economic contribution of the aviation industry report v6alaskaasp.com/admin/docs/economic...
TRANSCRIPT

The Economic Contribution of the Aviation Industry
to Alaska’s Economy
March 2009
A Component of thePrepared for
Alaska Department of Transportation and
Public Facilities
As subconsultants to:DOWL HKM
4041 B StreetAnchorage, AK 99503
(907) 562-2000
Prepared by:Northern Economics, Inc880 H Street, Suite 210Anchorage, AK 99501
(907) 274-5600
WIth a Grant from Federal Aviation Administration
www.AlaskaASP.com


THE ECONOMIC CONTRIBUTION OF THE AVIATION
INDUSTRY TO ALASKA’S ECONOMY
A COMPONENT OF THE
ALASKA AVIATION SYSTEM PLAN
Prepared for:
Alaska Department of Transportation and Public Facilities
Prepared by:
Northern Economics, Inc 880 H Street, Suite 210 Anchorage, AK 99501
(907) 274-5600
As subconsultants to:
DOWL HKM 4041 B Street
Anchorage, Alaska 99503 (907) 562-2000
W.O. D59825
January 2009


The Economic Contribution of the Aviation Industry
TABLE OF CONTENTS Page
Page i
EXECUTIVE SUMMARY ............................................................................................ I Introduction .............................................................................................................. I Contributions to the State of Alaska’s Economy...................................................... II
Economic Activity ................................................................................... III Employment ........................................................................................... IV Future Challenges for the Aviation Industry in Alaska...........................VII
The Importance of Airports to Alaska’s Communities...........................................VIII Off-Road Alaska’s Aviation Lifeline ........................................................ IX Passenger Survey Responses ...............................................................XI Alaska Residents’ Concerns for the Future......................................... XIV
1.0 INTRODUCTION............................................................................................. 1
2.0 ECONOMIC CONTRIBUTION TO THE STATE OF ALASKA’S ECONOMY...................................................................................................... 3
2.1 Economic Activity ......................................................................................... 5 2.2 Employment ................................................................................................. 9
3.0 THE IMPORTANCE OF AIRPORTS TO ALASKA’S COMMUNITIES .......... 13 3.1 Alaska’s Aviation Lifeline ............................................................................ 13 3.2 Air Travel by Trip and Purpose................................................................... 14 3.3 Comparison with Western United States Airports....................................... 20
Alaska Airports ................................................................................................... 21 Lower 48 Communities....................................................................................... 22
4.0 LOOKING AHEAD ........................................................................................ 28 4.1 Future Challenges for the Aviation Industry................................................ 28 4.2 Alaska Residents’ Concerns for the Future ................................................ 29 4.3 Future Travel .............................................................................................. 34
5.0 METHODOLOGY.......................................................................................... 35 5.1 Survey Methodology................................................................................... 35
5.1.1 Public Airports Managed by ADOT&PF ................................................ 36 5.1.2 Public Airports Managed by Entities Other than ADOT&PF.................. 37 5.1.3 ADOT&PF Business/Leaseholder Survey............................................. 38
5.2 Input-Output Analysis ................................................................................. 40
6.0 REFERENCES.............................................................................................. 44

The Economic Contribution of the Aviation Industry
TABLE OF CONTENTS (cont’d)
Page ii
TABLES Page
Table 1. Community Enplanements and Freight, 2007 ............................................. IX Table 2. Mean Number of Trips During Past 12 Months by Trip Purpose and
Airport Type .............................................................................................XII Table 3. Mean Number of Trips During Past 12 Months by Trip Purpose and
ADOT&PF Region ...................................................................................XII Table 4. Mean Number of Trips During Past 12 Months for Off-road and
Railbelt Communities ............................................................................. XIV Table 5. Direct Economic Contribution of Airport Operations, FY2007 (in
Millions of $)............................................................................................... 6 Table 6. Direct Economic Contribution of Operations of Businesses,
Agencies, and Organizations Located at Alaska Airports, FY2007 (in Millions of $).......................................................................................... 6
Table 7. Estimated Multiplier Effects of Alaska’s Aviation Industry, FY2007 (in Millions of $)............................................................................................... 7
Table 8. Estimated Direct and Multiplier Effects of Alaska’s Aviation Industry, FY2007 (in Millions of $) ............................................................................ 7
Table 9. Number of Direct Full-Time and Part-Time Jobs Associated with Airport Operations, FY2007 ..................................................................... 10
Table 10. Number of Full-Time and Part-Time Jobs Associated with Businesses Located in Alaska Airports in 2007 ....................................... 11
Table 11. Total Number of Induced Jobs Associated with Direct and Indirect Aviation Spending in Alaska in 2007........................................................ 11
Table 12. Mean number of Trips by Air During Past 12 Months, by Trip Purpose for Off-road and Railbelt Communities ...................................... 15
Table 13. Mean number Trips per Household by Air Combined During Past 12 Months by Trip Purpose for Off-road and Railbelt Communities.............. 16
Table 14. Mean Number of Trips by Air During Past 12 Months by Trip Purpose and Airport Type ........................................................................ 17
Table 15. Mean Number of Travelers on all Trips by Air Combined During Past 12 Months by Trip Purpose and Airport Type .................................. 18
Table 16. Mean Number of Trips by Air During Past 12 Months by Trip Purpose and ADOT&PF Region .............................................................. 19
Table 17. Mean number of Passengers on all Trips by Air Combined During Past 12 Months by Trip Purpose and ADOT&PF Region......................... 20
Table 18. Community Enplanements and Air Freight per Capita, 2007 ................... 26 Table 19. Future travel by ADOT&PF Regions and by Airport Type........................ 35 Table 20. Selected Off-Road System Communities................................................. 39
FIGURES Page
Figure 1. The Aviation Industry’s Contribution to GSP Compared to Primary Economic Sectors, 2007........................................................................... IV
Figure 2. The Aviation Industry’s Contribution to Available Jobs Compared to Primary Economic Sectors, 2007..............................................................VI
Figure 3. Comparison of Enplanements per Capita for Selected Community Airports, 2007 ............................................................................................X
Figure 4. 2007 Freight per Capita 2007 ....................................................................XI Figure 5. Alaska Enplanements and Domestic Fuel Price for all U.S. Carriers,
January 2000 – November 2008............................................................ XVI
The Economic Contribution of the Aviation Industry
TABLE OF CONTENTS (cont’d) Page
Page iii
Figure 6. Alaska Aviation Industry’s Estimated Economic Contribution to Statewide Economic Activity, FY2007 ....................................................... 5
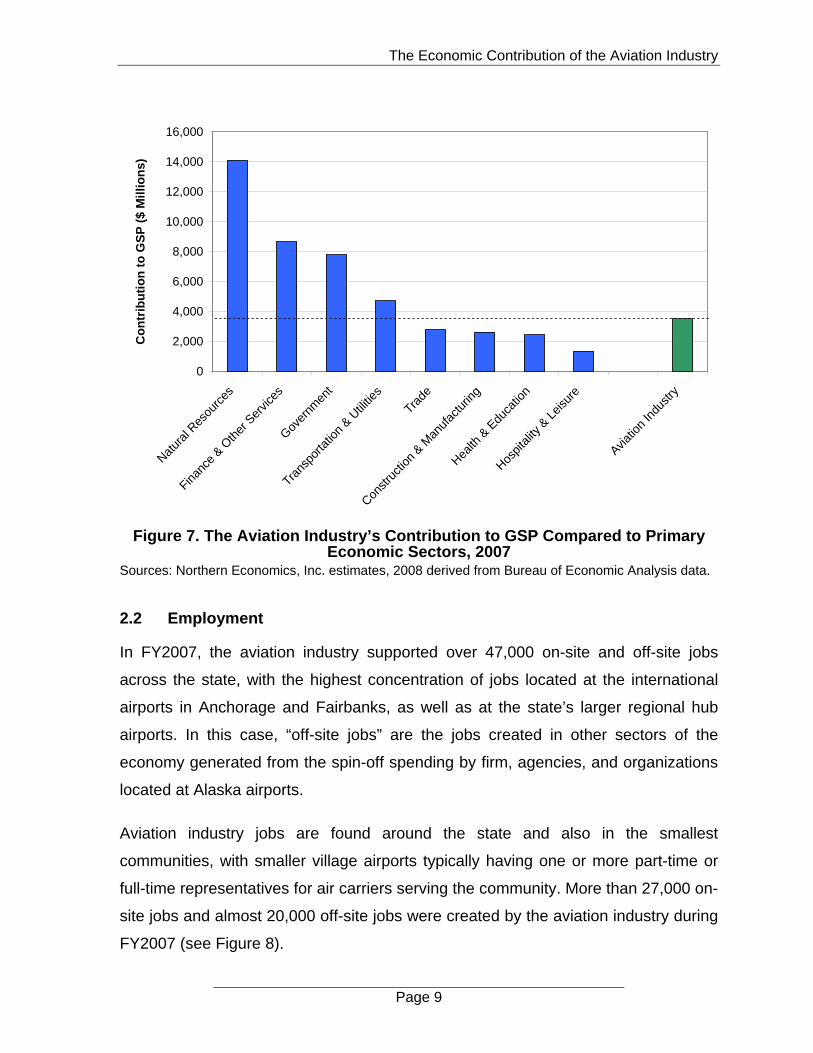
Figure 7. The Aviation Industry’s Contribution to GSP Compared to Primary Economic Sectors, 2007............................................................................ 9
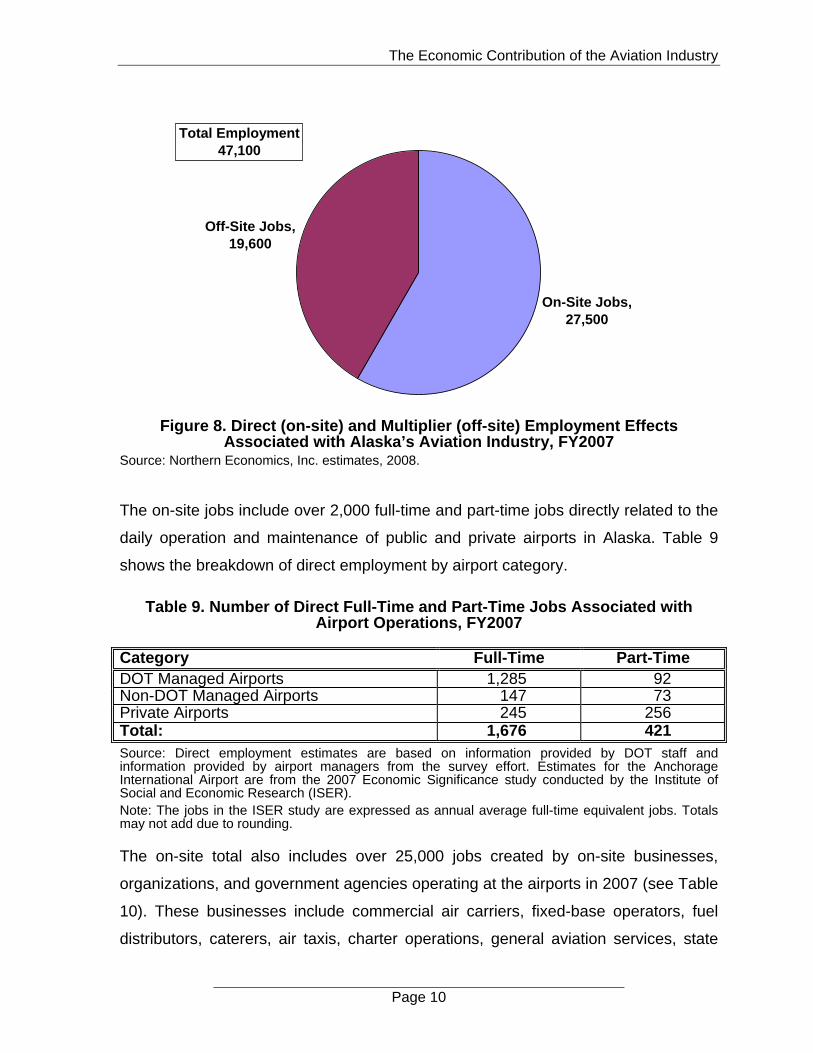
Figure 8. Direct (on-site) and Multiplier (off-site) Employment Effects Associated with Alaska’s Aviation Industry, FY2007................................ 10
Figure 9. The Aviation Industry’s Contribution to Available Jobs Compared to Primary Economic Sectors, 2007............................................................. 12
Figure 10. Comparison of Enplanements per Capita for Selected Community Airports, 2007 .......................................................................................... 26
Figure 11. 2007 Air Freight per Capita..................................................................... 27 Figure 12. 2007 Mail per Capita............................................................................... 28 Figure 13. Alaska Enplanements and Fuel Prices for All Domestic Carriers
January 2000 – September 2008............................................................. 32 Figure 14. Alaska Enplanements, Excluding ANC and FAI, and Fuel Prices
for All Domestic Carriers, ,January 2000 – November 2008 ................... 33 Figure 15. Surveys in the Context of the Project Outline ......................................... 36 APPENDICES APPENDIX A: ADOT&PF Leaseholder Survey Instrument...................................... 47 APPENDIX B: Private/Non-ADOT&PF Public Airport Survey .................................. 55 APPENDIX C: Passenger Opinion Survey............................................................... 57
The Economic Contribution of the Aviation Industry
Page iv
ACKNOWLEDGEMENTS
We would like to acknowledge the participation of the Alaska Aviation Advisory Board members and other individuals that contributed to this report.
Aviation System Advisory Board Jack Barber Anchorage, AK James Dodson Fairbanks, KA Tom H George Fairbanks, AK Robert Jacobsen Juneau, AK Daniel L. Klaes Bettles, AK Kenneth J. Lythgoe Anchorage, AK Wilbur O'Brien Anchorage, AK Alberto A Orot Anchorage, AK Lee M. Ryan (Chair) Kotzebue, AK Michael B. Salazar Ketchikan, AK
Other Individuals that participated in interviews or contributed to this report Tim Anelson Iliamna, AK Diane Brandt Glasgow, MT Liz Cabrera Petersburg, AK Joan Carlson Haines, AK Leslie Carnes Pendleton, OR Janice Chelanski Dillingham, AK Jim Davis Riverton, WY Majorie Gemmil Juneau, AK Scott Goetz Lander, WY Brian Holst Juneau, AK Harry Johnson, Jr. Unalakleet, AK Spike Jorgensen Tok, AK Marlene Mahlum Wolf Point, MT Denise Michels Nome, AK Bob Pernella Wrangell, AK Jim Spinelli Hailey, ID Greg Stucky Haines, AK Richard Underkofler Petersburg, AK Gary White Sitka, AK Walt Wilcox Galena, AK

The Economic Contribution of the Aviation Industry
Page v
LIST OF ACRONYMS
AAB.............................................................................Alaska Aviation Advisory Board
AASP ..............................................................................Alaska Aviation System Plan
ADOT&PF ............................Alaska Department of Transportation & Public Facilities
ANC .......................................................Ted Stevens Anchorage International Airport
FAA.............................................................................Federal Aviation Administration
FAI ............................................................................... Fairbanks International Airport
GSP ............................................................................................. Gross State Product
ISER ......................................................... Institute of Social and Economic Research
NAC ............................................................................................... Northern Air Cargo
UAA ........................................................................... University of Alaska Anchorage

The Economic Contribution of the Aviation Industry
Page I
EXECUTIVE SUMMARY
Introduction
This report provides an assessment of the economic contribution of Alaska’s aviation
industry to the state’s economy in 2007, and a discussion of the importance of the
industry to the state and to rural Alaska in particular.1 The estimate is based on a
large survey and interview effort conducted in the fall of 2008 as part of the Alaska
Aviation System Plan (AASP), which is being prepared by the Alaska Department of
Transportation & Public Facilities (ADOT&PF), Aviation Division; Federal Aviation
Administration (FAA); and a consultant team led by DOWL HKM. This economic
analysis was prepared by Northern Economics, Inc. as a subcontractor to DOWL
HKM.
One of the early phases of the AASP focused on identifying issues and concerns
facing the aviation industry in Alaska. The governor-appointed Alaska Aviation
Advisory Board (AAB) and others knowledgeable about the industry saw a need for
additional state capital investment and operational funding for airports since these
facilities are a critical transportation link for most Alaska communities. However,
research documenting the importance of the statewide aviation industry—especially
for rural Alaska—is very sparse. Prior studies exist for a few airports, such as
economic impact reports prepared for the Ted Stevens Anchorage International
Airport by the Institute of Social and Economic Research (ISER) at the University of
Alaska Anchorage (UAA). We have incorporated data from these prior reports into
this analysis to the extent that such information is available and timely.
The AAB and other stakeholders have suggested that this report could be used to
enhance the understanding of local, state, and federal decision makers both within
and outside of Alaska on the social and economic importance of the Alaska aviation
industry. For the aviation industry and aviation-related businesses, this report
1 The Alaska Aviation System Plan was conducted in accordance with FAA Advisory Circular
150/5070-7: The Airport System Planning Process. The economic analysis described in this report
was conducted pursuant to Section 101.a (3) of that document.
The Economic Contribution of the Aviation Industry
Page II
provides documentation that was previously not available, and supports the position
that state planning efforts, capital, and operational investment for a healthy aviation
system and industry in Alaska are justified.
The aviation industry, as defined in this statewide analysis, includes all the
businesses and organizations located at an airport. They are referred to in this report
as “on-site entities.” Spending by these firms and organizations results in other jobs
and income—the “multiplier effect”—for businesses located elsewhere (i.e., “off-
site”). Information for on-site and off-site economic activity is presented in this
executive summary. Subsequent studies may expand the definition of “aviation
industry” to include other aviation-related businesses not located at airports
(e.g., off-site air freight companies or off-site aircraft parts manufacturing companies)
and some portion of expenditures by visitors and other persons traveling on air
transportation services and through airports.
The following subsections provide information on the contribution of the aviation
industry to Alaska’s economy, describe the importance of Alaska’s airports and the
aviation industry to its citizens and communities, and compare the importance of
airports in Alaska with similar remote airports in the western United States. The
information presented in the following sub-sections is based primarily on a survey
effort that targeted all public airports managed by ADOT&PF, cities, municipalities,
and other public entities, private airports throughout the state, leaseholders located
on ADOT&PF airports, and 600 residents in Alaska who have flown within the last
12 months. Telephone interviews with airport managers, city officials, and other
community leaders in 18 selected communities in Alaska and in 4 western states
were undertaken to evaluate the importance of airports to remote communities.
Contributions to the State of Alaska’s Economy
The businesses, agencies, and organizations that are located on airports and
comprise Alaska’s aviation industry are a crucial component of Alaska’s economy.
They are drawn from the primary sectors of the economy such as government,
trade, transportation and utilities, and hospitality and leisure. In fact, nearly every
The Economic Contribution of the Aviation Industry
Page III
primary economic sector in the state is represented within the aviation industry as
defined by this report (i.e., on-site).
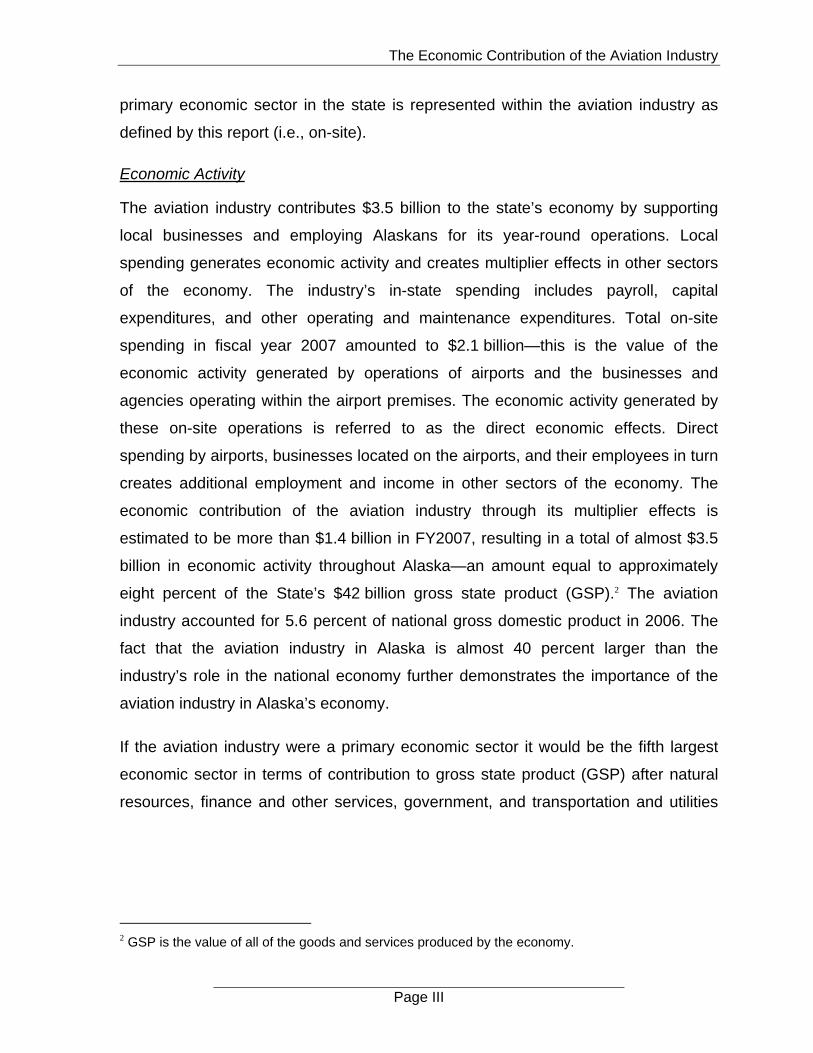
Economic Activity
The aviation industry contributes $3.5 billion to the state’s economy by supporting
local businesses and employing Alaskans for its year-round operations. Local
spending generates economic activity and creates multiplier effects in other sectors
of the economy. The industry’s in-state spending includes payroll, capital
expenditures, and other operating and maintenance expenditures. Total on-site
spending in fiscal year 2007 amounted to $2.1 billion—this is the value of the
economic activity generated by operations of airports and the businesses and
agencies operating within the airport premises. The economic activity generated by
these on-site operations is referred to as the direct economic effects. Direct
spending by airports, businesses located on the airports, and their employees in turn
creates additional employment and income in other sectors of the economy. The
economic contribution of the aviation industry through its multiplier effects is
estimated to be more than $1.4 billion in FY2007, resulting in a total of almost $3.5
billion in economic activity throughout Alaska—an amount equal to approximately
eight percent of the State’s $42 billion gross state product (GSP).2 The aviation
industry accounted for 5.6 percent of national gross domestic product in 2006. The
fact that the aviation industry in Alaska is almost 40 percent larger than the
industry’s role in the national economy further demonstrates the importance of the
aviation industry in Alaska’s economy.
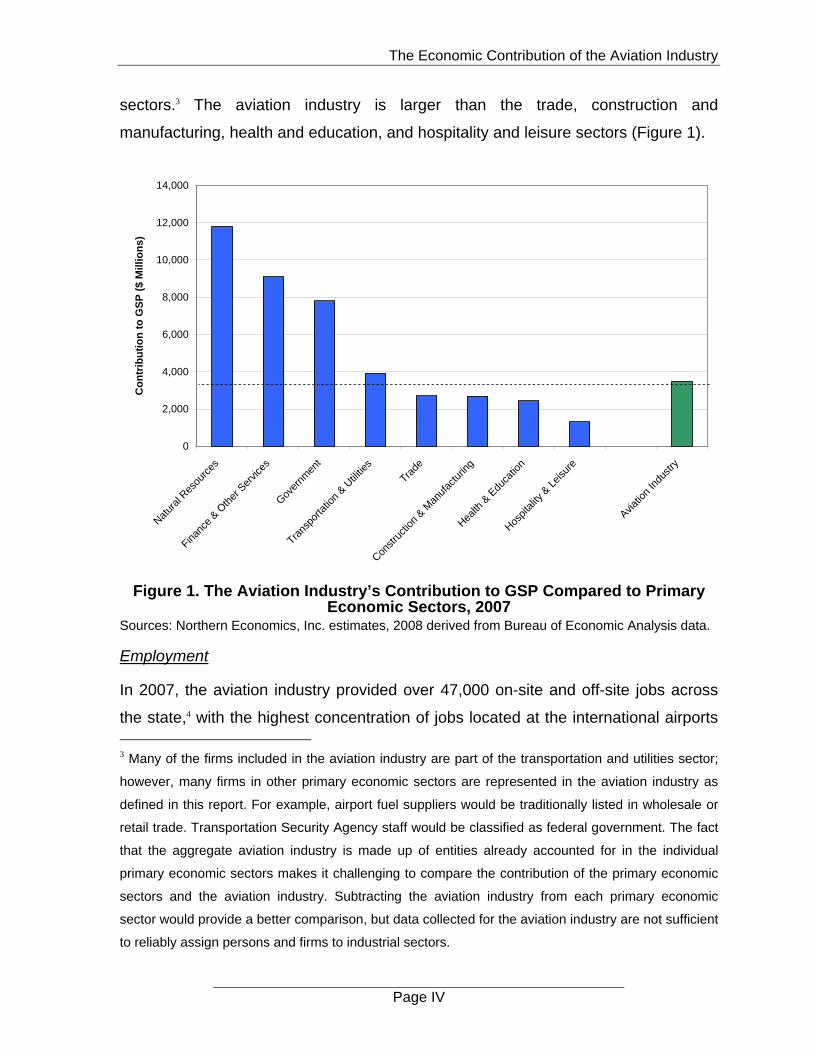
If the aviation industry were a primary economic sector it would be the fifth largest
economic sector in terms of contribution to gross state product (GSP) after natural
resources, finance and other services, government, and transportation and utilities
2 GSP is the value of all of the goods and services produced by the economy.
The Economic Contribution of the Aviation Industry
Page IV
sectors.3 The aviation industry is larger than the trade, construction and
manufacturing, health and education, and hospitality and leisure sectors (Figure 1).
0
2,000
4,000
6,000
8,000
10,000
12,000
14,000
Natur
al Res
ourc
es
Financ
e & O
ther
Ser
vices
Gover
nmen
t
Trans
porta
tion
& Utili
ties
Trade
Constr
uctio
n & M
anuf
actu
ring
Health
& E
duca
tion
Hospit
ality
& Leis
ure
Aviatio
n In
dustr
y
Co
ntr
ibu
tio
n t
o G
SP
($
Mill
ion
s)
Figure 1. The Aviation Industry’s Contribution to GSP Compared to Primary Economic Sectors, 2007
Sources: Northern Economics, Inc. estimates, 2008 derived from Bureau of Economic Analysis data.
Employment
In 2007, the aviation industry provided over 47,000 on-site and off-site jobs across
the state,4 with the highest concentration of jobs located at the international airports 3 Many of the firms included in the aviation industry are part of the transportation and utilities sector;
however, many firms in other primary economic sectors are represented in the aviation industry as
defined in this report. For example, airport fuel suppliers would be traditionally listed in wholesale or
retail trade. Transportation Security Agency staff would be classified as federal government. The fact
that the aggregate aviation industry is made up of entities already accounted for in the individual
primary economic sectors makes it challenging to compare the contribution of the primary economic
sectors and the aviation industry. Subtracting the aviation industry from each primary economic
sector would provide a better comparison, but data collected for the aviation industry are not sufficient
to reliably assign persons and firms to industrial sectors.
The Economic Contribution of the Aviation Industry
Page V
in Anchorage (ANC)5 and Fairbanks (FAI), as well as at the state’s larger regional
hub airports. Aviation industry jobs are found around the state and also in the
smallest communities, with smaller village airports typically having one or more part-
time or full-time representatives for air carriers serving the community. More than
27,000 on-site jobs and almost 20,000 off-site jobs are created by the aviation
industry.
The on-site jobs include over 2,000 full-time and part-time jobs directly related to the
daily operation and maintenance of public and private airports in Alaska. The on-site
total also includes over 25,000 jobs created by on-site businesses, organizations,
and government agencies operating at the airports in 2007. These businesses
include commercial air carriers, fixed-base operators, fuel distributors, ground
handlers, caterers, air taxis, charter operations, general aviation services, state
agencies, and other public agencies such as the U.S. Post Office and Kulis Air
National Guard Base operating at ANC. The number of on-site jobs underscores the
value of airport infrastructure in creating jobs in various businesses and communities
across the entire state.
Off-site jobs are created when goods and services are purchased from other
businesses in the state to support the operations and maintenance of airports and
businesses located at airports, and when direct and indirect airport employees
spend their wages on goods and services within the state. Spending by aviation
suppliers and users created almost 20,000 off-site jobs across the state in 2007
based on an input-output analysis of the survey data using the IMPLAN software
program which is typically used for economic impact analyses.
4 In this case off-site jobs includes induced and indirect jobs associated with direct expenditures by
firms, agencies, and organizations included in the aviation industry as defined on Page 2.
5 Employment data reported for ANC are expressed as full-time equivalent employees and not full-
and part-time jobs as collected for the other airports in the state. The employment numbers for the
aviation industry would be greater if employment data for ANC were expressed in full- and part-time
jobs.
The Economic Contribution of the Aviation Industry
Page VI
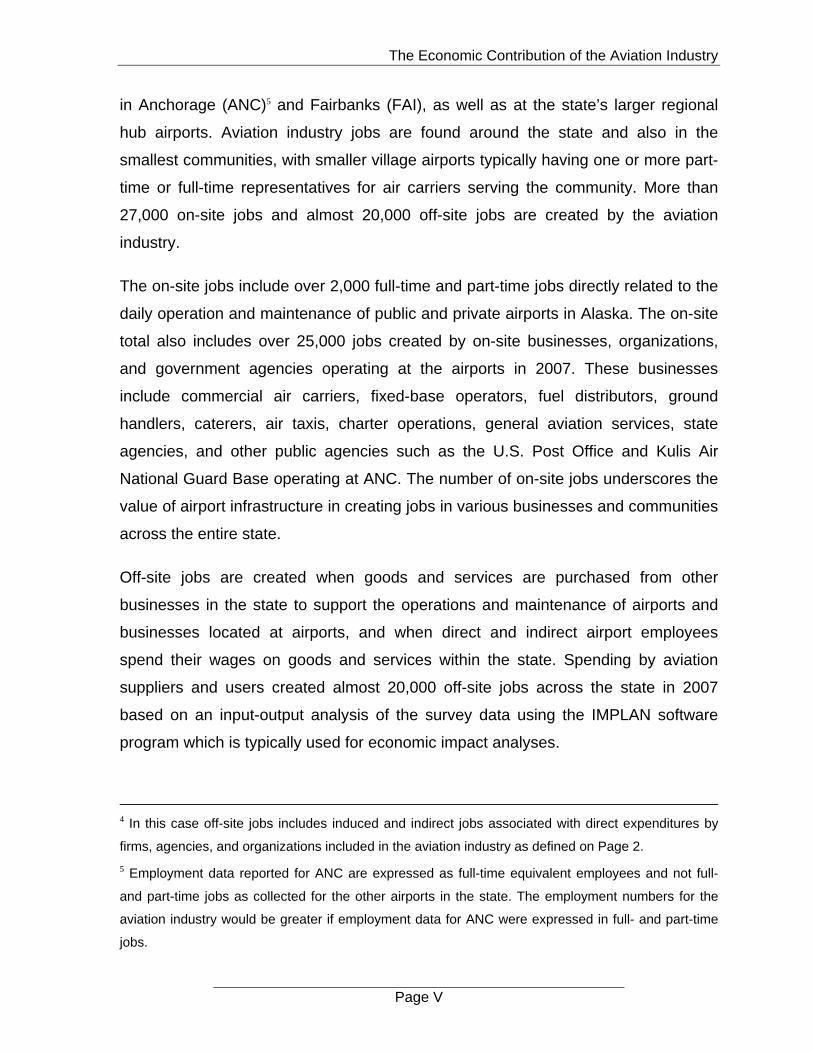
The 47,000 jobs generated by the firms, agencies, and businesses that make up the
aviation industry provided approximately 10 percent of the total jobs in Alaska’s
economy in 2007, including the self-employed and the military. As shown in Figure
2, the on-site and off-site employment generated by the aviation industry was
smaller than employment for the government, finance and other services, trade, and
health and education sectors, but larger than employment for the hospitality and
leisure, construction and manufacturing, natural resources, and transportation and
utilities sectors.
In 2006 the national aviation industry created about 11 million full-time and part-time
jobs (Federal Aviation Administration, 2008), or about 7 percent of the nation’s
annual average employment, including the self-employed in that year. The much
larger share of employment generated by Alaska’s aviation industry (10 percent) in
comparison to the national estimates is further evidence of the importance of the
aviation industry to Alaska’s communities and residents.
0
20,000
40,000
60,000
80,000
100,000
120,000
Gover
nmen
t
Financ
e & O
ther
Ser
vices
Trade
Health
& E
duca
tion
Hospit
ality
& Leis
ure
Constr
uctio
n & M
anuf
actu
ring
Natur
al Res
ourc
es
Trans
porta
tion
& Utili
ties
On-Site
Avia
tion
Indu
stry
All Avia
tion
Indu
stry J
obs
Job
s
Figure 2. The Aviation Industry’s Contribution to Available Jobs Compared to Primary Economic Sectors, 2007
Sources: Northern Economics, Inc. estimates, 2008 derived from Bureau of Economic Analysis data.

The Economic Contribution of the Aviation Industry
Page VII
Future Challenges for the Aviation Industry in Alaska
The survey asked firms, agencies, and organizations
operating on airports to provide their views on challenges
facing their business and aviation-related businesses in
Alaska in the coming years. Nearly half of the
respondents (49 percent) identified fuel and energy
prices as one of the main challenges. Fuel price was the concern most often
mentioned, but was often just one of several concerns
for respondents. Increasing lease rates (32 percent),
government restrictions/mandates (19 percent), finding
and retaining quality labor (15 percent) and operating
costs and general economic conditions were also
mentioned as challenges (both 10 percent). About a
third of the respondents mentioned increasing lease rates as a challenge to their
business. A number of these respondents felt that Anchorage prices were being
charged for small airport leases.
The increasing cost of living and the current
economic situation of the nation were also
mentioned as challenges for the future.
Respondents’ concern is that this situation may
decrease money spent on travel, and increasing
airfares would result in a smaller market base of both local travelers and tourists.
Finding and retaining quality labor is seen as a challenge by respondents. Some
respondents linked this challenge to another issue: namely, migration out of the rural
communities to larger metropolitan areas.
Several respondents mentioned concerns about government interventions and
policies, and other issues with municipal, state, and federal governments.
“…In addition, finding and retaining
quality labor is and continues to be
a concern that will likely increase if
high costs force shifts in population
to larger metropolitan areas.”
“Nationwide economic
slowdown. High price of
energy costs….leading to
increased airfare…. leading
to decreased travel.”
“Increased lease rates from
the State, increased property
taxes and restrictions on
lease usage, as well as higher
energy prices for heating,
electrical and operations.”

The Economic Contribution of the Aviation Industry
Page VIII
The Importance of Airports to Alaska’s Communities
To evaluate the importance of Alaska’s airports to state residents, the study team
conducted a telephone survey of 500 households in 18 selected communities
throughout the state and 100 households within the Railbelt stretching from
Fairbanks to the Kenai Peninsula, and also conducted interviews of airport
managers, community officials, and other leaders in these communities. The 18 off-
road system communities were: Juneau, Sitka, Bethel, Dillingham, Nome, Barrow,
Wrangell, Petersburg, McGrath, Iliamna, Unalakleet, Galena, Haines, Angoon, King
Cove, Mekoryuk, Noatak, and Arctic Village. The 18 communities were divided
equally among regional hubs, sub-regional hubs, and community airports in the
three ADOT&PF regions: Southeast, Central, and Northern.
To illustrate the importance of Alaska’s airports in comparison to remote airports in
other western U.S. states, the study team conducted similar interviews with airport
managers and community officials for airports in Idaho, Montana, Oregon, and
Wyoming. The team also made a comparison of enplanements and freight volumes
per capita between the 18 case study airports in Alaska and the airports in the
western U.S. The results of these case studies are discussed below.
Air transportation is an efficient means for moving people, goods, and materials in
and out of off-road communities in Alaska and improves the quality of life in those
communities. There are three basic size groupings of airports as defined in this
report: 1) large or regional hub airports; 2) sub-regional airports, and 3) community
airports. A large or hub airport allows a community to provide goods and services
more efficiently to a larger or broader area, and enhances its role as a government
or economic center. Sub-regional hubs are typically smaller in population and have
smaller economies than regional hubs with fewer routes connecting to outlying
villages and fewer flights to major urban centers. Community airports are typically in
the smallest communities, and these airports generally only support one local
community.

The Economic Contribution of the Aviation Industry
Page IX
Off-Road Alaska’s Aviation Lifeline
Communities in Alaska that are not connected to the national highway system
depend on the aviation industry for movement of goods and people in ways that
Lower 48 communities depend on a road system. The study compared
enplanements and freight deliveries per capita for the 18 case study communities in
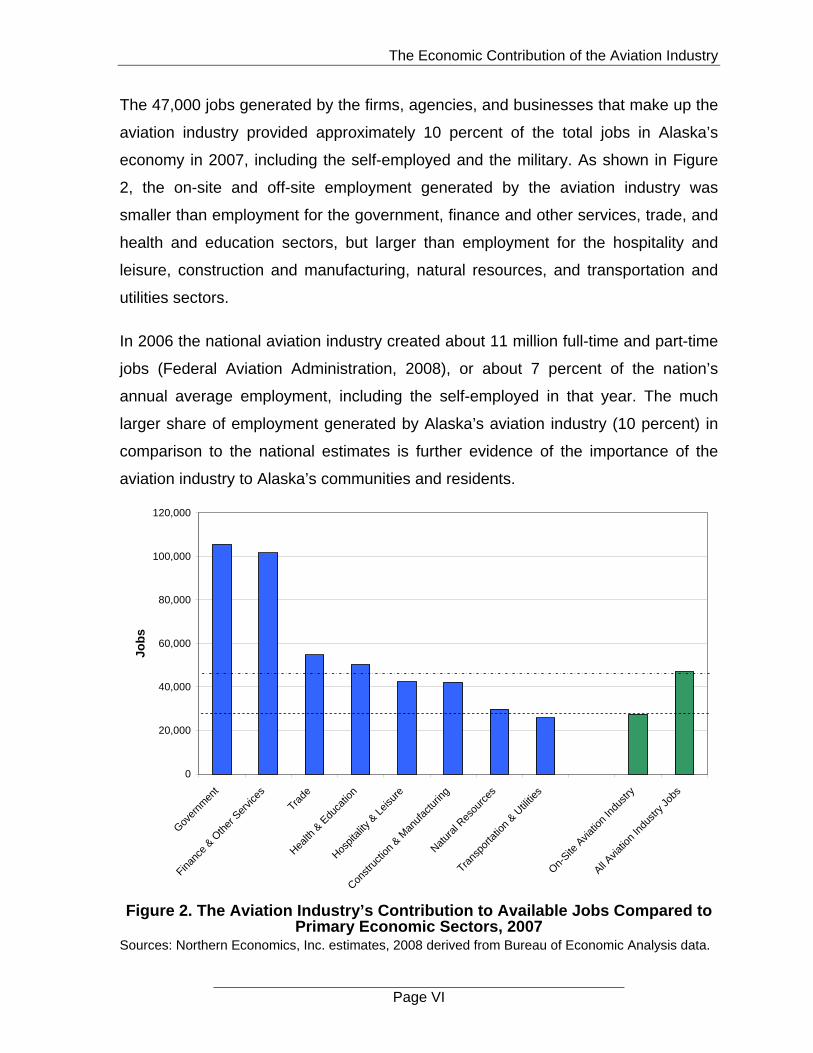
Alaska with Lower 48 case study communities. The average number of annual
enplanements per capita for off-road communities in Alaska was found to be 14.6
enplanements per person per year. This number is eight times higher than the
number of enplanements per capita for even the next highest state (i.e., Idaho at
1.8 enplanements per year), and more than 30 times higher than the lowest
comparison group (i.e., Montana at 0.5 enplanements per person per year) (see
Table 1 and Figure 3). The difference in freight pounds per capita is even more
startling for Alaska as compared to the western U.S. The per capita freight loads for
the 18 case study communities in Alaska is 39 times higher than the freight load for
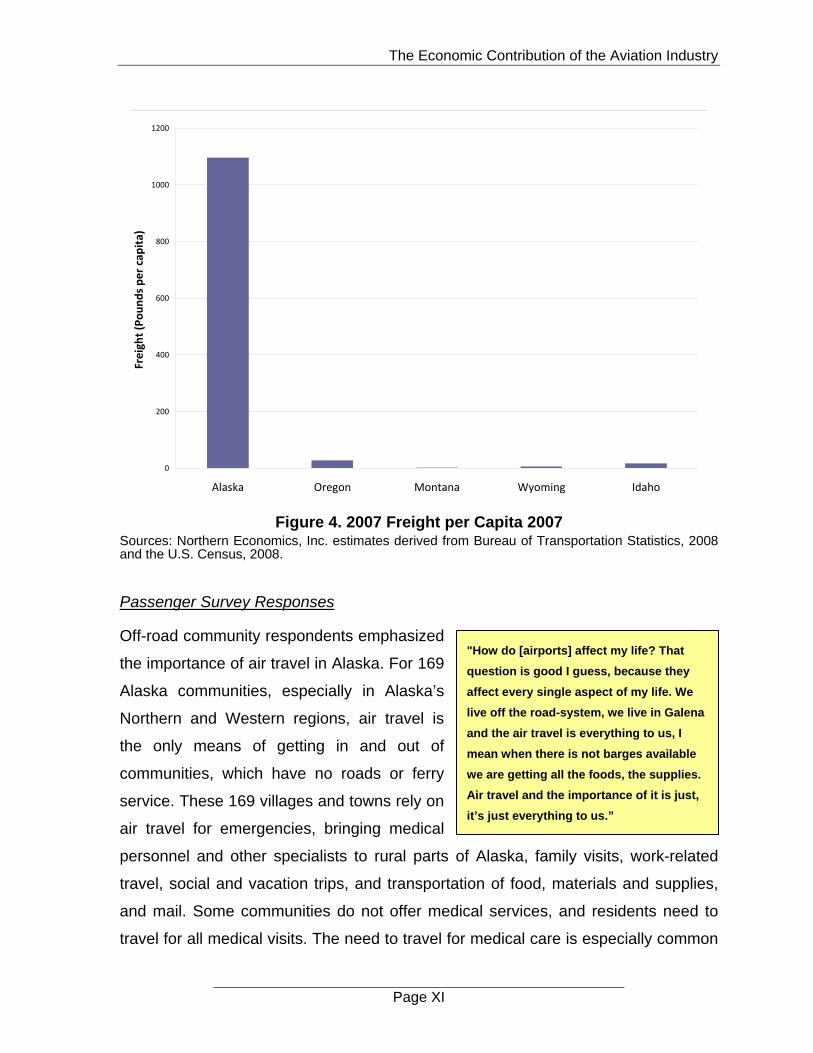
rural communities in the next highest surveyed state (see Table 1 and Figure 4).
Alaska communities in the study averaged 1,096 pounds of air freight per capita in
2007 while rural communities in Oregon averaged 28 pounds. Rural communities in
Montana averaged just 2 pounds of air freight per person in 2007.
Table 1. Community Enplanements and Freight, 2007
Per Capita Measure State Enplanements (Number) Freight (Pounds)
Alaska 14.6 1,096 Oregon 1.4 28 Montana 0.5 2 Wyoming 0.9 6 Idaho 1.8 17 Sources: Northern Economics, Inc. estimates derived from Bureau of Transportation Statistics, 2008 and the U.S. Census, 2008.
The Economic Contribution of the Aviation Industry
Page X
Figure 3. Comparison of Enplanements per Capita for Selected Community
Airports, 2007 Sources: Northern Economics, Inc. estimates derived from Bureau of Transportation Statistics, 2008 and the U.S. Census, 2008.
The Economic Contribution of the Aviation Industry
Page XI
0
200
400
600
800
1000
1200
Alaska Oregon Montana Wyoming Idaho
Freight (Pounds per capita)
Figure 4. 2007 Freight per Capita 2007
Sources: Northern Economics, Inc. estimates derived from Bureau of Transportation Statistics, 2008 and the U.S. Census, 2008.
Passenger Survey Responses
Off-road community respondents emphasized
the importance of air travel in Alaska. For 169
Alaska communities, especially in Alaska’s
Northern and Western regions, air travel is
the only means of getting in and out of
communities, which have no roads or ferry
service. These 169 villages and towns rely on
air travel for emergencies, bringing medical
personnel and other specialists to rural parts of Alaska, family visits, work-related
travel, social and vacation trips, and transportation of food, materials and supplies,
and mail. Some communities do not offer medical services, and residents need to
travel for all medical visits. The need to travel for medical care is especially common
"How do [airports] affect my life? That
question is good I guess, because they
affect every single aspect of my life. We
live off the road-system, we live in Galena
and the air travel is everything to us, I
mean when there is not barges available
we are getting all the foods, the supplies.
Air travel and the importance of it is just,
it’s just everything to us.”

The Economic Contribution of the Aviation Industry
Page XII
in small communities. Survey responses indicate that small community respondents
made more than twice as many family or personal business-related and medical
trips than larger communities (See Table 2). They also make more family and
personal business trips, but fewer trips that may be for more discretionary travel
such as social or vacation.
Table 2. Mean Number of Trips During Past 12 Months by Trip Purpose and Airport Type
Airport Type
Trip Purpose Regional Hub Sub-regional
Hub Community Work trips 5.4 4.5 4.0 Family and personal business trips 2.4 2.2 4.5 School or church trips 1.0 1.1 0.7 Social or vacation trips 2.6 1.9 1.4 Medical trips 1.0 1.5 3.8 Total 12.5 11.3 14.5 Source: Northern Economics, Inc. estimates, 2008.
Households residing in ADOT&PF’s Northern Region are more dependent on air
travel than the other ADOT&PF regions and they had a higher number of aviation
medical trips than the other regions, and a higher total number of trips (See Table 3).
Southeast Alaska communities typically have an option of travel by the ferries of the
Alaska Marine Highway System and are not as dependent on air travel as
communities in the Northern Region.
Table 3. Mean Number of Trips During Past 12 Months by Trip Purpose and ADOT&PF Region
ADOT&PF Region Trip Purpose Southeast Central Northern
Work trips 4.2 6.6 8.8 Family and personal business trips 2.0 4.0 3.8 School or church trips 1.0 0.5 1.3 Social or vacation trips 2.3 2.7 2.5 Medical trips 1.2 1.3 2.0 Total 10.7 15.0 18.4 Source: Northern Economics, Inc. estimates, 2008.
The Economic Contribution of the Aviation Industry
Page XIII
The case studies confirm the results of the passenger survey that airports play a
vital role for Alaska off-road communities. Several
interview respondents compared the role of the airports
to the role of highways and the road system in the
lower 48 states. Most community members said it
would be difficult for their community to maintain or
sustain itself without air transportation. Many
communities in Northern and Western Alaska would be completely isolated in the
winter without their airports. In parts of Central and Southeast Alaska, ferry or road
transportation may exist as alternatives, but communities still rely heavily on their
airports for swift and reliable travel.
As noted previously, the regional hub airports are generally located in larger
communities with diverse economies and higher per capita incomes, such as Bethel
or Kotzebue. Alaska’s community airports are typically located in the smallest
communities and residents there have lower average incomes. The increasing cost
of air travel affects all Alaska residents, but especially those living in the smallest
communities with lower incomes. The survey data indicate that small community
airport residents make fewer trips for social or vacation purposes—approximately
1.4 trips per household per year in community-level airports as compared to 1.9 trips
for sub-regional hub households and 2.6 trips for regional hub households.
Households in all off-road communities make about the same number of annual trips
by air per household as households in the Railbelt. Railbelt community households
make more work-related trips than rural community households, but for all other trip
categories (i.e., social or vacation, family or personal business, school or church,
medical), off-road households have a higher average number of trips. (See Table 4.)
“If we didn’t have the airport
we wouldn’t have anything.
The airport is a fact of life for
living out here in the villages.
The airport is our roads,
highway, ocean—our lifeline.”

The Economic Contribution of the Aviation Industry
Page XIV
Table 4. Mean Number of Trips During Past 12 Months for Off-road and Railbelt Communities
Trip Purpose Off-Road Railbelt Work trips 5.2 8.6 Family and personal business trips 2.5 1.9 School or church trips 1.0 0.3 Social or vacation trips 2.4 1.4 Medical trips 1.3 0.3 Total 12.5 12.6 Source: Northern Economics, Inc. estimates, 2008.
Alaska Residents’ Concerns for the Future
The greatest concern expressed by residents
of off-road communities is the increasing cost
of air travel. These residents are finding it
more difficult to travel as air transportation
costs increase and personal income remains
low. Increasing air cargo rates also raise the
cost of groceries and other supplies while increased baggage fees can significantly
affect travelers from off-road communities, who generally take advantage of the
lower prices in Alaska urban centers to stock up on food and supplies before
traveling back home where costs are higher.
Residents of Alaska are greatly concerned by the increasing cost of energy,
particularly in those communities that rely upon air delivery of fuel supplies. Fuel
must be flown in to these communities at much greater cost as they are not
accessible by road, ferry, or barge. In addition, the aircraft currently used for fuel
deliveries are nearing the end of their useful life, and newer large fuel delivery
aircraft cannot operate at airports with shorter runway lengths. Many of the smaller
communities that rely on air transport of fuel have airports with shorter runway
lengths. Using smaller aircraft, which could land at these shorter runways, for fuel
deliveries would increase fuel prices above their current levels.
Both Railbelt and off-road households indicate in survey responses that they will
travel less by air in the next 12 months (November 2008 through October 2009), with
“… [costs are] getting pretty outrageous
not just from Kotzebue to Anchorage but
also to the rural villages. I think that’s our
greatest fear is cost. Thank you for doing
the survey, thank you for serving the state.
I hope we can all make a difference.”
The Economic Contribution of the Aviation Industry
Page XV
a reduction of about 5 to 10 percent in the total number of trips. It is thought that this
reduction is due to the cost concerns expressed above. In Southeast Alaska, of the
households that indicated they would use less air transportation, about a third said
they would increase the number of trips made on other public transportation
providers such as the Alaska Marine Highway System, which can be less expensive
than air travel.
The recent 2008 spike in jet fuel and aviation gasoline has had an adverse impact
on the aviation users and industry in Alaska. Figure 5 shows monthly passenger
enplanements at all Alaska airports from January 2000 through November 2008,
compared to the average monthly fuel price reported by all domestic carriers. Fuel
prices for Alaska carriers were only available through September, so prices for all
domestic carriers were used to have similar time periods for the both data series.
Fuel prices in Alaska experienced a similar spike with the price exceeding $4.00 in
the summer of 2008. The enplanement data are for large certificated air carriers
subject to the Federal Aviation Act of 1958. As such, the enplanement data do not
include a number of smaller air carriers and operators in Alaska and thus
underestimate total enplanements in the state. The enplanement data are
considered to be representative of overall trends in enplanements for the state.
Summer 2008 peak enplanements throughout Alaska were slightly less than what
would have been expected in a normal year. Enplanements through November have
continued to decline and are now near levels experienced in 2003 and 2004. Even
though fuel prices have dropped in the past few months, prices are still at historically
high levels compared to fuel prices in recent years.

The Economic Contribution of the Aviation Industry
Page XVI
Figure 5. Alaska Enplanements and Domestic Fuel Price for all U.S. Carriers,
January 2000 – November 2008
Sources: Northern Economics, Inc. estimates derived from Bureau of Transportation Statistics, 2008. Note: Enplanement data are for large certificated air carriers subject to the Federal Aviation Act of 1958.
The importance of airports in the case study
communities compared to rural airports in the Lower
48 states is emphasized by the responses of
participants to questions regarding whether or not
they believe their community could maintain itself
without its airport. Rural communities in the Lower 48
often commented their community would be less
attractive for people visiting or doing business, but they could likely deal with not
having an airport. In general, rural airports in the Lower 48 states are important to
their communities, but tend not to play as vital a role in terms of transportation of
people and goods, since travel can also occur by road and sometimes rail to and
from these rural towns.
“Yes, [our Lower 48 community
could maintain itself] but we
couldn’t attract the level of
tourists and recreationists….
Without the airport we would
have a really difficult time
getting people to visit especially
in the wintertime.”
The Economic Contribution of the Aviation Industry
Page 1
1.0 INTRODUCTION
Aviation is more important in Alaska than perhaps anywhere else in the United
States. Alaska’s unique mix of airports, seaplane bases, and heliports spread over
remote geographic regions are a vital lifeline within the state, to destinations in the
Lower 48 states, and to destinations around the globe. Alaska’s aviation system plan
is likewise more important in Alaska because of aviation’s role in Alaska and
because the State of Alaska Department of Transportation and Public Facilities
(ADOT&PF) owns most of the public airports and is able to directly implement plan
recommendations. The statewide aviation system plan must recognize Alaska’s
dependence on aviation, the unique operating environment, lack of basic
infrastructure, financial constraints, and regional diversity.
This report is a component of the continuing Alaska Aviation System Plan (AASP),
which is being prepared by the Aviation Division of the ADOT&PF; Federal Aviation
Administration (FAA); and a consultant team led by DOWL HKM. This economic
analysis was prepared by Northern Economics, Inc. as a subcontractor to DOWL
HKM.
The primary purpose of the airport system planning process is to examine the
existing aviation system, analyze future trends, evaluate policy issues, and
determine the type, extent, and location of airport improvements needed in the state.
Earlier in the planning process members of the consultant team reviewed existing
documents and studies and conducted extensive outreach within ADOT&PF and
with external stakeholders to determine what aviation issues needed to be
considered or addressed in the AASP. The absence of information on the economic
effects of the aviation industry on the state’s economy, and the importance of the
industry to state residents and their communities were identified as issues that
needed to be addressed; this report was prepared to address these issues.
This AASP document was conducted in accordance with FAA Advisory Circular
150/5070-7: The Airport System Planning Process. The economic analysis

The Economic Contribution of the Aviation Industry
Page 2
described in this report was conducted pursuant to Section 101.a(3) of that
document.
This report provides an estimate of the economic contribution of Alaska’s aviation
industry to the state’s economy in 2007, and a discussion of the importance of the
industry to the state and to rural Alaska in particular. The estimate is based on a
large survey and interview effort conducted in the fall of 2008.
One of the early phases of the AASP focused on identifying issues and concerns
facing the aviation industry in Alaska. The governor-appointed Alaska Aviation
Advisory Board (AAB) and others knowledgeable about the industry saw a need for
additional state capital investment in and operational funding for airports since these
facilities are a necessary part of the aviation network and a critical transportation link
for most Alaska communities. However, research documenting the importance of the
statewide aviation industry—especially for communities not connected to the road
system—is very sparse. Prior studies exist for a few airports, such as economic
impact reports prepared for the Ted Stevens Anchorage International Airport by the
Institute of Social and Economic Research (ISER) at the University of Alaska
Anchorage (UAA). We have incorporated data from these prior reports into this
analysis to the extent that such information is available and timely.
The AAB and other stakeholders have suggested that this report could be used to
enhance the understanding of local, state, and federal decision makers both within
and outside of Alaska on the social and economic importance of the Alaska aviation
industry. For the aviation industry and aviation-related businesses, this report
provides documentation that was previously not available, and supports the position
that state planning efforts, capital, and operational investment for a healthy aviation
system and industry in Alaska are justified.
The aviation industry, as defined in this first statewide economic impact analysis,
includes all the businesses and organizations located at an airport. They are referred
to in this report as “on-site entities.” Spending by these firms and organizations
results in other jobs and income—the “multiplier effect”—for businesses located

The Economic Contribution of the Aviation Industry
Page 3
elsewhere (i.e., “off-site”). Information for on-site and off-site economic activity is
presented in this report. Subsequent studies may expand the definition of “aviation
industry” to include other aviation-related businesses not located at airports
(e.g., off-site air freight companies or off-site aircraft parts manufacturing companies)
and some portion of expenditures by visitors and other persons traveling on air
transportation services and through airports.
The following sections of this report provide information on the contribution of the
aviation industry to Alaska’s economy, describe the importance of Alaska’s airports
and the aviation industry to its citizens and communities, and compare the
importance of airports in Alaska with similar remote airports in the western United
States. The information presented in the following sections is based primarily on a
survey effort that targeted all public airports managed by ADOT&PF, public airports
managed by other entities, private airports throughout the state, leaseholders
located on ADOT&PF airports, and 600 residents in Alaska who have flown within
the last 12 months. Telephone interviews with airport managers, city officials, and
other community leaders in 18 selected communities in Alaska and in 4 western
states were undertaken to evaluate the importance of airports to remote
communities. More detailed information on the survey and analytical methods
employed in this project and summaries of interviews are presented in the
appendices.
2.0 ECONOMIC CONTRIBUTION TO THE STATE OF ALASKA’S ECONOMY
This section discusses the economic contribution of Alaska’s aviation industry to the
state economy. The economic contribution of the aviation industry is measured in
terms of the value of economic activity (or output) and the number of jobs generated
from the industry’s operations, covering fiscal year (FY) 2007. This study shows that
the Alaska aviation industry contributed $3.5 billion in economic output and
supported over 47,000 jobs statewide in FY2007.
The aviation industry, as defined in this statewide study, includes all the businesses
and organizations located at public and private airports in Alaska. These entities,
The Economic Contribution of the Aviation Industry
Page 4
which include the airlines, airport concessions, air freight companies, and even
government and civic organizations, are collectively referred to in this report as “on-
site entities.” Not included in this study’s definition of the aviation industry are the
other aviation-related businesses that are not located at airports (e.g., off-site air
freight companies or off-site aircraft parts manufacturing companies).
The measure of the total economic contribution is comprised of the direct (or on-site)
effects and the multiplier effects. The direct effects result from the aviation
expenditures injected into the state economy through payroll, maintenance and
operations, and capital spending by on-site entities. Not included in this study’s
direct spending measure is the portion of expenditures by visitors and other persons
traveling on air transportation services and through airports. The multiplier effects
result from the spin-off spending as aviation employees and other businesses that
support the on-site entities buy goods and services from the local vendors. For
example, if an airport employee spends his wages on food, utilities, and clothing, this
second round of spending creates the multiplier or induced effects on the economy.
Direct spending and direct employment by the aviation industry were estimated
using primary data from a survey conducted by the study team of all public airports
managed by ADOT&PF, public airports managed by other entities, private airports
throughout the state, and leaseholders located on ADOT&PF airports. Secondary
data were used to supplement information not available from the survey data. Also,
since a study of the economic impacts of the Anchorage International Airport is done
every year and was already available; the survey effort did not include the
Anchorage airport. The results of the latest study entitled, Ted Stevens Anchorage
International Airport: Economic Significance 2007, which was conducted by the
Institute of Social and Economic Research (ISER), were incorporated in this
statewide study.
The multiplier effects were based on an input-output analysis of the survey and
secondary data using the IMPLAN software program and database.
The Economic Contribution of the Aviation Industry
Page 5
The methodology used in this study is discussed in more detail in the appendices
(see Appendix A for Survey Methods and Appendix B for the Input-Output Analysis).
2.1 Economic Activity
Local spending generates economic activity and creates multiplier effects in other
sectors of the economy. The industry’s in-state spending includes payroll, capital
expenditures, and other operating and maintenance expenditures. Total spending by
on-site entities in fiscal year 2007 amounted to $2.1 billion—this is the value of the
economic activity generated by operations of airports and the businesses and
agencies operating within the airport premises. The economic activity generated by
these on-site operations is referred to as the direct economic effects. Direct
spending by the airports and businesses located at the airports, in turn creates
additional economic activity or multiplier effects in other sectors of the economy. The
economic contribution of the aviation industry through its multiplier effects is
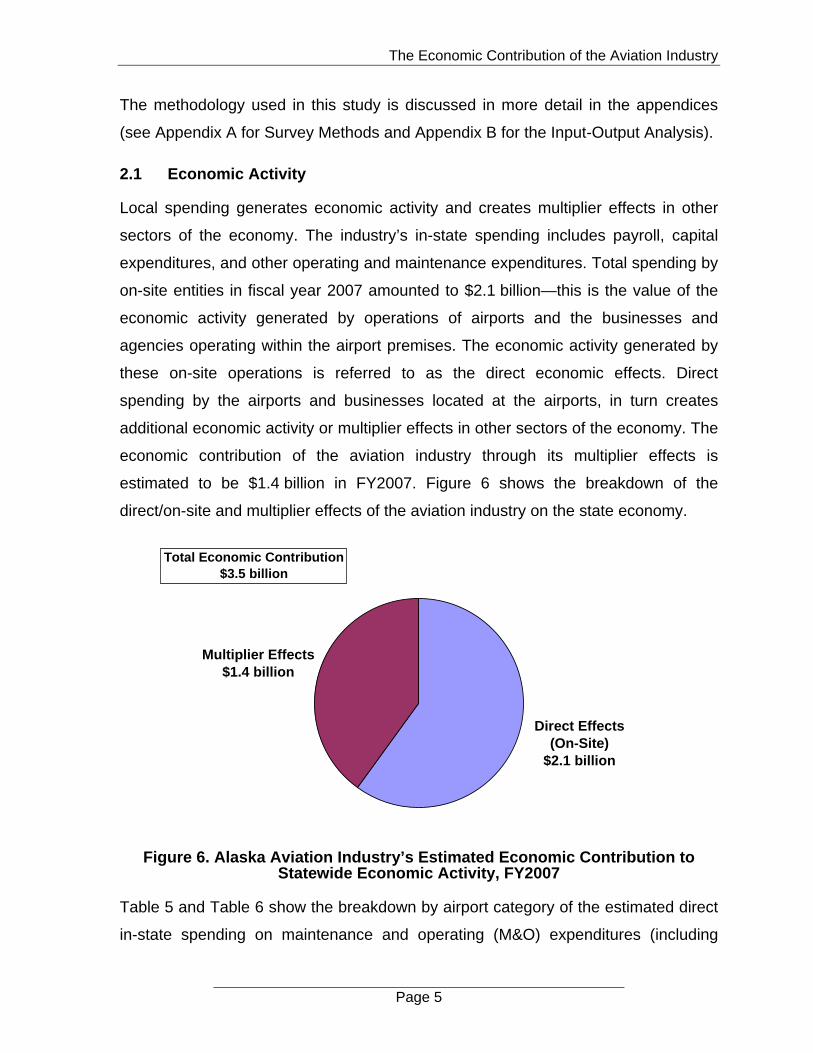
estimated to be $1.4 billion in FY2007. Figure 6 shows the breakdown of the
direct/on-site and multiplier effects of the aviation industry on the state economy.
Direct Effects(On-Site)
$2.1 billion
Multiplier Effects$1.4 billion
Total Economic Contribution$3.5 billion
Figure 6. Alaska Aviation Industry’s Estimated Economic Contribution to Statewide Economic Activity, FY2007
Table 5 and Table 6 show the breakdown by airport category of the estimated direct
in-state spending on maintenance and operating (M&O) expenditures (including
The Economic Contribution of the Aviation Industry
Page 6
payroll), and capital expenditures by airports and by on-site businesses and
organizations, respectively.
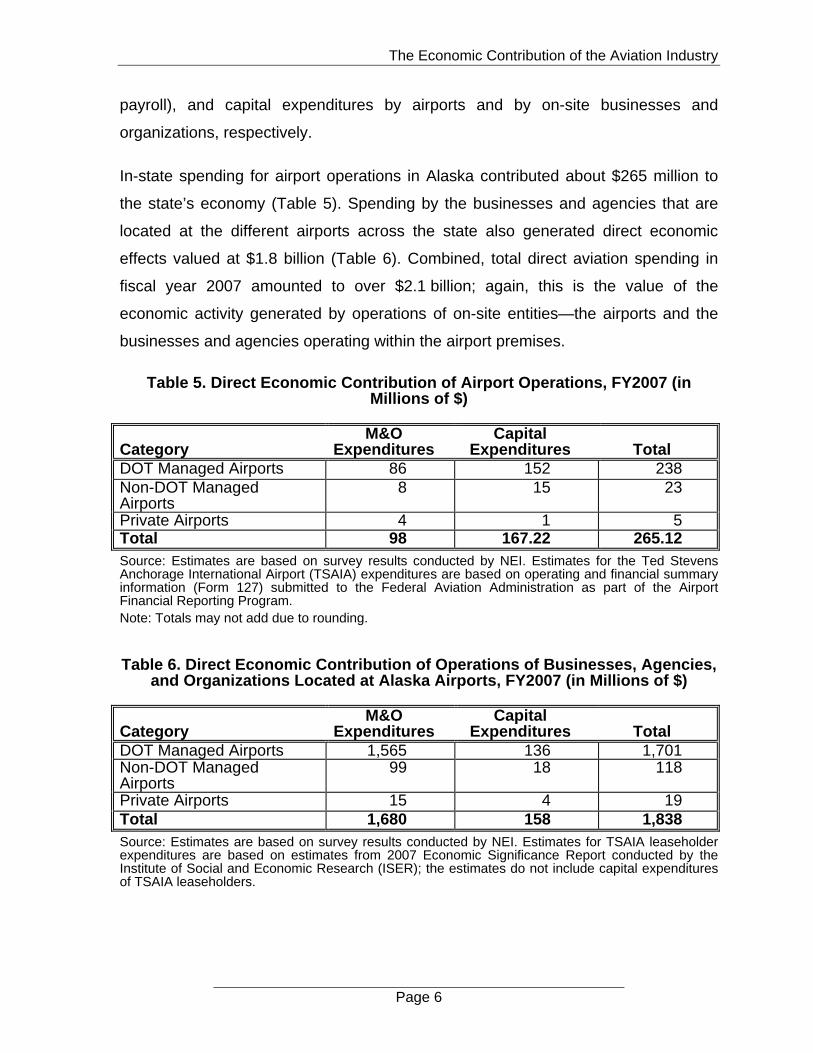
In-state spending for airport operations in Alaska contributed about $265 million to
the state’s economy (Table 5). Spending by the businesses and agencies that are
located at the different airports across the state also generated direct economic
effects valued at $1.8 billion (Table 6). Combined, total direct aviation spending in
fiscal year 2007 amounted to over $2.1 billion; again, this is the value of the
economic activity generated by operations of on-site entities—the airports and the
businesses and agencies operating within the airport premises.
Table 5. Direct Economic Contribution of Airport Operations, FY2007 (in Millions of $)
Category M&O
Expenditures Capital
Expenditures Total DOT Managed Airports 86 152 238 Non-DOT Managed Airports
8 15 23
Private Airports 4 1 5 Total 98 167.22 265.12 Source: Estimates are based on survey results conducted by NEI. Estimates for the Ted Stevens Anchorage International Airport (TSAIA) expenditures are based on operating and financial summary information (Form 127) submitted to the Federal Aviation Administration as part of the Airport Financial Reporting Program. Note: Totals may not add due to rounding.
Table 6. Direct Economic Contribution of Operations of Businesses, Agencies, and Organizations Located at Alaska Airports, FY2007 (in Millions of $)
Category M&O
Expenditures Capital
Expenditures Total DOT Managed Airports 1,565 136 1,701 Non-DOT Managed Airports
99 18 118
Private Airports 15 4 19 Total 1,680 158 1,838 Source: Estimates are based on survey results conducted by NEI. Estimates for TSAIA leaseholder expenditures are based on estimates from 2007 Economic Significance Report conducted by the Institute of Social and Economic Research (ISER); the estimates do not include capital expenditures of TSAIA leaseholders.

The Economic Contribution of the Aviation Industry
Page 7
Table 7 shows the estimated multiplier effects of the aviation industry spending in
2007. The results indicate that the industry generated an additional $1.4 billion in
economic activity in other sectors of the economy.
Table 7. Estimated Multiplier Effects of Alaska’s Aviation Industry, FY2007 (in Millions of $)
Category Amount DOT Managed Airports 1,289 Non-DOT Managed Airports 94 Private Airports 19 Total 1,401 Source: Multiplier effects are based on industry multipliers provided by IMPLAN. Direct inputs to the model are based on expenditure estimates derived from the surveys, ISER results, and TSAIA financial statements. Note: Totals may not add due to rounding.
Table 8 summarizes the direct and multiplier effects of the aviation industry to the
state economy in FY2007.
Table 8. Estimated Direct and Multiplier Effects of Alaska’s Aviation Industry, FY2007 (in Millions of $)
Category Amount Direct Effects On-site Airport Operations 265 On-Site Airport Businesses 1,838 Subtotal 2,103 Multiplier Effects 1,401 Total: 3,504 Source: Multiplier effects are based on industry multipliers provided by IMPLAN. Direct inputs to the model are based on expenditure estimates derived from the surveys, ISER results, and ANC financial statements. Note: Totals may not add due to rounding.
In total, the aviation industry generated over $3.5 billion in economic activity
throughout Alaska—an amount equal to nearly eight percent of the State’s $44.5
billion gross state product (GSP).6 The aviation industry accounted for 5.6 percent of
national gross domestic product in 2006 (Federal Aviation Administration, 2008).
The fact that the aviation industry in Alaska is almost 40 percent larger than the
6 GSP is the value of all of the goods and services produced by the economy, less the cost of goods
used in production.
The Economic Contribution of the Aviation Industry
Page 8
industry’s role in the national economy further demonstrates the importance of the
aviation industry in Alaska’s economy.
The businesses, agencies, and organizations that are located on airports and
comprise Alaska’s aviation industry are a crucial component of Alaska’s economy.
They are drawn from the primary sectors of the economy (i.e., those sectors that are
reported by governmental agencies) such as government, trade, transportation and
utilities, and hospitality and leisure.
If the aviation industry were a primary economic sector, it would be the fifth largest
economic sector in terms of contribution to gross state product (GSP) after natural
resources, finance and other services, government, and transportation and utilities
sectors.7 The aviation industry is larger than the trade, construction and
manufacturing, health and education, and hospitality and leisure sectors (See Figure
1).
7 Many of the firms included in the aviation industry are part of the transportation and utilities sector;
however, most economic sectors are represented in the aviation industry. The fact that the aggregate
aviation industry is made up of entities already accounted for in the individual primary economic
sectors makes it challenging to compare the contribution of the aviation industry to those sectors.
The Economic Contribution of the Aviation Industry
Page 9
0
2,000
4,000
6,000
8,000
10,000
12,000
14,000
16,000
Natur
al Res
ourc
es
Finan
ce &
Oth
er S
ervic
es
Gover
nmen
t
Trans
porta
tion
& Utili
ties
Trade
Constr
uctio
n & M
anuf
actu
ring
Health
& E
duca
tion
Hospit
ality
& Leis
ure
Aviatio
n In
dustr
y
Co
ntr
ibu
tio
n t
o G
SP
($
Mil
lio
ns)
Figure 7. The Aviation Industry’s Contribution to GSP Compared to Primary Economic Sectors, 2007
Sources: Northern Economics, Inc. estimates, 2008 derived from Bureau of Economic Analysis data.
2.2 Employment
In FY2007, the aviation industry supported over 47,000 on-site and off-site jobs
across the state, with the highest concentration of jobs located at the international
airports in Anchorage and Fairbanks, as well as at the state’s larger regional hub
airports. In this case, “off-site jobs” are the jobs created in other sectors of the
economy generated from the spin-off spending by firm, agencies, and organizations
located at Alaska airports.
Aviation industry jobs are found around the state and also in the smallest
communities, with smaller village airports typically having one or more part-time or
full-time representatives for air carriers serving the community. More than 27,000 on-
site jobs and almost 20,000 off-site jobs were created by the aviation industry during
FY2007 (see Figure 8).
The Economic Contribution of the Aviation Industry
Page 10
On-Site Jobs, 27,500
Off-Site Jobs, 19,600
Total Employment47,100
Figure 8. Direct (on-site) and Multiplier (off-site) Employment Effects Associated with Alaska’s Aviation Industry, FY2007
Source: Northern Economics, Inc. estimates, 2008.
The on-site jobs include over 2,000 full-time and part-time jobs directly related to the
daily operation and maintenance of public and private airports in Alaska. Table 9
shows the breakdown of direct employment by airport category.
Table 9. Number of Direct Full-Time and Part-Time Jobs Associated with Airport Operations, FY2007
Category Full-Time Part-Time DOT Managed Airports 1,285 92 Non-DOT Managed Airports 147 73 Private Airports 245 256 Total: 1,676 421 Source: Direct employment estimates are based on information provided by DOT staff and information provided by airport managers from the survey effort. Estimates for the Anchorage International Airport are from the 2007 Economic Significance study conducted by the Institute of Social and Economic Research (ISER). Note: The jobs in the ISER study are expressed as annual average full-time equivalent jobs. Totals may not add due to rounding.
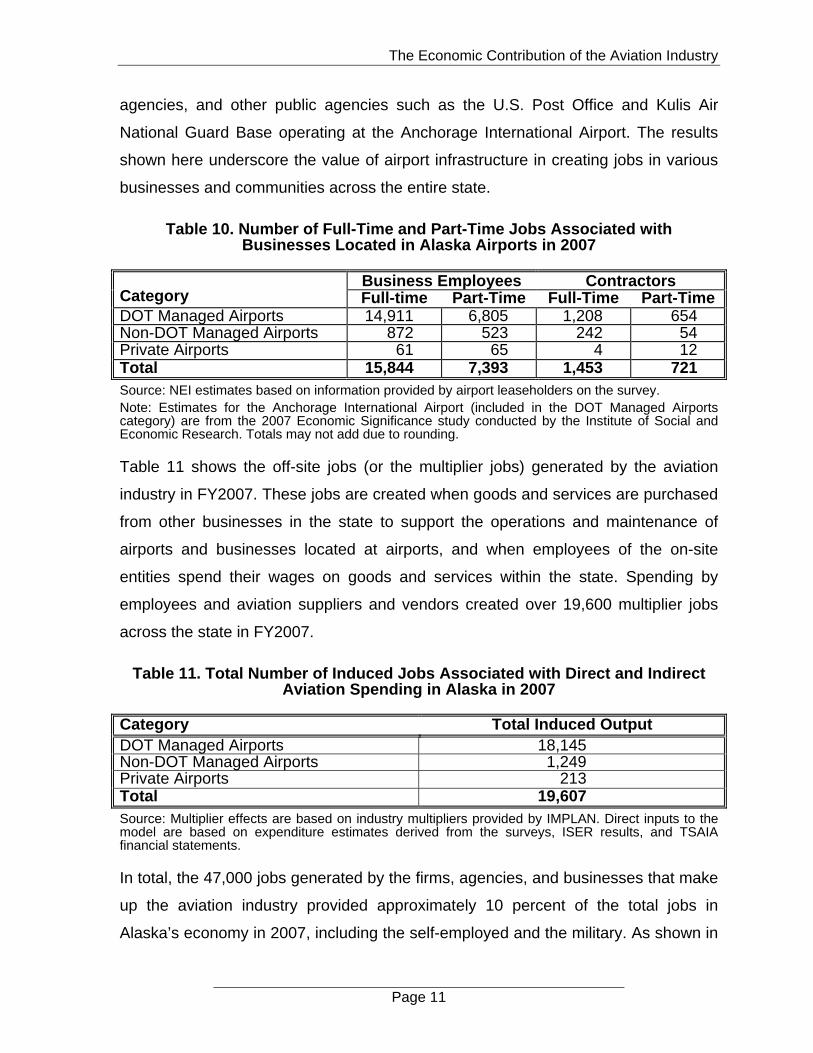
The on-site total also includes over 25,000 jobs created by on-site businesses,
organizations, and government agencies operating at the airports in 2007 (see Table
10). These businesses include commercial air carriers, fixed-base operators, fuel
distributors, caterers, air taxis, charter operations, general aviation services, state
The Economic Contribution of the Aviation Industry
Page 11
agencies, and other public agencies such as the U.S. Post Office and Kulis Air
National Guard Base operating at the Anchorage International Airport. The results
shown here underscore the value of airport infrastructure in creating jobs in various
businesses and communities across the entire state.
Table 10. Number of Full-Time and Part-Time Jobs Associated with Businesses Located in Alaska Airports in 2007
Business Employees Contractors Category Full-time Part-Time Full-Time Part-Time DOT Managed Airports 14,911 6,805 1,208 654 Non-DOT Managed Airports 872 523 242 54 Private Airports 61 65 4 12 Total 15,844 7,393 1,453 721 Source: NEI estimates based on information provided by airport leaseholders on the survey. Note: Estimates for the Anchorage International Airport (included in the DOT Managed Airports category) are from the 2007 Economic Significance study conducted by the Institute of Social and Economic Research. Totals may not add due to rounding.
Table 11 shows the off-site jobs (or the multiplier jobs) generated by the aviation
industry in FY2007. These jobs are created when goods and services are purchased
from other businesses in the state to support the operations and maintenance of
airports and businesses located at airports, and when employees of the on-site
entities spend their wages on goods and services within the state. Spending by
employees and aviation suppliers and vendors created over 19,600 multiplier jobs
across the state in FY2007.
Table 11. Total Number of Induced Jobs Associated with Direct and Indirect Aviation Spending in Alaska in 2007
Category Total Induced Output DOT Managed Airports 18,145 Non-DOT Managed Airports 1,249 Private Airports 213 Total 19,607 Source: Multiplier effects are based on industry multipliers provided by IMPLAN. Direct inputs to the model are based on expenditure estimates derived from the surveys, ISER results, and TSAIA financial statements.
In total, the 47,000 jobs generated by the firms, agencies, and businesses that make
up the aviation industry provided approximately 10 percent of the total jobs in
Alaska’s economy in 2007, including the self-employed and the military. As shown in

The Economic Contribution of the Aviation Industry
Page 12
Figure 2, the on-site and off-site employment generated by the aviation industry was
smaller than employment for the government, finance and other services, trade, and
health and education sectors, but larger than employment for the hospitality and
leisure, construction and manufacturing, natural resources, and transportation and
utilities sectors.
In 2006 the national aviation industry contributed to the employment of 11 million
people, or about 7 percent of the nation’s annual average employment, including the
self-employed in that year (Federal Aviation Administration, 2008). The much larger
share of employment generated by Alaska’s aviation industry (10 percent) in
comparison to the national estimates is further evidence of the importance of the
aviation industry to Alaska’s communities and residents.
0
20,000
40,000
60,000
80,000
100,000
120,000
Gover
nmen
t
Finan
ce &
Oth
er S
ervic
es
Trade
Health
& E
duca
tion
Hospit
ality
& Leis
ure
Constr
uctio
n & M
anuf
actu
ring
Natur
al Res
ourc
es
Trans
porta
tion
& Utili
ties
On-Site
Avia
tion
Indu
stry
All Avia
tion
Indu
stry J
obs
Job
s
Figure 9. The Aviation Industry’s Contribution to Available Jobs Compared to Primary Economic Sectors, 2007
Sources: Northern Economics, Inc. estimates, 2008 derived from Bureau of Economic Analysis data.
The Economic Contribution of the Aviation Industry
Page 13
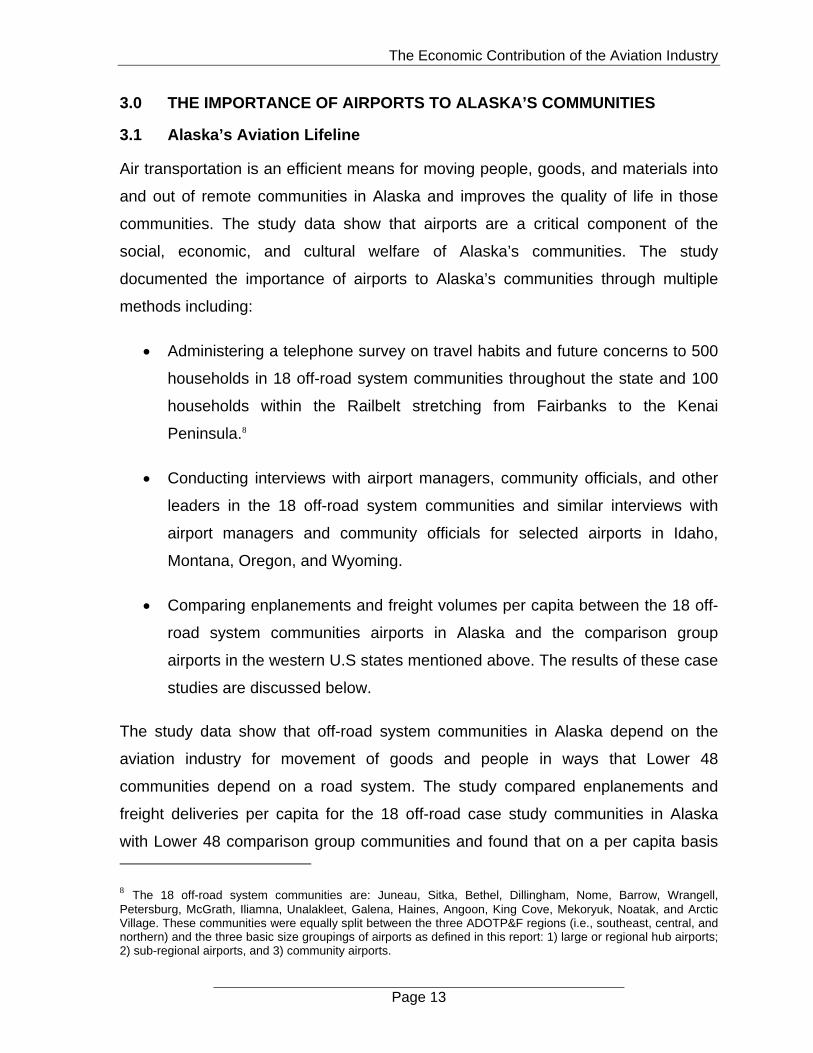
3.0 THE IMPORTANCE OF AIRPORTS TO ALASKA’S COMMUNITIES
3.1 Alaska’s Aviation Lifeline
Air transportation is an efficient means for moving people, goods, and materials into
and out of remote communities in Alaska and improves the quality of life in those
communities. The study data show that airports are a critical component of the
social, economic, and cultural welfare of Alaska’s communities. The study
documented the importance of airports to Alaska’s communities through multiple
methods including:
Administering a telephone survey on travel habits and future concerns to 500
households in 18 off-road system communities throughout the state and 100
households within the Railbelt stretching from Fairbanks to the Kenai
Peninsula.8
Conducting interviews with airport managers, community officials, and other
leaders in the 18 off-road system communities and similar interviews with
airport managers and community officials for selected airports in Idaho,
Montana, Oregon, and Wyoming.
Comparing enplanements and freight volumes per capita between the 18 off-
road system communities airports in Alaska and the comparison group
airports in the western U.S states mentioned above. The results of these case
studies are discussed below.
The study data show that off-road system communities in Alaska depend on the
aviation industry for movement of goods and people in ways that Lower 48
communities depend on a road system. The study compared enplanements and
freight deliveries per capita for the 18 off-road case study communities in Alaska
with Lower 48 comparison group communities and found that on a per capita basis
8 The 18 off-road system communities are: Juneau, Sitka, Bethel, Dillingham, Nome, Barrow, Wrangell, Petersburg, McGrath, Iliamna, Unalakleet, Galena, Haines, Angoon, King Cove, Mekoryuk, Noatak, and Arctic Village. These communities were equally split between the three ADOTP&F regions (i.e., southeast, central, and northern) and the three basic size groupings of airports as defined in this report: 1) large or regional hub airports; 2) sub-regional airports, and 3) community airports.
The Economic Contribution of the Aviation Industry
Page 14
communities in Alaska have annual enplanements at least eight times higher than
the number of enplanements per capita in the comparison group and that freight per
capita was at least 39 times higher than the next highest state. The study data also
show that Alaska’s off-road system communities depend on air travel in ways that
are different from the Railbelt communities. For example, while off-road system and
Railbelt households indicated they traveled on airplanes roughly the same number of
times in the past twelve months, the reasons for those trips were very different.
Railbelt households were more likely to travel for work-related reasons while off-road
system households were traveling to obtain services that they could not acquire in
their own communities (e.g., medical travel). The results of this part of the study are
explained in the following subsections, which outline the results of the 600-
household passenger survey, and provide the comparisons of travel and freight
usage through case study comparisons.
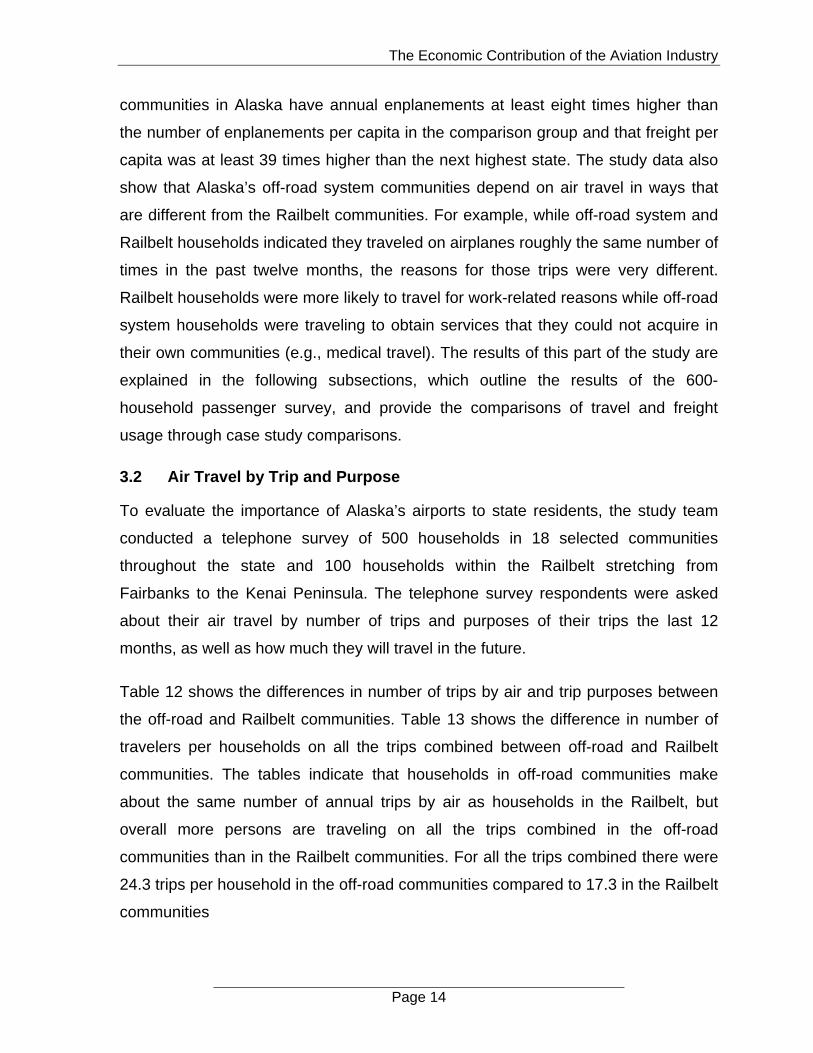
3.2 Air Travel by Trip and Purpose
To evaluate the importance of Alaska’s airports to state residents, the study team
conducted a telephone survey of 500 households in 18 selected communities
throughout the state and 100 households within the Railbelt stretching from
Fairbanks to the Kenai Peninsula. The telephone survey respondents were asked
about their air travel by number of trips and purposes of their trips the last 12
months, as well as how much they will travel in the future.
Table 12 shows the differences in number of trips by air and trip purposes between
the off-road and Railbelt communities. Table 13 shows the difference in number of
travelers per households on all the trips combined between off-road and Railbelt
communities. The tables indicate that households in off-road communities make
about the same number of annual trips by air as households in the Railbelt, but
overall more persons are traveling on all the trips combined in the off-road
communities than in the Railbelt communities. For all the trips combined there were
24.3 trips per household in the off-road communities compared to 17.3 in the Railbelt
communities
The Economic Contribution of the Aviation Industry
Page 15
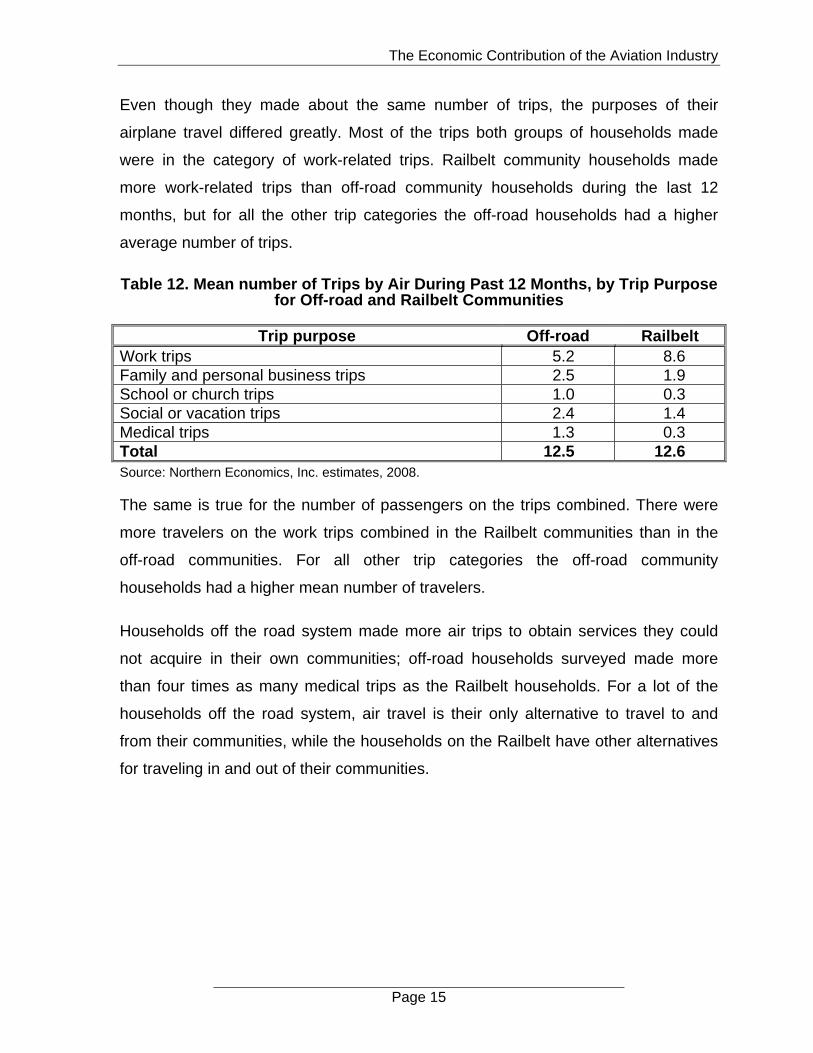
Even though they made about the same number of trips, the purposes of their
airplane travel differed greatly. Most of the trips both groups of households made
were in the category of work-related trips. Railbelt community households made
more work-related trips than off-road community households during the last 12
months, but for all the other trip categories the off-road households had a higher
average number of trips.
Table 12. Mean number of Trips by Air During Past 12 Months, by Trip Purpose for Off-road and Railbelt Communities
Trip purpose Off-road Railbelt Work trips 5.2 8.6 Family and personal business trips 2.5 1.9 School or church trips 1.0 0.3 Social or vacation trips 2.4 1.4 Medical trips 1.3 0.3 Total 12.5 12.6 Source: Northern Economics, Inc. estimates, 2008.
The same is true for the number of passengers on the trips combined. There were
more travelers on the work trips combined in the Railbelt communities than in the
off-road communities. For all other trip categories the off-road community
households had a higher mean number of travelers.
Households off the road system made more air trips to obtain services they could
not acquire in their own communities; off-road households surveyed made more
than four times as many medical trips as the Railbelt households. For a lot of the
households off the road system, air travel is their only alternative to travel to and
from their communities, while the households on the Railbelt have other alternatives
for traveling in and out of their communities.

The Economic Contribution of the Aviation Industry
Page 16
Table 13. Mean number Trips per Household by Air Combined During Past 12 Months by Trip Purpose for Off-road and Railbelt Communities
Trip Purpose Off-road Railbelt Work trips 6.4 9.2 Family and personal business trips 6.6 3.6 School or church trips 2.3 0.4 Social or vacation trips 6.6 3.6 Medical trips 2.4 0.5 Total 24.3 17.3 Source: Northern Economics, Inc. estimates, 2008.
The 18 selected communities in the off-road system sample were divided equally
among regional hubs, sub-regional hubs, and community airports in the three
ADOT&PF regions: Southeast, Central, and Northern. A regional hub airport is larger
and allows a community to provide goods and services more efficiently to a larger or
broader area, and enhances its role as a government or economic center. Sub-
regional hubs are typically smaller in population and have smaller economies than
regional hubs with fewer routes connecting to outlying villages and fewer flights to
major urban centers. Community airports are typically in the smallest communities,
and these airports generally only support one local community. The increasing cost
of air travel affects all Alaska residents, but especially those living in the smallest
communities with lower incomes.
Table 14 shows the mean number of trips by trip purpose for the different airport
type communities. Survey responses indicate that small community respondents
made more than twice as many family or personal business-related and medical
trips by air as the larger communities. They also made more family and personal
business trips, but fewer trips that may be for more discretionary travel such as
social or vacation.

The Economic Contribution of the Aviation Industry
Page 17
Table 14. Mean Number of Trips by Air During Past 12 Months by Trip Purpose and Airport Type
Airport Type
Trip Purpose Regional HubSub-regional
Hub CommunityWork trips 5.4 4.5 4.0 Family and personal business trips 2.4 2.2 4.5 School or church trips 1.0 1.1 0.7 Social or vacation trips 2.6 1.9 1.4 Medical trips 1.0 1.5 3.8 Total 12.5 11.3 14.5 Source: Northern Economics, Inc. estimates, 2008.
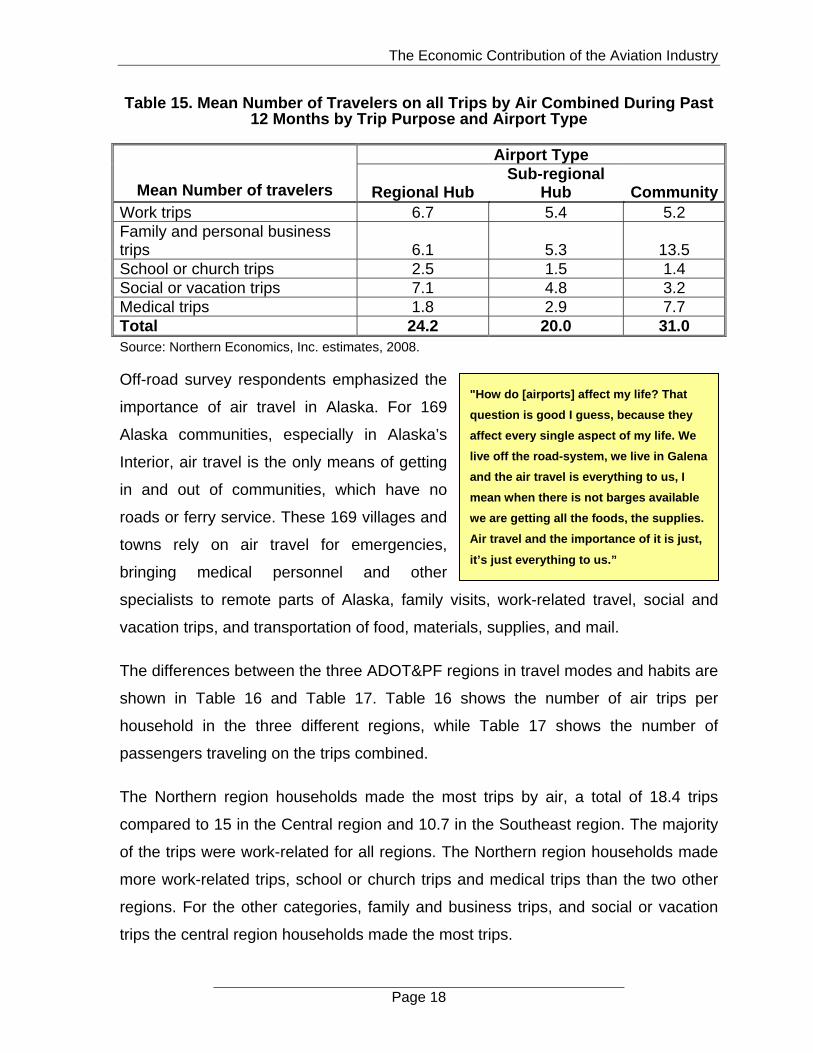
Table 15 shows the number of travelers on all air trips combined divided into trip
purposes by airport type community. The number of travelers on the trips tells the
same story as above. In total, there are more travelers on all trips combined in the
households in small communities than in the larger communities. For medical trips
the number of travelers is more than four times what it is in the regional hub
communities, and more than twice as many as in the sub-regional hub communities.
Typically the smaller communities have very limited medical service, if any at all, and
residents have to travel for all medical services. As the size of the community grows,
the number of medical services expands and residents do not need to travel as
frequently.
In the smaller communities there were also more travelers on family and personal
business trips; more than twice as many as in the larger communities and fewer
travelers on social or vacation trips and on work trips than in the regional hub
communities.
The Economic Contribution of the Aviation Industry
Page 18
Table 15. Mean Number of Travelers on all Trips by Air Combined During Past 12 Months by Trip Purpose and Airport Type
Airport Type
Mean Number of travelers Regional Hub Sub-regional
Hub CommunityWork trips 6.7 5.4 5.2 Family and personal business trips 6.1 5.3 13.5 School or church trips 2.5 1.5 1.4 Social or vacation trips 7.1 4.8 3.2 Medical trips 1.8 2.9 7.7 Total 24.2 20.0 31.0 Source: Northern Economics, Inc. estimates, 2008.
Off-road survey respondents emphasized the
importance of air travel in Alaska. For 169
Alaska communities, especially in Alaska’s
Interior, air travel is the only means of getting
in and out of communities, which have no
roads or ferry service. These 169 villages and
towns rely on air travel for emergencies,
bringing medical personnel and other
specialists to remote parts of Alaska, family visits, work-related travel, social and
vacation trips, and transportation of food, materials, supplies, and mail.
The differences between the three ADOT&PF regions in travel modes and habits are
shown in Table 16 and Table 17. Table 16 shows the number of air trips per
household in the three different regions, while Table 17 shows the number of
passengers traveling on the trips combined.
The Northern region households made the most trips by air, a total of 18.4 trips
compared to 15 in the Central region and 10.7 in the Southeast region. The majority
of the trips were work-related for all regions. The Northern region households made
more work-related trips, school or church trips and medical trips than the two other
regions. For the other categories, family and business trips, and social or vacation
trips the central region households made the most trips.
"How do [airports] affect my life? That
question is good I guess, because they
affect every single aspect of my life. We
live off the road-system, we live in Galena
and the air travel is everything to us, I
mean when there is not barges available
we are getting all the foods, the supplies.
Air travel and the importance of it is just,
it’s just everything to us.”

The Economic Contribution of the Aviation Industry
Page 19
Table 16. Mean Number of Trips by Air During Past 12 Months by Trip Purpose and ADOT&PF Region
ADOT&PF Region Trip Purpose Southeast Central Northern
Work trips 4.2 6.6 8.8 Family and personal business trips 2.0 4.0 3.8 School or church trips 1.0 0.5 1.3 Social or vacation trips 2.3 2.7 2.5 Medical trips 1.2 1.3 2.0 Total 10.7 15.0 18.4 Source: Northern Economics, Inc. estimates, 2008.
The highest mean number of passengers on air trips combined was for family and
personal business trips. The Northern region had the highest mean number of
travelers for all trip categories. The Southeast communities typically have more
options for traveling in and out of their communities, such as the state ferry system,
and are not as dependent on air travel as communities in the Northern region. The
communities in the Northern region are all reliant on air travel and transportation of
goods and supplies through all or parts of the year. None of the communities in the
Northern region are on the ferry system. The Central region includes both
communities on the ferry system and communities that can only be reached by air.
As seen in Table 17 there were more than twice as many travelers in all trip
categories in the Northern region as in the Southeast region, 45.3 compared to 18.8.
The Central region had a mean number of 31.2 passengers per household on all
trips combined. Northern Region households had more than twice as many trips in
every trip purpose category compared to Southeast households, with almost a 3:1
ratio in some cases. Northern Region households also had more trips than Central
Region households across all trip purpose categories, with five times as many trips
for school or church trips.

The Economic Contribution of the Aviation Industry
Page 20
Table 17. Mean number of Passengers on all Trips by Air Combined During Past 12 Months by Trip Purpose and ADOT&PF Region
ADOT&PF Region Mean Number of travelers Southeast Central Northern
Work trips 5.0 8.4 11.5 Family and personal business trips 4.4 11.9 12.5 School or church trips 2.1 1.0 5.0 Social or vacation trips 5.5 7.3 11.5 Medical trips 1.8 2.7 4.8 Total 18.8 31.2 45.3 Source: Northern Economics, Inc. estimates, 2008.
3.3 Comparison with Western United States Airports
To illustrate the importance of Alaska’s airports in
comparison to remote airports in other western U.S.
states, the study team conducted interviews with airport
managers, community officials and other leaders in
communities in Alaska, Idaho, Montana, Oregon, and
Wyoming. The team also made a comparison of
enplanements and freight volumes per capita between the 18 case study airports in
Alaska and the airports in the western U.S. A major focus of the case studies was
contacting local experts that could provide local insights about the airport located in
their community. Interviews were completed with airport managers, community
officials, and other community managers.
Several attempts were made to contact local
experts from all the case study communities;
thirteen of the eighteen communities were
reached. Case study airports contacted
include: Dillingham, Haines, Iliamna, Juneau,
Petersburg, Sitka, Wrangell, Mekoryuk, Nome,
Unalakleet, Galena, Noatak, and Arctic Village.
Topics covered during the interviews included:
The role of the airport in the community
In Galena, “the airport is a hub [for] five
surrounding communities (Ruby, Huslia,
Koyukuk, Unalakleet, Kaltag). They have
smaller gravel strips that are daylight-
only strips, so if they need to get out in
case of an emergency they must use our
airport. Also all of their freight, mail, and
healthcare providers come through the
Galena airport”.
If we didn’t have the airport
we wouldn’t have anything.
The airport is a fact of life for
living out here in the villages.
The airport is our roads,
highway, ocean, our lifeline.
The Economic Contribution of the Aviation Industry
Page 21
In Wrangell, “it (the airport) has
been very important. Even just the
fact of getting people in and out of
the community, like visitors,
government, contractors,
consultants, anyone that needs to
travel to the community”.
The effect of the airport on the community’s economic development
The effect of the airport on the community’s health and safety
And the effect of the airport on nearby communities
Alaska Airports
Air transportation is an efficient means for moving
people, goods, and materials in and out of off-road
communities in Alaska and it improves the quality of
life in those communities. The case studies
confirmed the results from the passenger survey
that airports play a vital role for most Alaska off-
road communities. Many off-road communities in
Northern and Western Alaska would be completely isolated in the winter without
their airports. In parts of Central and Southeast Alaska, ferry or road transportation
may be alternatives, but communities still rely heavily on their airports for swift and
reliable travel.
The interviewees emphasized that without their
airport, population and business activities would
drop dramatically. Most community members
contacted stated it would be difficult for their
community to maintain itself without an airport.
The role of airports in rural Alaska was often compared to the role of highways and
the road system in the lower 48 states. A large or hub airport allows a community to
provide goods and services to an area
much larger than itself, and even to
maintain itself as a government or
economic center.
For many communities in Alaska,
having an airport helps them attract
tourists. For example, many off-road communities attract visitors through having
In Sitka, “Sitka only has 15 miles of
road and limited ferry service, so the
airport is our lifeline. Without the
airport we would reduce by half (in
population size)”.
In Sitka “we are a regional healthcare center, so it
helps us serve the surrounding communities and
people that need healthcare. Sitka has two medevac
companies that bring people in from outside the
area and these same two medevac services can fly
people down to Seattle too”.
The Economic Contribution of the Aviation Industry
Page 22
charter services so visitors can fly in and go fishing or hunting. Airports also play a
vital role for the fresh fish and seafood industry—without air service from rural
communities, this industry would not be able to provide fresh fish and seafood to
distant markets in Alaska or outside of the state.
Airports are essential for providing
emergency response services in many
rural Alaska communities. Airports are
used to bring medical personnel like
doctors or specialists to remote parts of Alaska, or to enable people to travel to a
hospital or clinic to see a doctor or specialist. For larger communities, such as
Juneau or Sitka, their airports allow them to provide medical services to a larger
area.
The effect airports have on nearby communities (that
do not have their own airport) is similar to the effect
the airport has on the community in which it is
located. It may act as a hub for people traveling from
a regional or sub-regional hub airport to a community
airport, and it may provide access to goods and
services that would otherwise not be provided. For
example, an airport in a slightly larger off-road
village may act as an economic center for
providing freight to businesses and people located
in nearby smaller villages or in non-incorporated
parts of remote Alaska. Freight includes mail, food, and other essential supplies.
Lower 48 Communities
With the purpose of better understanding the role of off-road Alaska airports, case
studies of rural airports in the lower 48 states were completed. The results of these
cases studies were compared to results from off-road Alaska airport case studies,
allowing the identification of similarities and differences between the airports.
In Iliamna, “they (people from
nearby communities) come to
pick up freight, so the airport is
a hub for the seven Iliamna Lake
villages”.
In Wrangell “health and safety is probably the main
thing (provided to nearby communities). People
living rurally can give us a call and we can send
emergency help to them”.
In Nome, “No one in rural Alaska
could maintain themselves without
airports. I don’t think this question is
a realistic question to us, because
living out here without airports just
couldn’t happen”.

The Economic Contribution of the Aviation Industry
Page 23
Rural airports contacted in the lower 48 states include Hailey, Idaho; Pendleton,
Oregon; Glasgow, Montana; Wolf Point, Montana; Lander, Wyoming; and Riverton,
Wyoming. These communities were chosen due to their remote locations and
comparable size of operations to Alaska airports. Similar to Alaska off-road
communities, the case studies of other rural U.S. airports involved interviews with
airport managers, community officials, and other community managers.
Topics covered in the interviews with communities included:
The role of the airport in the community
The effect of the airport on the community’s economic development
The effect of the airport on the community’s health and safety
And the effect of the airport on nearby communities
In general, rural airports in the Lower 48 States are important to their communities
but tend to not play as vital a role in terms of overall travel to and from the
communities, or for the transportation of cargo, since travel can occur by road and
sometimes rail to and from these rural communities. Instead, rural airports play other
critical roles, attracting tourists or other visitors like government staff or business
people. Having airports helps rural communities attract businesses or industries that
would not consider locating in the rural community without the airport. The airports
help communities function and provide services
like FedEx and UPS.
Passenger travel to and from rural airports in
Western States in the Lower 48 is often
associated with a high number of tourists or
recreational travel. Tourism is an important
component of many rural Western economies,
and having the convenience of airport access is important for attracting tourists that
want convenient access to nearby tourist destinations or recreational pursuits.
In Hailey, Idaho “we couldn’t attract
the level of tourists and recreationists
that [we] currently [do] (without our
airport). Having the airport allows
travelers to easily come to Hailey, so
without the airport we would have a
really difficult time getting people to
visit especially in the wintertime”.
The Economic Contribution of the Aviation Industry
Page 24
Air service is important for the communities for the provision of medical and
emergency services. Patients travel by air for medical services not available in their
communities, and sometimes doctors or other medical specialists are under contract
with a rural hospital to travel to the rural community and meet with patients at the
local hospitals.
In the Western U.S. rural airports are critical for fighting
fires, and especially forest fires.
When asked whether or not they believe their
community could maintain itself without the airport, rural
communities in the Lower 48 commented that their
community could deal with not having an airport, but
that it would make them much less attractive for people
considering visiting the area or doing business in the
area. The population would likely decline.
Not having an airport is an inconvenience for rural communities in the Lower 48, but
it is something they can potentially work around.
For example, a few of the rural airports
contacted in the Lower 48 had recently lost
commercial air service (Glasgow and Wolf
Point, Montana). Although they are expecting
commercial air service to be restored in the next
year as the air carrier Great Lakes Airlines
begins service, they have had first-hand
experience about what it is like to not have
passenger air service in their local communities.
In Glasgow the community had a grant to provide bus service. The grant recently
expired so the community helps coordinate car pools for people that need to travel
for medical or other needs (Brandt, D., 2008).
In Riverton, Wyoming “we
would get by, but it wouldn’t
be as convenient for people
to travel in, but we would
likely still get through”.
In Pendleton, Oregon “in the
summertime the airport is
critical for fighting forest
fires. Pendleton is a staging
point for these operations”.
In Riverton, Wyoming “it is the only
airport in a larger area, so being ready
for an emergency situation is really
important. Also we are right next to an
Indian Reservation, so having the
airport allows us to respond quickly to
any emergency they might have.
Fortunately, we haven’t had fires near
us recently, but the airport would likely
be very important if there is one”.
The Economic Contribution of the Aviation Industry
Page 25
Air freight transportation, including air mail, is a vital service provided through Alaska
airports. Although many off-road communities in Alaska supplement their food
supply with subsistence activities, they receive food and supplies from outside
sources. Air freight and air mail shipments could include essential supplies such as
food, medicine, or materials needed to survive in Alaska’s cold and long winter
season.
Off-road communities in Alaska depend on the aviation industry for movement of
goods and people in ways that Lower 48 communities depend on a road system.
The study compared enplanements and air freight deliveries per capita for the 18
case study communities in Alaska with Lower 48 case study communities. The
average number of annual enplanements per capita for communities in Alaska was
found to be 14.6 enplanements per person per year. This number is eight times
higher than the number of enplanements per capita for even the next highest state
(i.e., Idaho at 1.8 enplanements per year), and more than 30 times higher than the
lowest comparison group (i.e., Montana at 0.5 enplanements per person per year)
(see Table 18 and Figure 10).
The difference in air freight pounds per capita is even more startling for Alaska as
compared to the western U.S. The per capita air freight loads for communities in
Alaska is 39 times higher than the air freight load for rural communities in the next
highest surveyed state (see Table 18 and Figure 11). Alaska communities in the
study averaged 1,096 pounds of air freight per capita in 2007 while rural
communities in Oregon averaged 28 pounds. Rural communities in Montana
averaged just 2 pounds of air freight per person in 2007.
For many communities in Alaska, almost all mail is delivered by air transport. In
contrast, few rural communities in the Western U.S. have mail delivered by air
service. A comparison of mail volumes delivered to Alaska communities and similar
information for rural communities in the Western U.S. cannot be made, but
information for Alaska is presented later in this section.
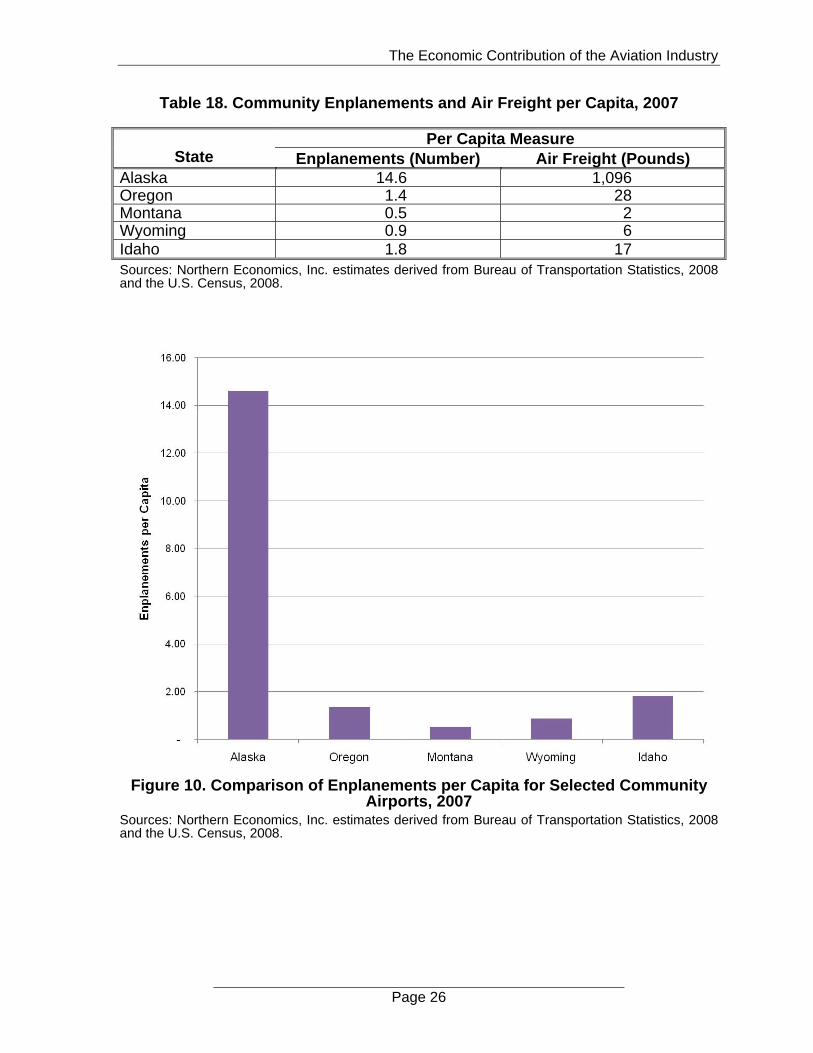
The Economic Contribution of the Aviation Industry
Page 26
Table 18. Community Enplanements and Air Freight per Capita, 2007
Per Capita Measure State Enplanements (Number) Air Freight (Pounds)
Alaska 14.6 1,096 Oregon 1.4 28 Montana 0.5 2 Wyoming 0.9 6 Idaho 1.8 17 Sources: Northern Economics, Inc. estimates derived from Bureau of Transportation Statistics, 2008 and the U.S. Census, 2008.
Figure 10. Comparison of Enplanements per Capita for Selected Community
Airports, 2007 Sources: Northern Economics, Inc. estimates derived from Bureau of Transportation Statistics, 2008 and the U.S. Census, 2008.
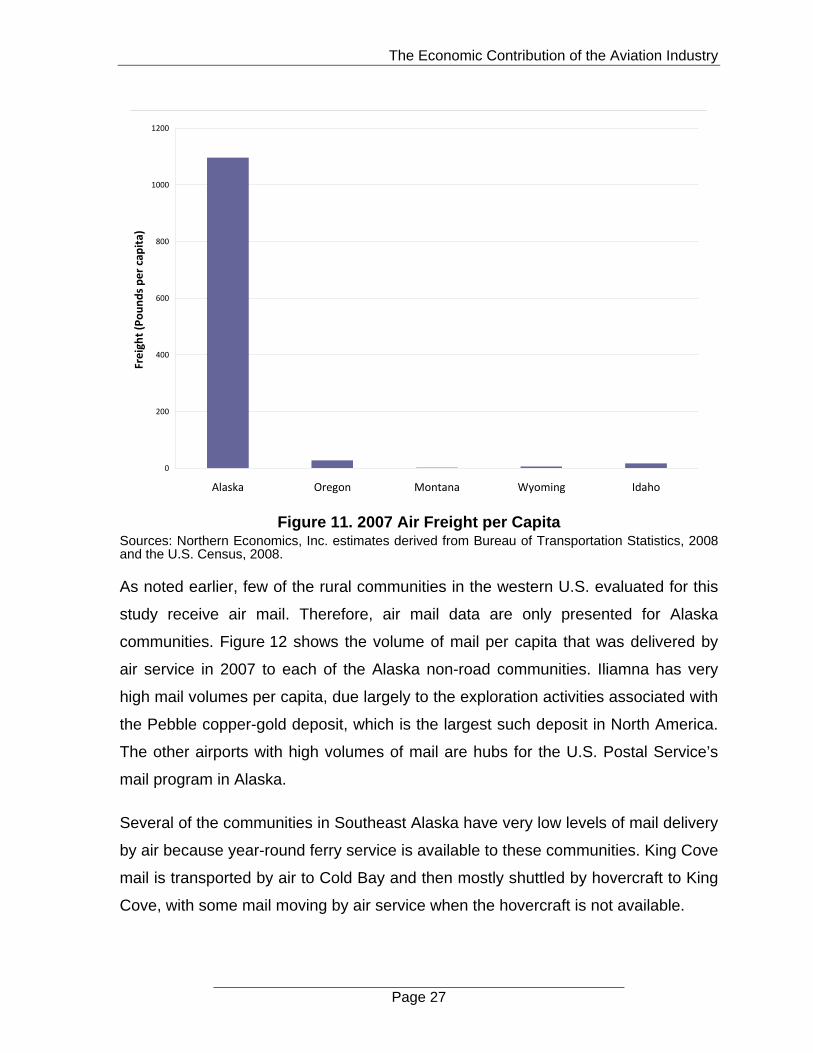
The Economic Contribution of the Aviation Industry
Page 27
0
200
400
600
800
1000
1200
Alaska Oregon Montana Wyoming Idaho
Freight (Pounds per capita)
Figure 11. 2007 Air Freight per Capita
Sources: Northern Economics, Inc. estimates derived from Bureau of Transportation Statistics, 2008 and the U.S. Census, 2008.
As noted earlier, few of the rural communities in the western U.S. evaluated for this
study receive air mail. Therefore, air mail data are only presented for Alaska
communities. Figure 12 shows the volume of mail per capita that was delivered by
air service in 2007 to each of the Alaska non-road communities. Iliamna has very
high mail volumes per capita, due largely to the exploration activities associated with
the Pebble copper-gold deposit, which is the largest such deposit in North America.
The other airports with high volumes of mail are hubs for the U.S. Postal Service’s
mail program in Alaska.
Several of the communities in Southeast Alaska have very low levels of mail delivery
by air because year-round ferry service is available to these communities. King Cove
mail is transported by air to Cold Bay and then mostly shuttled by hovercraft to King
Cove, with some mail moving by air service when the hovercraft is not available.
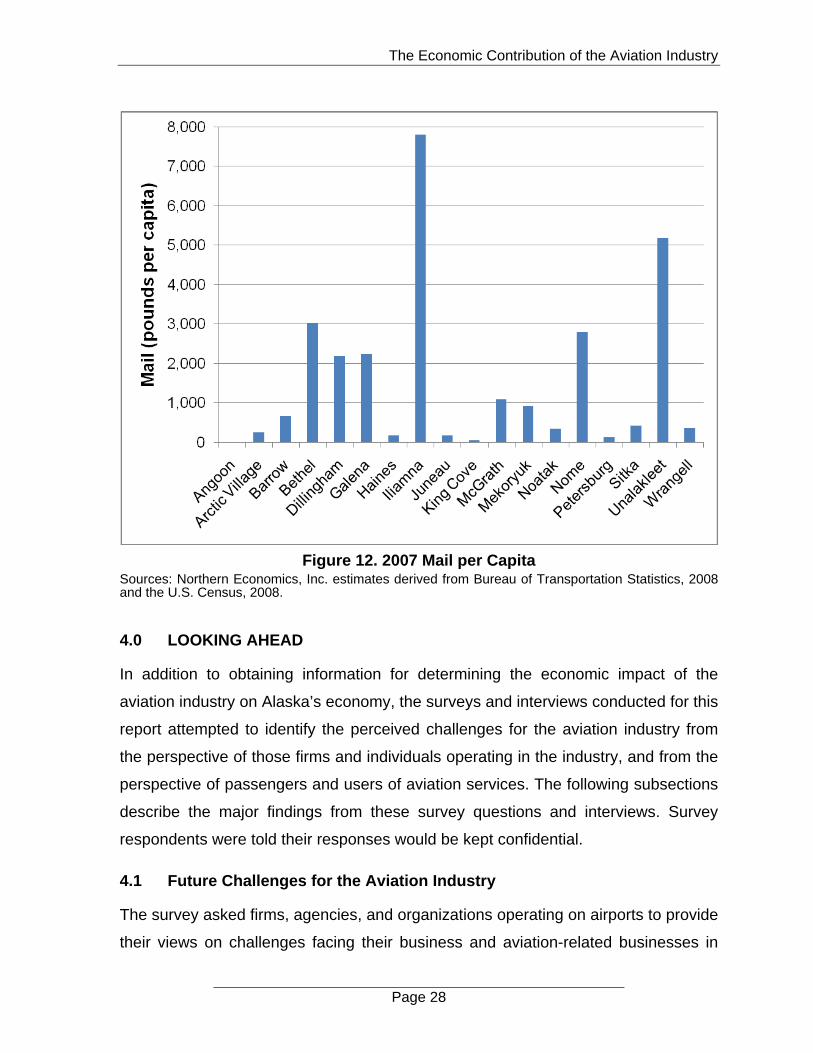
The Economic Contribution of the Aviation Industry
Page 28
Figure 12. 2007 Mail per Capita Sources: Northern Economics, Inc. estimates derived from Bureau of Transportation Statistics, 2008 and the U.S. Census, 2008.
4.0 LOOKING AHEAD
In addition to obtaining information for determining the economic impact of the
aviation industry on Alaska’s economy, the surveys and interviews conducted for this
report attempted to identify the perceived challenges for the aviation industry from
the perspective of those firms and individuals operating in the industry, and from the
perspective of passengers and users of aviation services. The following subsections
describe the major findings from these survey questions and interviews. Survey
respondents were told their responses would be kept confidential.
4.1 Future Challenges for the Aviation Industry
The survey asked firms, agencies, and organizations operating on airports to provide
their views on challenges facing their business and aviation-related businesses in
The Economic Contribution of the Aviation Industry
Page 29
Alaska in the coming years. Nearly half of the respondents (49 percent) identified
fuel and energy prices as one of the main challenges. Fuel price was the concern
most often mentioned, but was just one of several concerns for respondents.
Increasing lease rates (32 percent), government restrictions/mandates (19 percent),
finding and retaining quality labor (15 percent) and
operating costs and general economic conditions were
mentioned as challenges (both 10 percent). About a third
of the respondents mentioned increasing lease rates in
2008 as a challenge to their business. A number of these
respondents felt that Anchorage prices were being charged for smaller airport
leases.
The increasing cost of living and the current economic
situation of the nation were also mentioned as
challenges for the future. Respondents’ concern is that
this situation may decrease money spent on travel, and
increasing airfares would result in a smaller market
base of both local travelers and tourists.
Finding and retaining quality labor is seen as a
challenge by respondents. Some respondents
linked this challenge to another issue: namely,
migration out of the smaller communities to larger
metropolitan areas.
Several respondents mentioned concerns about government interventions and
policies, and other issues with municipal, state, and federal governments.
4.2 Alaska Residents’ Concerns for the Future
At the end of the passenger survey the respondents were asked about their air travel
experiences; the effect of Alaska air travel and air travel facilities on the quality of
life, and their concerns about the future for air travel in Alaska.
“…In addition, finding and retaining
quality labor is and continues to be a
concern that will likely increase if high
costs force shifts in population to
larger metropolitan areas.”
“Nationwide economic
slowdown. High price of
energy costs….leading to
increased airfare…. leading
to decreased travel.”
“Increased lease rates from
the state, increased property
taxes and restrictions on
lease usage, as well as higher
energy prices for heating,
electrical and operations.”

The Economic Contribution of the Aviation Industry
Page 30
Most respondents were satisfied with air travel and the facilities in Alaska, and many
praised newer upgrades to runways and airports. A few of the respondents were not
satisfied with air travel and the facilities in Alaska finding them unsafe and unreliable.
The respondents emphasized the importance of air travel in off-road Alaska. For
many communities it is the only means of passenger travel. These villages rely on
air travel for medical services and emergencies, family visits, work-related travel,
social and vacation trips, and transportation of supplies. Some communities do not
offer medical services, and residents need to travel for all medical visits. This is
especially common in small communities.
The greatest concern expressed by residents
is the increasing cost of air travel. Many find it
harder to travel as prices have increased
more than income. Increasing air cargo rates
also raise the cost of groceries and other
supplies while increased baggage fees can
significantly affect travelers from off-road communities who generally take advantage
of the lower prices in Alaska urban centers to stock up on food and supplies before
traveling back home where costs are higher.
Residents are greatly concerned by the increasing cost of energy, particularly in
those communities that rely upon air delivery of fuel supplies. Fuel must be flown in
to these communities at much greater cost as they are not accessible by road, ferry,
or barge. In addition, the older aircraft currently used for fuel deliveries are nearing
the end of their useful life, and newer large fuel delivery aircraft cannot operate at
airports with shorter runway lengths. Many of the smaller communities that rely on
air transport for fuel have airports with shorter runway lengths. Using smaller aircraft,
which can land at these shorter runways, for fuel deliveries increases fuel prices
above their current levels.
The recent 2008 spike in jet fuel and aviation gasoline has had an adverse impact
on both aviation users and industry in Alaska. Figure 13 shows monthly passenger
“…[costs are] getting pretty outrageous
not just from Kotzebue to Anchorage but
also to the rural villages. I think that’s our
greatest fear is cost. Thank you for doing
the survey, thank you for serving the state.
I hope we can all make a difference.”

The Economic Contribution of the Aviation Industry
Page 31
enplanements at all Alaska airports from January 2000 through November 2008,
compared to the average monthly fuel price reported by all domestic carriers. Fuel
prices for Alaska carriers were only available through September so prices for all
domestic carriers were used to have similar time periods for the both data series.
Fuel prices in Alaska experienced a similar spike with the price exceeding $4.00 in
the summer of 2008.
The enplanement data used are for the large certificated air carriers subject to the
Federal Aviation Act of 1958. As such, the enplanement data do not include a
number of smaller air carriers and operators in Alaska and thus underestimate total
enplanements in the state. However, the enplanement data are considered to be
representative of overall trends in enplanements for the state.
Summer 2008 peak enplanements throughout Alaska were slightly less than what
would have been expected in a normal year. Enplanements through November have
continued to decline and are now at levels experienced in 2003-2004. Even though
fuel prices have dropped in the last few months of 2008, they are still at historically
high levels compared to fuel prices in recent years.

The Economic Contribution of the Aviation Industry
Page 32
Figure 13. Alaska Enplanements and Fuel Prices for All Domestic Carriers January 2000 – November 2008
Sources: Northern Economics, Inc. estimates derived from Bureau of Transportation Statistics, 2008. Note: Enplanement data are for large certificated air carriers subject to the Federal Aviation Act of 1958.
ANC and FAI are the two largest airports in the state and their levels of activity make
it difficult to discern the trends at the other airports in the state when all airports are
aggregated. Figure 14 shows the enplanements at all airports in the state, excluding
ANC and FAI, with the same fuel price information as discussed above. Recent
trends at the smaller airports in the state are very similar to the trends presented
earlier with ANC and FAI included. In November 2008 enplanements dropped to
about 2004 levels and looked poised to decline further, even though fuel prices had
decreased.
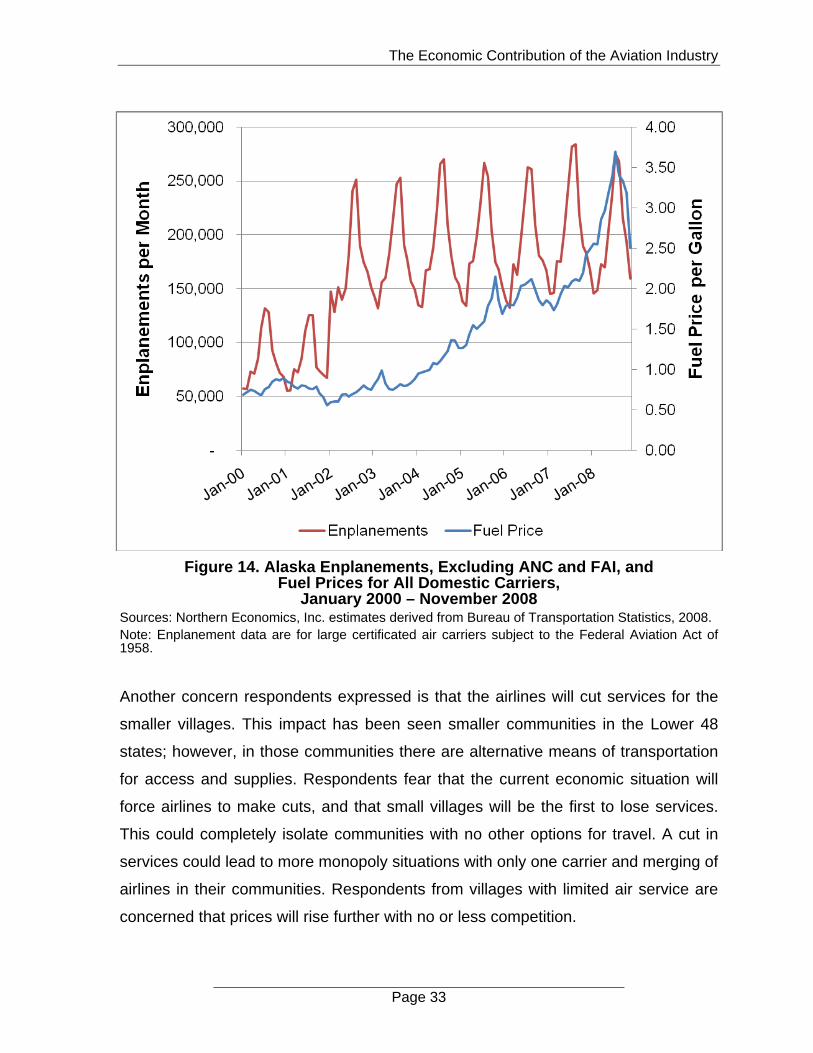
The Economic Contribution of the Aviation Industry
Page 33
Figure 14. Alaska Enplanements, Excluding ANC and FAI, and Fuel Prices for All Domestic Carriers,
January 2000 – November 2008 Sources: Northern Economics, Inc. estimates derived from Bureau of Transportation Statistics, 2008. Note: Enplanement data are for large certificated air carriers subject to the Federal Aviation Act of 1958.
Another concern respondents expressed is that the airlines will cut services for the
smaller villages. This impact has been seen smaller communities in the Lower 48
states; however, in those communities there are alternative means of transportation
for access and supplies. Respondents fear that the current economic situation will
force airlines to make cuts, and that small villages will be the first to lose services.
This could completely isolate communities with no other options for travel. A cut in
services could lead to more monopoly situations with only one carrier and merging of
airlines in their communities. Respondents from villages with limited air service are
concerned that prices will rise further with no or less competition.
The Economic Contribution of the Aviation Industry
Page 34
Several respondents mentioned that air travel is not always dependable in Alaska,
due to weather, or sometimes just bad service from carriers. Some respondents
mention that air carriers sometimes cancel without any apparent reason, and that
makes it hard to plan for connecting flights etc. At other times, bad weather can
delay or cancel parts or all of the travel.
Many respondents in the Southeast region mentioned that the ferry system is their
preferred travel method. However, recent cuts in ferry services make air travel even
more important.
Many travelers mentioned new TSA regulations as an annoyance with unreasonable
security rules, and several pointed out that in Alaska the extra safety measures are
unnecessary.
4.3 Future Travel
Survey respondents were asked how much they think they will travel by air in the
next 12 months and into the future. The respondents that answered they would
travel less by air in the future were asked if they thought they would travel more
using public transportation, more with private transportation, or travel less altogether.
Railbelt and off-road households indicated that they will travel less by air in the next
12 months (November 2008 through October 2009), with a reduction of about 5 to
10 percent in the total number of air trips. In the off-road communities about 14
percent will travel more and 18 percent will travel less, while in the Railbelt
communities almost 15 percent will travel more and 20 percent will travel less.
Table 19 shows the differences in future travel between the three ADOT&PF regions
and between the different airport type communities. A larger percentage of the
respondents in the Central region answered they would travel less, 23 percent
compared to just over 17 percent in the other regions. Only 10 percent in the Central
region said they will travel more compared to 20 percent in the Northern region and
13 percent in the Southeast region. Sixty-two percent in the Northern region and 70
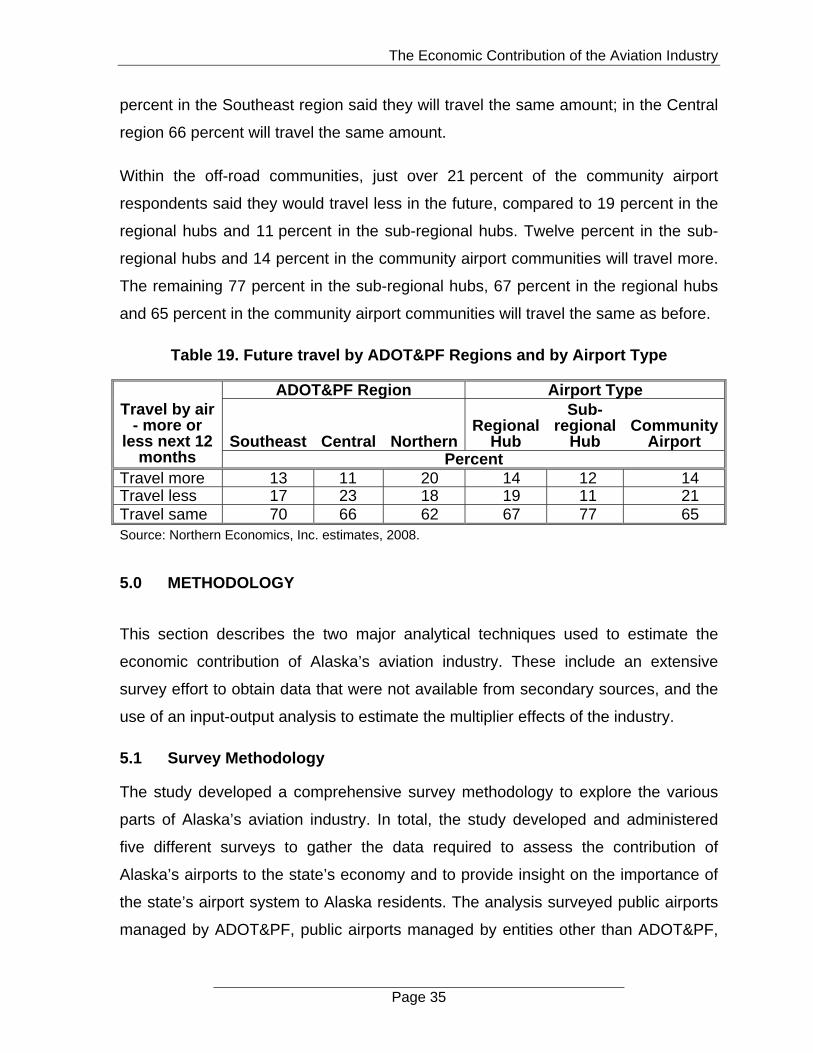
The Economic Contribution of the Aviation Industry
Page 35
percent in the Southeast region said they will travel the same amount; in the Central
region 66 percent will travel the same amount.
Within the off-road communities, just over 21 percent of the community airport
respondents said they would travel less in the future, compared to 19 percent in the
regional hubs and 11 percent in the sub-regional hubs. Twelve percent in the sub-
regional hubs and 14 percent in the community airport communities will travel more.
The remaining 77 percent in the sub-regional hubs, 67 percent in the regional hubs
and 65 percent in the community airport communities will travel the same as before.
Table 19. Future travel by ADOT&PF Regions and by Airport Type
ADOT&PF Region Airport Type
Southeast Central NorthernRegional
Hub
Sub-regional
Hub Community
Airport
Travel by air - more or
less next 12 months Percent
Travel more 13 11 20 14 12 14 Travel less 17 23 18 19 11 21 Travel same 70 66 62 67 77 65 Source: Northern Economics, Inc. estimates, 2008.
5.0 METHODOLOGY
This section describes the two major analytical techniques used to estimate the
economic contribution of Alaska’s aviation industry. These include an extensive
survey effort to obtain data that were not available from secondary sources, and the
use of an input-output analysis to estimate the multiplier effects of the industry.
5.1 Survey Methodology
The study developed a comprehensive survey methodology to explore the various
parts of Alaska’s aviation industry. In total, the study developed and administered
five different surveys to gather the data required to assess the contribution of
Alaska’s airports to the state’s economy and to provide insight on the importance of
the state’s airport system to Alaska residents. The analysis surveyed public airports
managed by ADOT&PF, public airports managed by entities other than ADOT&PF,
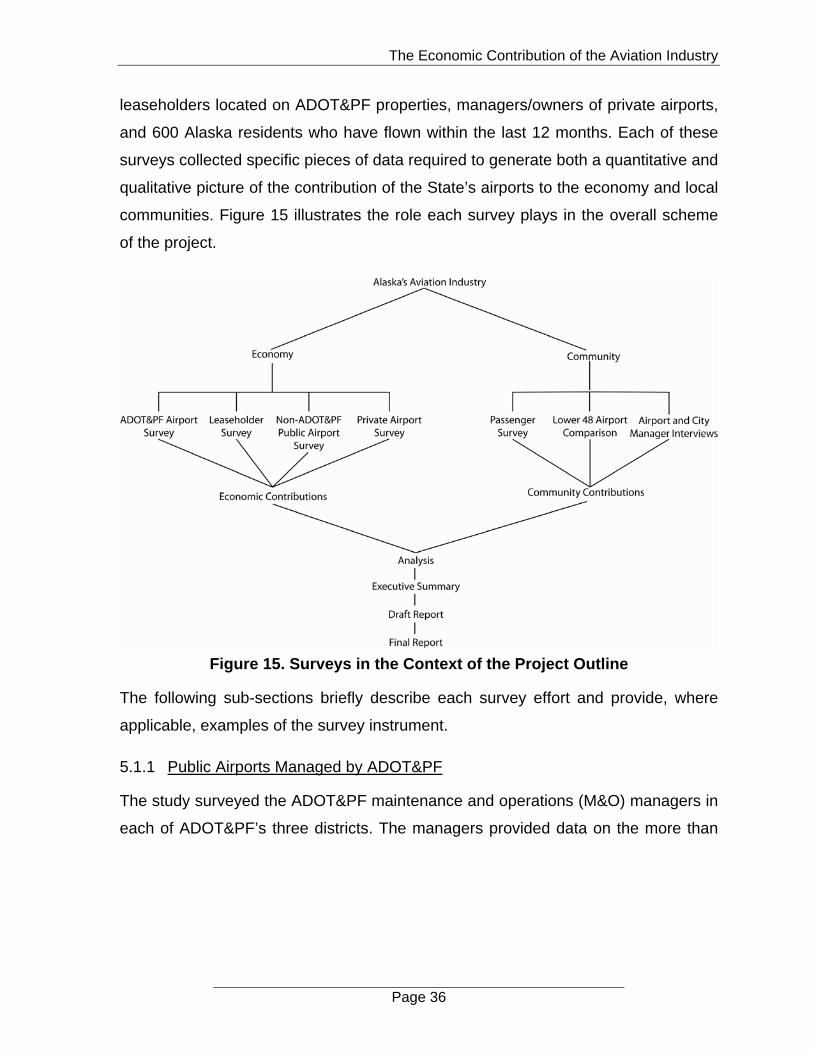
The Economic Contribution of the Aviation Industry
Page 36
leaseholders located on ADOT&PF properties, managers/owners of private airports,
and 600 Alaska residents who have flown within the last 12 months. Each of these
surveys collected specific pieces of data required to generate both a quantitative and
qualitative picture of the contribution of the State’s airports to the economy and local
communities. Figure 15 illustrates the role each survey plays in the overall scheme
of the project.
Figure 15. Surveys in the Context of the Project Outline
The following sub-sections briefly describe each survey effort and provide, where
applicable, examples of the survey instrument.
5.1.1 Public Airports Managed by ADOT&PF
The study surveyed the ADOT&PF maintenance and operations (M&O) managers in
each of ADOT&PF’s three districts. The managers provided data on the more than

The Economic Contribution of the Aviation Industry
Page 37
250 airports around the state that ADOT&PF manages.9 For each airport, the survey
asked managers about:
The number of full-time and part-time positions filled in an average month in
2007
The total amount spent on maintenance and operations in FY 2007
The percentage of maintenance and operations expenditures that were spent
in-state
The total amount spent on capital expenditures in FY 2007
5.1.2 Public Airports Managed by Entities Other than ADOT&PF
Using data from the Federal Aviation Administration, the study team identified nearly
140 public airports in the state that are operated by entities other than ADOT&PF.
The non-ADOT&PF public airports range from dirt or field strips on public lands to
large municipally-owned airports such as the Kenai Municipal Airport, Merrill Field, or
Juneau International Airport. The study team called every airport manager or owner
for whom we could find contact information and successfully interviewed 73 percent
of the managers and owners targeted by the survey. The survey instrument asked
each manager the same four questions that were asked of the ADOT&PF M&O
managers about:
The number of full-time and part-time positions filled in an average month in
2007
The total amount spent on maintenance and operations in FY 2007
The percentage of maintenance and operations expenditures that were spent
in-state
The total amount spent on capital expenditures in FY 2007
9 We also sent the same survey to Fairbanks International Airport as part of the International Airport
System. FAI’s data are included with the airports managed by ADOT&PF.

The Economic Contribution of the Aviation Industry
Page 38
In addition, the survey asked each manager to estimate the total number of
businesses operating on airport property and to estimate the number of businesses
by business type. The instrument matched the business type categories to the
categories established for the ADOT&PF Business/Leaseholder Survey.
5.1.3 ADOT&PF Business/Leaseholder Survey
The study conducted a mail/internet survey of ADOT&PF leaseholders. The team
acquired ADOT&PF’s leaseholder database from ADOT&PF. The team then
removed all of the leases at Ted Stevens Anchorage International Airport (AIA) as
the University of Alaska-Anchorage’s Institute of Social and Economic Research
(ISER) estimates the economic contribution of AIA on a yearly basis. From within the
remaining leases, the study identified approximately 760 unique leaseholders or
leaseholder contacts. We received a raw response rate of 105 responses. This
amount equals a raw response rate of 13.8 percent while the functionally complete
response rate was 10.2 percent. These response rates are at or above the normal
response rates expected for a mail survey conducted without an incentive. The
survey generated enough responses from the population to perform the analysis.
However, the study team augmented and checked the survey results against
publicly available information to validate the accuracy of the data we collected. For
example, salary data were corroborated by comparing the respondents’ NAICS
codes against the BLS average salary data for companies in that same category in
Alaska.
Each leaseholder received a letter and a follow-up postcard asking them to
participate in an internet based survey. The survey asked the leaseholders to:
Identify their business type within a pre-identified group of categories
Estimate the number of full-time and part-time positions held in an average
month in 2007 by direct and contract employees
Estimate the amount spent on direct and contract employee salaries in 2007
Estimate their capital and operating expenditures, including the in-state
portion, in 2007

The Economic Contribution of the Aviation Industry
Page 39
In addition, the survey asked respondents an open-ended question about the
challenges they felt that their business and aviation-related business in general
currently faced and would face in the future. The analysis uses the data from this
particular survey to directly estimate the employment at state-owned and operated
airports as well as to provide a vehicle for scaling up the business estimates from
the private and non-ADOT&PF airport surveys into estimates of employment and
payroll benefits.
5.1.4 Private Airports
The study team administered a survey instrument to owners and managers of
Alaska’s private airports. The team used the same survey instrument and
administration methodology as was used for the survey of non-ADOT&PF public
airports (see Appendix B). The study team identified more than 300 private airports
in the state that are recognized by the FAA. The team found contact information for
194 airports and successfully interviewed 119 airport managers and owners. This
number is equivalent to 61 percent of the owners with valid telephone contact
information.
5.1.5 Alaska Resident Passenger Survey
The study conducted a phone survey of 600 Alaska residents about their travel
patterns in the last 12 months. The sample frame included 500 residents in 18
communities. The 18 communities were divided evenly between the three
ADOT&PF regions (Northern, Central, and Southeast) as well as dividing between
regional hub communities, sub-regional hub communities, and community airport
communities (Table 20).
Table 20. Selected Off-Road System Communities
ADOT&PF Region Airport Size Southeast Central Northern Regional Hub Juneau, Sitka Bethel, Dillingham Nome, Barrow Sub-Regional Wrangell, Petersburg McGrath, Iliamna Unalakleet, Galena Community Haines, Angoon King Cove, Mekoryuk Noatak, Arctic Village Source: Northern Economics, Inc. 2008.
The Economic Contribution of the Aviation Industry
Page 40
The sample frame also included 100 residents from the Railbelt communities
stretching from Fairbanks to the Kenai Peninsula Borough. This extra sample was
provided to allow a contrast between off-road and road-connected aviation system
users. The resident passenger survey collected quantitative information on the
number and type of trips and allowed residents to provide verbal comments on what
the aviation system means to them and their communities. The comments were
captured using a voice-mail system and are recorded on CD. See Section 3.0 for the
summarized results of this survey. Appendix C contains the Passenger Opinion
Survey Instrument.
5.2 Input-Output Analysis
The economic impacts of the aviation industry to the state economy were quantified
using input-output (I-O) analysis. I-O analysis is an economic tool used to measure
the effects or impacts of an economic activity and is typically used to evaluate the
benefits of a project, an entity, or an industry to the local, regional, and state
economy. The analysis is based on a model of the inter-industry transactions within
a community, a region, or a state. The I-O model is a matrix that tracks the dollar
flow between the industries within a specified economic region of interest. The
model can measure how many times a dollar is re-spent in, or “ripples“ through, a
community (or a larger economic region) before it leaks out.
The I-O model yields multipliers that are used to calculate the indirect and induced
effects on jobs, income, and business sales/output generated per dollar of spending
on various types of goods and services in the study area. To evaluate the economic
effects to the state or a particular region, only the “local” (i.e., within the state or
within the region) expenditures are used in the model; the rest are considered
leakages. More leakages mean smaller multipliers; and the larger the local
expenditures, the greater the multiplier effects. The multipliers for any given industry
in any given location are unique, based on industry composition and geographic
area.

The Economic Contribution of the Aviation Industry
Page 41
IMPLAN software was used to develop the I-O model for the Alaska economy.
IMPLAN is a widely used software package used for economic impact assessments,
and Northern Economics has used the software for a decade in Alaska. IMPLAN
uses specific data on what inputs are needed to produce the goods or services for
over 500 industries. IMPLAN also has borough-specific data on what industries are
available locally from which to purchase those inputs. The most recent IMPLAN data
(2007 data) on multipliers for all the economic sectors in the Alaska I-O model were
applied. Figure 1 illustrates conceptually how the total economic impacts or benefits
are determined.
Figure 16. Framework in Evaluating the Total Economic Effects of
Local Spending
The aviation industry, as defined in this statewide study, includes all the businesses
and organizations located at public and private airports in Alaska. These entities,
which include the airlines, airport concessions, air freight companies, airline support
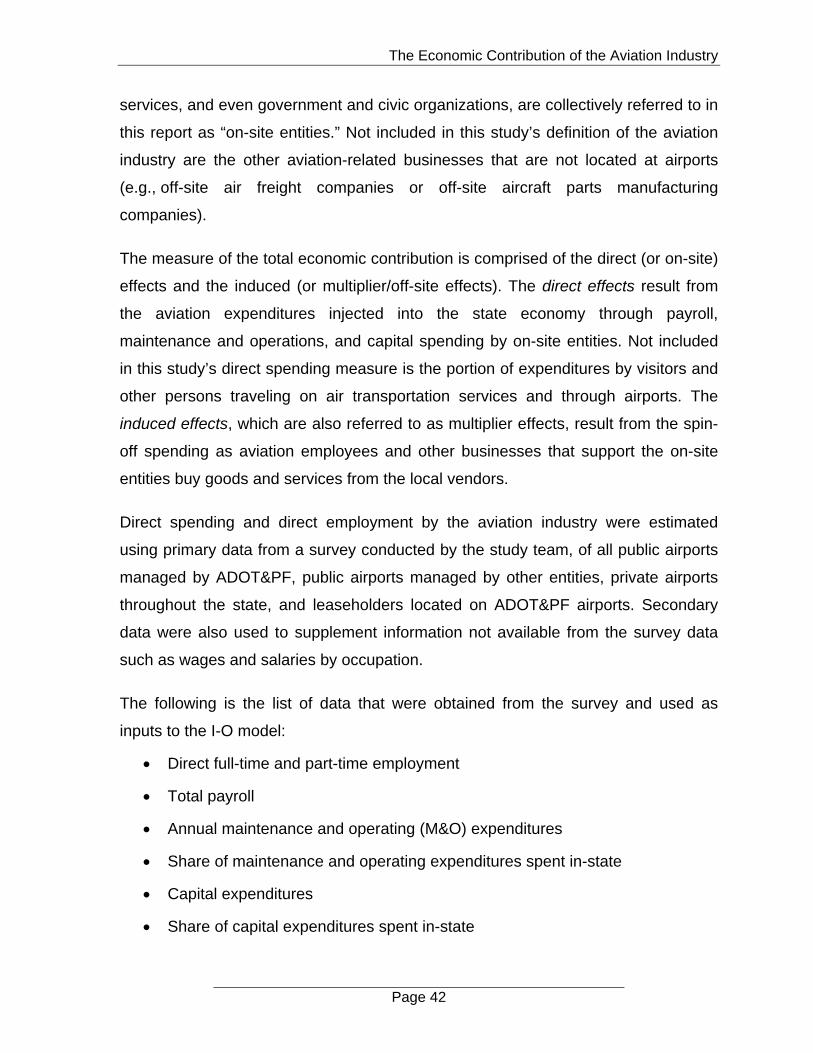
The Economic Contribution of the Aviation Industry
Page 42
services, and even government and civic organizations, are collectively referred to in
this report as “on-site entities.” Not included in this study’s definition of the aviation
industry are the other aviation-related businesses that are not located at airports
(e.g., off-site air freight companies or off-site aircraft parts manufacturing
companies).
The measure of the total economic contribution is comprised of the direct (or on-site)
effects and the induced (or multiplier/off-site effects). The direct effects result from
the aviation expenditures injected into the state economy through payroll,
maintenance and operations, and capital spending by on-site entities. Not included
in this study’s direct spending measure is the portion of expenditures by visitors and
other persons traveling on air transportation services and through airports. The
induced effects, which are also referred to as multiplier effects, result from the spin-
off spending as aviation employees and other businesses that support the on-site
entities buy goods and services from the local vendors.
Direct spending and direct employment by the aviation industry were estimated
using primary data from a survey conducted by the study team, of all public airports
managed by ADOT&PF, public airports managed by other entities, private airports
throughout the state, and leaseholders located on ADOT&PF airports. Secondary
data were also used to supplement information not available from the survey data
such as wages and salaries by occupation.
The following is the list of data that were obtained from the survey and used as
inputs to the I-O model:
Direct full-time and part-time employment
Total payroll
Annual maintenance and operating (M&O) expenditures
Share of maintenance and operating expenditures spent in-state
Capital expenditures
Share of capital expenditures spent in-state

The Economic Contribution of the Aviation Industry
Page 43
Since a study of the economic impacts of the Anchorage International Airport is done
every year and was already available, the survey effort did not include the
Anchorage airport. The results of the latest study entitled, Ted Stevens Anchorage
International Airport: Economic Significance 2007, conducted by the Institute of
Social and Economic Research (ISER), were adopted in this statewide study.
The operating expenditures for ANC were obtained from the operating and financial
summary information (Form 127) submitted to the Federal Aviation Administration as
part of the Airport Financial Reporting Program; available at
http://cats.airports.faa.gov/reports/reports.cfm.

The Economic Contribution of the Aviation Industry
Page 44
6.0 REFERENCES
Alaska Department of Labor and Workforce Development, 2008. 2007 Wages and
Employment for Air Transportation Sector. Excel spreadsheets e-mailed by
Debra Berggren of ADOL&WD to Rich Sewell of ADOT&PF on December 23,
2008.
Bureau of Economic Analysis, Gross Domestic Product for Alaska, 2007. Available
at http://www.bea.gov/regional/gsp/action.cfm.
Federal Aviation Administration, Air Traffic Organization, 2008. The Economic
Impact of Civil Aviation on the U.S. Economy.
Federal Aviation Administration. Compliance Activity Tracking System (CATS) Form
127. A database of operating and financial summary reports filed by
commercial airports. Available at http://cats.airports.faa.gov/
Institute of Social and Economic Research (ISER), 2007. Ted Stevens Anchorage
International Airport: Economic Significance, 2007. A report prepared for the
Ted Stevens Anchorage International Airport.
Minnesota IMPLAN Group, Inc., IMPLAN System (data and software), 1725 Tower
Drive West, Suite 140, Stillwater, MN 55082 www.implan.com.
Population Division, U.S. Census Bureau. “Table 4: Annual Estimates of the
Population for Incorporated Places in Alaska, Listed Alphabetically: April 1,
2000 to July 1, 2007 (SUB-EST2007-04-02).” Available at
http://www.census.gov/popest/cities/SUB-EST2007-4.html. December 1,
2008.
Population Division, U.S. Census Bureau. “Table 4: Annual Estimates of the
Population for Incorporated Places in Idaho, Listed Alphabetically: April 1,
2000 to July 1, 2007 (SUB-EST2007-04-16).” Available at
The Economic Contribution of the Aviation Industry
Page 45
http://www.census.gov/popest/cities/SUB-EST2007-4.html. December 1,
2008.
Population Division, U.S. Census Bureau. “Table 4: Annual Estimates of the
Population for Incorporated Places in Montana, Listed Alphabetically: April 1,
2000 to July 1, 2007 (SUB-EST2007-04-30).” Available at
http://www.census.gov/popest/cities/SUB-EST2007-4.html. December 1,
2008.
Population Division, U.S. Census Bureau. “Table 4: Annual Estimates of the
Population for Incorporated Places in Oregon, Listed Alphabetically: April 1,
2000 to July 1, 2007 (SUB-EST2007-04-41).” Available at
http://www.census.gov/popest/cities/SUB-EST2007-4.html. December 1,
2008.
Population Division, U.S. Census Bureau. “Table 4: Annual Estimates of the
Population for Incorporated Places in Wyoming, Listed Alphabetically: April 1,
2000 to July 1, 2007 (SUB-EST2007-04-56).” Available at
http://www.census.gov/popest/cities/SUB-EST2007-4.html. December 1,
2008.

The Economic Contribution of the Aviation Industry
Page 46
APPENDICES

The Economic Contribution of the Aviation Industry
Page 47
APPENDIX A:
ADOT&PF Leaseholder Survey Instrument
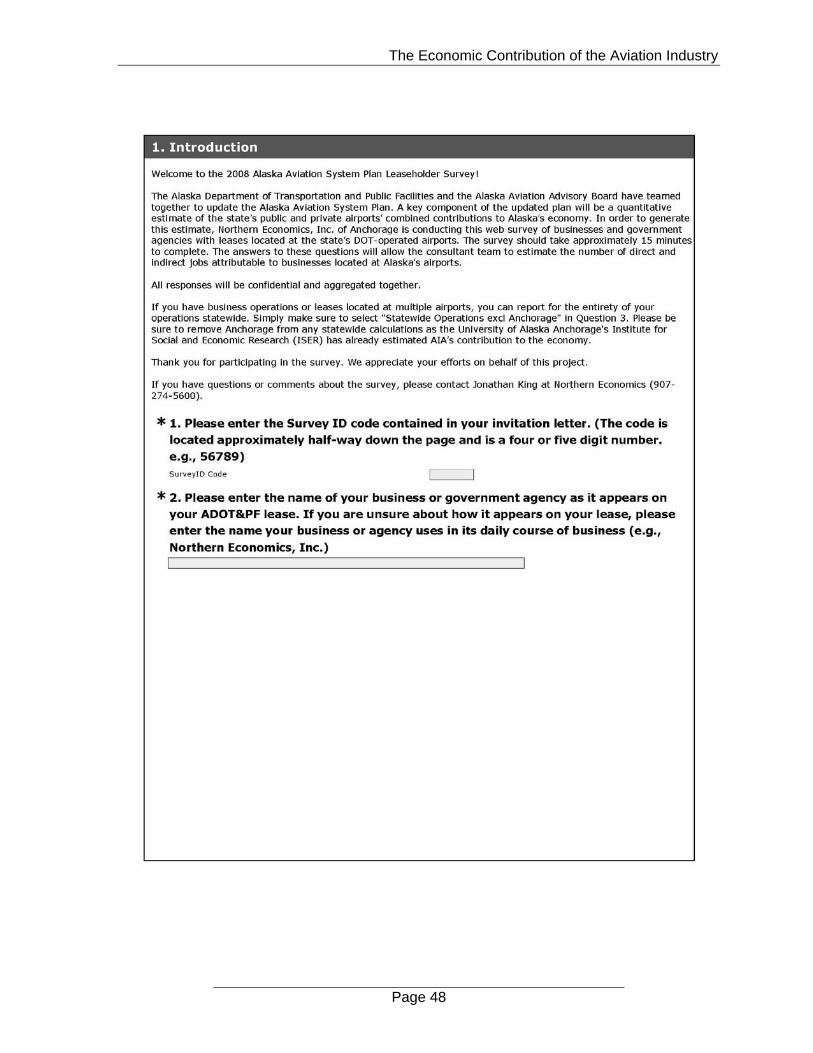
The Economic Contribution of the Aviation Industry
Page 48
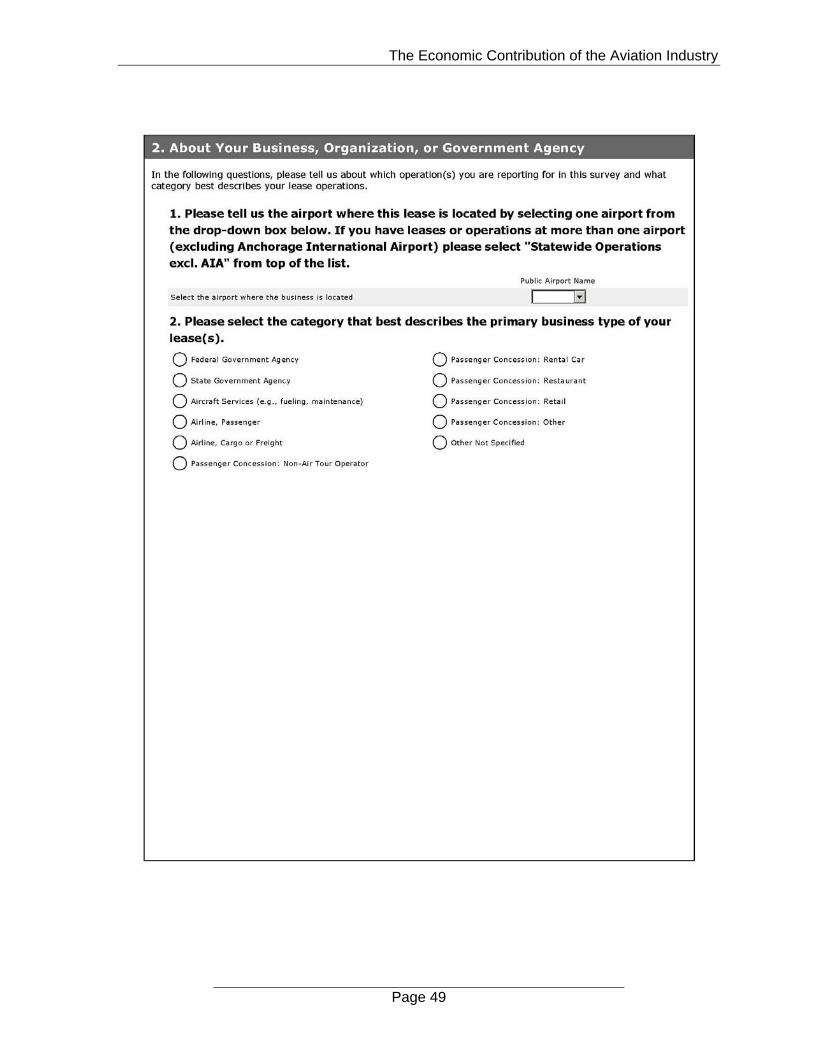
The Economic Contribution of the Aviation Industry
Page 49
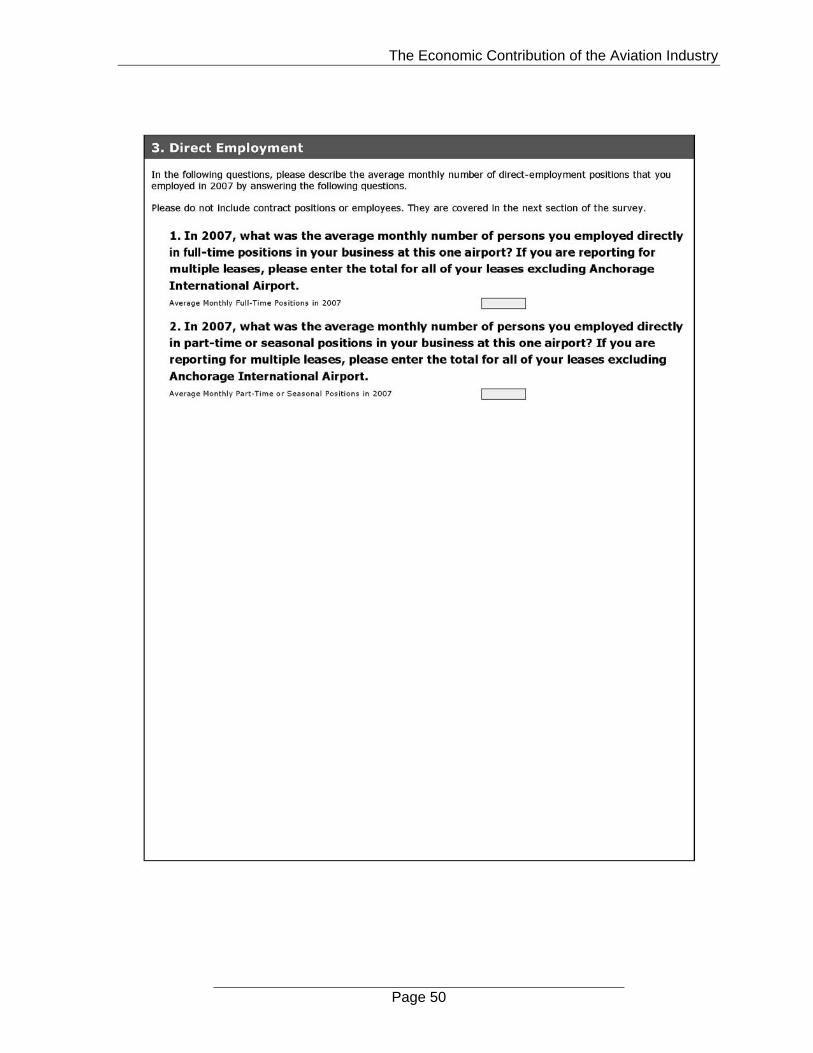
The Economic Contribution of the Aviation Industry
Page 50
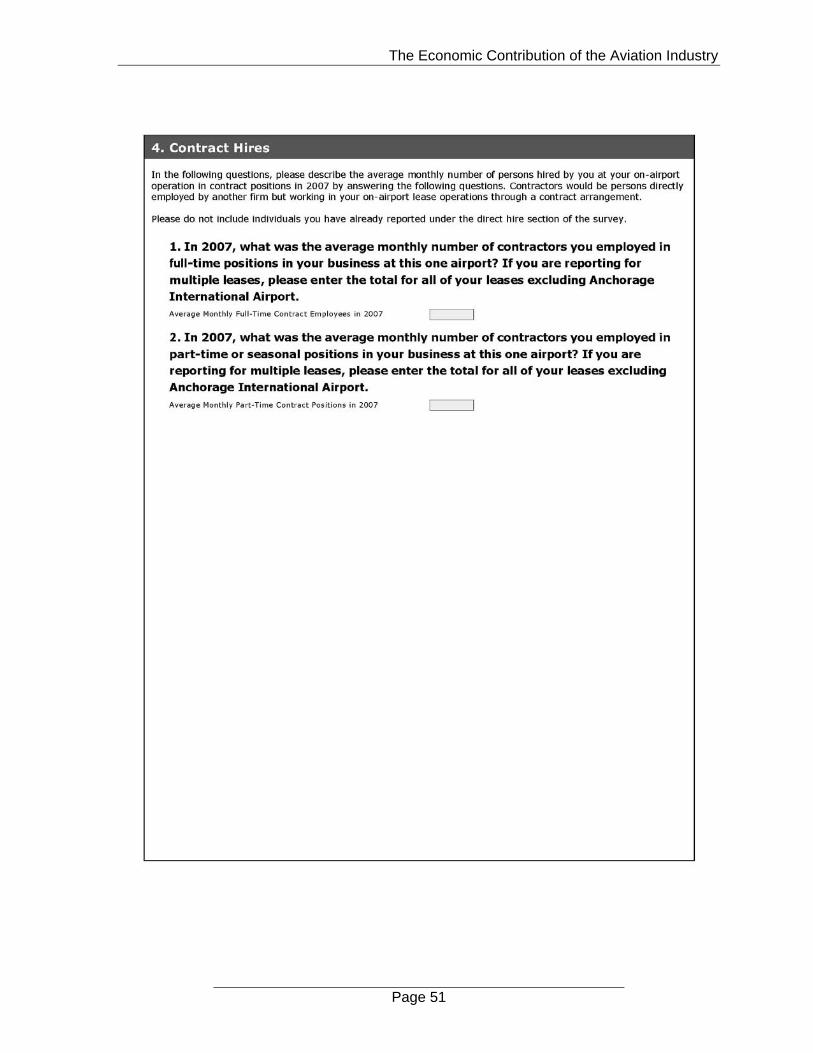
The Economic Contribution of the Aviation Industry
Page 51
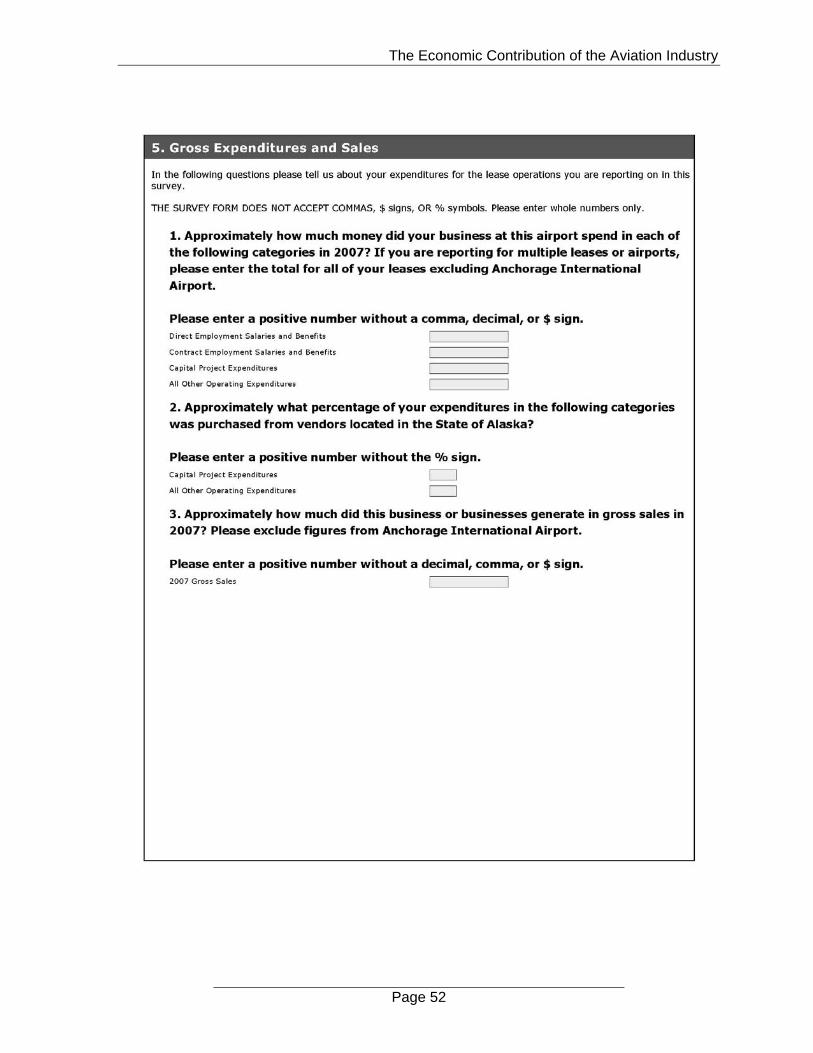
The Economic Contribution of the Aviation Industry
Page 52

The Economic Contribution of the Aviation Industry
Page 53

The Economic Contribution of the Aviation Industry
Page 54

The Economic Contribution of the Aviation Industry
Page 55
APPENDIX B:
Private/Non-ADOT&PF Public Airport Survey
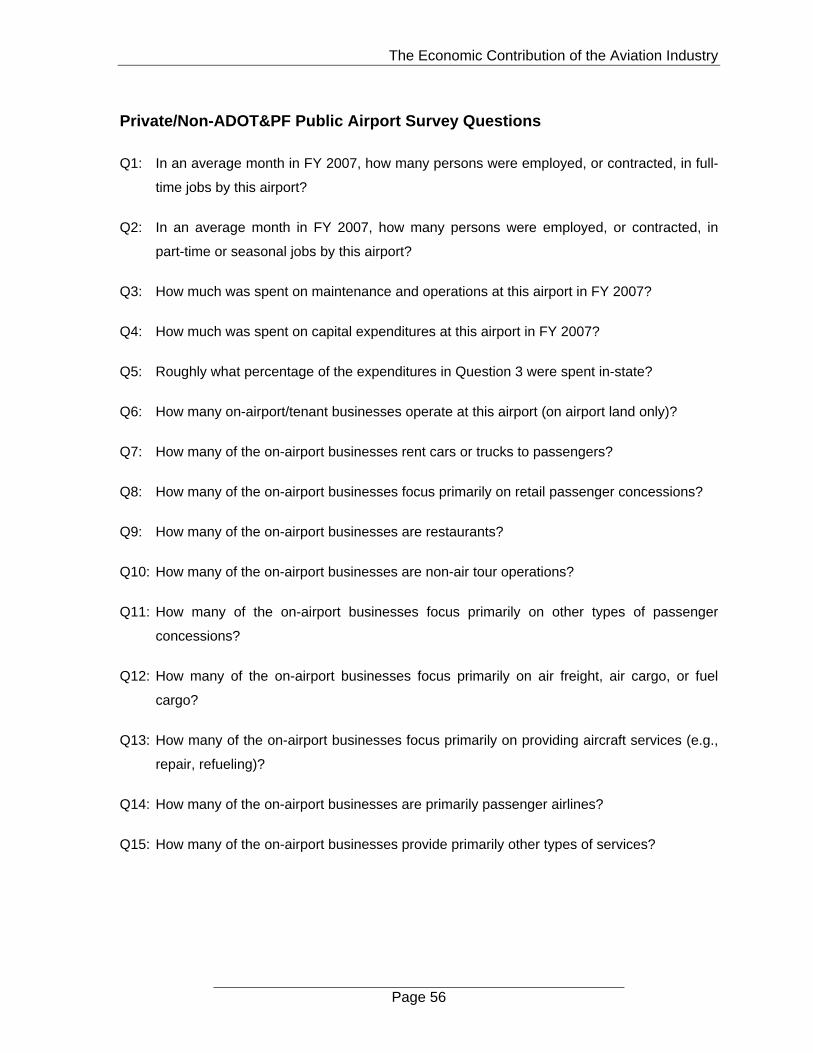
The Economic Contribution of the Aviation Industry
Page 56
Private/Non-ADOT&PF Public Airport Survey Questions
Q1: In an average month in FY 2007, how many persons were employed, or contracted, in full-
time jobs by this airport?
Q2: In an average month in FY 2007, how many persons were employed, or contracted, in
part-time or seasonal jobs by this airport?
Q3: How much was spent on maintenance and operations at this airport in FY 2007?
Q4: How much was spent on capital expenditures at this airport in FY 2007?
Q5: Roughly what percentage of the expenditures in Question 3 were spent in-state?
Q6: How many on-airport/tenant businesses operate at this airport (on airport land only)?
Q7: How many of the on-airport businesses rent cars or trucks to passengers?
Q8: How many of the on-airport businesses focus primarily on retail passenger concessions?
Q9: How many of the on-airport businesses are restaurants?
Q10: How many of the on-airport businesses are non-air tour operations?
Q11: How many of the on-airport businesses focus primarily on other types of passenger
concessions?
Q12: How many of the on-airport businesses focus primarily on air freight, air cargo, or fuel
cargo?
Q13: How many of the on-airport businesses focus primarily on providing aircraft services (e.g.,
repair, refueling)?
Q14: How many of the on-airport businesses are primarily passenger airlines?
Q15: How many of the on-airport businesses provide primarily other types of services?

The Economic Contribution of the Aviation Industry
Page 57
APPENDIX C:
Passenger Opinion Survey
The Economic Contribution of the Aviation Industry
Page 58
The Economic Contribution of the Aviation Industry
Page 59
The Economic Contribution of the Aviation Industry
Page 60

The Economic Contribution of the Aviation Industry
Page 61
Appendix D Brochure

Alaska Aviation System Plan Alaska Aviation System Plan
Rural survey respondents emphasized the importance of air travel in rural Alaska. For many communities, especially in Alaska’s West and Interior, air travel is the only means to get in and out of the communities; there are no roads or ferry service. These villages rely on air travel for emergencies, family visits, work-related travel, social and vacation trips, and transportation of supplies. Some communities do not offer medical services and residents need to travel for all medical visits. This situation is especially common in small communities and the survey data indicate that community airport respondents made more than twice as many family or personal business related and medical trips than those in larger communities.
Some rural communities in Western and Interior Alaska would be completely isolated in the winter without their rural airports. In parts of Central and Southeast Alaska, ferry or road transportation may be alternatives, but communities still rely heavily on their airports for swift and reliable travel and cargo transport.
By contrast, rural communities in the Lower 48 more often commented that their community would be less attractive for people visiting or doing business but that they could likely live without an airport.
Alaska Aviation System Plan
IntroductionAs an economic engine for the State of Alaska, Alaska’s
aviation industry contributes $3.5 billion dollars and over 47,000 jobs to the state’s economy. Aviation is a critical component of the state’s economy and the vitality of Alaska’s communities. The Alaska Department of Transportation & Public Facilities (ADOT&PF), Aviation Division recently embarked on updating the Alaska Aviation System Plan. An important part of that update is determining the value and contribution of Alaska’s aviation industry to the state’s economy. This determination was accomplished through an extensive survey effort targeting all public airports managed by ADOT&PF, public airports managed by other entities, private airports throughout the state, leaseholders located on ADOT&PF airports, and 600 residents in rural Alaska and the Railbelt who have flown within the last 12 months. The study included interviews with airport managers, city officials and other community leaders in 18 selected communities in Alaska, and four western states to evaluate the importance of airports to remote, rural communities.
Contributions to Alaska’s State EconomyAirports and aviation-related businesses create significant
economic value within the State of Alaska. In fiscal year (FY) 2007, the Alaska aviation industry contributed $3.5 billion to the state economy and supported over 47,000 jobs statewide. The aviation industry contributed about 8 percent of Alaska’s gross state product of $44 billion in 2007 and supported almost 10 percent of 2007 statewide annual average employment. If compared to the primary economic sectors the aviation industry would be the fifth largest employer in Alaska.
Economic Activity
The aviation industry contributes to Alaska’s economy by supporting local businesses and employing citizens in year round operations. The value of the economic activity generated by the operation of the airports, the businesses, and agencies operating within the airport premises in FY2007 amounted to more than $2.1 billion.
This direct spending by airports, businesses located on the airports and their employees in turn creates additional employment and income in other sectors of the economy. The economic contribution of the aviation industry through those secondary (multiplier) expenditures is estimated to be $1.4 billion in FY2007 resulting in a total of $3.5 billion in economic activity. (See Figure 1)
This Alaska Aviation System Plan was conducted in accordance with FAA Advisory Circular 150/5070-7: The Airport System Planning Process. The economic analysis described in this brochure was conducted pursuant to Section 101.a(3) of that document.
This report was prepared by Northern Economics, Inc. For more information please call ADOT&PF Aviation Division at (907) 267-0730. www.dot.state.ak.us
The Economic Contribution of theAviation Industry to Alaska’s Economy
Air
Frei
ght (
Poun
ds p
er C
apita
)
Figure 5 Air Freight per Capita for Selected Community Airports, 2007Sources: Bureau of Transportation Statistics, 2008. U.S. Census Bureau, 2008.
16
14
12
10
8
6
4
2
Figure 4 Comparison of Enplanements per 1,000Persons for Selected Community Airports, 2007Sources: Bureau of Transportation Statistics, 2008. U.S. Census Bureau, 2008.
8 times more enplanements per capita
39 times more freight per capita
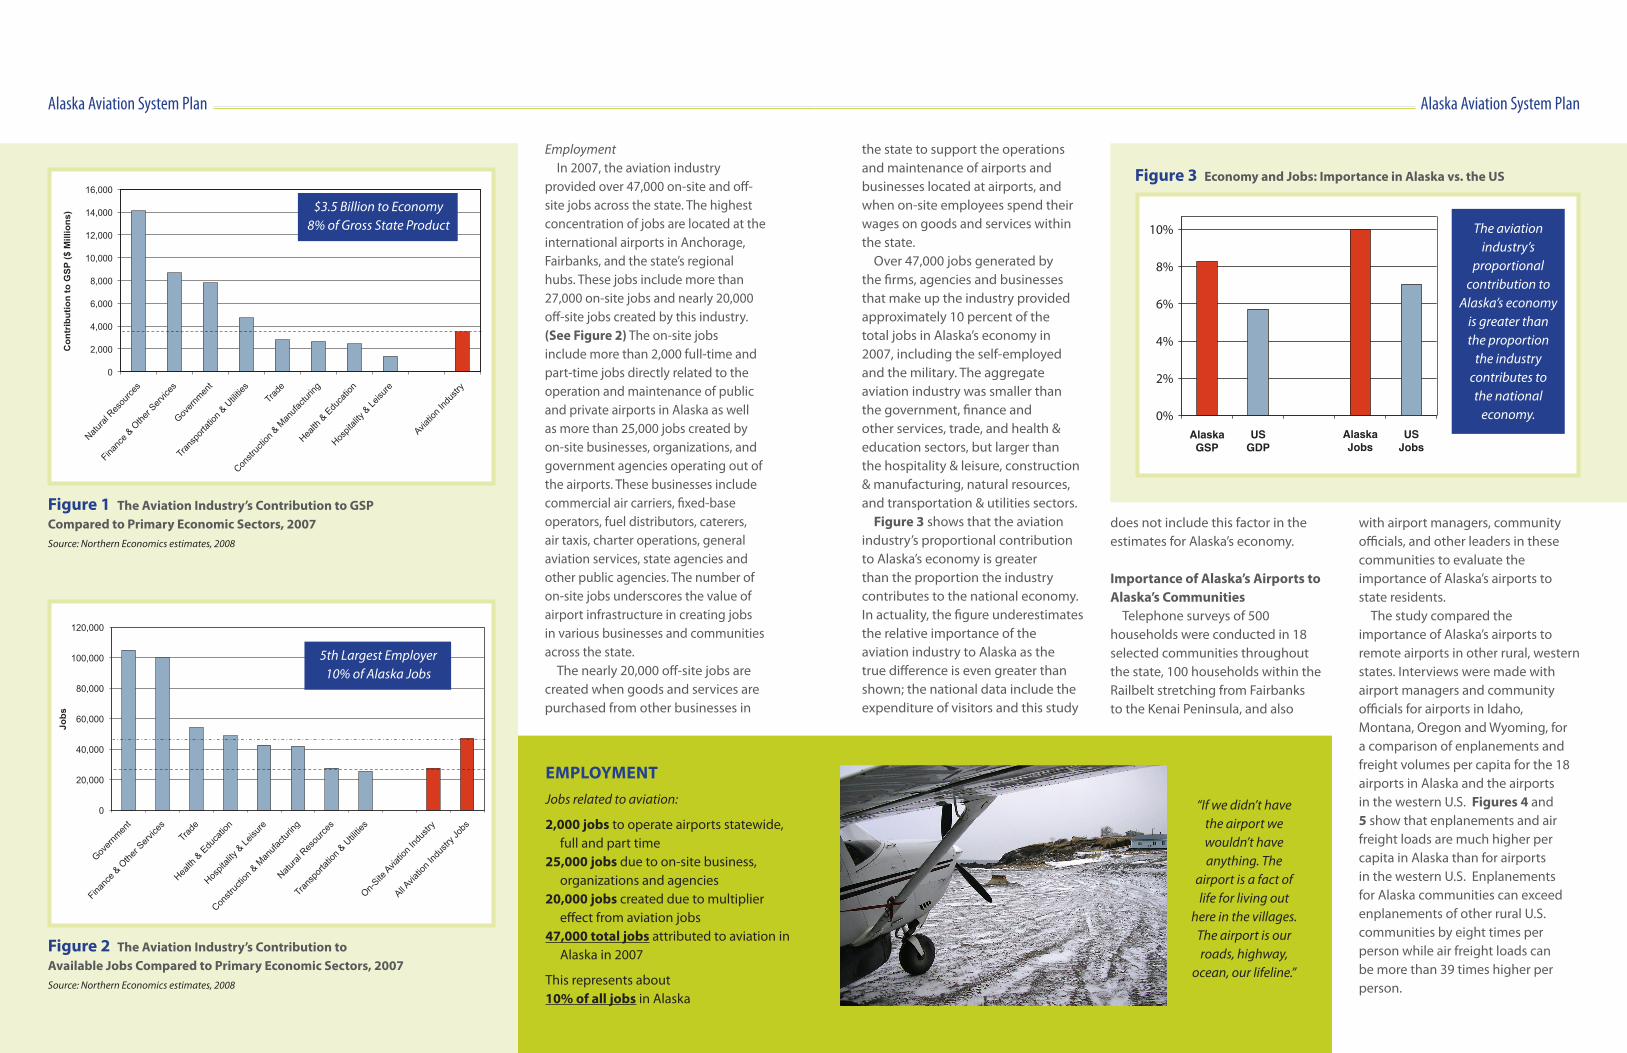
Alaska Aviation System Plan Alaska Aviation System Plan
the state to support the operations and maintenance of airports and businesses located at airports, and when on-site employees spend their wages on goods and services within the state.
Over 47,000 jobs generated by the firms, agencies and businesses that make up the industry provided approximately 10 percent of the total jobs in Alaska’s economy in 2007, including the self-employed and the military. The aggregate aviation industry was smaller than the government, finance and other services, trade, and health & education sectors, but larger than the hospitality & leisure, construction & manufacturing, natural resources, and transportation & utilities sectors.
Figure 3 shows that the aviation industry’s proportional contribution to Alaska’s economy is greater than the proportion the industry contributes to the national economy. In actuality, the figure underestimates the relative importance of the aviation industry to Alaska as the true difference is even greater than shown; the national data include the expenditure of visitors and this study
does not include this factor in the estimates for Alaska’s economy.
Importance of Alaska’s Airports to Alaska’s Communities
Telephone surveys of 500 households were conducted in 18 selected communities throughout the state, 100 households within the Railbelt stretching from Fairbanks to the Kenai Peninsula, and also
with airport managers, community officials, and other leaders in these communities to evaluate the importance of Alaska’s airports to state residents.
The study compared the importance of Alaska’s airports to remote airports in other rural, western states. Interviews were made with airport managers and community officials for airports in Idaho, Montana, Oregon and Wyoming, for a comparison of enplanements and freight volumes per capita for the 18 airports in Alaska and the airports in the western U.S. Figures 4 and 5 show that enplanements and air freight loads are much higher per capita in Alaska than for airports in the western U.S. Enplanements for Alaska communities can exceed enplanements of other rural U.S. communities by eight times per person while air freight loads can be more than 39 times higher per person.
EmploymentIn 2007, the aviation industry
provided over 47,000 on-site and off-site jobs across the state. The highest concentration of jobs are located at the international airports in Anchorage, Fairbanks, and the state’s regional hubs. These jobs include more than 27,000 on-site jobs and nearly 20,000 off-site jobs created by this industry. (See Figure 2) The on-site jobs include more than 2,000 full-time and part-time jobs directly related to the operation and maintenance of public and private airports in Alaska as well as more than 25,000 jobs created by on-site businesses, organizations, and government agencies operating out of the airports. These businesses include commercial air carriers, fixed-base operators, fuel distributors, caterers, air taxis, charter operations, general aviation services, state agencies and other public agencies. The number of on-site jobs underscores the value of airport infrastructure in creating jobs in various businesses and communities across the state.
The nearly 20,000 off-site jobs are created when goods and services are purchased from other businesses in
“If we didn’t have the airport we wouldn’t have anything. The
airport is a fact of life for living out
here in the villages. The airport is our roads, highway,
ocean, our lifeline.”
5th Largest Employer10% of Alaska Jobs
EMPLOYMENTJobs related to aviation:
2,000 jobs to operate airports statewide, full and part time
25,000 jobs due to on-site business, organizations and agencies
20,000 jobs created due to multiplier effect from aviation jobs
47,000 total jobs attributed to aviation in Alaska in 2007
This represents about 10% of all jobs in Alaska
Figure 2 The Aviation Industry’s Contribution toAvailable Jobs Compared to Primary Economic Sectors, 2007Source: Northern Economics estimates, 2008
$3.5 Billion to Economy8% of Gross State Product
Figure 1 The Aviation Industry’s Contribution to GSPCompared to Primary Economic Sectors, 2007Source: Northern Economics estimates, 2008
10%
8%
6%
4%
2%
0%AlaskaGSP
USGDP
AlaskaJobs
USJobs
The aviation industry’s
proportional contribution to
Alaska’s economy is greater than the proportion
the industry contributes to the national
economy.
Figure 3 Economy and Jobs: Importance in Alaska vs. the US