economic benefits of the tennessee valley authority’s ... content/environment... · economic...
TRANSCRIPT

Economic Benefits of the Tennessee Valley Authority’s Natural Resource Plan January 10, 2011 Prepared For Tennessee Valley Authority


Economic Benefits of the Tennessee Valley Authority’s Natural Resource Plan
January 2011
Prepared for Tennessee Valley Authority 400 W. Summit Hill Dr. Knoxville, TN 37902-1499 Tel 865 632 2101 Prepared by Cardno ENTRIX 3141 John Humphries Wynd, Suite 265 Raleigh, NC 27612 Tel 919 239 8900 Fax 919 239 8913 Toll-free 800 368 7511 www.cardnoentrix.com


Economic Benefits of the Tennessee Valley Authority’s Natural Resource Plan
January 2011 Cardno ENTRIX Table of Contents i
Table of Contents Executive Summary ..................................................................................................................................................... v
Methodology and Data ........................................................................................................ v
Benefits Overview ............................................................................................................ vii
Recreation and Visitor Use Benefits .................................................................... vii
Cultural Resource Preservation Benefits ............................................................... x
Species and Habitat Conservation Benefits ......................................................... xii
Water Resource Benefits .................................................................................... xiv
Other Benefits ..................................................................................................... xvi
Chapter 1 Introduction .................................................................................................................................. 1-1 1.1 Purpose and Scope of the Analysis ..................................................................... 1-1
1.2 Report Organization ............................................................................................ 1-2
Chapter 2 Methodology and Data Sources .................................................................................................. 2-1 2.1 Overview of Benefits .......................................................................................... 2-1
2.1.1 Management Options ............................................................................. 2-2
2.1.2 Baseline and Timeframe ........................................................................ 2-2
2.1.3 Quantitative/Qualitative Nature and Certainty of Estimated Benefits .................................................................................................. 2-3
2.2 Measuring Economic Benefit ............................................................................. 2-3
2.2.1 Valuation Methods ................................................................................. 2-5
Chapter 3 Recreation/Visitor Benefit Estimation ........................................................................................ 3-1 3.1 Summary of Estimated Recreation/Visitor Benefits ........................................... 3-2
3.2 Recreation Participation Estimates (Estimated Number of Beneficiaries) ......... 3-5
3.2.1 Developed Facilities .............................................................................. 3-5
3.2.2 Developed Facilities and American with Disabilities Act Accessibility Guidelines (ADAAG) ...................................................... 3-6
3.2.3 Dispersed Recreation ............................................................................. 3-7
3.3 Valuation Literature .......................................................................................... 3-10
3.3.1 Value of Recreation Activities ............................................................. 3-10
3.3.2 Value of Quality Improvements .......................................................... 3-11
Chapter 4 Cultural Resource Preservation Benefits ................................................................................... 4-1 4.1 Summary of Estimated Cultural Resource Benefits ........................................... 4-1
4.2 Affected Population ............................................................................................ 4-3
4.2.1 Public ..................................................................................................... 4-3
4.2.2 Native American Tribes ......................................................................... 4-4

Economic Benefits of the Tennessee Valley Authority’s Natural Resource Plan
ii Table of Contents Cardno ENTRIX January 2011
4.2.3 Field School Participants ....................................................................... 4-4
4.3 Total Number of Cultural Resources: Documented and Undocumented............ 4-4
4.3.1 Archeological Sites ................................................................................ 4-4
4.3.2 Historical Sites ....................................................................................... 4-5
4.4 Archaeological Value ......................................................................................... 4-5
4.4.1 ARPA Fines ........................................................................................... 4-5
4.4.2 Archaeological Value ............................................................................ 4-5
Chapter 5 Species and Habitat Conservation Benefits .............................................................................. 5-1 5.1 Population Affected ............................................................................................ 5-3
5.2 Habitat and Species on TVA lands ..................................................................... 5-3
5.3 Estimating Value................................................................................................. 5-5
5.3.1 Species and Habitat Values .................................................................... 5-5
5.3.2 Invasive Species Control Value ............................................................. 5-6
5.3.3 Carbon Sequestration Value .................................................................. 5-6
5.3.4 Value to Volunteers ............................................................................... 5-7
Chapter 6 Water Resource Benefits ............................................................................................................. 6-1 6.1 Summary of Estimated Water Resource Benefits ............................................... 6-1
6.2 Aquatic Ecology Management and Restoration ................................................. 6-3
6.3 Shoreline Stabilization ........................................................................................ 6-3
6.4 Water Quality (Hydrologic Unit Improvements) ................................................ 6-3
6.5 Public Outreach................................................................................................... 6-5
Chapter 7 Other Benefits: Management Knowledge, Public Perception, and Cost Savings .................. 7-1 7.1 Summary of Other Benefits ................................................................................ 7-1
Chapter 8 List of Preparers ........................................................................................................................... 8-1 Chapter 9 References .................................................................................................................................... 9-1
Appendices Appendix A Overview of Two Types of Economic Effects ................................................................ A-1
Appendix B Summary of NRP Benefits by Resource Area ................................................................ B-1
Appendix C Summary of NRP Benefits by Management Option ....................................................... C-1
Tables Table ES-1 Benefit Category Definitions ............................................................................................. vi
Table ES-2 Summary of Recreation Values ....................................................................................... viii
Table ES-3 Summary of Cultural Resource Values .............................................................................. xi
Table ES-4 Summary of Species and Habitat Conservation Values ................................................... xiii

Economic Benefits of the Tennessee Valley Authority’s Natural Resource Plan
January 2011 Cardno ENTRIX Table of Contents iii
Table ES-5 Summary of Water Resource Values ................................................................................ xv
Table ES-6 Summary of Programs Providing Management Knowledge, Partnerships, and Public Perception Benefits .............................................................................................. xvii
Table 2-1 Benefit Category Definitions ........................................................................................... 2-2
Table 3-1 Summary of Recreation Values ....................................................................................... 3-2
Table 3-2 Hunting Visitation at ACOE Lakes in the TVA Region .................................................. 3-7
Table 3-3 Dispersed Recreation Participation in the TVA Region .................................................. 3-8
Table 3-5 Value of Recreational Activities .................................................................................... 3-11
Table 3-6 Value of Improved Recreation Conditions .................................................................... 3-12
Table 4-1 Summary of Cultural Resource Values ............................................................................ 4-2
Table 4-2 Estimated Population of Tribes Consulted by TVA ....................................................... 4-4
Table 5-1 Summary of Species and Habitat Conservation Values ................................................... 5-2
Table 5-2 Wildlife-Related Recreation Participation in TVA Region ............................................. 5-3
Table 5-3 Habitat Acreage on TVA-Managed Lands ...................................................................... 5-4
Table 5-4 Federal Candidate or Proposed Threatened and Endangered Species in Tennessee River Watershed .............................................................................................................. 5-4
Table 5-5 Current Land Use Zone Definitions for Single Use Allocation Lands on 28 TVA Reservoirs ........................................................................................................................ 5-4
Table 6-1 Summary of Water Resource Values ............................................................................... 6-2
Table 7-1 Summary of Programs Providing Management Knowledge, Partnerships, and Public Perception Benefits ............................................................................................... 7-1
Table B-1 Summary of Recreation Program Benefits by Management Option .................................. 2
Table B-2 Summary of Cultural Program Benefits by Management Option ....................................... 7
Table B-3 Summary of Biological Resource Management Program Benefits by Management Option ......................................................................................................... 12
Table B-4 Summary of Water Resource Program Benefits by Management Option ........................ 24
Table C-1a Summary of Recreation Resource Program Benefits Under Current Management Option ................................................................................................................................. 2
Table C-1b Summary of Recreation Resource Program Benefits Under Custodial Management Option ........................................................................................................... 5
Table C-1c: Summary of Recreation Resource Program Benefits Under Enhanced Management Option ................................................................................................................................. 7
Table C-1d Summary of Recreation Resource Program Benefits Under Flagship Management Option ............................................................................................................................... 10
Table C-2a Summary of Cultural Resource Program Benefits Under Current Management Option ............................................................................................................................... 13
Table C-2b Summary of Cultural Resource Program Benefits Under Custodial Management Option ............................................................................................................................... 15

Economic Benefits of the Tennessee Valley Authority’s Natural Resource Plan
iv Table of Contents Cardno ENTRIX January 2011
Table C-2c Summary of Cultural Resource Program Benefits Under Enhanced Management Option ............................................................................................................................... 18
Table C-2d Summary of Cultural Resource Program Benefits Under Flagship Management Option ............................................................................................................................... 21
Table C-3a Summary of Biological Resource Program Benefits Under Current Management Option ............................................................................................................................... 24
Table C-3b Summary of Biological Resource Program Benefits Under Custodial Management Option ......................................................................................................... 30
Table C-3c Summary of Biological Resource Program Benefits Under Enhanced Management Option ......................................................................................................... 35
Table C-3d Summary of Biological Resource Program Benefits Under Flagship Management Option ............................................................................................................................... 41
Table C-4a Summary of Water Resource Program Benefits Under Current Management Option ............................................................................................................................... 47
Table C-4b Summary of Water Resource Program Benefits Under Custodial Management Option ............................................................................................................................... 49
Table C-4c Summary of Water Resource Program Benefits Under Enhanced Management Option ............................................................................................................................... 51
Table C-4d Summary of Water Resource Program Benefits Under Flagship Management Option ............................................................................................................................... 53
Figures Figure 2-1: Steps in NRP Activity / Goal Valuation .................................................................................. 2-4

January 2011 Cardno ENTRIX Executive Summary v
Executive Summary In 2008 the Board of Directors of the Tennessee Valley Authority (TVA) approved the TVA Environmental Policy. The Environmental Policy establishes principles to lead TVA successfully in three areas: provide reliable and affordable power to the Tennessee River Valley (Valley), reduce environmental impact and engage in proactive environmental stewardship in a balanced and ecological sound manner, and support sustainable economic growth in the Valley. The Natural Resource Plan (NRP) represents TVA’s planning process for Environmental Policy goals not closely tied to energy production and use. Specifically, the NRP systematically addresses stewardship on the 293,000 acres of TVA-managed lands in four resource areas: recreation; water resources; cultural resources; and biological resources. The general goal of the NRP is to integrate the objectives of these resource areas, provide for the optimum public benefit, and balance competing and sometimes conflicting resource uses.
TVA desires an understanding of the benefits from each type of goal/activity in each management option in order to prioritize stewardship actions and develop a preferred alternative for the EIS. This analysis identifies and, to the extent feasible, quantifies the economic benefits of the NRP programs based on available information. These benefits stem from resource management and enhancement, and accrue to the public through visits to TVA lands, enhanced perception and knowledge of TVA-managed resources, and cost savings to TVA and its rate payers. In addition to providing economic value to recreationists and others, many NRP programs also contribute to economic development in the Tennessee Valley. While these economic development effects are important, they are beyond the scope of this analysis. This study focuses solely on the economic benefits of the NRP, including benefits to visitors and others associated with the quality and quantity of resources on TVA-managed lands.
The NRP programs provide numerous and varied benefits over a broad geographic area. The geographic scope of the NRP for cultural, biological, and recreation resources is the 293,000 acres of TVA-managed reservoir lands, while the geographic scope for water resources is the Tennessee River watershed. This analysis assumes that the economic benefits primarily accrue to residents of and visitors to the TVA region. Furthermore, the scope of the analysis includes all of the primary economic and social benefits of the NRP programs and provides a range of broadly applicable values using existing valuation studies.
Methodology and Data The NRP includes nearly 180 management goals or stewardship activities, including 33 goals or activities in cultural resources, 91 in biological resources, 33 in recreation resources, and 22 in water resources. Many of these goals or stewardship actions provide multiple benefits, resulting in a large set of benefits. To streamline the analysis, we collaborated with the TVA resource specialists and developed six benefit categories.
Following an overview of the categories of benefits analyzed in this study, this chapter outlines the methodology and data sources used to quantify benefits. The analysis relied solely on existing studies, no original valuation studies or surveys were conducted. Cardno ENTRIX drew

Economic Benefits of the Tennessee Valley Authority’s Natural Resource Plan
vi Executive Summary Cardno ENTRIX January 2011
from existing valuation literature and applied these existing values to the NRP programs in accordance with the characteristics of the Tennessee Valley region and the expected effects of NRP goals and stewardship activities (a methodology known as benefits transfer). To understand the effects of the NRP programs in terms that have economic relevance, ENTRIX worked closely with TVA resource specialists to understand and quantify where possible the outcomes of NRP programs in terms of resource quality or quantity changes.
Benefits of the NRP programs were organized into six categories. These categories are defined in Table 2-1. Four of the benefit categories correspond to the resource management areas in the NRP: recreation, cultural, biological, and water resources. The remaining two categories are benefits to the public and TVA of increased management data and knowledge and enhanced partnerships and public perception.
Table ES-1 Benefit Category Definitions Benefit Category Definition
Recreation/ Visitor Benefit Use Benefits to recreationists/visitors of experiences on TVA-managed lands. Value represents user benefits related to the number and quality of recreation resources on TVA lands, including developed facilities, dispersed recreation areas, and biological and cultural resources enjoyed by recreationists.
Cultural Resource Preservation Cultural resource benefit of preventing degradation of cultural resources, including structures, buildings, and archaeological sites. These benefits may accrue from cultural resource management programs, or from such programs as shoreline stabilization, not including direct recreation/visitor use benefits such as development of museums (where separable, included under recreation/visitor benefit).
Species/ Habitat Conservation and Abundance
Biological resource benefit of enhancing or preventing degradation of biological resources, including both species and habitat, not including related recreation benefit (where separable, included under recreation/visitor benefit).
Water Resource Benefit Direct benefits of water resource management related to the provisioning of water supplies and stabilization of shoreline areas. These benefits primarily stem from improved water quality, reduced erosion, and water conservation.
Management Data and Scientific Knowledge/ Reduce Compliance Costs
Benefits related to increased knowledge or data availability to TVA resource managers that will enable more informed management decisions regarding resource enhancement or conservation, and benefit to TVA associated with reduced compliance or resource management costs.
Public Perception, Partnerships, Outreach
Benefit of increased public knowledge regarding the use or conservation of cultural, biological, recreation, and water resources; benefits associated with developing partnerships with local and regional entities; and benefits related to enhanced public perception, including perception related to recreation, resource stewardship, and public outreach.
Benefits are estimated for each of the four management options considered for the NRP: Custodial Management, Current Management, Enhanced Management, and Flagship Management. Benefits are estimated on a per unit basis, for example, per trail mile per year. The management options generally differ in how many units are provided, such as how many trail miles are developed each year. To estimate benefits for each management option, the benefits on a per unit basis are simply scaled based on the number of units provided under each management option.
Benefits are quantified to the extent possible, but are expressed qualitatively where necessary. Economic value from resource management is generated when there is a change in a resource

Economic Benefits of the Tennessee Valley Authority’s Natural Resource Plan
January 2011 Cardno ENTRIX Executive Summary vii
quality or quantity that people value. For many of the NRP activities, there is no known change in resource quality or quantity to value (e.g., the acres of habitat improved or the reduced number of archaeological sites damaged is not known). For these activities, data is provided regarding the number of people who may particularly benefit by NRP management of the resource, along with information on potential economic value on a per unit basis as available (e.g., the average value per habitat acre improved when acreage is unknown). For many NRP stewardship activities, it is not feasible to quantify benefits, even though they may be valuable to the public.
We estimate values for NRP benefits using existing literature, matching literature values to the extent possible with the type of benefits specifically generated by NRP activities. As the values represent average values, and can vary widely based on such factors as baseline conditions and the degree of improvement or change due to the NRP programs, there is uncertainty regarding the actual value of NRP programs. Acknowledging this uncertainty, we present a range of average, broadly applicable values of the types of benefits provided by NRP programs.
Benefits Overview Appendix B and Appendix C contain the detailed tables of benefits by management option for each resource area. Provided below are the valuation data on a per unit basis; benefits for each NRP management option as presented in Appendix B and Appendix C were scaled according to the number of units provided under each management option.
Recreation and Visitor Use Benefits Recreation and visitor use benefits are generated by the recreation management programs (campground management, day use area management, recreation assessment and design tools, and public outreach). Recreation benefits are also generated by enhancements to the recreation environment that are expected to result from water, biological, and cultural resource management programs. Together, these NRP programs provide four types of benefit to recreators, each of which could increase the number of recreators and/or the value of the recreation experience:
1. Quantity of recreation / visitor facilities (increased opportunities for visitors),
2. Quality of recreation / visitor facilities,
3. Quality of recreation environment (including improvements to or protection of biological and cultural resources), and
4. Availability of information and education to recreators.
The value to recreators of NRP programs is based on the number of recreation participants and the value of the recreation experience to each participant. For example, we estimate the value of a day use area as the number of days that people recreate at the area, multiplied by the average daily value to each recreator. Thus, recreation value from the NPR can result from either an increase in the number of recreators (usually due to an increase in the availability of recreation opportunities) or in increase in the value of the experience to the recreator. The recreation values presented in this chapter represent this ‘net benefit’ to the recreator.

Economic Benefits of the Tennessee Valley Authority’s Natural Resource Plan
viii Executive Summary Cardno ENTRIX January 2011
Table ES-2 summarizes the estimated visitor and recreation values generated by the NRP programs, with detail provided on the estimated number of recreation participants and the estimated range of value per participant.
Table ES-2 Summary of Recreation Values
Management Activity / Goal Current Annual Recreation Participation Value / Participation Annual Value of Activity / Goal
Recreation Management
Campground Management
Developed Campground 19,500 Average camping person days per TVA
campground
$9 - $30 / Day $180,000 - $590,000 per Campground
ADAAG Campsites 285 Average increased camping person days per
ADAAG campsite
$9 - $30 / Day $2,500 - $8,500 per ADAAG Site
Day Use Area Management
Developed Day Use Area 11,700 Average Person Days per TVA Day Use Area
$12 - $40 / Day $140,000 to $470,000 per Day Use Area
ADAAG Day Use Area 1,750 Average Existing Day Use Area Visits May Benefit
Unknown change in value to users or
change in number of users.
Unknown
Stream Access Site 440 Average Person Trips Per Stream Access Site
$10 - $27 / Trip $4,000 - $12,000 per Stream Access Site
Blue-Way 150 Average additional Person Trips Per Stream Mile
$10 - $27 / Trip $1,500 - $4,000 per Blue-way Mile
Greenway 70 to 90 Households Within One Square Mile of One
Greenway Mile
$170 - $215 Household
$10,000 - $20,000 per Greenway Mile
Recreation Assessment and Design Tools
All Assessment/Design Tools 6,000,000 Dispersed Recreation Visits on 293,000 Acres
156,000
Camping Person Days at 8 campgrounds
735,000 Day Use Visits at 63 TVA Day Use Areas
Unknown Unknown
Expansion of new campgrounds 19,500 Average camping person days per TVA campground
$9 - $30 / Day $180,000 - $590,000 per Campground
Update recreation inventory for TVA-managed reservoirs
186,000 Person trips to each TVA reservoir
Unknown Unknown
Public Outreach
Clean and Green Campground Initiative
19,500 Average camping person days per TVA campground

Economic Benefits of the Tennessee Valley Authority’s Natural Resource Plan
January 2011 Cardno ENTRIX Executive Summary ix
Management Activity / Goal Current Annual Recreation Participation Value / Participation Annual Value of Activity / Goal
Maintain existing Internet presence and strive to enhance
300,000 Visits to TVA Recreation Web Pages
Unknown Unknown
Develop and implement new Resource Ranger program
Unknown $20 / Volunteer Hour
Unknown
2,600,000 Visitors to a Nature Center by TVA Region
Residents
$5 - $10 / Nature Center Visit
Unknown
Biological Resource Management
Dispersed Recreation Management
Dispersed Recreation Area Improvement
6,000 Average Trips Per Recreation Area
$0-$15 / Trip $0 - $90,000 per Site Improved
General Dispersed Recreation 20 Average Trips Per Acre of TVA Managed Lands
$10 - $30 / Trip for Improved Quality
$200 - $600 per Acre of TVA Land
Hiking 16,700 Average Hiking Person Trips Per Mile of Trail
$9 - $13 / Trip $150,000 - $215,000 per Trail Mile
Terrestrial Habitat Management
Dewatering Sites Recreation 20 Average Person Trips per Dewatering Site Acre
$10 - $30 / Trip $200 - $600 per Dewatering Site Acre
Agricultural and Open Lands Management
20 Average Person Trips Per Acre of TVA Managed
Lands
$3 - $30 /Acre of Habitat Improvement
$3 - $30 Per Acre of Habitat
Improvement
Sensitive Biological Resource Management
Migratory Birds Management 110,000 Migratory bird hunters in TVA region
2.0 million
People view birds in TVA region
20 Average person trips per acre of TVA-managed
lands
$3 - $30 /Acre of Habitat Improvement
$3 - $30 Per Acre of Habitat
Improvement
Endangered and Threatened Species Program
20 Average Person Trips Per Acre of TVA Managed
Lands
$3 - $30 /Acre of Habitat Improvement
$3 - $30 Per Acre of Habitat
Improvement
Natural Areas Program 20 Average Person Trips Per Acre of TVA Managed
Lands
$3 - $30 /Acre of Habitat Improvement
$3 - $30 Per Acre of Habitat
Improvement
Forest Resource Management
All Forest Resource Management Programs
20 Trips per acre of TVA-managed lands
$10 - $30 / Trip $200 - $600 per Acre of TVA forest land
Wildlife Habitat Council – Third Party Certifications
$3 - $30 / Acre of Habitat Improvement
$3 - $30 / Acre
Public Outreach

Economic Benefits of the Tennessee Valley Authority’s Natural Resource Plan
x Executive Summary Cardno ENTRIX January 2011
Management Activity / Goal Current Annual Recreation Participation Value / Participation Annual Value of Activity / Goal
All Biological Resources Outreach 6,000,000 Dispersed Recreation Visits on 293,000 Acres
156,000
Camping Person Days at 8 campgrounds
735,000 Day Use Visits at 63 TVA Day Use Areas
Unknown Unknown
Develop and implement new environmental education program (museum and program)
52,850 Average visits per nature center nationwide
3 million
Residents in TVA region visit nature centers annually
$5 - $10 / Nature Center Visit
$250,000 - $500,000 per nature center annually
Cultural Resources Management
Public Outreach
All Cultural Resources Outreach 2,300,000 Residents in TVA region visit historic sites
annually
7,000 Visits to TVA cultural resource web pages annually
Unknown Unknown
History Museum 10,700 Average visits per museum nationwide
$19-$30 / Visit $200,000 - $320,000 per Museum
Cultural Resource Preservation Benefits Cultural resources on TVA lands include archaeological sites and objects, historic structures (including buildings and dams), historic sites (including civil war sites). There is a high density of cultural resources on TVA lands, particularly along shorelines. These sites are vulnerable to damage, both from shoreline erosion and also from looting. Federal law requires TVA to manage and preserve these resources to the extent possible. In addition to compliance with federal law, preservation of cultural resources on TVA-land has numerous public benefits, including the protection of cultural heritage and identity and the scientific and educational value regarding our history and pre-history.
Quantification of the economic benefits of cultural resource management was possible for only a few management activities and goals, as there are few to no existing studies quantifying in dollar terms the value to the public of cultural resources similar to those on TVA lands. It is known, however, that the American public values cultural resources. For example, according to a recent national survey of archaeological resources, nearly all respondents agreed that archaeological

Economic Benefits of the Tennessee Valley Authority’s Natural Resource Plan
January 2011 Cardno ENTRIX Executive Summary xi
sites have ‘educational and scientific value’ (99 percent of respondents) and ‘value related to personal heritage’ (93 percent of respondents).1
To indicate the potential magnitude of value of cultural resource preservation from NRP programs, we provide the following quantitative information: 1) the number of people who may benefit from cultural resources preservation, 2) the number of undocumented sites that may be identified through additional surveys (identification of which may provide additional scientific, educational, and potential recreation value), and 3) estimates of the ‘archaeological value’, as defined under the Archaeological Resources Protection Act of 1979, of NRP management actions that protect cultural resources.
Table ES-3 summarizes the quantitative information developed in this study regarding the value to the public of NRP cultural resource management actions and goals.
Table ES-3 Summary of Cultural Resource Values
Management Activity / Goal Resource/ Current Population Benefiting Value / Unit Annual Value of Activity /
Goal
Cultural Resource Management
All Management Actions / Goals
310 Million Americans 6.5 Million Residents in TVA region, 2.3 million visit historical sites and 1.0 million visit archaeological sites 450,000 Members of tribes with a cultural interest in resources on TVA lands
Varies on goal / activity, with many values unknown.
Increased protection and preservation of cultural resources for current and future generations.
ARPA
Conduct ARPA Inspections and security checks
11,500 Identified Archaeological Resources 1 ARPA Investigation per 108 Security Inspections
Looting Fines of $100,000 to $250,000 per Looting Incident; Damage value per TVA prosecution: $670,000.
Unknown decrease in looting incidents due to security checks
Archaeological Monitoring and Protection
Protect archaeological site of tributary shoreline miles OR main stem shoreline miles
2.6 Shoreline Archaeological Sites Per Mile
$600,000 - $1,800,000 / Site
$1 - $5 million Per Mile
Preservation Program
Archaeological surveys of TVA-managed lands 0.07
Average Undocumented Sites Per Acre Unknown Increased protection and
management knowledge
1 Harris Interactive, 2000, Exploring Public Perceptions and Attitudes about Archaeology, Prepared for the
Society for American Archaeology.

Economic Benefits of the Tennessee Valley Authority’s Natural Resource Plan
xii Executive Summary Cardno ENTRIX January 2011
Management Activity / Goal Resource/ Current Population Benefiting Value / Unit Annual Value of Activity /
Goal
Cultural Resource Partnerships
Field Schools
10-15 Participants per field school 5-10 Volunteers per field school
Unknown Training for future professionals and public education benefits through field trips and observation of excavation.
Recreation Management
Public Outreach 6,000,000 Dispersed Recreation Visits on 293,000 TVA-managed Acres 156,000 Camping Person Days at 8 campgrounds 735,000 Day Use Visits at 63 TVA Day Use Areas 8,7000,000 Day Use Visits to TVA Reservoirs
Unknown Potential increased protection and preservation of cultural resources for current and future generations.
Biological Resource Management
Public Outreach and Dispersed Recreation Management
6,000,000 Dispersed Recreation Visits on 293,000 TVA-managed Acres 156,000 Camping Person Days at 8 campgrounds 735,000 Day Use Visits at 63 TVA Day Use Areas 8,7000,000 Day Use Visits to TVA Reservoirs
Unknown Potential increased protection and preservation of cultural resources for current and future generations.
Water Resource Management
Shoreline Stabilization
Stabilize critically eroding shoreline
2.6 Shoreline Archaeological Sites Per Mile
$600,000 - $1,800,000 / Site
$1 - $5 million
Per Mile
Species and Habitat Conservation Benefits The Tennessee Valley is a biological rich area supporting diverse species and habitats. Conservation of species and habitat diversity and abundance has intrinsic benefit to people, including the protection of our heritage and identity, the scientific and educational value of species and habitats, and the non-use value to people of knowing that these biological resources exist and are protected for future current and future generations. The recreation value of species and habitat conservation has been widely studied, and is estimated above for NRP programs

Economic Benefits of the Tennessee Valley Authority’s Natural Resource Plan
January 2011 Cardno ENTRIX Executive Summary xiii
(under recreation and visitor use benefits). While valuable to people, the quantification of the intrinsic benefits of habitat and species conservation was not possible for the NRP programs because there is little to no data on how NPR management activities will affect species populations or habitat quality. To indicate the potential magnitude of value of species and habitat conservation from NRP programs, this chapter provides the following quantitative information: 1) the number of people who may value the intrinsic benefits from species and habitat conservation, 2) information on the habitats and species in the TVA region, and 3) examples from the literature providing estimates of the value to people of species and habitat conservation.
Table ES-4 Summary of Species and Habitat Conservation Values
Management Activity / Goal Current Resource/Population Benefiting Value / Unit Annual Value of Activity /
Goal Biological Resource Management
All Management Activities /Goals
310,000,000 US Population 6,500,000 TVA 125-County Population
Value of enhanced habitat and species populations.
Wetland Management
$150 - $1,600 / Wetland
Acre
Unknown number of wetland acres conserved.
Endangered and Threatened Species Program
$5 - $100 /Household/
Year (for significant
increases in species
protection rates)
Potential benefits from unknown change in habitat
quality and species populations from NRP management actions.
Natural Areas Program
Monitor TVA’s natural areas annually and implement maintenance needs on natural areas as identified by opportunistic observations
34,000 Acres currently zoned for sensitive resource management
Potential benefits from unknown change in habitat
quality and species populations
Develop and implement management plans on natural areas
220 Average estimated acres per Natural Area
Potential benefits from unknown change in habitat
quality and species populations
Non-Native Invasive Plant (NNIP) Management
Control NNIP on TVA-managed lands
2.0 – 5.0 Benefit Cost
Ratio
Cost of NNIP control of $40 to $225 per acre results in
benefits of $80 to $1125 per acre
Terrestrial Greenhouse Gas

Economic Benefits of the Tennessee Valley Authority’s Natural Resource Plan
xiv Executive Summary Cardno ENTRIX January 2011
Management Activity / Goal Current Resource/Population Benefiting Value / Unit Annual Value of Activity /
Goal
$10 -$40 /
Ton of Carbon
Economic value of carbon sequestration in terms of avoided costs of climate
change, including avoided damages to species and
habitat
Public Outreach
Volunteer Program
$20 / Hour Value to
Volunteers
Value to volunteers; unknown number of volunteer hours
Water Resource Management
All Management Activities /Goals
Potential improved aquatic habitat quality
Cultural Resources Management
Shoreline Stabilization Potential improved aquatic
habitat quality
Water Resource Benefits The NRP water resource management programs focus on restoration of aquatic biology communities, enhanced water quality, and shoreline stabilization to prevent erosion. Public outreach management activities within water resource management programs as well as in recreation and biological resource programs also include components to encourage water conservation. Restoration of aquatic biology communities and enhanced water quality can provide the following benefits: increased recreation value, increased aesthetic value to nearby residents, avoided adverse health effects, and reduced water treatment costs for domestic and/or industrial water users. Shoreline stabilization can reduce property and resource damage associated with erosion and improve water quality by reducing sediment in the water (the value shoreline stabilization in preserving cultural resources is estimated above under ‘Cultural Resource Preservation Benefits’). Water conservation can lessen the severity and frequency of water shortages and/or decrease the price of water in the region by reducing the need for more water resource development projects. The value of water resource benefits from the NRP depends on the current quality of the water bodies, the population affected, and the degree of resource improvement.
Table ES-5 summarizes the estimated water resource values generated by the NRP programs, including benefits generated by public outreach and other NRP programs in the recreation and biological resource management areas. While the NRP includes 22 water resource management goals and activities, we have estimated quantitative value for a limited number of goals and activities. This is due to two factors. First, many of the management activities and goals are related to strategic partnerships, public outreach, and data collection that will contribute to water resource enhancement; however, data is not available to quantify the effect on water resources.
Second, many of the water resource management activities and goals are aimed at improving the water quality in the Tennessee River Valley as measured by the hydrologic unit (HU) rating of

Economic Benefits of the Tennessee Valley Authority’s Natural Resource Plan
January 2011 Cardno ENTRIX Executive Summary xv
poor, fair, or good. One of the NRP management goals sets a target for improving the number of HUs in the Tennessee River watershed from poor to fair or fair to good (the management goal of “Improve __ HU in __ Years”). Several water resource management actions identify the means that will be used to achieve this management goal, including public outreach programs and targets to reduce the quantity of phosphorous and sediment entering streams. As these are intermediary management actions that will assist in reaching the overall management goal of improving HU water quality but do not represent additional benefits, to avoid double counting we value only the final outcome of water quality improvements in the HUs embodied in the management goal of “Improve __HU in __Years”.
Table ES-5 Summary of Water Resource Values
Management Activity / Goal Resource/ Current Population Benefiting Value / Unit Annual Value of Activity /
Goal
Water Resource Management
All Activities / Goals
2.6 Million Households in the Tennessee Valley 125-County Region
Varies by Activity
Potential positive effect on water quality and conservation
Aquatic Ecology Management
Outreach to Raise Public Awareness of Exotic and Invasive Aquatics
Unknown Unknown Potential benefit cost ratio of 2.0 to 5.0 (for every dollar spent, $2 to $5 dollars in benefits)
Reservoir Shoreline Stabilization
Stabilize Critically Eroding Shoreline
3.7 Shoreline 26a permits (Private Property Structures) Per Mile
Unknown Unknown
Targeted Watershed Initiative
Improve Hydrologic Unit (HU) 611 HU containing in the Tennessee River watershed 2.6 Million Households in the Tennessee Valley 125-County Region
$0.02 -$0.05 / Household / HU Improved
$55,000 - $135,000 per HU improved
Public Outreach
Maintain Certification / Certify New “Clean and Green” Marinas
70 Percent Certified Marinas Experience Increased Revenue
$5,000 - $50,000/ Marina with Increased Revenue
$3,500 - $35,000 per Certified Marina
Recreation Management
Public Outreach
6,000,000 Dispersed Recreation Visits on 293,000 TVA-managed Acres 156,000 Camping Person Days at 8 campgrounds
Unknown, varies by activity
Potential positive effect on water quality and conservation

Economic Benefits of the Tennessee Valley Authority’s Natural Resource Plan
xvi Executive Summary Cardno ENTRIX January 2011
Management Activity / Goal Resource/ Current Population Benefiting Value / Unit Annual Value of Activity /
Goal 735,000 Day Use Visits at 63 TVA Day Use Areas 8,7000,000 Day Use Visits to TVA Reservoirs
Campground Management
Establish flagship campgrounds with innovative design and efficiency measures
19,500 Average person camping days per campground
Unknown Water conservation benefits.
Day Use Areas
Implement sustainable initiatives
11,700 Average person days per TVA day use area
Unknown Water conservation benefits
Biological Resource Management
Public Outreach
6,000,000 Dispersed Recreation Visits on 293,000 TVA-managed Acres 156,000 Camping Person Days at 8 campgrounds 735,000 Day Use Visits at 63 TVA Day Use Areas 8,7000,000 Day Use Visits to TVA Reservoirs
Unknown, varies by activity
Potential positive effect on water quality and conservation
Other Benefits There are two additional benefit categories of NRP management actions and goals:
1. Increased management knowledge and data. Management data and knowledge can increase the effectiveness of TVA resource management and also enhance prioritization of management actions to increase public benefits on TVA-managed lands. TVA leadership in data gathering and development of resource management techniques can also enhance resource management on other public lands.
2. Enhanced partnerships and public perception. TVA resource stewardship actions and collaborative partnerships with other public agencies can foster trust and a positive image to the public and partner agencies. Partnerships may benefit recreationists and visitor users through the TVA service area on both TVA-managed lands and other lands.
Increased management knowledge, partnerships, and enhanced public perception of TVA can enhance resource management and lead to cost savings to TVA and its rate payers. While

Economic Benefits of the Tennessee Valley Authority’s Natural Resource Plan
January 2011 Cardno ENTRIX Executive Summary xvii
important and potentially quite large, these benefits are difficult to quantify. In fact, the only quantified benefit is the compliance cost savings estimated by TVA biology resource specialists due to current biological data collection and management. Given the difficulty in quantification, we focused on identifying the programs that primarily provide these other benefits.
Table ES-6 Summary of Programs Providing Management Knowledge, Partnerships, and Public Perception Benefits
Management Activity / Goal Management Knowledge and Data Partnerships & Public Image
Cost Savings
Recreation Management
All Management Activities and Goals
Positive perception of enhanced and maintained recreation and visitor use experience.
Campground Management
Establish flagship campgrounds with innovative design and efficiency measures
Research and development and leadership in innovative design that can be shared with other public land managers
(Positive perception of enhanced and maintained recreation and visitor use experience)
Day Use Areas Management
Implement sustainable initiatives at day use areas
Research and development and leadership in innovative design that can be shared with other public land managers
(Positive perception of enhanced recreation and visitor use experience.)
Develop blue-way miles per year contingent upon available partnerships
Strengthen partnerships (in addition to enhanced public image from improving recreation opportunities)
Assist with development (as appropriate) of greenway miles
Strengthen partnerships (in addition to enhanced public image from improving recreation opportunities)
Assist partners with acquisition and development of additional stream access sites (as appropriate)
Strengthen partnerships (in addition to enhanced public image from improving recreation opportunities)
Recreation Assessment and Design Tools All Programs Increased management knowledge regarding
level of use, user perception of recreation resources, and condition of resources.
Better prioritization of program funding to maximize value from recreation resource expenditures.
Partner with state boating law administrators to complete comprehensive boating density assessments per year
Strengthen partnerships (in addition to enhanced public image from improving recreation opportunities)

Economic Benefits of the Tennessee Valley Authority’s Natural Resource Plan
xviii Executive Summary Cardno ENTRIX January 2011
Management Activity / Goal Management Knowledge and Data Partnerships & Public Image
Cost Savings
Public Outreach Clean and Green Campground Initiative
Research and development and leadership in innovative design that can be shared with other public land managers
(Positive perception of enhanced recreation and visitor use experience.)
Establish the CF&TF to leverage funding for conservation, environmental, and/or recreation project(s) across the Valley
Potential funding for additional management data collection.
Strengthen partnerships (in addition to enhanced public image from improving recreation opportunities and conservation projects)
Potential increase in grant funding for TVA projects, thereby reducing TVA costs
Biological Resource Management
All Management Actions and Goals
Improved management knowledge that can translate into increased protection of resources and data sharing with partners.
Positive perception of management actions to maintain and enhance resources.
Better prioritization of program funding to maximize value from program expenditures.
Dispersed Recreation Management
All Programs Increased management knowledge regarding level of use, user perception of recreation resources, and condition of resources.
Positive perception of enhanced and maintained recreation and visitor use experience.
Emphasize partnership and promotion of LNT
Strengthen Partnerships (and positive public perception of TVA stewardship)
Formally design and implement a Valley-wide trails establishment and maintenance program
Strengthen partnerships (in addition to enhanced public image from improving recreation opportunities)
Endangered and Threatened Species, TVA Natural Heritage Database, Wetlands Database, and Lands Conditions Assessment Programs
(Improved management knowledge that can translate into increased protection of resources and data sharing with partners. )
(Positive perception of management actions to maintain and enhance resources.)
Current management cost savings to TVA of an estimated $18.5 million annually (decreased staff time required for NEPA compliance, Section 261 permitting, reduced costs in planning and siting of projects)
Land Stewardship Assessment Tools and Stewardship Programs
Honor data sharing agreements among TVA and other state and federal resource agencies
Strengthen Partnerships (and positive public perception of TVA stewardship)
Strong partnerships and collaboration with partner agencies can increase communication to streamline compliance and save cost to TVA
Expand information gathering efforts for identification of sensitive resources through partnerships
Strengthen Partnerships (and positive public perception of TVA stewardship)
Strong partnerships and collaboration with partner agencies can increase communication to streamline compliance and

Economic Benefits of the Tennessee Valley Authority’s Natural Resource Plan
January 2011 Cardno ENTRIX Executive Summary xix
Management Activity / Goal Management Knowledge and Data Partnerships & Public Image
Cost Savings
save cost to TVA
Sensitive Biological Resources Management Programs Continue to be advisers/participants in planning organizations
Strengthen Partnerships (and positive public perception of TVA stewardship)
Strong partnerships and collaboration with partner agencies can increase communication to streamline compliance and save cost to TVA
Expand role in large-scale planning efforts across the region via partnerships
Strengthen Partnerships (and positive public perception of TVA stewardship)
Strong partnerships and collaboration with partner agencies can increase communication to streamline compliance and save cost to TVA
Develop a list of target-listed species; develop and monitor management plans; actively seek partnerships; and, catalog select species where management opportunities exist within the region
Strengthen Partnerships (and positive public perception of TVA stewardship)
Strong partnerships and collaboration with partner agencies can increase communication to streamline compliance and save cost to TVA
Provide level of data to support national and regional planning efforts for migratory birds; Participate in national and regional planning efforts
Strengthen Partnerships (and positive public perception of TVA stewardship)
Strong partnerships and collaboration with partner agencies can increase communication to streamline compliance and save cost to TVA
Continue leadership role in Tennessee River Valley Shorebird Working Group
Strengthen Partnerships (and positive public perception of TVA stewardship)
Strong partnerships and collaboration with partner agencies can increase communication to streamline compliance and save cost to TVA
Cooperate with partners to implement conservation projects for migratory birds on TVA-managed lands and implement demonstration projects to benefit regional habitat objectives for migratory birds per year
Strengthen Partnerships (and positive public perception of TVA stewardship)
Strong partnerships and collaboration with partner agencies can increase communication to streamline compliance and save cost to TVA
Partner to inventory and monitor waterfowl and other water bird populations along TVA reservoirs
Strengthen Partnerships (and positive public perception of TVA stewardship)
Strong partnerships and collaboration with partner agencies can increase communication to streamline compliance and save cost to TVA

Economic Benefits of the Tennessee Valley Authority’s Natural Resource Plan
xx Executive Summary Cardno ENTRIX January 2011
Management Activity / Goal Management Knowledge and Data Partnerships & Public Image
Cost Savings
Terrestrial Habitat Management Programs
Work with local and regional partners to incorporate nature-based tourism into management of dewatering areas projects
Strengthen Partnerships (and positive public perception of TVA stewardship)
Strong partnerships and collaboration with partner agencies can increase communication to streamline compliance and save cost to TVA
Provide support to state forestry assessment plans
Increase data for landscape level management.
Strengthen Partnerships (and positive public perception of TVA stewardship)
Strong partnerships and collaboration with partner agencies can increase communication to streamline compliance and save cost to TVA
Habitat Enhancement Partnerships: Engage existing partners in the management of licensed lands to align management goals with the Environmental Policy
Strengthen Partnerships (and positive public perception of TVA stewardship)
Strong partnerships and collaboration with partner agencies can increase communication to streamline compliance and save cost to TVA
Actively participate in State Exotic Pest Plant Councils along with regional early detection and rapid response initiatives
Strengthen Partnerships (and positive public perception of TVA stewardship)
Strong partnerships and collaboration with partner agencies can increase communication to streamline compliance and save cost to TVA
Nuisance Animal Control: Develop programmatic guidelines for addressing nuisance animals; establish MOA with agencies responsible for regulating wildlife; and, develop and share BMPs with partners
Strengthen Partnerships (and positive public perception of TVA stewardship)
Strong partnerships and collaboration with partner agencies can increase communication to streamline compliance and save cost to TVA; reduce costs through Memorandum of Agreement (MOA)
Terrestrial Greenhouse Management
All Programs Data on carbon sequestration rates and techniques
Enhanced management knowledge can reduce future compliance costs with pending carbon regulation.
Enter into third-party consortiums focusing on issues related to terrestrial GHG management practices
Strengthen Partnerships (and positive public perception of TVA stewardship)
Strong partnerships and collaboration with partner agencies can increase communication to streamline compliance and save cost to TVA

Economic Benefits of the Tennessee Valley Authority’s Natural Resource Plan
January 2011 Cardno ENTRIX Executive Summary xxi
Management Activity / Goal Management Knowledge and Data Partnerships & Public Image
Cost Savings
Cultural Resource Management
All Management Actions and Goals
Improved management knowledge and data that can translate into increased protection of resources and data sharing with partners.
Positive perception of management actions to maintain and enhance resources.
Better prioritization of program funding to maximize value from program expenditures.
Preservation Program DATABASE: Maintain current/ Develop a comprehensive database
Improved management knowledge that can translate into increased protection of resources and data sharing with partners.
Decreased costs through savings in staff time and field work due to better storage and retrieval of data; Increased management knowledge and prioritization of management actions.
Improve preservation program; develop implementation procedures and a comprehensive database
Improved management knowledge that can translate into increased protection of resources and data sharing with partners.
Decreased costs through savings in staff time and field work due to better storage and retrieval of data; Increased management knowledge and prioritization of management actions.
Preserve America Target to develop new partnerships per year to promote heritage tourism , historic properties and local governments
Strengthen Partnerships (and positive public perception of TVA stewardship)
Strong partnerships and collaboration with partner agencies can increase communication to streamline compliance and save cost to TVA
Improve preservation program; develop implementation procedures and a comprehensive database
Improved management knowledge that can translate into increased protection of resources and data sharing with partners.
Decreased costs through savings in staff time and field work due to better storage and retrieval of data; Increased management knowledge and prioritization of management actions.
NHPA Section 106
Establish a program for managing existing mitigation obligations
Streamlining Section 106 compliance would decrease compliance cost and decrease staff time requirements
Pursue a programmatic agreement with individual states regarding compliance for repetitive actions
Strengthen Partnerships (and positive public perception of TVA stewardship)
Streamlining Section 106 compliance would decrease compliance cost and decrease staff time requirements

Economic Benefits of the Tennessee Valley Authority’s Natural Resource Plan
xxii Executive Summary Cardno ENTRIX January 2011
Management Activity / Goal Management Knowledge and Data Partnerships & Public Image
Cost Savings
Develop emergency procedures for requirements under NHPA Section 106
Streamlining Section 106 compliance would decrease compliance cost and decrease staff time requirements
Water Resource Management
All Activities / Goals
Improved management knowledge that can translate into increased protection of resources and data sharing with partners.
Positive perception from actions to improve water quality, water conservation, and shoreline stabilization.
Water Resource Improvement Programs
Data Sharing Strengthen Partnerships (and positive public perception of TVA stewardship)
Strong partnerships and collaboration with partner agencies can increase communication to streamline compliance and save cost to TVA
Partnership Programs
Maintain existing relationships, partnerships, and/or third party agreements
Strengthen Partnerships (and positive public perception of TVA stewardship)
Strong partnerships and collaboration with partner agencies can increase communication to streamline compliance and save cost to TVA
Develop new/enhance existing relationships, partnerships, and/or third party agreements
Strengthen Partnerships (and positive public perception of TVA stewardship)
Strong partnerships and collaboration with partner agencies can increase communication to streamline compliance and save cost to TVA
Case studies / research projects implemented and exported
Strengthen Partnerships (and positive public perception of TVA stewardship)
Strong partnerships and collaboration with partner agencies can increase communication to streamline compliance and save cost to TVA

January 2011 Cardno ENTRIX Introduction 1-1
Chapter 1 Introduction In 2008 the Board of Directors of the Tennessee Valley Authority (TVA) approved the TVA Environmental Policy. The Environmental Policy establishes principles to lead TVA successfully in three areas: provide reliable and affordable power to the Tennessee River Valley (Valley), reduce environmental impact and engage in proactive environmental stewardship in a balanced and ecological sound manner, and support sustainable economic growth in the Valley. The Natural Resource Plan (NRP) represents TVA’s planning process for Environmental Policy goals not closely tied to energy production and use. Specifically, the NRP systematically addresses stewardship on the 293,000 acres of TVA-managed lands in four resource areas: recreation; water resources; cultural resources; and biological resources. The general goal of the NRP is to integrate the objectives of these resource areas, provide for the optimum public benefit, and balance competing and sometimes conflicting resource uses.
The NRP includes over 180 categories of management goals and activities in the four resource areas. The NRP also identifies four management options representing different levels of investment in each category of management goal and activity, resulting in over 1,000 total implementation levels of management activity/goals. Appendices B and C provide the complete set of NRP management goals and activities by management action for each resource area. TVA is currently completing an Environmental Impact Statement (EIS) to evaluate the four NRP management options. In accordance with their goal of providing for optimum public benefits, TVA contracted with Cardno ENTRIX to conduct a benefits analysis of the NRP programs.
1.1 Purpose and Scope of the Analysis TVA desires an understanding of the benefits from each type of goal/activity in each management option in order to prioritize stewardship actions and develop a preferred alternative for the EIS. This analysis identifies and, to the extent feasible, quantifies the economic benefits of the NRP programs based on available information. These benefits stem from resource management and enhancement, and accrue to the public through visits to TVA lands, enhanced perception and knowledge of TVA-managed resources, and cost savings to TVA and its rate payers. In addition to providing economic value to recreationists and others, many NRP programs also contribute to economic development in the Tennessee Valley. While these economic development effects are important, they are beyond the scope of this analysis.2 This study focuses solely on the economic benefits of the NRP, including benefits to visitors and others associated with the quality and quantity of resources on TVA-managed lands.
The NRP programs provide numerous and varied benefits over a broad geographic area. The geographic scope of the NRP for cultural, biological, and recreation resources is the 293,000 2 Economic development effects are often distributional effects that represent a transfer of economic activity from
one region to another, and are therefore a different type of effect from the economic benefits analyzed in this study.

Economic Benefits of the Tennessee Valley Authority’s Natural Resource Plan
1-2 Introduction Cardno ENTRIX January 2011
acres of TVA-managed reservoir lands, while the geographic scope for water resources is the Tennessee River watershed. This analysis assumes that the economic benefits primarily accrue to residents of and visitors to the TVA region. Furthermore, the scope of the analysis includes all of the primary economic and social benefits of the NRP programs and provides a range of broadly applicable values using existing valuation studies.
1.2 Report Organization Following an overview of methodology and data sources in the next chapter, the following five chapters in this document present the results and detailed supporting information for each of the six benefit categories defined for this analysis. Chapter 3 presents the data and methodology used to develop recreation and visitor use benefits; Chapter 4, cultural resource preservation benefits; Chapter 5, species and habitat conservation benefits; Chapter 6, water resource benefits; and Chapter 7, benefits related to increased management data and knowledge, cost savings to TVA, and enhanced public perception and partnerships. Chapter 8 provides cited references. Appendix A provides additional explanation regarding the distinction between economic benefit and economic development or impact analysis, while Appendix B and Appendix C contain the detailed tables of benefits by management option for each resource area.

January 2011 Cardno ENTRIX Methodology and Data Sources 2-1
Chapter 2 Methodology and Data Sources The NRP includes nearly 180 management goals or stewardship activities, including 33 goals or activities in cultural resources, 91 in biological resources, 33 in recreation resources, and 22 in water resources. Many of these goals or stewardship actions provide multiple benefits, resulting in a large set of benefits. To streamline the analysis, we collaborated with the TVA resource specialists and developed six benefit categories.
Following an overview of the categories of benefits analyzed in this study, this chapter outlines the methodology and data sources used to quantify benefits. The analysis relied solely on existing studies, no original valuation studies or surveys were conducted. Cardno ENTRIX drew from existing valuation literature and applied these existing values to the NRP programs in accordance with the characteristics of the Tennessee Valley region and the expected effects of NRP goals and stewardship activities (a methodology known as benefits transfer). To understand the effects of the NRP programs in terms that have economic relevance, ENTRIX worked closely with TVA resource specialists to understand and quantify where possible the outcomes of NRP programs in terms of resource quality or quantity changes. This process is described in further detail below.
2.1 Overview of Benefits Benefits of the NRP programs were organized into six categories. These categories are defined in Table 2-1. Four of the benefit categories correspond to the resource management areas in the NRP: recreation, cultural, biological, and water resources. The remaining two categories are benefits to the public and TVA of increased management data and knowledge and enhanced partnerships and public perception.

Economic Benefits of the Tennessee Valley Authority’s Natural Resource Plan
2-2 Methodology and Data Sources Cardno ENTRIX January 2011
Table 2-1 Benefit Category Definitions Benefit Category Definition
Recreation/ Visitor Use Benefit Benefits to recreationists/visitors of experiences on TVA-managed lands. Value represents user benefits related to the number and quality of recreation resources on TVA lands, including developed facilities, dispersed recreation areas, and biological and cultural resources enjoyed by recreationists.
Cultural Resource Preservation Cultural resource benefit of preventing degradation of cultural resources, including structures, buildings, and archaeological sites. These benefits may accrue from cultural resource management programs, or from such programs as shoreline stabilization, not including direct recreation/visitor use benefits such as development of museums (where separable, included under recreation/visitor benefit).
Species/ Habitat Conservation and Abundance
Biological resource benefit of enhancing or preventing degradation of biological resources, including both species and habitat, not including related recreation benefit (where separable, included under recreation/visitor benefit).
Water Resource Benefit Direct benefits of water resource management related to the provisioning of water supplies and stabilization of shoreline areas. These benefits primarily stem from improved water quality, reduced erosion, and water conservation.
Management Data and Scientific Knowledge/ Reduce Compliance Costs
Benefits related to increased knowledge or data availability to TVA resource managers that will enable more informed management decisions regarding resource enhancement or conservation, and benefit to TVA associated with reduced compliance or resource management costs.
Public Perception, Partnerships, Outreach
Benefit of increased public knowledge regarding the use or conservation of cultural, biological, recreation, and water resources; benefits associated with developing partnerships with local and regional entities; and benefits related to enhanced public perception, including perception related to recreation, resource stewardship, and public outreach.
The benefits in Table 2-1 can be further categorized based on whether they provide use or non-use values. Use benefits are generally associated with people’s present use of the resource, while non-use (or passive use) benefits do not require present use and, instead, are simply derived through the knowledge that the resource exists and is protected. Most of the benefits from the NRP are use benefits. There are there are potential non-use benefits provided by the NRP, particularly associated with cultural and biological resources; however, these are difficult to reliably measure.
2.1.1 Management Options Benefits are estimated for each of the four management options considered for the NRP: Custodial Management, Current Management, Enhanced Management, and Flagship Management. Benefits are estimated on a per unit basis, for example, per trail mile per year. The management options generally differ in how many units are provided, such as how many trail miles are developed each year. To estimate benefits for each management option, the benefits on a per unit basis are simply scaled based on the number of units provided under each management option.
For activities for which we quantified benefits in dollar terms, values represent the expected value of implementing a given activity/goal at the level specified in the management option. For example, in the dispersed recreation management program, the value of the activity/goal of “Add __ trail miles per year in accordance with Dispersed Recreation multi-year plans” is based on 20 miles of new trail under the Flagship Management Option (estimated value of $3.0 million to $4.3 million per year), while it is valued for 10 miles of new trail under Enhanced Management option (estimated value of $1.5 million to $2.2 million per year).
2.1.2 Baseline and Timeframe To estimate benefits, it is necessary to establish a baseline condition against which outcomes are compared and benefits defined. Often the baseline condition is defined as current conditions.

Economic Benefits of the Tennessee Valley Authority’s Natural Resource Plan
January 2011 Cardno ENTRIX Methodology and Data Sources 2-3
However, one of the NRP management options is current management, and we also want to estimate the benefits of this level of management. Therefore, this analysis defines the baseline condition as no management. So for example, there are eight campgrounds currently managed by TVA on dam or power plant reservations. The baseline condition for this analysis assumes that there are no campgrounds managed by TVA, so that the benefit of the current management option is the value provided by the eight campgrounds.
Regarding the timeframe of the analysis, we estimated benefits for a one-year time period based on expected effects of full NRP program implementation. Benefits are estimated based on current population, and are not increased through time to account for additional benefit stemming from population growth and related increased resource use. Most NRP program goals and activities result in constant benefits each year into the future, but some grow cumulatively over time. For example, the goal to develop one mile of trail every year will result in one additional mile of trail in year one, but two additional miles of trail in year two. Annual benefits of such management activities will thus increase every year. For such management activities, the benefits per unit, such as per mile of trail per year, are provided.
2.1.3 Quantitative/Qualitative Nature and Certainty of Estimated Benefits Benefits are quantified to the extent possible, but are expressed qualitatively where necessary. Economic value from resource management is generated when there is a change in a resource quality or quantity that people value. For many of the NRP activities, there is no known change in resource quality or quantity to value (e.g., the acres of habitat improved or the reduced number of archaeological sites damaged is not known). For these activities, data is provided regarding the number of people who may particularly benefit by NRP management of the resource, along with information on potential economic value on a per unit basis as available (e.g., the average value per habitat acre improved when acreage is unknown). For many NRP stewardship activities, it is not feasible to quantify benefits, even though they may be valuable to the public.
We estimate values for NRP benefits using existing literature, matching literature values to the extent possible with the type of benefits specifically generated by NRP activities. As the values represent average values, and can vary widely based on such factors as baseline conditions and the degree of improvement or change due to the NRP programs, there is uncertainty regarding the actual value of NRP programs. Acknowledging this uncertainty, we present a range of average, broadly applicable values of the types of benefits provided by NRP programs.
2.2 Measuring Economic Benefit The NRP activities and goals will generate economic benefits if they increase individual well-being, or “utility”. The following discussion provides a brief conceptual overview of the process for measuring an increase in well-being due to the consumption of a good or service. In the case of the NRP, the relevant goods or services being evaluated are related to resource quantity or quality on TVA lands. Valuing resources on TVA lands requires several steps, each of which can be challenging.
Figure 2-1 displays the three step process to assess the NRP programs and ultimately assess their value. First, the NRP program under study must be assessed to identify the change in the resource. For example, the change in water quality (concentration of pollutant) from the Targeted Reservoir Initiative Program must be identified. The second step is to identify the resulting change in the economically relevant good or service, such as the change in water clarity or fish abundance. Finally,

Economic Benefits of the Tennessee Valley Authority’s Natural Resource Plan
2-4 Methodology and Data Sources Cardno ENTRIX January 2011
the third step is to estimate the value to society of the change in goods or services, such as the value of the change in water clarity to recreationists and nearby residents.
Figure 2-1: Steps in NRP Activity / Goal Valuation
The economic value of goods or services, such as improved water quality, is the increase in well-being that consumers derive from the good or service. This value is the difference between the price consumers actually pay for the good or service, and the total benefit they derive from it (which is measured as the maximum price they would be willing to pay for the good or service, and commonly referred to as willingness-to-pay or WTP). For example, if a recreationist is willing to pay $100 for a hunting trip on TVA lands, but only has to pay $75 (in travel and other costs), then the recreationist has a net benefit, or increase in well-being, from the trip equal to $25. In the case of the NRP, net benefits will increase if the NRP increases the quantity or quality of resources on TVA lands due to the NRP (than would otherwise occur in the absence of NRP). For example, the NRP may provide net benefits by improving habitat quality which increases the quality of goods and services provided by the habitat, such as hunting and fishing trips. Increased investment in public education and scientific knowledge by the NRP can provide net benefits by changing personal preferences. If personal preferences change, such that public perception and enjoyment of environmental attributes increases for a given level of resource quality/quantity, the NRP will also increase well-being for environmental attributes even without changes in resource quality/quantity.
Assess NRP Programs
(e.g., Targeted Reservoir Initiative)
Quantify Resource Change
(e.g., Change in Water Quality)
Ecological, Recreation, or Cultural
Economic Valuation
Step 1
Step 2
Estimate Resource Values (e.g., Value of Water Quality Improvement)
Step 3

Economic Benefits of the Tennessee Valley Authority’s Natural Resource Plan
January 2011 Cardno ENTRIX Methodology and Data Sources 2-5
2.2.1 Valuation Methods To quantify the benefits of the NRP programs, this analysis relied solely on existing data and valuation studies; no new valuation studies or surveys were conducted. Cardno ENTRIX drew from existing valuation literature and applied these existing values to the NRP programs in accordance with the characteristics of the Tennessee Valley region and the expected effects of NRP stewardship activities. Applying the results of existing economic resource valuation studies to a new policy context, such as to the NRP programs, is called benefits transfer. The key to ensuring a successful benefit transfer is to carefully assess the soundness and similarity of studies selected for benefits transfer. To be considered sound, a study should have high-quality data collection procedures, adhere to best practices for empirical methodology, and be consistent with economic theory. Further, the study should provide enough information about the research to fully evaluate the data, modeling, and results. Similarity refers to how closely the context of the proposed transfer study resembles the “new” context (current study). Some aspects of similarity include the environmental goods being analyzed, the baseline level of environmental quality, the magnitude of change in environmental quality, the socio-economic characteristics of the affected population, and the property rights, culture, and institutional settings of the affected population.
The existing valuation studies used in this analysis rely on different methods to value resources. The appropriateness of using any technique varies with the type of resource being valued, the potential magnitude of the service in a particular case study, and the available, relevant data. The most reliable approach for estimating WTP or benefit is to infer it from the market price. However, many natural and cultural resources do not have a market price from which to infer value. Even for natural resource benefits such as carbon sequestration for which there are developing markets, the market price seldom represents the total economic value.3
While there are no direct markets for exchanging and pricing many cultural and natural resources, market values can often be used to infer value using non-market valuation methods. The replacement cost and avoided cost methods value non-market goods and services based on the costs of equivalent replacement resources (such as engineering water purification) or the costs of impacts avoided (such as flood damage) due to the resource. An example of replacement costs is to consider a forest that provides water purification services to a downstream community. Using the replacement costs to value the forest sets a minimum value of the forest equal to the costs of providing the same water purification services through such means as building a water treatment facility or constructed wetlands. An important caveat is that the replacement costs must reflect services that are actually valued and would otherwise be paid for without the resource. For example, it would be inappropriate to value the water in an aquifer that is not being used as a potable water supply at the price of bottled water. The water is not being used for that service and consumers would likely not be willing (or able) to pay the commercial price of bottled water to replace all current household water use. An example of avoided costs is the healthcare expenditures that would not occur (but otherwise would have) as a result of improvements in air quality due to vegetation.
3 For example the willingness to pay for a ton of carbon, used to mitigate for carbon emissions, is tied closely to the
cost of developing a carbon offset project and the value to the carbon credit purchaser of emitting on additional ton of carbon. While the cost of developing a carbon offset and the value of emitting more carbon will vary from project to project, the value provided to society, the public value, for the ecosystem services provided by carbon sequestration will not vary based on such factors. Therefore the private willingness to pay is an indicator but not a measure of total societal value.

Economic Benefits of the Tennessee Valley Authority’s Natural Resource Plan
2-6 Methodology and Data Sources Cardno ENTRIX January 2011
The value of outdoor recreation and environmental quality are often estimated using the travel cost method is most commonly used to estimate the value of outdoor recreation and environmental quality, such as boating, hunting, fishing, and wildlife viewing. This method infers the value people place on a resource by the amount of money they are willing to pay to travel to use the resource. For example, while many hiking trails do not charge an admission price that fully reflects the cost of providing the trail, the distance people must travel effectively acts as an admission price. The cost of traveling can be used to estimate willingness to pay. Many of the estimated NRP recreation benefits are based on values drawn from existing travel cost studies.
Recreational and aesthetic values are also estimated through hedonic methods. For example, hedonic property value models analyze property values to tease out the contribution of environmental attributes to the sale price of a home. The model includes a wide variety of properties in an area, which sell for different prices based on traditional home attributes, like square footage, and environmental attributes, such as proximity to local parks and open space. A statistical model can measure the contribution of each attribute to sales price. This technique has been used extensively to estimate the value of open space for residential areas based on the extent that property values increase in locations near green infrastructure and open space. For this reason, this analysis used values derived from hedonic studies to estimate benefits of the NRP goal of developing greenways.
The final approach for estimating non-market values is to use stated preference methods. Stated preference methods directly ask consumers how much they are willing to pay for a particular resource or resource change. It is typically used when there are no other valuation methods that can be used to infer total value based on prices or costs. For example, the methods described above are difficult to use to estimate the value of protecting endangered species habitat. The obvious drawback with stated preference methods is that they represent hypothetical purchases, not real ones, and may be biased. Issues in Applying Valuation Methods to Specific Case Studies
The economic value of the natural resources provided by a site depends on a number of factors. Several of these factors are discussed below, including location of the natural area, the relative abundance or rarity of the resources in the natural area, and also the temporal and cultural context. Studies relied upon to estimate benefits of the NRP were selected based on these factors, as well as how recently the studies were completed and the proximity of the study location to the TVA region.
2.2.1.1 Location The goods and services provided by a resource and its associated value differ by location, so it is important to recognize potential variation in value due to differing locations. First, the level of goods and services provided by the same resource can differ based on location-specific structural and physical attributes. Second, the value of the resource also typically differs by location, depending on the human activity and population in the area. Take, for example, the value of water purification services of a wetland. If a wetland captures polluted runoff and improves the quality of water entering a river that is often used for recreation or drinking water, then the water purification service of the wetland may have significant economic value. This potentially high value stems from the enhanced opportunity to provide water regulation functions due to concentrated pollutants in the runoff, and from the nearby presence of a water body in which water quality has particular economic value. In contrast, a wetland located in a natural area that is not exposed to polluted runoff (and thus will not remove the same level of pollutants) and is not adjacent to a water body of economic concern, would have lower water purification value.

Economic Benefits of the Tennessee Valley Authority’s Natural Resource Plan
January 2011 Cardno ENTRIX Methodology and Data Sources 2-7
2.2.1.2 Abundance Similar to most economic goods and services, the value of a resource usually depends on its abundance. If a good or service is very abundant, the value of each unit is typically less than the value would be if the good or service is relatively scarce. This idea of scarcity is related to the concept of marginal value of a good or service, or the value of one more unit, compared to the average value. Typically, the more we have of a good or service, the less we value each additional unit. Consider the value of water use in the home. The value of the first few gallons used for drinking and basic cleaning activities is very high, while the marginal value of the last gallon consumed for watering the lawn or washing the car has much lower value. This pattern of declining marginal value is often applicable for both use and non-use values. For example, the recreation use value of a particular natural area is lower if there are many substitute natural areas nearby. Likewise, people tend to hold higher non-use existence values for conservation of endangered species than conservation of species that are not threatened.
2.2.1.3 Temporal and Cultural Context Economic value is estimated based on the preferences of individuals, with total societal value being the aggregation of individual values. As individual preferences and willingness to trade one good or service for another can change through time and also can vary by culture, value is defined relative to a particular time and place. For example, in earlier centuries, American attitudes and perceptions of natural habitat and wildlife species were quite different than they are now. This is a reflection not only of the change in abundance of habitat, but also a changing perception and awareness by the public of the benefits of these natural systems. In addition to the temporal context, cultural differences also play a role in the value placed by individuals on different ecological goods and services.


January 2011 Cardno ENTRIX Recreation/Visitor Benefit Estimation 3-1
Chapter 3 Recreation/Visitor Benefit Estimation This section summarizes the results and methods for estimating the recreation benefits of NRP management options. Recreation and visitor use benefits are generated by the recreation management programs (campground management, day use area management, recreation assessment and design tools, and public outreach). Recreation benefits are also generated by enhancements to the recreation environment that are expected to result from water, biological, and cultural resource management programs. Together, these NRP programs provide four types of benefit to recreators, each of which could increase the number of recreators and/or the value of the recreation experience:
3. Quantity of recreation / visitor facilities (increased opportunities for visitors),
4. Quality of recreation / visitor facilities,
5. Quality of recreation environment (including improvements to or protection of biological and cultural resources), and
6. Availability of information and education to recreators.
The value to recreators of NRP programs is based on the number of recreation participants and the value of the recreation experience to each participant. For example, we estimate the value of a day use area as the number of days that people recreate at the area, multiplied by the average daily value to each recreator. Thus, recreation value from the NPR can result from either an increase in the number of recreators (usually due to an increase in the availability of recreation opportunities) or in increase in the value of the experience to the recreator. The recreation values presented in this chapter represent this ‘net benefit’ to the recreator.
In general, this analysis assumes that a change in the quantity of recreation facilities results in a change in the number of recreation participants, while a change in the quality of facilities or the recreation environment results in a change in the value of the recreation experience. These values are quantified to the extent possible based on available data on recreation participation in the TVA region as well as the value of recreation experiences similar to those provided on TVA lands.
The value of information and education provided to recreators through public outreach programs is not quantified because of insufficient information about the number of people reached and the value of this information. In the absence of such information, we provide the available data on the number of people who access TVA recreation-related information and are interested in outdoor education. Similarly, the value of recreation assessment and design tools is generally not quantified as information is not available at this time regarding the effect of these programs on the quality and quantity of recreation opportunities offered on TVA lands.

Economic Benefits of the Tennessee Valley Authority’s Natural Resource Plan
3-2 Recreation / Visitor Benefit Estimation Cardno ENTRIX January 2011
This chapter is organized in three parts. Section 3.1 summarizes the recreation benefits estimated in this analysis, based on the estimated participation in recreation opportunities on TVA lands and the average value of these experiences. Section 3.2 presents the data and methodology used to estimate participation, while Section 3.3 presents the economic source literature for the value to recreationists.
3.1 Summary of Estimated Recreation/Visitor Benefits Table 3-1 summarizes the estimated visitor and recreation values generated by the NRP programs, with detail provided on the estimated number of recreation participants and the estimated range of value per participant. There is uncertainty in both the estimates of participation and the estimates of value per participant. Although some actual visitation data is available for TVA developed recreation facilities (i.e., campgrounds and day use facilities), for estimates of dispersed recreation activities (all activities occurring elsewhere on TVA lands, such as hiking or primitive camping or recreating at stream access sites), we relied on participation data from nearby Army Corps of Engineer Reservoirs, National Forests, and National Wildlife Refuges and assumed that use patterns are similar on TVA-managed lands. Visitor participation is defined in both person trips (the number of discrete recreation visits by individuals to TVA-managed lands, regardless of duration of the visit) and in person days (the number of days spent recreating by individuals on TVA-managed lands).
Recreational per unit values were collected from various literature sources and applied to estimates of participation for the NRP program area. To the extent possible we have matched literature values with the type of benefits specifically generated by NRP activities. As the values represent average values, and can vary widely based on the specific quality of a recreation opportunity and available substitutes, there is uncertainty regarding the actual value to recreationists of NRP programs. Acknowledging this uncertainty, we present a range of average, broadly applicable values to participants of the types of benefits provided by NRP programs.
Table 3-1 Summary of Recreation Values
Management Activity / Goal Current Annual Recreation Participation Value / Participation Annual Value of Activity / Goal
Recreation Management
Campground Management
Developed Campground 19,500 Average camping person days per TVA
campground
$9 - $30 / Day $180,000 - $590,000 per Campground
ADAAG Campsites 285 Average increased camping person days per
ADAAG campsite
$9 - $30 / Day $2,500 - $8,500 per ADAAG Site
Day Use Area Management
Developed Day Use Area 11,700 Average Person Days per TVA Day Use Area
$12 - $40 / Day $140,000 to $470,000 per Day Use Area
ADAAG Day Use Area 1,750 Average Existing Day Use Area Visits May Benefit
Unknown change in value to users or
change in number of users.
Unknown

Economic Benefits of the Tennessee Valley Authority’s Natural Resource Plan
January 2011 Cardno ENTRIX Recreation/Visitor Benefit Estimation 3-3
Management Activity / Goal Current Annual Recreation Participation Value / Participation Annual Value of Activity / Goal
Stream Access Site 440 Average Person Trips Per Stream Access Site
$10 - $27 / Trip $4,000 - $12,000 per Stream Access Site
Blue-Way 150 Average additional Person Trips Per Stream Mile
$10 - $27 / Trip $1,500 - $4,000 per Blue-way Mile
Greenway 70 to 90 Households Within One Square Mile of One
Greenway Mile
$170 - $215 Household
$10,000 - $20,000 per Greenway Mile
Recreation Assessment and Design Tools
All Assessment/Design Tools 6,000,000 Dispersed Recreation Visits on 293,000 Acres
156,000
Camping Person Days at 8 campgrounds
735,000 Day Use Visits at 63 TVA Day Use Areas
Unknown Unknown
Expansion of new campgrounds 19,500 Average camping person days per TVA campground
$9 - $30 / Day $180,000 - $590,000 per Campground
Update recreation inventory for TVA-managed reservoirs
186,000 Person trips to each TVA reservoir
Unknown Unknown
Public Outreach
Clean and Green Campground Initiative
19,500 Average camping person days per TVA campground
Maintain existing Internet presence and strive to enhance
300,000 Visits to TVA Recreation Web Pages
Unknown Unknown
Develop and implement new Resource Ranger program
Unknown $20 / Volunteer Hour
Unknown
2,600,000 Visitors to a Nature Center by TVA Region
Residents
$5 - $10 / Nature Center Visit
Unknown
Biological Resource Management
Dispersed Recreation Management
Dispersed Recreation Area Improvement
6,000 Average Trips Per Recreation Area
$0-$15 / Trip $0 - $90,000 per Site Improved
General Dispersed Recreation 20 Average Trips Per Acre of TVA Managed Lands
$10 - $30 / Trip for Improved Quality
$200 - $600 per Acre of TVA Land
Hiking 16,700 Average Hiking Person Trips Per Mile of Trail
$9 - $13 / Trip $150,000 - $215,000 per Trail Mile
Terrestrial Habitat Management
Dewatering Sites Recreation 20 Average Person Trips per Dewatering Site Acre
$10 - $30 / Trip $200 - $600 per Dewatering Site Acre

Economic Benefits of the Tennessee Valley Authority’s Natural Resource Plan
3-4 Recreation / Visitor Benefit Estimation Cardno ENTRIX January 2011
Management Activity / Goal Current Annual Recreation Participation Value / Participation Annual Value of Activity / Goal
Agricultural and Open Lands Management
20 Average Person Trips Per Acre of TVA Managed
Lands
$3 - $30 /Acre of Habitat Improvement
$3 - $30 Per Acre of Habitat
Improvement
Forest Resource Management
All Forest Resource Management Programs
20 Trips per acre of TVA-managed lands
$10 - $30 / Trip $200 - $600 per Acre of TVA forest land
Wildlife Habitat Council – Third Party Certifications
$3 - $30 / Acre of Habitat Improvement
$3 - $30 / Acre
Sensitive Biological Resource Management
Migratory Birds Management 110,000 Migratory bird hunters in TVA region
2.0 million
People view birds in TVA region
20 Average person trips per acre of TVA-managed
lands
$3 - $30 /Acre of Habitat Improvement
$3 - $30 Per Acre of Habitat
Improvement
Endangered and Threatened Species Program
20 Average Person Trips Per Acre of TVA Managed
Lands
$3 - $30 /Acre of Habitat Improvement
$3 - $30 Per Acre of Habitat
Improvement
Natural Areas Program 20 Average Person Trips Per Acre of TVA Managed
Lands
$3 - $30 /Acre of Habitat Improvement
$3 - $30 Per Acre of Habitat
Improvement
Public Outreach
All Biological Resources Outreach 6,000,000 Dispersed Recreation Visits on 293,000 Acres
156,000
Camping Person Days at 8 campgrounds
735,000 Day Use Visits at 63 TVA Day Use Areas
Unknown Unknown
Develop and implement new environmental education program (museum and program)
52,850 Average visits per nature center nationwide
3 million
Residents in TVA region visit nature centers annually
$5 - $10 / Nature Center Visit
$250,000 - $500,000 per nature center annually
Cultural Resources Management
Public Outreach
All Cultural Resources Outreach 2,300,000 Residents in TVA region visit historic sites
annually
7,000 Visits to TVA cultural resource web pages annually
Unknown Unknown

Economic Benefits of the Tennessee Valley Authority’s Natural Resource Plan
January 2011 Cardno ENTRIX Recreation/Visitor Benefit Estimation 3-5
Management Activity / Goal Current Annual Recreation Participation Value / Participation Annual Value of Activity / Goal
History Museum 10,700 Average visits per museum nationwide
$19-$30 / Visit $200,000 - $320,000 per Museum
3.2 Recreation Participation Estimates (Estimated Number of Beneficiaries) Estimates for recreation participation were obtained from various sources including TVA studies and existing data on visitation to TVA sites. Actual visitation data on TVA lands is limited to reservoir visitation surveys conducted by the University of Tennessee and TVA campground occupancy made up the bulk of visitation information used for developed day use and campground facilities. To supplement this data, we relied extensively on a 2006 report prepared by the Southern Research Station of the US Forest Services that estimated recreation participation and trends in the TVA region and also provided population estimates for the 125-county TVA region.4 As noted above, for dispersed recreation activities, we also relied on data from public recreation lands managed by other entities and assumed similar use patterns on TVA-managed lands. Finally, the U.S. Census Bureau is the source of general population statistics.
Detailed information on the source data and methodology to estimate the participation data in Table 3-1 is provided below.
3.2.1 Developed Facilities Developed facilities include both TVA-managed campgrounds and day use areas. Estimates of total recreation use at these facilities as well as potential use by disabled recreators are discussed below.
3.2.1.1 TVA Campground TVA provided data on 2009 occupancy in TVA campgrounds.5 This data indicates that the average TVA campground has 6,500 nights of site occupancy per year (an occupancy rate of 50 percent). As the value of camping is on a per person per day basis, it was also necessary to determine the average length of stay and the number of people per site to estimate the number of total person days of camping for every night of site occupancy. Data from visitor use surveys in the Cherokee National Forest6 shows that the average duration of overnight trip in developed areas is 49.5 hours, which means the average trip length is two nights.. Assuming that, on average, there are two people in each campsite7, there are an estimated 19,500 camping person-
4 Green, G. T., K. Cordell, H. Fleming and C. Betz. 2006. A Report Submitted to the Tennessee Valley Authority,
By the Outdoor Recreation & Wilderness Assessment Group, Southern Research Station, USDA Forest Service, Athens, Georgia.
5 Personal communication with Jerry Fouse, TVA Recreation Resource Specialist, October 2010. 6 U.S. Forest Service, 2009, National Visitor Use Monitoring Results, Data Collected FY2007, Cherokee National
Forest, accessed online at http://www.fs.fed.us/recreation/programs/nvum/2009/Cherokee_FY2007.pdf. 7 Results from the Cherokee National Forest National Visitor Use Monitoring survey indicate that the average
group size was 4.7 people, but this includes both overnight and day users.

Economic Benefits of the Tennessee Valley Authority’s Natural Resource Plan
3-6 Recreation / Visitor Benefit Estimation Cardno ENTRIX January 2011
days in each TVA campground (6,500 nights of occupancy, multiplied by 1.5 to account for three days camping for every two nights occupancy, multiplied by two people per site).
3.2.1.2 TVA Day Use Areas The number of annual visits to TVA day use facilities is estimated from day use data collected at a sample of TVA reservoirs by the University of Tennessee.8 This data includes total annual day use visitation estimates on nine reservoirs: Douglas, Fort Loudoun, Kentucky, Melton Hill, Mountain Group, Nickajack, Norriss, and Wheeler. We assume that visitation at these reservoirs is similar to visitation at other reservoirs, and use this data to calculate 186,000 average annual visitation per reservoir. Based on 47 TVA reservoirs, this method estimates 8.7 million day use recreators on all reservoirs, including visitors that use TVA facilities and those that use other facilities. To estimate the benefits of TVA day use facilities, we estimate the proportion of day use visits at TVA facilities based on the proportion of boat ramps at TVA day use facilities relative to the total number of boat ramps on TVA reservoirs, or eight percent. Thus, an estimated 735,000 people use the 63 day use facilities on TVA-managed lands, for an average of 11,700 people at each TVA day use facility.
3.2.2 Developed Facilities and American with Disabilities Act Accessibility Guidelines (ADAAG)
We estimated the number of potential beneficiaries of ADAAG compliant recreation facilities as the population in the TVA that is non-institutionalized disabled. According to the U.S. Census Bureau, in 2009 approximately 15 percent of the population in Tennessee was classified as non-institutionalized disabled.9 Based on a population in the TVA 125-county region of approximately 6.5 million people, we estimate that there are approximately 1.5 million non-institutionalized disabled people.
3.2.2.1 ADAAG and TVA Campgrounds TVA resource specialists estimate that occupancy at ADAAG campground sites is approximately 90 percent during the eight month camping season, for an average occupancy of 215 nights per site.10 Compared to the current average occupancy at existing (non-ADAAG) sites of
8 Schexnayder, S., B. Stephens, et al. (2009). Recreation Use on Nickajack Reservoir. Knoxville, University of
Tennessee Agriculture Institute: 39; Schexnayder, S., B. Stephens, et al. (2009). Recreation Use on Wheeler Reservoir. Knoxville, University of Tennessee Agriculture Institute: 41; Stephens, B., L. Didier, et al. (2006). Recreation Use on Fort Loudoun Reservoir. Knoxville, University of Tennessee Agriculture Institute: 16; Stephens, B., L. Didier, et al. (2006). Recreation Use on Douglas Reservoir. Knoxville, University of Tennessee Agriculture Institute: 18; Stephens, B., L. Didier, et al. (2006). Recreation Use on Kentucky Reservoir. Knoxville, University of Tennessee Agriculture Institute: 17; Stephens, B., L. Didier, et al. (2006). Recreation Use on Melton Hill Reservoir. Knoxville, University of Tennessee Agriculture Institute: 17; Stephens, B., L. Didier, et al. (2006). Recreation Use on Mountain Group Reservoir. Knoxville, University of Tennessee Agriculture Institute: 17; Stephens, B., L. Didier, et al. (2006). Recreation Use on Norris Reservoir. Knoxville, University of Tennessee Agriculture Institute: 17.
9 U.S. Census Bureau (2009). "American FactFinder American Community Survey." Retrieved October 2010, from http://www.factfinder.census.gov/servlet/ADPTable?-geo_id=04000US47&-qr_name=ACS_2009_1YR_G00_DP2&-ds_name=ACS_2009_1YR_G00_
10 Personal communication with Jerry Fouse, TVA Recreation Specialist, November, 2010.
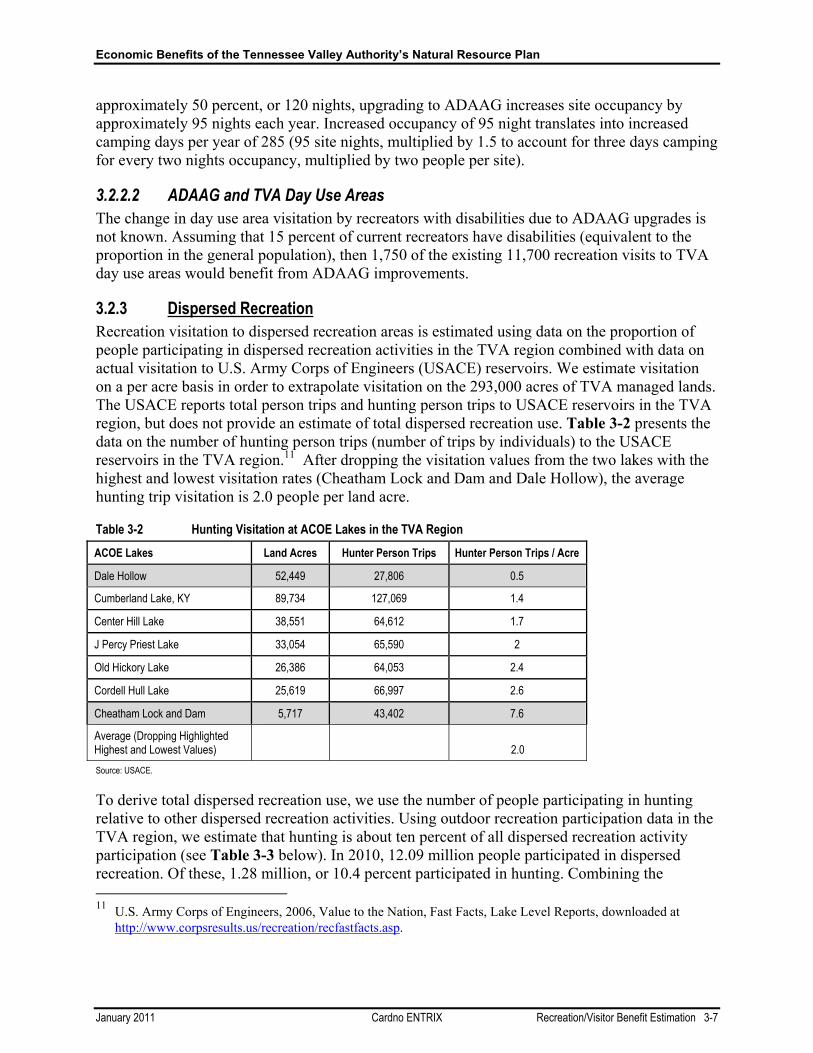
Economic Benefits of the Tennessee Valley Authority’s Natural Resource Plan
January 2011 Cardno ENTRIX Recreation/Visitor Benefit Estimation 3-7
approximately 50 percent, or 120 nights, upgrading to ADAAG increases site occupancy by approximately 95 nights each year. Increased occupancy of 95 night translates into increased camping days per year of 285 (95 site nights, multiplied by 1.5 to account for three days camping for every two nights occupancy, multiplied by two people per site).
3.2.2.2 ADAAG and TVA Day Use Areas The change in day use area visitation by recreators with disabilities due to ADAAG upgrades is not known. Assuming that 15 percent of current recreators have disabilities (equivalent to the proportion in the general population), then 1,750 of the existing 11,700 recreation visits to TVA day use areas would benefit from ADAAG improvements.
3.2.3 Dispersed Recreation Recreation visitation to dispersed recreation areas is estimated using data on the proportion of people participating in dispersed recreation activities in the TVA region combined with data on actual visitation to U.S. Army Corps of Engineers (USACE) reservoirs. We estimate visitation on a per acre basis in order to extrapolate visitation on the 293,000 acres of TVA managed lands. The USACE reports total person trips and hunting person trips to USACE reservoirs in the TVA region, but does not provide an estimate of total dispersed recreation use. Table 3-2 presents the data on the number of hunting person trips (number of trips by individuals) to the USACE reservoirs in the TVA region.11 After dropping the visitation values from the two lakes with the highest and lowest visitation rates (Cheatham Lock and Dam and Dale Hollow), the average hunting trip visitation is 2.0 people per land acre.
Table 3-2 Hunting Visitation at ACOE Lakes in the TVA Region ACOE Lakes Land Acres Hunter Person Trips Hunter Person Trips / Acre
Dale Hollow 52,449 27,806 0.5
Cumberland Lake, KY 89,734 127,069 1.4
Center Hill Lake 38,551 64,612 1.7
J Percy Priest Lake 33,054 65,590 2
Old Hickory Lake 26,386 64,053 2.4
Cordell Hull Lake 25,619 66,997 2.6
Cheatham Lock and Dam 5,717 43,402 7.6
Average (Dropping Highlighted Highest and Lowest Values) 2.0 Source: USACE.
To derive total dispersed recreation use, we use the number of people participating in hunting relative to other dispersed recreation activities. Using outdoor recreation participation data in the TVA region, we estimate that hunting is about ten percent of all dispersed recreation activity participation (see Table 3-3 below). In 2010, 12.09 million people participated in dispersed recreation. Of these, 1.28 million, or 10.4 percent participated in hunting. Combining the 11 U.S. Army Corps of Engineers, 2006, Value to the Nation, Fast Facts, Lake Level Reports, downloaded at
http://www.corpsresults.us/recreation/recfastfacts.asp.

Economic Benefits of the Tennessee Valley Authority’s Natural Resource Plan
3-8 Recreation / Visitor Benefit Estimation Cardno ENTRIX January 2011
estimated 2.0 hunting trips per acre with the estimate that 10 percent of USACE dispersed recreation trips are for hunting, results in an estimate of 20 total dispersed recreation trips per acre. Applying this value to the 293,000 acres of land managed by TVA yields an estimate of 6.0 million annual dispersed recreation visits to TVA lands.
Table 3-3 Dispersed Recreation Participation in the TVA Region
Dispersed Recreation Activities Participants in 2004, Millions (TVA
Region) Projected Participants in 2010, Millions (TVA
Region)12 Canoeing 0.351 0.50
Day Hiking 1.76 2.48
Migratory Bird Hunting 0.081 0.11
Kayaking 0.109 0.15
Rock climbing 0.199 0.27
Orienteering 0.057 0.08
Primitive Camping 0.844 1.12
Backpacking 0.441 0.58
Warmwater fishing 1.541 1.92
Swimming 1.779 2.02
View birds 1.565 1.96
Total Dispersed recreation 8.646 11.09
Big Game Hunting 0.484 0.52
Small Game hunting 0.508 0.65
Total Hunting 1.073 1.28
Total All Activities 9.719 12.09
Proportion Hunting of all Dispersed Recreation 11.0% 10.4% Source: Derived from Outdoor Recreation Trends in the TVA 125-County Region.
3.2.3.1 Dispersed Recreation Sites There are approximately 1,000 dispersed recreation sites on TVA managed lands. By assuming that the 6.0 million dispersed recreationists visit one dispersed recreation site on each visit, we estimate approximately 6,000 annual visits to each dispersed recreation site annually.
12 Using the trend data from 1995 to 2004 to project increased participation from 2004 to 2010, assuming that the
average annual percentage increase from the period 1995 to 2004 is the same in the period 2004 to 2010.

Economic Benefits of the Tennessee Valley Authority’s Natural Resource Plan
January 2011 Cardno ENTRIX Recreation/Visitor Benefit Estimation 3-9
3.2.3.2 Blue-ways and Stream Access Sites We estimate use of stream access sites based on creel survey data from the Duck River in South Central Tennessee and the participation rate of fishing relative to other stream access recreation activities. It is reasonable to view recreation on the Duck River as be representative of recreation use on other rivers with TVA-managed stream access sites.13 Tennessee Cooperative Fishery Research Unit conducted the Duck River Creel Survey in 1998 on a 150-mile reach of the Duck River and estimated there were 11,500 fishing days.14 In addition to anglers, there are also paddlers and other users recreating at stream access points. Data on recreation participation in the TVA region shows that 32.5 percent of the population participates in warmwater fishing, while 23.3 percent of the population participates in canoeing, kayaking, or rafting. Using these proportions (58 percent are fishing, and the remainder engage in other activities), we estimate that there are about 20,000 person day trips to stream access sites on the Duck River. There are 45 stream access points along the surveyed 150-mile reach for an average use of 440 annual day trips per stream access site.
3.2.3.3 Trails Recreation participation data in the TVA region shows that approximately 25 percent of people that participate in dispersed recreational activities hike, either as backpacking or as day hiking.15 Assuming that 25 percent of the 6.0 million dispersed recreation person visits on TVA lands are for hiking, we estimate 1.5 million person hiking visits. Based on 90 miles of trail on TVA lands, we estimate an average of approximately 16,700 annual hiking person visits per trail mile.
3.2.3.4 Greenways The number of people benefiting from greenways varies based on the location of the greenway. As TVA is considering a greenway that would connect Oak Ridge (Anderson County) and Lenoir City (Loudon County) along the Melton Hill Reservoir in Tennessee, this study uses this as an example site and assumes that benefits from a greenway in this area would be similar to benefits in other areas. The literature on greenways is predominately focused on the increased value to homes located proximate to greenways, so the number of people affected is estimated based on the number of households within one square mile of the greenway. According to the US Census Bureau, there are approximately 70 households per square mile in Loudon County, Tennessee and 90 households per square mile in Anderson County, Tennessee.
3.2.3.5 Museums and Cultural and Historical Site Visitation There is no specific data available on visitation to TVA lands related to cultural and historic resources; however other data provides reasonable estimates. While not specific to TVA lands,
13 Per personal communication with Jerry Fouse, TVA Recreation Management Specialist, October 2010. 14 Condo, B., and P.W. Bettoli. 2000. Survey of the recreational fishery in the Duck River. Fisheries Report 00-32,
Tennessee Wildlife Resources Agency, Nashville. Note: Condo and Bettoli provide estimates in pressure hours which were converted to annual trips by dividing hours by the mean trip length and expanding to the rest of the year.
15 As shown in Table 3.3, for 2010 2.48 million people participate in day hiking and 0.58 million participate in backpacking. Total dispersed recreation is 11.08 or 25 percent of the total.

Economic Benefits of the Tennessee Valley Authority’s Natural Resource Plan
3-10 Recreation / Visitor Benefit Estimation Cardno ENTRIX January 2011
there is data that indicates that approximately 2.3 million residents of the TVA 125-county region visit historic sites and 1.0 million residents visit archaeological sites.16 Participation rate for museums visits were collected from the 2006 report of Museum Financial Information by the American Association of Museums.17 The report indicates that the National median of history museum visits is 10,750 visits annually.
Similarly, there is no data available on the number of people who may participate in recreation outreach programs, but there is data that indicates that approximately 3.0 million people in the TVA region visit nature centers.18
3.2.3.6 Dewatering Sites Estimated visitation to dewatering sites is based on visitation data from the Wheeler National Wildlife Refuge. Annual estimated visits to t Wheeler National Wildlife Refuge is 18.6 person visits per acre (based on visitation of 65,000 people and 35,000 acres of land).19 Assuming the same level of visitation on the 106,000 acres in the five TVA dewatering projects provides an estimate of 2 million person visits annually.
3.3 Valuation Literature Per unit values are based on information from peer reviewed economic journals and publications The sections below provide data for activities and for quality improvements.
3.3.1 Value of Recreation Activities Table 3-6 summarizes the net benefits to recreationists of various recreation activities made possible by NPR programs. As several NRP programs are related to types of recreation locations, such as day use areas, dispersed recreation areas, and stream access sites, rather than specific recreation activities, the range of values per recreator associated with these locations are based on the recreation activities expected at these locations. Recreational values are presented in ranges to reflect the range in value of different recreation activities that may be engaged in at a particular recreation location as well as the uncertainty regarding the specific value of each activity.
16 Green, G. T., K. Cordell, H. Fleming and C. Betz. 2006. A Report Submitted to the Tennessee Valley Authority,
By the Outdoor Recreation & Wilderness Assessment Group, Southern Research Station, USDA Forest Service, Athens, Georgia.
17 American Association of Museums. (2010). "2006 Musem Finacial Information." Accessed at: http://www.aam-us.org/aboutmuseums/abc.cfm#visitors.
18 An estimated 2.6 million people visited nature centers in 2004; a 29.5 percent growth from 1995. Assuming trends continue, approximately 3.0 million people may have visited nature centers in 2010.
19 U.S. National Fish and Wildlife Service, Wheeler National Wildlife Refuge Facts, accessed online at: http://www.fws.gov/southeast/pubs/facts/wlrcon.pdf.

Economic Benefits of the Tennessee Valley Authority’s Natural Resource Plan
January 2011 Cardno ENTRIX Recreation/Visitor Benefit Estimation 3-11
Table 3-5 Value of Recreational Activities
Recreational Activity Value Applied to NRP Programs Articles
Day use areas: Picnicking, Swimming, Fishing, Boating, Wildlife Watching
$12-$40 / Person/Day Bergstrom, John C. et al. (1996); Williams, J. and P. Bettoli (2003); Bhat, Gajanan et al. (1998); Boyle, Kevin J. et al (1998); Aiken, Richard (2009); Loomis, John B. (2003); Siderelis, Christos et al. (1995);
Dispersed Recreation Areas: Hiking, Fishing, Swimming, Paddling, Hunting, Wildlife Watching, Boating, Primitive Camping
$10-$40 / Person/Day Boyle, Kevin J. et al (1998); Aiken, Richard (2009); Knoche, S. and F. Lupi (2007); Upneja, Arun et al. (2001); Zawacki, William T. et al. (2000); Loomis, John B. (2003); Siderelis, Christos et al. (1995); House, Kevin Patrick (1995); Casey, James F. et al. (1995); Williams, J. and P. Bettoli (2003);
Stream Access Sites Fishing, Paddling
$10-$27/Person /Day Williams, J. and P. Bettoli (2003); Bhat, Gajanan et al. (1998); Aiken, Richard (2009); Boyle, Kevin J. et al (1998); Loomis, John (2003); Bergstrom, John C. et al. (1996)
Campgrounds: Camping $9-$30/Person/Day Bergstrom, John C. et al. (1996); Bergstrom, John C. et al. (1991); Mckean, John R. et al. (2005)
Public Outreach: Visiting a Nature Center
$5-$10/Person/Visit
Corporate History: Visiting a Museum
$19-30/Person/Visit Poor, P. Joan et al.(2004); Taylor, David T. et al.(1993) Bergstrom, John C. et al. (1991);Chambers, S. et al. (1998)
Historic Sites: Historic Sightseeing
$0-30/Person/Day Poor, P. Joan et al.(2004); Taylor, David T. et al.(1993) Bergstrom, John C. et al. (1991);Chambers, S. et al. (1998)
Greenway: Increased Property Value per House in Knoxville, TN
$170 - 215/Household (One-time value)20
Irwin, G Elena (2002); Cho,S. et al. (2009)
3.3.2 Value of Quality Improvements Numerous biological resource management programs may provide benefits to recreators through increased quality of the recreation experience. Many of these programs enhance habitat and species populations. Examples of such programs include the endangered and threatened species program, migratory birds management, natural areas program, agricultural and open lands management, dewatering projects management, and forest resource management. These programs can increase the value of wildlife-related recreation (such as hunting, fishing, and wildlife viewing) by increasing the rate of wildlife observance, and can increase the value of nearly all types of recreation through habitat improvements that enhance the overall recreation environment.
Other biological resource management programs improve the quality of recreation experiences on TVA lands by helping to ensure public safety for recreationists, reduce hazards or annoyances, and prevent closures of areas to recreation. For example, nuisance animal control
20 This value was updated from the 2002 value of $170 to a 2010 dollar value of $215using the consumer price
index (CPI).

Economic Benefits of the Tennessee Valley Authority’s Natural Resource Plan
3-12 Recreation / Visitor Benefit Estimation Cardno ENTRIX January 2011
can reduce hazards and annoyances to recreators and forest management can prevent closures to recreationists due to forest fire or public hazards.
Table 3-6 summarizes literature utilized to estimate the value to recreators of improved habitat quality and overall recreation conditions. Based on the peer-reviewed literature, this analysis estimates that the per acre value of habitat improvements range from $3 to $30, while the value per trip of improved quality can vary from $0 to $15, depending on the type and degree of improvement and the recreation activity. As most values are reported on a per trip basis, this analysis used the average dispersed recreation use of 20 visits per acre to translate per trip values to per acre values.
Table 3-6 Value of Improved Recreation Conditions Value Type of Improvement Articles
$0-$15 / Trip Increased Hiking Value for ‘Ideal Conditions’ Per Person Per Trip; Deer Hunting Quality Improvement Per Trip; Non-Consumptive Wildlife Recreation Per Observation; Improved Hunting Value Per Trip
Siderelis, Christos et al. (1995); Rockel, M. Kealy, M. (1991), Zawacki, William T. et al. (2000); Knoche, Scott et al.(2006); Bergstrom, John C. et al.(2009); Boyle, Kevin J. et al.(1998); Aiken, Richard(2009);
$3-30 / Acre Hunting Quality Improvement Per Acre; Deer Hunting Quality Improvement Per Trip; Non-Consumptive Wildlife Recreation Per Observation; Improved Hunting Value Per Trip
Murray, Brian et al. (2009); Rockel,M. Kealy, M. (1991), Zawacki, William T. et al. (2000); Knoche, Scott et al.(2006); Bergstrom, John C. et al.(2009); Boyle, Kevin J. et al.(1998); Aiken, Richard(2009);
Several recreation management programs may also enhance the quality of the recreation experience on TVA lands. In particular, recreation assessment and design tools programs will provide management data and information that will assist TVA recreation managers in improving the recreation experience and in prioritizing the expenditure of recreation funds to achieve optimum public benefit. Additionally, implementing sustainability measures at day use areas and campgrounds through such activities as the clean and green campground initiative may improve the quality of the recreation experience. The value of recreation assessment and design tools are not quantified as the effect of these programs on the quality of recreation opportunities is not known.

January 2011 Cardno ENTRIX Cultural Resource Preservation Benefits 4-1
Chapter 4 Cultural Resource Preservation Benefits Cultural resources on TVA lands include archaeological sites and objects, historic structures (including buildings and dams), historic sites (including civil war sites). There is a high density of cultural resources on TVA lands, particularly along shorelines. These sites are vulnerable to damage, both from shoreline erosion and also from looting. Federal law requires TVA to manage and preserve these resources to the extent possible. In addition to compliance with federal law, preservation of cultural resources on TVA-land has numerous public benefits, including the protection of cultural heritage and identity and the scientific and educational value regarding our history and pre-history. Cultural resources also provide recreation and education value to people who visit historic and archaeological sites or museums (this visitor use value is captured in Chapter 3), and cost savings to TVA and its rate payers through better information management and reduced compliance costs (discussed in Chapter 7).
Cultural resource management options in the NRP include 29 cultural resource management activities and goals. Preservation of cultural resources on TVA-managed lands is also enhanced through shoreline stabilization activities in the NRP water resources management area, and through NRP public outreach activities in all resource areas. Quantification of the economic benefits of cultural resource management was possible for only a few of these management activities and goals, as there are few to no existing studies quantifying in dollar terms the value to the public of cultural resources similar to those on TVA lands. It is known, however, that the American public values cultural resources. For example, according to a recent national survey of archaeological resources, nearly all respondents agreed that archaeological sites have ‘educational and scientific value’ (99 percent of respondents) and ‘value related to personal heritage’ (93 percent of respondents).21
To indicate the potential magnitude of value of cultural resource preservation from NRP programs, this chapter provides the following quantitative information: 1) the number of people who may benefit from cultural resources preservation, 2) the number of undocumented sites that may be identified through additional surveys (identification of which may provide additional scientific, educational, and potential recreation value), and 3) estimates of the ‘archaeological value’, as defined under the Archaeological Resources Protection Act of 1979, of NRP management actions that protect cultural resources.
4.1 Summary of Estimated Cultural Resource Benefits Table 4-1 summarizes the quantitative information developed in this study regarding the value to the public of NRP cultural resource management actions and goals.
21 Harris Interactive, 2000, Exploring Public Perceptions and Attitudes about Archaeology, Prepared for the
Society for American Archaeology.

Economic Benefits of the Tennessee Valley Authority’s Natural Resource Plan
4-2 Cultural Resource Preservation Benefits Cardno ENTRIX January 2011
Table 4-1 Summary of Cultural Resource Values
Management Activity / Goal Resource/ Current Population Benefiting Value / Unit Annual Value of Activity /
Goal
Cultural Resource Management
All Management Actions / Goals
310 Million Americans 6.5 Million Residents in TVA region, 2.3 million visit historical sites and 1.0 million visit archaeological sites 450,000 Members of tribes with a cultural interest in resources on TVA lands
Varies on goal / activity, with many values unknown.
Increased protection and preservation of cultural resources for current and future generations.
ARPA
Conduct ARPA Inspections and security checks
11,500 Identified Archaeological Resources 1 ARPA Investigation per 108 Security Inspections
Looting Fines of $100,000 to $250,000 per Looting Incident; Damage value per TVA prosecution: $670,000.
Unknown decrease in looting incidents due to security checks
Archaeological Monitoring and Protection
Protect archaeological site of tributary shoreline miles OR main stem shoreline miles
2.6 Shoreline Archaeological Sites Per Mile
$600,000 - $1,800,000 / Site
$1 - $5 million Per Mile
Preservation Program
Archaeological surveys of TVA-managed lands 0.07
Average Undocumented Sites Per Acre Unknown Increased protection and
management knowledge
Cultural Resource Partnerships
Field Schools
10-15 Participants per field school 5-10 Volunteers per field school
Unknown Training for future professionals and public education benefits through field trips and observation of excavation.
Recreation Management
Public Outreach 6,000,000 Dispersed Recreation Visits on 293,000 TVA-managed Acres 156,000 Camping Person Days at 8 campgrounds 735,000 Day Use Visits at 63 TVA Day Use Areas 8,7000,000 Day Use Visits to TVA Reservoirs
Unknown Potential increased protection and preservation of cultural resources for current and future generations.

Economic Benefits of the Tennessee Valley Authority’s Natural Resource Plan
January 2011 Cardno ENTRIX Cultural Resource Preservation Benefits 4-3
Management Activity / Goal Resource/ Current Population Benefiting Value / Unit Annual Value of Activity /
Goal
Biological Resource Management
Public Outreach and Dispersed Recreation Management
6,000,000 Dispersed Recreation Visits on 293,000 TVA-managed Acres 156,000 Camping Person Days at 8 campgrounds 735,000 Day Use Visits at 63 TVA Day Use Areas 8,7000,000 Day Use Visits to TVA Reservoirs
Unknown Potential increased protection and preservation of cultural resources for current and future generations.
Water Resource Management
Shoreline Stabilization
Stabilize critically eroding shoreline
2.6 Shoreline Archaeological Sites Per Mile
$600,000 - $1,800,000 / Site
$1 - $5 million
Per Mile
4.2 Affected Population Cultural resource management and protection on TVA lands will benefit the American public and particularly Native American Tribes who have a strong cultural interest in resources on TVA.
4.2.1 Public The U.S. population is approximately 311 million people. Preserving cultural resources on TVA-managed lands protects the collective heritage of this population. The local population may particularly value cultural resources on TVA lands. The population in the 125-County TVA region is about 6.5 million people. Of this population, interest in cultural sites is evident by the fact that approximately one million people visit archaeological sites and 2.3 million people visit historical sites each year.22 Furthermore, interest in cultural resources is evident from the the estimated 7,000 annual visits to TVA cultural resource web pages.
22 Green, G. T., K. Cordell, H. Fleming and C. Betz. 2006. A Report Submitted to the Tennessee Valley Authority,
By the Outdoor Recreation & Wilderness Assessment Group, Southern Research Station, USDA Forest Service, Athens, Georgia.

Economic Benefits of the Tennessee Valley Authority’s Natural Resource Plan
4-4 Cultural Resource Preservation Benefits Cardno ENTRIX January 2011
4.2.2 Native American Tribes TVA consults with 18 federally recognized tribes who have a cultural interest in the TVA Power Service area.23 Based on 2006 US Census Data, the combined population of these tribes is approximately 450,000, as presented in Table 4-2.
Table 4-2 Estimated Population of Tribes Consulted by TVA
Tribe 2006 Population
Cherokee 331,491
Chickasaw 12,773
Choctaw 55,107
Creek 27,243
Seminole 12,578
Shawnee N/A
Total 439,192
4.2.3 Field School Participants Field schools provide opportunities for training future archaeology professionals. Each field school typically trains 10 to 15 students. Field schools also provide volunteer opportunities for five to 10 individuals, and public education opportunities through observation of excavation.24
4.3 Total Number of Cultural Resources: Documented and Undocumented The benefits of shoreline stabilization, archaeological surveys, and identification surveys of historical structures depend on the total number of cultural resources that may be preserved or identified. This section describes the data and methodology to estimate the total of number of archaeological and historic resources on TVA-managed lands, including those not yet identified.
4.3.1 Archeological Sites Approximately 11,500 archaeological sites have been identified on TVA-managed lands, of which 7,190 are located adjacent to reservoir shorelines but above normal summer pool water elevation. However, only approximately 25 percent of TVA-managed lands have been systematically surveyed. Assuming therefore that only 25 percent of sites adjacent to shoreline have been documented, there may be an additional 21,570 undocumented shoreline sites, or 28,760 total shoreline sites. There are approximately 11,000 miles of TVA-managed shoreline,
23 These tribes are: Absentee Shawnee Tribe Oklahoma, Alabama-Coushatta Tribe of Texas, Alabama-Quassate
Tribal Town, Cherokee Nation, Chickasaw Nation, Choctaw Nation of Oklahoma, Eastern Band of Cherokee Indians, Eastern Shawnee Tribe of Oklahoma, Jena Band of Choctaw Indians, Kialegee Tribal Town, Mississippi Band of Choctaw Indians, Seminole Tribe of Florida, Seminole Tribe of Oklahoma, Shawnee Tribe, Thlopthlocco Tribal Town, and the United Keetowah Band of Cherokee Indians of Oklahoma.
24 Personal communication with Erin Pritchard, TVA Cultural Resource Specialist, November, 2010.

Economic Benefits of the Tennessee Valley Authority’s Natural Resource Plan
January 2011 Cardno ENTRIX Cultural Resource Preservation Benefits 4-5
so there are an estimated 2.6 sites per mile of TVA shoreline and an estimated 2.0 undocumented sites per mile.
4.3.2 Historical Sites There are approximately 5,300 identified historical sites on TVA-managed lands. Assuming that the same portion TVA lands have been surveyed for historical sites as archaeological sites (25 percent), there may be an additional 16,000 unidentified historical sites on TVA-managed lands. As there are 293,000 acres of TVA-managed lands, this is equivalent to an average of 0.05 unidentified historical sites on TVA lands.
4.4 Archaeological Value This study uses the methodology established by ARPA to estimate the potential value to society of protecting cultural resources on TVA lands through such management actions as shoreline stabilization to prevent loss of resources through erosion, and increased ARPA security inspections to minimize resource damage and theft. ARPA is intended to protect archaeological artifacts on federal lands from theft and damage. It establishes fines for theft or damage of archaeological resources on federal lands such as those managed by TVA and also establishes ‘archaeological value’ of damaged or lost resources as the measure of the gravity of any criminal or civil violation of ARPA.
4.4.1 ARPA Fines Fines under ARPA for theft or damage of archaeological resources are based on archaeological or commercial value, plus the cost of resource restoration and repair. Depending on the value of the archaeological resources damaged and whether the individual is committing a first or second offense, maximum fines are established at $100,000 and $250,000:
If the sum of archaeological value and restoration cost is under $500 and the crime is a first offense, the penalty is not more than 1 year imprisonment and a $100,000 fine.
If the sum exceeds $500 and the crime is a first offense, the penalty is not more than two years imprisonment and a $250,000 fine
If the crime is a second offense, then the penalty is not more than five year imprisonment and a $250,000 fine (regardless of archaeological value and restoration costs).
4.4.2 Archaeological Value Under ARPA, archaeological value is the value of information associated with the archaeological resource and shall be appraised in terms of the:
“cost of the retrieval of the scientific information which would have been obtainable prior to the violation”. These costs may include, but need not be limited to, the cost of

Economic Benefits of the Tennessee Valley Authority’s Natural Resource Plan
4-6 Cultural Resource Preservation Benefits Cardno ENTRIX January 2011
preparing a research design, conducting field work, carrying out laboratory analyses, and preparing reports as would e necessary to realize the information potential.”25
In other words, the archaeological value is the estimated as the cost of actual recovery of archaeological materials and data in mitigation or research projects.
Shoreline stabilization programs provide benefits related to water quality (captured in the value of HU water quality improvements), cultural resource preservation, and reduced damage to private shoreline property. The value of cultural resource preservation through reduced shoreline erosion is approximated based on the estimated cost to preserve resources through excavation and removal. This value is estimated at $1 million to $5 million per shoreline mile stabilized, based on the following assumptions: an estimated 2.6 archaeological sites per mile of TVA shoreline (see Section 4.3.1 above), an estimated average shoreline length per site of 200 meters, an assumed avoided excavation volume over time of one to three cubic meters, and an estimated excavation cost of $3,000 per cubic meter.26
25 Society for American Archaeology, Professional Standards for the Determination of Archaeological Value”,
accessed at: http://www.saa.org/Portals/0/SAA/GovernmentAffairs/ARPAstandards.pdf. 26 Per personal communication with Erin Pritchard, TVA Cultural Resources Specialist, November 2010.

January 2011 Cardno ENTRIX Species and Habitat Conservation Benefits 5-1
Chapter 5 Species and Habitat Conservation Benefits The Tennessee Valley is a biological rich area supporting diverse species and habitats. The river system supports approximately 230 species of fishes and 100 species of mussels, many of which are found only in the watershed and have small populations that may become threatened or endangered.27 Terrestrial habitat are also diverse, with over 60 species of reptiles, 70 species of amphibians, 180 species of breeding birds, and 60 species of mammals in forested and other habitats in the Valley.28 Conservation of species and habitat diversity and abundance has intrinsic benefit to people, including the protection of our heritage and identity, the scientific and educational value of species and habitats, and the non-use value to people of knowing that these biological resources exist and are protected for future current and future generations. NRP biological resource management programs also provide volunteer opportunities, enhance recreation value (this visitor use value is captured in Chapter 3), and generate cost savings to TVA and its rate payers through better information management and reduced compliance costs (discussed in Chapter 7).
Biological resource management in the NRP includes 86 management activities and goals. The recreation value of species and habitat conservation has been widely studied, and is estimated for NRP programs in Chapter 4. While valuable to people, the quantification of the intrinsic benefits of habitat and species conservation was not possible for the NRP programs because there is little to no data on how NPR management activities will affect species populations or habitat quality. To indicate the potential magnitude of value of species and habitat conservation from NRP programs, this chapter provides the following quantitative information: 1) the number of people who may value the intrinsic benefits from species and habitat conservation, 2) information on the habitats and species in the TVA region, and 3) examples from the literature providing estimates of the value to people of species and habitat conservation.
27 Regional Resource Stewardship Council, 2001, “Recommended policy on improving biodiversity in the
Tennessee River System”, accessed at http://www.tva.gov/rrsc/readingroom/biodiversityrec.htm. 28 Tennessee Valley Authority, 2004, Reservoir Operations Study Final Environmental Impact Statement, Section
4.10 Terrestrial Ecology, accessed at http://www.tva.com/environment/reports/ros_eis/4-10_terrestrial_ecology.pdf.

Economic Benefits of the Tennessee Valley Authority’s Natural Resource Plan
5-2 Species and Habitat Conservation Benefits Cardno ENTRIX January 2011
Table 5-1 Summary of Species and Habitat Conservation Values
Management Activity / Goal Resource/ Current Population Benefiting Value / Unit Annual Value of Activity /
Goal Biological Resource Management
All Management Activities /Goals
310,000,000 US Population 6,500,000 TVA 125-County Population
Value of enhanced habitat and species populations.
Wetland Management
$150 - $1,600 / Wetland
Acre
Unknown number of wetland acres conserved.
Endangered and Threatened Species Program
$5 - $100 /Household/
Year (for significant
increases in species
protection rates)
Potential benefits from unknown change in habitat
quality and species populations from NRP management actions.
Natural Areas Program
Monitor TVA’s natural areas annually and implement maintenance needs on natural areas as identified by opportunistic observations
34,000 Acres currently zoned for sensitive resource management
Potential benefits from unknown change in habitat
quality and species populations
Develop and implement management plans on natural areas
220 Average estimated acres per Natural Area
Potential benefits from unknown change in habitat
quality and species populations
Non-Native Invasive Plant (NNIP) Management
Control NNIP on TVA-managed lands
2.0 – 5.0 Benefit Cost
Ratio
Cost of NNIP control of $40 to $225 per acre results in
benefits of $80 to $1125 per acre
Terrestrial Greenhouse Gas
$10 -$40 /
Ton of Carbon
Economic value of carbon sequestration in terms of avoided costs of climate
change, including avoided damages to species and
habitat
Public Outreach
Volunteer Program
$20 / Hour Value to
Volunteers
Value to volunteers; unknown number of volunteer hours

Economic Benefits of the Tennessee Valley Authority’s Natural Resource Plan
January 2011 Cardno ENTRIX Species and Habitat Conservation Benefits 5-3
Management Activity / Goal Resource/ Current Population Benefiting Value / Unit Annual Value of Activity /
Goal Water Resource Management
All Management Activities /Goals
Potential improved aquatic habitat quality
Cultural Resources Management
Shoreline Stabilization Potential improved aquatic
habitat quality
5.1 Population Affected The U.S. population is approximately 311 million people. Conservation of biological resources on TVA-managed lands protects the collective heritage of the nation, and people are concerned with species and habitat conservation. For example, according to the non-profit Giving USA, in 2009 Americans gave $6.2 billion to environmental, conservation, and animal-welfare charities.29 The local population may particularly value biological resources on TVA lands. The population in the 125-County TVA region is about 6.5 million people. Of this population, over half participate in wildlife viewing recreation activities (see Table 5-2), and likely therefore have a general interest in habitat and species conservation even if they do not recreate on TVA-managed lands.30
Table 5-2 Wildlife-Related Recreation Participation in TVA Region Wildlife-Related Recreation Activity Estimated 2010 Participants in TVA Region
View Wildlife 3,700,000
View Birds 2,000,000
Migratory Bird Hunting 100,000
Big Game Hunting 500,000
Small Game Hunting 600,000
Warmwater Fishing 1,900,000
5.2 Habitat and Species on TVA lands Of the 293,000 acres of TVA-managed lands, over 233,000 acres are forest, scrub/shrub, grassland/herbaceous, or wetland habitat (see Table 5-3). This habitat supports diverse species, 93 of which are candidate or proposed federal threatened and endangered species (see Table 5-4). TVA has zoned its lands for appropriate land use, and has designated 34,000 acres as
29 The Chronicle of Philanthropy, June 8, 2010, “Environmental Groups Chalk up 2.7% Increase in Gifts, Report
Finds”, accessed online at: http://philanthropy.com/article/Environmental-Groups-Chalk-Up/65817/.
30 Green, G. T., K. Cordell, H. Fleming and C. Betz. 2006. A Report Submitted to the Tennessee Valley Authority, By the Outdoor Recreation & Wilderness Assessment Group, Southern Research Station, USDA Forest Service, Athens, Georgia.

Economic Benefits of the Tennessee Valley Authority’s Natural Resource Plan
5-4 Species and Habitat Conservation Benefits Cardno ENTRIX January 2011
sensitive resource management areas, which include designated Natural Areas (see Table 5-5). Based on 154 natural areas and 34,000 acres in Zone 3 lands, on average there are an estimated 220 acres per Natural Area. TVA has also four projects that are third-party certified by the Wildlife Habitat Council. Three of the four existing projects total 2,000 acres, or an average of 670 acres each. TVA resource specialists estimate that new projects will have 1,000 acres per project.31
Table 5-3 Habitat Acreage on TVA-Managed Lands Habitat Type Acreage of TVA-Managed Lands
Forest 170,469
Scrub/Shrub 7,824
Grassland/Herbaceous 5,917
Wetlands 49,327
Total 233,538 Source: Derived from Natural Resource Plan land use / land cover data from TVA. Table 5-4 Federal Candidate or Proposed Threatened and Endangered Species in Tennessee River Watershed
Species Type Number of Species
Invertebrates 43
Mammals 4
Fish 15
Plants 29
Birds 2
Total 93 Source: Personal communication with TVA Biological Resource Specialists, October 2010. Table 5-5 Current Land Use Zone Definitions for Single Use Allocation Lands on 28 TVA Reservoirs
Land Use Zone Description Acreage
Zone 1 Non-TV A shoreline N/A
Zone 2 Project Operations 14,107
Zone 3 Sensitive Resource Management 33.494
Zone 4 Natural Resource Conservation 78.114
Zone 5 Industrial 1,688
Zone 6 Developed Recreation 12,639
Zone 7 Shoreline Access 7.497
Total 141,136
31 Personal communication with Wesley James and John Baxter, TVA Biological Resource Specialists, November
2010.

Economic Benefits of the Tennessee Valley Authority’s Natural Resource Plan
January 2011 Cardno ENTRIX Species and Habitat Conservation Benefits 5-5
5.3 Estimating Value This section summarizes estimated economic values from the literature on species and habitat conservation, the value of invasive species control, and the economic value to volunteers of their participation in public outreach programs.
5.3.1 Species and Habitat Values Habitat and species could provide both use value and non-use values. Use values on TVA-managed lands are primarily related to outdoor recreation, which is discussed in Chapter 3. The intrinsic benefit of habitat and wildlife conservation not associated with use is difficult to measure and, therefore, controversial. Attempts to measure total value (use and non-use) of species conservation use survey methods that elicit hypothetical willingness to pay. One challenge with this method is that it is often very difficult to identify what exactly people are valuing: the species, the habitat, or the indication of overall ecosystem health. People’s ability to understand the relative benefits of different conservation questions is also problematic. One study, for example, showed the average perceived benefits from preventing 2,000 birds from dying in oil-filled ponds was no different than the value from preventing 20,000 or 200,000 birds from dying.32 In addition, respondents know they do not actually have to pay the amount stated in the survey and are not as careful “spending” hypothetical dollars as they are spending their own real dollars. Finally, studies that evaluate willingness to pay for only one species or habitat may also overestimate economic benefits because they often do not address tradeoffs between species conservation and other priorities. Because of the difficulties with these methods, this study reports some of the values found in the literature, but cannot validate their reliability.
Studies about species and habitat conservation conclude that the annual per person WTP ranges from approximately $5 to $100 per species for significant increases in species protection rates.33 The value per species generally increases if it is a ‘charismatic’ and recognizable species, it is a bird or mammal or fish, and if the survey respondent is a visitor or recreator in the conservation location (i.e., would hold use values as well).
There are also some studies that focus on the per acre value of habitat conservation. In particular, the literature provides values for the economic benefits of wetlands. The range of values in these studies is $150 to $1,600 per acre.34
32 Desvousges, W., F.R. Johnson, R. Dunford, K. Boyle, S. Hudson, and K. Wilson. 1992. Measuring natural
resource damages with contingent valuation: tests of validity and reliability. Research Triangle Institute, NC. 33 Loomis, J. and D. White. 1996. Economic benefits of rare and endangered species: Summary and meta analysis.
Colorado State University. Fort Collins, CO. Kotchen and Reiling. 2000. “Environmental Attitudes, Motivations, and contingent valuation of nonuse values: a case study involving endangered species.” Ecological Economics 32: (93-107). Reaves, Kramer, and Holmes. 1999. Does Question Format Matter? Valuing Endangered Species. Environmental and Resource Economics (14): 365 – 383.
34 Woodward, Richard and Yong-Suhk Wui. 2001. “The economic value of wetland services, a meta-analysis.” Ecological Economics, (37): 257-270.

Economic Benefits of the Tennessee Valley Authority’s Natural Resource Plan
5-6 Species and Habitat Conservation Benefits Cardno ENTRIX January 2011
5.3.2 Invasive Species Control Value Economic cost benefit studies of non-native invasive species control efforts indicate that the benefits typically significantly outweigh the costs. Benefits are related to avoided economic damages to crops, fisheries, forests, recreation, that would otherwise occur if non-native species spread were left unchecked. The benefit cost ratio (the value of benefits for every dollar spent on costs) can vary widely depending on the invasive species, the rate of its spread, the economic sectors affected, and the control method used.35 One comprehensive study in California found that for every $1.0 dollar spent on control efforts, $2.8 to $5.3 dollars in economic benefits to agriculture was produced; as this appears to represent a reasonable range of benefits relative to other studies, a range of 2.0 to 5.0 is used to estimate the values of NRP non-native invasive control programs.36
5.3.3 Carbon Sequestration Value There are two approaches to valuing carbon sequestration: 1) economic studies estimating the value of avoided damages from reduced climate change, and 2) replacement cost of reducing emissions or developing alternative sequestration projects.37
The social value of carbon, which is estimated as the avoided cost to society from global climate change, is much debated in the literature. For example, Mendelsohn (2003) suggests that the social value of carbon, which is often reported in the literature as ranging from $7 to $20 per ton, may actually be closer to $1 to $2 per ton. Conversely, in a 2009 study, Tol estimated the social value of carbon through a meta-analysis of 232 published estimates and identifies the mean, median, and mode value of the published estimates as $149, $41, and $18 per metric ton of carbon, respectively.38 The results from meta-analysis indicate a higher mean, median, and mode value for the social value of carbon with $215, $124, and $58 per metric ton of carbon, respectively. Recognizing the inherent uncertainty in estimates of the total social and economic costs of climate change, this analysis uses a range of $10 to $40 per ton as the estimate of the social value of carbon.
35 Olson, Lars. 2005. “The Economics of Terrestrial Invasive Species: A Review of the Literature.” Agricultural
and Resource Economics Review. 35(1): 178-194. Culliney, Thomas W. 2005. “Benefits of Classical Biological Control for Managing Invasive Plants”.Critical Reviews in Plant Science (24): 131-150.
36 Sumner, D.A., H. Brunke, and M. Kreith. 2006. “Agricultural Costs and Benefits of Government Invasive Species Control Actions in California. University of California Agricultural Issues Center.
37 There is also some data available on carbon prices from the carbon markets in the United States such as the Regional Greenhouse Gas Initiative (RGGI) in the northeast and the voluntary Chicago Climate Exchange (CCX). However, prices from these markets do not yet accurately reflect the cost of carbon emission reduction as there is currently little demand for carbon reduction. In the case of the RGGI market (which includes power plants in 10 northeastern states), carbon emission allowances exceed current power plant emissions levels due to the reduced electricity demand associated with the economic downturn. As a consequence, the price for RGGI allowances in the most recent auction in June 2010 were $1.88, nearly identical to the price floor of $1.86.
38 Tol, Richard, 2009, ‘The economic effects of climate change,’ Journal of Economic Perspectives, Vol 23 No.2.

Economic Benefits of the Tennessee Valley Authority’s Natural Resource Plan
January 2011 Cardno ENTRIX Species and Habitat Conservation Benefits 5-7
5.3.4 Value to Volunteers Volunteer programs may enhance resources or recreator enjoyment, but are also expected to provide benefits to the volunteers themselves. Studies specifically focusing on the benefits of environmental education and volunteering are few, but two studies conducted in the United Kingdom on environmental volunteering indicate the potential for significant benefits, both to society as well as to the individual volunteer.39 In these studies, British environmental volunteers, which likely have similar motivations and benefits as American environmental volunteers, have reported such varied individual benefits as increased personal well-being and positive emotional effects, gaining new skills and knowledge about environmental issues and policies, enjoyment of nature and the outdoors, increased physical exercise, and becoming more connected to other people in their community and their natural environment.
In addition to the empirical studies, the fact that volunteer work on TVA lands is done without monetary compensation suggests that volunteering creates benefits for the volunteer. The time that individuals spend on volunteer work reduces the time they have available for paid work, and, therefore, “costs” them the equivalent of their foregone wages, or some portion thereof. Consequently, the minimum value of benefits to volunteers is the value to them of their foregone wages (adjusted downward for taxes and upward for fringe benefits), as well as any disutility of work (e.g., downward wage rate adjustment for work-induced stress). Based on intrinsic enjoyment of the volunteer activity, the true hourly benefit derived from volunteering may actually exceed the labor rate. In this study, the value of foregone wages is estimated at $20 per hour based on the average wage in Tennessee of life, physical, and social science technicians.40
39 O’Brien, Liz, Mardle Townsend, and Matthew Ebden. 2008. “Environmental Volunteering: Motivations,
Barriers, and Benefits,” Report to the Scottish Forestry Trust and Forestry Commission. Hine, Rachel, Jo Peacock, and Jules Pretty. 2008. “Evaluating the impact of environmental volunteering on behaviours and attitudes to the environment,” Report for the British Trust of Conservation Volunteers.
40 U.S. Bureau of Labor Statistics, 2010, Occupational Employment Statistics, “2009 Tennessee Occupational Employment and Wage Estimates”, Accessed online at: http://www.bls.gov/oes/current/oes_tn.htm#19-0000.


January 2011 Cardno ENTRIX Water Resource Benefits 6-1
Chapter 6 Water Resource Benefits The NRP water resource management programs focus on restoration of aquatic biology communities, enhanced water quality, and shoreline stabilization to prevent erosion. Public outreach management activities within water resource management programs as well as in recreation and biological resource programs also include components to encourage water conservation. Restoration of aquatic biology communities and enhanced water quality can provide the following benefits: increased recreation value, increased aesthetic value to nearby residents, avoided adverse health effects, and reduced water treatment costs for domestic and/or industrial water users. Shoreline stabilization can reduce property and resource damage associated with erosion and improve water quality by reducing sediment in the water (the value shoreline stabilization in preserving cultural resources is estimated in Chapter 4). Water conservation can lessen the severity and frequency of water shortages and/or decrease the price of water in the region by reducing the need for more water resource development projects. The value of water resource benefits from the NRP depends on the current quality of the water bodies, the population affected, and the degree of resource improvement.
This chapter is organized into three parts. First, quantified water resource benefits are summarized in Section 6.1. Sections 6.2, 6.3, 6.4, and 6.5 provide detail on the values estimated for aquatic ecology management, water quality improvement, shoreline stabilization, and public outreach programs.
6.1 Summary of Estimated Water Resource Benefits Table 6-1 summarizes the estimated water resource values generated by the NRP programs, including benefits generated by public outreach and other NRP programs in the recreation and biological resource management areas. While the NRP includes 22 water resource management goals and activities, we have estimated quantitative value for a limited number of goals and activities. This is due to two factors. First, many of the management activities and goals are related to strategic partnerships, public outreach, and data collection that will contribute to water resource enhancement; however, data is not available to quantify the effect on water resources.
Second, many of the water resource management activities and goals are aimed at improving the water quality in the Tennessee River Valley as measured by the hydrologic unit (HU) rating of poor, fair, or good. One of the NRP management goals sets a target for improving the number of HUs in the Tennessee River watershed from poor to fair or fair to good (the management goal of “Improve __ HU in __ Years”). Several water resource management actions identify the means that will be used to achieve this management goal, including public outreach programs and targets to reduce the quantity of phosphorous and sediment entering streams. As these are intermediary management actions that will assist in reaching the overall management goal of improving HU water quality but do not represent additional benefits, to avoid double counting we value only the final outcome of water quality improvements in the HUs embodied in the management goal of “Improve __HU in __Years”.

Economic Benefits of the Tennessee Valley Authority’s Natural Resource Plan
6-2 Water Resource Benefits Cardno ENTRIX January 2011
Table 6-1 Summary of Water Resource Values
Management Activity / Goal Resource/ Current Population Benefiting Value / Unit Annual Value of Activity /
Goal
Water Resource Management
All Activities / Goals
2.6 Million Households in the Tennessee Valley 125-County Region
Varies by Activity
Potential positive effect on water quality and conservation
Targeted Watershed Initiative
Improve Hydrologic Unit (HU) 611 HU containing in the Tennessee River watershed 2.6 Million Households in the Tennessee Valley 125-County Region
$0.02 -$0.05 / Household / HU Improved
$55,000 - $135,000 per HU improved
Reservoir Shoreline Stabilization
Stabilize Critically Eroding Shoreline
3.7 Shoreline 26a permits (Private Property Structures) Per Mile
Unknown Unknown
Aquatic Ecology Management
Outreach to Raise Public Awareness of Exotic and Invasive Aquatics
Unknown Unknown Potential benefit cost ratio of 2.0 to 5.0 (for every dollar spent, $2 to $5 dollars in benefits)
Public Outreach
Maintain Certification / Certify New “Clean and Green” Marinas
70 Percent Certified Marinas Experience Increased Revenue
$5,000 - $50,000/ Marina with Increased Revenue
$3,500 - $35,000 per Certified Marina
Recreation Management
Public Outreach
6,000,000 Dispersed Recreation Visits on 293,000 TVA-managed Acres 156,000 Camping Person Days at 8 campgrounds 735,000 Day Use Visits at 63 TVA Day Use Areas 8,7000,000 Day Use Visits to TVA Reservoirs
Unknown, varies by activity
Potential positive effect on water quality and conservation
Campground Management
Establish flagship campgrounds with innovative design and efficiency measures
19,500 Average person camping days per campground
Unknown Water conservation benefits.

Economic Benefits of the Tennessee Valley Authority’s Natural Resource Plan
January 2011 Cardno ENTRIX Water Resource Benefits 6-3
Management Activity / Goal Resource/ Current Population Benefiting Value / Unit Annual Value of Activity /
Goal
Day Use Areas
Implement sustainable initiatives
11,700 Average person days per TVA day use area
Unknown Water conservation benefits
Biological Resource Management
Public Outreach
6,000,000 Dispersed Recreation Visits on 293,000 TVA-managed Acres 156,000 Camping Person Days at 8 campgrounds 735,000 Day Use Visits at 63 TVA Day Use Areas 8,7000,000 Day Use Visits to TVA Reservoirs
Unknown, varies by activity
Potential positive effect on water quality and conservation
6.2 Aquatic Ecology Management and Restoration As described in Section 5.3.2, the literature indicates that the economic benefit of non-native invasive species control efforts typically significantly outweigh the costs. Based on this literature, this study uses a benefit cost ratio (the value of benefits for every dollar spent on costs) of 2.0 to 5.0 was used to estimate the values of NRP non-native invasive control programs.
6.3 Shoreline Stabilization Shoreline stabilization programs provide benefits related to water quality (captured in the value of HU water quality improvements), cultural resource preservation (captured in Chapter 4), and reduced damage to private shoreline property. The benefits of reduced private property damage are not estimated due to the lack of available data on the costs that may be incurred due to shoreline erosion. However, it is known that there are numerous private structures located along the shoreline of TVA Reservoirs. Based on the number of 26a permits, which are required for shoreline construction, there are an estimated 41,000 structures along the 11,000 miles of TVA shorelines, or approximately 3.7 structures per mile. Shoreline stabilization near these structures may reduce property damage costs from erosion.
6.4 Water Quality (Hydrologic Unit Improvements) As noted above, many of the NRP water resource management goals and activities are related to the improvement of HUs. These include goals and activities in the targeted reservoir initiative, the targeted watershed initiative, the water resource improvement campaign, partnership programs, and public outreach programs. Specific targets in these programs, including reducing sediment and phosphorous entering streams and reservoirs each year, contribute to the overall goal of improving HUs. TVA rates water quality in each of the 611 Tennessee River watershed HUs (based on the 11-digit US Geological Survey code) using an Index of Biological Integrity

Economic Benefits of the Tennessee Valley Authority’s Natural Resource Plan
6-4 Water Resource Benefits Cardno ENTRIX January 2011
(IBI).41 The IBI measures the biological health of an HU through ecological based metrics for fish and other aquatic life. The IBI rates each HU as poor, fair, or good.
The economic literature on the value of water quality improvement generally provides values related to improved water clarity (as evidenced by effects on residential home prices) or improved recreation experiences (including effects on aesthetics and fish catch rates). However, a recent study analyzed the value to households of increasing the percent of waterbodies in a region that have ‘good’ (rather than ‘not good’) water quality using ratings based on the US Environmental Protection Agency National Water Quality Inventory.42 As this is similar to the goal of TVA for improving the percent of HU that are fair or good, this study was utilized to estimate the value of water quality improvement in the Tennessee River watershed. The 2008 study findings indicate that a one percent increase in the percentage of waterbodies in a region that rate ‘good’ has a mean annual value to households of $32 and a median value of $13. The study found that the value to households decreases as the percentage of ‘good’ quality watersheds increases.
Applying this to the Tennessee Valley, there are 611 HU in the region, so improving one HU to fair or good increases the water quality rating on 0.16 percent of the region’s water bodies. The value per household of improving the water quality on one HU is thus estimated at $0.02 to $0.05 per year for each of the estimated 2.6 million households in the TVA 125-county region, for an average value of $55,000 to $135,000 annually per improved HU. This value embodies the perceived economic value of water quality improvements related to such disparate benefits as enhanced recreation, aesthetics, and health. This value represents an estimated average value of improving one HU in the Tennessee River watershed, and it is important to recognize that as water quality increases across the watershed, the value of each additional HU improvement may decline.
The contribution of many management activities results in the value of improving HUs. It is important to recognize, however, that each of these management actions taken by TVA to improve water quality may reduce the likelihood that another entity will be required to take such actions, and thus may save costs to other entities in the Tennessee Valley. For example, actions by TVA to reduce the amounts of phosphorus entering streams may result in cost savings to other entities that may otherwise been required to reduce phosphorus discharges. The ‘avoided’ costs to other entities of phosphorus reduction may vary from $10 to $330 per pound, depending on the entity and the method used.43 These cost savings would only be realized if these entities 41 Personal communication with Shannon O’Quinn, TVA Water Resources Technical Specialist, October 2010. 42 Viscusi, Kip W., Joel Huber, Jason Bell, 2008, “The Economic Value of Water Quality”, Environmental
Resource Economics, 41(2): 169-187. 43 Hubband, Lisa et al. 2003. “Assessment of Environmental and Economic Benefits Associated With Streambank
Stabilization and Phosphorus Retention.” US Army Engineer Research and Development Center (ERDC), ERDC WQTN-AM-14, accessed at http://www.dtic.mil/cgi-bin/GetTRDoc?AD=ADA417227&Location=U2&doc=GetTRDoc.pdf; Keplinger et al. 2004. “Cost and Affordability of Phosphorus Removal at Small Wastewater Treatment Plants”. Small Flows Quarterly 5(4).; Kepliner et al. 2003. “Economic and Environmental Implications of Phosphorus Controls” Research financed by U.S. Environmental Protection Agency, Office of Policy Development, cooperating agreement number CR 26807-01-1, accessed online at: http://www.envtn.org/uploads/Keplinger_Bosque.pdf.

Economic Benefits of the Tennessee Valley Authority’s Natural Resource Plan
January 2011 Cardno ENTRIX Water Resource Benefits 6-5
would actually be required to implement additional phosphorus reduction measures in the absence of TVA management actions.
6.5 Public Outreach Many elements of public outreach contribute to the improvement of HUs and are included in the water quality improvement value estimated above. In addition, the Tennessee Valley Clean and Green Marina Program, provides value to marina owners and recreators. Several states have established similar programs and have estimated their value. Studies from Virginia and Texas indicate that most marinas participating in clean marina programs feel that the program has brought economic benefits to their marina by reducing costs and increasing revenues..44 The data indicates that approximately 70 percent of participating marinas report increased revenues ranging from $5,000 to $50,000. As marinas responded that the program can actually result in reduced costs, this value is assumed to be a net economic benefit. Assuming that similar benefits are experienced by marinas in the Tennessee Valley Clean and Green Marina Program, the average participating marina may benefit annually by $3,500 to $35,000.
Other NRP water resource management programs may increase water conservation. However, the effect of these programs on reducing water use is not known and the value of the programs cannot be quantified.
44 U.S. EPA, Office of Water, 1996, Environmental and Business Success Stores, “Clean Marinas Clear Value”,
accessed online at: P:\Shared\Projects\TVA\New Material\Clean Marinas Clear Value Success Stories US EPA.mht.; Hall, Peter R. and Thomas J. Murray, 2005, “Why every marina should be a ‘Clean Marina’”, Boat and Motor Dealer, December 2005; Hollin, Dewayne, 2005, “A Proactive Partership for Clean Boating in Texas”, Proceedings of the 14th Biennial Coastal Zone Conference, New Orleans, LA.


January 2011 Cardno ENTRIX Other Benefits 7-1
Chapter 7 Other Benefits: Management Knowledge, Public Perception, and Cost Savings The previous chapters summarize the expected benefits of resource enhancements from NRP management actions. There are two additional benefit categories of NRP management actions and goals:
1. Increased management knowledge and data. Management data and knowledge can increase the effectiveness of TVA resource management and also enhance prioritization of management actions to increase public benefits on TVA-managed lands. TVA leadership in data gathering and development of resource management techniques can also enhance resource management on other public lands.
2. Enhanced partnerships and public perception. TVA resource stewardship actions and collaborative partnerships with other public agencies can foster trust and a positive image to the public and partner agencies. Partnerships may benefit recreationists and visitor users through the TVA service area on both TVA-managed lands and other lands.
Increased management knowledge, partnerships, and enhanced public perception of TVA can enhance resource management and lead to cost savings to TVA and its rate payers. While important and potentially quite large, these benefits are difficult to quantify. In fact, the only quantified benefit is the compliance cost savings estimated by TVA biology resource specialists due to current biological data collection and management. Given the difficulty in quantification, this chapter focuses on identifying the programs that primarily provide these other benefits.
7.1 Summary of Other Benefits Table 7-1 summarizes the specific NRP programs by resource area that prove ‘other benefits’. As shown in the table, all NRP programs will enhance the public perception of TVA as a trusted resource steward. In particular, public perception is expected to be influenced by programs that are most visible to the public and affect the most number of people, such as outreach programs and visitor use programs. Benefits to TVA of a positive public image and public trust include an increased ability to work with the public to execute projects, and, potentially, reduced likelihood of legal challenges to TVA actions from the public.
To cultivate trust and working relationships with local, state, and federal partners, many NRP programs are aimed at developing or strengthening collaborative partnerships. These partnerships increase communication between TVA and regulatory agencies, and streamline the involvement of TVA resource managers in formulating policy that will affect TVA lands and management. This saves cost to TVA and its rate payers by enabling TVA to bring its knowledge to the policy development phase and help to design practical and effective policies and solutions. NRP partnership programs include data sharing, regional planning efforts, economic development efforts, and developing programmatic agreements that will streamline compliance.

Economic Benefits of the Tennessee Valley Authority’s Natural Resource Plan
7-2 Water Resource Benefits Cardno ENTRIX January 2011
All of these efforts have the potential to reduce resourced management costs to TVA and/or partner agencies.
Nearly all biological resource programs and many recreation, cultural, and water resource management programs will provide increased management knowledge and data. This has several benefits, including reduced costs to TVA and enhanced resource management. First, many TVA programs will increase the identification and documentation of sensitive cultural and biological resources. The more that TVA resource managers know about the location and condition of resources, the more that they can incorporate this knowledge early in project planning processes to ensure avoidance of sensitive resources, rather than costlier mitigation and restoration. Additionally, development and maintenance of resource databases can streamline permitting processes as data is available when needed and can eliminate the need for time-intensive and costly fieldwork data collection and analysis. Specific examples of such programs include the Natural Heritage Database in the biological resource management area and the Preservation program database in the cultural resource management area. As estimated by TVA biological resource specialists45, current TVA programs that collect and manage data on sensitive natural resources (Natural Heritage Database, Wetlands Database, Land Condition Assessment, etc), provide cost savings of $4.5 million dollars annually.46 This is the only quantitative estimate available of cost savings, but provides an indication of the importance of data collection and management.
Enhanced resource management and prioritization of management actions and funding is another benefit of management knowledge and data. With more data on resource conditions, TVA recreation, biological, cultural, and water resource managers can better prioritize management actions to ensure optimum public benefit. For example, recreation assessment and design tools will increase management knowledge regarding level of use, user perception of recreation resources, and condition of resources. This data will aid managers in enhancing both visitor experience and resource quality.
45 Personal communication with Wesley James and John Baxter, TVA Biological Resource Specialists, November
2010. 46 This estimate is based on the comparative time to prepare EA’s by TVA and by the Department of Energy
(DOE). On average, TVA requires ½ the length of time to prepare EA’s. DOE costs are estimated at approximately $120,000 per EA, so TVA may save approximately $60,000 in preparation costs per EA. As there are approximately 300 EA’s prepared annually, this translates into cost savings of approximately $18 million. Additionally, TVA estimates that the biological resource databases reduce the staff time required to review 26a permits by 5 full-time equivalents annually. Using an average annual compensation rate of approximately $100,000, this provides cost savings of $500,000. Combined then, the biological resource data collection and information management programs currently provide an estimated cost savings of approximately $18.5 million.

Economic Benefits of the Tennessee Valley Authority’s Natural Resource Plan
January 2011 Cardno ENTRIX Other Benefits 7-1
Table 7-1 Summary of Programs Providing Management Knowledge, Partnerships, and Public Perception Benefits
Management Activity / Goal Management Knowledge and Data Partnerships & Public Image
Cost Savings
Recreation Management
All Management Activities and Goals
Positive perception of enhanced and maintained recreation and visitor use experience.
Campground Management
Establish flagship campgrounds with innovative design and efficiency measures
Research and development and leadership in innovative design that can be shared with other public land managers
(Positive perception of enhanced and maintained recreation and visitor use experience)
Day Use Areas Management
Implement sustainable initiatives at day use areas
Research and development and leadership in innovative design that can be shared with other public land managers
(Positive perception of enhanced recreation and visitor use experience.)
Develop blue-way miles per year contingent upon available partnerships
Strengthen partnerships (in addition to enhanced public image from improving recreation opportunities)
Assist with development (as appropriate) of greenway miles
Strengthen partnerships (in addition to enhanced public image from improving recreation opportunities)
Assist partners with acquisition and development of additional stream access sites (as appropriate)
Strengthen partnerships (in addition to enhanced public image from improving recreation opportunities)
Recreation Assessment and Design Tools All Programs Increased management knowledge regarding
level of use, user perception of recreation resources, and condition of resources.
Better prioritization of program funding to maximize value from recreation resource expenditures.
Partner with state boating law administrators to complete comprehensive boating density assessments per year
Strengthen partnerships (in addition to enhanced public image from improving recreation opportunities)
Public Outreach Clean and Green Campground Initiative
Research and development and leadership in innovative design that can be shared with other public land managers
(Positive perception of enhanced recreation and visitor use experience.)
Establish the CF&TF to leverage funding for conservation, environmental, and/or recreation project(s) across the Valley
Potential funding for additional management data collection.
Strengthen partnerships (in addition to enhanced public image from improving recreation opportunities and conservation projects)
Potential increase in grant funding for TVA projects, thereby reducing TVA costs
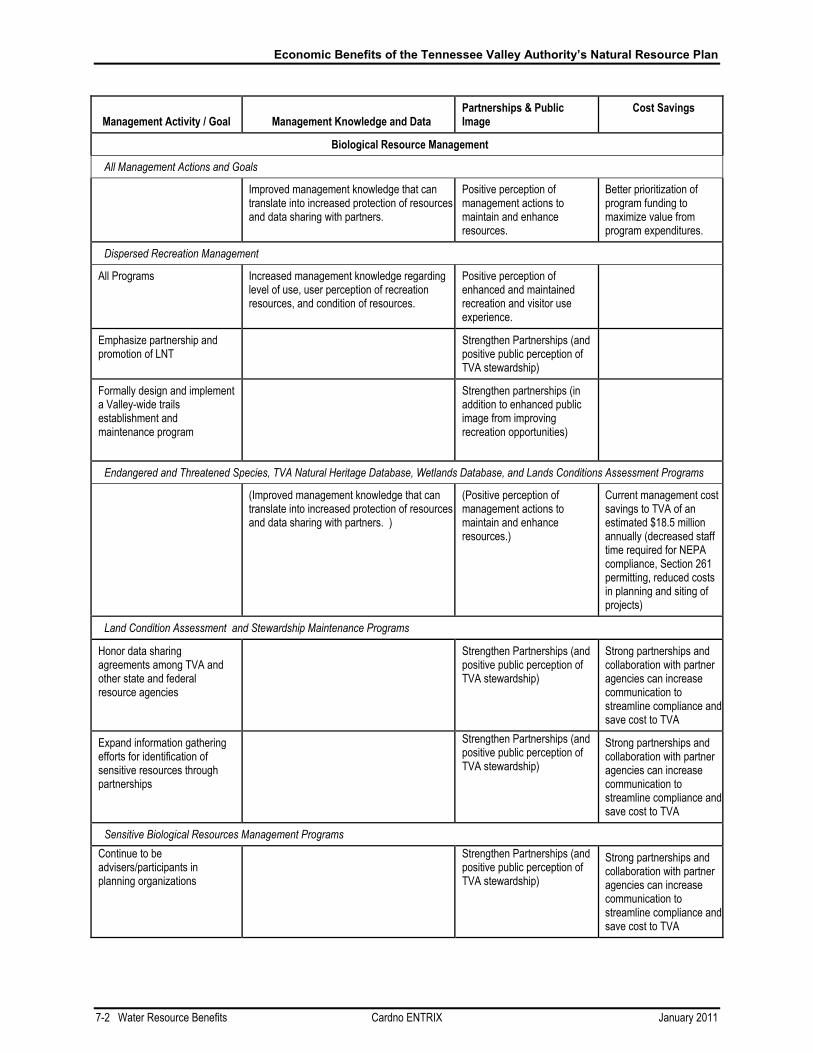
Economic Benefits of the Tennessee Valley Authority’s Natural Resource Plan
7-2 Water Resource Benefits Cardno ENTRIX January 2011
Management Activity / Goal Management Knowledge and Data Partnerships & Public Image
Cost Savings
Biological Resource Management
All Management Actions and Goals
Improved management knowledge that can translate into increased protection of resources and data sharing with partners.
Positive perception of management actions to maintain and enhance resources.
Better prioritization of program funding to maximize value from program expenditures.
Dispersed Recreation Management
All Programs Increased management knowledge regarding level of use, user perception of recreation resources, and condition of resources.
Positive perception of enhanced and maintained recreation and visitor use experience.
Emphasize partnership and promotion of LNT
Strengthen Partnerships (and positive public perception of TVA stewardship)
Formally design and implement a Valley-wide trails establishment and maintenance program
Strengthen partnerships (in addition to enhanced public image from improving recreation opportunities)
Endangered and Threatened Species, TVA Natural Heritage Database, Wetlands Database, and Lands Conditions Assessment Programs
(Improved management knowledge that can translate into increased protection of resources and data sharing with partners. )
(Positive perception of management actions to maintain and enhance resources.)
Current management cost savings to TVA of an estimated $18.5 million annually (decreased staff time required for NEPA compliance, Section 261 permitting, reduced costs in planning and siting of projects)
Land Condition Assessment and Stewardship Maintenance Programs
Honor data sharing agreements among TVA and other state and federal resource agencies
Strengthen Partnerships (and positive public perception of TVA stewardship)
Strong partnerships and collaboration with partner agencies can increase communication to streamline compliance and save cost to TVA
Expand information gathering efforts for identification of sensitive resources through partnerships
Strengthen Partnerships (and positive public perception of TVA stewardship)
Strong partnerships and collaboration with partner agencies can increase communication to streamline compliance and save cost to TVA
Sensitive Biological Resources Management Programs Continue to be advisers/participants in planning organizations
Strengthen Partnerships (and positive public perception of TVA stewardship)
Strong partnerships and collaboration with partner agencies can increase communication to streamline compliance and save cost to TVA

Economic Benefits of the Tennessee Valley Authority’s Natural Resource Plan
January 2011 Cardno ENTRIX Water Resource Benefits 7-3
Management Activity / Goal Management Knowledge and Data Partnerships & Public Image
Cost Savings
Expand role in large-scale planning efforts across the region via partnerships
Strengthen Partnerships (and positive public perception of TVA stewardship)
Strong partnerships and collaboration with partner agencies can increase communication to streamline compliance and save cost to TVA
Develop a list of target-listed species; develop and monitor management plans; actively seek partnerships; and, catalog select species where management opportunities exist within the region
Strengthen Partnerships (and positive public perception of TVA stewardship)
Strong partnerships and collaboration with partner agencies can increase communication to streamline compliance and save cost to TVA
Provide level of data to support national and regional planning efforts for migratory birds; Participate in national and regional planning efforts
Strengthen Partnerships (and positive public perception of TVA stewardship)
Strong partnerships and collaboration with partner agencies can increase communication to streamline compliance and save cost to TVA
Continue leadership role in Tennessee River Valley Shorebird Working Group
Strengthen Partnerships (and positive public perception of TVA stewardship)
Strong partnerships and collaboration with partner agencies can increase communication to streamline compliance and save cost to TVA
Cooperate with partners to implement conservation projects for migratory birds on TVA-managed lands and implement demonstration projects to benefit regional habitat objectives for migratory birds per year
Strengthen Partnerships (and positive public perception of TVA stewardship)
Strong partnerships and collaboration with partner agencies can increase communication to streamline compliance and save cost to TVA
Partner to inventory and monitor waterfowl and other water bird populations along TVA reservoirs
Strengthen Partnerships (and positive public perception of TVA stewardship)
Strong partnerships and collaboration with partner agencies can increase communication to streamline compliance and save cost to TVA
Terrestrial Habitat Management Programs
Work with local and regional partners to incorporate nature-based tourism into management of dewatering areas projects
Strengthen Partnerships (and positive public perception of TVA stewardship)
Strong partnerships and collaboration with partner agencies can increase communication to streamline compliance and save cost to TVA
Provide support to state forestry assessment plans
Increase data for landscape level management.
Strengthen Partnerships (and positive public perception of TVA stewardship)
Strong partnerships and collaboration with partner agencies can increase communication to streamline compliance and save cost to TVA

Economic Benefits of the Tennessee Valley Authority’s Natural Resource Plan
7-4 Water Resource Benefits Cardno ENTRIX January 2011
Management Activity / Goal Management Knowledge and Data Partnerships & Public Image
Cost Savings
Habitat Enhancement Partnerships: Engage existing partners in the management of licensed lands to align management goals with the Environmental Policy
Strengthen Partnerships (and positive public perception of TVA stewardship)
Strong partnerships and collaboration with partner agencies can increase communication to streamline compliance and save cost to TVA
Actively participate in State Exotic Pest Plant Councils along with regional early detection and rapid response initiatives
Strengthen Partnerships (and positive public perception of TVA stewardship)
Strong partnerships and collaboration with partner agencies can increase communication to streamline compliance and save cost to TVA
Nuisance Animal Control: Develop programmatic guidelines for addressing nuisance animals; establish MOA with agencies responsible for regulating wildlife; and, develop and share BMPs with partners
Strengthen Partnerships (and positive public perception of TVA stewardship)
Strong partnerships and collaboration with partner agencies can increase communication to streamline compliance and save cost to TVA; reduce costs through Memorandum of Agreement (MOA)
Terrestrial Greenhouse Management
All Programs Data on carbon sequestration rates and techniques
Enhanced management knowledge can reduce future compliance costs with pending carbon regulation.
Enter into third-party consortiums focusing on issues related to terrestrial GHG management practices
Strengthen Partnerships (and positive public perception of TVA stewardship)
Strong partnerships and collaboration with partner agencies can increase communication to streamline compliance and save cost to TVA
Cultural Resource Management
All Management Actions and Goals
Improved management knowledge and data that can translate into increased protection of resources and data sharing with partners.
Positive perception of management actions to maintain and enhance resources.
Better prioritization of program funding to maximize value from program expenditures.
Preservation Program DATABASE: Maintain current/ Develop a comprehensive database
Improved management knowledge that can translate into increased protection of resources and data sharing with partners.
Decreased costs through savings in staff time and field work due to better storage and retrieval of data; Increased management knowledge and prioritization of management actions.

Economic Benefits of the Tennessee Valley Authority’s Natural Resource Plan
January 2011 Cardno ENTRIX Water Resource Benefits 7-5
Management Activity / Goal Management Knowledge and Data Partnerships & Public Image
Cost Savings
Improve preservation program; develop implementation procedures and a comprehensive database
Improved management knowledge that can translate into increased protection of resources and data sharing with partners.
Decreased costs through savings in staff time and field work due to better storage and retrieval of data; Increased management knowledge and prioritization of management actions.
Preserve America Target to develop new partnerships per year to promote heritage tourism , historic properties and local governments
Strengthen Partnerships (and positive public perception of TVA stewardship)
Strong partnerships and collaboration with partner agencies can increase communication to streamline compliance and save cost to TVA
Improve preservation program; develop implementation procedures and a comprehensive database
Improved management knowledge that can translate into increased protection of resources and data sharing with partners.
Decreased costs through savings in staff time and field work due to better storage and retrieval of data; Increased management knowledge and prioritization of management actions.
NHPA Section 106
Establish a program for managing existing mitigation obligations
Streamlining Section 106 compliance would decrease compliance cost and decrease staff time requirements
Pursue a programmatic agreement with individual states regarding compliance for repetitive actions
Strengthen Partnerships (and positive public perception of TVA stewardship)
Streamlining Section 106 compliance would decrease compliance cost and decrease staff time requirements
Develop emergency procedures for requirements under NHPA Section 106
Streamlining Section 106 compliance would decrease compliance cost and decrease staff time requirements
Water Resource Management
All Activities / Goals
Improved management knowledge that can translate into increased protection of resources and data sharing with partners.
Positive perception from actions to improve water quality, water conservation, and shoreline stabilization.

Economic Benefits of the Tennessee Valley Authority’s Natural Resource Plan
7-6 Water Resource Benefits Cardno ENTRIX January 2011
Management Activity / Goal Management Knowledge and Data Partnerships & Public Image
Cost Savings
Water Resource Improvement Programs
Data Sharing Strengthen Partnerships (and positive public perception of TVA stewardship)
Strong partnerships and collaboration with partner agencies can increase communication to streamline compliance and save cost to TVA
Partnership Programs
Maintain existing relationships, partnerships, and/or third party agreements
Strengthen Partnerships (and positive public perception of TVA stewardship)
Strong partnerships and collaboration with partner agencies can increase communication to streamline compliance and save cost to TVA
Develop new/enhance existing relationships, partnerships, and/or third party agreements
Strengthen Partnerships (and positive public perception of TVA stewardship)
Strong partnerships and collaboration with partner agencies can increase communication to streamline compliance and save cost to TVA
Case studies / research projects implemented and exported
Strengthen Partnerships (and positive public perception of TVA stewardship)
Strong partnerships and collaboration with partner agencies can increase communication to streamline compliance and save cost to TVA

January 2011 Cardno ENTRIX List of Preparers 8-1
Chapter 8 List of Preparers Principal-in-Charge .............................................................. Dr. Doug MacNair, Ph.D., Economics
Project Manager ................ Barbara Wyse, M.S., Environmental and Natural Resource Economics
Analysis.................................................................................. John Cary, M.A. Applied Economics
Analysis............................................. Rush Childs, M.E.M., Environmental Economics and Policy


January 2011 Cardno ENTRIX References 9-1
Chapter 9 References American Association of Museums. (2010). "2006 Museum Finacial Information." 2010, from
http://www.aam-us.org/aboutmuseums/abc.cfm#visitors.
Aiken, R. (2009). Net Economic Values of Wildlife-Related Recreation in 2006: Addendum to the 2006 National Survey of Fishing, Hunting, and Wildlife-Associated Recreation. U. S. F. a. W. Service. Washington, D.C., U.S. Fish and Wildlife Service.
Bergstrom, J. C. and G. Bhat (1996). Ecoregional Estimates of the Net Economic Value of Outdoor Recreational Activities in the United States: Individual Model Results. Washington D.C., U.S.D.A. Forest Service: 69.
Bergstrom, J. C. and H. K. Cordell (1991). "An Analysis of the Demand for and Value of Outdoor Recreation in the United States." Journal of Leisure Research 23(1): 67-86.
Bhat, G., J. C. Bergstrom, et al. (1998). "An ecoregional Approach to the Economic Valuation of Land- and Water-Based Recreation in the United States." Environmental Management 22(1): 69-77.
Boyle, K. J., B. Roach, et al. (1998). 1996 Net Economic Values for Bass, Trout and Walleye Fishing, Deer, Elk and Moose Hunting, and Wildlife Watching: Addemdum to the 1996 National Survey of Fishing, Hunting and Wildlife-Associated Recreation. Washington D.C., U.S. Fish and Wildlife Service: 40.
Casey, J. F., T. Vukina, et al. (1995). "The Economic Value of Hiking: Further Considerations of Opportuntiy Cost of Time in Recreational Demand Models." Journal of Agriculture and Applied Economics 27(2): 658-668.
Chambers, C. M., P. E. Chambers, et al. (1998). "Contingent Valuation of Quasi-Public Goods: Validity, Reliability, and Application To Valuing a Historic Site." Public Finance Review 26: 137-154.
Cho, S.-H., C. D. Clark, et al. (2009). "Spatial and Temporal Variation in the Housing Market Values of Lot Size and Open Space." Land Economics 85(1): 51-73.
The Chronicle of Philanthropy, June 8, 2010, “Environmental Groups Chalk up 2.7% Increase in Gifts, Report Finds”, accessed online at: http://philanthropy.com/article/Environmental-Groups-Chalk-Up/65817/.
Condo, B., and P.W. Bettoli. 2000. Survey of the recreational fishery in the Duck River. Fisheries Report 00-32, Tennessee Wildlife Resources Agency, Nashville.

Economic Benefits of the Tennessee Valley Authority’s Natural Resource Plan
9-2 References Cardno ENTRIX January 2011
Culliney, Thomas W. 2005. “Benefits of Classical Biological Control for Managing Invasive Plants”.Critical Reviews in Plant Science (24): 131-150.
Desvousges, W., F.R. Johnson, R. Dunford, K. Boyle, S. Hudson, and K. Wilson. 1992. Measuring natural resource damages with contingent valuation: tests of validity and reliability. Research Triangle Institute, NC.
Green, G. T., K. Cordell, H. Fleming and C. Betz. 2006. A Report Submitted to the Tennessee Valley Authority, By the Outdoor Recreation & Wilderness Assessment Group, Southern Research Station, USDA Forest Service, Athens, Georgia.
Hall, Peter R. and Thomas J. Murray, 2005, “Why every marina should be a ‘Clean Marina’”, Boat and Motor Dealer, December 2005.
Harris Interactive, 2000, Exploring Public Perceptions and Attitudes about Archaeology, Prepared for the Society for American Archaeology.
Hine, Rachel, Jo Peacock, and Jules Pretty. 2008. “Evaluating the impact of environmental volunteering on behaviours and attitudes to the environment,” Report for the British Trust of Conservation Volunteers.
Hollin, Dewayne, 2005, “A Proactive Partership for Clean Boating in Texas”, Proceedings of the 14th Biennial Coastal Zone Conference, New Orleans, LA.
House, K. P. (1995). Valuation of Hiking Trail Attributes Using a Hedonic Travel Cost Analysis. Reno, University of Nevada. Master of Science in Agricultral Economics: 117.
Hubband, Lisa et al. (2003). “Assessment of Environmental and Economic Benefits Associated With Streambank Stabilization and Phosphorus Retention.” US Army Engineer Research and Development Center (ERDC), ERDC WQTN-AM-14, accessed at http://www.dtic.mil/cgi-bin/GetTRDoc?AD=ADA417227&Location=U2&doc=GetTRDoc.pdf
Irwin, E. g. (2002). The Effects of Open Space on Residential Property Values, Ohio State University: 23.
Kepliner et al. 2003. “Economic and Environmental Implications of Phosphorus Controls” Research financed by U.S. Environmental Protection Agency, Office of Policy Development, cooperating agreement number CR 826807-01-1, accessed online at: http://www.envtn.org/uploads/Keplinger_Bosque.pdf.
Keplinger et al. 2004. “Cost and Affordability of Phosphorus Removal at Small Wastewater Treatment Plants”. Small Flows Quarterly 5(4).
Knoche, S. and F. Lupi (2007). "Valuing deer hunting ecosystem services from farm landscapes." Ecological Economics 64: 313-320.

Economic Benefits of the Tennessee Valley Authority’s Natural Resource Plan
January 2011 Cardno ENTRIX References 9-3
Kotchen and Reiling. 2000. “Environmental Attitudes, Motivations, and contingent valuation of nonuse values: a case study involving endangered species.” Ecological Economics 32: (93-107).
Loomis, J. (2003). "Travel cost demand model based river recreation benefit estimates with on-site and household surveys: Comparative results and a correction procedure." Water Resources Research 39(4): WES 5-1:5-4.
Loomis, J. and D. White (1996). Economic benefits of rare and endangered species: Summary and meta analysis. Colorado State University. Fort Collins, CO.
McKean, J. R., D. Johnson, et al. (2005). "Willingness to Pay for Non Angler Recreation at the Lower Snake River Reservoirs." Journal of Leisure Research 37(2): 178-194.
Murray, B., A. Jenkins, et al. (2010). "Valuing Ecosystem Services from Wetlands Restoration in the Mississippi Alluvial Valley." Ecological Economics 69(15): 1051-1061.
O’Brien, Liz, Mardle Townsend, and Matthew Ebden. 2008. “Environmental Volunteering: Motivations, Barriers, and Benefits,” Report to the Scottish Forestry Trust and Forestry Commission.
Olson, Lars. 2005. “The Economics of Terrestrial Invasive Species: A Review of the Literature.” Agricultural and Resource Economics Review. 35(1): 178-194.
Personal communication with Erin Pritchard, TVA Cultural Resource Specialist, November, 2010.
Personal communication with Jerry Fouse, TVA Recreation Resource Specialist, October 2010.
Personal communication with Jerry Fouse, TVA Recreation Resource Specialist, November 2010.
Personal communication with Shannon O’Quinn, TVA Water Resources Technical Specialist, October 2010.
Personal communication with Wesley James and John Baxter, TVA Biological Resource Specialists, November 2010.
Poor, P. J. and J. M. Smith (2004). "Travel Cost Analysis of a Cultural Heritage Site: The Case of Historic St. Mary's City of Maryland." Journal of Cultural Economics 28: 217-229.
Reaves, Kramer, and Holmes (1999). Does Question Format Matter? Valuing Endangered Species. Environmental and Resource Economics (14): 365 – 383.
Regional Resource Stewardship Council (2001). “Recommended policy on improving biodiversity in the Tennessee River System”, accessed at http://www.tva.gov/rrsc/readingroom/biodiversityrec.htm.

Economic Benefits of the Tennessee Valley Authority’s Natural Resource Plan
9-4 References Cardno ENTRIX January 2011
Rockel, M. L. and M. J. Kealy (1991). "The Value of Nonconsumptive Wildlife Recreation in the United States." Land Economics 67(4): 422-434.
Reeves, W. C. and P. W. Bettoli (2001). Duck River Creel Survey May-October 2000, Tennessee Wildlife Resources Agency: 14.
Schexnayder, S., B. Stephens, et al. (2009). Recreation Use on Nickajack Reservoir. Knoxville, University of Tennessee Agriculture Institute: 39.
Siderelis, C., G. Brothers, et al. (1995). "A Boating Choice Model for the Valuation of Lake Access." Journal of Leisure Research 27(3): 264-282.
Society for American Archaeology, Professional Standards for the Determination of Archaeological Value”, accessed at: http://www.saa.org/Portals/0/SAA/GovernmentAffairs/ARPAstandards.pdf.
Stephens, B., L. Didier, et al. (2006). Recreation Use on Fort Loudoun Reservoir. Knoxville, University of Tennessee Agriculture Institute: 16.
Stephens, B., L. Didier, et al. (2006). Recreation Use on Douglas Reservoir. Knoxville, University of Tennessee Agriculture Institute: 18.
Stephens, B., L. Didier, et al. (2006). Recreation Use on Kentucky Reservoir. Knoxville, University of Tennessee Agriculture Institute: 17.
Stephens, B., L. Didier, et al. (2006). Recreation Use on Melton Hill Reservoir. Knoxville, University of Tennessee Agriculture Institute: 17.
Stephens, B., L. Didier, et al. (2006). Recreation Use on Mountain Group Reservoir. Knoxville, University of Tennessee Agriculture Institute: 17.
Stephens, B., L. Didier, et al. (2006). Recreation Use on Norris Reservoir. Knoxville, University of Tennessee Agriculture Institute: 17.
Sumner, D.A., H. Brunke, and M. Kreith. 2006. “Agricultural Costs and Benefits of Government Invasive Species Control Actions in California. University of California Agricultural Issues Center.
Taylor, D. T., R. R. Fletcher, et al. (1993). "A Comparison of Characteristics, Regional Expenditures, and Economic Impact of Visitors to Historical Sites with Other Recreational Visitors." Journal of Travel Research 32: 30-35.
Tennessee Valley Authority (2009). Campground Occupancy Report for FY 03-09.
Tennessee Valley Authority (2004). Reservoir Operations Study Final Environmental Impact Statement, Section 4.10 Terrestrial Ecology, accessed at http://www.tva.com/environment/reports/ros_eis/4-10_terrestrial_ecology.pdf.

Economic Benefits of the Tennessee Valley Authority’s Natural Resource Plan
January 2011 Cardno ENTRIX References 9-5
Tol, Richard, 2009, ‘The economic effects of climate change,’ Journal of Economic Perspectives, Vol 23 No.2.
Upneja, A., E. L. Shafer, et al. (2001). "Economic Benefits of Sport Fishing and Angler Wildlife Watching in Pennsylvania." Journal of Travel Research 40: 68-78.
U.S. Army Corps of Engineers (2006). Value to the Nation, Fast Facts, Lake Level Reports, downloaded at http://www.corpsresults.us/recreation/recfastfacts.asp.
U.S. Bureau of Labor Statistics, 2010, Occupational Employment Statistics, “2009 Tennessee Occupational Employment and Wage Estimates”, Accessed online at: http://www.bls.gov/oes/current/oes_tn.htm#19-0000.
U.S. Census Bureau (2009). "American FactFinder American Community Survey." Retrieved October 2010, from http://factfinder.census.gov/servlet/DatasetMainPageServlet?_program=ACS&_submenuId=datasets_4&_lang=en&_ts=.
U.S. EPA, Office of Water, 1996, Environmental and Business Success Stores, “Clean Marinas Clear Value”, accessed online at: P:\Shared\Projects\TVA\New Material\Clean Marinas Clear Value Success Stories US EPA.mht.
U.S. Forest Service (2009). National Visitor Use Monitoring Results, Data Collected FY2007, Cherokee National Forest, accessed online at http://www.fs.fed.us/recreation/programs/nvum/2009/Cherokee_FY2007.pdf.
U.S. National Fish and Wildlife Service, Wheeler National Wildlife Refuge Facts, accessed online at: http://www.fws.gov/southeast/pubs/facts/wlrcon.pdf.
Viscusi, Kip W., Joel Huber, Jason Bell (2008), “The Economic Value of Water Quality”, Environmental Resource Economics, 41(2): 169-187.
Williams, J. S. and P. W. Bettoli (2003). Net Value of Trout Fishing Opportunities in Tennessee Tailwaters: A Final Report Submitted to the tennessee Wildlife Resources Agency. Fisheries Report. Cookeville, Tennessee Cooperative Fishery Research Unit and Tennessee Technological University: 63.
Woodward, Richard and Yong-Suhk Wui. 2001. “The economic value of wetland services, a meta-analysis.” Ecological Economics, (37): 257-270.
Zawacki, W. T., A. Marsinko, et al. (2000). "A Travel Cost Analysis of Noncomsumptive Wildlife- Associated Recreation in the United States." Forest Science 46(4): 496-506.


Appendix A
Overview of Two Types of Economic Effects


January 2011 Cardno ENTRIX A-1
Appendix A Overview of Two Types of Economic Effects
A.1 Economic Benefits Economists measure the benefit to consumers of a good or service as the difference between the price consumers pay for the good or service, and the benefit they derive from it (which is measured as the maximum price they would be willing to pay, and commonly referred to as willingness-to-pay or WTP). For example, if a recreationist is willing to pay $100 for a boating trip at a TVA reservoir, but only has to pay $75, then the recreationist has a net benefit, or increase in well-being, from the trip equal to $25. Assuming all other things equal, a change, or increase, in this well-being from the consumption of goods and services can thus occur either because the price falls, or because the quality of the good or service rises and results in increased value to (or WTP by) the consumer. In the case of the NRP, such improved well-being may arise if the NRP increases the quantity or quality of resources on TVA lands due to the NRP (than would otherwise occur in the absence of NRP). For example, the NRP may result in increased well-being (and WTP) if improved habitat quality increases the quality of goods and services provided by the habitat, such as hunting and fishing trips. If increased investment in public education and scientific knowledge occurs due to the NRP, this too may cause increased well-being by causing personal preferences to change. If personal preferences change, such that public perception and enjoyment of environmental attributes increases for a given level of resource quality/quantity, the NRP will also increase well-being for environmental attributes even without changes in resource quality/quantity.
A.2 Economic Impacts Regional economic impact analysis can provide an assessment of the potential localized effects in the Valley of the NRP. Specifically, regional economic impact analysis produces a quantitative estimate of the potential magnitude of the initial change in regional economic “activity”, resulting from an action such as resource enhancement. Regional economic impacts are commonly measured using regional input/output models. These models rely on multipliers that represent the relationship between a change in one sector of the economy (e.g., expenditures by recreationists) and the effect of that change on economic output, income, or employment in other local sectors (e.g., suppliers of goods and services to recreationists). These economic data provide a numerical estimate of the magnitude of growth or contraction of jobs, income, and transactions in a specific local economy. These economic impacts reflect “activity” (i.e., they characterize “transfers” among local or regional components of the broader economy), not “net” changes in the economy, as a whole. As these impacts generally reflect shifts in resource use, rather than net welfare losses or gains, these types of distributional impacts must be reported separately from net benefit effects (i.e., these values cannot be summed). As this is an economic benefits analysis and not an economic impact analysis, the economic development aspects of the NRP are not analyzed.


Appendix B
Summary of NRP Benefits by Resource Area

January 2011 Cardno ENTRIX B-1
Appendix B Summary of NRP Benefits by Resource Area Tables B-1 through B-4 present the estimated benefits of NRP programs in summary form in the management option tables for Recreation Resources, Cultural Resources, Biological Resources, and Water Resources, respectively. For activities for which dollar values were able to be quantified, dollar values are presented in the tables under each management option. These values represent the expected value of implementing a given activity/goal at the level specified in the management option. For example, in the dispersed recreation management program, the value of the activity/goal of “Add __ trail miles per year in accordance with Dispersed Recreation multi-year plans” is based on 20 miles of new trail under the Flagship Management Option (estimated value of $2 million to $3 million per year), while it is valued for 10 miles of new trail under Enhanced Management option (estimated value of $1 million to $1.5 million per year). All activities/goals with the same implementation level across management options (i.e. there is no difference between management options) are highlighted in grey.

Economic Benefits of the Tennessee Valley Authority’s Natural Resource Plan
B-2 Cardno ENTRIX January 2011
Table B-1 Summary of Recreation Program Benefits by Management Option
Program Category Program Goals and Activities
Management Options
Valuation Notes Current Mgmt
Custodial Mgmt
Enhanced Mgmt
Flagship Mgmt
Campground Management
Located on Dam or Power Plant Reservations
Manage 8 campgrounds 8 Campgrounds: $1.4 to $4.7 million / year
8 Campgrounds: $1.4 to $4.7 million / year
8 Campgrounds: $1.4 to $4.7 million / year
8 Campgrounds: $1.4 to $4.7 million / year
The average TVA campground has 6500 nights occupied per year. Value of camping is estimated to average of $9 to $30 per day per person. Based on average length of stay 2 nights (so 3 days of camping for every 2 nights of campground occupancy) and 2 people per site, average value per site occupancy is $27 to $90. Average recreational value per campground is thus estimated at $180,000 to $590,000.
Campground Management
Located on Dam or Power Plant Reservations
Make __ proactive upgrades consistent with ADAAG (on dam campgrounds)
2; Assuming 8 campsites, $20,000 / year to $70,000 / year
1; Assuming 4 campsites, $10,000 / year to $35,000 / year
4; Assuming 15 campsites, $40,000 to $130,000 / year
8 campgrounds, Assuming 30 campsites, $75,000 to $255,000 / year
There are nearly 1 million people who are non-institutional disabled residents in the TVA region (15% of residents). Non-ADAAG camp sites are occupied on average for 120 nights per year. ADAAG sites are estimated to have 90% occupancy during the 8 month camping season, for an average occupancy of 216 nights. Increased occupancy of 95 nights per site, with a value of $27 to $90 per site occupancy, implies a benefit of $2500 to $8500 per year per site.
Campground Management
Located on Dam or Power Plant Reservations
Establish flagship campgrounds with innovative design and efficiency measures
1 campground; 6,500 visits / year
1 campground; 6,500 visits/ year
Enhance public perception and public awareness of renewable energy and water efficiency measures, and develop techniques for use elsewhere. Increased value to recreationists also possible. The average TVA campground has 6,500 visits (number of nights sites are occupied) per year. Value of carbon emission reduction / sequestration is estimated at $10 to $40 per metric ton.
Campground Management
Located on Other Reservoir Properties
Manage __ campgrounds through third party agreements (or close the campgrounds)
4 campgrounds: $0.7 to $2.3 million per year
3 campgrounds: $0.54 to $1.77 million per year
4 campgrounds: $0.7 to $2.3 million per year
4 campgrounds: $0.7 to $2.3 million per year
Average recreational value per campground is thus estimated at $180,000 to $590,000 (see above for derivation).
Campground Management
Located on Other Reservoir Properties
Make __ proactive upgrades consistent with ADAAG (off dam campgrounds)
3; Assuming 12 campsites, $30,000 to $100,000 / year
4; Assuming 15 campsites, $40,000 to $130,000 / year
Non-ADAAG camp sites are occupied on average for 120 nights per year. ADAAG sites are estimated to have 90% occupancy during the 8 month camping season, for an average occupancy of 216 nights. Increased occupancy of 94 nights per site, with a value of $27 to $90 per site occupancy, implies a benefit of $2500 to $8500 per year per site .
Campground Management
Located on Other Reservoir Properties
Seek contractual agreements to manage campgrounds located on other reservoir properties
• • • • Average recreational value per campground is estimated at $180,000 to $590,000. The quality of the camping recreation experience at contractual agreement campgrounds vs. TVA campgrounds is not known; however, if quality is reduced at contractual agreement campgrounds then the value would also be reduced.

Economic Benefits of the Tennessee Valley Authority’s Natural Resource Plan
January 2011 Cardno ENTRIX B-3
Table B-1 Summary of Recreation Program Benefits by Management Option
Program Category Program Goals and Activities
Management Options
Valuation Notes Current Mgmt
Custodial Mgmt
Enhanced Mgmt
Flagship Mgmt
Day Use Areas Management
Day Use Areas - On Dam
Continue to operate and manage 30 day use areas located on dam reservations
30 day use areas : $4.2 to $14 million /year
30 day use areas : $4.2 to $14 million /year
30 day use areas : $4.2 to $14 million /year
30 day use areas : $4.2 to $14 million /year
Recreational values for day use areas range from $12-40 based on the type of activity. Based on data from the reservoir site visitation from the University of Tennessee and the proportion of day use areas managed by TVA, each TVA day use area Is estimated to receive 11,700 visits annually, for a value of $140,000 to $470,000 annually.
Day Use Areas Management
Day Use Areas - On Dam
Implement __ sustainable initiatives per year
1: Educate and benefit 12,000 users
0 2: Educate and benefit 23,000 users
4: Educate and benefit 46,000 users
Enhance public perception and public awareness of renewable energy and water efficiency measures; development of techniques for use elsewhere. Increased value to recreationists also possible. The average TVA day use site has an estimated 11,700 visits per year. The change in visitation or per day value as a result of sustainable initiatives is unknown but likely positive. Value of carbon emission reduction / sequestration is estimated at $10 to $40 per metric ton.
Day Use Areas Management
Day Use Areas - Off Dam
Continue to operate and manage __ day use areas located off dam reservations
0 to 33 day use areas : $0 (0 day use areas) to $4.6 to $15.4 million / year (33 day use areas)
0 day use areas (required)
0 to 33 day use areas : $0 (0 day use areas) to $4.6 to $15.4 million / year (33 day use areas)
0 to 33 day use areas : $0 (0 day use areas) to $4.6 to $15.4 million / year (33 day use areas)
Based on survey data, there are an estimated 8.7 million recreational users of day use areas on TVA reservoirs, of which TVA-managed areas represents approximately 8%. Assuming 8% of day use area recreation is at TVA-managed areas, results in 735,000 TVA day area users, or 11,700 day area users per day use area. Recreational values for day use areas range from $12-40 based on the type of activity, for a value of $140,000 to $470,000 per day use area.
Day Use Areas Management
Day Use Areas - Off Dam
Proactively upgrade __ day use areas consistent with ADAAG per year
1 Facility: potentially benefit 1,750 current day use facility users.
2 Facilities as capital upgrades occur: potentially benefit 3,500 current day use facility users.
4 Facilities: potentially benefit 7,000 current day use facility users.
There are nearly 1 million people who are non-institutional disabled residents in the TVA region (15% of residents). The change in the probability of visitation for disabled recreator to dam reservations due to upgrades is unknown. Assuming that 15% of current recreation users would benefit from access improvements results in benefits to approximately 1,750 users at each day use area.
Day Use Areas Management
Day Use Areas - Off Dam
Seek contractual agreements (CA) for __ day use areas located off dam reservations
0 to 33 day use areas : $0 (0 day use areas) to $4.6 to $15.4 million / year (33 day use areas)
0 day use areas (required)
0 to 33 day use areas : $0 (0 day use areas) to $4.6 to $15.4 million / year (33 day use areas)
0 to 33 day use areas : $0 (0 day use areas) to $4.6 to $15.4 million / year (33 day use areas)
The site quality change due to contractual agreements for day use areas is unknown, but would cause a change in recreation use value.

Economic Benefits of the Tennessee Valley Authority’s Natural Resource Plan
B-4 Cardno ENTRIX January 2011
Table B-1 Summary of Recreation Program Benefits by Management Option
Program Category Program Goals and Activities
Management Options
Valuation Notes Current Mgmt
Custodial Mgmt
Enhanced Mgmt
Flagship Mgmt
Day Use Areas Management
Greenways Assist with development (as appropriate) of __ greenway miles per year
10 miles: $100,000 to $200,000 / year
20 miles: $200,000 to $400,000 / year
Value per greenway miles is estimated at $10,000-20,000 per mile for greenway, based on increased property values of homes near greenways and the density of homes near Lenoir City and Oak Ridge TN (example greenway location). We used household density within 1 square mile and increased value of $171 per household.
Day Use Areas Management
Stream Access Sites
Manage __stream access sites on TVA-managed lands
31 by TVA: $135,000 - $370,000
31 by TVA: $135,000 - $370,000
16 by TVA: $70,000 - $190,000
0 by TVA: We estimate 440 annually visits per stream access site base on creel survey on the Duck River and expand to include other users as a percentage of angling based on TVA trend analysis and a value of $10 to $27 per visit. So this is $4,000 to $12,000 per access site.
Day Use Areas Management
Stream Access Sites
Develop and implement improved stream access sites on TVA-managed lands
15: Minimum benefit of $65,000 to $180,000
31: Minimum benefit of $135,000 to $370,000
Improved stream access sites may increase the value of each visit and/or increase the number of visitors to each site. There are currently an estimated 440 average annual visits to each stream access site. Average value of visitation may increase by up to $15 per visit with quality improvements, while increased visitation would increase value of the site by $10 to $27 for each additional visit.
Day Use Areas Management
Stream Access Sites
Manage __ stream access sites through third party agreements (or close the campgrounds)
50: $220,000 to $590,000 per year
0 50: $220,000 to $590,000 per year
50: $220,000 to $590,000 per year
We estimate 440 annual visits per stream access site based on creel survey on the Duck River and expand to include other users as a percentage of angling based on TVA trend analysis and a value of $10 to $27 per visit. So this is $4,000 to $12,000 per access site. It is unknown the change in site quality as a result of contractual agreement, though value will decline if quality declines.
Day Use Areas Management
Stream Access Sites
Assist partners with acquisition and development of __ additional stream access sites (as appropriate)
4: $20,000 - $50,000
6: $25,000 - $70,000
Estimated $4,000 to $12,000 per stream access site
Day Use Areas Management
Stream Access Sites
Develop __ blue-way miles per year contingent upon available partnerships
1 mile: $1,500 to $4,000
0 miles 2 miles: $3,000 to $8,000
4 miles: $6,000 to $16,000
Based on Duck River creel survey total angling visitation and additional estimated visitation from paddlers, estimate current use of 150 people per mile. Assuming use doubles with blue-way due to enhanced signage and outfitters, and a value of $10 to 27 per trip based on different activities, estimate recreation value of $1,500 to $4,000 per mile for the new trips.

Economic Benefits of the Tennessee Valley Authority’s Natural Resource Plan
January 2011 Cardno ENTRIX B-5
Table B-1 Summary of Recreation Program Benefits by Management Option
Program Category Program Goals and Activities
Management Options
Valuation Notes Current Mgmt
Custodial Mgmt
Enhanced Mgmt
Flagship Mgmt
Recreation Assessment and Design Tools
Boating Density Assessments
Continue to complete boat density assessments in support of the associated environmental reviews (~ 5 per year)
• • • • Increased management knowledge, and potential for increased protection of resources and increased value of recreation experience (Increase average value of visitation of up to $15 per visit due to improved quality).
Recreation Assessment and Design Tools
Boating Density Assessments
Partner with state boating law administrators to complete __ comprehensive boating density assessments per year
1 2
Recreation Assessment and Design Tools
Developed Recreation Inventory and Surveys
Update recreation inventory for __ TVA-managed reservoirs per year and survey users
15 : Data to Benefit 2.8 million users
0 23: Data to benefit 4.3 million users
46: Data to benefit 8.6 million users
Number of recreationists per reservoir estimated at 186,000; these recreationists may benefit from improved reservoir management.
Recreation Assessment and Design Tools
Developed Recreation Inventory and Surveys
Continue field reconnaissance and assessments to ensure ongoing compliance with regulations
• • • • Provides management knowledge, and potential protection of resources and value of recreation experience.
Recreation Assessment and Design Tools
Recreation Design Principles
Place signage at recreation facilities and stream access sites to support the implementation of recreation guidelines
• • • • Increased management knowledge, and potential for increased protection of resources and increased value of recreation experience (Increase average value of visitation of up to $15 per visit due to improved quality)
Recreation Assessment and Design Tools
Recreation Planning, Assistance, and Technical Support
Utilize regional recreation data to guide potential expansion of new campgrounds on TVA-managed lands allocated for developed recreation use
• $180,000 - $590,000 per campground
• $180,000 - $590,000 per campground
• $180,000 - $590,000 per campground
• $180,000 - $590,000 per campground
Value per campground for recreationists is estimated at $180,000 to $590,000.
Recreation Assessment and Design Tools
Recreation Planning, Assistance, and Technical Support
Provide technical support to other agencies and stakeholders and share recreation information, as appropriate
• • • Increased management knowledge, and potential for increased protection of resources and increased value of recreation experience (Increase average value of visitation of up to $15 per visit due to improved quality)

Economic Benefits of the Tennessee Valley Authority’s Natural Resource Plan
B-6 Cardno ENTRIX January 2011
Table B-1 Summary of Recreation Program Benefits by Management Option
Program Category Program Goals and Activities
Management Options
Valuation Notes Current Mgmt
Custodial Mgmt
Enhanced Mgmt
Flagship Mgmt
Public Outreach Programs
Clean and Green Campground Initiative
Implement and manage Clean and Green Campground Initiative
• 10 campgrounds Benefiting 195,000 person camping days
• 10 campgrounds Benefiting 195,000 person camping days
Benefits to water quality, cultural resources, biological resources and consequent increased recreation value. In terms of value of the education experience, one study found that visiting an environmental education center provides benefits of $5-$10 per day. 2.6 million people in the TVA region visited a nature center in 2004. It is not known how many individuals would participate in outreach programs, and their benefit would vary based on type of outreach product and event. Value to volunteer is equivalent to foregone wage rate; average wage in TN of life, physical, and social science technician is $20 / hr.
Public Outreach Programs
Conservation Foundation and Trust Fund
Establish the CF&TF to leverage funding for conservation, environmental, and/or recreation project(s) across the Valley
• •
Public Outreach Programs
Recreation Information Management
Maintain and strive to enhance existing internet presence in support of the Environmental Information Center and other key stakeholders
• • •
Public Outreach Programs
Recreation Information Management
Enhance current management to provide self-service and automated support for the Environmental Information Center
• •
Public Outreach Programs
Recreation Information Management
Develop interactive dispersed recreation land maps (e.g., hunt-able TVA lands)
•
Public Outreach Programs
Recreation Management Regulations
Develop and implement a Resource Rangers program to support the Code of Federal Regulations
• •
Public Outreach Programs
Recreation Management Regulations
Develop formal regulations to articulate expectations for visitors on TVA-managed lands and to assist with enforcement of use restrictions
• •
Public Outreach Programs
Annual Tours Conduct _ annual tours that feature emerging / green technologies on recreation areas
2 4 6

Economic Benefits of the Tennessee Valley Authority’s Natural Resource Plan
January 2011 Cardno ENTRIX B-7
Table B-2 Summary of Cultural Program Benefits by Management Option
Program Category
Program Goals and Activities
Management Options
Valuation Notes Current Mgmt Custodial Mgmt Enhanced Mgmt Flagship Mgmt Cultural Resource Management
ARPA Conduct ARPA Inspections with __ security checks per year
1000: estimated 9 ARPA investigations of looting annually
by reported incident 2500: estimated 23 ARPA investigations of looting annually
5000: estimated 46 ARPA investigations of looting annually
Decreased Incidence of Looting; $100,000 to $250,000 value per incident based on ARPA fines. In the last 4 years there have been 37 ARPA investigations, or 1 per 108 security inspections. Of these investigations, there have been 9 prosecutions, with average estimated damage cost to TVA property of $673,000.
Cultural Resource Management
ARPA Train and outfit new officers and train ARPA specialists
• •
Cultural Resource Management
Archaeological Monitoring and Protection
Protect archaeological site of __ tributary shoreline miles (TSM) OR __ main stem shoreline miles (MSM) per year
2 TSM OR MSM: $3.1 to $9.4 million / year
0.3 - 0.4 TSM OR 0.4 - 0.6 MSM: $0.5 million to $2.8 million / year
0.4 - 0.6 TSM OR 0.9 to 1.1 MSM: $0.6 to $5.2 million / year
1.1 - 1.3 TSM OR 1.9 to 2.1 MSM: $1.7 to $9.9 million per year
$1 to $5 million potential benefit based on excavation costs per mile (based on $3,000 excavation cost per cubic meter, 1 to 3 meter depth of excavation, and 250 to 500 shoreline meters of archaeological sites per shoreline mile (using estimated 2.61 sites per mile and average site size of 100 to 200 shoreline meters))
Cultural Resource Management
Archaeological Monitoring and Protection
Monitor archaeological site along __ miles of shoreline per year
mitigation projects only 150 miles: Monitoring approximately 400 sites per year
250 miles: Monitoring approximately 650 sites per year
500 miles: Monitoring of approximately 1,300 sites per year.
Based on the 7,190 sites above NSP elevation adjacent to reservoirs, and only 25 percent of land systematically surveyed, there are an estimated 2.6 sites per shoreline mile. Monitoring will Increase management knowledge and prioritization of management actions, as well as increased protection of sites. There are an estimated 6.0 million dispersed recreational users on TVA lands; Approximately 1.3 million people in TVA region visit archaeological sites
Cultural Resource Management
Native American Consultation
Coordinate Consultation with federally recognized Indian tribes
• • • • Regulatory Compliance; Increased knowledge of cultural resources; Population of 18 federally recognized tribes is approximately 450,000 people.
Cultural Resource Management
Native American Consultation
Conduct formal consultation workshops with federally recognized tribes every __ years
5 years 5 years 3 years 2 years
Cultural Resource Management
NAGPRA Ensure NAGPRA compliance • • • •

Economic Benefits of the Tennessee Valley Authority’s Natural Resource Plan
B-8 Cardno ENTRIX January 2011
Table B-2 Summary of Cultural Program Benefits by Management Option
Program Category
Program Goals and Activities
Management Options
Valuation Notes Current Mgmt Custodial Mgmt Enhanced Mgmt Flagship Mgmt Cultural Resource Management
Preservation Program
Identify archaeological surveys of __ acres of TVA-managed lands per year
2,000 acres: Potential Discovery of 150 sites
1,000 acres: Potential Discovery of 75 sites
3,000 acres: Potential discovery of 225 sites
5,000 acres: Potential Discovery of 375 sites
Increased management knowledge and prioritization of management actions, as well as increased protection of sites. There are an estimated 6.0 million dispersed recreational users on TVA lands; Approximately 1 million people in TVA region visit archaeological sites
Cultural Resource Management
Preservation Program
Maintain historic photo collection, cemetery database, and TVA’s historic agency information
• • • • Approximately 2.3 million people in the TVA region visit historic sites, indicating their interest in historical information. Interest in cultural resources also shown by 7,000 annual visits to TVA Cultural Resources web pages.
Cultural Resource Management
Preservation Program
DATABASE: Maintain current/ Develop a comprehensive database
• • • Decreased costs through savings in staff time and field work due to better storage and retrieval of data; Increased management knowledge and prioritization of management actions.
Cultural Resource Management
Preservation Program
HISTORIC ARTIFACT COLLECTION: Improve curation and management of historic artifact collection
• • • Approximately 2.3 million people in the TVA region visit historic sites, indicating their interest in historical information. Interest in cultural resources also shown by 7,000 annual visits to TVA Cultural Resources web pages.
Cultural Resource Management
Preservation Program
Conduct identification surveys of historic structures on TVA-managed lands
• Potential discovery of 0.05 structures / acre surveyed
• Potential discovery of 0.05 structures / acre surveyed
• Potential discovery of 0.05 structures / acre surveyed
There are an estimated .05 unknown historic sites per acre of TVA land - based on 5,322 known sites, assuming 25% surveyed (as with archaeology), giving 16,000 unknown sites distributed over 293,000 acres. Enhanced management from additional knowledge of site locations.
Cultural Resource Management
Preservation Program
Annually evaluate and nominate __ sites to the National Register of Historic Places
2 sites 4 sites 6 sites Values from visiting historic sites can range from $0-20. The national median visitation for historic sites is 16,000 (2006 American Museum Association), but it is not known how nomination would change the number or value of site visits.
Cultural Resource Management
Preservation Program
Improve preservation program; develop implementation procedures and a comprehensive database
• • • Increased knowledge for enhanced management; Increased Protection of Cultural Resources; Decreased costs through savings in staff time and field work due to better storage and retrieval of data

Economic Benefits of the Tennessee Valley Authority’s Natural Resource Plan
January 2011 Cardno ENTRIX B-9
Table B-2 Summary of Cultural Program Benefits by Management Option
Program Category
Program Goals and Activities
Management Options
Valuation Notes Current Mgmt Custodial Mgmt Enhanced Mgmt Flagship Mgmt Cultural Resource Management
Preservation Program
Partner with stakeholders to identify traditional cultural properties
• Increased knowledge for enhanced management; Increased Protection of Cultural Resources
Cultural Resource Management
Preservation Program
Develop an on-line interactive cemetery database for public use
• Approximately 2.3 million people in the TVA region visit historic sites, indicating their interest in historical information. Interest in cultural resources also shown by 7,000 annual visits to TVA Cultural Resources web pages.
Cultural Resource Management
Preserve America
Conduct adaptive reuse studies of TVA historic buildings
• • • • Potential benefits to visitors from adaptive reuse of historic buildings. Approximately 2.3 million people in the TVA region visit historic sites, indicating their interest in historical information. Interest in cultural resources also shown by 7,000 annual visits to TVA Cultural Resources web pages.
Cultural Resource Management
Preserve America
Develop formal regulations to supplement investigative authority
• • Potential increased preservation of historic resources and enhanced public perception of resource stewardship and regulatory compliance by TVA.
Cultural Resource Management
Preserve America
Submit NHPA Section 3 reports and Section 110 progress every three years
• • • Improved compliance. Benefits for recreation. Approximately 2.3 million people in the TVA region visit historic sites, indicating their interest in historical information. Interest in cultural resources also shown by 7,000 annual visits to TVA Cultural Resources web pages. Values to visitors to historic sites can range from $0-20 per visit.
Cultural Resource Management
Preserve America
Develop a plan for TVA-owned historic properties suitable for heritage tourism
• • •
Cultural Resource Management
Preserve America
Target to develop __ new partnerships per year to promote heritage tourism , historic properties and local governments
1 - 2 partners 3 - 5 partners
Cultural Resource Management
NHPA Section 106 Compliance
Manage existing mitigation obligations
• Over 2 million people in the TVA region visit historic sites; Protection of Cultural Resources
Cultural Resource Management
NHPA Section 106 Compliance
Conduct reviews under Section 106 NHPA
• • • • Regulatory Requirements, Increased knowledge for enhanced management; Increased Protection of Cultural Resources

Economic Benefits of the Tennessee Valley Authority’s Natural Resource Plan
B-10 Cardno ENTRIX January 2011
Table B-2 Summary of Cultural Program Benefits by Management Option
Program Category
Program Goals and Activities
Management Options
Valuation Notes Current Mgmt Custodial Mgmt Enhanced Mgmt Flagship Mgmt Cultural Resource Management
NHPA Section 106 Compliance
Establish a database for managing existing mitigation obligations
• • • Improved ability to meet obligations and improved compliance with regulations. Streamlining Section 106 compliance would decrease compliance cost and decrease staff time requirements Cultural
Resource Management
NHPA Section 106 Compliance
Pursue a programmatic agreement with individual states regarding compliance for repetitive actions
• •
Cultural Resource Management
NHPA Section 106 Compliance
Develop emergency procedures for requirements under NHPA Section 106
• •
Cultural Resource Partnerships
Cultural Resource Partnerships
Provide __ grant opportunities for archaeological and/or historical research for both academic and nonacademic publications
1-2 grants TVA management can benefit from data collected as well as publications resulting from research.
Cultural Resource Partnerships
Cultural Resource Partnerships
Provide support for __ archaeological field schools
1-2 schools: 10 to 15 students and 5-10 volunteers.
Each field school typically provides opportunities for training 10-15 future professionals and provides volunteer opportunities for 5-10 volunteers. Public education benefits through field trips and observation of excavation.
Public Outreach Programs
Archeological Outreach (Thousand Eyes)
Conduct __ events each year 2 - 3 events 3 - 5 events 5 - 10 events (3 - 5 partners)
10 - 15 events (5 - 10 partners)
Public education and outreach can reduce impact on resources as well as provide enjoyment to participants.
Public Outreach Programs
Corporate History Program
Develop a formal TVA corporate history program and conduct regular updates to the TVA timeline
• • Approximately 2.3 million people in the TVA region visit historic sites, indicating their interest in historical information. Interest in cultural resources also shown by 7,000 annual visits to TVA Cultural Resources web pages.
Public Outreach Programs
Corporate History Program
Develop an oral history program • • Approximately 2.3 million people in the TVA region visit historic sites, indicating their interest in historical information. Interest in cultural resources also shown by 7,000 annual visits to TVA Cultural Resources web pages.

Economic Benefits of the Tennessee Valley Authority’s Natural Resource Plan
January 2011 Cardno ENTRIX B-11
Table B-2 Summary of Cultural Program Benefits by Management Option
Program Category
Program Goals and Activities
Management Options
Valuation Notes Current Mgmt Custodial Mgmt Enhanced Mgmt Flagship Mgmt Public Outreach Programs
Corporate History Program
Develop an annual history public outreach component with __ events per year and develop a Web site
Website only 3 - 5 events Approximately 2.3 million people in the TVA region visit historic sites, indicating their interest in historical information. Interest in cultural resources also shown by 7,000 annual visits to TVA Cultural Resources web pages.
Public Outreach Programs
Corporate History Program
Develop a history and archaeology museum
• $200-320K/ year
Recreational values associated museum visitation range from $19-30 per trip. National median visitation for history museum 10,750 ( 2006 American Museum Association)

Economic Benefits of the Tennessee Valley Authority’s Natural Resource Plan
B-12 Cardno ENTRIX January 2011
Table B-3 Summary of Biological Resource Management Program Benefits by Management Option
Program Category Program Goals and Activities
Management Options
Valuation Notes Current Mgmt Custodial Mgmt
Enhanced Mgmt
Flagship Mgmt
Dispersed Recreation Management
Dispersed Recreation Management
Evaluate 70 dispersed recreation areas annually (current state only)
• • • • Improved management knowledge that can translated into increased protection of cultural and biological resources and consequent increase in dispersed recreation value; estimated 6 million dispersed recreational users on TVA lands; Approximately 1.3 million people in TVA region visit archaeological sites
Dispersed Recreation Management
Dispersed Recreation Management
Collect data on dispersed recreation sites identified during LCA
• • • •
Dispersed Recreation Management
Dispersed Recreation Management
Improve __ dispersed recreation area(s) annually
1 area : $0 to $90,000 for first year (greater values in future years as cumulative number of sites that have been improved increases)
5 areas: $0 to $450,000 for first year (greater values in future years as cumulative number of sites that have been improved increases)
15 areas: $0 to $1.35 million for first year (greater values in future years as cumulative number of sites that have been improved increases)
25 areas: $0 to $2.25 million for first year (greater values in future years as cumulative number of sites that have been improved increases)
Based on visitation at ACOE reservoirs in the region and general recreation participation data for the TVA region, dispersed recreation is estimated at 6.0 million person trips annually across the 293,000 TVA managed acres. Based on an estimated 1,000 dispersed area sites, and assuming dispersed recreationists visit one dispersed area per visit, there are 6,000 person visits on average to each dispersed site annually. The value of each recreational trip to an improved dispersed recreation area could range from $0-15 per trip, so the value of improvements ranges from $0 to $90,000 per site improved.
Dispersed Recreation Management
Dispersed Recreation Management
Implement __ key opportunities annually
1 project: $60,000 to $240,000 for first year (greater values in future years as cumulative number of projects implemented increases)
10 projects: $600,000 to $2.4 million fir first year (greater values in future years as cumulative number of projects implemented increases)
10 15 projects: $900,000 to $3.6 million for first year (greater values in future years as cumulative number of projects implemented increases)
20 projects: $1.2 million to $4.8 million for first year (greater values in future years as cumulative number of projects implemented increases)
Based on 6,000 person visits annually to each dispersed site, and assuming new sites are developed to meet demand, and a recreation value of $10 to $40 based on activity, the value of each site per year is estimated at $60,000 to $240,000.

Economic Benefits of the Tennessee Valley Authority’s Natural Resource Plan
January 2011 Cardno ENTRIX B-13
Table B-3 Summary of Biological Resource Management Program Benefits by Management Option
Program Category Program Goals and Activities
Management Options
Valuation Notes Current Mgmt Custodial Mgmt
Enhanced Mgmt
Flagship Mgmt
Dispersed Recreation Management
Dispersed Recreation Management
Distribute __ dispersed recreation user surveys annually
600 surveys
Potential increased protection of cultural and biological resources and consequent increase in dispersed recreation value; estimated 6 million dispersed recreational users on TVA lands; Approximately 1.3 million people in TVA region visit archaeological sites and approximately 2.3 million visit historical sites.
Dispersed Recreation Management
Dispersed Recreation Management
Conduct __ outdoor clinics annually 100 events
Dispersed Recreation Management
Dispersed Recreation Management
Implement an educational campaign to promote ecofriendly dispersed recreation
• • •
Dispersed Recreation Management
Dispersed Recreation Management
Develop and implement multiyear dispersed recreation plans
• •
Dispersed Recreation Management
Dispersed Recreation Management
Develop and adopt formal regulations • •
Dispersed Recreation Management
Trails Management Manage existing 90 miles of trail system with maintenance restricted to improving safety hazards
90 miles: $13.5 million to $19.5 million / year
90 miles: $13.5 million to $19.5 million / year
Based on an estimated 6.0 million dispersed recreation visitors and hiking participation of approximately 25% among dispersed recreation activities, an estimated 1.5 million people hike on TVA trails with value per trip of $9 - $13 per trip, for a total value of $150,000 to $215,000 per mile.
Dispersed Recreation Management
Trails Management Formally design and implement a Valleywide trails establishment and maintenance program
• 90 miles: $13.5 million to $19.5 million / year; $150,000 to $215,000 per year for each additional mile
• 90 miles: $13.5 million to $19.5 million / year; $150,000 to $215,000 per year for each additional mile
Recreational values associated with a quality improvement are highly dependent on prior site conditions and the type of quality change being implemented. It is has been estimated that 2.5 million visitors could potentially use the TVA trail system annually.

Economic Benefits of the Tennessee Valley Authority’s Natural Resource Plan
B-14 Cardno ENTRIX January 2011
Table B-3 Summary of Biological Resource Management Program Benefits by Management Option
Program Category Program Goals and Activities
Management Options
Valuation Notes Current Mgmt Custodial Mgmt
Enhanced Mgmt
Flagship Mgmt
Dispersed Recreation Management
Trails Management Add __ trail miles per year in accordance with Dispersed Recreation multiyear plans
10 miles: $1.5 million to $2.2 million / year for every additional 10 miles
10 miles: $1.5 million to $2.2 million / year for every additional 10 miles
20 miles: $3 million to $4.3 million / year for every additional 20 miles
It is not known how the number or value of hiking trips would change with increased mileage; for existing trips additional trail mileage may increase trip value by $0 to $15 for each user of the enhanced trail system. On average there are an estimated 16,700 hikers for each mile of existing trail system. If use increased proportionately, total value could increase by $150,000 to $215,000 per mile per year.
Dispersed Recreation Management
Leave No Trace Continue to participate in program • • • Potential increased protection of cultural and biological resources and consequent increase in dispersed recreation value; estimated 6 million dispersed recreational users on TVA lands; Approximately 1.3 million people in TVA region visit archaeological sites and approximately 2.3 million visit historical sites.
Dispersed Recreation Management
Leave No Trace Emphasize partnership and promotion of LNT
• •
Land Stewardship Programs
Land Condition Assessment and Land Stewardship Maintenance
Assess __ acres of TVA-managed lands annually while continuing to refine the Comprehensive LCA and Rapid LCA processes
5,000 acres 20,000 acres 35,000 acres 50,000 acres Together with Endangered and Threatened Species, current management cost savings to TVA of an estimated $18.5 million annually; this is due to decreased staff time required for NEPA compliance, Section 261 permitting, reduced costs in planning and siting of projects due to available biological data. Based on comparison of DOE and TVA cost to prepare an EA and staff requirements for 26a permitting. Enhanced management and prioritization based on improved management knowledge of resource status. Value to recreationists of habitat improvement estimated at $3 to $30 per acre. Additional predictive models and additional data gathering can decrease compliance costs through avoidance of impact in the planning process, and reduction in subsequent mitigation cost.
Land Stewardship Programs
Land Condition Assessment and Land Stewardship Maintenance
Implement prioritized stewardship activities addressing all public health and safety needs
• • •
Land Stewardship Programs
Land Condition Assessment and Land Stewardship Maintenance
Implement prioritized stewardship activities and __ percent of asset preservation needs per year and benchmark others for process improvements
10 percent 25 percent
Land Stewardship Programs
Natural Resources Management Implementation Plans
Focused implementation of 10 existing Unit Plans with updated stakeholder input on 18,000 acres of TVA-managed land
• • • •
Land Stewardship Programs
Natural Resources Management Implementation Plans
Proactively develop and implement integrated natural resource plans for TVA-managed lands at a rate of __ planned reservoirs annually (Note: This includes existing unit plans)
2 5

Economic Benefits of the Tennessee Valley Authority’s Natural Resource Plan
January 2011 Cardno ENTRIX B-15
Table B-3 Summary of Biological Resource Management Program Benefits by Management Option
Program Category Program Goals and Activities
Management Options
Valuation Notes Current Mgmt Custodial Mgmt
Enhanced Mgmt
Flagship Mgmt
Land Stewardship Programs TVA Natural Heritage
Database Continue current management of TVA’s natural heritage database
• • • • Together with Endangered and Threatened Species, current management cost savings to TVA of an estimated $18.5 million annually; this is due to decreased staff time required for NEPA compliance, Section 261 permitting, reduced costs in planning and siting of projects due to available biological data. Based on comparison of DOE and TVA cost to prepare an EA and staff requirements for 26a permitting. Enhanced management and prioritization based on improved management knowledge of resource status. Value to recreationists of habitat improvement estimated at $3 to $30 per acre. Additional predictive models and additional data gathering can decrease compliance costs through avoidance of impact in the planning process, and reduction in subsequent mitigation cost.
Land Stewardship Programs TVA Natural Heritage
Database Honor data sharing agreements among TVA and other state and federal resource agencies
• • • •
Land Stewardship Programs TVA Natural Heritage
Database Expand information gathering efforts for identification of sensitive resources through partnerships
•
Land Stewardship Programs TVA Natural Heritage
Database Develop predictive models for federally and state-listed species
•
Land Stewardship Programs TVA Natural Heritage
Database Expand data users for environmental review and planning purposes
• •
Land Stewardship Programs TVA Wetlands
Database Continue current management of TVA’s wetlands database
• • •
Land Stewardship Programs TVA Wetlands
Database Conduct additional activities in support of database development, maintenance, and use
•
Land Stewardship Programs TVA Wetlands
Database Expand data users for environmental review and planning purposes
Land Stewardship Programs TVA Wetlands
Database Institute an information gathering effort on TVA-managed lands for assessments of wetland resources and identification of opportunities to improve these resources
•
Land Stewardship Programs Boundary
Maintenance Conduct boundary maintenance on an as needed basis at the reservoir level
•
Improved protection of biological and cultural resources as well as potential benefit to recreationists. Prevent encroachment from adjacent land owners and land users. Value to recreationists of habitat improvement estimated at $3 to $30 per acre. Land Stewardship
Programs Boundary Maintenance
Develop Valley-wide prioritization process for boundary maintenance to be implemented at the reservoir level
•

Economic Benefits of the Tennessee Valley Authority’s Natural Resource Plan
B-16 Cardno ENTRIX January 2011
Table B-3 Summary of Biological Resource Management Program Benefits by Management Option
Program Category Program Goals and Activities
Management Options
Valuation Notes Current Mgmt Custodial Mgmt
Enhanced Mgmt
Flagship Mgmt
Land Stewardship Programs Boundary
Maintenance Program to address Valley-wide boundary maintenance incorporating future survey technologies on a __ year cycle
10 year cycle 5 year cycle Improved protection of biological and cultural resources as well as potential benefit to recreationists. Prevent encroachment from adjacent land owners and land users. Value to recreationists of habitat improvement estimated at $3 to $30 per acre.
Terrestrial Habitat Management
Agricultural and Open Lands Management
Manage existing license agreements on TVA-managed lands on 5,600 acres of TVA-managed lands
5,600 acres 0 to 5,6000 acres
0 acres 0 acres
Rental value of program is approximately $126,000 per year. Recreation occurs on existing license agreements, but may be enhanced via converting lands. Habitat improvement value $3 to $30 per acre / year for recreation.
Terrestrial Habitat Management
Agricultural and Open Lands Management
Cease agricultural license program •
Terrestrial Habitat Management
Agricultural and Open Lands Management
Develop an open land/early successional habitat program through agricultural licensing or cooperative partnerships
• •
Terrestrial Habitat Management
Agricultural and Open Lands Management
Convert lands unsuitable for program inclusion (10% of total lands) to improved wildlife/forest habitats at a rate of 50 percent annually
50 percent 50 percent
Terrestrial Habitat Management
Dewatering Projects Management
Continue current projects management and manage existing contractual agreements
• $20 - $60 million per year
• $20 - $60 million per year
• $20 - $60 million per year
• $20 - $60 million per year
- 467 acres in Gumdale and Perryville Dewatering projects with limited wildlife benefits (per TVA Dewatering Project report), and likely limited recreation benefits - Continue providing wildlife habitat benefits through agreements with FWS, ADCRN, TWRA on 5 dewatering projects on 106,000 acres. Visitation per acre at Wheeler National Wildlife Refuge is 18.6 people (based on visitation of 65,000 people and 35,000 acres of land). Assuming the same visitation at the 106,000 acres in the 5 dewatered areas managed by contractual agreements, total visitation in these areas is estimated at 2 million people annually. With value of $10 to $30 per trip, total value of management is approximately $20 million to $60 million.
Terrestrial Habitat Management
Dewatering Projects Management
Rebuild dewatering units based on per unit review
• •

Economic Benefits of the Tennessee Valley Authority’s Natural Resource Plan
January 2011 Cardno ENTRIX B-17
Table B-3 Summary of Biological Resource Management Program Benefits by Management Option
Program Category Program Goals and Activities
Management Options
Valuation Notes Current Mgmt Custodial Mgmt
Enhanced Mgmt
Flagship Mgmt
Terrestrial Habitat Management
Dewatering Projects Management
Operate, manage, and maintain dewatering unit projects at re-established conditions
• $20 - $62.3 million per year
• $20 - $62.3 million per year
Enhanced management should enhance visitor experience on these dewatering projects. Potential benefit of $3 to $30 per acre for all 106,000 acres.
Terrestrial Habitat Management
Dewatering Projects Management
Work with local and regional partners to incorporate nature-based tourism into management of dewatering areas projects
• Average value per day per person of wildlife viewing, fishing, hunting varies from $10 to $30 - increased visitation will increase value.
Terrestrial Habitat Management
Forest Resource Management
Manage tree hazards and tree cutting/vegetation damage encroachments
• Recreation value of $200 to $600 per acre
• Recreation value of $200 to $600 per acre
• Recreation value of $200 to $600 per acre
• Recreation value of $200 to $600 per acre
Forest resource management activities maintain healthy forests. Proactive forest management can reduce longo-term management costs. There is recreation value from helping to ensure public safety to recreationists and prevent closures to recreationists due to forest fire or public hazards. With approximately 170,000 acres, forest accounts for 70% of habitat acreage on TVA-managed lands, and 58% of all 293,000 acres of NRP managed lands, and provide habitat and recreation benefits. Assuming 58% of dispersed recreation occurs on forested lands, there are 3.5 million dispersed recreation visits to forested areas, or a minimum of 20 visits per forested acre. Activities may range in value from $10 to $30 per day, for a range in value of $200 per $600 per acre.
Terrestrial Habitat Management
Forest Resource Management
Continue small-scale timber salvage operations
• • •
Terrestrial Habitat Management
Forest Resource Management
Monitor broad forestry trends on TVA-managed lands and conduct basic forest protection activities
• Recreation value of $200 to $600 per acre
• Recreation value of $200 to $600 per acre
• Recreation value of $200 to $600 per acre
Terrestrial Habitat Management
Forest Resource Management
Provide support to state forestry assessment plans
• • •
Terrestrial Habitat Management
Forest Resource Management
Develop and maintain a qualified fire management crew
• •
Terrestrial Habitat Management
Forest Resource Management
Develop forest resource program with the intent to inventory, through forest prescription process, 10 percent of TVA reservoir properties annually
10 percent •
Terrestrial Habitat Management
Wildlife Habitat Enhancement Partnerships
Integrate with other resource areas to ensure compliance with laws and policies
• • • Reduce compliance costs through partnerships and increased communication with regulators to help inform and shape policy discussions; Reduce potential costs by ensuring compliance with all laws and policies.
Terrestrial Habitat Management
Wildlife Habitat Enhancement Partnerships
Improve habitat on __ acres of TVA-managed lands and outside existing Unit Plan implementation
500 acres: $1500-$15,000 / year
750 acres: $2,000-$20,000 / year
1,000 acres: $3,000 to 30,000 / year
20,000 acres: $60,000 to $600,000 / year
Habitat improvement value to recreation of $3 to $30 per acre / year
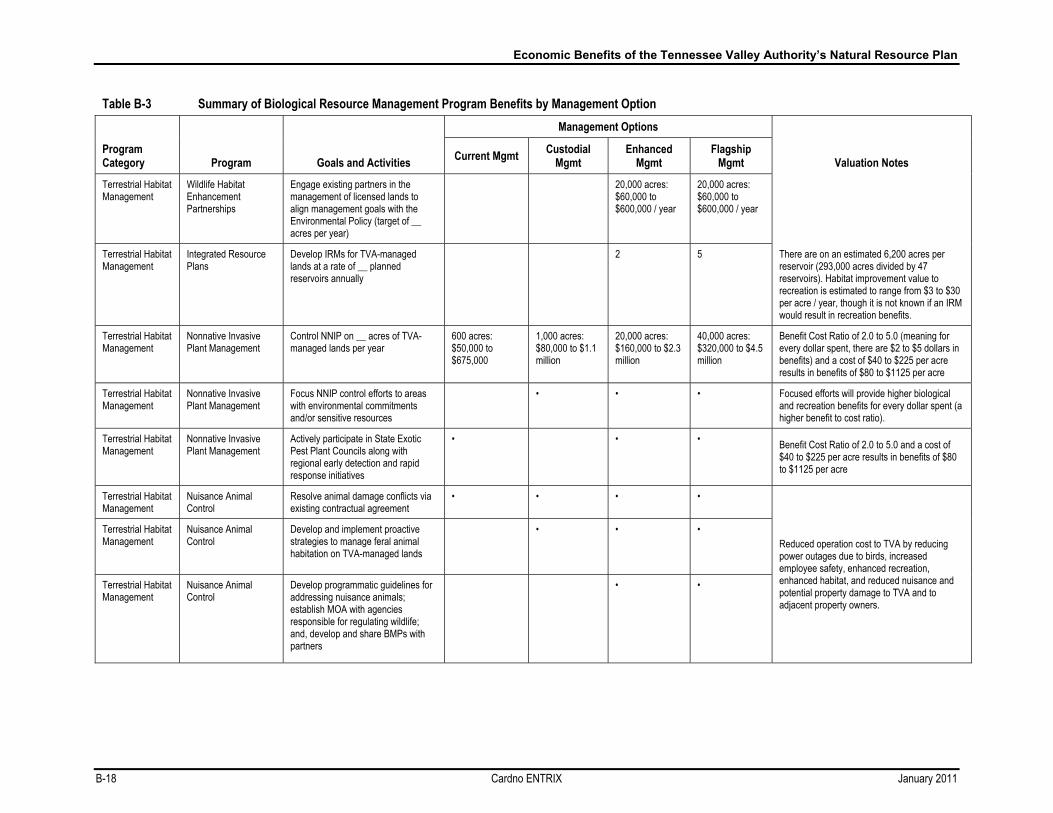
Economic Benefits of the Tennessee Valley Authority’s Natural Resource Plan
B-18 Cardno ENTRIX January 2011
Table B-3 Summary of Biological Resource Management Program Benefits by Management Option
Program Category Program Goals and Activities
Management Options
Valuation Notes Current Mgmt Custodial Mgmt
Enhanced Mgmt
Flagship Mgmt
Terrestrial Habitat Management
Wildlife Habitat Enhancement Partnerships
Engage existing partners in the management of licensed lands to align management goals with the Environmental Policy (target of __ acres per year)
20,000 acres: $60,000 to $600,000 / year
20,000 acres: $60,000 to $600,000 / year
Terrestrial Habitat Management
Integrated Resource Plans
Develop IRMs for TVA-managed lands at a rate of __ planned reservoirs annually
2 5 There are on an estimated 6,200 acres per reservoir (293,000 acres divided by 47 reservoirs). Habitat improvement value to recreation is estimated to range from $3 to $30 per acre / year, though it is not known if an IRM would result in recreation benefits.
Terrestrial Habitat Management
Nonnative Invasive Plant Management
Control NNIP on __ acres of TVA-managed lands per year
600 acres: $50,000 to $675,000
1,000 acres: $80,000 to $1.1 million
20,000 acres: $160,000 to $2.3 million
40,000 acres: $320,000 to $4.5 million
Benefit Cost Ratio of 2.0 to 5.0 (meaning for every dollar spent, there are $2 to $5 dollars in benefits) and a cost of $40 to $225 per acre results in benefits of $80 to $1125 per acre
Terrestrial Habitat Management
Nonnative Invasive Plant Management
Focus NNIP control efforts to areas with environmental commitments and/or sensitive resources
• • • Focused efforts will provide higher biological and recreation benefits for every dollar spent (a higher benefit to cost ratio).
Terrestrial Habitat Management
Nonnative Invasive Plant Management
Actively participate in State Exotic Pest Plant Councils along with regional early detection and rapid response initiatives
• • • Benefit Cost Ratio of 2.0 to 5.0 and a cost of $40 to $225 per acre results in benefits of $80 to $1125 per acre
Terrestrial Habitat Management
Nuisance Animal Control
Resolve animal damage conflicts via existing contractual agreement
• • • •
Reduced operation cost to TVA by reducing power outages due to birds, increased employee safety, enhanced recreation, enhanced habitat, and reduced nuisance and potential property damage to TVA and to adjacent property owners.
Terrestrial Habitat Management
Nuisance Animal Control
Develop and implement proactive strategies to manage feral animal habitation on TVA-managed lands
• • •
Terrestrial Habitat Management
Nuisance Animal Control
Develop programmatic guidelines for addressing nuisance animals; establish MOA with agencies responsible for regulating wildlife; and, develop and share BMPs with partners
• •

Economic Benefits of the Tennessee Valley Authority’s Natural Resource Plan
January 2011 Cardno ENTRIX B-19
Table B-3 Summary of Biological Resource Management Program Benefits by Management Option
Program Category Program Goals and Activities
Management Options
Valuation Notes Current Mgmt Custodial Mgmt
Enhanced Mgmt
Flagship Mgmt
Terrestrial Habitat Management
Terrestrial Greenhouse Gas Management
Develop a terrestrial GHG management plan that identifies opportunities, prioritizes options, and forms an implementation roadmap
2 2
Enhanced management knowledge can reduce future compliance costs. Social value of per metric ton of carbon emission reduction / sequestration (based on avoided impacts of climate change) is typically estimated at $10 to $40 per ton. Enhanced management knowledge can reduce future compliance costs. Social value of per metric ton of carbon emission reduction / sequestration (based on avoided impacts of climate change) is typically estimated at $10 to $40 per ton. Currently, market value of carbon is very low in the United States.
Terrestrial Habitat Management
Terrestrial Greenhouse Gas Management
Conduct research projects focusing on issues related to terrestrial GHG management practices (e.g., conduct reservoir carbon uptake studies, evaluate ecological impacts of various carbon sequestration practices, etc.)
50 acres 120 acres 200 acres 250 acres
Terrestrial Habitat Management
Terrestrial Greenhouse Gas Management
Enter into third-party consortiums focusing on issues related to terrestrial GHG management practices
• •
Terrestrial Habitat Management
Terrestrial Greenhouse Gas Management
Conduct demonstration projects focusing on issues related to terrestrial GHG management practices (e.g., comparison of carbon offset generation and verification methodologies, demonstrate new soil and/or above ground measurement techniques, etc.)
2 projects 4 projects
Terrestrial Habitat Management
Terrestrial Greenhouse Gas Management
Collaborate with stakeholders to develop and promote forestry practices that increase carbon uptake and ensure habitat preservation (e.g., promoting state programs)
•

Economic Benefits of the Tennessee Valley Authority’s Natural Resource Plan
B-20 Cardno ENTRIX January 2011
Table B-3 Summary of Biological Resource Management Program Benefits by Management Option
Program Category Program Goals and Activities
Management Options
Valuation Notes Current Mgmt Custodial Mgmt
Enhanced Mgmt
Flagship Mgmt
Terrestrial Habitat Management
Wildlife Habitat Council – Third Party Certifications
Continue management of __ current certified projects
4 projects: $8,000 to $80,000 per year
4 projects: $8,000 to $80,000 per year
4 projects: $8,000 to $80,000 per year
An estimated 48.8 percent of the population in the TVA 125-county region view wildlife (3.2 million people) and may benefit from wildlife habitat improvements. Habitat improvements to recreation are estimated to be valued at approximately $3 to $30 per acre. Three of the four existing projects total 2,000 acres, or 670 acres, for potential habitat improvement value to recreationists of $2,000 to $20,000 per existing project. New locations have 1,000 acres per project, for a value of $3,000 to $30,000 per project.
Terrestrial Habitat Management
Wildlife Habitat Council – Third Party Certifications
Initiate __ wildlife enhancement projects at __ new locations on TVA-managed lands
3 projects / 3 new locations; 3,000 acres: $9,000 to $90,0000 for first year (increased value in following years due to more cumulative projects implemented)
5 projects / 5 new locations 5,000 acres: $15,000 to $150,000 for first year (increased value in following years due to more cumulative projects implemented)
Terrestrial Habitat Management
Wildlife Habitat Council – Third Party Certifications
Establish a third-party review and certification process for wildlife management activities on 10 percent of appropriate TVA–managed lands annually
10 percent •
Sensitive Biological Resources Management
Conservation Planning Continue to be advisers/participants in planning organizations
• • •
Reduce compliance costs through partnerships and increased communication with regulators to help inform and shape policy discussions.
Sensitive Biological Resources Management
Conservation Planning Limit TVA’s involvement to those efforts required by regulatory compliance
•
Sensitive Biological Resources Management
Conservation Planning Expand role in large-scale planning efforts across the region via partnerships
•
Sensitive Biological Resources Management
Endangered and Threatened Species Program
Continue the requirements under Section 7(a)(2) of ESA and implementation of biological opinion requirements
• • • • Value to people of endangered species population protection varies by species and size of species population increase, but for birds and mammals can range from $5 to $100 per household per year for significant increases in species protection rates.

Economic Benefits of the Tennessee Valley Authority’s Natural Resource Plan
January 2011 Cardno ENTRIX B-21
Table B-3 Summary of Biological Resource Management Program Benefits by Management Option
Program Category Program Goals and Activities
Management Options
Valuation Notes Current Mgmt Custodial Mgmt
Enhanced Mgmt
Flagship Mgmt
Sensitive Biological Resources Management
Endangered and Threatened Species Program
Continue voluntary monitoring of select species populations
• • • • Enhanced management and prioritization based on improved management knowledge of resource status. Value to recreationists of habitat improvement estimated at $3 to $30 per acre. Additional predictive models and additional data gathering can decrease compliance costs through avoidance of impact in the planning process, and reduction in subsequent mitigation cost. Value to people of endangered species population protection varies by species and size of species population increase, but for birds and mammals can range from $5 to $100 per household per year for significant increases in species protection rates.
Sensitive Biological Resources Management
Endangered and Threatened Species Program
Develop a list of target-listed species; develop and monitor management plans; actively seek partnerships; and, catalog select species where management opportunities exist within the region
• •
Sensitive Biological Resources Management
Endangered and Threatened Species Program
Continue cave gate maintenance and signage
• • • • Value to people of endangered species population protection varies by species and size of species population increase, but for birds and mammals can range from $5 to $100 per household per year for significant increases in species protection rates.
Sensitive Biological Resources Management
Migratory Birds Management
Continue to comply with EO 13186 • • • •
Sensitive Biological Resources Management
Migratory Birds Management
Provide level of data to support national and regional planning efforts for migratory birds; Participate in national and regional planning efforts
• • •
There are an estimated 110,000 migratory bird hunters and 2.0 million people who view birds in the TVA region. Improvements to migratory bird habitat and populations would benefit these recreationists. Recreation benefits of habitat improvement may be in the range of $3 to $30 per acre.
Sensitive Biological Resources Management
Migratory Birds Management
Develop agency guidelines for compliance with EO 13186
• •
Sensitive Biological Resources Management
Migratory Birds Management
Continue leadership role in Tennessee River Valley Shorebird Working Group
• • • •

Economic Benefits of the Tennessee Valley Authority’s Natural Resource Plan
B-22 Cardno ENTRIX January 2011
Table B-3 Summary of Biological Resource Management Program Benefits by Management Option
Program Category Program Goals and Activities
Management Options
Valuation Notes Current Mgmt Custodial Mgmt
Enhanced Mgmt
Flagship Mgmt
Sensitive Biological Resources Management
Migratory Birds Management
Cooperate with partners to implement conservation projects for migratory birds on TVA-managed lands and implement demonstration projects to benefit regional habitat objectives for migratory birds per year
• •
There are an estimated 110,000 migratory bird hunters and 2.0 million people who view birds in the TVA region. Improvements to migratory bird habitat and populations would benefit these recreationists. Recreation benefits of habitat improvement may be in the range of $3 to $30 per acre.
Sensitive Biological Resources Management
Migratory Birds Management
Partner with organizations to inventory and monitor waterfowl and other water bird populations along TVA reservoirs
• •
Sensitive Biological Resources Management
Natural Areas Program
Monitor __ percent of TVA’s natural areas annually and implement maintenance needs on natural areas as identified by opportunistic observations
5 percent: $5,000 - $50,000 per year recreation value
33 percent: $35,000 to $335,000 per year recreation value
33 percent: $35,000 to $335,000 per year recreation value
33 percent: $35,000 to $335,000 per year recreation value
There are 34,000 acres in zone 3 lands for sensitive resource management. Increased value of recreation per acre improved can range from $3 to $30 per acre.
Sensitive Biological Resources Management
Natural Areas Program
Develop and implement management plans on __ natural areas annually
15 areas: $10,000 to $100,000 / year recreation value
33 areas: $20,000 to $215,000 / year recreation value
Habitat improvement valued at an estimated $3 to $30 per acre based on recreation value. Based on 154 natural areas and 34,000 acre sin Zone 3 lands, there are an estimated 220 acres per natural area on average.
Sensitive Biological Resources Management
Natural Areas Program
Implement maintenance needs on natural areas as identified by opportunistic observations, monitoring and management plans
• • Increased value of recreation per acre improved can range from $3 to $30 per acre.
Sensitive Biological Resources Management
Natural Areas Program
Designate or remove natural areas via the reservoir lands planning process
•
Increased value of recreation per acre improved can range from $3 to $30 per acre. Dedicating resources to areas of highest benefit will provide the most benefits per dollar spent.
Sensitive Biological Resources Management
Natural Areas Program
Establish criteria and annually evaluate TVA-managed lands (~5,000 acres) for potential designation outside reservoir lands planning processes. Includes developing programmatic guidelines for the natural areas program and updating records annually to include appropriate information using national standards and methodologies
• •

Economic Benefits of the Tennessee Valley Authority’s Natural Resource Plan
January 2011 Cardno ENTRIX B-23
Table B-3 Summary of Biological Resource Management Program Benefits by Management Option
Program Category Program Goals and Activities
Management Options
Valuation Notes Current Mgmt Custodial Mgmt
Enhanced Mgmt
Flagship Mgmt
Sensitive Biological Resources Management
Wetland Management Continue implementation of current TVA wetland policy on TVA-managed lands
• • • • Regulatory Compliance; Wetland value per acre is estimated to range from $150 to $1600 per acre / year
Sensitive Biological Resources Management
Wetland Management Develop a proactive program for wetland identification and protection on TVA-managed lands
• • Wetland value per acre is estimated to range from $150 to $1600 per acre; Proactive management can reduce compliance costs by avoiding impacts to wetland resources early on during the project planning process.
Public Outreach Environmental Education Program
Develop and implement new program - museum and program
• Potential value of $250,000 - $500,000 for nature center.
• Potential value of $250,000 - $500,000 for nature center. Based on 78,000 visits to TVA recreation web
pages from July to October 2010, there may be as many as 300,000 annual visits to internet-based resources, indicating a high interest in recreation resource information and potentially, natural resource information.
Public Outreach Natural Resources Communication
Develop and implement new program - communication program (internet - based program)
•
Public Outreach Resource Stewardship Campaigns
Develop and implement this new program to promote natural resources improvements and protection; deliver 25 stakeholder products annually
•
Public Outreach Volunteer Program Establish a formal volunteer program • $20 / volunteer hour
• $20 / volunteer hour
• $20 / volunteer hour
Value to volunteer is equivalent to foregone wage rate; average wage in TN of life, physical, and social science technician is $20 / hr

Economic Benefits of the Tennessee Valley Authority’s Natural Resource Plan
B-24 Cardno ENTRIX January 2011
Table B-4 Summary of Water Resource Program Benefits by Management Option
Program Category Program Goals and Activities
Management Options
Valuation Notes Current Mgmt
Custodial Mgmt
Enhanced Mgmt Flagship Mgmt
Water Resource Improvement Programs
Water Resource Improvement Campaign
Reduce __ tons of suspended sediment reaching streams per year
720 tons 1,080 tons 360 tons Positive effect on water quality, potential increase in recreational value, aesthetic value to adjacent landowners, and decreased water treatment cost. Value captured in HU Improvement management goal.
Water Resource Improvement Programs
Water Resource Improvement Campaign
Reduce __ pounds of phosphorus reaching streams per year
1,100 pounds 1,650 pounds 550 pounds Positive effect on water quality, potential increase in recreational value, aesthetic value to adjacent landowners, and decreased water treatment cost. Value captured in HU Improvement management goal.
Water Resource Improvement Programs
Targeted Reservoir Initiative Program
Develop a reservoir-specific improvement plan
• Increased management knowledge and potential improved water quality, with resulting biological and recreation benefits.
Water Resource Improvement Programs
Targeted Reservoir Initiative Program
Reduce 5,000 pounds of phosphorus reaching a TVA-managed reservoir per year
• Positive effect on water quality, potential increase in recreational value, aesthetic value to adjacent landowners, and decreased water treatment cost. Value captured in HU Improvement management goal.
Water Resource Improvement Programs
Targeted Watershed Initiative Program
Reduce __ tons of suspended sediment reaching streams per year
234 tons 1,300 tons Positive effect on water quality, potential increase in recreational value, aesthetic value to adjacent landowners, and decreased water treatment cost. Value captured in HU Improvement management goal.

Economic Benefits of the Tennessee Valley Authority’s Natural Resource Plan
January 2011 Cardno ENTRIX B-25
Table B-4 Summary of Water Resource Program Benefits by Management Option
Program Category Program Goals and Activities
Management Options
Valuation Notes Current Mgmt
Custodial Mgmt
Enhanced Mgmt Flagship Mgmt
Water Resource Improvement Programs
Targeted Watershed Initiative Program
Reduce __ pounds of phosphorus reaching streams per year
350 pounds
2,000 pounds Positive effect on water quality, potential increase in recreational value, aesthetic value to adjacent landowners, and decreased water treatment cost. Value captured in HU Improvement management goal.
Water Resource Improvement Programs
Targeted Watershed Initiative Program
Improve __ HU in __ years 1 HU / 5 years: $10,000 to $30,000 per year
1 HU / 3 years: $20,000 to $45,000 / Year
Value per household of $0.02 or $0.05 for each HU improvement (based on value per household of 10 to 30 dollars of a 1 percent improvement in water bodies rated 'good' with 1 HU representing 0.16% of the 611 HU in the Tennessee River watershed), and 2.6 million households in TVA region
Water Resource Improvement Programs
Targeted Watershed Initiative Program
Deliver __ stakeholder products per year 50 products 75 products Potential positive effect on water quality, and related benefits to recreational and biological resources.
Water Resource Improvement Programs
Water Resource Grant Program
Develop and implement evaluation, management, and implementation processes
• Potential positive effect on water quality, and related benefits to recreational and biological resources.
Water Resource Improvement Programs
Quality Growth Program
Deliver __ communication products including workshops, new training products, various awards, and/or conferences per year
25 products Captured under Water Resource Outreach Campaigns
Captured under Water Resource Outreach Campaigns
Captured under Water Resource Outreach Campaigns
Potential positive effect on water quality, and related benefits to recreational and biological resources.

Economic Benefits of the Tennessee Valley Authority’s Natural Resource Plan
B-26 Cardno ENTRIX January 2011
Table B-4 Summary of Water Resource Program Benefits by Management Option
Program Category Program Goals and Activities
Management Options
Valuation Notes Current Mgmt
Custodial Mgmt
Enhanced Mgmt Flagship Mgmt
Water Resource Improvement Programs
Reservoir Shoreline Stabilization
Stabilize __ miles of critically eroding shoreline per year
3 miles: $4.7 to $14.1 million / Year cultural resource preservation value; Potential avoided property damage to 10 property owners (first year, with more property owners benefiting as cumulative number of stabilized shoreline increases)
8 miles: $12.5 to $37.6 million / Year cultural resource preservation value; Potential avoided property damage to 30 property owners (first year, with more property owners benefiting as cumulative number of stabilized shoreline increases)
$1 to $5 million potential benefits as indicated by excavation costs per mile (based on $3,000 excavation cost per cubic meter, 1 to 3 meter depth of excavation, and 500 shoreline meters of archaeological sites per shoreline mile (using estimated 2.61 sites per mile based on number of known sites and % land surveyed and average site size of 200 shoreline meters)); Reduced Sediment in Water (captured elsewhere). Based on 26a permits, there are at least 41,000 property owners with lands adjacent to TVA reservoirs who may benefit. Based on 11,000 shoreline miles, this is an average of 3.7 property owners with 26a permits per mile.
Aquatic Monitoring and Management
Aquatic Ecology Management
Partner and actively participate in restoring the aquatic biological communities
• • Benefit to water quality, biological, and recreation resources. Recreation benefit to fish and wildlife-related recreation.
Aquatic Monitoring and Management
Aquatic Ecology Management
Develop and evaluate public outreach opportunities to raise public awareness of exotic and invasive aquatic animal species consistent with EO 13112
• • Benefit cost ratio of invasive species control has been found to be 2.0 to 5.0 (for every dollar spent, $2 to $5 benefit is received)
Aquatic Monitoring and Management
Stream and Tailwater Monitoring Program
Conduct __ stream assessments per year 110 50 70 150 Increased management knowledge and reduced compliance cost.
Aquatic Monitoring and Management
Stream and Tailwater Monitoring Program
Share stream and reservoir data as requested as requested online online (interactive)

Economic Benefits of the Tennessee Valley Authority’s Natural Resource Plan
January 2011 Cardno ENTRIX B-27
Table B-4 Summary of Water Resource Program Benefits by Management Option
Program Category Program Goals and Activities
Management Options
Valuation Notes Current Mgmt
Custodial Mgmt
Enhanced Mgmt Flagship Mgmt
Partnership Programs
Strategic Partnership Planning
Maintain existing relationships, partnerships, and/or third party agreements
• • • • Enhanced water quality management through increased data sharing and data collection. Reduce compliance costs through partnerships and increased communication with regulators to help inform and shape policy discussions; Reduce potential costs by ensuring compliance with all laws and policies.
Partnership Programs
Strategic Partnership Planning
Develop new/ Enhance existing relationships, partnerships, and/or third party agreements
• •
Partnership Programs
Case Study/ Research Initiative
_# case studies / research projects implemented and exported
2 3
Public Outreach Programs
Tennessee Valley Clean Marina Program
Maintain certification for 80 marinas 80 marinas: $280,000 to $2.8 million / Year
80 marinas: $280,000 to $2.8 million / Year
80 marinas: $280,000 to $2.8 million / Year
80 marinas: $280,000 to $2.8 million / Year
Increased revenue at 70% Clean Marinas of $5,000 to $50,000 per marina indicates potential value to consumers of an average of $3,500 to $35,000 per marina
Public Outreach Programs
Tennessee Valley Clean Marina Program
Certify __ new marinas per year 1 marina: $3,500 to $35,000 / Year
2 marinas: $7,000 to $70,000 / Year
Public Outreach Programs
Water Efficiency Program
Deliver __ educational workshops per year
10 TBD TBD TBD Potential benefit to water quality, biological, and recreation resources. Educational and public perception benefit.
Public Outreach Programs
Water Resource Outreach Campaign
Deliver __ stakeholder products per year 20 products 50 products 70 products Potential benefit to water quality, biological, and recreation resources. Educational and public perception benefit.


Appendix C
Summary of NRP Benefits by Management Option


December 2010 Cardno ENTRIX C-1
Appendix C Summary of NRP Benefits by Management Option
Tables C-1a through C-4d summarize the estimated benefits in each of the six benefit categories by management option and resource management area. For example, Table C-1a summarizes benefits from the NRP Recreation Management programs for the custodial management option; Table C-1b, the current management option; Table C-1c, the enhanced management option; and Table C-1d, the flagship management option. Tables C-2a through C-2d summarize benefits from cultural resource management programs, Tables C-3a through C-3d summarize benefits from biological resource management programs, and Tables C-4a through C-4d summarize benefits from water resource management programs.

Economic Benefits of the Tennessee Valley Authority’s Natural Resource Plan
C-2 Cardno ENTRIX January 2011
Table C-1a Summary of Recreation Resource Program Benefits Under Current Management Option
Recreation Program Recreation / Visitor Use Benefit Water Resource
Benefit
Species / Habitat Conservation and
Abundance
Cultural Resource
Preservation
Management Data and Scientific Knowledge /
Reduced Compliance Costs
Public Perception, Partnerships,
Outreach
Campground Management: On Reservation
$1.42 to $4.75 million per year; 1 flagship campground may benefit 6,500 campsite visitors every year
Flagship campground may reduce impact on water resources through water use efficiency
Development of sustainable techniques for use elsewhere
Positive perception related to continuing to maintain facilities and ADAAG upgrades
Campground Management: Off Reservation
$0.72 to $2.4 million per year Positive perception related to continuing to maintain facilities and ADAAG upgrades
Day Use Areas: On Reservation $4.2 to $14.0 million per year; Sustainable initiatives may benefit 12,000 users / year
Sustainable initiatives may reduce impact on water resources through water use efficiency
Development of sustainable techniques for use elsewhere.
Positive perception related to continuing to maintain facilities. Sustainable initiatives may enhance perception and educate 12,000 users / year on renewable energy and water efficiency measures
Day Use Areas: Off Reservation $4.62 to $15.40 million per year Positive perception related to continuing to maintain facilities or develop Contractual Agreements to operate and to upgrade 1 facility consistent with ADAAG
Greenways
Stream Access Sites $357,000 to $964,0000 per year Positive perception related to continuing to maintain sites and add blue-way miles

Economic Benefits of the Tennessee Valley Authority’s Natural Resource Plan
January 2011 Cardno ENTRIX C-3
Table C-1a Summary of Recreation Resource Program Benefits Under Current Management Option
Recreation Program Recreation / Visitor Use Benefit Water Resource
Benefit
Species / Habitat Conservation and
Abundance
Cultural Resource
Preservation
Management Data and Scientific Knowledge /
Reduced Compliance Costs
Public Perception, Partnerships,
Outreach
Boating Density Assessments
Potential increased value of recreation experience from improved management
Potential resource benefit from improved management
Potential aquatic habitat benefit from improved management
Potential resource benefit from improved management
Increased knowledge for enhanced management
Positive perception of data gathering and recreation management
Developed Recreation Inventory and Surveys
2.8 million recreationists per year at surveyed reservoirs may benefit from improved reservoir management; field reconnaissance can lead to enhanced recreation conditions
Potential resource benefit from field assessments
Potential resource benefit from field assessments
Potential resource benefit from field assessments
Increased knowledge for enhanced management
Positive perception of proactive data gathering and recreation management
Recreation Design Principles
Potential value of improved recreation experience from improved resource quality at recreation sites
Potential resource benefit from better compliance with visitor guidelines
Potential resource benefit from better compliance with visitor guidelines
Potential resource benefit from better compliance with visitor guidelines
Positive perception of recreation management
Recreation Planning, Assistance, and Technical Support
$180,000 to $590,000 recreation value / campground / year
Potential benefit to resources from enhanced data sharing and technical support
Potential benefit to resources from enhanced data sharing and technical support
Potential benefit to resources from enhanced data sharing and technical support
Data sharing and technical support for increased recreation knowledge and enhanced management
Positive public perception for new campgrounds
Clean and Green Campground Initiative
Conservation Foundation and Trust Fund
Recreation Information Management Based on 78,000 visits to TVA recreation web pages from July to October 2010, there may be as many as 300,000 annual visits to internet-based resources, indicating a high interest in enhancing internet presence
Positive perception related to availability of information on internet

Economic Benefits of the Tennessee Valley Authority’s Natural Resource Plan
C-4 Cardno ENTRIX January 2011
Table C-1a Summary of Recreation Resource Program Benefits Under Current Management Option
Recreation Program Recreation / Visitor Use Benefit Water Resource
Benefit
Species / Habitat Conservation and
Abundance
Cultural Resource
Preservation
Management Data and Scientific Knowledge /
Reduced Compliance Costs
Public Perception, Partnerships,
Outreach
Recreation Management Regulations
Annual Tours Value to visitors on tours. Potential benefit to resources from enhanced public awareness
Potential benefit to resources from enhanced public awareness
Potential benefit to resources from enhanced public awareness
Potential benefit to resources from enhanced public awareness
Positive perception of TVA stewardship

Economic Benefits of the Tennessee Valley Authority’s Natural Resource Plan
January 2011 Cardno ENTRIX C-5
Table C-1b Summary of Recreation Resource Program Benefits Under Custodial Management Option
Recreation Program Recreation / Visitor Use Benefit Water Resource
Benefit
Species / Habitat Conservation and
Abundance
Cultural Resource
Preservation
Management Data and Scientific Knowledge /
Reduced Compliance Costs
Public Perception, Partnerships,
Outreach
Campground Management: On Reservation
$1.42 to $4.75 million per year Positive perception related to continuing to maintain facilities and ADAAG upgrades
Campground Management: Off Reservation
$00.55 to $1.8 million per year Positive perception related to continuing to maintain facilities and ADAAG upgrades
Day Use Areas: On Reservation $4.2 to $14.0 million per year Positive perception related to continuing to maintain facilities
Day Use Areas: Off Reservation $0 to $15.4 million per year Potential positive perception related to finding Contractual Agreements to operate facilities.
Greenways
Stream Access Sites $136,000 to $367,0000 per year Positive perception related to continuing to maintain sites
Boating Density Assessments
Potential increased value of recreation experience from boating density assessments associated with environmental reviews
Potential resource benefit from improved management (shoreline erosion related to boating for example)
Potential aquatic habitat benefit from improved management
Potential resource benefit from improved management (shoreline erosion)
Increased knowledge for enhanced management
Public perception benefit from boating density assessments
Developed Recreation Inventory and Surveys
Field reconnaissance can lead to enhanced recreation conditions
Potential resource benefit from field assessments
Potential resource benefit from field assessments
Potential resource benefit from field assessments
Increased knowledge for enhanced management
Positive perception of data gathering and recreation management

Economic Benefits of the Tennessee Valley Authority’s Natural Resource Plan
C-6 Cardno ENTRIX January 2011
Table C-1b Summary of Recreation Resource Program Benefits Under Custodial Management Option
Recreation Program Recreation / Visitor Use Benefit Water Resource
Benefit
Species / Habitat Conservation and
Abundance
Cultural Resource
Preservation
Management Data and Scientific Knowledge /
Reduced Compliance Costs
Public Perception, Partnerships,
Outreach
Recreation Design Principles
Potential value of improved recreation experience from improved resource quality at recreation sites
Potential resource benefit from better compliance with visitor guidelines
Potential resource benefit from better compliance with visitor guidelines
Potential resource benefit from better compliance with visitor guidelines
Positive perception of recreation management
Recreation Planning, Assistance, and Technical Support
$180,000 to $590,000 recreation value / campground
Positive public perception for new campgrounds
Clean and Green Campground Initiative
Conservation Foundation and Trust Fund
Recreation Information Management Based on 78,000 visits to TVA recreation web pages from July to October 2010, there may be as many as 300,000 annual visits to internet-based resources, indicating a high interest in recreation resource information
Positive perception related to availability of information on internet
Recreation Management Regulations
Annual Tours

Economic Benefits of the Tennessee Valley Authority’s Natural Resource Plan
January 2011 Cardno ENTRIX C-7
Table C-1c: Summary of Recreation Resource Program Benefits Under Enhanced Management Option
Recreation Program Recreation / Visitor Use
Benefit Water Resource
Benefit
Species / Habitat Conservation and
Abundance
Cultural Resource
Preservation
Management Data and Scientific Knowledge /
Reduced Compliance Costs
Public Perception, Partnerships, Outreach
Campground Management: On Reservation
$1.44 to $4.80 million per year Positive perception related to continuing to maintain facilities and ADAAG upgrades
Campground Management: Off Reservation
$0.74 to $2.4 million per year Positive perception related to continuing to maintain facilities and ADAAG upgrades
Day Use Areas: On Reservation $4.2 to $14.0 million per year; Sustainable initiatives may benefit 23,000 users / year
Sustainable initiatives may reduce impact on water resources through water use efficiency
Development of sustainable techniques for use elsewhere.
Positive perception related to continuing to maintain facilities. Sustainable initiatives may enhance perception and educate 23,000 users / year on renewable energy and water efficiency measures
Day Use Areas: Off Reservation $4.62 to $15.4 million per year; ADAAG upgrades may benefit 3,500 users per year
Positive perception related to continuing to maintain facilities (or develop contractual agreements) and upgrade ADAAG
Greenways $100,000 to $200,000 per year Positive perception related to developing greenways
Stream Access Sites $376,000 to $1.02 million per year
Positive perception related to improving existing sites as well as developing additional access points and blue-way miles

Economic Benefits of the Tennessee Valley Authority’s Natural Resource Plan
C-8 Cardno ENTRIX January 2011
Table C-1c: Summary of Recreation Resource Program Benefits Under Enhanced Management Option
Recreation Program Recreation / Visitor Use
Benefit Water Resource
Benefit
Species / Habitat Conservation and
Abundance
Cultural Resource
Preservation
Management Data and Scientific Knowledge /
Reduced Compliance Costs
Public Perception, Partnerships, Outreach
Boating Density Assessments
Potential increased value of recreation experience from improved management
Potential resource benefit from improved management (shoreline erosion related to boating for example)
Potential aquatic habitat benefit from improved management
Potential resource benefit from improved management (shoreline erosion)
Increased knowledge for enhanced management
Positive perception of proactive data gathering and recreation management
Developed Recreation Inventory and Surveys
4.3 million recreationists at surveyed reservoirs may benefit from improved reservoir management; field reconnaissance can lead to enhanced recreation conditions
Potential resource benefit from field assessments
Potential resource benefit from field assessments
Potential resource benefit from field assessments
Increased knowledge for enhanced management
Positive perception of proactive data gathering and recreation management
Recreation Design Principles
Potential value of improved recreation experience from improved resource quality at recreation sites
Potential resource benefit from better compliance with visitor guidelines
Potential resource benefit from better compliance with visitor guidelines
Potential resource benefit from better compliance with visitor guidelines
Positive perception of recreation management
Recreation Planning, Assistance, and Technical Support
$180,000 to $590,000 recreation value / campground
Potential benefit to resources from enhanced data sharing and technical support
Potential benefit to resources from enhanced data sharing and technical support
Potential benefit to resources from enhanced data sharing and technical support
Data sharing and technical support for increased recreation knowledge and enhanced management
Positive public perception for new campgrounds
Clean and Green Campground Initiative
Direct benefit to 195,000 person camping days per year for every 10 campgrounds; potential benefit to recreationists from improvement in water quality or biological resources and consequent.
Potential benefit to water quality
Potential benefit to habitat
Potential management knowledge developed that can be shared with other agencies
Positive perception related to stewardship of resources; Potential education regarding resource stewardship

Economic Benefits of the Tennessee Valley Authority’s Natural Resource Plan
January 2011 Cardno ENTRIX C-9
Table C-1c: Summary of Recreation Resource Program Benefits Under Enhanced Management Option
Recreation Program Recreation / Visitor Use
Benefit Water Resource
Benefit
Species / Habitat Conservation and
Abundance
Cultural Resource
Preservation
Management Data and Scientific Knowledge /
Reduced Compliance Costs
Public Perception, Partnerships, Outreach
Conservation Foundation and Trust Fund
Potential benefit to recreationists from recreation projects or improvement in water quality or biological resources and consequent.
Potential benefit to water quality
Potential benefit to habitat
Positive perception from funding projects benefitting the public
Recreation Information Management
Enhanced existing internet presence may benefit recreation users. There were 78,000 visits to TVA recreation web pages from July to October 2010, there may be as many as 300,000 annual visits to internet-based resources, indicating a high interest in recreation resource information
Positive perception related to availability of information on internet
Recreation Management Regulations
Potential benefits to water quality, cultural resources, biological resources and consequent increased recreation value
Potential benefit to water quality
Potential benefit to habitat
Potential benefit to cultural resources
Positive perception related to stewardship of resources
Annual Tours Value to visitors on tours. Potential benefit to resources from enhanced public awareness
Potential benefit to resources from enhanced public awareness
Potential benefit to resources from enhanced public awareness
Potential benefit to resources from enhanced public awareness
Positive perception of TVA stewardship

Economic Benefits of the Tennessee Valley Authority’s Natural Resource Plan
C-10 Cardno ENTRIX January 2011
Table C-1d Summary of Recreation Resource Program Benefits Under Flagship Management Option
Recreation Program Recreation / Visitor Use
Benefit Water Resource
Benefit
Species / Habitat Conservation and
Abundance
Cultural Resource
Preservation
Management Data and Scientific Knowledge /
Reduced Compliance Costs
Public Perception, Partnerships, Outreach
Campground Management: On Reservation
$1.48 to $4.93 million per year ; 1 flagship campground may benefit 6,500 campground visitors / year
Flagship campgrounds may reduce impact on water resources through water use efficiency
Development of sustainable techniques for use elsewhere
Positive perception related to continuing to maintain facilities. Sustainable initiatives may enhance perception and educate 26,000 users / year on renewable energy and water efficiency measures
Campground Management: Off Reservation
$0.74 to $2.5 million per year Positive perception related to continuing to maintain facilities and ADAAG upgrades
Blue-ways $6,000 to $16,000 per year Positive perception related to developing blue ways
Day Use Areas: On Reservation $4.2 to $14.0 million per year; Sustainable initiatives may benefit 46,000 users / year
Sustainable initiatives may reduce impact on water resources through water use efficiency
Development of sustainable techniques for use elsewhere.
Positive perception related to continuing to maintain facilities. Sustainable initiatives may enhance perception and educate 46,000 users / year on renewable energy and water efficiency measures
Day Use Areas: Off Reservation $4.62 to $15.4 million per year; ADAAG upgrades may benefit 7,000 users per year
Positive perception related to continuing to maintain facilities (or develop contractual agreements) and upgrade ADAAG
Greenways $200,000 to $400,000 per year Positive perception related to developing greenways

Economic Benefits of the Tennessee Valley Authority’s Natural Resource Plan
January 2011 Cardno ENTRIX C-11
Table C-1d Summary of Recreation Resource Program Benefits Under Flagship Management Option
Recreation Program Recreation / Visitor Use
Benefit Water Resource
Benefit
Species / Habitat Conservation and
Abundance
Cultural Resource
Preservation
Management Data and Scientific Knowledge /
Reduced Compliance Costs
Public Perception, Partnerships, Outreach
Stream Access Sites $388,000 to $1.05 million per year
Positive perception related to improving existing sites as well as developing additional access points and blue-way miles
Boating Density Assessments
8.7 million reservoir users may benefit; potential increased value of recreation experience from improved management
Potential resource benefit from improved management (shoreline erosion related to boating for example)
Potential aquatic habitat benefit from improved management
Potential resource benefit from improved management (shoreline erosion)
Increased knowledge for enhanced management
Positive perception of proactive data gathering and recreation management
Developed Recreation Inventory and Surveys
Recreationists at surveyed reservoirs may benefit from improved reservoir management; field reconnaissance can lead to enhanced recreation conditions
Potential resource benefit from field assessments
Potential resource benefit from field assessments
Potential resource benefit from field assessments
Increased knowledge for enhanced management
Positive perception of proactive data gathering and recreation management
Recreation Design Principles
Potential value of improved recreation experience from improved resource quality at recreation sites
Potential resource benefit from better compliance with visitor guidelines
Potential resource benefit from better compliance with visitor guidelines
Potential resource benefit from better compliance with visitor guidelines
Positive perception of recreation management
Recreation Planning, Assistance, and Technical Support
$180,000 to $590,000 recreation value / campground
Potential benefit to resources from enhanced data sharing and technical support
Potential benefit to resources from enhanced data sharing and technical support
Potential benefit to resources from enhanced data sharing and technical support
Data sharing and technical support for increased recreation knowledge and enhanced management
Positive public perception for new campgrounds

Economic Benefits of the Tennessee Valley Authority’s Natural Resource Plan
C-12 Cardno ENTRIX January 2011
Table C-1d Summary of Recreation Resource Program Benefits Under Flagship Management Option
Recreation Program Recreation / Visitor Use
Benefit Water Resource
Benefit
Species / Habitat Conservation and
Abundance
Cultural Resource
Preservation
Management Data and Scientific Knowledge /
Reduced Compliance Costs
Public Perception, Partnerships, Outreach
Clean and Green Campground Initiative
Direct benefit to 195,000 person camping days per year for every 10 campgrounds; potential benefit to recreationists from improvement in water quality or biological resources and consequent.
Potential benefit to water quality
Potential benefit to habitat
Potential management knowledge developed that can be shared with other agencies
Positive perception related to stewardship of resources; Potential education regarding resource stewardship
Conservation Foundation and Trust Fund
Potential benefit to recreationists from recreation projects or improvement in water quality or biological resources and consequent.
Potential benefit to water quality
Potential benefit to habitat
Positive perception from funding projects benefitting the public
Recreation Information Management
Enhanced existing internet presence and interactive recreation maps may benefit recreation users. There were 78,000 visits to TVA recreation web pages from July to October 2010, there may be as many as 300,000 annual visits to internet-based resources, indicating a high interest in recreation resource information
Positive perception related to availability of information on internet
Recreation Management Regulations
Potential benefits to water quality, cultural resources, biological resources and consequent increased recreation value
Potential benefit to water quality
Potential benefit to habitat
Potential benefit to cultural resources
Positive perception related to stewardship of resources
Annual Tours Value to visitors on tours. Potential benefit to resources from enhanced public awareness
Potential benefit to resources from enhanced public awareness
Potential benefit to resources from enhanced public awareness
Potential benefit to resources from enhanced public awareness
Positive perception of TVA stewardship

Economic Benefits of the Tennessee Valley Authority’s Natural Resource Plan
January 2011 Cardno ENTRIX C-13
Table C-2a Summary of Cultural Resource Program Benefits Under Current Management Option
Cultural Resource Programs
Recreation / Visitor Use Benefit (Access to Sites or Information;
Number and Quality of Recreation Sites)
Water Resource
Benefit
Species / Habitat Conservation and
Abundance Cultural Resource
Preservation
Management Data and Scientific
Knowledge / Reduced Compliance Costs
Public Perception, Partnerships,
Outreach
ARPA Protection of sites, potentially benefiting an estimated 6.0 million dispersed recreational users on TVA lands; Approximately 1.3 million people in TVA region visit archaeological sites (although they are not necessarily visitors to TVA-managed lands)
Potentially decreased Incidence of Looting with 1,000 ARPA inspections resulting in approximately 9 ARPA investigations annually and development of codified regulations; $100,000 to $250,000 value per incident based on ARPA fines.
Potential benefit from decreased incidences of looting.
Archaeological Monitoring and Protection
Protection of sites, potentially benefiting an estimated 6.0 million dispersed recreational users on TVA lands; Approximately 1.3 million people in TVA region visit archaeological sites (although they are not necessarily visitors to TVA-managed lands)
$3.1 to $9.4 million / year estimated benefit based on archaeological excavation costs; protection of archaeological sites from monitoring during mitigation projects
Increased management knowledge of archaeological sites.
Potential enhanced public perception from increased monitoring and increased resource preservation.
Native American Consultation
Regulatory Compliance Consultation every 5 years; Population of 18 federally recognized tribes is approximately 450,000 people; Enhanced public perception.
NAGPRA Regulatory Compliance Population of 18 federally recognized tribes is approximately 450,000 people

Economic Benefits of the Tennessee Valley Authority’s Natural Resource Plan
C-14 Cardno ENTRIX January 2011
Table C-2a Summary of Cultural Resource Program Benefits Under Current Management Option
Cultural Resource Programs
Recreation / Visitor Use Benefit (Access to Sites or Information;
Number and Quality of Recreation Sites)
Water Resource
Benefit
Species / Habitat Conservation and
Abundance Cultural Resource
Preservation
Management Data and Scientific
Knowledge / Reduced Compliance Costs
Public Perception, Partnerships,
Outreach
Preservation Program Potential benefit to users/ public of site identification from surveys; Approximately 1.3 million people in TVA region visit archaeological sites; Approximately 2.3 million people in the TVA region visit historic sites
Yes Potential Discovery of 150 sites from archaeological surveys; Potential discover of .05 historical sites per acre of historical structure surveys
Potential enhanced public perception from increased monitoring and increased resource preservation
Preserve America Potential benefit to users/public of adaptive reuse of historic buildings
Potential historic building preservation benefits from adaptive reuse studies
Increased historic building management knowledge
Positive perception related to adaptive reuse of historic buildings
NHPA Section 106 Compliance
Potential benefit to users from enhanced historic preservation.
Regulatory requirement and potential resource preservation from managing existing mitigation obligations and conducting Section 106 NHPA reviews
Positive perception of compliance
Cultural Resource Partnerships
Archaeological Outreach (Thousand Eyes Program)
Potential user benefits from 2-3 public outreach events
Potential increased protection from 2-3 public events
Increased public awareness from 2-3 public events
Corporate History Program

Economic Benefits of the Tennessee Valley Authority’s Natural Resource Plan
January 2011 Cardno ENTRIX C-15
Table C-2b Summary of Cultural Resource Program Benefits Under Custodial Management Option
Cultural Resource Programs
Recreation / Visitor Use Benefit (Access to Sites or Information;
Number and Quality of Recreation Sites)
Water Resource
Benefit
Species / Habitat Conservation and
Abundance ( Cultural Resource
Preservation
Management Data and Scientific
Knowledge / Reduced Compliance Costs
Public Perception, Partnerships,
Outreach
ARPA Protection of sites, potentially benefiting an estimated 6.0 million dispersed recreational users on TVA lands; Approximately 1.3 million people in TVA region visit archaeological sites (although they are not necessarily visitors to TVA-managed lands)
Potentially Control Incidence of Looting with ARPA inspections after reported incidents and development of codified regulations; $100,000 to $250,000 value per incident based on ARPA fines.
Potential benefit from decreased incidences of looting.
Archaeological Monitoring and Protection
Protection of sites, potentially benefiting an estimated 6.0 million dispersed recreational users on TVA lands; Approximately 1.3 million people in TVA region visit archaeological sites (although they are not necessarily visitors to TVA-managed lands)
$0.5 - $2.8 million / year estimated benefit based on archaeological excavation costs; increased protection of archaeological sites from monitoring of 400 sites
Increased management knowledge of archaeological sites.
Public perception benefit from increased site protection
Native American Consultation
Regulatory Compliance Consultation every 5 years; Population of 18 federally recognized tribes is approximately 450,000 people.
NAGPRA Regulatory Compliance Population of 18 federally recognized tribes is approximately 450,000 people.

Economic Benefits of the Tennessee Valley Authority’s Natural Resource Plan
C-16 Cardno ENTRIX January 2011
Table C-2b Summary of Cultural Resource Program Benefits Under Custodial Management Option
Cultural Resource Programs
Recreation / Visitor Use Benefit (Access to Sites or Information;
Number and Quality of Recreation Sites)
Water Resource
Benefit
Species / Habitat Conservation and
Abundance ( Cultural Resource
Preservation
Management Data and Scientific
Knowledge / Reduced Compliance Costs
Public Perception, Partnerships,
Outreach
Preservation Program Potential benefit to users/ public of site identification from surveys and nomination of 2 sites per year to National Register of Historic Places; Approximately 1.3 million people in TVA region visit archaeological sites; and 2.3 million people in the TVA region visit historic sites
Potential increased protection from nomination of 2 sites to National Historic Register and improved curation and management of artifact collection
Potential Discovery of 75 sites from archaeological surveys; Potential discover of .05 historical sites per acre of historical structure surveys; improved resource data and historic artifact management; Reduced compliance costs from developing database.
Potential enhanced public perception from listing of sites on National Register of Historic Places
Preserve America Potential benefits to visitors from plan for heritage tourism on TVA historic properties and adaptive reuse studies for historic buildings; approximately 2.3 million people in the TVA region visit historic sites; Values from visiting historic sites can range from $0-20 per visit. The national median visitation for historic sites is 16,000 (2006 American Museum Association).
Potential increased preservation of sites from submitting NHPA Section 3 and Section 110 reports and adaptive reuse studies of historic buildings
Increased management data from submitting NHPA Section 3 reports and Section 110 progress every three years and adaptive reuse studies
Potential enhanced public perception from heritage tourism plan, adaptive reuse studies, and regulatory compliance
NHPA Section 106 Compliance
Potential benefit to visitors of preservation of historic sites; Over 2.3 million people in the TVA region visit historic sites; Values from visiting historic sites can range from $0-20 per visit. The national median visitation for historic sites is 16,000 (2006 American Museum Association).
Potential increased protection from program to manage mitigation and compliance with Section 106
Enhanced information management through program to manage mitigation
Potential enhanced public perception from mitigation program and compliance with Section 106
Cultural Resource Partnerships
Archaeological Outreach (Thousand Eyes Program)
Potential user benefits from 3-5 public outreach events
Potential increased protection from 3-5 public events
Increased public awareness from 3-5 public events

Economic Benefits of the Tennessee Valley Authority’s Natural Resource Plan
January 2011 Cardno ENTRIX C-17
Table C-2b Summary of Cultural Resource Program Benefits Under Custodial Management Option
Cultural Resource Programs
Recreation / Visitor Use Benefit (Access to Sites or Information;
Number and Quality of Recreation Sites)
Water Resource
Benefit
Species / Habitat Conservation and
Abundance ( Cultural Resource
Preservation
Management Data and Scientific
Knowledge / Reduced Compliance Costs
Public Perception, Partnerships,
Outreach
Corporate History Program

Economic Benefits of the Tennessee Valley Authority’s Natural Resource Plan
C-18 Cardno ENTRIX January 2011
Table C-2c Summary of Cultural Resource Program Benefits Under Enhanced Management Option
Cultural Resource Programs
Recreation / Visitor Use Benefit (Access to Sites or Information;
Number and Quality of Recreation Sites)
Water Resource
Benefit
Species / Habitat Conservation and
Abundance ( Cultural Resource
Preservation
Management Data and Scientific Knowledge / Reduced Compliance
Costs
Public Perception, Partnerships,
Outreach
ARPA Protection of sites, potentially benefiting an estimated 6.0 million dispersed recreational users on TVA lands; Approximately 1.3 million people in TVA region visit archaeological sites (although they are not necessarily visitors to TVA-managed lands)
Potentially decreased Incidence of Looting with 2,500 ARPA inspections resulting in approximately 23 ARPA investigations annually; $100,000 to $250,000 value per incident based on ARPA fines.
Potential benefit from decreased incidences of looting.
Archaeological Monitoring and Protection
Protection of sites, potentially benefiting an estimated 6.0 million dispersed recreational users on TVA lands; Approximately 1.3 million people in TVA region visit archaeological sites (although they are not necessarily visitors to TVA-managed lands)
$0.6 to $5.2 million / year estimated benefit based on archaeological excavation costs; increased protection of archaeological sites from monitoring of 250 miles of shoreline
Increased management knowledge of archaeological sites.
Public perception benefit from increased site protection
Native American Consultation
Potential increased preservation from increased management knowledge of cultural resources from formal consultation every 3 years
Regulatory Compliance; increased management knowledge from formal consultation every 3 years
Consultation every 3 years; Population of 18 federally recognized tribes is approximately 450,000 people.
NAGPRA Regulatory Compliance Population of 18 federally recognized tribes is approximately 450,000 people.

Economic Benefits of the Tennessee Valley Authority’s Natural Resource Plan
January 2011 Cardno ENTRIX C-19
Table C-2c Summary of Cultural Resource Program Benefits Under Enhanced Management Option
Cultural Resource Programs
Recreation / Visitor Use Benefit (Access to Sites or Information;
Number and Quality of Recreation Sites)
Water Resource
Benefit
Species / Habitat Conservation and
Abundance ( Cultural Resource
Preservation
Management Data and Scientific Knowledge / Reduced Compliance
Costs
Public Perception, Partnerships,
Outreach
Preservation Program Potential benefit to users/ public of site identification from surveys and nomination of 4 sites per year to National Register of Historic Places; Approximately 1.3 million people in TVA region visit archaeological sites; and 2.3 million people in the TVA region visit historic sites
Potential increased protection from nomination of 4 sites to National Historic Register and improved curation and management of artifact collection
Potential Discovery of 225 sites from archaeological surveys; Potential discover of .05 historical sites per acre of historical structure surveys; improved resource data and historic artifact management
Potential enhanced public perception from listing of sites on National Register of Historic Places
Preserve America Potential benefits to visitors from 1-2 new partnerships/year and plan for heritage tourism on TVA historic properties; Over 2 million people in the TVA region visit historic sites; Values from visiting historic sites can range from $0-20 per visit. The national median visitation for historic sites is 16,000 (2006 American Museum Association).
Potential increased preservation of sites from submitting NHPA Section 3 and Section 110 reports, formal regulations, and adaptive reuse studies of historic buildings
Increased management data from submitting NHPA Section 3 reports and Section 110 progress every three years
Potential enhanced public perception from heritage tourism plan, adaptive reuse studies for historic buildings, and regulatory compliance
NHPA Section 106 Compliance
Potential benefit to visitors of increased preservation of historic sites; Approximately 2.3 million people in the TVA region visit historic sites; Values from visiting historic sites can range from $0-20 per visit. The national median visitation for historic sites is 16,000 (2006 American Museum Association).
Potential increased protection from program to manage mitigation, programmatic agreements with states regarding compliance for repetitive actions, and emergency procedures for Section 106 compliance
Enhanced information management through program to manage mitigation; Section 106 review compliance; Reduce staff time and save costs.
Partnership to develop programmatic agreements with states regarding compliance for repetitive actions. Enhanced public perception related to compliance with Section 106.
Cultural Resource Partnerships
Archaeological Outreach (Thousand Eyes Program)
Potential user benefits from public outreach events
Potential increased protection from 5-10 public events and 3-5 partnerships
Increased public awareness from 5-10 public events and 3-5 partnerships

Economic Benefits of the Tennessee Valley Authority’s Natural Resource Plan
C-20 Cardno ENTRIX January 2011
Table C-2c Summary of Cultural Resource Program Benefits Under Enhanced Management Option
Cultural Resource Programs
Recreation / Visitor Use Benefit (Access to Sites or Information;
Number and Quality of Recreation Sites)
Water Resource
Benefit
Species / Habitat Conservation and
Abundance ( Cultural Resource
Preservation
Management Data and Scientific Knowledge / Reduced Compliance
Costs
Public Perception, Partnerships,
Outreach
Corporate History Program
Visitor benefits from a formal TVA corporate history program, regular updates to the TVA timeline, outreach events, and oral history program; Approximately 2.3 million people in the TVA region visit historical sites and may be interested in TVA history. Website with historical outreach may benefit users; currently there are 7,000 annual visits to TVA Cultural Resources webpages.
Increased preservation of TVA corporate history, potential increased site protection from public outreach.
Public perception benefit from increased access to historical information

Economic Benefits of the Tennessee Valley Authority’s Natural Resource Plan
January 2011 Cardno ENTRIX C-21
Table C-2d Summary of Cultural Resource Program Benefits Under Flagship Management Option
Cultural Resource Programs
Recreation / Visitor Use Benefit (Access to Sites or Information;
Number and Quality of Recreation Sites)
Water Resource
Benefit
Species / Habitat Conservation and
Abundance ( Cultural Resource
Preservation
Management Data and Scientific
Knowledge / Reduced Compliance Costs
Public Perception, Partnerships,
Outreach
ARPA Protection of sites, potentially benefiting an estimated 6.0 million dispersed recreational users on TVA lands; Approximately 1.3 million people in TVA region visit archaeological sites (although they are not necessarily visitors to TVA-managed lands)
Potentially decreased Incidence of Looting with 5,000 ARPA inspections resulting in approximately 46 ARPA investigations annually; $100,000 to $250,000 value per incident based on ARPA fines.
Potential benefit from decreased incidences of looting.
Archaeological Monitoring and Protection
Protection of sites, potentially benefiting an estimated 6.0 million dispersed recreational users on TVA lands; Approximately 1.3 million people in TVA region visit archaeological sites (although they are not necessarily visitors to TVA-managed lands)
$1.7 to $9.9 million per year estimated benefit based on archaeological excavation costs; increased protection of archaeological sites from monitoring of 500 miles of shoreline
Increased management knowledge of archaeological sites.
Benefit from increased protection of sites
Native American Consultation
Potential increased preservation from increased management knowledge of cultural resources from formal consultation every 2 years
Regulatory Compliance; increased management knowledge from formal consultation every 2 years
Consultation every 2 years; Population of 18 federally recognized tribes is approximately 450,000 people.
NAGPRA Regulatory Compliance Population of 18 federally recognized tribes is approximately 450,000 people.

Economic Benefits of the Tennessee Valley Authority’s Natural Resource Plan
C-22 Cardno ENTRIX January 2011
Table C-2d Summary of Cultural Resource Program Benefits Under Flagship Management Option
Cultural Resource Programs
Recreation / Visitor Use Benefit (Access to Sites or Information;
Number and Quality of Recreation Sites)
Water Resource
Benefit
Species / Habitat Conservation and
Abundance ( Cultural Resource
Preservation
Management Data and Scientific
Knowledge / Reduced Compliance Costs
Public Perception, Partnerships,
Outreach
Preservation Program Benefit to public / visitors of online cemetery database for TVA managed lands; potential benefit to users/ public of site identification from surveys and nomination of 6 sites per year to National Register of Historic Places; Approximately 1.3 million people in TVA region visit archaeological sites; and 2.3 million people in the TVA region visit historic sites
Potential increased protection from nomination of 6 sites to National Historic Register and improved curation and management of artifact collection
Potential Discovery of 375 sites from archaeological surveys; Potential discover of .05 historical sites per acre of historical structure surveys; Additional identification through partnership with stakeholders; improved resource data and historic artifact management
Potential increased public perception from listing of sites on National Register of Historic Places
Preserve America Potential benefits to visitors from 3-5 new partnerships/year and plan for heritage tourism on TVA historic properties; Approximately 2.3 million people in the TVA region visit historic sites; Values from visiting historic sites can range from $0-20 per visit. The national median visitation for historic sites is 16,000 (2006 American Museum Association).
Potential increased preservation of sites from submitting NHPA Section 3 and Section 110 reports, formal regulations, and adaptive reuse studies of historic buildings
Increased management data from submitting NHPA Section 3 reports and Section 110 progress every three years
Potential enhanced public perception from heritage tourism plan and regulatory compliance
NHPA Section 106 Compliance
Potential benefit to visitors of increased preservation of historic sites; Approximately 2.3 million people in the TVA region visit historic sites; Values from visiting historic sites can range from $0-20 per visit. The national median visitation for historic sites is 16,000 (2006 American Museum Association).
Potential increased protection from program to manage mitigation, programmatic agreements with states regarding compliance for repetitive actions, and emergency procedures for Section 106 compliance
Enhanced information management through program to manage mitigation; Section 106 review compliance
Partnership to develop programmatic agreements with states regarding compliance for repetitive actions and compliance with Section 106
Cultural Resource Partnerships
Approximately 1.3 million people in TVA region visit archaeological sites; potential benefit to some visitors of observing field schools
Increased management knowledge from data collection from 1 to 2 schools and 1 to 2 grants
Increased management knowledge from data collection from 1 to 2 schools and 1 to 2 grants
Enhanced public perception for supporting research

Economic Benefits of the Tennessee Valley Authority’s Natural Resource Plan
January 2011 Cardno ENTRIX C-23
Table C-2d Summary of Cultural Resource Program Benefits Under Flagship Management Option
Cultural Resource Programs
Recreation / Visitor Use Benefit (Access to Sites or Information;
Number and Quality of Recreation Sites)
Water Resource
Benefit
Species / Habitat Conservation and
Abundance ( Cultural Resource
Preservation
Management Data and Scientific
Knowledge / Reduced Compliance Costs
Public Perception, Partnerships,
Outreach
Archaeological Outreach (Thousand Eyes Program)
Potential user benefits from public outreach events
Potential increased resource protection from outreach
Potential increased protection from 10-15 public events and 5-10 partnerships
Increased public awareness from 10-15 public events and 5-10 partnerships
Corporate History Program
$0.2 to $0.32 million / year visitor benefit from museum; Visitor benefits from a formal TVA corporate history program, regular updates to the TVA timeline, outreach events, and oral history program; Approximately 2.3 million people in the TVA region visit historical sites and may be interested in TVA history. 3-5 events and website with historical outreach may benefit users; currently there are 7,000 annual visits to TVA Cultural Resources web pages.
Increased preservation of TVA corporate history. Potential increased preservation of historical sites with 3-5 outreach events per year.
Public perception benefit from increased access to TVA history through events and website and a museum

Economic Benefits of the Tennessee Valley Authority’s Natural Resource Plan
C-24 Cardno ENTRIX January 2011
Table C-3a Summary of Biological Resource Program Benefits Under Current Management Option
Biological Resource Programs Recreation / Visitor Use Benefit
Water Resource
Benefit
Species / Habitat Conservation and
Abundance
Cultural Resource
Preservation
Management Data and Scientific Knowledge / Reduced Compliance
Costs
Public Perception, Partnerships,
Outreach
Dispersed Recreation Management
$60,000 to $330,000 in first year from dispersed area improvement for first year from dispersed area improvement (greater values in following years as total cumulative number of new//improved areas increase). Improved management knowledge can translated into increased protection of cultural, water, and biological resources and consequent increase in dispersed recreation value; estimated 6 million dispersed recreational users on TVA lands; Approximately 1.3 million people in TVA region visit archaeological sites
Improved management knowledge can translated into increased protection of resources
Improved management knowledge can translated into increased protection of resources
Improved management knowledge can translated into increased protection of resources
Improved management knowledge can translated into increased protection of resources
Public perception enhanced from improved dispersed recreation areas and opportunities
Trails Management
$13.5 to $19.5 million per year Benefit of maintaining existing trail system
Leave No Trace
Potential increased protection of cultural, water, and biological resources can increase in dispersed recreation value; estimated 6 million dispersed recreational users on TVA lands; Approximately 1.3 million people in TVA region visit archaeological sites
Potential increased protection of resources
Potential increased protection of resources
Potential increased protection of resources
Potential enhanced perception and knowledge from program
Land Condition Assessment and Land Stewardship Maintenance
Value to recreationists of habitat improvement estimated at $3 to $30 per acre
Knowledge of resource conditions can enhance prioritization of resource enhancement activities
Knowledge of resource conditions can enhance resource protection of resource enhancement activities
Knowledge of resource conditions can enhance prioritization of resource enhancement activities
Together with Endangered and Threatened Species, Natural Heritage Database and Wetland Database, current management cost savings to TVA of an estimated $18.5 million annually
Positive perception of stewardship activities
Natural Resources Management Implementation Plans
Potential habitat improvement value to recreation of $3 to $30 per acre / year (not known if Unit Plans will result in enhanced recreation value)
Potential increased protection of resources
Potential increased protection of resources from unit plan implementation on 18,000 acres
Potential increased protection of resources
Increased knowledge from stakeholder input
Positive image as good resource steward and receptive to stakeholder input

Economic Benefits of the Tennessee Valley Authority’s Natural Resource Plan
January 2011 Cardno ENTRIX C-25
Table C-3a Summary of Biological Resource Program Benefits Under Current Management Option
Biological Resource Programs Recreation / Visitor Use Benefit
Water Resource
Benefit
Species / Habitat Conservation and
Abundance
Cultural Resource
Preservation
Management Data and Scientific Knowledge / Reduced Compliance
Costs
Public Perception, Partnerships,
Outreach
TVA Natural Heritage Database
Knowledge of resource conditions can enhance resource protection of resource enhancement activities
Together with Endangered and Threatened Species, Natural Heritage Database and Wetland Database, current management cost savings to TVA of an estimated $18.5 million annually
TVA Wetland Database
Water quality benefits of wetland preservation
Knowledge of resource conditions can enhance resource protection and prioritization of resource enhancement activities
Together with Endangered and Threatened Species, Natural Heritage Database and Wetland Database, current management cost savings to TVA of an estimated $18.5 million annually
Boundary Maintenance
Preventing encroachment and unlawful uses provide potential benefit to recreationists. Value to recreationists of habitat improvement estimated at $3 to $30 per acre.
Potential increased protection of resources
Potential increased protection of resources
Potential increased protection of resources
Public perception benefit of ensuring no encroachment and appropriate uses
Agricultural and Open Lands Management
Recreation occurs on existing license agreements. Potential habitat benefit Positive image as good land steward and community partner
Dewatering Projects
$20 to $60 million based on an estimated 2.0 million visitors
Potential increased quality of water resources.
Project managed for wildlife benefit.
Positive image as good resource steward

Economic Benefits of the Tennessee Valley Authority’s Natural Resource Plan
C-26 Cardno ENTRIX January 2011
Table C-3a Summary of Biological Resource Program Benefits Under Current Management Option
Biological Resource Programs Recreation / Visitor Use Benefit
Water Resource
Benefit
Species / Habitat Conservation and
Abundance
Cultural Resource
Preservation
Management Data and Scientific Knowledge / Reduced Compliance
Costs
Public Perception, Partnerships,
Outreach
Forest Resource Management
Recreation value of up to $200 to $600 per acre per year based on 20 recreationists on average per acre.
Potential increased protection of resources
Forest resource management activities maintain healthy forests and habitat. With approximately 170,000 acres, forest accounts for 70% of habitat acreage on TVA-managed lands, and 58% of all 293,000 acres of NRP managed lands.
Potential increased protection of resources
Proactive forest management can reduce long-term management costs.
Positive image as good resource steward
Wildlife Habitat Enhancement Partnerships
$1,5,00 - $15,000 per year potential increased recreation value from habitat improvements
Habitat enhancement benefits Positive image as good resource steward
Integrated Resource Plans
Nonnative Invasive Plant Management
Potential recreation benefits from reduced invasive species resulting in healthier habitats
Potential increased protection of resources
$50,000 to $675,000 habitat/other benefits from preventing invasives from crowding out native species and degrading habitat
Potential increased protection of resources
Decreased long-term eradication costs
Positive image as good land steward and good land neighbor
Nuisance Animal Control
Benefits to recreationists areas from animal removal including preventing property damage
Potential increased protection of resources
Potential increased protection of resources
Cost savings of reduced power outages, safer conditions for employees
Positive image as good land steward and good land neighbor

Economic Benefits of the Tennessee Valley Authority’s Natural Resource Plan
January 2011 Cardno ENTRIX C-27
Table C-3a Summary of Biological Resource Program Benefits Under Current Management Option
Biological Resource Programs Recreation / Visitor Use Benefit
Water Resource
Benefit
Species / Habitat Conservation and
Abundance
Cultural Resource
Preservation
Management Data and Scientific Knowledge / Reduced Compliance
Costs
Public Perception, Partnerships,
Outreach
Terrestrial Greenhouse Gas Management
Long-term benefits from climate change avoidance
Long-term benefits from climate change avoidance
Enhanced management knowledge can reduce future compliance costs. Social value of per metric ton of carbon emission reduction / sequestration (based on avoided impacts of climate change) is typically estimated at $10 to $40 per ton. Currently, market value of carbon is very low in the United States.
Enhanced public perception of TVA and increased education regarding climate change
Wildlife Habitat Council—Third Party Certifications
$8,000 to $80,000 potential increased value to recreationists
Potential benefit to water resources
Habitat enhancement Positive image as good land steward
Conservation Planning
Reduce compliance costs through partnerships and increased communication with regulators to help inform and shape policy discussions.
Positive image of a collaborative partner

Economic Benefits of the Tennessee Valley Authority’s Natural Resource Plan
C-28 Cardno ENTRIX January 2011
Table C-3a Summary of Biological Resource Program Benefits Under Current Management Option
Biological Resource Programs Recreation / Visitor Use Benefit
Water Resource
Benefit
Species / Habitat Conservation and
Abundance
Cultural Resource
Preservation
Management Data and Scientific Knowledge / Reduced Compliance
Costs
Public Perception, Partnerships,
Outreach
Endangered and Threatened Species Program
Value to recreationists of habitat improvement estimated at $3 to $30 per acre.
Enhanced management and prioritization based on improved management knowledge of resource status. Value to people of endangered species population protection varies by species and size of species population increase, but for birds and mammals can range from $5 to $100 per household per year for significant increases in species protection rates.
Additional predictive models and additional data gathering can decrease compliance costs through avoidance of impact in the planning process, and reduction in subsequent mitigation cost.
Positive image as land steward
Migratory Birds Management
There are an estimated 110,000 migratory bird hunters and 2.0 million people who view birds in the TVA region. Improvements to migratory bird habitat and populations would benefit these recreationists. Recreation benefits of habitat improvement may be in the range of $3 to $30 per acre.
Compliance with EO 13186 may enhance migratory bird habitat.
Partnerships and relationships important for regulatory compliance and streamlining permitting processes
Positive image of a collaborative partner and good land steward
Natural Areas Program
$5,000 to $50,000 potential recreation value from natural area improvements (Habitat improvement valued at an estimated $3 to $30 per acre based on recreation value.)
Potential increased protection of resources
Potential increased protection of resources
Potential increased protection of resources
Increased knowledge from monitoring
Positive image as good land steward
Wetland Management
Benefit to recreationists, particularly waterfowl hunters and wildlife viewers of wetland protection.
Protection of water resources
Protection of wetland resources; Wetland value per acre is estimated to range from $150 to $1600 per acre;
Proactive management can reduce compliance costs by avoiding impacts to wetland resources early on during the project planning process.
Positive image as good land steward
Environmental Education Program

Economic Benefits of the Tennessee Valley Authority’s Natural Resource Plan
January 2011 Cardno ENTRIX C-29
Table C-3a Summary of Biological Resource Program Benefits Under Current Management Option
Biological Resource Programs Recreation / Visitor Use Benefit
Water Resource
Benefit
Species / Habitat Conservation and
Abundance
Cultural Resource
Preservation
Management Data and Scientific Knowledge / Reduced Compliance
Costs
Public Perception, Partnerships,
Outreach
Natural Resources Communication
Resource Stewardship Campaigns
Volunteer Program

Economic Benefits of the Tennessee Valley Authority’s Natural Resource Plan
C-30 Cardno ENTRIX January 2011
Table C-3b Summary of Biological Resource Program Benefits Under Custodial Management Option
Biological Resource Programs Recreation / Visitor Use Benefit
Water Resource Benefit
Species / Habitat Conservation and
Abundance
Cultural Resource
Preservation
Management Data and Scientific Knowledge /
Reduced Compliance Costs
Public Perception, Partnerships,
Outreach
Dispersed Recreation Management
$600,000 to $2.85 million for first year from dispersed area improvement (greater values in following years as total cumulative number of new//improved areas increase). Improved management knowledge can translated into increased protection of cultural, water, and biological resources and consequent increase in dispersed recreation value; estimated 6 million dispersed recreational users on TVA lands; Approximately 1.3 million people in TVA region visit archaeological sites
Improved management knowledge can translated into increased protection of resources
Improved management knowledge can translated into increased protection of resources
Improved management knowledge can translated into increased protection of resources
Improved management knowledge can translated into increased protection of resources
Public perception enhanced from improved dispersed recreation areas and opportunities
Trails Management
$15 to $21.7 million per year Benefit of maintaining and expanding existing trail system
Leave No Trace
Land Condition Assessment and Land Stewardship Maintenance
Value to recreationists of habitat improvement estimated at $3 to $30 per acre
Knowledge of resource conditions and implementation of 10 existing Unit Plans can enhance prioritization of resource enhancement activities
Knowledge of resource conditions and implementation of 10 existing Unit Plans can enhance resource protection of resource enhancement activities
Knowledge of resource conditions can enhance prioritization of resource enhancement activities
Together with Endangered and Threatened Species, Natural Heritage Database and Wetland Database, current management cost savings to TVA of an estimated $18.5 million annually
Positive perception of stewardship activities
TVA Natural Heritage Database
Knowledge of resource conditions can enhance resource protection of resource enhancement activities
With Endangered and Threatened Species, Natural Heritage Database and Wetland Database, current management cost savings to TVA of an estimated $18.5 million annually
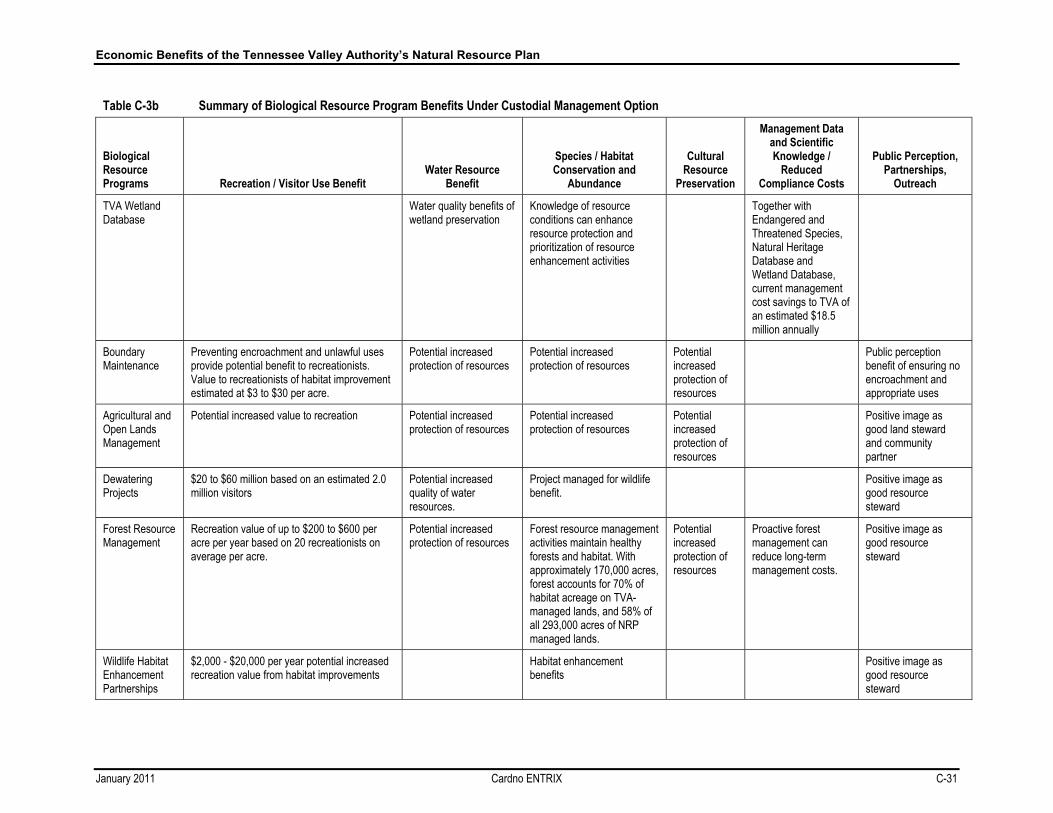
Economic Benefits of the Tennessee Valley Authority’s Natural Resource Plan
January 2011 Cardno ENTRIX C-31
Table C-3b Summary of Biological Resource Program Benefits Under Custodial Management Option
Biological Resource Programs Recreation / Visitor Use Benefit
Water Resource Benefit
Species / Habitat Conservation and
Abundance
Cultural Resource
Preservation
Management Data and Scientific Knowledge /
Reduced Compliance Costs
Public Perception, Partnerships,
Outreach
TVA Wetland Database
Water quality benefits of wetland preservation
Knowledge of resource conditions can enhance resource protection and prioritization of resource enhancement activities
Together with Endangered and Threatened Species, Natural Heritage Database and Wetland Database, current management cost savings to TVA of an estimated $18.5 million annually
Boundary Maintenance
Preventing encroachment and unlawful uses provide potential benefit to recreationists. Value to recreationists of habitat improvement estimated at $3 to $30 per acre.
Potential increased protection of resources
Potential increased protection of resources
Potential increased protection of resources
Public perception benefit of ensuring no encroachment and appropriate uses
Agricultural and Open Lands Management
Potential increased value to recreation Potential increased protection of resources
Potential increased protection of resources
Potential increased protection of resources
Positive image as good land steward and community partner
Dewatering Projects
$20 to $60 million based on an estimated 2.0 million visitors
Potential increased quality of water resources.
Project managed for wildlife benefit.
Positive image as good resource steward
Forest Resource Management
Recreation value of up to $200 to $600 per acre per year based on 20 recreationists on average per acre.
Potential increased protection of resources
Forest resource management activities maintain healthy forests and habitat. With approximately 170,000 acres, forest accounts for 70% of habitat acreage on TVA-managed lands, and 58% of all 293,000 acres of NRP managed lands.
Potential increased protection of resources
Proactive forest management can reduce long-term management costs.
Positive image as good resource steward
Wildlife Habitat Enhancement Partnerships
$2,000 - $20,000 per year potential increased recreation value from habitat improvements
Habitat enhancement benefits
Positive image as good resource steward

Economic Benefits of the Tennessee Valley Authority’s Natural Resource Plan
C-32 Cardno ENTRIX January 2011
Table C-3b Summary of Biological Resource Program Benefits Under Custodial Management Option
Biological Resource Programs Recreation / Visitor Use Benefit
Water Resource Benefit
Species / Habitat Conservation and
Abundance
Cultural Resource
Preservation
Management Data and Scientific Knowledge /
Reduced Compliance Costs
Public Perception, Partnerships,
Outreach
Nonnative Invasive Plant Management
Potential recreation benefits from reduced invasive species resulting in healthier habitats
Potential increased protection of resources
$80,000 to $1.1 million habitat/other benefits from preventing invasives from crowding out native species and degrading habitat
Potential increased protection of resources
Decreased long-term eradication costs
Positive image as good land steward and good land neighbor
Nuisance Animal Control
Benefits to recreationists areas from animal removal including preventing property damage
Potential increased protection of resources
Potential increased protection of resources
Cost savings of reduced power outages, safer conditions for employees
Positive image as good land steward and good land neighbor
Terrestrial Greenhouse Gas Management
Potential interest and value to recreationists and visitors of research projects and greenhouse gas management plan.
Long-term benefits from climate change avoidance
Long-term benefits from climate change avoidance
Enhanced management knowledge can reduce future compliance costs. Social value of per metric ton of carbon emission reduction / sequestration (based on avoided impacts of climate change) is typically estimated at $10 to $40 per ton. Currently, market value of carbon is very low in the United States.
Enhanced public perception of TVA and increased education regarding climate change
Wildlife Habitat Council—Third Party Certifications

Economic Benefits of the Tennessee Valley Authority’s Natural Resource Plan
January 2011 Cardno ENTRIX C-33
Table C-3b Summary of Biological Resource Program Benefits Under Custodial Management Option
Biological Resource Programs Recreation / Visitor Use Benefit
Water Resource Benefit
Species / Habitat Conservation and
Abundance
Cultural Resource
Preservation
Management Data and Scientific Knowledge /
Reduced Compliance Costs
Public Perception, Partnerships,
Outreach
Conservation Planning
Reduce compliance costs through partnerships and increased communication with regulators to help inform and shape policy discussions.
Positive image of a collaborative partner
Endangered and Threatened Species Program
Value to recreationists of habitat improvement estimated at $3 to $30 per acre.
Enhanced management and prioritization based on improved management knowledge of resource status. Value to people of endangered species population protection varies by species and size of species population increase, but for birds and mammals can range from $5 to $100 per household per year for significant increases in species protection rates.
Data gathering can decrease compliance costs through avoidance of impact in the planning process, and reduction in subsequent mitigation cost.
Positive image as good land steward
Migratory Birds Management
There are an estimated 110,000 migratory bird hunters and 2.0 million people who view birds in the TVA region. Improvements to migratory bird habitat and populations would benefit these recreationists. Recreation benefits of habitat improvement may be in the range of $3 to $30 per acre.
Data sharing for enhanced habitat / species protection
Partnerships and relationships important for regulatory compliance and streamlining permitting processes
Positive image of a collaborative partner and good land steward
Natural Areas Program
$35,000 to $335,000 potential recreation value from natural area improvements (Habitat improvement valued at an estimated $3 to $30 per acre based on recreation value.)
Potential increased protection of resources
Potential increased protection of resources
Potential increased protection of resources
Increased knowledge from monitoring
Positive image as good land steward

Economic Benefits of the Tennessee Valley Authority’s Natural Resource Plan
C-34 Cardno ENTRIX January 2011
Table C-3b Summary of Biological Resource Program Benefits Under Custodial Management Option
Biological Resource Programs Recreation / Visitor Use Benefit
Water Resource Benefit
Species / Habitat Conservation and
Abundance
Cultural Resource
Preservation
Management Data and Scientific Knowledge /
Reduced Compliance Costs
Public Perception, Partnerships,
Outreach
Wetland Management
Benefit to recreationists, particularly waterfowl hunters and wildlife viewers of wetland protection.
Protection of water resources
Protection of wetland resources; Wetland value per acre is estimated to range from $150 to $1600 per acre;
Proactive management can reduce compliance costs by avoiding impacts to wetland resources early on during the project planning process.
Positive image as good land steward
Environmental Education Program
Natural Resources Communication
Resource Stewardship Campaigns
Volunteer Program
Value to volunteer of $20/hour; potential benefit to recreationists
Potential increased protection of resources
Potential increased protection of resources
Potential increased protection of resources
Enhanced public perception of TVA and increased education regarding resources

Economic Benefits of the Tennessee Valley Authority’s Natural Resource Plan
January 2011 Cardno ENTRIX C-35
Table C-3c Summary of Biological Resource Program Benefits Under Enhanced Management Option
Biological Resource Programs Recreation / Visitor Use Benefit
Water Resource Benefit
Species / Habitat Conservation and
Abundance
Cultural Resource
Preservation
Management Data and Scientific Knowledge / Reduced Compliance
Costs
Public Perception,
Partnerships, Outreach
Dispersed Recreation Management
$900,000 to $5.0 million for first year from dispersed area improvement (greater values in following years as total cumulative number of new//improved areas increase). Improved management knowledge can translated into increased protection of cultural, water, and biological resources and consequent increase in dispersed recreation value; estimated 6 million dispersed recreational users on TVA lands; Approximately 1.3 million people in TVA region visit archaeological sites
Improved management knowledge can translated into increased protection of resources
Improved management knowledge can translated into increased protection of resources
Improved management knowledge can translated into increased protection of resources
Improved management knowledge can translated into increased protection of resources
Public perception enhanced from improved dispersed recreation areas and opportunities
Trails Management
$15.0 to $21.7 million per year Benefit of maintaining and expanding existing trail system
Leave No Trace Potential increased protection of cultural, water, and biological resources can increase in dispersed recreation value; estimated 6 million dispersed recreational users on TVA lands; Approximately 1.3 million people in TVA region visit archaeological sites
Potential increased protection of resources
Potential increased protection of resources
Potential increased protection of resources
Potential enhanced perception and knowledge from program
Land Condition Assessment and Land Stewardship Maintenance
Value to recreationists of habitat improvement estimated at $3 to $30 per acre.
Knowledge of resource conditions can enhance prioritization of resource enhancement activities
Knowledge of resource conditions can enhance resource protection of resource enhancement activities
Knowledge of resource conditions can enhance prioritization of resource enhancement activities
Together with Endangered and Threatened Species, Natural Heritage Database and Wetland Database, current management cost savings to TVA of an estimated $18.5 million annually
Positive perception of stewardship activities

Economic Benefits of the Tennessee Valley Authority’s Natural Resource Plan
C-36 Cardno ENTRIX January 2011
Table C-3c Summary of Biological Resource Program Benefits Under Enhanced Management Option
Biological Resource Programs Recreation / Visitor Use Benefit
Water Resource Benefit
Species / Habitat Conservation and
Abundance
Cultural Resource
Preservation
Management Data and Scientific Knowledge / Reduced Compliance
Costs
Public Perception,
Partnerships, Outreach
TVA Natural Heritage Database
Knowledge of resource conditions can enhance resource protection of resource enhancement activities
Together with Endangered and Threatened Species, Natural Heritage Database and Wetland Database, current management cost savings to TVA of an estimated $18.5 million annually
TVA Wetland Database
Water quality benefits of wetland preservation
Knowledge of resource conditions can enhance resource protection and prioritization of resource enhancement activities
Together with Endangered and Threatened Species, Natural Heritage Database and Wetland Database, current management cost savings to TVA of an estimated $18.5 million annually
Boundary Maintenance
Preventing encroachment and unlawful uses provide potential benefit to recreationists. Value to recreationists of habitat improvement estimated at $3 to $30 per acre.
Potential increased protection of resources
Potential increased protection of resources
Potential increased protection of resources
Public perception benefit of ensuring no encroachment and appropriate uses
Agricultural and Open Lands Management
Recreation occurs on existing license agreements, but may be enhanced via converting lands. Habitat improvement value $3 to $30 per acre / year for recreation.
Potential increased protection of resources
Potential increased protection of resources
Potential increased protection of resources
Positive image as good land steward and community partner
Dewatering Projects
$20 to $60 million based on an estimated 2.0 million visitors
Potential increased quality of water resources.
Project managed for wildlife benefit.
Positive image as good resource steward

Economic Benefits of the Tennessee Valley Authority’s Natural Resource Plan
January 2011 Cardno ENTRIX C-37
Table C-3c Summary of Biological Resource Program Benefits Under Enhanced Management Option
Biological Resource Programs Recreation / Visitor Use Benefit
Water Resource Benefit
Species / Habitat Conservation and
Abundance
Cultural Resource
Preservation
Management Data and Scientific Knowledge / Reduced Compliance
Costs
Public Perception,
Partnerships, Outreach
Forest Resource Management
Recreation value of up to $200 to $600 per acre per year based on 20 recreationists on average per acre.
Potential increased protection of resources
Forest resource management activities maintain healthy forests and habitat. With approximately 170,000 acres, forest accounts for 70% of habitat acreage on TVA-managed lands, and 58% of all 293,000 acres of NRP managed lands.
Potential increased protection of resources
Proactive forest management can reduce long-term management costs.
Positive image as good resource steward
Wildlife Habitat Enhancement Partnerships
$63,000 - $630,000 per year potential increased recreation value from habitat improvements
Habitat enhancement benefits
Positive image as good resource steward
Nonnative Invasive Plant Management
Potential recreation benefits from reduced invasive species resulting in healthier habitats
Potential increased protection of resources
$160,000 to $2.3 million habitat/other benefits from preventing invasives from crowding out native species and degrading habitat
Potential increased protection of resources
Decreased long-term eradication costs
Positive image as good land steward and good land neighbor
Nuisance Animal Control
Benefits to recreationists areas from animal removal including preventing property damage
Potential increased protection of resources
Potential increased protection of resources
Cost savings of reduced power outages, safer conditions for employees
Positive image as good land steward and good land neighbor

Economic Benefits of the Tennessee Valley Authority’s Natural Resource Plan
C-38 Cardno ENTRIX January 2011
Table C-3c Summary of Biological Resource Program Benefits Under Enhanced Management Option
Biological Resource Programs Recreation / Visitor Use Benefit
Water Resource Benefit
Species / Habitat Conservation and
Abundance
Cultural Resource
Preservation
Management Data and Scientific Knowledge / Reduced Compliance
Costs
Public Perception,
Partnerships, Outreach
Terrestrial Greenhouse Gas Management
Potential interest and value to recreationists and visitors of demonstration projects and GHG management plan.
Long-term benefits from climate change avoidance
Long-term benefits from climate change avoidance
Enhanced management knowledge can reduce future compliance costs. Social value of per metric ton of carbon emission reduction / sequestration (based on avoided impacts of climate change) is typically estimated at $10 to $40 per ton. Currently, market value of carbon is very low in the United States.
Enhanced public perception of TVA and increased education regarding climate change
Wildlife Habitat Council—Third Party Certifications
$17,000 to $170,000 potential increased value to recreationists
Potential benefit to water resources
Habitat enhancement Positive image as good land steward
Conservation Planning
Reduce compliance costs through partnerships and increased communication with regulators to help inform and shape policy discussions.
Positive image of a collaborative partner

Economic Benefits of the Tennessee Valley Authority’s Natural Resource Plan
January 2011 Cardno ENTRIX C-39
Table C-3c Summary of Biological Resource Program Benefits Under Enhanced Management Option
Biological Resource Programs Recreation / Visitor Use Benefit
Water Resource Benefit
Species / Habitat Conservation and
Abundance
Cultural Resource
Preservation
Management Data and Scientific Knowledge / Reduced Compliance
Costs
Public Perception,
Partnerships, Outreach
Endangered and Threatened Species Program
Value to recreationists of habitat improvement estimated at $3 to $30 per acre.
Enhanced management and prioritization based on improved management knowledge of resource status. Value to people of endangered species population protection varies by species and size of species population increase, but for birds and mammals can range from $5 to $100 per household per year for significant increases in species protection rates.
Additional predictive models and additional data gathering can decrease compliance costs through avoidance of impact in the planning process, and reduction in subsequent mitigation cost.
Positive image as land steward
Migratory Birds Management
There are an estimated 110,000 migratory bird hunters and 2.0 million people who view birds in the TVA region. Improvements to migratory bird habitat and populations would benefit these recreationists. Recreation benefits of habitat improvement may be in the range of $3 to $30 per acre.
Data sharing for enhanced habitat / species protection
Partnerships and relationships important for regulatory compliance and streamlining permitting processes
Positive image of a collaborative partner and good land steward
Natural Areas Program
$45,000 to $435,000 potential recreation value from natural area improvements (Habitat improvement valued at an estimated $3 to $30 per acre based on recreation value.)
Potential increased protection of resources
Potential increased protection of resources
Potential increased protection of resources
Increased knowledge from monitoring
Positive image as good land steward
Wetland Management
Benefit to recreationists, particularly waterfowl hunters and wildlife viewers of wetland protection.
Protection of water resources
Protection of wetland resources; Wetland value per acre is estimated to range from $150 to $1600 per acre;
Proactive management can reduce compliance costs by avoiding impacts to wetland resources early on during the project planning process.
Positive image as good land steward

Economic Benefits of the Tennessee Valley Authority’s Natural Resource Plan
C-40 Cardno ENTRIX January 2011
Table C-3c Summary of Biological Resource Program Benefits Under Enhanced Management Option
Biological Resource Programs Recreation / Visitor Use Benefit
Water Resource Benefit
Species / Habitat Conservation and
Abundance
Cultural Resource
Preservation
Management Data and Scientific Knowledge / Reduced Compliance
Costs
Public Perception,
Partnerships, Outreach
Environmental Education Program
Potential value of $250,000 - $500,000 per nature center. Benefit to visitors of internet resources.
Potential increased protection of resources
Potential increased protection of resources
Potential increased protection of resources
Enhanced public perception of TVA and increased education regarding resources
Natural Resources Communication
Resource Stewardship Campaigns
Volunteer Program
Value to volunteer of $20/hour; potential benefit to recreationists
Potential increased protection of resources
Potential increased protection of resources
Potential increased protection of resources
Enhanced public perception of TVA and increased education regarding resources

Economic Benefits of the Tennessee Valley Authority’s Natural Resource Plan
January 2011 Cardno ENTRIX C-41
Table C-3d Summary of Biological Resource Program Benefits Under Flagship Management Option
Biological Resource Programs Recreation / Visitor Use Benefit
Water Resource Benefit
Species / Habitat Conservation and
Abundance
Cultural Resource
Preservation
Management Data and Scientific Knowledge / Reduced Compliance
Costs
Public Perception,
Partnerships, Outreach
Dispersed Recreation Management
$1.2 to $7.0 million for first year from dispersed area improvement (greater values in following years as total cumulative number of new//improved areas increases). Improved management knowledge can translated into increased protection of cultural, water, and biological resources and consequent increase in dispersed recreation value; estimated 6 million dispersed recreational users on TVA lands; Approximately 1.3 million people in TVA region visit archaeological sites
Improved management knowledge can translated into increased protection of resources
Improved management knowledge can translated into increased protection of resources
Improved management knowledge can translated into increased protection of resources
Improved management knowledge can translated into increased protection of resources
Public perception enhanced from improved dispersed recreation areas and opportunities
Trails Management
$16.5 to $23.8 million per year Benefit of maintaining and expanding existing trail system
Leave No Trace Potential increased protection of cultural, water, and biological resources can increase in dispersed recreation value; estimated 6 million dispersed recreational users on TVA lands; Approximately 1.3 million people in TVA region visit archaeological sites
Potential increased protection of resources
Potential increased protection of resources
Potential increased protection of resources
Potential enhanced perception and knowledge from program
Land Condition Assessment and Land Stewardship Maintenance
Value to recreationists of habitat improvement estimated at $3 to $30 per acre
Knowledge of resource conditions can enhance prioritization of resource enhancement activities
Knowledge of resource conditions can enhance resource protection of resource enhancement activities
Knowledge of resource conditions can enhance prioritization of resource enhancement activities
Together with Endangered and Threatened Species, Natural Heritage Database and Wetland Database, current management cost savings to TVA of an estimated $18.5 million annually
Positive perception of stewardship activities

Economic Benefits of the Tennessee Valley Authority’s Natural Resource Plan
C-42 Cardno ENTRIX January 2011
Table C-3d Summary of Biological Resource Program Benefits Under Flagship Management Option
Biological Resource Programs Recreation / Visitor Use Benefit
Water Resource Benefit
Species / Habitat Conservation and
Abundance
Cultural Resource
Preservation
Management Data and Scientific Knowledge / Reduced Compliance
Costs
Public Perception,
Partnerships, Outreach
TVA Natural Heritage Database
Knowledge of resource conditions can enhance resource protection of resource enhancement activities
Together with Endangered and Threatened Species, Natural Heritage Database and Wetland Database, current management cost savings to TVA of an estimated $18.5 million annually
TVA Wetland Database
Water quality benefits of wetland preservation
Knowledge of resource conditions can enhance resource protection and prioritization of resource enhancement activities
Together with Endangered and Threatened Species, Natural Heritage Database and Wetland Database, current management cost savings to TVA of an estimated $18.5 million annually
Boundary Maintenance
Preventing encroachment and unlawful uses provide potential benefit to recreationists. Value to recreationists of habitat improvement estimated at $3 to $30 per acre.
Potential increased protection of resources
Potential increased protection of resources
Potential increased protection of resources
Public perception benefit of ensuring no encroachment and appropriate uses
Agricultural and Open Lands Management
Recreation occurs on existing license agreements, but may be enhanced via converting lands. Habitat improvement value $3 to $30 per acre / year for recreation.
Potential increased protection of resources
Potential increased protection of resources
Potential increased protection of resources
Positive image as good land steward and community partner
Dewatering Projects
$20 to $60 million based on an estimated 2.0 million visitors
Potential increased quality of water resources.
Project managed for wildlife benefit.
Positive image as good resource steward

Economic Benefits of the Tennessee Valley Authority’s Natural Resource Plan
January 2011 Cardno ENTRIX C-43
Table C-3d Summary of Biological Resource Program Benefits Under Flagship Management Option
Biological Resource Programs Recreation / Visitor Use Benefit
Water Resource Benefit
Species / Habitat Conservation and
Abundance
Cultural Resource
Preservation
Management Data and Scientific Knowledge / Reduced Compliance
Costs
Public Perception,
Partnerships, Outreach
Forest Resource Management
Recreation value of up to $200 to $600 per acre per year based on 20 recreationists on average per acre.
Potential increased protection of resources
Forest resource management activities maintain healthy forests and habitat. With approximately 170,000 acres, forest accounts for 70% of habitat acreage on TVA-managed lands, and 58% of all 293,000 acres of NRP managed lands.
Potential increased protection of resources
Proactive forest management can reduce long-term management costs.
Positive image as good resource steward
Wildlife Habitat Enhancement Partnerships
$120,000 - $1.2 million per year potential increased recreation value from habitat improvements
Habitat enhancement benefits
Positive image as good resource steward
Nonnative Invasive Plant Management
Potential recreation benefits from reduced invasive species resulting in healthier habitats
Potential increased protection of resources
$320,000 to $4.5 million habitat/other benefits from preventing invasives from crowding out native species and degrading habitat
Potential increased protection of resources
Decreased long-term eradication costs
Positive image as good land steward and good land neighbor
Nuisance Animal Control
Benefits to recreationists areas from animal removal including preventing property damage
Potential increased protection of resources
Potential increased protection of resources
Cost savings of reduced power outages, safer conditions for employees
Positive image as good land steward and good land neighbor

Economic Benefits of the Tennessee Valley Authority’s Natural Resource Plan
C-44 Cardno ENTRIX January 2011
Table C-3d Summary of Biological Resource Program Benefits Under Flagship Management Option
Biological Resource Programs Recreation / Visitor Use Benefit
Water Resource Benefit
Species / Habitat Conservation and
Abundance
Cultural Resource
Preservation
Management Data and Scientific Knowledge / Reduced Compliance
Costs
Public Perception,
Partnerships, Outreach
Terrestrial Greenhouse Gas Management
Potential interest and value to recreationists and visitors of demonstration projects.
Long-term benefits from climate change avoidance
Long-term benefits from climate change avoidance
Enhanced management knowledge can reduce future compliance costs. Social value of per metric ton of carbon emission reduction / sequestration (based on avoided impacts of climate change) is typically estimated at $10 to $40 per ton. Currently, market value of carbon is very low in the United States.
Enhanced public perception of TVA and increased education regarding climate change
Wildlife Habitat Council—Third Party Certifications
$23,000 to $230,000 potential increased value to recreationists
Potential benefit to water resources
Habitat enhancement Positive image as good land steward
Conservation Planning
Reduce compliance costs through partnerships and increased communication with regulators to help inform and shape policy discussions.
Positive image of a collaborative partner

Economic Benefits of the Tennessee Valley Authority’s Natural Resource Plan
January 2011 Cardno ENTRIX C-45
Table C-3d Summary of Biological Resource Program Benefits Under Flagship Management Option
Biological Resource Programs Recreation / Visitor Use Benefit
Water Resource Benefit
Species / Habitat Conservation and
Abundance
Cultural Resource
Preservation
Management Data and Scientific Knowledge / Reduced Compliance
Costs
Public Perception,
Partnerships, Outreach
Endangered and Threatened Species Program
Value to recreationists of habitat improvement estimated at $3 to $30 per acre.
Enhanced management and prioritization based on improved management knowledge of resource status. Value to people of endangered species population protection varies by species and size of species population increase, but for birds and mammals can range from $5 to $100 per household per year for significant increases in species protection rates.
Additional predictive models and additional data gathering can decrease compliance costs through avoidance of impact in the planning process, and reduction in subsequent mitigation cost.
Positive image as land steward
Migratory Birds Management
There are an estimated 110,000 migratory bird hunters and 2.0 million people who view birds in the TVA region. Improvements to migratory bird habitat and populations would benefit these recreationists. Recreation benefits of habitat improvement may be in the range of $3 to $30 per acre.
Data sharing for enhanced habitat / species protection
Partnerships and relationships important for regulatory compliance and streamlining permitting processes
Positive image of a collaborative partner and good land steward
Natural Areas Program
$55,000 to $550,000 potential recreation value from natural area improvements (Habitat improvement valued at an estimated $3 to $30 per acre based on recreation value.)
Potential increased protection of resources
Potential increased protection of resources
Potential increased protection of resources
Increased knowledge from monitoring
Positive image as good land steward
Wetland Management
Benefit to recreationists, particularly waterfowl hunters and wildlife viewers of wetland protection.
Protection of water resources
Protection of wetland resources; Wetland value per acre is estimated to range from $150 to $1600 per acre;
Proactive management can reduce compliance costs by avoiding impacts to wetland resources early on during the project planning process.
Positive image as good land steward

Economic Benefits of the Tennessee Valley Authority’s Natural Resource Plan
C-46 Cardno ENTRIX January 2011
Table C-3d Summary of Biological Resource Program Benefits Under Flagship Management Option
Biological Resource Programs Recreation / Visitor Use Benefit
Water Resource Benefit
Species / Habitat Conservation and
Abundance
Cultural Resource
Preservation
Management Data and Scientific Knowledge / Reduced Compliance
Costs
Public Perception,
Partnerships, Outreach
Environmental Education Program
Potential value of $250,000 - $500,000 per nature center. Benefit to visitors of internet resources.
Potential increased protection of resources
Potential increased protection of resources
Potential increased protection of resources
Enhanced public perception of TVA and increased education regarding resources
Natural Resources Communication
Potential benefit to recreation of increased protection or enhancement of TVA resources; Increased information available on website may provide direct benefit to recreationists
Potential increased protection of resources
Potential increased protection of resources
Potential increased protection of resources
Enhanced public perception of TVA and increased education regarding resources
Resource Stewardship Campaigns
Potential benefit to recreation of increased protection or enhancement of TVA resources
Potential increased protection of resources
Potential increased protection of resources
Potential increased protection of resources
Enhanced public perception of TVA and increased education regarding resources
Volunteer Program
Value to volunteer of $20/hour; potential benefit to recreationists
Potential increased protection of resources
Potential increased protection of resources
Potential increased protection of resources
Enhanced public perception of TVA and increased education regarding resources

Economic Benefits of the Tennessee Valley Authority’s Natural Resource Plan
January 2011 Cardno ENTRIX C-47
Table C-4a Summary of Water Resource Program Benefits Under Current Management Option
Water Resource Improvement Programs
Recreation / Visitor Use Benefit (Access to Sites or Information;
Number and Quality of Recreation Sites)
Water Resource Benefit (including
benefit to Recreation)
Species / Habitat Conservation and
Abundance (Including Benefit to Recreation)
Cultural Resource
Preservation
Management Data and Scientific Knowledge /
Reduced Compliance Costs
Public Perception,
Partnerships, Outreach
Water Resource Improvement Campaign
Targeted Reservoir Initiative Program
Targeted Watershed Initiative Program
Potential recreation benefits from reduction in 234 tons of sediment and 350 lbs phosphorus in streams and 1 HU improvement every 5 years
$10,000 to $30,000 value of 1 HU improvement every 5 years
Potential biological benefits from reduction in 234 tons of sediment and 1,500 lbs phosphorus in streams and 1 HU improvement every 5 years
Enhanced public perception from water quality efforts
Water Resource Grant Program
Quality Growth Program Potential benefit to recreational experience (water clarity, fish catch rate, etc)
Potential positive effect on water quality / quantity
Potential positive effect on aquatic habitat quality
Positive perception of TVA
Reservoir Shoreline Stabilization
Aquatic Ecology Management
Stream and Tailwater Monitoring Program
Improved management knowledge and sharing of data can lead to better management and prioritization of water resource enhancement actions
Increased knowledge of 110 streams
Positive public perception and ease of data sharing with other agencies
Strategic Partnership Planning
Potential compliance cost and permitting benefit of maintaining partnerships and relationships
Positive perception of TVA as collaborative partner

Economic Benefits of the Tennessee Valley Authority’s Natural Resource Plan
C-48 Cardno ENTRIX January 2011
Table C-4a Summary of Water Resource Program Benefits Under Current Management Option
Water Resource Improvement Programs
Recreation / Visitor Use Benefit (Access to Sites or Information;
Number and Quality of Recreation Sites)
Water Resource Benefit (including
benefit to Recreation)
Species / Habitat Conservation and
Abundance (Including Benefit to Recreation)
Cultural Resource
Preservation
Management Data and Scientific Knowledge /
Reduced Compliance Costs
Public Perception,
Partnerships, Outreach
Case Study / Research Initiative
Tennessee Valley Clean Marina Program
Benefit of $280,000 to $2.8 million Potential positive effect on water quality / quantity
Potential positive effect on aquatic habitat quality
Positive perception of TVA
Tennessee Valley Clean and Green Marina Program
Water Efficiency Program Potential change in water use and instream water quantity
Potential instream water quantity benefit
Positive public perception of TVA
Water Resource Outreach Campaign

Economic Benefits of the Tennessee Valley Authority’s Natural Resource Plan
January 2011 Cardno ENTRIX C-49
Table C-4b Summary of Water Resource Program Benefits Under Custodial Management Option
Water Resource Improvement Programs
Recreation / Visitor Use Benefit (Access to Sites or Information;
Number and Quality of Recreation Sites)
Water Resource Benefit (including
benefit to Recreation)
Species / Habitat Conservation and
Abundance (Including Benefit to Recreation)
Cultural Resource
Preservation
Management Data and Scientific Knowledge /
Reduced Compliance Costs
Public Perception,
Partnerships, Outreach
Water Resource Improvement Campaign
Potential recreation benefits from reduction in 720 tons of sediment and 1,100 pounds of phosphorus
Water Resource Benefit Habitat Benefit Enhanced public perception from water quality efforts
Targeted Reservoir Initiative Program
Targeted Watershed Initiative Program
Water Resource Grant Program
Quality Growth Program
Reservoir Shoreline Stabilization
Aquatic Ecology Management
Stream and Tailwater Monitoring Program
Improved management knowledge can lead to better management and prioritization of water resource enhancement actions
Increased knowledge of 50 streams and data sharing
Positive public perception and ease of data sharing with other agencies
Strategic Partnership Planning
Potential compliance cost and permitting benefit of maintaining partnerships and relationships
Positive perception of TVA as collaborative partner
Case Study / Research Initiative
Tennessee Valley Clean Marina Program
Benefit of $280,000 to $2.8 million Potential positive effect on water quality / quantity
Potential positive effect on aquatic habitat quality
Positive perception of TVA

Economic Benefits of the Tennessee Valley Authority’s Natural Resource Plan
C-50 Cardno ENTRIX January 2011
Table C-4b Summary of Water Resource Program Benefits Under Custodial Management Option
Water Resource Improvement Programs
Recreation / Visitor Use Benefit (Access to Sites or Information;
Number and Quality of Recreation Sites)
Water Resource Benefit (including
benefit to Recreation)
Species / Habitat Conservation and
Abundance (Including Benefit to Recreation)
Cultural Resource
Preservation
Management Data and Scientific Knowledge /
Reduced Compliance Costs
Public Perception,
Partnerships, Outreach
Water Efficiency Program Potential recreation benefit of water quality and conservation from stakeholder workshops
Potential change in water use and instream water quantity
Potential instream water quantity benefit
Positive public perception of TVA
Water Resource Outreach Campaign
Potential recreation benefit of water quality and conservation from stakeholder products
Potential benefit to water quality and conservation from stakeholder workshops/products
Potential benefit to aquatic habitat from stakeholder workshops/products
Positive public perception of TVA

Economic Benefits of the Tennessee Valley Authority’s Natural Resource Plan
January 2011 Cardno ENTRIX C-51
Table C-4c Summary of Water Resource Program Benefits Under Enhanced Management Option
Water Resource Improvement Programs
Recreation / Visitor Use Benefit (Access to Sites or Information;
Number and Quality of Recreation Sites)
Water Resource Benefit (including benefit to
Recreation)
Species / Habitat Conservation and
Abundance (Including Benefit to Recreation)
Cultural Resource
Preservation
Management Data and Scientific Knowledge /
Reduced Compliance Costs
Public Perception,
Partnerships, Outreach
Water Resource Improvement Campaign
Potential recreation benefits from reduction in 1,650 lbs phosphorus in streams and 1,080 tons of sediment
Benefits from reduction in 1,080 tons of sediment and 1,650 lbs phosphorus
Potential biological benefits from reduction in 1,080 tons of sediment and 1,650 lbs phosphorus in streams
Enhanced public perception from water quality efforts
Targeted Reservoir Initiative Program
Targeted Watershed Initiative Program
Water Resource Grant Program
Quality Growth Program
Reservoir Shoreline Stabilization
Potential benefit to recreators due to water quality improvement and in situ archaeological site preservation
Reduced sediment load in water; potential avoided property damage to approximately 10 property owners
Enhanced aquatic habitat
Protection of an estimated 8 archaeological sites; with potential value of $4.7 to $14.1. million
Positive public perception of resource stewardship
Aquatic Ecology Management
Potential benefit to fish and wildlife-related recreation
Potential benefit to water quality
Benefit cost ratio of invasive species control has been found to be 2.0 to 5.0 (for every dollar spent, $2 to $5 benefit is received)
Long-term cost savings related to invasive control.
Potential enhanced public perception.
Stream and Tailwater Monitoring Program
Improved management knowledge can lead to better management and prioritization of water resource enhancement actions
Increased knowledge of 70 streams and data sharing

Economic Benefits of the Tennessee Valley Authority’s Natural Resource Plan
C-52 Cardno ENTRIX January 2011
Table C-4c Summary of Water Resource Program Benefits Under Enhanced Management Option
Water Resource Improvement Programs
Recreation / Visitor Use Benefit (Access to Sites or Information;
Number and Quality of Recreation Sites)
Water Resource Benefit (including benefit to
Recreation)
Species / Habitat Conservation and
Abundance (Including Benefit to Recreation)
Cultural Resource
Preservation
Management Data and Scientific Knowledge /
Reduced Compliance Costs
Public Perception,
Partnerships, Outreach
Strategic Partnership Planning
Potential compliance cost and permitting benefit of maintaining and enhancing partnerships and relationships
Positive perception of TVA as collaborative partner
Case Study / Research Initiative
Research projects to increase management knowledge and actions
Research projects to increase management knowledge and actions
Positive perception of TVA as good resource steward
Tennessee Valley Clean Marina Program
Benefit of $284,000 to $2.84 million Potential positive effect on water quality / quantity
Potential positive effect on aquatic habitat quality
Positive perception of TVA
Water Efficiency Program Potential recreation benefit of water quality and conservation from stakeholder workshops
Potential change in water use and instream water quantity
Potential instream water quantity benefit
Positive public perception of TVA
Water Resource Outreach Campaign
Potential recreation benefit of water quality and conservation from stakeholder products
Potential benefit to water quality and conservation from stakeholder workshops/products
Potential benefit to aquatic habitat from stakeholder workshops/products
Positive public perception of TVA

Economic Benefits of the Tennessee Valley Authority’s Natural Resource Plan
January 2011 Cardno ENTRIX C-53
Table C-4d Summary of Water Resource Program Benefits Under Flagship Management Option
Water Resource Improvement Programs
Recreation / Visitor Use Benefit (Access to Sites or Information;
Number and Quality of Recreation Sites)
Water Resource Benefit (including benefit to
Recreation)
Species / Habitat Conservation and
Abundance (Including Benefit to Recreation)
Cultural Resource
Preservation
Management Data and Scientific Knowledge /
Reduced Compliance Costs
Public Perception,
Partnerships, Outreach
Water Resource Improvement Campaign
Potential recreation benefits from reduction in 360 tons of sediment and 550 lbs phosphorus in streams
Phosphorus reduction benefits and additional benefits from reduction in 360 tons of sediment
Potential biological benefits from reduction in sediment phosphorus in streams
Enhanced public perception from water quality efforts
Targeted Reservoir Initiative Program
Potential recreation benefits from reservoir specific improvement plan, reduction in 5,000 lbs phosphorus in reservoirs
Potential water resource benefits from reservoir specific improvement plan, $50,000 to $1.6 million value of reduction in phosphorus in reservoirs and from reservoir specific improvement plan
Potential species habitat benefits from reservoir specific improvement plan, reduction in 5,000 lbs phosphorus in reservoirs and from reservoir specific improvement plan
Potential cultural resource benefits from reservoir specific improvement plan
Potential gain in knowledge from reservoir improvement plan
Enhanced public perception from water quality efforts and reservoir improvement plans
Targeted Watershed Initiative Program
Potential recreation benefits from 1 HU improvement every 3 years
$20,000 to $45,000 value o 1 HU improvement every 3 years
Potential species habitat benefits from improvement in HU
Enhanced public perception from water quality efforts
Water Resource Grant Program
Potential positive effect on recreation from developing and implementing evaluation, management, and implementation processes
Potential positive effect on water quality from developing and implementing evaluation, management, and implementation processes
Potential positive effect on species habitat from developing and implementing evaluation, management, and implementation processes
Potential positive effect on cultural resources from developing and implementing evaluation, management, and implementation processes
Increased management knowledge from developing and implementing evaluation, management, and implementation processes
Enhanced public perception from water quality efforts
Quality Growth Program
Reservoir Shoreline Stabilization
Potential benefit to recreators due to water quality improvement and in situ archaeological site preservation
Reduced sediment load in water; potential avoided property damage of approximately 30 property owners
Enhanced aquatic habitat Protection of an estimated 20 archaeological sites; with potential value of $12.5 to $37.6 million
Positive public perception of resource stewardship
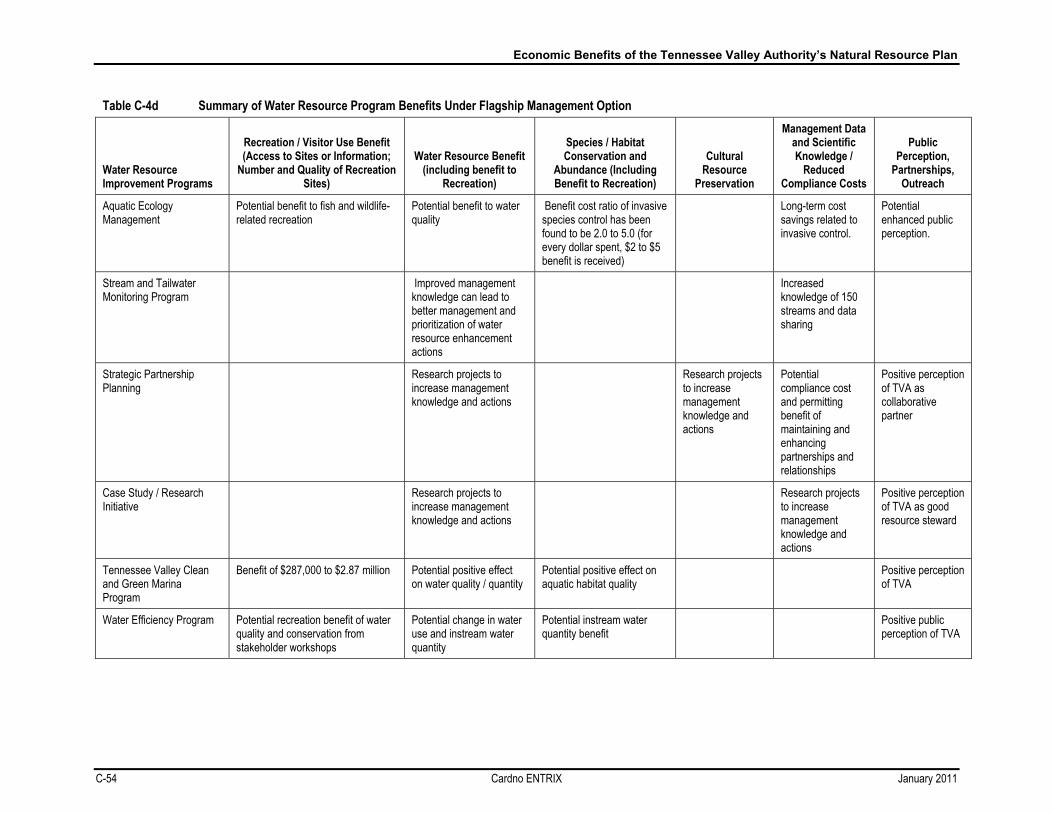
Economic Benefits of the Tennessee Valley Authority’s Natural Resource Plan
C-54 Cardno ENTRIX January 2011
Table C-4d Summary of Water Resource Program Benefits Under Flagship Management Option
Water Resource Improvement Programs
Recreation / Visitor Use Benefit (Access to Sites or Information;
Number and Quality of Recreation Sites)
Water Resource Benefit (including benefit to
Recreation)
Species / Habitat Conservation and
Abundance (Including Benefit to Recreation)
Cultural Resource
Preservation
Management Data and Scientific Knowledge /
Reduced Compliance Costs
Public Perception,
Partnerships, Outreach
Aquatic Ecology Management
Potential benefit to fish and wildlife-related recreation
Potential benefit to water quality
Benefit cost ratio of invasive species control has been found to be 2.0 to 5.0 (for every dollar spent, $2 to $5 benefit is received)
Long-term cost savings related to invasive control.
Potential enhanced public perception.
Stream and Tailwater Monitoring Program
Improved management knowledge can lead to better management and prioritization of water resource enhancement actions
Increased knowledge of 150 streams and data sharing
Strategic Partnership Planning
Research projects to increase management knowledge and actions
Research projects to increase management knowledge and actions
Potential compliance cost and permitting benefit of maintaining and enhancing partnerships and relationships
Positive perception of TVA as collaborative partner
Case Study / Research Initiative
Research projects to increase management knowledge and actions
Research projects to increase management knowledge and actions
Positive perception of TVA as good resource steward
Tennessee Valley Clean and Green Marina Program
Benefit of $287,000 to $2.87 million Potential positive effect on water quality / quantity
Potential positive effect on aquatic habitat quality
Positive perception of TVA
Water Efficiency Program Potential recreation benefit of water quality and conservation from stakeholder workshops
Potential change in water use and instream water quantity
Potential instream water quantity benefit
Positive public perception of TVA

Economic Benefits of the Tennessee Valley Authority’s Natural Resource Plan
January 2011 Cardno ENTRIX C-55
Table C-4d Summary of Water Resource Program Benefits Under Flagship Management Option
Water Resource Improvement Programs
Recreation / Visitor Use Benefit (Access to Sites or Information;
Number and Quality of Recreation Sites)
Water Resource Benefit (including benefit to
Recreation)
Species / Habitat Conservation and
Abundance (Including Benefit to Recreation)
Cultural Resource
Preservation
Management Data and Scientific Knowledge /
Reduced Compliance Costs
Public Perception,
Partnerships, Outreach
Water Resource Outreach Campaign
Potential recreation benefit of water quality and conservation from stakeholder products
Potential benefit to water quality and conservation from stakeholder workshops/products
Potential benefit to aquatic habitat from stakeholder workshops/products
Positive public perception of TVA

Toll-free 800 368 7511 www.cardnoentrix.com www.cardno.com
Australia • Belgium • Canada • Ecuador • Indonesia • Kenya • New Zealand • Papua New GuineaPeru • United Arab Emirates • United Kingdom • United States • Operations in 70 countries
Down to Earth. Down to Business.™