economic benefits and jobs provided by delaware watersheds
TRANSCRIPT

Economic Benefits andJobs Provided by
Delaware WatershedsJanuary 2012
written byMartha Corrozi Narvaez and Gerald Kauffmanwith contributions fromAndrew Homsey, Nicole Minni, Catherine Cruz-Ortíz, Erin McVey, and Chelsea Halley of IPA’s Water Resources Agency
Institute for Public AdministrationSchool of Public Policy & AdministrationCollege of Arts & SciencesUniversity of Delaware
www.ipa.udel.eduserving the public good, shaping tomorrow’s leaders
prepared for

Economic Benefits and Jobs Provided by Delaware Watersheds
January 2012
Prepared for
Delaware Department of Natural Resources and Environmental Control
written by Martha Corrozi Narvaez and Gerald Kauffman
with contributions from
Andrew Homsey, Nicole Minni, Catherine Cruz-Ortíz, Erin McVey, Chelsea Halley
of IPA’s Water Resources Agency
Institute for Public Administration School of Public Policy & Administration
College of Arts & Science University of Delaware
www.ipa.udel.edu
serving the public good, shaping tomorrow’s leaders

Economic Benefits and Jobs Provided by Delaware Watersheds Jan. 2012
i
Preface Located along the Eastern Seaboard, Delaware is tremendously rich in natural resources and habitat. Although the second smallest state, it is rich in water resources―25 miles of ocean coastline, 841 square miles of bay, 2,509 miles of rivers and streams, and 2,934 acres of lakes and ponds. The water, natural resources, and ecosystems contained in Delaware’s watersheds are a valuable economic resource to the state. Researchers at the Institute for Public Administration’s Water Resources Agency (WRA) conclude that Delaware’s water supplies and natural resources constitute a substantial economic engine, which contributes somewhere between $2 billion and $6.7 billion to the regional economy in Delaware. Moreover, Delaware watersheds represent an economic engine responsible for more than 70,000 jobs and providing over $2 billion in wages. WRA project director Gerald Kauffman and associate policy scientist Martha Corrozi Narvaez led a team of IPA researchers―associate policy scientist Andrew Homsey and assistant policy scientist Nicole Minni, who provided GIS mapping support, and research assistants Erin McVey, Catherine Cruz-Ortiz, and Chelsea Halley, who collected ecosystem services and jobs data―in preparation of the writing of this important document. This report demonstrates that the natural resources of Delaware’s watersheds provide real and significant economic benefits to the state and are worthy of investment to keep them healthy and productive. Jerome R. Lewis, Ph.D. Director, Institute for Public Administration

Economic Benefits and Jobs Provided by Delaware Watersheds Jan. 2012
ii
Table of Contents List of Figures ............................................................................................................................... iii
List of Tables ................................................................................................................................ iii
Executive Summary .......................................................................................................................1
1. Introduction ..............................................................................................................................7
2. Methods ...................................................................................................................................16
3. Economic Value ......................................................................................................................18
Market Value ...........................................................................................................................21 Non-Market Value ...................................................................................................................36
4. Ecosystem Services .................................................................................................................43
5. Jobs and Wages ......................................................................................................................52
Appendix – Employment Codes by Industry, 2009 ..................................................................63
References .....................................................................................................................................67
Economic Benefits and Jobs Provided by Delaware Watersheds Jan. 2012
iii
List of Figures
Figure Page Figure 1. Major Basins and Watershed Boundaries in Delaware ...............................................12 Figure 2. Land Use/Land Cover in Delaware’s Watersheds ......................................................13 Figure 3. Economic Value of Water Resources .........................................................................18 Figure 4. Annual Economic Value of Delaware Watersheds .....................................................19 Figure 5. Blue Crab Harvests in Delaware Waters ....................................................................29 Figure 6. Striped Bass Harvests in Delaware Waters .................................................................29 Figure 7. Eastern Oyster Harvests in Delaware Waters .............................................................30 Figure 8. Annual Household Willingness to Pay for Improved Water Quality .........................40 Figure 9. Household Willingness to Pay for Improved Water Quality in Delaware ..................40 Figure 10. Ecosystem Service Areas in Delaware Watersheds ....................................................48 Figure 11. Value of Natural Goods and Services by Ecosystem Within Delaware Watersheds ..................................................................................................................48 Figure 12. Value of Natural Goods and Services by Watershed Within Delaware .....................49 Figure 13. Ecosystem Service Value (2010 dollars) Within Delaware Watersheds ....................49 Figure 14. Value of Natural Goods and Services by Watershed Within Delaware .....................50 Figure 15. Value of Natural Goods and Services by Watershed Within Delaware .....................50
List of Tables Table Page Table E1. Annual Economic Value of the Delaware Watersheds .................................................4 Table E2. Ecosystem Goods and Services Value of Delaware Watersheds ..................................5 Table E3. Jobs and Wages Related to Delaware Watersheds .......................................................6 Table 1. Land Use in Delaware Watersheds .............................................................................11 Table 2. Land Area, Population, and Employment in Delaware ..............................................14 Table 3. Population Change in Delaware by County, 2000–2010 ............................................14 Table 4. Population Projections in Delaware, 2010–2030 ........................................................14 Table 5. 2010 Population Density in Delaware by Watershed .................................................15 Table 6. Annual Economic Value in Delaware Watersheds .....................................................20 Table 7. Increased Property Values Resulting from Improved Water Quality .........................21 Table 8. Added Property Value Due to Improved Water Quality in Delaware’s Watersheds .21 Table 9. Drinking Water–Treatment Costs Based on Percent of Forested Watershed .............22 Table 10. Surface Water–Discharge Sewage-Treatment Plants in Delaware .............................23 Table 11. Value of NPDES Surface Water–Discharge Sewage-Treatment Plants in Delaware 24 Table 12. Largest Public Water Withdrawals in Delaware .........................................................25 Table 13. Economic Value of Delaware’s Public Water Supply ................................................26 Table 14. Freshwater-Use Values in the United States ...............................................................27 Table 15. Value of Agriculture Irrigation in Delaware Using Ag Census Data .........................27 Table 16. Value of Agriculture Irrigation in Delaware Using USGS Data ................................27 Table 17. Thermoelectric Power Plant Water Withdrawals in Delaware ...................................28 Table 18. Value of Commercial Fish Harvests in Delaware .......................................................31

Economic Benefits and Jobs Provided by Delaware Watersheds Jan. 2012
iv
Table 19. Value of Fishing, Hunting, and Wildlife Recreation in Delaware ..............................32 Table 20. Value of Cropland and Agriculture in Delaware ........................................................33 Table 21. Tax Revenues from the Port of Wilmington, 2005 .....................................................34 Table 22. Port of Wilmington Total TEUs as a Share of East Coast and U.S. Markets, 1985-2005 ...................................................................................................................35 Table 23. Port of Wilmington Total Tonnage as a Share of East Coast and U.S. Markets, 1985-2005 ...................................................................................................................35 Table 24. Total Annual Value of Recreational Benefits in Delaware Watersheds .....................36 Table 25. Typical Benefits from Improved Freshwater Quality .................................................37 Table 26. Adjusted Annual Household Values for National Water Quality Benefits ................37 Table 27. Annual Benefits from Watershed Management and Improved Water Quality in
Delaware .....................................................................................................................38 Table 28. Annual Willingness to Pay for Water Quality Benefits in New England States ........39 Table 29. Comparison of Annual Willingness to Pay for Water Quality Benefits .....................39 Table 30. Economic and Environmental Benefits of Forests in Delaware .................................41 Table 31. Economic and Environmental Benefits of Forests in Delaware Watersheds .............41 Table 32. Value of Public Parks in Delaware Watersheds .........................................................42 Table 33. Ecosystem Services Values for Cecil County .............................................................44 Table 34. Forest Ecosystem Service Values for U.S. Temperate Forests ...................................45 Table 35. Comparison of Ecosystem Goods and Services Values from Various Studies ..........45 Table 36. Value of Ecosystem Goods and Services in Delaware Watersheds ...........................47 Table 37. Low-Range of Ecosystem Services in Delaware watersheds .....................................51 Table 38. High Range of Ecosystem Services in Delaware Watersheds ....................................51 Table 39. Jobs and Wages Directly and Indirectly Related to Delaware Watersheds ................52 Table 40. Delaware Watershed Jobs and Wages, 2009 ..............................................................53 Table 41. Direct and Indirect Watershed-Related Jobs in Delaware, 2009 ................................54 Table 42. Coastal Employment, Wages, and GDP in Delaware .................................................55 Table 43. Agriculture Jobs and Wages in Delaware ...................................................................55 Table 44. Jobs from Fishing, Hunting, and Wildlife Recreation in Delaware Watersheds ........56 Table 45. Fishery jobs, wages, and business output supported by coastal wetlands in Delaware .....................................................................................................................56 Table 46. Watershed Organization Jobs in Delaware Watersheds .............................................58 Table 47. Jobs Generated by the Port of Wilmington .................................................................59 Table 48. Direct Jobs by Category and Sector at the Port of Wilmington ..................................59 Table 49. Tourism Jobs in Delaware ..........................................................................................60 Table 50. Largest Public Water Withdrawals in Delaware Watersheds .....................................61 Table 51. Jobs at NPDES Wastewater Utilities in Delaware Watersheds ..................................62

Economic Benefits and Jobs Provided by Delaware Watersheds Jan. 2012
1
Executive Summary Abstract The water, natural resources, and ecosystems contained in Delaware’s watersheds are an economic engine for the state. These resources provide tremendous economic value to the state and the surrounding region. This report examines that value in three distinct ways: • Economic value directly related to Delaware’s
water resources and habitats—Using economic activity as a measure of value, Delaware watersheds contribute over $6 billion in annual economic activity from water quality, flood control, water supply, fishing and wildlife viewing, recreation, agriculture, ports, forests, and parks.
• Value of the goods and services provided by
Delaware’s ecosystems—Using ecosystem goods and services as a measure of value, the ecosystems of Delaware provide $6.7 billion annually in goods and services in 2010 dollars, with a net present value of $216.6 billion calculated over a 100-year period.
• Employment related to Delaware’s water resources and habitats—Using employment as a
measure of value, Delaware’s water resources and habitat directly and indirectly support over 70,000 jobs with over $2 billion in wages annually. This does not include the thousands or, perhaps, millions of jobs in companies and industries that rely on Delaware’s waters for their industrial and commercial processes.
The purpose of these estimates is to demonstrate that Delaware watersheds provide real and significant economic benefits to the state and are worthy of investment to keep them healthy and productive. All were made by taking values from existing literature and studies and applying them to Delaware using ecological economics and benefits-transfer techniques described in this report. All values in are in 2010 dollars except where noted. It is important to note that the values in the three categories above cannot be summed because there is some measure of overlap between certain values within each category that could result in double counting. For example, the jobs of fishermen that contribute to employment and wages are also a factor in the economic activity generated from fishing, and the ecosystem values of forests for water-quality benefits should be at least partially captured in the economic value of water supply. Accurately determining (and eliminating) this overlap is difficult, if not impossible, within the scope of this analysis. However, each of the above estimates clearly
Delaware Watershed Basins

Economic Benefits and Jobs Provided by Delaware Watersheds Jan. 2012
2
indicates Delaware watersheds are an economic engine that contributes between $2 billion and $6.7 billion annually to the state’s economy. It is also important to note that the estimates presented in this report are not all-inclusive, due to a lack of data for some economic sectors, nor are they meant to be used to compare and contrast uses of Delaware’s water resources for their value. Some values were not included in these estimates because the data to assess them either are not readily available or do not exist. For example, the full amount of economic activity and jobs associated with the many companies and industries that rely on Delaware’s waters for their industrial processes is not included here, because identifying those companies and gathering information on their economic activity is beyond the scope of this analysis. Since all estimates were made by taking values from existing literature and studies, the values for various activities and resources vary greatly in how they were determined and applied to Delaware, making it difficult to accurately compare values across uses and activities. Gathering more complex, tailored, or primary data on Delaware watersheds would improve the comparability of information across uses as well as make value estimates more comprehensive. Further research is recommended to gather updated Delaware-specific valuation data. The field of ecosystem services valuation in particular is still a new and growing field. As knowledge and understanding of these valuation techniques grows and is applied to more resources, we will continue to incorporate them in our understanding of the value of Delaware’s watersheds. However, it is also important to note that we may never be able to fully describe in economic terms the real value of the Delaware watersheds and all of their benefits to the people of this state and region. Delaware Watersheds
The entire state of Delaware is drained by four basins; the Piedmont, Delaware Estuary, and Inland Bays basins flow east, and the Chesapeake Bay basin flows west. Within these four major basins there are 46 watersheds that flow from Piedmont and Coastal physiographic provinces to the tidal river and bay.
Piedmont Basin – Empties into the Delaware River, is part of the Delaware Estuary, and comprises 605 square miles, 80 percent of which lies in Pennsylvania.
Delaware Bay and Estuary Basin – Located in eastern New Castle, Kent, and Sussex counties and drains runoff from 520,960 acres, or 814 square miles, to the Delaware Bay.
Inland Bays/Atlantic Ocean Basin - Comprises 313 square miles of eastern Sussex County, Delaware.
Chesapeake Basin – Drains to the nation’s largest estuary, the Chesapeake Bay, and encompasses a 769-square-mile area of land in western New Castle, Kent, and Sussex Counties.

Economic Benefits and Jobs Provided by Delaware Watersheds Jan. 2012
3
In Delaware in 2007, 39 percent of the land is agriculture, 18 percent is forest, 17 percent is saltwater/freshwater wetland, 15 percent is urban, 8 percent is marine, and 3 percent is open freshwater. Between 2000 and 2010, Delaware population grew by 14.6 percent. According to the U.S. Census Bureau, in 2010, 897,934 people live in Delaware with a population density of 1,000 per square mile. Sixty percent of the population resides in New Castle County, 18 percent reside in Kent County, and 22 percent reside in Sussex County. Just less than 400,000 people were employed in Delaware; 68 percent of those jobs were in New Castle County, 15 percent in Kent County, and 17 percent in Sussex County. Annual Economic Value The economic value of Delaware watersheds is over $6 billion in annual market and non-market value. Market value is determined by the sale/purchase of watershed goods, such as drinking water, fish, hunting supplies or powerboats. Non-market value is provided by ecosystems, such as pollution removal by forests, public willingness to pay for improved water quality, forest carbon-storage benefits, and health benefits of parks. Note that the totals for both market and non-market values are rounded down to ensure that values are not overstated (Table E1).

Economic Benefits and Jobs Provided by Delaware Watersheds Jan. 2012
4
Table E1. Annual Economic Value of Delaware Watersheds $million Market Value >$5 billion
Water Quality Increased Property Value (+6% over 20 years) 39 Water Treatment by Forests ($41/mgd) 2 Wastewater Treatment 245 Flood Control Benefits Stormwater Detention (+2-5%) 42-105 Water Supply Drinking Water Supply ($4.78/1,000 gallons) 518 Irrigation Water Supply ($300/acre-foot) 22-24 Thermoelectric Power Water Supply ($44/acre-foot) 41 Industrial Water Supply ($200/acre-foot) 9 Fish/Wildlife Wetlands 6 National Wildlife Refuges 20 Commercial Fish Landings ($0.60/lb) 9 Fishing (11-18 trips/angler, $17-$53/trip) 109 Hunting (16 trips/hunter, $16-50/trip) 46 Wildlife/Bird-watching (8-13 trips/yr, $15-$27/trip) 147 Recreation Tourism 1,900 Power-Boating 344 Agriculture Crop, poultry, livestock value ($1,800/acre) 1,200 Ports Navigation ($15/acre-foot) 66 Port Activity 3,200 Non-Market Value >$1 billion Recreation Swimming ($13.40/trip) 1 Boating ($30/trip) 6 Fishing ($62.79/trip) 56 Wildlife/Bird watching ($77.73/trip) 67 Water Quality Improved Stream Water Quality/Willingness to Pay 153 Forests Carbon Storage ($827/acre) 220 Carbon Sequestration ($29/acre) 8 Air-Pollution Removal ($266/acre) 71 Building Energy Savings ($56/acre) 15 Avoided Carbon Emissions ($3/acre) 796 Public Parks Health Benefits ($9,734/acre) 265 Community Cohesion ($2,383/acre) 65 Stormwater Benefit ($921/acre) 25 Air-Pollution Control ($88/acre) 2
Economic Benefits and Jobs Provided by Delaware Watersheds Jan. 2012
5
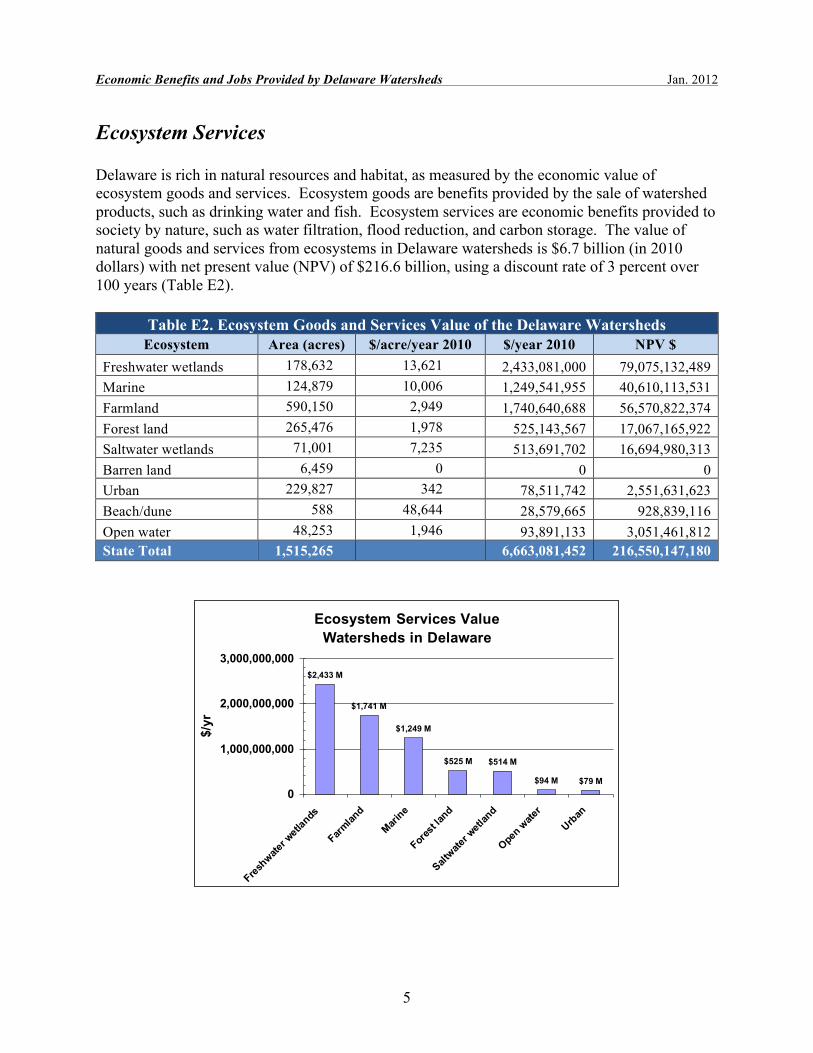
Ecosystem Services Delaware is rich in natural resources and habitat, as measured by the economic value of ecosystem goods and services. Ecosystem goods are benefits provided by the sale of watershed products, such as drinking water and fish. Ecosystem services are economic benefits provided to society by nature, such as water filtration, flood reduction, and carbon storage. The value of natural goods and services from ecosystems in Delaware watersheds is $6.7 billion (in 2010 dollars) with net present value (NPV) of $216.6 billion, using a discount rate of 3 percent over 100 years (Table E2).
Table E2. Ecosystem Goods and Services Value of the Delaware Watersheds Ecosystem Area (acres) $/acre/year 2010 $/year 2010 NPV $
Freshwater wetlands 178,632 13,621 2,433,081,000 79,075,132,489 Marine 124,879 10,006 1,249,541,955 40,610,113,531 Farmland 590,150 2,949 1,740,640,688 56,570,822,374 Forest land 265,476 1,978 525,143,567 17,067,165,922 Saltwater wetlands 71,001 7,235 513,691,702 16,694,980,313 Barren land 6,459 0 0 0 Urban 229,827 342 78,511,742 2,551,631,623 Beach/dune 588 48,644 28,579,665 928,839,116 Open water 48,253 1,946 93,891,133 3,051,461,812 State Total 1,515,265 6,663,081,452 216,550,147,180
Ecosystem Services Value Watersheds in Delaware
$79 M$94 M
$514 M$525 M
$1,249 M
$1,741 M
$2,433 M
0
1,000,000,000
2,000,000,000
3,000,000,000
Freshwate
r wetl
ands
Farmlan
d
Marine
Fores
t land
Saltwate
r wetl
and
Open w
ater
Urban
$/yr

Economic Benefits and Jobs Provided by Delaware Watersheds Jan. 2012
6
Value of Natural Goods and Services (2010 $M)Watersheds in Delaware
$2,424
$2,049 $1,993
$197
0
500
1,000
1,500
2,000
2,500
3,000
DelawareEstuary
Chesapeake Inland Bays Piedmont
$/yr
(mill
ions
)
Jobs and Wages Delaware watersheds are jobs engines with water resources and habitat that supports over 70,000 direct and indirect jobs with over $2 billion in annual wages in the coastal, farm, ecotourism, watershed-organization, water supply/wastewater, recreation, and port industries (Table 39).
Table E3. Jobs and Wages Related to Delaware Watersheds Sector Jobs Wages ($) Data Source
Direct Watershed-related 18,926 402,000,000 U.S. Bureau of Labor Statistics (2009) Indirect Watershed-related 22,711 322,000,000 U.S. Census Bureau (2009) Coastal 15,174 268,000,000 Nat’l Coastal Econ. Program (2009) Farm 28,328 1,410,000,000 Awokuse et al. (2010) Fishing/Hunting/Birding 9,248 304,000,000 U.S. Fish and Wildlife Service (2008) National Wildlife Refuge 198 5,500,000 Carver and Caudill (2007) Wetlands 584 19,300,000 NOAA Coastal Services Center (2011) Watershed Organizations 115 5,520,000 WRA and DRBC (2010) Ports 4,601 307,000,000 Martins Associates (2007)) Tourism 31,050 931,000,000 Delaware Tourism Office (2008) Water Supply Utilities 275 15,000,000 WRA and DRBC (2010) Wastewater Utilities 207 9,000,000 WRA and DRBC (2010) Delaware Watershed totals >70,000 >$2 billion

Economic Benefits and Jobs Provided by Delaware Watersheds Jan. 2012
7
1. Introduction Objectives This report summarizes the socioeconomic value of water, natural resources, and ecosystems in Delaware’s watersheds estimated as: 1. Economic activity including market and non-market value of agriculture, water supply,
fishing, hunting, recreation, boating, ecotourism, and navigation/port benefits. 2. Ecosystem goods and services (natural capital) value provided by habitat such as wetlands,
forests, farms, and open water. 3. Jobs and wages directly and indirectly associated with Delaware’s watersheds. These estimates demonstrate that the natural resources of Delaware’s watersheds provide real and significant economic benefits to the state and are worthy of investment to keep them healthy and productive. Value-transfer techniques were applied by selecting data from existing studies and applying them to Delaware using ecological-economics techniques. Values in the three categories cannot be summed because there may be overlap within each category that could result in double-counting. For example, the jobs of fishermen that contribute to employment and wages are also a factor in the economic activity generated from fishing. The ecosystem values of forests for water-quality benefits should be at least partially captured in the economic value of water supply. Accounting for this overlap is difficult, if not impossible, within the scope of this analysis. However, each of the above estimates clearly indicates that Delaware’s watersheds are an economic engine that contributes between $2 billion and $6.7 billion to our state’s economy. The estimates presented in this report are not comprehensive, nor are they meant to be used to compare/contrast uses of the state’s water resources for their value. Some values were not included in these estimates because the data to assess them are not readily available. For example, the full amount of economic activity and jobs associated with the many companies and industries that rely on Delaware’s waters for their industrial processes is not included here, because identifying those companies and gathering information on their economic activity is complicated and beyond the scope of this analysis. Since all estimates were made by taking values from existing literature, the values for various activities differ greatly in how they were determined and applied to Delaware’s water resources making it difficult to accurately compare values across uses. Other values, like the value of freshwater mussels for filtering water, are not included in this work because they are not yet well documented in the literature on valuation. The field of ecosystem services valuation in particular is still a new and growing field. As our knowledge and understanding of these valuation techniques grows and is applied to more resources, we must continue to incorporate them in our understanding of the value of Delaware’s water resources.

Economic Benefits and Jobs Provided by Delaware Watersheds Jan. 2012
8
An Economic Engine Delaware is located on the Atlantic Coast in the Mid-Atlantic region and surrounded by several major bodies of water—Delaware River, Delaware Bay, Chesapeake Bay, and the Atlantic Ocean. Water is an abundant resource in the First State and makes Delaware a truly unique place. Whether it’s the pristine beaches, the natural beauty and biology of the streams and creeks, the invigorating recreational opportunities, or the essential services that the First State’s water resources provide, it is a driving force and an essential component of Delaware’s economy. In 2010 more than 300 million gallons per day of drinking water and industrial-process water were withdrawn from the rivers, streams, and aquifers in Delaware’s watersheds to sustain the state’s jobs and domestic, commercial, and industrial economy. The river, bay, beaches, wetlands, and forests support a multi-billion dollar coastal tourism, recreation, and hunting/fishing/birding economy. Society tends to underprice water, based on its marginal value for single uses (i.e., drinking water), and not consider its full value of water for all uses, such as recreation and tourism. The following report tabulates the substantial economic value and worth of watersheds in Delaware—the 2nd smallest state by area and the 6th most densely populated state in the nation. The report attempts to quantify the highest multi-objective value of water in toto for its wide range of habitat, recreation, ecological, and industrial benefits throughout the state of Delaware. The Watersheds
The state of Delaware occupies four major basins—Piedmont, Delaware Bay and Estuary, Inland Bays, and Chesapeake Bay (Figure 1).
Delaware is situated on the Delmarva Peninsula and includes (DNREC, 2010): • 25 miles of ocean coastline • 841 square miles of bay • 2,509 miles of rivers and streams • 2,934 acres of lakes and ponds In addition: • 86 percent of Delaware rivers/streams impaired for swimming due to high bacteria • 97 percent of Delaware rivers/streams do not meet fish and wildlife water quality standards • 44 percent of Delaware ponds and lakes do not meet swimming uses • 89 percent of ponds and lakes do not support fish and wildlife uses • >100 miles of waters have fish-consumption advisories from high PCBs, metals, pesticides
Within Delaware’s four major basins there are 46 watersheds that flow from Piedmont and Coastal Plain physiographic provinces to the tidal river and bay.

Economic Benefits and Jobs Provided by Delaware Watersheds Jan. 2012
9
Piedmont
The entire Piedmont Basin, 80 percent of which is in Pennsylvania, empties into the Delaware River and is part of the Delaware Estuary. The Piedmont Basin contains the following watersheds:
• Brandywine Creek • Red Clay Creek • White Clay Creek • Christina River • Naamans Creek • Shellpot Creek
The Piedmont Basin supplies a significant source of freshwater from surface water and groundwater sources. The geologically unique Fall Line located in the Piedmont Basin runs along a line between Newark and Wilmington and separates the hilly, rocky, Piedmont from the flat, sandy Coastal Plain provinces. This transition zone supports a wide array of flora and fauna.
Delaware Bay and Estuary
The Delaware Bay and Estuary Basin is located in eastern New Castle, Kent, and Sussex counties and drains runoff from the Delaware Bay and Delaware Estuary. The basin drains 520,960 acres, or 814 square miles, and encompasses the following watersheds:
• Delaware River • Army Creek • Red Lion Creek • Dragon Run Creek • Chesapeake & Delaware Canal East • Appoquinimink River • Blackbird Creek • Delaware Bay • Smyrna River • Leipsic River • Little Creek • St. Jones River • Murderkill River • Mispillion River • Cedar Creek • Broadkill River
The Delaware Bay and Estuary Basin lies entirely within the Atlantic Coastal Plain physiographic province. Topography in the northern part of the basin is dominantly undulating and rolling with moderate dissection. In the southern portion of the drainage basin, flatter (slope

Economic Benefits and Jobs Provided by Delaware Watersheds Jan. 2012
10
gradients <1%) landscapes dominate. Some of the most productive farms in Delaware, some of which are still owned by the original families, are located within this basin.
Inland Bays/Atlantic Ocean
The Inland Bays/Atlantic Ocean Basin comprises 313 square miles of eastern Sussex County, Delaware. The Inland Bays/Atlantic Ocean Basin lies entirely within the Atlantic Coastal Plain physiographic province. The dominant physiographic features of the basin are the three “inland bays” that are located just landward of the Atlantic Ocean shoreline. From north to south, these are Rehoboth Bay, Indian River Bay, and Little Assawoman Bay. Rehoboth Bay includes the following watersheds:
• Lewes-Rehoboth Canal • Rehoboth Bay Watershed
The Indian River Bay includes the following watersheds:
• Indian River • Iron Branch • Indian River Bay
The Little Assawoman Bay includes the following watersheds:
• Little Assawoman • Assawoman • Buntings Branch
Other distinctive physiographic characteristics include the flat topography and man-made drainage ditches that are used to drain soils with perennially high water tables, which are mostly limited to the area south of Millsboro and Indian River Bay.
The Inland Bays Watershed supports Delaware’s ocean and coastal tourism economy and contains rapidly growing industries of poultry farming and second-home residential development. More than 11 miles of Delaware’s ocean coast are developed with homes and businesses. The majority of them are located on the barrier island—the thin strip of land separating the ocean from the Inland Bays. Sea-level rise, storms, and other natural coastal-transport processes are causing the barrier island system to migrate in a landward direction.
Chesapeake Bay
The Chesapeake Bay Basin drains to the nation’s largest estuary, the Chesapeake Bay. As an estuary, the Chesapeake Bay contains a mixture of fresh and saltwater, creating an ideal habitat for a diverse array of plants and animals. The bay’s welfare is heavily reliant on the land use of the basin, since Delaware’s portion of the Chesapeake Basin contains headwater areas, the area where a waterway originates. The basin encompasses a 769-square-mile area of land in western

Economic Benefits and Jobs Provided by Delaware Watersheds Jan. 2012
11
New Castle, Kent, and Sussex Counties. More geological formations exist in the Chesapeake Basin than in any of the other three basins. Delaware’s Coastal Plain contains very thick sedimentary deposits. These unique deposits were able to form because of Delaware’s position along what used to be an extremely active continental plate boundary. The basin encompasses the following 16 watersheds:
• Bohemia Creek • Gravelly Branch • Pocomoke River • Broad Creek • Gum Branch • Sassafras River • C&D Canal West • Marshyhope Creek • Wicomico River • Deep Creek • Nanticoke River • Elk Creek • Perch Creek
In Delaware in 2007, 39 percent of the land is agriculture, 18 percent is forest, 17 percent is saltwater/freshwater wetland, 15 percent is urban, 8 percent is marine, and 3 percent is open freshwater (Table 1 and Figure 2). The entire state of Delaware is drained by four basins; the Piedmont, Delaware Estuary, and Inland Bays basins flow east, and the Chesapeake Bay Basin flows west (Figure 1).
Table 1. Land Use in Delaware Watersheds
Ecosystem Piedmont (acre)
Delaware Estuary (acres)
Chesapeake Bay
(acres)
Inland Bays/ Atlantic Ocean
(acres)
Total (acres)
Freshwater wetlands 4,732 58,390 81,130 34,379 178,632 Marine 799 16,274 233 107,573 124,879 Farmland 9,588 254,143 245,509 80,910 590,150 Forest 32,189 95,346 102,306 35,635 265,476 Saltwater wetland 919 61,617 353 8,111 71,001 Barren land 234 2,305 844 3,076 6,459 Urban 67,357 123,048 17,019 22,403 229,827 Beach/Dune 42 256 74 216 588 Open freshwater 575 14,056 1,780 31,842 48,253 Total 116,435 625,435 449,248 324,145 1,515,263
Ecosystem Piedmont Delaware Estuary
Chesapeake Bay
Inland Bays/ Atlantic Ocean Total
Freshwater wetlands 4.1% 9.3% 18.1% 10. 6% 11.8% Marine 0.7% 2.6% 0.1% 33.2% 8.2% Farmland 8.2% 40.6% 54.6% 25.0% 38.9% Forest 27.6% 15.2% 22.8% 11.0% 17.5% Saltwater wetland 0.8% 9.9% 0.1% 2.5% 4.7% Barren land 0.2% 0.4% 0.2% 0.9% 0.4% Urban 57.8% 19.7% 3.8% 6.9% 15.2% Beach/Dune 0.0% 0.0% 0.0% 0.1% 0.0% Open freshwater 0.5% 2.2% 0.4% 9.8% 3.2% Total 100.0% 100.0% 100.0% 100.0% 100.0%
Source: NOAA CSC, 2007

Economic Benefits and Jobs Provided by Delaware Watersheds Jan. 2012
12
Figure 1. Major Basins and Watershed Boundaries in Delaware

Economic Benefits and Jobs Provided by Delaware Watersheds Jan. 2012
13
Figure 2. Land Use/Land Cover in Delaware’s Watersheds (NOAA CSC, 2007)

Economic Benefits and Jobs Provided by Delaware Watersheds Jan. 2012
14
Demographics According to the U.S. Census Bureau, in 2010, 897,934 people live in Delaware on 1,956 square miles—a population density of just over 450/sq. mi. (Table 2). New Castle County is the most populous county, comprising 60 percent of the population (538,479); 162,310 people reside in Kent County (18%), and 197,145 reside in Sussex County (22%). Just less than 400,000 people were employed in Delaware, with 267,683 jobs in New Castle County (68%), 60,964 jobs in Kent County (15%), and 67,447 (17%) jobs in Sussex County (Table 2). Table 2. Land Area, Population, and Employment in Delaware
State/County Area (sq. mi.)
Population1 2010
Employment2 2010
New Castle 426 538,479 267,683 Kent 590 162,310 60,964 Sussex 940 197,145 67,447 Delaware 1,956 897,934 396,094
1. U.S. Census Bureau, 2010 2. U.S. Bureau of Labor Statistics, 2011
Between 2000 and 2010, Delaware population grew by 14.6 percent or 114,334 people (Table 3 and 5). Over the last decade, population increased by over 25 percent in Kent and Sussex counties and by 7.6 percent in New Castle County. By 2030, the population in Delaware is projected to grow by 156,697 (18%) to over a million people (Table 4).
Table 3. Population Change in Delaware by County, 2000-2010 State/county Pop. 2000 Pop. 2010 Change % Change
New Castle 500,265 538,479 38,214 7.6 Kent 126,697 162,310 35,613 28.1 Sussex 156,638 197,145 40,507 25.9 Delaware 783,600 897,934 114,334 14.6
Source: U.S. Census Bureau, 2010
Table 4. Population Projections in Delaware, 2010-2030
County Actual
Population 20101
Projected Population
20202
Projected Population
20302
2010-2030 Change
2010-2030 % Change
New Castle 538,479 567,764 589,267 50,788 9 Kent 162,310 178,817 192,853 30,543 19 Sussex 197,145 235,341 272,511 75,366 38 Total 897,934 981,922 1,054,631 156,697 18
1. U.S. Census Bureau, 2010 2. Delaware Population Consortium, 2010

Economic Benefits and Jobs Provided by Delaware Watersheds Jan. 2012
15
Table 5. 2010 Population Density in Delaware by Watershed Watershed Area (sq. mi.) Population Population Density (people/sq. mi.)
Piedmont Brandywine Creek 23 44,098 1,920 Christina River 67 175,572 2,615 Naamans Creek 10 35,783 3,512 Red Clay Creek 21 24,523 1,163 Shellpot Creek 14 37,992 2,646 White Clay Creek 46 95,579 2,070 Delaware Bay and Estuary Appoquinimink River 46 24,113 520 Army Creek 10 21,305 2,124 Blackbird Creek 31 5,465 177 Broadkill River 107 23,216 217 C & D Canal East 44 12,148 276 Cedar Creek 52 7,334 140 Delaware Bay 10 393 41 Delaware River 6 16,879 2,597 Dragon Run Creek 10 6,429 620 Leipsic River 105 16,201 155 Little Creek 23 8,269 356 Mispillion River 76 18,155 238 Murderkill River 107 25,364 238 Red Lion Creek 11 11,716 1,070 Smyrna River 64 20,577 322 St. Jones River 90 68,323 759 Chesapeake Bay Bohemia Creek 9 3,755 428 Broad Creek 120 17,700 148 C & D Canal West 17 10,666 614 Chester River 40 5,150 130 Choptank River 97 10,289 106 Deep Creek 63 10,333 163 Elk Creek 0 314 730 Gravelly Branch 38 3,668 96 Gum Branch 30 2,768 92 Marshyhope Creek 96 7,576 79 Nanticoke River 144 30,000 208 Perch Creek 2 2,368 1,172 Pocomoke River 35 2,068 60 Sassafras River 8 1,979 246 Wicomico 2 352 173 Inland Bays Assawoman 7 2,344 316 Buntings Branch 10 1,802 183 Indian River 86 17,237 200 Indian River Bay 86 21,498 249 Iron Branch 15 4,617 299 Lewes-Rehoboth Canal 17 7,782 465 Little Assawoman 33 8,838 267 Rehoboth Bay 72 22,113 308 Total 2,004 894,651 446

Economic Benefits and Jobs Provided by Delaware Watersheds Jan. 2012
16
2. Methods
Valuation Techniques
The University of Delaware derived the economic value of Delaware’s watersheds from published studies that employed the following valuation techniques: Avoided Cost: Society sustains costs if certain ecosystems were not present or are lost. For instance, the loss of wetlands may increase economic cost from flood damage. Replacement Cost: Natural services are lost and replaced by more expensive human systems. For instance, forests provide water-filtration benefits that would be replaced by costly water-filtration plants. Net Factor Income by Enhancement of Income: Improved water quality is known to enhance fishing productivity and boost fishing jobs/wages. Travel Cost: Visitors are willing to pay to travel and purchase food and lodging to visit ecosystems and natural resources for tourism, boating, hunting, fishing, and birding. Hedonic Pricing: Residents may be willing to pay more for higher property values along scenic bay and river coastlines with improved water quality. Contingent Valuation: Valuation by survey of individual preferences to preserve ecosystems. People may be willing to pay more in fees or water rates to preserve river and bay water quality. Scope of Work The University of Delaware established the socioeconomic value of Delaware’s watersheds according to the following scope of work. 1. Area of Interest: The area of interest is defined as the watersheds of Delaware and the water resources in Delaware. The University of Deaware developed ArcGIS map layers of watersheds, population, ecosystems, habitat, and land use/land cover to perform the analysis. 2. Literature Review: Gather published literature and socioeconomic data relevant to the watersheds of Delaware including databases from the U.S. Census Bureau, U.S. Bureau of Labor Statistics, U.S. Department of Agriculture, U.S. Forest Service, and U.S. Fish and Wildlife Service. 3. Annual Economic Value: Estimate the direct (market) and indirect (non-market) economic value of agriculture, water quality, water supply, fishing, hunting, recreation, boating, ecotourism, and navigation in Delaware by utilizing population, employment, industrial activity, and land-use data. Total economic activity is the sum of direct and indirect uses, option demand,

Economic Benefits and Jobs Provided by Delaware Watersheds Jan. 2012
17
and non-use values (Ingraham and Foster 2008). Direct-use (market) values are derived from the sale or purchase of natural goods such as drinking water, boating, recreation, and commercial fishing. Indirect (non-market) values are benefits from ecosystems such as water filtration by forests and flood control/habitat protection from wetlands. Option demand is public willingness to pay for benefits from water quality or scenic value of the water resources. Non-use (existence) values are treasured by a public who may never visit the resource but are willing to pay to preserve the existence of the resource. 4. Ecosystem Services: Tabulate the market value of natural resources (ecosystem services value) in Delaware’s watersheds for habitat such as wetlands, forests, farmland, and open water. Ecosystem services (ecological services) are economic benefits provided to society by nature such as water filtration, flood reduction, and drinking water supply. Using ArcGIS, map and tabulate ecosystem areas (acres) using 2007 NOAA Coastal Services Center (CSC) land cover data in the following classifications: (a) freshwater wetlands, (b) marine, (c) farmland, (d), forest, (e) barren, (f) saltwater wetland, (g) urban, (h) beach/dune, and (i) open freshwater. Review published research studies and gather economic value ($/acre) data for these ecosystem goods and services: (a) carbon sequestration, (b) flood control, (c) drinking water supply, (d) water-quality filtration, (e) waste treatment and assimilation, (f) nutrient regulation, (g) fish and wildlife habitat, (h) recreation and aesthetics. Compute ecosystem services value by multiplying land-use area (acres) by ecosystem value ($/acre). Ecosystem services in Delaware’s watersheds are estimated using value (benefits) transfer where published data and literature from similar watersheds are reviewed and applied to the resource in question. Value-transfer techniques include selecting data from published literature from another watershed or study area and applying the dollars-per-acre values to Delaware land-use areas. While primary research data from the area in question (Delaware) is preferable and is used in some cases in this report, value transfer is the next best practical way to value ecosystems, especially when, in the absence of such data, the worth of ecosystems have previously been deemed zero. Future economic valuation research is recommended to develop primary ecosystem service values for Delaware. 5. Jobs and wages: Obtain employment and wage data from the U.S. Department of Labor, U.S. Census Bureau, National Ocean Economics Program, and other sources. Calculate direct/indirect jobs in Delaware by North American Industry Classification System (NAICS) codes such as shipbuilding, marine transportation/ports, fisheries, recreation, minerals, trade, agriculture, and others. NAICS data were supplemented with farm jobs data from the USDA Agricultural Statistics Bureau, U.S. Fish and Wildlife Service ecotourism jobs data, and jobs provided by water purveyors and wastewater-treatment utilities. 6. Report: Prepare a report and GIS mapping that summarizes (1) annual economic value of activities related to Delaware’s watersheds, (2) ecosystem goods and services (natural capital), and (3) jobs and wages directly and indirectly related to Delaware’s watersheds in 2010 dollars.

Economic Benefits and Jobs Provided by Delaware Watersheds Jan. 2012
18
3. Economic Value
Figure 3 illustrates the total economic value of water resources computed from use and non-use values (Hodge and Dunn, 1992). Use values include direct values, such as market goods from the sales of crops, fish, and timber; unpriced benefits from recreation and aesthetic viewsheds; and ecological-function values (ecosystem services) from flood control, water storage, and waste-assimilation services of wetland and forest habitat. Non-use values include future-option values such as future drug discoveries from wetland plants and future recreation, existence values from satisfaction that a water resource exists but may never be visited, and bequest values such as preserving water quality for future generations.
Figure 3. Economic Value of Water Resources
Source: Hodge and Dunn, 1992
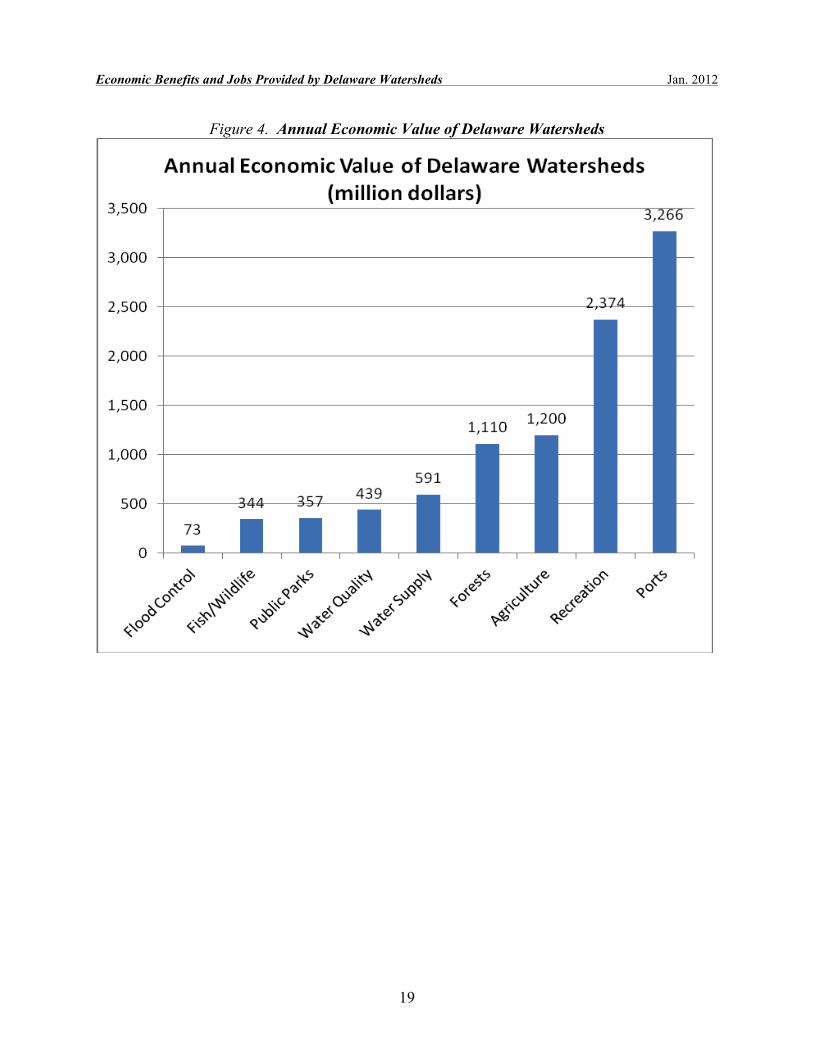
The value of the Delaware Estuary watershed from recreation, water quality, water supply, fish/wildlife, flood control benefits, agriculture, public parks, forests and maritime transportation benefits exceeds $6 billion (Figure 4 and Table 6).
• Water Quality $439M • Flood Control $73M • Water Supply $591M • Fish/Wildlife $344M • Recreation $2,374M • Agriculture $1,200M • Ports $3,266M • Forests $1,110M • Public Parks $357M Total >$6B
Economic Benefits and Jobs Provided by Delaware Watersheds Jan. 2012
19
Figure 4. Annual Economic Value of Delaware Watersheds
Economic Benefits and Jobs Provided by Delaware Watersheds Jan. 2012
20
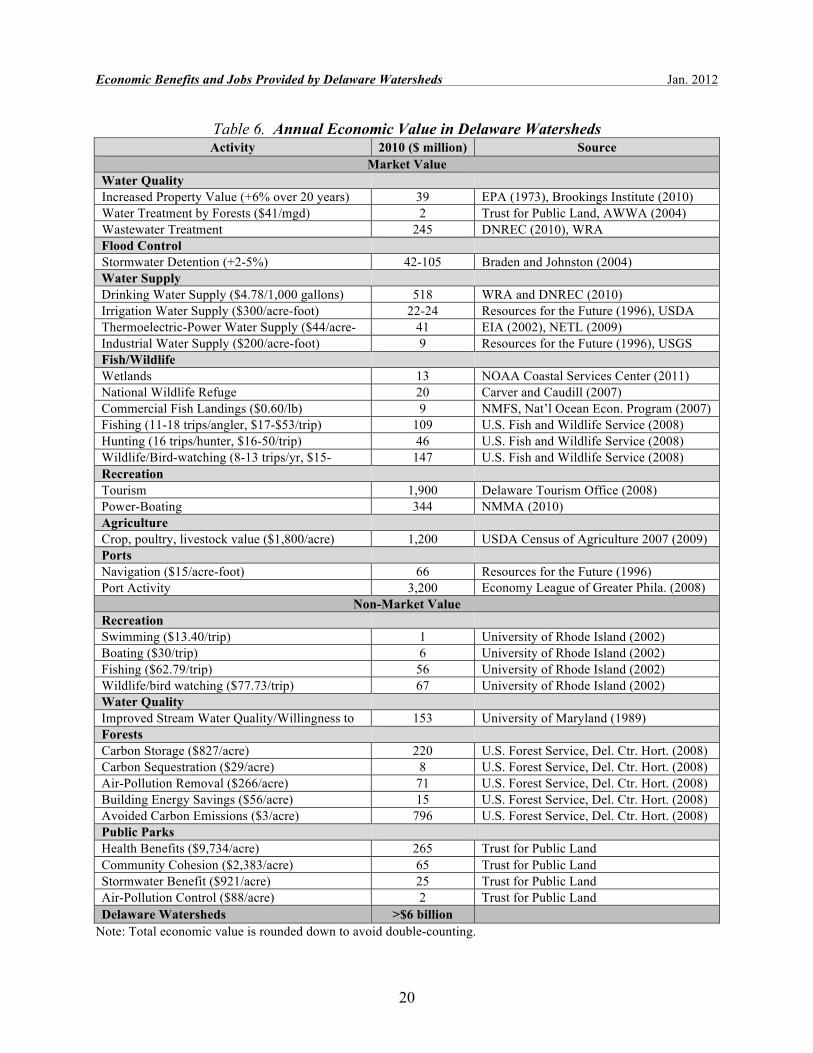
Table 6. Annual Economic Value in Delaware Watersheds Activity 2010 ($ million) Source
Market Value Water Quality Increased Property Value (+6% over 20 years) 39 EPA (1973), Brookings Institute (2010) Water Treatment by Forests ($41/mgd) 2 Trust for Public Land, AWWA (2004) Wastewater Treatment 245 DNREC (2010), WRA Flood Control Stormwater Detention (+2-5%) 42-105 Braden and Johnston (2004) Water Supply Drinking Water Supply ($4.78/1,000 gallons) 518 WRA and DNREC (2010) Irrigation Water Supply ($300/acre-foot) 22-24 Resources for the Future (1996), USDA
(2007), USGS (2005) Thermoelectric-Power Water Supply ($44/acre-foot)
41 EIA (2002), NETL (2009) Industrial Water Supply ($200/acre-foot) 9 Resources for the Future (1996), USGS
(2005) Fish/Wildlife Wetlands 13 NOAA Coastal Services Center (2011) National Wildlife Refuge 20 Carver and Caudill (2007) Commercial Fish Landings ($0.60/lb) 9 NMFS, Nat’l Ocean Econ. Program (2007) Fishing (11-18 trips/angler, $17-$53/trip) 109 U.S. Fish and Wildlife Service (2008) Hunting (16 trips/hunter, $16-50/trip) 46 U.S. Fish and Wildlife Service (2008) Wildlife/Bird-watching (8-13 trips/yr, $15-$27/trip)
147 U.S. Fish and Wildlife Service (2008) Recreation Tourism 1,900 Delaware Tourism Office (2008) Power-Boating 344 NMMA (2010) Agriculture Crop, poultry, livestock value ($1,800/acre) 1,200 USDA Census of Agriculture 2007 (2009) Ports Navigation ($15/acre-foot) 66 Resources for the Future (1996) Port Activity 3,200 Economy League of Greater Phila. (2008)
Martins Associates (2007) Non-Market Value Recreation Swimming ($13.40/trip) 1 University of Rhode Island (2002) Boating ($30/trip) 6 University of Rhode Island (2002) Fishing ($62.79/trip) 56 University of Rhode Island (2002) Wildlife/bird watching ($77.73/trip) 67 University of Rhode Island (2002) Water Quality Improved Stream Water Quality/Willingness to Pay
153 University of Maryland (1989) Forests Carbon Storage ($827/acre) 220 U.S. Forest Service, Del. Ctr. Hort. (2008) Carbon Sequestration ($29/acre) 8 U.S. Forest Service, Del. Ctr. Hort. (2008) Air-Pollution Removal ($266/acre) 71 U.S. Forest Service, Del. Ctr. Hort. (2008) Building Energy Savings ($56/acre) 15 U.S. Forest Service, Del. Ctr. Hort. (2008) Avoided Carbon Emissions ($3/acre) 796 U.S. Forest Service, Del. Ctr. Hort. (2008) Public Parks Health Benefits ($9,734/acre) 265 Trust for Public Land Community Cohesion ($2,383/acre) 65 Trust for Public Land Stormwater Benefit ($921/acre) 25 Trust for Public Land Air-Pollution Control ($88/acre) 2 Trust for Public Land Delaware Watersheds >$6 billion
Note: Total economic value is rounded down to avoid double-counting.
Economic Benefits and Jobs Provided by Delaware Watersheds Jan. 2012
21
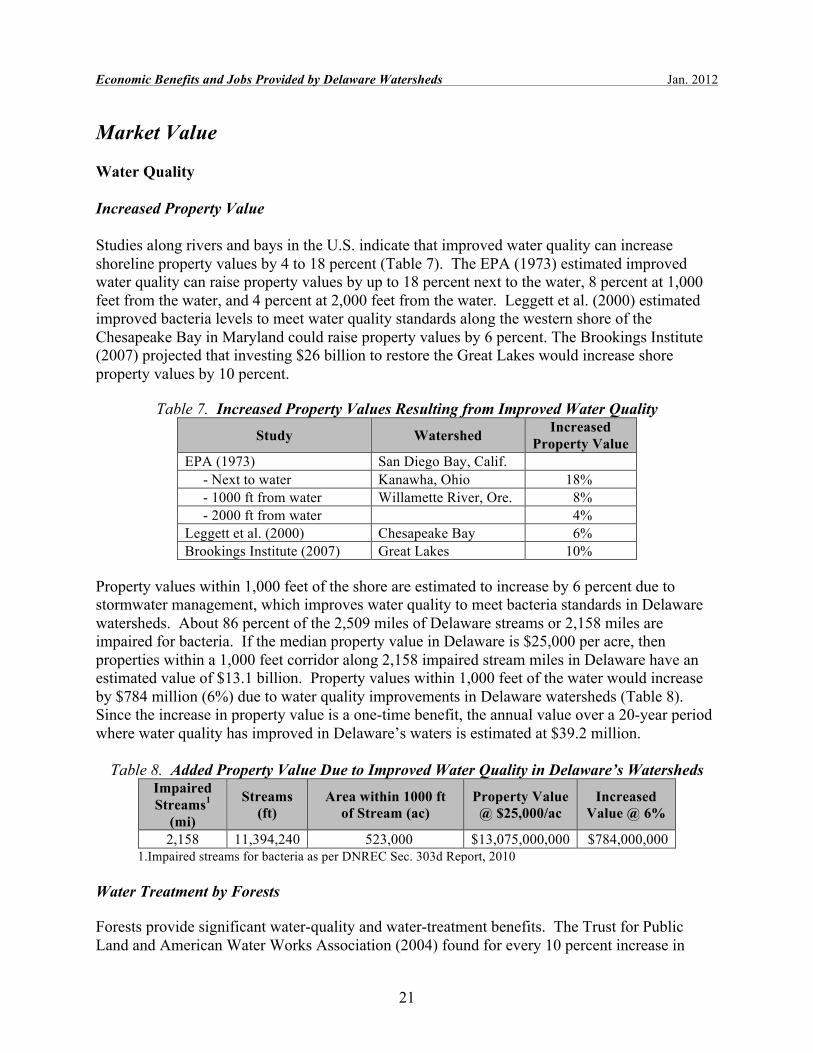
Market Value Water Quality Increased Property Value Studies along rivers and bays in the U.S. indicate that improved water quality can increase shoreline property values by 4 to 18 percent (Table 7). The EPA (1973) estimated improved water quality can raise property values by up to 18 percent next to the water, 8 percent at 1,000 feet from the water, and 4 percent at 2,000 feet from the water. Leggett et al. (2000) estimated improved bacteria levels to meet water quality standards along the western shore of the Chesapeake Bay in Maryland could raise property values by 6 percent. The Brookings Institute (2007) projected that investing $26 billion to restore the Great Lakes would increase shore property values by 10 percent.
Table 7. Increased Property Values Resulting from Improved Water Quality Study Watershed Increased
Property Value EPA (1973) San Diego Bay, Calif. - Next to water Kanawha, Ohio 18% - 1000 ft from water Willamette River, Ore. 8% - 2000 ft from water 4% Leggett et al. (2000) Chesapeake Bay 6% Brookings Institute (2007) Great Lakes 10%
Property values within 1,000 feet of the shore are estimated to increase by 6 percent due to stormwater management, which improves water quality to meet bacteria standards in Delaware watersheds. About 86 percent of the 2,509 miles of Delaware streams or 2,158 miles are impaired for bacteria. If the median property value in Delaware is $25,000 per acre, then properties within a 1,000 feet corridor along 2,158 impaired stream miles in Delaware have an estimated value of $13.1 billion. Property values within 1,000 feet of the water would increase by $784 million (6%) due to water quality improvements in Delaware watersheds (Table 8). Since the increase in property value is a one-time benefit, the annual value over a 20-year period where water quality has improved in Delaware’s waters is estimated at $39.2 million.
Table 8. Added Property Value Due to Improved Water Quality in Delaware’s Watersheds Impaired Streams1
(mi)
Streams (ft)
Area within 1000 ft of Stream (ac)
Property Value @ $25,000/ac
Increased Value @ 6%
2,158 11,394,240 523,000 $13,075,000,000 $784,000,000 1.Impaired streams for bacteria as per DNREC Sec. 303d Report, 2010
Water Treatment by Forests Forests provide significant water-quality and water-treatment benefits. The Trust for Public Land and American Water Works Association (2004) found for every 10 percent increase in

Economic Benefits and Jobs Provided by Delaware Watersheds Jan. 2012
22
forested watershed land, drinking water treatment and chemical costs are reduced by approximately 20 percent (Table 9). If the public drinking water supply is 100 million gallons per day (mgd) and forests cover 265,476 acres (414 sq. mi. or 18 percent) of Delaware watersheds, then loss of these forests would increase drinking water–treatment costs by $41 per mgd ($139 per mgd @ 0% forested minus $98 per mgd @ 18% forested) or $4,100/day or $1,496,000/year.
Table 9. Drinking Water–Treatment Costs Based on Percent of Forested Watershed Watershed Forested
Treatment Costs ($ per million gallons)
Change in Costs
0% 139 21% 10% 115 19% 20% 93 20% 30% 73 21% 40% 58 21% 50% 46 21% 60% 37 19%
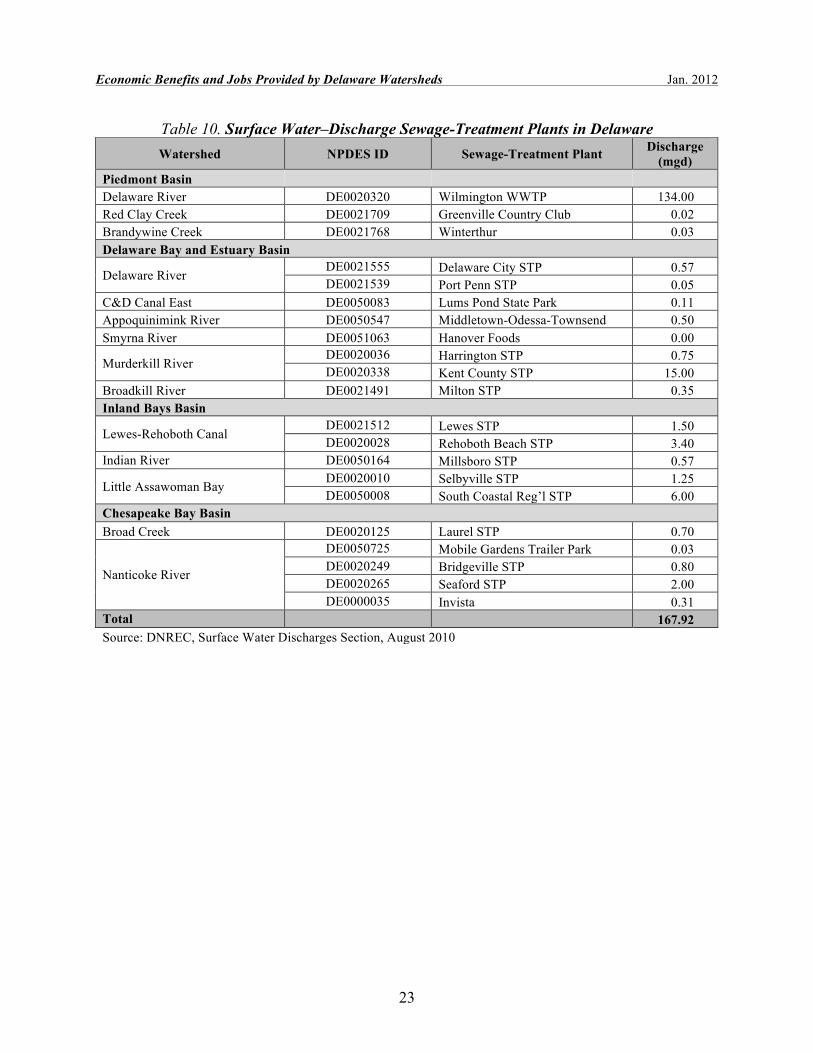
Source: Trust for Public Land and AWWA, 2004 Wastewater Treatment The water resources in the state of Delaware provide significant wastewater-treatment and -assimilation services. According to DNREC’s Surface Water Discharges Section, there are 21 permitted surface-discharge sewage-treatment plants in Delaware. Three are located in the Piedmont Basin, eight in the Delaware Bay and Estuary Basin, five in the Inland Bays Basin, and five in the Chesapeake Bay Basin. The NPDES wastewater dischargers in Delaware possess Federal and state water-quality permits to treat and discharge 168 million gallons per day to the watershed (Table 10). An analysis of wastewater utilities conducted by WRA computes that the average wastewater rate in the watershed is $4.00 per 1,000 gallons, which, for an average residence of four people (at 50 gpcd), is a fee of $290 per year. The total market value based on treated-wastewater rates in Delaware’s watersheds is $671,680 per day or $245 million per year (Table 11).
Economic Benefits and Jobs Provided by Delaware Watersheds Jan. 2012
23
Table 10. Surface Water–Discharge Sewage-Treatment Plants in Delaware Watershed NPDES ID Sewage-Treatment Plant Discharge
(mgd) Piedmont Basin Delaware River DE0020320 Wilmington WWTP 134.00 Red Clay Creek DE0021709 Greenville Country Club 0.02 Brandywine Creek DE0021768 Winterthur 0.03 Delaware Bay and Estuary Basin
Delaware River DE0021555 Delaware City STP 0.57 DE0021539 Port Penn STP 0.05
C&D Canal East DE0050083 Lums Pond State Park 0.11 Appoquinimink River DE0050547 Middletown-Odessa-Townsend 0.50 Smyrna River DE0051063 Hanover Foods 0.00
Murderkill River DE0020036 Harrington STP 0.75 DE0020338 Kent County STP 15.00
Broadkill River DE0021491 Milton STP 0.35 Inland Bays Basin
Lewes-Rehoboth Canal DE0021512 Lewes STP 1.50 DE0020028 Rehoboth Beach STP 3.40
Indian River DE0050164 Millsboro STP 0.57
Little Assawoman Bay DE0020010 Selbyville STP 1.25 DE0050008 South Coastal Reg’l STP 6.00
Chesapeake Bay Basin Broad Creek DE0020125 Laurel STP 0.70
Nanticoke River
DE0050725 Mobile Gardens Trailer Park 0.03 DE0020249 Bridgeville STP 0.80 DE0020265 Seaford STP 2.00 DE0000035 Invista 0.31
Total
167.92 Source: DNREC, Surface Water Discharges Section, August 2010

Economic Benefits and Jobs Provided by Delaware Watersheds Jan. 2012
24
Table 11. Value of NPDES Surface Water–Discharge Sewage-Treatment Plants in Delaware NPDES ID Sewage Treatment Plant Discharge
(mgd) $/day $/Year
($4.00/1,000gal) Piedmont Basin DE0020320 Wilmington WWTP 134.000 536,000 195,640,000 DE0021709 Greenville Country Club 0.015 60 21,900 DE0021768 Winterthur 0.025 100 36,500 Delaware Bay and Estuary Basin DE0021555 Delaware City STP 0.570 2,280 832,200 DE0021539 Port Penn STP 0.050 200 73,000 DE0050083 Lums Pond State Park 0.105 420 153,300 DE0050547 Middletown-Odessa-Townsend 0.500 2,000 730,000 DE0051063 Hanover Foods 0.000 0 0 DE0020036 Harrington STP 0.750 3,000 1,095,000 DE0020338 Kent County STP 15.000 60,000 21,900,000 DE0021491 Milton STP 0.350 1,400 511,000 Inland Bays Basin DE0021512 Lewes STP 1.500 6,000 2,190,000 DE0020028 Rehoboth Beach STP 3.400 13,600 4,964,000 DE0050164 Millsboro STP 0.566 2,264 826,360 DE0020010 Selbyville STP 1.250 5,000 1,825,000 DE0050008 South Coastal Reg’l STP 6.000 24,000 8,760,000 Chesapeake Bay Basin DE0020125 Laurel STP 0.700 2,800 1,022,000 DE0050725 Mobile Gardens Trailer Park 0.028 112 40,880 DE0020249 Bridgeville STP 0.800 3,200 1,168,000 DE0020265 Seaford STP 2.000 8,000 2,920,000 DE0000035 Invista 0.311 1,244 454,060 Total 167.920 $671,680 $245,163,200
Flood Control Benefits Stormwater Detention Braden and Johnston (2004) from the University of Illinois estimate that onsite stormwater detention provides flood mitigation and water quality protection services totaling 2 to 5 percent of property value on average for all properties in the floodplain (Wise et al.). If 211,840 acres (331 sq. mi. or 17%) of Delaware’s land mass is within a FEMA-mapped 100-year floodplain and the average value of floodplain land is $10,000/acre, then the total value of floodplain land in Delaware is $2.1 billion. Based on the assumption that onsite stormwater detention increases downstream property values by 2 to 5 percent, stormwater detention then provides $42 to $105 million in economic benefits to downstream floodplain property owners in Delaware.

Economic Benefits and Jobs Provided by Delaware Watersheds Jan. 2012
25
Water Supply Drinking Water Supply Seventy-five percent of the drinking water for New Castle County comes from the streams of the Christina Basin, which include the Brandywine, Red Clay, and White Clay Creeks, and the Christina River. The only four public surface-water intakes in the state are located in the Piedmont Basin. Groundwater sources supply the remaining 25 percent of New Castle County’s drinking water. Kent and Sussex Counties rely solely on groundwater for their drinking water supply. Table 12 provides a list of the largest public water suppliers in Delaware, which include the three largest withdrawers—United Water Delaware, the City of Wilmington, and the City of Dover.
The annual value of raw (untreated) public water supplies in Delaware (297 mgd) is $108 million per year. Water purveyors in Delaware estimate the value of raw water supply is $1.00/1,000 gallons from the cost of services studies for rate setting by the Public Service Commission. When treated and delivered to customers, the market value of drinking water supplies is $518 million (Table 13). The average value of treated drinking water, based on rates set by public and private water purveyors in Delaware, is $4.78 per 1,000 gallons (Corrozi and Seymour, 2008).
Table 12. Largest Public Water Withdrawals in Delaware Delaware Water Purveyor Withdrawal
(mgd) Wilmington 25.0 United Water Delaware 18.5 Newark 6.0 Dover 5.5 Milford 3.4 Lewes 1.9 Harrington 0.7 Tidewater Utilities 0.6 Milton 0.6 Dover Air Force Base 0.6 New Castle Mun. Services Comm. 0.4 Smyrna 0.4 Camden-Wyoming Water Authority 0.3
Source: DRBC and DNREC, 2010

Economic Benefits and Jobs Provided by Delaware Watersheds Jan. 2012
26
Table 13. Economic Value of Delaware’s Public Water Supply
Basin PWS Capacity1 (gpm)
Capacity (gpd)
Value/day Del. untreated2 ($1/1,000 gal)
Value/year Del. untreated ($1/1,000 gal)
Value/year Del. treated3
($4.78/1,000 gal)
Chesapeake Bay
C 17,785 25,610,400 $25,610 $9,347,796 $44,682,465 NTNC 5,177 7,454,880 $7,455 $2,721,031 $13,006,529 TNC 245 352,800 $353 $128,772 $615,530 Total 23,207 33,418,080 $33,418 $12,197,599 $58,304,524
Delaware Bay
C 68,891 99,203,040 $99,203 $36,209,110 $173,079,544 NTNC 26,433 38,063,520 $38,064 $13,893,185 $66,409,423 TNC 1,625 2,340,000 $2,340 $854,100 $4,082,598 Total 96,949 139,606,560 $139,607 $50,956,394 $243,571,565
Inland Bays/Atlantic
C 32,444 46,719,360 $46,719 $17,052,566 $81,511,267 NTNC 4,310 6,206,400 $6,206 $2,265,336 $10,828,306 TNC 1,032 1,486,080 $1,486 $542,419 $2,592,764 Total 37,786 54,411,840 $54,412 $19,860,322 $94,932,337
Piedmont
C 47,475 68,364,000 $68,364 $24,952,860 $119,274,671 NTNC 923 1,329,120 $1,329 $485,129 $2,318,916 TNC 25 36,000 $36 $13,140 $62,809 Total 48,423 69,729,120 $69,729 $25,451,129 $121,656,396
State Totals
C 166,595 239,896,800 $239,897 $87,562,332 $418,547,947 NTNC 36,843 53,053,920 $53,054 $19,364,681 $92,563,174 TNC 2,927 4,214,880 $4,215 $1,538,431 $7,353,701 Total 206,365 297,165,600 $297,166 $108,465,444 $518,464,822
C=Community, NTNC=Non-transient Non-community, and TNC=Transient Non-community 1. DNREC Division of Water 2. WRA, 2010 3. Corrozi and Seymour, 2008 Irrigation Water Supply In a study of the economic value of freshwater in the United States, Resources for the Future estimated the median market value of irrigation water withdrawals is $198/acre-ft in 1996 dollars (Frederick et al., 1996) or $300/acre-ft ($0.92/1,000 gal) in 2010 dollars, adjusting for 3 percent annually (Table 14). In 2007 Delaware had 432,773 acres of cropland (29% of the state’s area), 104,562 acres of which were irrigated (USDA, 2009). New Castle, Kent, and Sussex counties had 2,711, 29,066, and 72,785 acres of irrigated cropland, respectively (Table 15). Annual irrigation-water needs from June through September are nine inches in Delaware for corn, soybeans, and grain (2,600 gpd/acre or 417 mgd). In Delaware, the total annual value of water demand to irrigate 104,562 acres for agriculture is $23.5 million. The total annual value of water demand to irrigate 2,711 acres in New Castle County is just over $0.5 million, to irrigate 29,066 acres in Kent County is $6.5 million, and to irrigate 72,785 acres in Sussex County is $16.4 million (Table 16). The value of irrigation water demand = (9 in./12 in./ft.) (104,562 acres) ($300/acre-ft.) = $23,526,450/yr.

Economic Benefits and Jobs Provided by Delaware Watersheds Jan. 2012
27
Table 14. Freshwater-Use Values in the United States Use 1996 Median1
($/acre-ft.) 2010 Median2
($/acre-ft.) 2010 Median ($/1,000 gal)
Navigation 10 15 0.02 Irrigation 198 300 0.92 Industrial Process 132 200 0.61 Thermoelectric Power 29 44 0.14
1. Frederick et al., 1996 2. Adjusted to 2010 dollars at 3% annually
Table 15. Value of Agriculture Irrigation in Delaware Using Ag Census Data County Cropland1
(acres) Irrigation1
(acres) Value of irrigation2
@ $300/acre-ft. New Castle 51,913 2,711 $609,975 Kent 146,536 29,066 $6,539,850 Sussex 234,324 72,785 $16,376,625 Delaware 432,773 104,562 $23,526,450
1. Census of Agriculture, 2007 (USDA 2009) 2. Frederick et al., 1996 3. USGS, 2005
The USGS (2005) estimated that there are 65.1 mgd used for irrigation in Delaware. The median market value of irrigation-water withdrawals is $198/acre-ft. in 1996 dollars (Frederick et al., 1996) or $300/acre-ft. ($0.92/1,000 gal) in 2010 dollars, adjusting at 3 percent annually. Therefore, the total annual value of water demand to irrigate cropland in Delaware is $21.9 million (Table 16).
Table 16. Value of Agriculture Irrigation in Delaware Using USGS Data Irrigation1
(mgd) Value of irrigation/day2
@ $0.92/1,000 gal Value of irrigation/year2
@ $0.92/1,000 gal 65.1 mgd $59,892 $21,860,580
1. USGS, 2005 2. Frederick et al., 1996 Using data from both the USDA and USGS, the total annual value of water demand to irrigate the cropland in Delaware ranges from $21.9–$23.5 million. Thermoelectric-Power Water Supply Thermoelectric power plants, which evaporate water during cooling, produce more than 89 percent of the energy in the United States. Delaware watersheds provide a source of cooling water to run the following coal, and gas-fired power plants in Delaware:
• Delmarva Delaware City Power Plant • Lewes City Power Plant • Conective Edgemoor Power Plant • Invista Seaford Power Plant • NRG Indian River Power Plant

Economic Benefits and Jobs Provided by Delaware Watersheds Jan. 2012
28
The USGS (2005) estimates that Delaware’s waters provide 805 mgd (422 mgd fresh and 383 mgd saline) of cooling water to run the power plants in Delaware. About 95 percent of the cooling water returns to the waterway (non-consumptive), and 5 percent evaporates (consumptive). The median economic value of thermoelectric-power water withdrawals in 1996 dollars is $29/acre-ft. ($0.09/1,000 gal) with a range of $9 to $63/acre-ft. (Frederick et al., 1996). Adjusting at 3 percent annually, the median value of thermoelectric-plant water withdrawals in 2010 dollars is $44 per acre-ft. or $0.14/1,000 gallons. The annual value of power-plant water withdrawals in Delaware is just over $41 million (Table 17).
Table 17. Thermoelectric Power Plant Water Withdrawals in Delaware
Power Plant1 Withdrawal2 (mgd)
Value/day3 ($0.14/,1000 gal)
Value/year ($0.14/1,000 gal)
Delmarva Delaware City
Conectiv Edgemoor Lewes City Invista Seaford NRG Indian River Total 805 $112,700 $41,135,500
1.EIA, 2002, DRBC, 2010, NETL, 2009. 2. USGS, 2005. 3. Frederick et al., 1996 (adjusted to 2010 dollars at 3% annually).
Industrial Water Supply The USGS (2005) estimates that industrial-water withdrawals total 41.4 mgd in Delaware watersheds. A study of the economic value of freshwater in the United States indicates the median market value of industrial withdrawals is $132/acre-ft. in 1996 dollars (Frederick et al. 1996) or $200/acre-ft. ($0.61/1,000 gal) in 2010 dollars adjusting at 3 percent annually. The value of industrial-water withdrawals based on 41.4 mgd in Delaware watersheds is $25,254 per day or $9,217,710 per year. Fish/Wildlife Wetlands The NOAA Coastal Services Center (2011) estimates that coastal wetlands habitat supports 584 commercial, creational, and charter fishing jobs in Delaware with $13.4 million in business output and 19.3 million in wages. National Wildlife Refuge The U.S. Fish and Wildlife Service estimates that the 16,000 acre Bombay Hook National Wildlife Refuge (NWR) in Delaware was the 4th most visited refuge in the nation, as it recorded nearly 271,000 recreational visits in 2006 with 80 percent of its visitors from other states (Carver and Caudill 2007). The Bombay Hook NWR is the 6th most valuable refuge in the U.S., as it contributed $20.2 million to the local economy from food, lodging, equipment, and transportation expenditures—with $13.4 million from bird watching alone—and was responsible

Economic Benefits and Jobs Provided by Delaware Watersheds Jan. 2012
29
for 198 jobs with $5.5 million in annual income. With a FY 2006 annual budget of $804,000 and benefits of $20.2 million, the Bombay Hook NWR provides a benefit to cost ratio of 23.4–1. Commercial Fish Landings The annual value of commercial fish landings in the waters of Delaware is $7.9 million in 2007 dollars or $8.6 million in 2010 dollars, as reported by the National Marine Fisheries Service and National Ocean Economics Program (2007). Table 18 ranks the most lucrative fisheries in 2010 dollars as blue crab ($5.8 million/year), with the eastern oyster, striped bass, and knobbed whelk each at approximately $0.5 million/year. Figures 5, 6 and 7 and Table 18 show fish harvests by weight and revenue for harvests at Delaware docks.
Figure 5. Blue Crab Harvests in Delaware Waters
Source: NMFS and NOEP, 2007
Figure 6. Striped Bass Harvests in Delaware Waters
Source: NMFS and NOEP, 2007

Economic Benefits and Jobs Provided by Delaware Watersheds Jan. 2012
30
Figure 7. Eastern Oyster Harvests in Delaware Waters
Source: NMFS and NOEP 2007

Economic Benefits and Jobs Provided by Delaware Watersheds Jan. 2012
31
Table 18. Value of Commercial Fish Harvests in Delaware Commercial Living Marine Species in Delaware, 20071
Species Pounds (2007)
Landed Value (2007 dollars) 2
Landed Value (2010 dollars) 2
Striped Bass 188,671 $429,994 $469,866 Bluefish 19,565 $8,075 $8,824 Butterfish 946 $843 $921 Common Carp 3,764 $865 $945 Channel Catfish 6,922 $3,929 $4,293 Northern Quahog Clam 44,618 $181,350 $198,166 Blue Crab 3,799,820 $5,329,182 $5,823,341 Horseshoe Crab 229,602 $48,978 $53,520 Atlantic Croaker 13,651 $8,281 $9,049 Black Drum 37,712 $21,867 $23,895 American Eel 139,648 $315,094 $344,312 Conger Eel 1,241 $517 $565 Finfished, UNC Bait and animal food 28 $7 $8 Finfishes, UNC General 5,421 $18,018 $19,689 Flatfish 676 $362 $396 Summer Flounder 5,464 $11,119 $12,150 Blueback Herring 1,434 $609 $665 Northern Kingfish 690 $548 $599 Atlantic Menhaden 85,080 $6,635 $7,250 Eastern Oyster 79,933 $490,465 $535,944 White Perch 55,973 $46,865 $51,211 Black Sea Bass 72,675 $200,902 $219,531 American Shad 71,445 $42,408 $46,340 Shellfish 30,130 $76,119 $83,177 Spot 128,209 $99,995 $109,267 Tautog 1,976 $3,723 $4,068 Weakfish 24,604 $36,177 $39,532 Channeled Whelk 17,139 $54,804 $59,886 Knobbed Whelk 260,078 $456,368 $498,686 Total 5,327,115 $7,894,099 $8,626,096
1. NMFS and National Ocean Economics Program, in 2007 dollars
2. Adjusted to 2010 dollars at 3% annually

Economic Benefits and Jobs Provided by Delaware Watersheds Jan. 2012
32
Fishing, Hunting, and Bird/Wildlife Watching In Delaware, the U.S. Fish and Wildlife Service (2008) estimated the annual economic value of recreational fishing, hunting, birding and wildlife-associated activities at $268.8 million in 2006 dollars or $302.6 million in 2010 dollars, adjusting at 3 percent annually (Table 19). Trip-related expenditures include the market value of purchases and sales of food and lodging, transportation, and hunting, fishing, and wildlife-watching equipment. Most fishing, hunting, and wildlife/birding recreation occurs on farms, forests, wetlands, and open-water ecosystems such as the Prime Hook and Bombay Hook National Wildlife Refuges, Cape Henlopen State Park, and other state parks and forests in Delaware and along the state’s rivers, bays, and ocean.
Table 19. Value of Fishing, Hunting, and Wildlife Recreation in Delaware
Recreation Activity
Value1 in 2006 dollars
($ million)
Value in 2010 dollars
($ million) Fishing $96.7 $108.9
Trip-related $48.5 $54.6 Equipment/Other $48.2 $54.3
Hunting $41.3 $46.5 Trip-related $13.6 $15.3 Equipment/Other $27.7 $31.2
Wildlife/Birding $130.8 $147.2 Trip-related $13.1 $14.7 Equipment/Other $117.7 $132.5
Total $268.8 $302.6 1. USFWS, Survey conducted in 2006, report issued 2008.
Recreation Tourism A vibrant tourism economy relies on clean water and healthy habitat in Delaware watersheds. According to the Delaware Tourism Office (2008), the Delaware tourism economy produced a total market value of goods and services during Fiscal Year 2008 of at least $1.9 billion. • In 2008 there were 6.9 million visitors to the state of Delaware. • The tourism industry generated just under $408 million in state and local government
taxes/fees in FY 2008, an average of about $59 per visitor. Power-Boating Delaware is home to a robust boating industry that relies on clean water. According to the National Marine Manufacturer’s Association (2010), in a national ranking by state, Delaware ranked 7th in total expenditures ($343,743,963) for new powerboats, engine, trailer, and

Economic Benefits and Jobs Provided by Delaware Watersheds Jan. 2012
33
accessory purchases. In 2009 Delaware ranked 40th in boat registrations (61,523 registrations) (NMMA, 2010). Agriculture Crop, Poultry, Livestock In the watersheds of Delaware, the USDA National Agricultural Statistics Service (2009) estimates the annual market value of agricultural products sold is $1.2 billion (2010 dollars) on 510,253 acres (797 sq. mi.) for crops such as corn, wheat, oats, barley, soybeans, potatoes, and vegetables, livestock, and poultry. Sussex County has the highest value of agricultural products of the three counties in Delaware at $927.6 million, and Kent and New Castle County have a significantly lower agriculture value—$205.9 million and $49.9 million, respectively. The average value of agriculture products sold in the state is $1,791/acre (Table 20).
Table 20. Value of Cropland and Agriculture in Delaware
County Farmland by
County1 (acres)
Ag Products Sold Value by County1
in 2007 dollars ($ million)
Ag Products Sold Value by County in 2010 dollars
($ million)
Ag Products Sold Value by County in 2010 dollars
($/acre) New Castle 66,981 45.7 49.9 745.5 Kent 173,808 188.4 205.9 1,184.5 Sussex 269,464 848.9 927.6 3,442.4 Total 510,253 $1,083.0 $1,183.4 $1,790.8 (average)
1. Census of Agriculture, 2007 (USDA, 2009)
Ports Navigation The 130-mile-long Delaware River and Bay ship channel from Cape Henlopen to the head of tide at Trenton has significant instream navigation–use value. The water-resource value from transport shipping is distinct from the port activities described below. The volume of the 216-sq.-mi. Delaware River and Bay within Delaware’s boundaries at a mean depth of 32 feet is 4.4 million acre-feet (1.4 trillion gallons). Frederick et al. (1996) concluded the median navigation-use value in the U.S. is $10/acre-foot in 1996 dollars ($15/acre-foot in 2010 dollars adjusting for 3% annually). Therefore, the annual navigation use value of the Delaware River/Bay from the Atlantic Ocean to the Port of Wilmington within state boundaries is $66 million. Port Activity The Martin Associates report (2005), prepared for the Diamond State Port Corporation, cited that the marine cargo activity at the Port of Wilmington’s terminals generated a total of $3.2 billion of total economic activity in the region. This total economic activity can be broken down into direct business revenue and the value of output to the state. Just over $400 million ($409.1
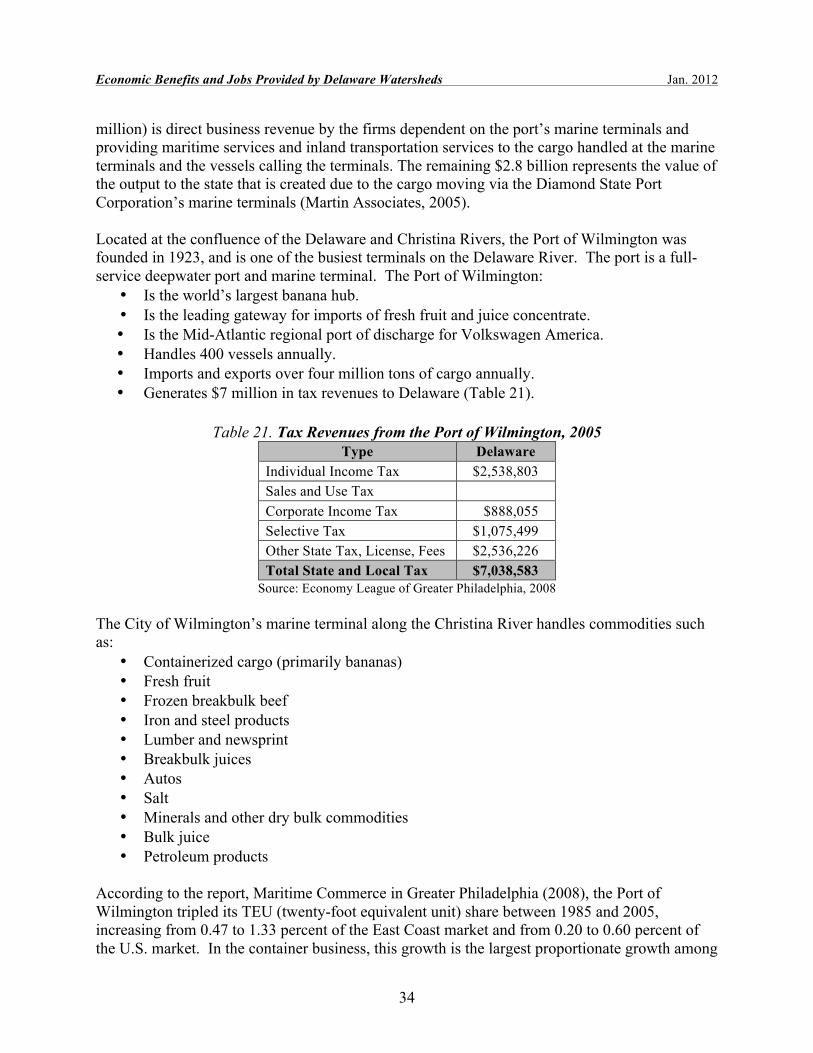
Economic Benefits and Jobs Provided by Delaware Watersheds Jan. 2012
34
million) is direct business revenue by the firms dependent on the port’s marine terminals and providing maritime services and inland transportation services to the cargo handled at the marine terminals and the vessels calling the terminals. The remaining $2.8 billion represents the value of the output to the state that is created due to the cargo moving via the Diamond State Port Corporation’s marine terminals (Martin Associates, 2005). Located at the confluence of the Delaware and Christina Rivers, the Port of Wilmington was founded in 1923, and is one of the busiest terminals on the Delaware River. The port is a full-service deepwater port and marine terminal. The Port of Wilmington:
• Is the world’s largest banana hub. • Is the leading gateway for imports of fresh fruit and juice concentrate. • Is the Mid-Atlantic regional port of discharge for Volkswagen America. • Handles 400 vessels annually. • Imports and exports over four million tons of cargo annually. • Generates $7 million in tax revenues to Delaware (Table 21).
Table 21. Tax Revenues from the Port of Wilmington, 2005
Type Delaware Individual Income Tax $2,538,803 Sales and Use Tax Corporate Income Tax $888,055 Selective Tax $1,075,499 Other State Tax, License, Fees $2,536,226 Total State and Local Tax $7,038,583
Source: Economy League of Greater Philadelphia, 2008
The City of Wilmington’s marine terminal along the Christina River handles commodities such as:
• Containerized cargo (primarily bananas) • Fresh fruit • Frozen breakbulk beef • Iron and steel products • Lumber and newsprint • Breakbulk juices • Autos • Salt • Minerals and other dry bulk commodities • Bulk juice • Petroleum products
According to the report, Maritime Commerce in Greater Philadelphia (2008), the Port of Wilmington tripled its TEU (twenty-foot equivalent unit) share between 1985 and 2005, increasing from 0.47 to 1.33 percent of the East Coast market and from 0.20 to 0.60 percent of the U.S. market. In the container business, this growth is the largest proportionate growth among

Economic Benefits and Jobs Provided by Delaware Watersheds Jan. 2012
35
the 20 largest U.S. container ports during this time period. In 2005 the Port of Wilmington contributed 251,000 TEUs, or 1.3 percent of the container market share, of East Coast ports (2005) (Table 22). The port handles 8,445 tons per year, or 1.4 percent of the container market share, of East Coast ports (Table 23). The Economy League of Greater Philadelphia (2008) reported that among U.S. ports in 2005 the Port of Wilmington ranked:
• 33rd in import tonnage (6,896,499 short tons imported) • 37th in import cargo value ($5,499,289,565) • 67th in export tonnage (381,567 short tons exported) • 24th in export cargo value ($2,175,543,116)
Table 22. Port of Wilmington Total TEUs as a Share of East Coast and U.S. Markets, 1985-2005
Year Total TEUs Share of East Coast Share of U.S.
1985 18,790 0.47% 0.20% 1990 91,623 1.58% 0.67% 1995 156,940 1.81% 0.78% 2000 192,091 1.64% 0.70% 2005 250,507 1.33% 0.60%
Source: Economy League of Greater Philadelphia, 2008
Table 23. Port of Wilmington Total Tonnage as a Share of East Coast and U.S. Markets, 1985-2005
Year Tonnage (thousands)
Share of East
Coast
Share of U.S.
1985 2,362 0.56% 0.15% 1990 4,209 0.90% 0.20% 1995 4,273 0.96% 0.20% 2000 5,184 0.94% 0.22% 2005 8,445 1.44% 0.36%
Source: Economy League of Greater Philadelphia, 2008

Economic Benefits and Jobs Provided by Delaware Watersheds Jan. 2012
36
Non-Market Value Recreation Boating, Fishing, and Swimming Recreation Using travel cost–demand methods, Johnston et al. (2002), from the University of Rhode Island, computed the consumer surplus (economic-use value) for swimming, boating, recreational fishing, and bird watching/wildlife viewing in the Peconic Estuary watershed on Long Island, N.Y., at $8.59, $19.23, $40.25, and $49.83 per trip, respectively, in 1995 dollars. Table 24 displays water-quality benefits to recreational users at $130 million per year in Delaware by transferring unit values from the Peconic Estuary, converting 1995 dollars to 2010 dollars at 3 percent per year and multiplying the 2010 figures by number of trips per year. Wildlife viewing/bird watching (51%) and fishing (43%) are the highest recreational benefits, followed by boating (5%) and swimming (1%).
Table 24. Total Annual Value of Recreational Benefits in Delaware Watersheds
Recreational Benefit
Consumer surplus/trip1
(1995 dollars)
Consumer surplus/trip2
(2010 dollars)
Trips/year
Annual Value
Portion of
Benefit
Swimming $8.59 $13.40 89,7933 $1,203,226 1% Boating $19.23 $30.00 211,1944 $6,335,820 5% Fishing $40.25 $62.79 897,9354 $56,381,339 43% Wildlife/bird watching $49.83 $77.73 855,0005 $66,459,150 51% Total $130,379,535 100%
1. Johnston et al., 2002. 2. 2010 dollars transferred from 1995 dollars at 3% per year. 3. Using 2010 U.S. Census value, 897,934, about 10% of population swims in watershed. 4. NOEP 2009, 16.8% of population enjoys boating at 1.4 trips/person/year and 10.3% of population goes fishing at 1.2 trips/person/year, using 2010 U.S. Census value. 5. USFWS 2006.
Water Quality Improved Stream Water Quality/Willingness to Pay The economic benefits of stormwater management to improve water quality is estimated by comparing reduced pollutant loadings from municipal and construction site controls, which result in changes in water-quality classifications among the following uses:
• Non-support (Impaired) • Boatable • Fishable • Swimmable
Carson and Mitchell (1993) conducted a contingent-value (CV) study to estimate the national benefits of freshwater-pollution control to meet the goals of the Clean Water Act. The study

Economic Benefits and Jobs Provided by Delaware Watersheds Jan. 2012
37
surveyed people’s preferences or willingness to pay (WTP) for improved water quality to achieve instream, withdrawal, aesthetic, ecosystem-use benefits and vicarious consumption and stewardship non-use benefits (Table 25). They found that the range of mean annual household WTP to go from non-supported (polluted) to improved water quality was wide—$93 for boatable, $70 for fishable, $78 for swimmable, and $242 for total use support (1990 dollars). Adjusting for inflation at 3 percent annually, mean annual household WTP in 2010 dollars also has a wide range, $168 for boatable, $127 for fishable, $141 for swimmable, and $438 for total use support (Table 26). The major policy implications from this WTP research indicate that the American public is willing to pay up to $438 per year for watershed and stormwater-management controls to achieve boatable, fishable, and swimmable water quality in freshwater rivers and streams.
Table 25. Typical Benefits from Improved Freshwater Quality
Benefit Category Examples Use Instream Recreational (fishing, swimming, boating) Commercial (fishing, navigation) Withdrawal Municipal(drinking water, waste disposal) Agriculture (irrigation) Industrial/commercial (waste treatment)
Aesthetic Near water recreation (hiking, picnicking, photography)
Viewing (commuting, office/home views) Ecosystem Hunting/bird watching Ecosystem support (food chain) Nonuse Vicarious Significant others (relatives, friends) American public Stewardship Inherent (preserving remote wetlands) Bequest (family, future generations)
Source: Carson and Mitchell 1993
Table 26. Adjusted Annual Household Values for National Water Quality Benefits Water
Quality Use Support
Mean WTP1 $1990
Standard Error of Mean ($)
95% Confidence interval ($)
Mean WTP2 $2010
Boatable 93 8 77-109 168 Fishable 70 6 58-82 127 Swimmable 78 9 60-96 141 Total 242 19 205-279 438
1. Carson and Mitchell, 1993 2. Adjusted to 2010 dollars for inflation at 3% annually In Delaware, the freshwater benefits of watershed management to achieve water-quality goals ranges from $54 million/year for boatable, $41 million for fishable, $45 million for swimmable, and $141 million for total boatable, fishable, and swimmable water-quality uses.
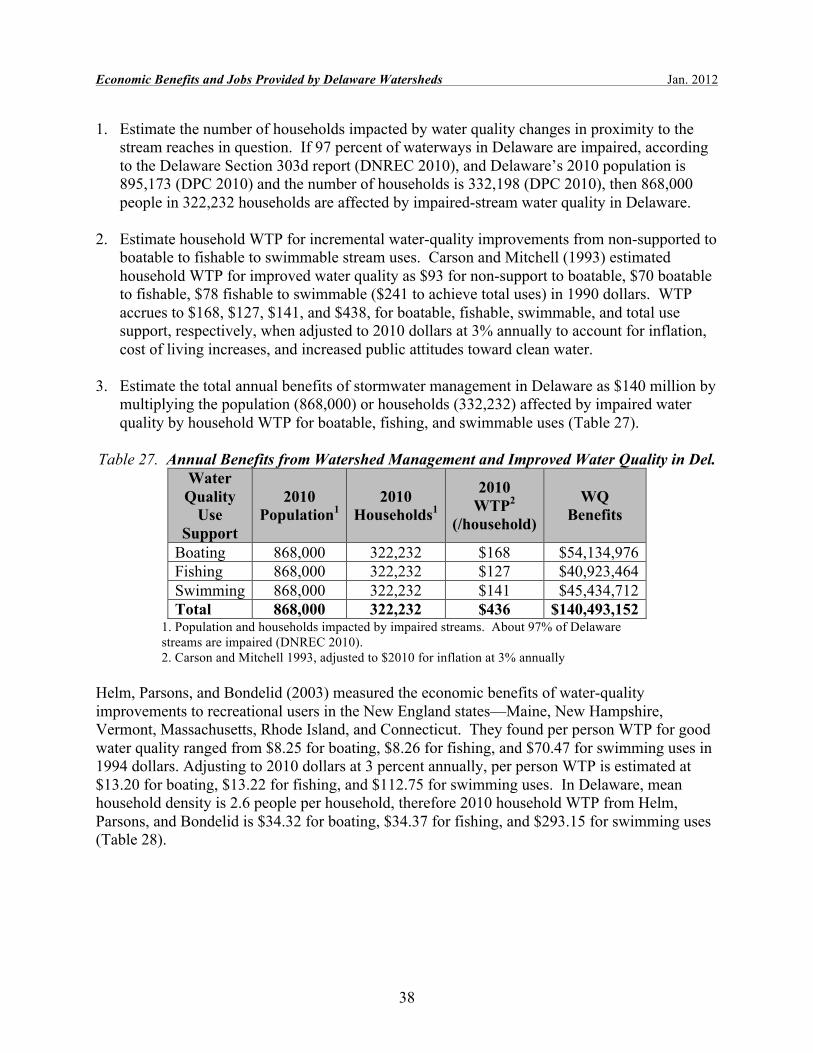
Economic Benefits and Jobs Provided by Delaware Watersheds Jan. 2012
38
1. Estimate the number of households impacted by water quality changes in proximity to the stream reaches in question. If 97 percent of waterways in Delaware are impaired, according to the Delaware Section 303d report (DNREC 2010), and Delaware’s 2010 population is 895,173 (DPC 2010) and the number of households is 332,198 (DPC 2010), then 868,000 people in 322,232 households are affected by impaired-stream water quality in Delaware.
2. Estimate household WTP for incremental water-quality improvements from non-supported to
boatable to fishable to swimmable stream uses. Carson and Mitchell (1993) estimated household WTP for improved water quality as $93 for non-support to boatable, $70 boatable to fishable, $78 fishable to swimmable ($241 to achieve total uses) in 1990 dollars. WTP accrues to $168, $127, $141, and $438, for boatable, fishable, swimmable, and total use support, respectively, when adjusted to 2010 dollars at 3% annually to account for inflation, cost of living increases, and increased public attitudes toward clean water.
3. Estimate the total annual benefits of stormwater management in Delaware as $140 million by
multiplying the population (868,000) or households (332,232) affected by impaired water quality by household WTP for boatable, fishing, and swimmable uses (Table 27).
Table 27. Annual Benefits from Watershed Management and Improved Water Quality in Del.
Water Quality
Use Support
2010 Population1
2010 Households1
2010 WTP2
(/household)
WQ Benefits
Boating 868,000 322,232 $168 $54,134,976 Fishing 868,000 322,232 $127 $40,923,464 Swimming 868,000 322,232 $141 $45,434,712 Total 868,000 322,232 $436 $140,493,152
1. Population and households impacted by impaired streams. About 97% of Delaware streams are impaired (DNREC 2010). 2. Carson and Mitchell 1993, adjusted to $2010 for inflation at 3% annually
Helm, Parsons, and Bondelid (2003) measured the economic benefits of water-quality improvements to recreational users in the New England states—Maine, New Hampshire, Vermont, Massachusetts, Rhode Island, and Connecticut. They found per person WTP for good water quality ranged from $8.25 for boating, $8.26 for fishing, and $70.47 for swimming uses in 1994 dollars. Adjusting to 2010 dollars at 3 percent annually, per person WTP is estimated at $13.20 for boating, $13.22 for fishing, and $112.75 for swimming uses. In Delaware, mean household density is 2.6 people per household, therefore 2010 household WTP from Helm, Parsons, and Bondelid is $34.32 for boating, $34.37 for fishing, and $293.15 for swimming uses (Table 28).

Economic Benefits and Jobs Provided by Delaware Watersheds Jan. 2012
39
Table 28. Annual Willingness to Pay for Water Quality Benefits in New England States
WQ Use Support
WTP per person1 (1994
dollars)
WTP per
person2 (2010
dollars)
WTP per household3
(2010 dollars)
Boatable 8.25 13.20 34.32 Fishable 8.26 13.22 34.37 Swimmable 70.47 112.75 293.15 Total 86.98 139.17 361.84
1. Helm, Parsons, and Bondelid 2003 2. Adjusted to 2010 dollars for inflation at 3% annually 3. Delaware household density of 2.6 persons/household in 2010
Table 29 compares annual household WTP for improved water quality adjusted to 2010 dollars from Carson and Mitchell (1993) and Helm, Parsons, and Bondelid (2003). Multiplying household WTP by the number of households (97%) in Delaware affected by impaired water quality indicates that total WTP ranges from $141 million per year from the Carson and Mitchell (1993) national survey data to $116 million per year from the Parsons et al. (2003) survey of the six New England states. Total WTP in Delaware from both studies are in close agreement ($141 million vs. $116 million) with higher WTP for swimmable uses ($94 million) from the New England states data compared to $45 million for the national survey.
Table 29. Comparison of Annual Willingness to Pay for Water Quality Benefits
WQ Use Support
2010 DE Population1
2010 DE Households
WTP per household2
(2010 dollars)
WTP per household3
(2010 dollars)
WQ Benefits2
WQ Benefits3
Boatable 868,000 322,232 168 34 54,134,976 10,955,888 Fishable 868,000 322,232 127 34 40,923,464 10,955,888 Swimmable 868,000 322,232 141 293 45,434,712 94,413,976 Total 868,000 322,232 438 361 141,137,616 116,325,752
1. Population and households impacted by impaired streams. About 97% of Delaware streams are impaired (DNREC 2010) 2. Carson and Mitchell, 1993. 3. Helm, Parsons, and Bondelid 2003. WTP adjusted to 2010 dollars for inflation at 3% annually.

Economic Benefits and Jobs Provided by Delaware Watersheds Jan. 2012
40
Figure 8. Annual Household Willingness to Pay for Improved Water Quality (2010 Dollars)
Willingness to Pay for Improved Water Quality (in $2010)
$168$127 $141
$438
$34
$293
$361
$34
$0
$100
$200
$300
$400
$500
Boatable Fishable Swimmable Total WQ
Water Quality Use Support
Ann
ual H
ouse
hold
WTP
($)
Carson and Mitchell (1993) Parsons, Helm, and Bondelid (1993)
Figure 9. Household Willingness to Pay for Improved Water Quality in Delaware
Willingness to Pay for Improved Water Quality in Delaware ($2010)
0
20,000,000
40,000,000
60,000,000
80,000,000
100,000,000
120,000,000
140,000,000
160,000,000
Boatable Fishable Swimmable Total WQ
Water Quality Use Support
Ann
ual H
ouse
hold
WTP
($)
Carson and Mitchell (1993) Parsons, Helm, and Bondelid (1993)

Economic Benefits and Jobs Provided by Delaware Watersheds Jan. 2012
41
Forests The U.S. Forest Service and Delaware Center for Horticulture (Nowak et al., 2008) estimated that 7,137 acres of forests in New Castle County provide environmental benefits such as carbon storage of $5.9 million ($827/acre) and air-pollution removal of $1.9 million ($266/acre/year). Applying these multipliers, 265,476 acres (415 sq. mi.) of forests in Delaware have benefits of carbon storage ($220 million), carbon sequestration ($7.7 million), air-pollution removal ($71 million), and building-energy savings ($15 million). In addition, forests in Delaware watersheds provide environmental benefits by regulating climate change, cooling, and air-emissions control including 11 million tons of carbon-storage capacity, 371,666 tons of carbon sequestration, 10,619 tons of air-pollution removal, 37,167 tons of avoided carbon-emissions capacity (Table 30 and 31).
Table 30. Economic and Environmental Benefits of Forests in Delaware
Benefits Forests New Castle County1 Forests State of Delaware2
Environmental (tons/acre)
Economic (value/acre)
Environmental (tons)
Economic (value)
Carbon Storage 40.00 $827 10,619,040 $219,548,652 Carbon Sequestration 1.40 $29 371,666 $7,698,804 Air Pollution Control 0.04 $266 10,619 $70,616,616 Energy Savings $56 $14,866,656 Avoided Carbon Emissions 0.14 $3 37,167 $796,428
1. Nowak et al. 2008 2. Computed for 265,476 acres of forests in Delaware
Table 31. Economic and Environmental Benefits of Forests in Delaware Watersheds Forest Benefits Piedmont
($) Delaware Bay
($) Chesapeake
($) Inland Bays ($) Total ($)
Carbon Storage 26,620,303 78,851,142 84,607,062 29,470,145 219,548,652
Carbon Sequestration 933,481 2,765,034 2,966,874 1,033,415 7,698,804
Air Pollution Control 8,562,274 25,362,036 27,213,396 9,478,910 70,616,616
Energy Savings 1,802,584 5,339,376 5,729,136 1,995,560 14,866,656 Avoided Carbon Emissions 96,567 286,038 306,918 106,905 796,428 1 Computed for the following acreage in each basin: 32,189 (Piedmont), 95,346 (Delaware Bay), 102,306 (Chesapeake), and 35,635 (Inland Bays).
Public Parks The Trust for Public Land (2009) found that the 444-acre City of Wilmington park and recreation system provides annual economic value and savings to the public from:
• Health benefits from exercise in the parks ($4,322,000 or $9,734/acre).

Economic Benefits and Jobs Provided by Delaware Watersheds Jan. 2012
42
• Community-cohesion benefits from people socializing in the parks ($1,058,000 or $2,383/acre).
• Water pollution–mitigation benefits from parks in treating stormwater ($409,000 or $921/acre).
• Air pollution–mitigation value from tree and shrub absorption ($39,000 or $88/acre). Assuming the data gathered for the City of Wilmington study is appropriate for value (benefits) transfer, public parks in Delaware’s watersheds provide the following annual economic benefits (Table 32):
• Health benefits from exercise in the parks ($264,618,790). • Community-cohesion benefits from people socializing in the parks ($64,781,855). • Water pollution–mitigation benefits from parks in treating stormwater ($25,037,385). • Air pollution–mitigation value from tree and shrub absorption ($2,392,280).
Table 32. Value of Public Parks in Delaware Watersheds
County Parks in
Watershed (acres)
Health Benefits (at $9,734/acre)
Community Cohesion (at $2,383/acre)
Stormwater Benefit (at $921/acre)
Air Pollution (at $88/acre)
Kent 6,888 $67,047,792 $16,414,104 $6,343,848 $606,144 New Castle 13,744 $133,784,096 $32,751,952 $12,658,224 $1,209,472
Sussex 6,553 $63,786,902 $15,615,799 $6,035,313 $576,664 Delaware 27,185 $264,618,790 $64,781,855 $25,037,385 $2,392,280

Economic Benefits and Jobs Provided by Delaware Watersheds Jan. 2012
43
4. Ecosystem Services Ecosystem services (natural capital) are the sum of goods (commodities like water, crops, and timber that can be sold) and services (functions like flood control, water filtration, and fisheries habitat) provided by watershed habitat, such as wetlands, forests, farms, and open water. The following studies were examined to estimate ecosystem-services values for Delaware’s watersheds:
• Cecil County green infrastructure study by the Conservation Fund, Annapolis, Md. (2007)
• New Jersey Department of Environmental Protection with the University of Vermont (2007)
• Ecosystem services value of forests by the Wilderness Society (2001) • Ecosystem services value of Peconic Estuary watershed by University of Rhode Island
(2002) • U.S. National Wildlife Refuge System by University of Maryland and the Nature
Conservancy (2008) • Economic value of ecosystem services in Massachusetts by the Audubon Society (2003).
Related Research Ecosystem services include air filtration, water filtration, recycling nutrients, soil conservation, pollinating crops and plants, climate regulation, carbon sequestration, flood/stormwater control, and hydrologic-cycle regulation. Ecological resources provide marketable goods and services such as timber, fish and wildlife recreation, hiking, and boating/kayaking. Weber (2007) from the Conservation Fund found the largest ecosystem services values in Cecil County, Md., are from stormwater/flood control, water supply, and clean water functions (Table 33). The N.J. Department of Environmental Protection (2007) partnered with the University of Vermont and estimated the value of New Jersey’s natural capital at $20 billion/year in 2004 dollars with a net present value (NPV) of $681 billion, based on a discount rate of 3 percent calculated in perpetuity. NPV takes the value of a dollar today and projects it into the future summed annually over a lifetime (say, 100 years), given the annual value is discounted by an interest rate (3%) due to inflation. The Wilderness Society (Krieger, 2001) concluded that forest ecosystem services for climate regulation, water supply, water quality, and recreation benefits totaled $392/acre in 1994 dollars or $631/acre in 2010 dollars at 3 percent annually (Table 34). A contingent value study by University of Rhode Island economists found that natural resources values in the Peconic Estuary watershed in Suffolk County on Long Island New York ranged from $6,560/acre for wetlands to $9,979/acre for farmland in 1995 dollars (Johnston et al., 2002). The University of Maryland studied the U.S. National Wildlife Refuge System and determined that ecosystem values of freshwater wetlands and forests are $6,268/acre and $845/acre, respectively (Ingraham and Foster, 2008). The Audubon Society found that the economic value of ecosystems in

Economic Benefits and Jobs Provided by Delaware Watersheds Jan. 2012
44
Massachusetts ranged from $984/acre for forests to $15,452/acre for saltwater wetlands (Breunig, 2003). The USDA Census of Agriculture (2009) indicates that in 2007 the total market value of agricultural crops sold from 510,253 acres of farm land in Delaware was $1,083 billion ($210.6 million in crops and $872.4 million in poultry and livestock) or $2,122/acre. Table 35 compares ecosystem services values (dollars/acre) from other studies in other watersheds. Data from the NJDEP study and market (goods) value of agriculture are used for value transfer, as Delaware watersheds share similar ecosystems (forests and wetlands), climate (humid continental at 40 degrees north in latitude), physiographic provinces (Piedmont/Coastal Plain), aquifers, and soils. NJDEP ecosystem-services values ($/acre) are lower than those of Cecil County for wetlands and forests and MassAudubon for wetlands. NJDEP estimates are higher than those of the Wilderness Society for forests and U.S. Wildlife Refuge values for freshwater wetlands and forests. Values are adjusted to 2010 dollars based on 3 percent annually. Net present values are calculated based on an annual discount rate of 3 percent in perpetuity (over 100 years in the future).
Table 33. Ecosystem Services Values for Cecil County
Ecosystem Service Upland Forest
($/ac/yr)
Riparian Forests/
Wetlands ($/ac/yr)
Nonriparian Wetlands ($/ac/yr)
Tidal Marsh
($/ac/yr)
Carbon sequestration 31 65 65 65 Clean air 191 191 191 Soil and peat formation 17 946 450 1,351 Stormwater/flood control 679 32,000 32,000 1,430 Water supply 8,630 8,630 8,630 Clean water 1,100 1,925 1,100 11,000 Erosion/sediment control 151 3,418 151 12,700 Water temperature regulation 4,450 Pest control 50 50 50 Pollination 75 75 75 Wood products 142 Recreation, fish, wildlife habitat 486 534 534 544 Community services savings 439 439 439 439 Increase in property values 42 42 Total 12,033 52,765 43,685 27,529
Source: Weber, 2007
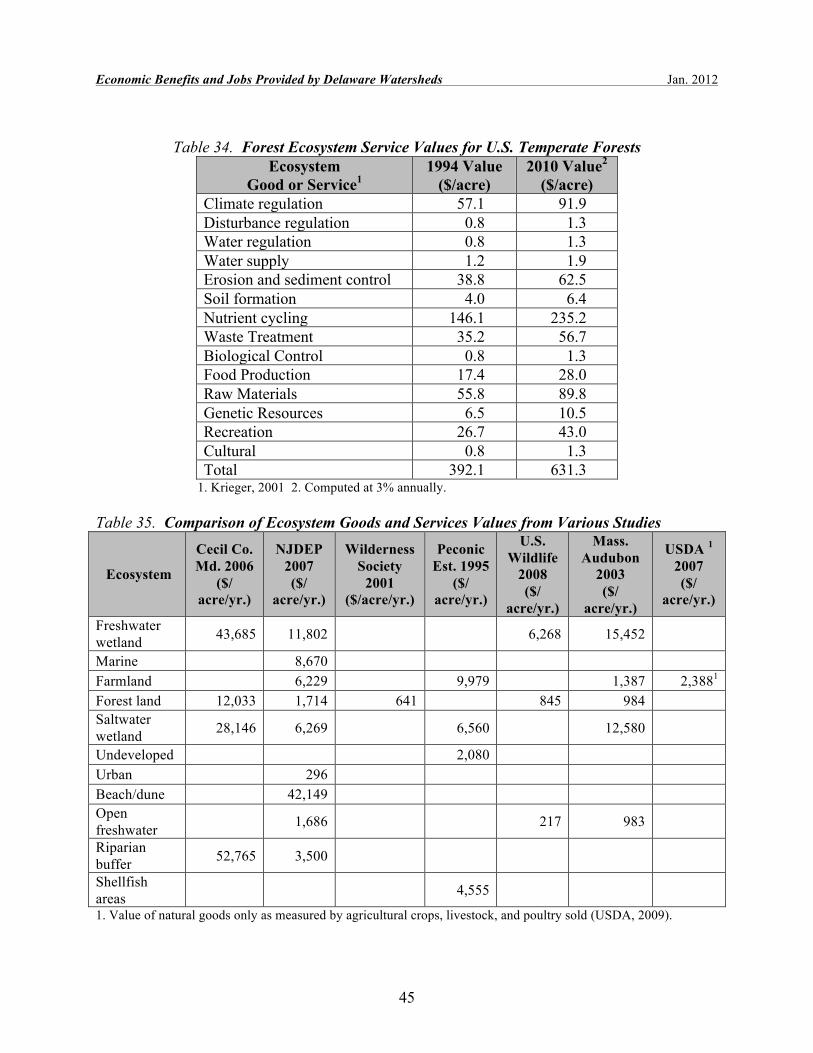
Economic Benefits and Jobs Provided by Delaware Watersheds Jan. 2012
45
Table 34. Forest Ecosystem Service Values for U.S. Temperate Forests
Ecosystem Good or Service1
1994 Value ($/acre)
2010 Value2 ($/acre)
Climate regulation 57.1 91.9 Disturbance regulation 0.8 1.3 Water regulation 0.8 1.3 Water supply 1.2 1.9 Erosion and sediment control 38.8 62.5 Soil formation 4.0 6.4 Nutrient cycling 146.1 235.2 Waste Treatment 35.2 56.7 Biological Control 0.8 1.3 Food Production 17.4 28.0 Raw Materials 55.8 89.8 Genetic Resources 6.5 10.5 Recreation 26.7 43.0 Cultural 0.8 1.3 Total 392.1 631.3
1. Krieger, 2001 2. Computed at 3% annually. Table 35. Comparison of Ecosystem Goods and Services Values from Various Studies
Ecosystem
Cecil Co. Md. 2006
($/ acre/yr.)
NJDEP 2007 ($/
acre/yr.)
Wilderness Society
2001 ($/acre/yr.)
Peconic Est. 1995
($/ acre/yr.)
U.S. Wildlife
2008 ($/
acre/yr.)
Mass. Audubon
2003 ($/
acre/yr.)
USDA 1 2007 ($/
acre/yr.)
Freshwater wetland 43,685 11,802 6,268 15,452
Marine 8,670 Farmland 6,229 9,979 1,387 2,3881 Forest land 12,033 1,714 641 845 984 Saltwater wetland 28,146 6,269 6,560 12,580
Undeveloped 2,080 Urban 296 Beach/dune 42,149 Open freshwater 1,686 217 983
Riparian buffer 52,765 3,500
Shellfish areas 4,555
1. Value of natural goods only as measured by agricultural crops, livestock, and poultry sold (USDA, 2009).

Economic Benefits and Jobs Provided by Delaware Watersheds Jan. 2012
46
Watershed Ecosystem Services The estimated value of goods and services provided in Delaware watersheds (2,368 sq. mi. or 1,515,263 acres) is $6.7 billion (in 2010 dollars) with a net present value (NPV) of $216.6 billion (Table 36). Ecosystem-services areas within the Delaware watersheds comprise farmland (39%), forests (18%), freshwater wetlands (12%), marine (8%), and saltwater wetlands (5%). Just over 15 percent of the watershed land in Delaware is urban/suburban (Figure 10). Freshwater wetlands, farms, marine habitat, forests, and saltwater wetlands provide the highest total ecosystems goods and services values (Figures 11 and 13). The Delaware Estuary, at $2.4 billion, provides the highest value of annual ecosystem services, and the Chesapeake Bay and Inland Bays follow close behind at $2.0 billion each (Figure 12 and 14). Delaware watersheds with the highest value of annual ecosystem services/acre include the Inland Bays ($6,147/acre), Chesapeake Bay ($4,562/acre), and Delaware Estuary ($3,878/acre) watersheds as these systems have the highest combined amounts of forests, marine, and wetlands habitats (over 75%) (Figure 15).
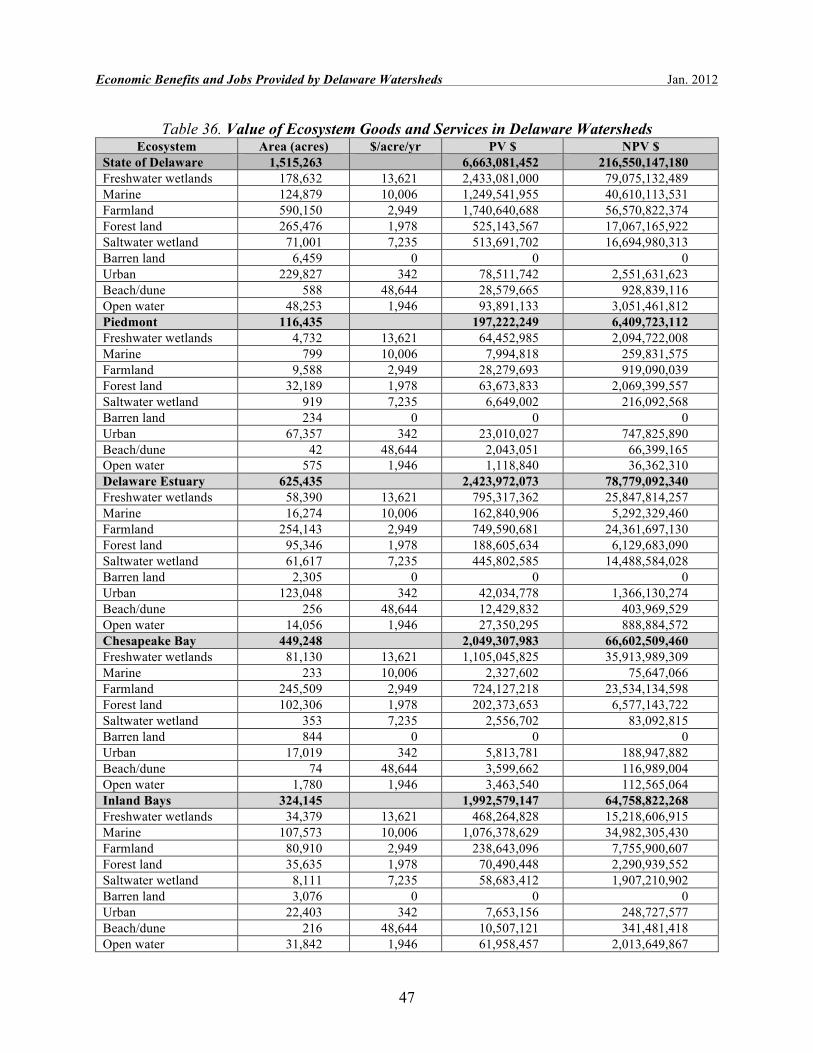
Economic Benefits and Jobs Provided by Delaware Watersheds Jan. 2012
47
Table 36. Value of Ecosystem Goods and Services in Delaware Watersheds Ecosystem Area (acres) $/acre/yr PV $ NPV $
State of Delaware 1,515,263 6,663,081,452 216,550,147,180 Freshwater wetlands 178,632 13,621 2,433,081,000 79,075,132,489 Marine 124,879 10,006 1,249,541,955 40,610,113,531 Farmland 590,150 2,949 1,740,640,688 56,570,822,374 Forest land 265,476 1,978 525,143,567 17,067,165,922 Saltwater wetland 71,001 7,235 513,691,702 16,694,980,313 Barren land 6,459 0 0 0 Urban 229,827 342 78,511,742 2,551,631,623 Beach/dune 588 48,644 28,579,665 928,839,116 Open water 48,253 1,946 93,891,133 3,051,461,812 Piedmont 116,435 197,222,249 6,409,723,112 Freshwater wetlands 4,732 13,621 64,452,985 2,094,722,008 Marine 799 10,006 7,994,818 259,831,575 Farmland 9,588 2,949 28,279,693 919,090,039 Forest land 32,189 1,978 63,673,833 2,069,399,557 Saltwater wetland 919 7,235 6,649,002 216,092,568 Barren land 234 0 0 0 Urban 67,357 342 23,010,027 747,825,890 Beach/dune 42 48,644 2,043,051 66,399,165 Open water 575 1,946 1,118,840 36,362,310 Delaware Estuary 625,435 2,423,972,073 78,779,092,340 Freshwater wetlands 58,390 13,621 795,317,362 25,847,814,257 Marine 16,274 10,006 162,840,906 5,292,329,460 Farmland 254,143 2,949 749,590,681 24,361,697,130 Forest land 95,346 1,978 188,605,634 6,129,683,090 Saltwater wetland 61,617 7,235 445,802,585 14,488,584,028 Barren land 2,305 0 0 0 Urban 123,048 342 42,034,778 1,366,130,274 Beach/dune 256 48,644 12,429,832 403,969,529 Open water 14,056 1,946 27,350,295 888,884,572 Chesapeake Bay 449,248 2,049,307,983 66,602,509,460 Freshwater wetlands 81,130 13,621 1,105,045,825 35,913,989,309 Marine 233 10,006 2,327,602 75,647,066 Farmland 245,509 2,949 724,127,218 23,534,134,598 Forest land 102,306 1,978 202,373,653 6,577,143,722 Saltwater wetland 353 7,235 2,556,702 83,092,815 Barren land 844 0 0 0 Urban 17,019 342 5,813,781 188,947,882 Beach/dune 74 48,644 3,599,662 116,989,004 Open water 1,780 1,946 3,463,540 112,565,064 Inland Bays 324,145 1,992,579,147 64,758,822,268 Freshwater wetlands 34,379 13,621 468,264,828 15,218,606,915 Marine 107,573 10,006 1,076,378,629 34,982,305,430 Farmland 80,910 2,949 238,643,096 7,755,900,607 Forest land 35,635 1,978 70,490,448 2,290,939,552 Saltwater wetland 8,111 7,235 58,683,412 1,907,210,902 Barren land 3,076 0 0 0 Urban 22,403 342 7,653,156 248,727,577 Beach/dune 216 48,644 10,507,121 341,481,418 Open water 31,842 1,946 61,958,457 2,013,649,867
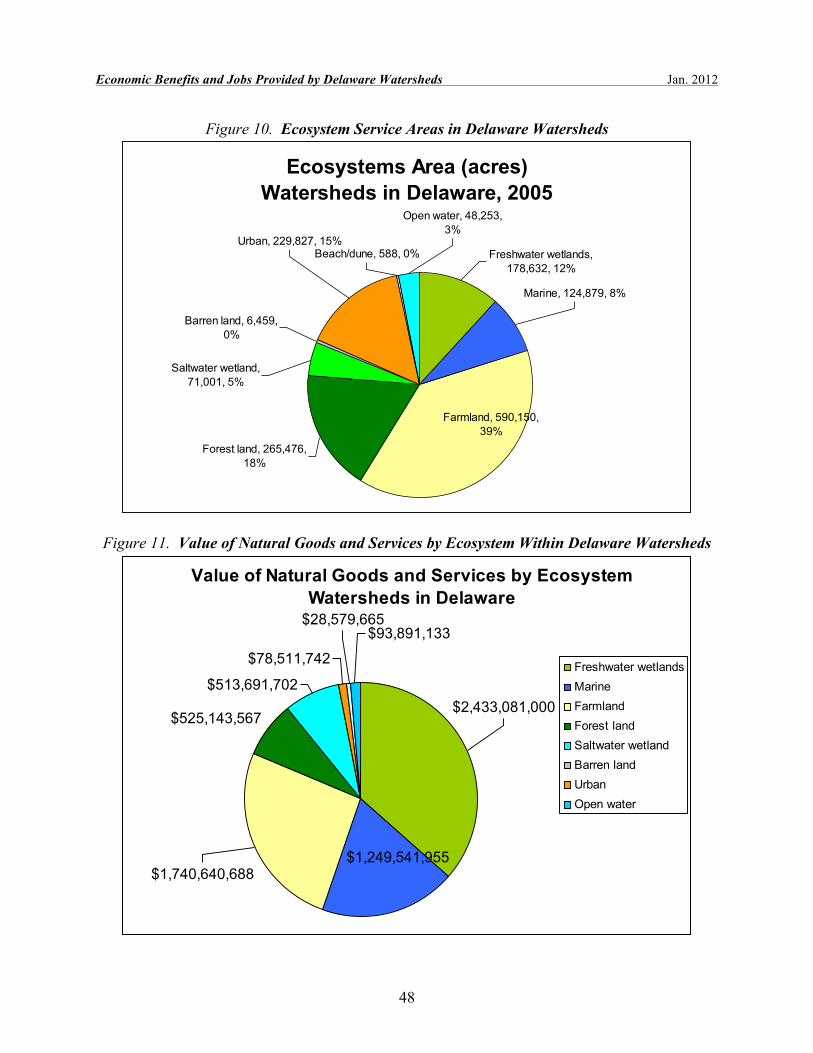
Economic Benefits and Jobs Provided by Delaware Watersheds Jan. 2012
48
Figure 10. Ecosystem Service Areas in Delaware Watersheds
Ecosystems Area (acres)Watersheds in Delaware, 2005
Freshwater wetlands, 178,632, 12%
Open water, 48,253, 3%
Beach/dune, 588, 0%Urban, 229,827, 15%
Saltwater wetland, 71,001, 5%
Barren land, 6,459, 0%
Forest land, 265,476, 18%
Farmland, 590,150, 39%
Marine, 124,879, 8%
Figure 11. Value of Natural Goods and Services by Ecosystem Within Delaware Watersheds
Value of Natural Goods and Services by EcosystemWatersheds in Delaware
$525,143,567
$513,691,702
$78,511,742
$28,579,665
$1,249,541,955
$93,891,133
$1,740,640,688
$2,433,081,000
Freshwater wetlandsMarineFarmlandForest landSaltwater wetlandBarren landUrbanOpen water

Economic Benefits and Jobs Provided by Delaware Watersheds Jan. 2012
49
Figure 12. Value of Natural Goods and Services by Watershed Within Delaware
Ecosystem Services ValueWatersheds in Delaware
Piedmont, $200,865,690
Delaware Estuary,
$5,473,269,054Chesapeake,
$2,191,701,751
Inland Bays, $2,023,324,947
Piedmont Delaware Estuary Chesapeake Inland Bays
Figure 13. Ecosystem Service Value (2010 dollars) Within Delaware Watersheds
Ecosystem Services Value Watersheds in Delaware
$79 M$94 M
$514 M$525 M
$1,249 M
$1,741 M
$2,433 M
0
1,000,000,000
2,000,000,000
3,000,000,000
Freshwate
r wetl
ands
Farmlan
d
Marine
Fores
t land
Saltwate
r wetl
and
Open w
ater
Urban
$/yr

Economic Benefits and Jobs Provided by Delaware Watersheds Jan. 2012
50
Figure 14. Value of Natural Goods and Services by Watershed Within Delaware
Value of Natural Goods and Services (2010 $M)Watersheds in Delaware
$2,424
$2,049 $1,993
$197
0
500
1,000
1,500
2,000
2,500
3,000
DelawareEstuary
Chesapeake Inland Bays Piedmont
$/yr
(mill
ions
)
Figure 15. Value of Natural Goods and Services by Watershed Within Delaware
Value of Natural Goods & Services (2010 $ per acre)Watersheds in Delaware
$6,147
$4,562$3,876
$1,694
0
2,000
4,000
6,000
8,000
Inland Bays Chesapeake DelawareEstuary
Piedmont
$/ac
re/y
r

Economic Benefits and Jobs Provided by Delaware Watersheds Jan. 2012
51
Ecosystem services in Delaware watersheds using the NJDEP and USDA farm-good values are worth $6.7 billion (2010 dollars) or $216.6 billion (NPV), which are conservatively in the lower end of the range. If lower per-acre estimates of ecosystem services from other studies were used instead of the NJDEP values, ecosystem services in Delaware watersheds would be $3.7 billion or NPV = $121.5 billion (Table 37). If higher per-acre estimates from other studies were used, the value of ecosystems in Delaware watersheds would be $20.1 billion or NPV = $654.6 billion (Table 38).
Estimate PV ($B) NPV ($B) Low 3.7 121.5 NJDEP 6.7 216.6 High 20.1 654.6
Table 37. Low Range of Ecosystem Services in Delaware Watersheds
Ecosystem Area (acres) $/acre/year PV ($) NPV ($) Freshwater wetlands 178,632 6,268 1,119,662,818 36,389,041,588 Marine 124,879 8,670 1,082,700,043 35,187,751,414 Farmland 590,150 1,387 818,538,139 26,602,489,502 Forest land 265,476 641 170,169,833 5,530,519,578 Saltwater wetland 71,001 6,269 445,102,324 14,465,825,530 Barren land 6,459 0 0 0 Urban 229,827 296 68,028,662 2,210,931,501 Beach/dune 588 42,149 24,763,638 804,818,235 Open water 48,253 217 10,470,901 340,304,283 Total acre 1,515,265 3,739,436,358 121,531,681,631 sq. mi. 2,368
1. Cecil Co., Md., 2006. 2. NJDEP, 2007. 3. Wilderness Society, 2001. 4. Peconic Estuary, 1995. 5. Ingraham and Foster, 2008. 6. Breunig, 2003.
Table 38. High Range of Ecosystem Services in Delaware Watersheds Ecosystem Area (acre) $/acre/year PV ($) NPV ($)
Freshwater wetlands 178,632 43,685 7,803,521,093 253,614,435,509 Marine 124,879 8,670 1,082,700,043 35,187,751,414 Farmland 590,150 9,979 5,889,107,487 191,395,993,323 Forest land 265,476 12,033 3,194,467,399 103,820,190,465 Saltwater wetland 71,001 28,146 1,998,380,924 64,947,380,025 Barren land 6,459 0 0 0 Urban 229,827 296 68,028,662 2,210,931,501 Beach/dune 588 42,149 24,763,638 804,818,235 Open water 48,253 1,686 81,354,558 2,644,023,135 Total acre 1,515,265 20,142,323,804 654,625,523,607 sq. mi. 2,368
1. Cecil Co., Md., 2006. 2. NJDEP, 2007. 3. Wilderness Society, 2001. 4. Peconic Estuary, 1995. 5. Ingraham and Foster, 2008. 6. Breunig, 2003.

Economic Benefits and Jobs Provided by Delaware Watersheds Jan. 2012
52
5. Jobs and Wages
Delaware watersheds are jobs engines with water resources and habitat that supports over 70,000 direct and indirect jobs with over $2 billion in annual wages in the coastal, farm, ecotourism, watershed organization, water supply/wastewater, recreation, and port industries (Table 39).
Table 39. Jobs and Wages Directly and Indirectly Related to Delaware Watersheds
Sector Jobs Wages ($ million) Data Source Direct Watershed-Related 18,926 402 U.S. Bureau of Labor Statistics (2009) Indirect Watershed-Related 22,711 322 U.S. Census Bureau (2009) Coastal 15,174 268 National Coastal Econ. Program (2009) Farm 28,328 1,410 Awokuse et al., (2010) Fishing/Hunting/Birding 9,248 304 U.S. Fish and Wildlife Service (2008) National Wildlife Refuge 198 6 Carver and Caudill (2007) Wetlands 584 19 NOAA Coastal Services Center (2011) Watershed Organizations 115 5.5 WRA and DRBC (2010) Ports 4,601 307 Martins Associates (2007)) Tourism 31,050 931 Delaware Tourism Office (2008) Water Supply Utilities 275 15 WRA and DRBC (2010) Wastewater Utilities 207 9 WRA and DRBC (2010) Delaware Watersheds >70,000 >$2 billion
Jobs and wages in Delaware watersheds were obtained from U.S. Bureau of Labor Statistics (2009) and U.S. Census Bureau (2009) databases (Tables 40 and 41, Appendix A). Note the NAICS database does not include jobs for certain known water-related industries, such as commercial fishing and boat building; therefore, the columns are left blank. Hence, the number of watershed-related jobs is likely undercounted. Delaware watershed-related jobs are tabulated for three scenarios: 1. Total jobs in Delaware counties determined by NAICS code (formerly SIC code). 2. Direct Delaware watershed-related jobs such as water/sewer construction, living resources,
maritime, tourism/recreation, ports, environmental services, and water/wastewater management determined for each NAICS code by county and by whole basin.
3. Indirect jobs/wages funded by purchases of goods/services by direct jobs earners estimated by a multiplier of 2.2 to direct jobs and 1.8 to direct wages (Latham and Stapleford, 1990). Therefore, every direct watershed job funds 1.2 indirect jobs, and a dollar in direct wages funds $0.80 in indirect wages.
U.S. Bureau of Labor Statistics data (2009) indicate there were 394,918 jobs in Delaware counties with wages of $18.8 billion including: • Kent County (60,145 jobs, $2.2 billion in wages) • New Castle County (266,134 jobs, $14.3 billion in wages) • Sussex County (68,639 jobs, $2.3 billion in wages)

Economic Benefits and Jobs Provided by Delaware Watersheds Jan. 2012
53
Organizations directly associated with Delaware watersheds (such as water/sewer construction, water utilities, fishing, recreation, tourism, and ports) employed 18,926 people with $402 million in wages. Organizations indirectly related to Delaware watersheds (based on multipliers of 2.2 for jobs and 1.8 for salaries) employed 22,711 people with $322 million in wages.
Table 40. Delaware Watershed Jobs and Wages, 2009
State/County
(1) Total
Delaware Jobs
(2) Direct
Watershed Jobs
(3) Indirect
Watershed Jobs
(1) Total
Delaware Wages
($ million)
(2) Direct
Watershed Wages
($ million)
(3) Indirect
Watershed Wages
($ billion) Delaware 394,918 18,926 22,711 18,800 402 322 Kent 60,145 2,200 New Castle 266,134 14,300 Sussex 68,639 2,300
Jobs and wages: (1) in Delaware counties, (2) direct watershed-related, and (3) indirect watershed related, in 2009.

Economic Benefits and Jobs Provided by Delaware Watersheds Jan. 2012
54
Table 41. Direct and Indirect Watershed-Related Jobs in Delaware, 2009
Sector Industry 1997
NAICS Code
Direct Watershed
Jobs1
Direct Watershed
Wages1 (x$1,000)
Indirect Watershed
Jobs2
Indirect Watershed
Wages2 (x$1,000)
Construction Marine-Related 237,120 Water and Sewer 23,711 691 27,474 829 21,979 Construction 237,990 157 7,098 188 5,678 Living Resources Fish Hatcheries 112,511 0 0 Aquaculture 112,512 0 0 Fishing 11,411 0 0 Finfish Fishing 114,111 0 0 Shellfish Fishing 114,112 0 0 Seafood Markets 445,220 49 1,809 59 1,447 Seafood Process. 31,171 0 0 Comm. Fisheries 0 0 Minerals Sand & Gravel 212,321 0 0 212,322 0 0 Oil & Gas 541,360 20 940 24 752 Ship/Boat Building Boat Bldg. Repair 336,612 0 0 Shipbuilding 0 0 Tourism/Recreation Recreation 487,990 0 0 611,620 0 0 532,292 0 0 Amusement 713,990 393 5,768 472 4,614 Boat Dealers 441,222 247 9,361 296 7,489 Restaurants 722,110 4,643 217,234 5,572 173,787 722,211 8,496 5,127 10,195 4,102 722,212 331 4,845 397 3,876 722,213 1,178 16,886 1,414 13,509 Hotels & Lodging 721,110 813 14,591 976 11,673 721,191 0 0 Marinas 713,930 0 0 RV Park/Camps 721,211 131 4,514 157 3,611 Scenic Tours 487,210 22 491 26 393 Sporting Good 339,920 0 0 Zoos, Aquaria 712,130 0 0 712,190 0 0 Transportation Navigation Shipping 488,330 0 0 Marine Cargo 488,320 438 19,927 526 15,942 Search/Navigation 334,511 0 0 Warehousing 493,110 391 17,174 469 13,739 493,120 0 0 Ports 0 0 Dredging/Disposal 0 0 Environmental Environ. Organiz. 813,312 98 3,633 118 2,906 Environ. Consult. 54,162 241 12,267 289 9,814 Water/Wastewater Water/Sewage 2,213 293 21,549 352 17,239 Waste Management 562 241 10,120 289 8,096 Septic Tank 562,991 53 1,738 64 1,390 Total 18,926 402,546 22,712 322,036
1. Direct jobs/wages are those directly related to Delaware watersheds. 2. Indirect jobs/wages are derived from purchases of goods and services by direct jobs earners by multipliers of 2.2 for jobs and 1.8 for wages.

Economic Benefits and Jobs Provided by Delaware Watersheds Jan. 2012
55
National Coastal Economy The National Ocean Economic Program (2009) published a report that summarized the coastal economy in the United States for the following industrial sectors: Marine Transportation, Tourism and Recreation, Living Marine Resources, Marine Construction, Ship and Boat Building, Mineral Extraction. According to the NOEP (2009), coastal counties in Delaware contributed 15,174 coastal jobs, representing $268 million in annual wages and $489.5 million toward the state GDP (Table 42).
Table 42. Coastal Employment, Wages, and GDP in Delaware Sector Employment Wages
($ million) GDP
($ million) Delaware 15,174 268.0 489.5 Marine Construction Living Resources 442 10.3 19.2 Offshore Minerals Tourism & Recreation 12,997 188.5 373.9 Marine Transportation 2,180 66.0 90.5 Ship and Boat Building
Source: NOEP, 2009 Farm Jobs A study by the University of Delaware’s College of Agriculture and Natural Resources indicates that the agriculture economy contributes 28,328 direct, indirect, and induced jobs with $1.41 billion in annual wages in Delaware (Awokuse et al., 2010). Sussex County agriculture is responsible for 15,378 jobs, Kent County for 8,502 jobs, and New Castle County for 4,448 jobs (Table1).
Table 43. Agriculture Jobs and Wages in Delaware State/County Employment Wages ($ million)
State of Delaware 28,328 1,410 Direct 16,565 828 Indirect 5,791 346 Induced 5,972 236 New Castle County 4,448 261 Direct 2,341 139 Indirect 1,016 71 Induced 1,091 51 Kent County 8,502 438 Direct 4,609 246 Indirect 2,004 120 Induced 1,889 72 Sussex County 15,378 711 Direct 9,615 442 Indirect 2,771 156 Induced 2,992 113

Economic Benefits and Jobs Provided by Delaware Watersheds Jan. 2012
56
Fishing/Hunting/Bird and Wildlife Recreation Jobs The 2007 NJDEP study estimated the average annual salary per ecotourism job is $32,843, using figures from the 2001 U.S. Fish and Wildlife Service report on fishing, hunting, and wildlife-associated recreation. Fishing, hunting, and bird/wildlife-associated recreation in Delaware watersheds account for $268.8 million in annual economic activity in 2006 dollars. Converting 2006 dollars to 2010 dollars at 3 percent per year, the annual economic activity is $303.7 million, and ecotourism accounts for 9,248 jobs (Table 44). While this estimate of ecotourism jobs is not exact, it provides a reasonable estimate of the jobs provided by fishing, hunting, and bird/wildlife-associated recreation in Delaware watersheds.
Table 44. Jobs from Fishing, Hunting, and Wildlife Recreation in Delaware Watersheds
Recreation Activity
Delaware Recreation Activity1
in 2006 dollars ($ million)
Delaware Recreation
Activity in 2010 dollars
($ million)
Delaware Recreation
Jobs2
in 2010 dollars
Fishing 96.7 109.3 3,327 Trip-Related 48.5 54.8 1,669 Equipment/other 48.2 54.5 1,658 Hunting 41.3 46.7 1,421 Trip-Related 13.6 15.4 468 Equipment/other 27.7 31.3 953 Wildlife/Birding 130.8 147.8 4,501 Trip-Related 13.1 14.8 451 Equipment/other 117.7 133.0 4,050 Total 268.8 303.8 9,249
1. USFWS, 2006. 2. Jobs estimated at $32,843 average salary. Wetland Jobs The NOAA Coastal Services Center (2011) estimates that coastal wetlands provide habitat that supports 584 commercial, recreational, and charter fishing jobs in Delaware with $13.4 million in business output and 19.3 million in wages (Table 45). Table 45. Fishery Jobs, Wages, and Business Output Supported by Coastal Wetlands in Del.
Fishing
Jobs Business Output ($ million)
Self-employed Revenue ($ million)
State of Delaware 584 13.4 19.3 New Castle County 91 1.5 4.3
Kent County 76 0.4 2 Sussex County 129 3.1 3.1
Source: NOAA Coastal Services Center, 2011
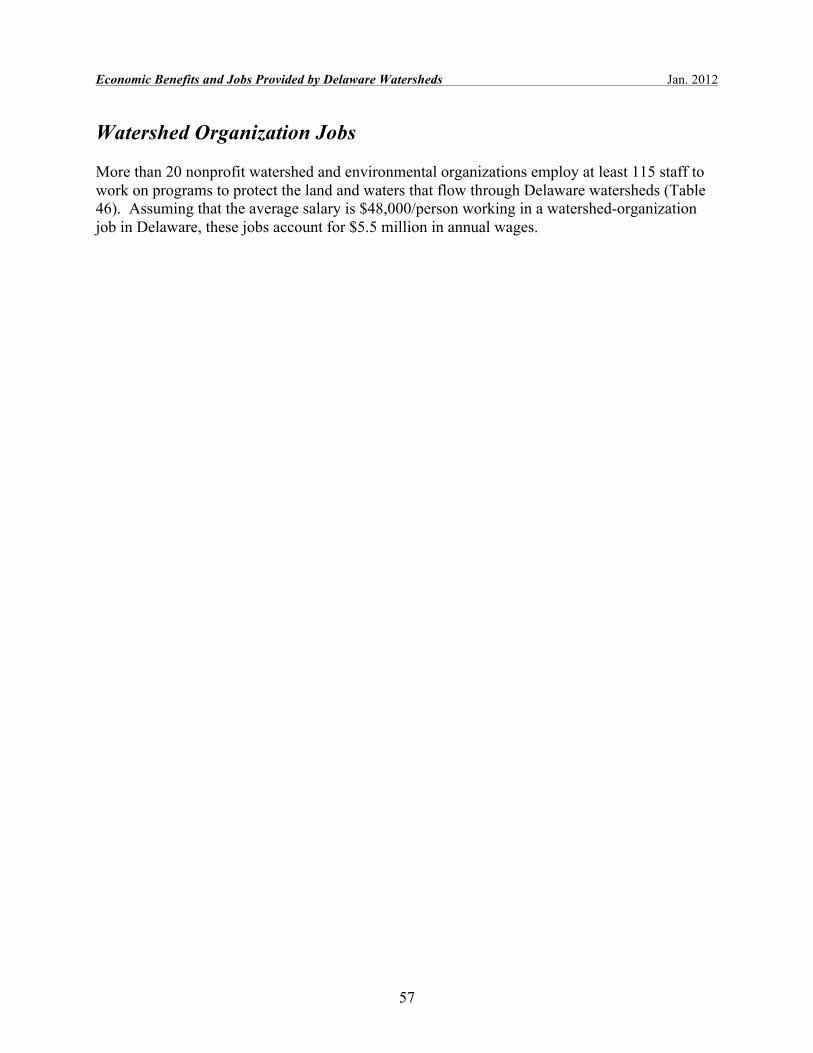
Economic Benefits and Jobs Provided by Delaware Watersheds Jan. 2012
57
Watershed Organization Jobs More than 20 nonprofit watershed and environmental organizations employ at least 115 staff to work on programs to protect the land and waters that flow through Delaware watersheds (Table 46). Assuming that the average salary is $48,000/person working in a watershed-organization job in Delaware, these jobs account for $5.5 million in annual wages.
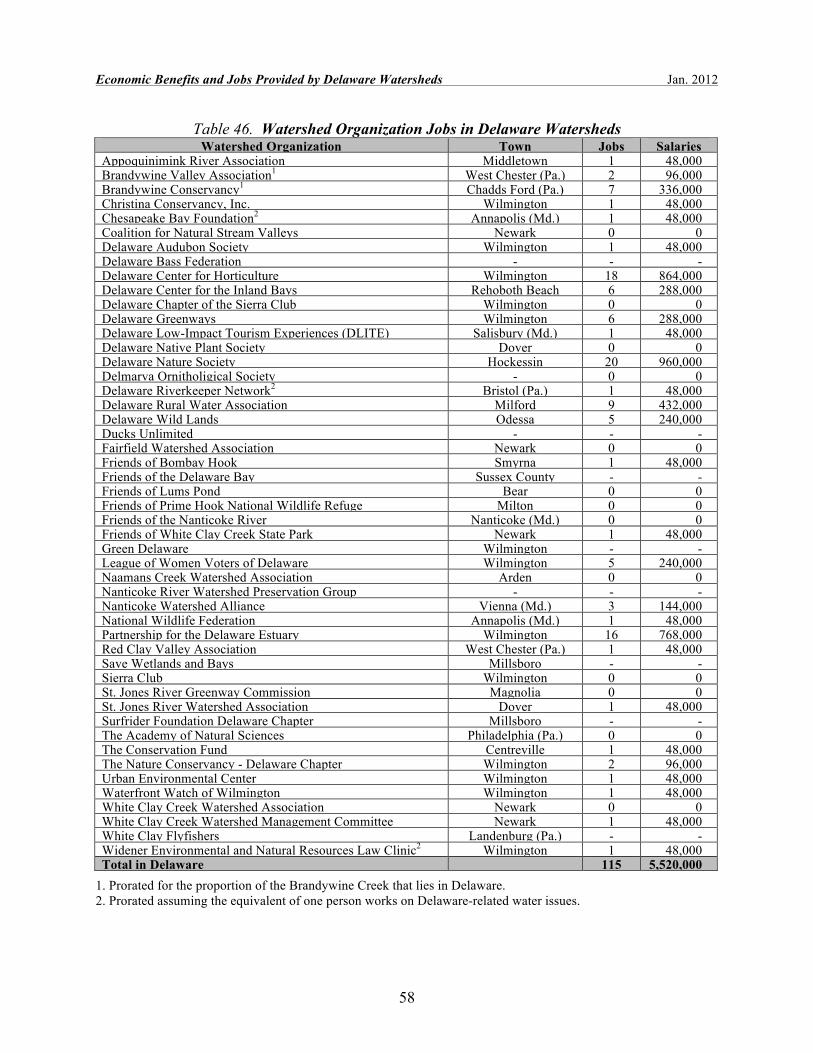
Economic Benefits and Jobs Provided by Delaware Watersheds Jan. 2012
58
Table 46. Watershed Organization Jobs in Delaware Watersheds Watershed Organization Town Jobs Salaries
Appoquinimink River Association Middletown 1 48,000 Brandywine Valley Association1 West Chester (Pa.) 2 96,000 Brandywine Conservancy1 Chadds Ford (Pa.) 7 336,000 Christina Conservancy, Inc. Wilmington 1 48,000 Chesapeake Bay Foundation2 Annapolis (Md.) 1 48,000 Coalition for Natural Stream Valleys Newark 0 0 Delaware Audubon Society Wilmington 1 48,000 Delaware Bass Federation - - - Delaware Center for Horticulture Wilmington 18 864,000 Delaware Center for the Inland Bays Rehoboth Beach 6 288,000 Delaware Chapter of the Sierra Club Wilmington 0 0 Delaware Greenways Wilmington 6 288,000 Delaware Low-Impact Tourism Experiences (DLITE) Salisbury (Md.) 1 48,000 Delaware Native Plant Society Dover 0 0 Delaware Nature Society Hockessin 20 960,000 Delmarva Ornitholigical Society - 0 0 Delaware Riverkeeper Network2 Bristol (Pa.) 1 48,000 Delaware Rural Water Association Milford 9 432,000 Delaware Wild Lands Odessa 5 240,000 Ducks Unlimited - - - Fairfield Watershed Association Newark 0 0 Friends of Bombay Hook Smyrna 1 48,000 Friends of the Delaware Bay Sussex County - - Friends of Lums Pond Bear 0 0 Friends of Prime Hook National Wildlife Refuge Milton 0 0 Friends of the Nanticoke River Nanticoke (Md.) 0 0 Friends of White Clay Creek State Park Newark 1 48,000 Green Delaware Wilmington - - League of Women Voters of Delaware Wilmington 5 240,000 Naamans Creek Watershed Association Arden 0 0 Nanticoke River Watershed Preservation Group - - - Nanticoke Watershed Alliance Vienna (Md.) 3 144,000 National Wildlife Federation Annapolis (Md.) 1 48,000 Partnership for the Delaware Estuary Wilmington 16 768,000 Red Clay Valley Association West Chester (Pa.) 1 48,000 Save Wetlands and Bays Millsboro - - Sierra Club Wilmington 0 0 St. Jones River Greenway Commission Magnolia 0 0 St. Jones River Watershed Association Dover 1 48,000 Surfrider Foundation Delaware Chapter Millsboro - - The Academy of Natural Sciences Philadelphia (Pa.) 0 0 The Conservation Fund Centreville 1 48,000 The Nature Conservancy - Delaware Chapter Wilmington 2 96,000 Urban Environmental Center Wilmington 1 48,000 Waterfront Watch of Wilmington Wilmington 1 48,000 White Clay Creek Watershed Association Newark 0 0 White Clay Creek Watershed Management Committee Newark 1 48,000 White Clay Flyfishers Landenburg (Pa.) - - Widener Environmental and Natural Resources Law Clinic2 Wilmington 1 48,000 Total in Delaware 115 5,520,000
1. Prorated for the proportion of the Brandywine Creek that lies in Delaware. 2. Prorated assuming the equivalent of one person works on Delaware-related water issues.
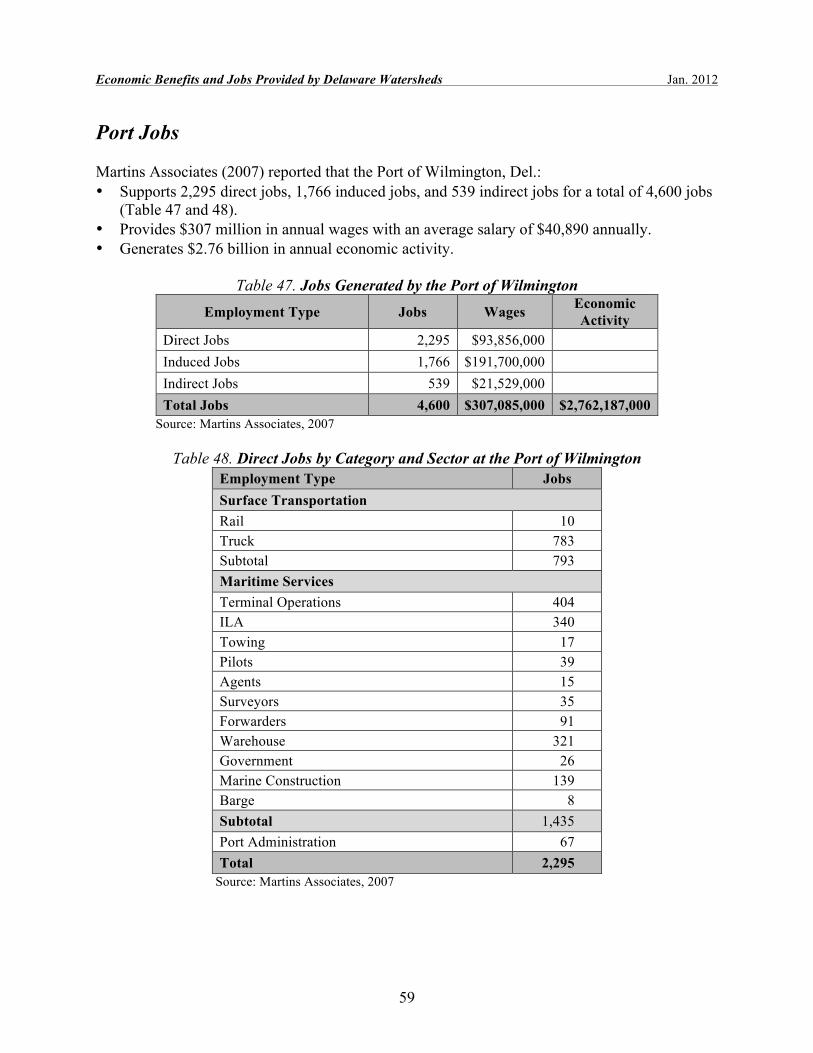
Economic Benefits and Jobs Provided by Delaware Watersheds Jan. 2012
59
Port Jobs Martins Associates (2007) reported that the Port of Wilmington, Del.: • Supports 2,295 direct jobs, 1,766 induced jobs, and 539 indirect jobs for a total of 4,600 jobs
(Table 47 and 48). • Provides $307 million in annual wages with an average salary of $40,890 annually. • Generates $2.76 billion in annual economic activity.
Table 47. Jobs Generated by the Port of Wilmington Employment Type Jobs Wages Economic
Activity Direct Jobs 2,295 $93,856,000 Induced Jobs 1,766 $191,700,000 Indirect Jobs 539 $21,529,000 Total Jobs 4,600 $307,085,000 $2,762,187,000
Source: Martins Associates, 2007
Table 48. Direct Jobs by Category and Sector at the Port of Wilmington Employment Type Jobs Surface Transportation Rail 10 Truck 783 Subtotal 793 Maritime Services Terminal Operations 404 ILA 340 Towing 17 Pilots 39 Agents 15 Surveyors 35 Forwarders 91 Warehouse 321 Government 26 Marine Construction 139 Barge 8 Subtotal 1,435 Port Administration 67 Total 2,295
Source: Martins Associates, 2007

Economic Benefits and Jobs Provided by Delaware Watersheds Jan. 2012
60
Tourism A vibrant tourism economy relies on clean water and healthy habitat in Delaware watersheds. According to data from the Delaware Tourism Office (2008), the Delaware tourism economy produced total market value of goods and services during FY 2008 of at least $1.9 billion. In 2008, 31,050 people were employed in Delaware's tourism industry (Table 49). The Delaware tourism industry is the 5th largest employer in the state, comprising 8.3 percent of Delaware's employment.
Table 49. Tourism Jobs in Delaware County Jobs
Kent 5,390 New Castle 17,930 Sussex 7,730 Total 31,050
Source: Delaware Tourism Office, 2008
Water Supply–Utility Jobs Public and private water utilities withdraw over 102 mgd of drinking water from surface-water and groundwater supplies in Delaware watersheds. According to the American Water Works Association, the average salary of a water-system employee is $55,407. The total number of jobs provided by water utilities in Delaware watersheds is 275, with annual wages of $15 million (Table 50).
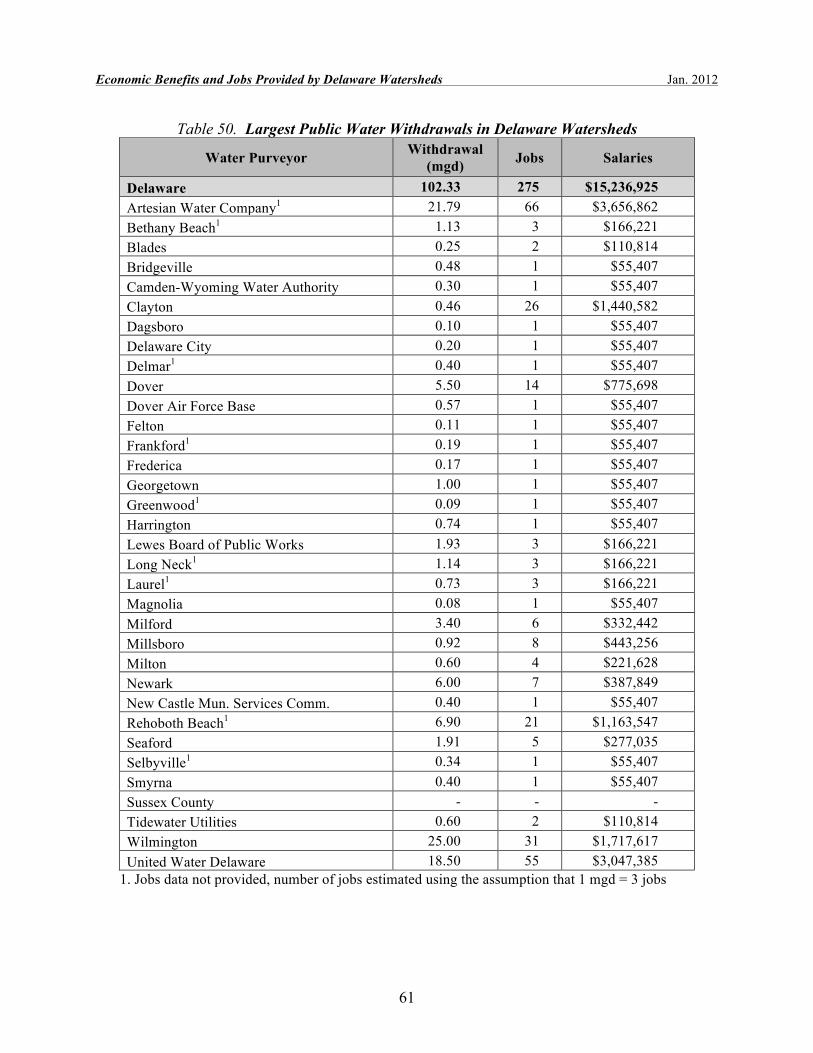
Economic Benefits and Jobs Provided by Delaware Watersheds Jan. 2012
61
Table 50. Largest Public Water Withdrawals in Delaware Watersheds
Water Purveyor Withdrawal (mgd) Jobs Salaries
Delaware 102.33 275 $15,236,925 Artesian Water Company1 21.79 66 $3,656,862 Bethany Beach1 1.13 3 $166,221 Blades 0.25 2 $110,814 Bridgeville 0.48 1 $55,407 Camden-Wyoming Water Authority 0.30 1 $55,407 Clayton 0.46 26 $1,440,582 Dagsboro 0.10 1 $55,407 Delaware City 0.20 1 $55,407 Delmar1 0.40 1 $55,407 Dover 5.50 14 $775,698 Dover Air Force Base 0.57 1 $55,407 Felton 0.11 1 $55,407 Frankford1 0.19 1 $55,407 Frederica 0.17 1 $55,407 Georgetown 1.00 1 $55,407 Greenwood1 0.09 1 $55,407 Harrington 0.74 1 $55,407 Lewes Board of Public Works 1.93 3 $166,221 Long Neck1 1.14 3 $166,221 Laurel1 0.73 3 $166,221 Magnolia 0.08 1 $55,407 Milford 3.40 6 $332,442 Millsboro 0.92 8 $443,256 Milton 0.60 4 $221,628 Newark 6.00 7 $387,849 New Castle Mun. Services Comm. 0.40 1 $55,407 Rehoboth Beach1 6.90 21 $1,163,547 Seaford 1.91 5 $277,035 Selbyville1 0.34 1 $55,407 Smyrna 0.40 1 $55,407 Sussex County - - - Tidewater Utilities 0.60 2 $110,814 Wilmington 25.00 31 $1,717,617 United Water Delaware 18.50 55 $3,047,385
1. Jobs data not provided, number of jobs estimated using the assumption that 1 mgd = 3 jobs

Economic Benefits and Jobs Provided by Delaware Watersheds Jan. 2012
62
Wastewater Utility Jobs Twenty-three wastewater utilities discharge over 168 million gallons per day of treated wastewater to Delaware watersheds. The wage information is computed using the assumption that the average wastewater utility salary is $40,000/year. These wastewater utilities employ 207 employees who earn $9.2 million in wages annually (Table 51).
Table 51. Jobs at NPDES Wastewater Utilities in Delaware Watersheds
NPDES ID Facility Discharge (mgd) Jobs Salaries
DE0051063 Hanover Foods 0.000 0 0 DE0021709 Greenville Country Club 0.015 2 80,000
DE0021768 Winterthur1 0.025 1 40,000
DE0050725 Mobile Gardens Trailer Park 0.028 0 0 DE0021539 Port Penn STP1 0.050 1 40,000
DE0050083 Lums Pond State Park 0.105 1 40,000
DE0000035 Invista1 0.311 1 40,000
DE0021491 Milton STP 0.350 0 0 DE0050547 Middletown-Odessa-Townsend1 0.500 1 40,000
DE0050164 Millsboro STP 0.566 8 320,000 DE0021555 Delaware City STP 0.570 0 0 DE0020125 Laurel STP 0.700 3 120,000 DE0020036 Harrington STP 0.750 1 40,000 DE0020249 Bridgeville STP 0.800 2 80,000
DE0020010 Selbyville STP1 1.250 3 120,000
DE0021512 Lewes STP 1.500 4 160,000 DE0020265 Seaford STP 2.000 6 240,000 DE0020028 Rehoboth Beach STP 3.400 11 440,000
DE0050008 South Coastal Regional STP1 6.000 18 720,000 DE0020320 Wilmington Wastewater Plant 134.000 90 4,500,000 DE0020338 Kent County STP 15.000 54 2,160,000 Total 207 9,180,000 1. Jobs data not provided, number of jobs estimated using the assumption that 1 mgd = 3 jobs

Economic Benefits and Jobs Provided by Delaware Watersheds Jan. 2012
63
Appendix - Employment Codes by Industry, 2009 Industry NAICS
Code Agriculture, Forestry, Fishing and Hunting 11 Crop Production 111 Animal Production 112 Aquaculture 1125 Forestry and Logging 113 Fishing, Hunting and Trapping 114 Fishing 1141 Support Activities for Agriculture and Forestry 115 Mining, Quarrying, and Oil and Gas Extraction 21 Oil and Gas Extraction 211 Mining (except Oil and Gas) 212 Nonmetallic Mineral Mining and Quarrying 2123 Support Activities for Mining 213 Utilities 22 Utilities 221 Electric Power Generation, Transmission and Distribution 2211 Natural Gas Distribution 2212 Water, Sewage and Other Systems 2213 Construction 23 Construction of Buildings 236 Residential Building Construction 2361 Nonresidential Building Construction 2362 Heavy and Civil Engineering Construction 237 Land Subdivision 2372 Highway, Street, and Bridge Construction 2373 Other Heavy and Civil Engineering Construction 2379 Specialty Trade Contractors 238 Manufacturing 31 Food Manufacturing 311 Seafood Product Preparation and Packaging 3117 Beverage and Tobacco Product Manufacturing 312 Textile Mills 313 Textile Product Mills 314 Apparel Manufacturing 315 Apparel Knitting Mills 3151 Leather and Allied Product Manufacturing 316 Wood Product Manufacturing 321 Paper Manufacturing 322 Petroleum and Coal Products Manufacturing 324 Chemical Manufacturing 325 Basic Chemical Manufacturing 3251
Resin, Synthetic Rubber, and Artificial Synthetic Fibers and Filaments Manufacturing 3252
Pesticide, Fertilizer, and Other Agricultural Chemical Manufacturing 3253 Pharmaceutical and Medicine Manufacturing 3254

Economic Benefits and Jobs Provided by Delaware Watersheds Jan. 2012
64
Paint, Coating, and Adhesive Manufacturing 3255 Soap, Cleaning Compound, and Toilet Preparation Manufacturing 3256 Other Chemical Product and Preparation Manufacturing 3259 Plastics and Rubber Products Manufacturing 326 Nonmetallic Mineral Product Manufacturing 327 Cement and Concrete Product Manufacturing 3273 Lime and Gypsum Product Manufacturing 3274 Other Nonmetallic Mineral Product Manufacturing 3279 Primary Metal Manufacturing 331 Fabricated Metal Product Manufacturing 332 Machinery Manufacturing 333 Computer and Electronic Product Manufacturing 334 Computer and Peripheral Equipment Manufacturing 3341 Communications Equipment Manufacturing 3342 Audio and Video Equipment Manufacturing 3343 Semiconductor and Other Electronic Component Manufacturing 3344
Navigational, Measuring, Electromedical, and Control Instruments Manufacturing 3345
Manufacturing and Reproducing Magnetic and Optical Media 3346 Electrical Equipment, Appliance, and Component Manufacturing 335 Transportation Equipment Manufacturing 336 Motor Vehicle Manufacturing 3361 Motor Vehicle Body and Trailer Manufacturing 3362 Motor Vehicle Parts Manufacturing 3363 Aerospace Product and Parts Manufacturing 3364 Railroad Rolling Stock Manufacturing 3365 Ship and Boat Building 3366 Other Transportation Equipment Manufacturing 3369 Furniture and Related Product Manufacturing 337 Miscellaneous Manufacturing 339 Wholesale Trade 42 Merchant Wholesalers, Durable Goods 423 Merchant Wholesalers, Nondurable Goods 424 Wholesale Electronic Markets and Agents and Brokers 425 Retail Trade 44 Motor Vehicle and Parts Dealers 441 Furniture and Home Furnishings Stores 442 Electronics and Appliance Stores 443 Electronics and Appliance Stores 4431 Building Material and Garden Equipment and Supplies Dealers 444 Food and Beverage Stores 445 Health and Personal Care Stores 446 Gasoline Stations 447 Clothing and Clothing Accessories Stores 448 Sporting Goods, Hobby, Book, and Music Stores 451 General Merchandise Stores 452 Miscellaneous Store Retailers 453 Nonstore Retailers 454 Transportation and Warehousing 48 Air Transportation 481

Economic Benefits and Jobs Provided by Delaware Watersheds Jan. 2012
65
Scheduled Air Transportation 4811 Nonscheduled Air Transportation 4812 Rail Transportation 482 Rail Transportation 4821 Water Transportation 483 Deep Sea, Coastal, and Great Lakes Water Transportation 4831 Inland Water Transportation 4832 Support Activities for Water Transportation 4883 Truck Transportation 484 General Freight Trucking 4841 Specialized Freight Trucking 4842 Transit and Ground Passenger Transportation 485 Urban Transit Systems 4851 Interurban and Rural Bus Transportation 4852 Taxi and Limousine Service 4853 School and Employee Bus Transportation 4854 Charter Bus Industry 4855 Other Transit and Ground Passenger Transportation 4859 Pipeline Transportation 486 Pipeline Transportation of Crude Oil 4861 Information 51 Publishing Industries (except Internet) 511 Motion Picture and Sound Recording Industries 512 Broadcasting (except Internet) 515 Telecommunications 517 Data Processing, Hosting, and Related Services 518 Other Information Services 519 Finance and Insurance 52 Monetary Authorities-Central Bank 521 Credit Intermediation and Related Activities 522
Securities, Commodity Contracts, and Other Financial Investments and Related Activities 523
Insurance Carriers and Related Activities 524 Funds, Trusts, and Other Financial Vehicles 525 Real Estate and Rental and Leasing 53 Real Estate 531 Rental and Leasing Services 532 Lessors of Nonfinancial Intangible Assets (except Copyrighted Works) 533 Professional, Scientific, and Technical Services 54 Professional, Scientific, and Technical Services 541 Management, Scientific, and Technical Consulting Services 5416 Scientific Research and Development Services 5417 Management of Companies and Enterprises 55 Management of Companies and Enterprises 551 Administrative and Support and Waste Management and Remediation Services 56 Administrative and Support Services 561 Travel Arrangement and Reservation Services 5615 Waste Management and Remediation Services 562 Educational Services 61 Educational Services 611
Economic Benefits and Jobs Provided by Delaware Watersheds Jan. 2012
66
Colleges, Universities, and Professional Schools 6113 Technical and Trade Schools 6115 Educational Support Services 6117 Health Care and Social Assistance 62 Ambulatory Health Care Services 621 Hospitals 622 Nursing and Residential Care Facilities 623 Social Assistance 624 Arts, Entertainment, and Recreation 71 Performing Arts, Spectator Sports, and Related Industries 711 Museums, Historical Sites, and Similar Institutions 712 Amusement, Gambling, and Recreation Industries 713 Other Amusement and Recreation Industries 7139 Accommodation and Food Services 72 Accommodation 721 Traveler Accommodation 7211 RV (Recreational Vehicle) Parks and Recreational Camps 7212 Rooming and Boarding Houses 7213 Food Services and Drinking Places 722 Other Services (except Public Administration) 81 Repair and Maintenance 811 Personal and Laundry Services 812 Religious, Grantmaking, Civic, Professional, and Similar Organizations 813 Social Advocacy Organizations 8133 Business, Professional, Labor, Political, and Similar Organizations 8139 Private Households 814 Public Administration 92 Executive, Legislative, and Other General Government Support 921 Justice, Public Order, and Safety Activities 922 Administration of Human Resource Programs 923 Administration of Environmental Quality Programs 924 Administration of Housing Programs, Urban Planning, Community Development 925 Administration of Economic Programs 926 Space Research and Technology 927 National Security and International Affairs 928
Source: U. S. Bureau of Labor Statistics

Economic Benefits and Jobs Provided by Delaware Watersheds Jan. 2012
67
References
Austin, J. C., S. Anderson, P. N. Courant, and R. E. Litan, 2007. America’s North Coast: A Benefit Cost Analysis of a Program to Protect and Restore the Great Lakes. The Brookings Institution, Great Lakes Economic Initiative. Austin, J. C., S. Anderson, P. N. Courant, and R. E. Litan, 2007. Healthy Waters, Strong Economy: The Benefits of Restoring the Great Lakes Ecosystem. The Brookings Institution. 16 pp. Awokuse, T. O., T. W. Ilvento, and Z. Johnston, 2010. The Impact of Agriculture on Delaware’sEconomy. University of Delaware, College of Agriculture and Natural Resources. 21 pp. Bockstael, N. E., K. E. McConnell, and I. E. Stroud, 1989. Measuring the Benefits of Improvements in Water Quality: the Chesapeake Bay. Marine Resource Economics. 6:1-18. Breunig, K., 2003. Losing Ground: At What Cost? Changes in Land Use and Their Impact on Habitat, Biodiversity, and Ecosystem Services in Massachusetts. Mass Audubon. 43 pp. Carson, Richard, T. and Robert Cameron Mitchell, 1993. The Value of Clean Water: The Public's Willingness to Pay for Boatable, Fishable, and Swimmable Quality Water. Water Resources Research, Vol. 29, No. 7. 2445-2454 pp. Carver, E. and J. Caudill, 2007. Banking on Nature 2006: The Economic Benefits to Local Communities of National Wildlife Refuge Visitation. U.S. Fish and Wildlife Service, Division of Economics. 372 pp. Chesapeake Bay Watershed Blue Ribbon Finance Panel, 2003. Saving a National Treasure: Financing the Cleanup of the Chesapeake Bay. A Report to the Chesapeake Executive Council. Corrozi, M. and M. Seymour, 2008. Water Rates in Delaware and Surrounding States. University of Delaware Institute for Public Administration, Water Resources Agency. Delaware Population Consortium, 2010. Annual Population Projections. Delaware Tourism Office, 2008. The Value of Tourism in Delaware. Delaware Tourism Office. Dover, Delaware. http://www.visitdelaware.com Dove, L. E. and R. M. Nyman eds., 1995. Living Resources of the Delaware Estuary. Delaware Estuary Program. 529 pp. Economy League of Greater Philadelphia, 2008. Maritime Commerce in Greater Philadelphia: Assessing Industry Trends and Growth Opportunities for Delaware River Ports. 78 pp.

Economic Benefits and Jobs Provided by Delaware Watersheds Jan. 2012
68
Frederick, K. D., T. VandenBerg, and J. Hansen, 1996. Economic Value of Freshwater in the United States. Discussion Paper 97-03. Resources for the Future. Washington, D.C. 37 pp. Great Lakes Coalition, 2010. Faces of Restoration, People Working Together to Restore the Great Lakes. 8 pp. Greeley-Polhemus Group, 1993. Final Report: Assessment of Selected Delaware Estuary Economic and Resource Values. Delaware Estuary Program Science & Tech. Advisory Committee. 117 pp. Helm, Erik C., George R. Parsons, and Tim Bondelid, 2004. Measuring the Economic Benefits of Water Quality Improvements to Recreational Users in Six Northeastern States: An Application of the Random Utility Maximization Model. Hodge, Ian and Charles Dunn, 1992. Valuing Rural Amenities. OECD publication. Ingraham, M. and S. G. Foster, 2008. The Value of Ecosystem Services Provided by the U.S. National Wildlife Refuge System in the Contiguous U. S. Ecological Economics. 67:608-818. Johnston, R. J., T. A. Grigalunas, J. J. Opaluch, Marisa Mazzotta, and J. Diamantedes, 2002. Valuing Estuarine Resource Services Using Economic and Ecological Models: The Peconic Estuary System Study. Coastal Management. 30:47-65. Krieger, Douglas J., 2001. Economic Value of Forest Ecosystem Services: A Review. An analysis prepared for the Wilderness Society. Latham, W. R. and J. E. Stapleford, 1987. Economic Impacts of the Delaware Estuary. Delaware Sea Grant College Program. No. DEL-SG-02-87. 12 pp. Leggett, C. G. and N. E. Bockstael, 2000. Evidence of the Effects of Water Quality on Residential Land Prices. Journal of Environmental Economics and Management. 39(2):121-144. Martins Associates, 2007. Prepared for the: Diamond State Port Corporation. The Local and Regional Economic Impacts of the Port of Wilmington Delaware. 33 pp. McCormick, B., 2010. Measuring the Economic Benefits of America’s Everglades Restoration. The Everglades Foundation. 173 pp. National Energy Technology Laboratory (NETL), 2009. Impact of Drought on U.S. Steam Electric Power Plant Cooling Water Intakes and Related Water Resource Management Issues. DOE/NETL-2009/1364. National Marine Manufacturers Association, 2010. Recreational Boating: Statistical Abstract.

Economic Benefits and Jobs Provided by Delaware Watersheds Jan. 2012
69
National Ocean Economics Program (NOEP). 2007. www.oceaneconomics.org/LMR/ fishSearch.asp National Ocean Economics Program (NOEP), 2009. State of the U.S. Ocean and Coastal Economies, Coastal and Ocean Economic Summaries of the Coastal States. 62 pp. New Jersey Department of Environmental Protection, 2007. Valuing New Jersey’s Natural Capital: An Assessment of the Economic Value of the State’s Natural Resources. NOAA Coastal Services Center, 2011. Coastal County Snapshots, Wetlands Benefits. www.csc.noaa.gov/snapshots Nowak, D. J., R. E. Hoehn, J. Wang, A. Lee, V. Krishnamurthy, and G. Schwetz, 2008. Urban Forest Assessment in Northern Delaware. Delaware Center for Horticulture and U.S. Forest Service. The Brookings Institution, 2007. Healthy Waters, Strong Economy: The Benefits of Restoring the Great Lakes Ecosystem. Trust for Public Land and American Water Works Association, 2004. Protecting the Source: Land Conservation and the Future of America’s Drinking Water. 51 pp. Trust for Public Land, 2009. How Much Value Does the City of Wilmington Receive from its Park and Recreation System? 20 pp. U.S. Census Bureau, 2009 and 2010. www.census.gov U.S. Department of Agriculture, 2009. 2007 Census of Agriculture. Delaware State & County Data. U.S. Department of Agriculture, 2010. Land Values and Cash Rents 2010 Summary. National Agricultural Statistics Services. U.S. Department of Labor, Bureau of Labor Statistics, 2009 and 2011. www.bls.gov U.S. Department of the Interior, Fish and Wildlife Service, 2008. 2006 National Survey of Fishing, Hunting, and Wildlife-Associated Recreation. U.S. Department of the Interior, U.S. Geological Survey, 2005. Estimated Use of Water in the United States in 2005. Circular 1344. U.S. Energy Information Administration, 2002. Inventory of Electric Utility Power Plants in the United States 2000. U. S. Department of Energy. Washington, D.C. 339 pp.

Economic Benefits and Jobs Provided by Delaware Watersheds Jan. 2012
70
U.S. Environmental Protection Agency. 1973. Benefit of Water Pollution Control on Property Values. EPA-‐600/5-‐73-‐005, October 1973. U.S. Environmental Protection Agency, 1995. A Framework for Measuring the Economic Benefits of Groundwater. Office of Water. Washington, D.C. U.S. Fish and Wildlife, 2008. 2006 National Survey of Fishing, Hunting, and Wildlife-Associated Recreation – Delaware. 81 pp. U.S. National Energy Technology Laboratory, 2009. Impact of Drought on U.S. Steam Electric Power Plant Cooling Water Intakes and Related Water Resource Management Issues. Washington, D.C. 191 pp. Weber, T., 2007. Ecosystem Services in Cecil County’s Green Infrastructure. The Conservation Fund. Annapolis, Maryland. Wise S., J. Braden, D. Ghalayini, J. Grant, C. Kloss, E. MacMullan, S. Morse1, F. Montalto, D. Nees, D. Nowak, S. Peck, S. Shaikh, and C. Yu. Year Unknown. Integrating Valuation Methods to Recognize Green Infrastructure's Multiple Benefits.

To the extent permitted by applicable State and Federal laws, the University of Delaware is committed to assuring equal opportunity to all persons and does not discrim-inate on the basis of race, creed, color, sex, age, religion, national origin, veteran or handicapped status, or gender identity and expression, or sexual orientation in itseducational programs, activities, admissions, or employment practices as required by Title IX of the Educational Amendments of 1972, Section 504 of the RehabilitationAct of 1973, Title VII of the Civil Rights Act of 1964, and other applicable statutes. The University of Delaware has designated Karen Mancini, Director of the Office ofDisabilities Support Services, as its ADA/Section 504 Coordinator under Federal law. Inquiries concerning Americans with Disabilities Act compliance, Section 504 com-pliance, campus accessibility, and related issues should be referred to Karen Mancini (302-831-4643) in the Office of Disabilities Support Services. Inquiries concerningTitle VII and Title IX compliance and related issues should be referred to the Director of the Office of Equity and Inclusion, Becki Fogerty (302-831-8063).
Institute for Public AdministrationSchool of Public Policy & Administration
College of Arts & SciencesUniversity of Delaware
180 Graham Hall University of Delaware Newark, DE 19716-7380
phone: 302-831-8971 e-mail: [email protected] fax: 302-831-3488
www.ipa.udel.edu
The University of Delaware’s Institute for Public Administration (IPA) addresses the policy, planning,and management needs of its partners through the integration of applied research, professionaldevelopment, and the education of tomorrow’s leaders.