economic and market watch report - mls pinmls property information network, inc.,(mls pin) is the...
TRANSCRIPT

Economic and Market Watch Report4th Quarter, 2009
*Click on a County to view economic and real estate information at the county and zip code level
© 2009 MLS Property Information Network, Inc.and the NATIONAL ASSOCIATION OF REALTORS®
Reproduction, reprinting, or retransmission in any form is prohibited without written permission.
This product is a collaboration between the MLS Property Information Network, Inc. and the NA TIONALASSOCIATION OF REALTORS®. Listings data are provided by the MLS Property Information
Network, Inc., while all statistical calculations, forecasts, analysis, and commentary are provided by theResearch Division of the NA TIONAL ASSOCIATION OF REALTORS®.
MLS Property Information Network, Inc.
Index
MLS Property Information Network, Inc.,(MLS PIN) is the largest multiple listing service in New England, and provides service to more than 29,000 real estate professionals throughout Massachusetts, as well as parts of Connecticut, New Hampshire, and Rhode Island. MLS PIN offers a comprehensive database of more than 44,000 active listings and one million off-market listings. This database also includes complete statewide assessments, tax and deed transfers. MLS PIN prides itself in its quality customer service and technical support with a professional and experienced staff, evening and weekend support, and complimentary hands-on training at locations throughout the state. We offer state-of-the art technology, which includes our very own in-house products H3MLS and Pinwheel 360 Virtual Tours. It is our goal to connect real estate professionals everyday with our service, technical expertise, credibility, and drive to always offer the best and most up to date services to our customers.
Economic and Market Watch Report
Local ReportMassachusetts
1 Barnstable County .......................................................................................................3 Berkshire County .........................................................................................................5 Bristol County ..............................................................................................................7 Essex County ................................................................................................................9 Franklin County ..........................................................................................................
11 Hampden County .........................................................................................................13 Hampshire County ......................................................................................................15 Middlesex County ........................................................................................................19 Nantucket County ........................................................................................................20 Norfolk County ............................................................................................................22 Plymouth County .........................................................................................................24 Suffolk County .............................................................................................................26 Worcester County ........................................................................................................
29 Others ...........................................................................................................................
30Trends ...............................................................................................................................................31Chief Economist's Commentary* ...................................................................................................33Economic Monitor* .........................................................................................................................
*Reprinted from Real Estate Outlook: Market Trends and Insights. ©2010 NATIONAL ASSOCIATION OF REALTORS ®.Used with permission. Reproduction, reprinting, or retransmission of this article in any form (electronic media included) is prohibited without permission. For subscription information please call 1-800-874-6500.
Local Report
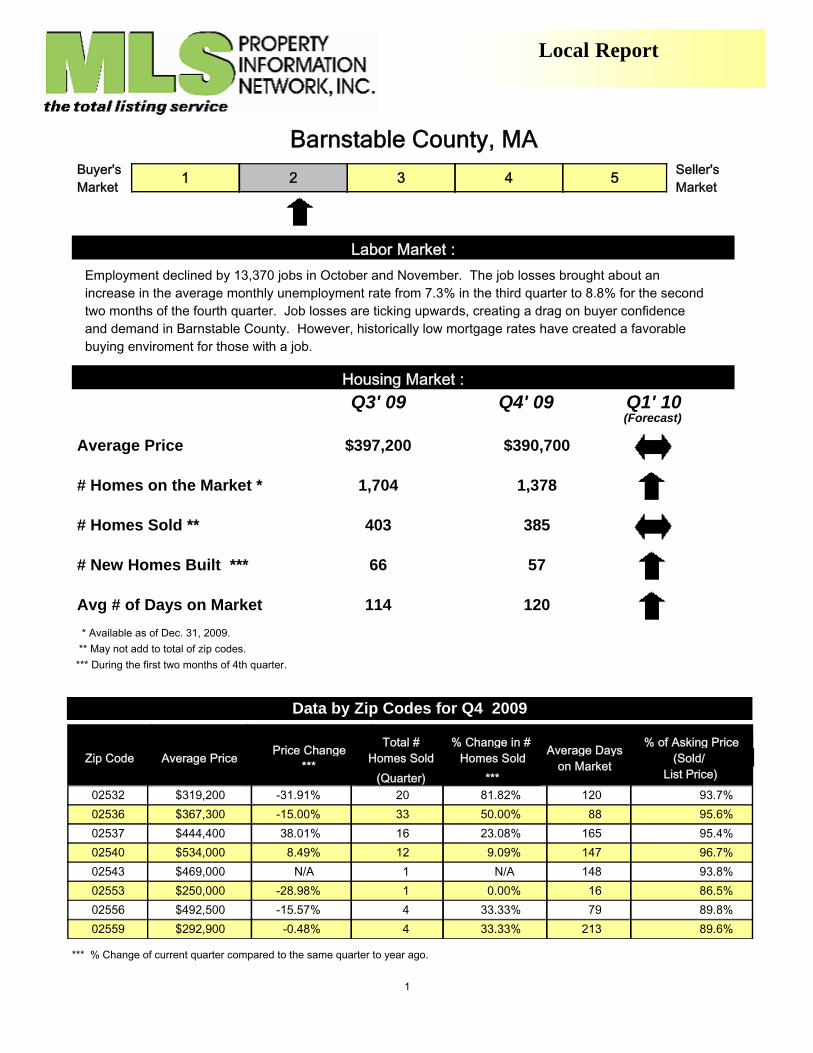
Barnstable County, MA
1 2 3 4 5 Seller's Market
Buyer's Market
Employment declined by 13,370 jobs in October and November. The job losses brought about an increase in the average monthly unemployment rate from 7.3% in the third quarter to 8.8% for the second two months of the fourth quarter. Job losses are ticking upwards, creating a drag on buyer confidence and demand in Barnstable County. However, historically low mortgage rates have created a favorable buying enviroment for those with a job.
Labor Market :
Housing Market :
(Forecast)Q3' 09 Q4' 09 Q1' 10
$397,200Average Price $390,700
1,704# Homes on the Market * 1,378
403# Homes Sold ** 385
66# New Homes Built *** 57 ***
114Avg # of Days on Market 120 * Available as of Dec. 31, 2009.
*** During the first two months of 4th quarter. ** May not add to total of zip codes.
Zip Code Average Price Price Change***
Total #Homes Sold
(Quarter)
% Change in #Homes Sold
***
Average Dayson Market
% of Asking Price(Sold/
List Price)
Data by Zip Codes for Q4 2009
02532 $319,200 -31.91% 20 81.82% 93.7%12002536 $367,300 -15.00% 33 50.00% 95.6%8802537 $444,400 38.01% 16 23.08% 95.4%16502540 $534,000 8.49% 12 9.09% 96.7%14702543 $469,000 N/A 1 N/A 93.8%14802553 $250,000 -28.98% 1 0.00% 86.5%1602556 $492,500 -15.57% 4 33.33% 89.8%7902559 $292,900 -0.48% 4 33.33% 89.6%213
1
*** % Change of current quarter compared to the same quarter to year ago.
Local Report
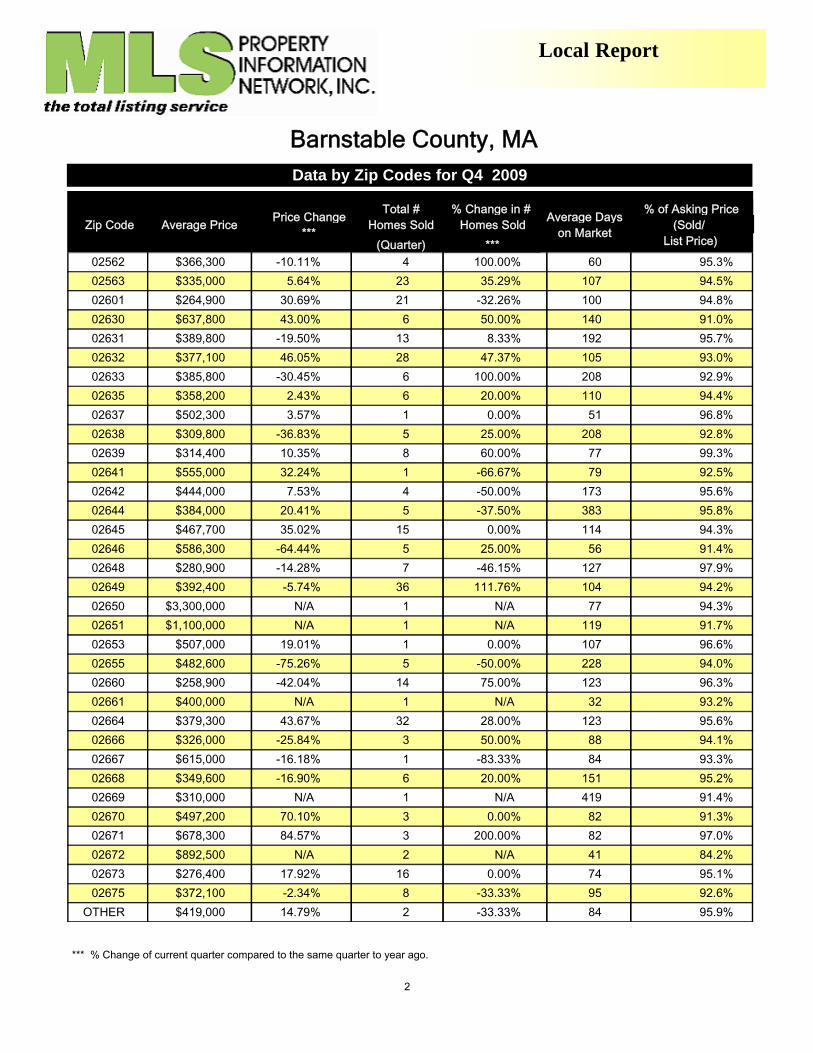
Barnstable County, MA
Zip Code Average Price Price Change***
Total #Homes Sold
(Quarter)
% Change in #Homes Sold
***
Average Dayson Market
% of Asking Price(Sold/
List Price)
Data by Zip Codes for Q4 2009
02562 $366,300 -10.11% 4 100.00% 95.3%6002563 $335,000 5.64% 23 35.29% 94.5%10702601 $264,900 30.69% 21 -32.26% 94.8%10002630 $637,800 43.00% 6 50.00% 91.0%14002631 $389,800 -19.50% 13 8.33% 95.7%19202632 $377,100 46.05% 28 47.37% 93.0%10502633 $385,800 -30.45% 6 100.00% 92.9%20802635 $358,200 2.43% 6 20.00% 94.4%11002637 $502,300 3.57% 1 0.00% 96.8%5102638 $309,800 -36.83% 5 25.00% 92.8%20802639 $314,400 10.35% 8 60.00% 99.3%7702641 $555,000 32.24% 1 -66.67% 92.5%7902642 $444,000 7.53% 4 -50.00% 95.6%17302644 $384,000 20.41% 5 -37.50% 95.8%38302645 $467,700 35.02% 15 0.00% 94.3%11402646 $586,300 -64.44% 5 25.00% 91.4%5602648 $280,900 -14.28% 7 -46.15% 97.9%12702649 $392,400 -5.74% 36 111.76% 94.2%10402650 $3,300,000 N/A 1 N/A 94.3%7702651 $1,100,000 N/A 1 N/A 91.7%11902653 $507,000 19.01% 1 0.00% 96.6%10702655 $482,600 -75.26% 5 -50.00% 94.0%22802660 $258,900 -42.04% 14 75.00% 96.3%12302661 $400,000 N/A 1 N/A 93.2%3202664 $379,300 43.67% 32 28.00% 95.6%12302666 $326,000 -25.84% 3 50.00% 94.1%8802667 $615,000 -16.18% 1 -83.33% 93.3%8402668 $349,600 -16.90% 6 20.00% 95.2%15102669 $310,000 N/A 1 N/A 91.4%41902670 $497,200 70.10% 3 0.00% 91.3%8202671 $678,300 84.57% 3 200.00% 97.0%8202672 $892,500 N/A 2 N/A 84.2%4102673 $276,400 17.92% 16 0.00% 95.1%7402675 $372,100 -2.34% 8 -33.33% 92.6%95
OTHER $419,000 14.79% 2 -33.33% 95.9%84
2
*** % Change of current quarter compared to the same quarter to year ago.
Local Report
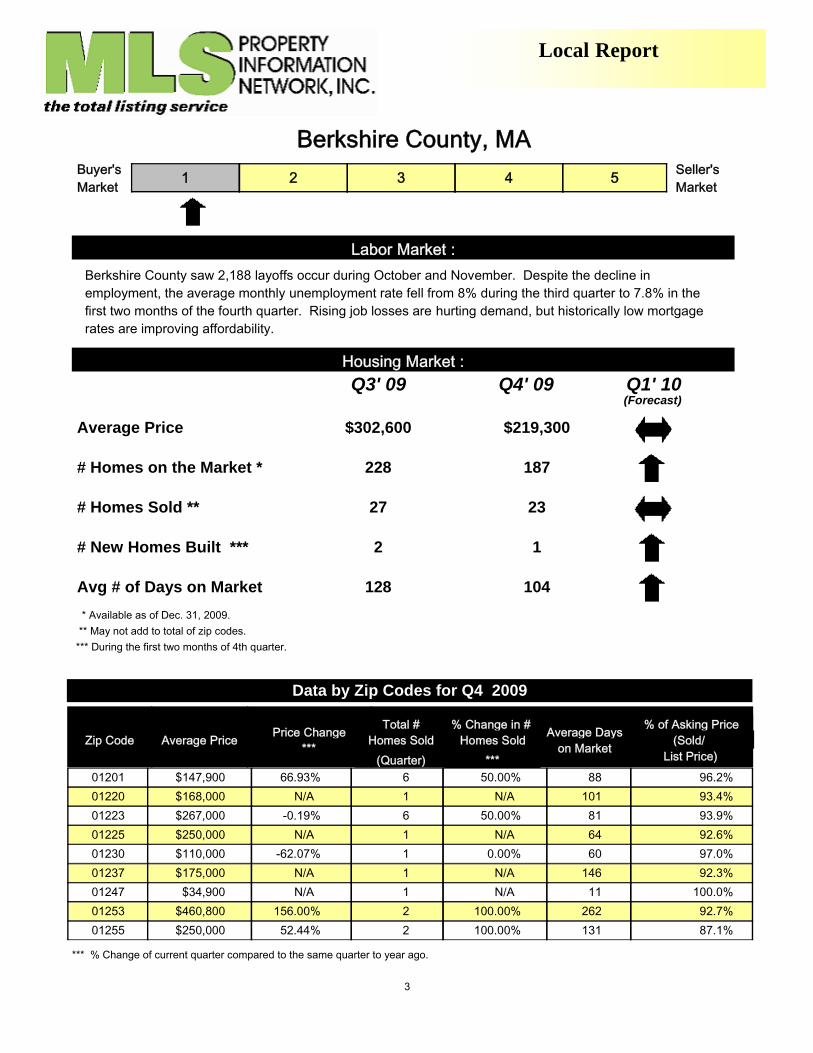
Berkshire County, MA
1 2 3 4 5 Seller's Market
Buyer's Market
Berkshire County saw 2,188 layoffs occur during October and November. Despite the decline in employment, the average monthly unemployment rate fell from 8% during the third quarter to 7.8% in the first two months of the fourth quarter. Rising job losses are hurting demand, but historically low mortgage rates are improving affordability.
Labor Market :
Housing Market :
(Forecast)Q3' 09 Q4' 09 Q1' 10
$302,600Average Price $219,300
228# Homes on the Market * 187
27# Homes Sold ** 23
2# New Homes Built *** 1 ***
128Avg # of Days on Market 104 * Available as of Dec. 31, 2009.
*** During the first two months of 4th quarter. ** May not add to total of zip codes.
Zip Code Average Price Price Change***
Total #Homes Sold
(Quarter)
% Change in #Homes Sold
***
Average Dayson Market
% of Asking Price(Sold/
List Price)
Data by Zip Codes for Q4 2009
01201 $147,900 66.93% 6 50.00% 96.2%8801220 $168,000 N/A 1 N/A 93.4%10101223 $267,000 -0.19% 6 50.00% 93.9%8101225 $250,000 N/A 1 N/A 92.6%6401230 $110,000 -62.07% 1 0.00% 97.0%6001237 $175,000 N/A 1 N/A 92.3%14601247 $34,900 N/A 1 N/A 100.0%1101253 $460,800 156.00% 2 100.00% 92.7%26201255 $250,000 52.44% 2 100.00% 87.1%131
3
*** % Change of current quarter compared to the same quarter to year ago.
Local Report
Berkshire County, MA
Zip Code Average Price Price Change***
Total #Homes Sold
(Quarter)
% Change in #Homes Sold
***
Average Dayson Market
% of Asking Price(Sold/
List Price)
Data by Zip Codes for Q4 2009
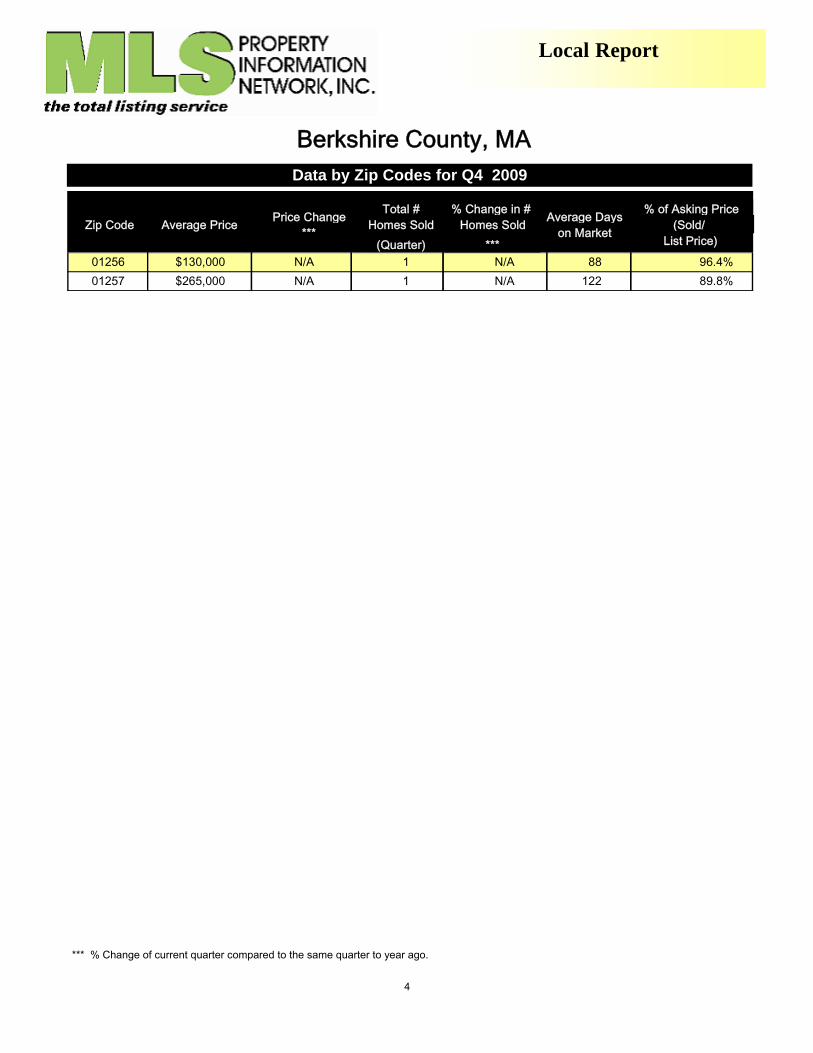
01256 $130,000 N/A 1 N/A 96.4%8801257 $265,000 N/A 1 N/A 89.8%122
4
*** % Change of current quarter compared to the same quarter to year ago.

Local Report
Bristol County, MA
1 2 3 4 5 Seller's Market
Buyer's Market
In the first two months of the fourth quarter, 1,000 jobs were added to the payrolls of Bristol County. As a result of these new jobs, the average monthly unemployment rate fell from 11.5% during the third quarter to 10.9% for October and November. This steady job creation may help to maintain demand for home purchases. Favorable mortgage rates should support this trend.
Labor Market :
Housing Market :
(Forecast)Q3' 09 Q4' 09 Q1' 10
$274,500Average Price $267,700
2,648# Homes on the Market * 2,161
886# Homes Sold ** 833
106# New Homes Built *** 65 ***
112Avg # of Days on Market 107 * Available as of Dec. 31, 2009.
*** During the first two months of 4th quarter. ** May not add to total of zip codes.
Zip Code Average Price Price Change***
Total #Homes Sold
(Quarter)
% Change in #Homes Sold
***
Average Dayson Market
% of Asking Price(Sold/
List Price)
Data by Zip Codes for Q4 2009
02048 $377,800 -2.90% 25 0.00% 95.9%8802334 $121,000 N/A 1 N/A 93.1%2902356 $447,600 -0.11% 23 4.55% 96.6%11102375 $307,800 -5.84% 15 -6.25% 94.4%8902702 $286,100 -6.78% 8 60.00% 92.2%22402703 $280,700 9.05% 77 30.51% 98.2%14102714 $455,700 N/A 1 N/A 103.8%20502715 $274,400 -3.31% 20 185.71% 96.2%9802717 $213,200 -1.75% 10 233.33% 91.2%238
5
*** % Change of current quarter compared to the same quarter to year ago.

Local Report
Bristol County, MA
Zip Code Average Price Price Change***
Total #Homes Sold
(Quarter)
% Change in #Homes Sold
***
Average Dayson Market
% of Asking Price(Sold/
List Price)
Data by Zip Codes for Q4 2009
02718 $266,400 6.35% 17 750.00% 97.1%14202719 $313,100 14.65% 33 32.00% 91.5%9402720 $227,700 0.53% 30 36.36% 95.2%10602721 $176,500 -9.07% 18 -5.26% 95.0%7602723 $199,000 -3.30% 13 116.67% 95.7%15102724 $193,900 4.47% 18 125.00% 96.5%9102725 $173,800 -36.48% 5 66.67% 88.9%7602726 $255,700 -0.54% 29 93.33% 96.1%8202740 $172,900 17.14% 62 12.73% 95.5%10902743 $233,900 0.09% 26 23.81% 92.7%17302744 $142,800 -10.13% 9 28.57% 92.6%6502745 $203,700 -1.16% 49 75.00% 96.1%8002746 $148,800 -6.88% 7 75.00% 99.1%8102747 $274,100 -3.35% 33 -10.81% 94.1%9802748 $454,300 23.45% 19 58.33% 85.6%15302760 $297,300 -15.32% 44 37.50% 97.0%7202763 $420,500 42.59% 1 -75.00% 95.6%7002764 $214,000 -24.33% 4 -50.00% 95.7%11702766 $333,000 12.96% 23 -20.69% 95.7%14102767 $341,000 11.40% 25 8.70% 95.0%13902769 $340,200 -2.49% 18 -21.74% 96.3%9202771 $312,900 11.35% 10 11.11% 95.0%15102777 $237,100 1.98% 41 46.43% 93.1%8402779 $318,900 11.93% 12 20.00% 97.8%12502780 $234,900 2.09% 80 15.94% 97.3%7002790 $302,600 -18.55% 25 4.17% 94.1%13102791 $770,000 -3.75% 1 0.00% 86.0%194
OTHER $64,900 N/A 1 N/A 100.0%27
6
*** % Change of current quarter compared to the same quarter to year ago.

Local Report
Essex County, MA
1 2 3 4 5 Seller's Market
Buyer's Market
In the first two months of the fourth quarter, 1,036 jobs were added to the payrolls of Essex County. As a result of these new jobs, the average monthly unemployment rate fell from 9.7% during the third quarter to 9.1% for October and November. This steady job creation may help to maintain demand for home purchases. Favorable mortgage rates should support this trend.
Labor Market :
Housing Market :
(Forecast)Q3' 09 Q4' 09 Q1' 10
$374,800Average Price $387,600
3,215# Homes on the Market * 2,312
1,336# Homes Sold ** 1,178
127# New Homes Built *** 67 ***
94Avg # of Days on Market 95 * Available as of Dec. 31, 2009.
*** During the first two months of 4th quarter. ** May not add to total of zip codes.
Zip Code Average Price Price Change***
Total #Homes Sold
(Quarter)
% Change in #Homes Sold
***
Average Dayson Market
% of Asking Price(Sold/
List Price)
Data by Zip Codes for Q4 2009
01810 $543,800 5.20% 55 -1.79% 96.5%8601830 $236,000 2.03% 38 -7.32% 97.2%8801832 $271,900 -18.18% 23 15.00% 97.2%6901833 $457,000 23.71% 18 -21.74% 96.6%11901834 $424,300 14.43% 9 50.00% 93.8%8601835 $282,100 -0.53% 21 23.53% 97.9%9201841 $149,900 4.90% 14 -57.58% 98.8%9401843 $181,600 2.77% 36 63.64% 96.8%10401844 $281,900 2.17% 95 23.38% 97.3%108
7
*** % Change of current quarter compared to the same quarter to year ago.

Local Report
Essex County, MA
Zip Code Average Price Price Change***
Total #Homes Sold
(Quarter)
% Change in #Homes Sold
***
Average Dayson Market
% of Asking Price(Sold/
List Price)
Data by Zip Codes for Q4 2009
01845 $425,500 -18.63% 44 10.00% 96.6%8101860 $314,100 -20.84% 16 220.00% 96.7%11801902 $178,800 17.17% 51 10.87% 98.5%6101903 $219,500 N/A 1 N/A 95.5%2501904 $218,500 -7.22% 31 -8.82% 96.9%5801905 $185,100 3.87% 30 -6.25% 96.7%6101906 $305,000 2.21% 67 42.55% 96.7%6001907 $543,400 24.83% 27 42.11% 92.6%10701908 $1,055,900 87.65% 7 0.00% 89.7%17101913 $322,000 19.57% 19 -13.64% 95.4%10201915 $339,800 -5.74% 58 7.41% 97.7%6501921 $511,900 -7.21% 24 50.00% 95.3%15501922 $477,300 155.24% 2 100.00% 95.0%9901923 $349,400 -1.88% 45 18.42% 96.1%7701929 $528,400 N/A 8 N/A 91.6%18901930 $529,300 14.59% 43 34.38% 92.1%16601938 $506,600 -4.54% 17 30.77% 95.1%9701940 $588,500 15.30% 38 171.43% 93.5%11101944 $698,300 -62.48% 13 62.50% 91.8%17401945 $690,000 22.86% 51 131.82% 91.2%13001949 $493,300 14.77% 13 18.18% 94.4%12901950 $438,700 -16.55% 40 29.03% 94.2%9701951 $391,600 -6.61% 13 30.00% 96.1%14801952 $332,200 23.27% 6 -60.00% 93.6%9101960 $316,100 -3.19% 74 12.12% 96.2%7301966 $607,000 -7.03% 19 90.00% 90.3%9501969 $407,800 12.47% 13 85.71% 93.4%8101970 $309,000 0.06% 45 25.00% 95.6%7701982 $440,200 -4.72% 21 110.00% 95.7%14801983 $530,200 13.10% 12 33.33% 97.1%7801984 $617,300 50.01% 10 150.00% 92.7%10901985 $512,600 27.48% 9 28.57% 96.0%58
OTHER $782,500 N/A 2 N/A 103.0%30
8
*** % Change of current quarter compared to the same quarter to year ago.
Local Report
Franklin County, MA
1 2 3 4 5 Seller's Market
Buyer's Market
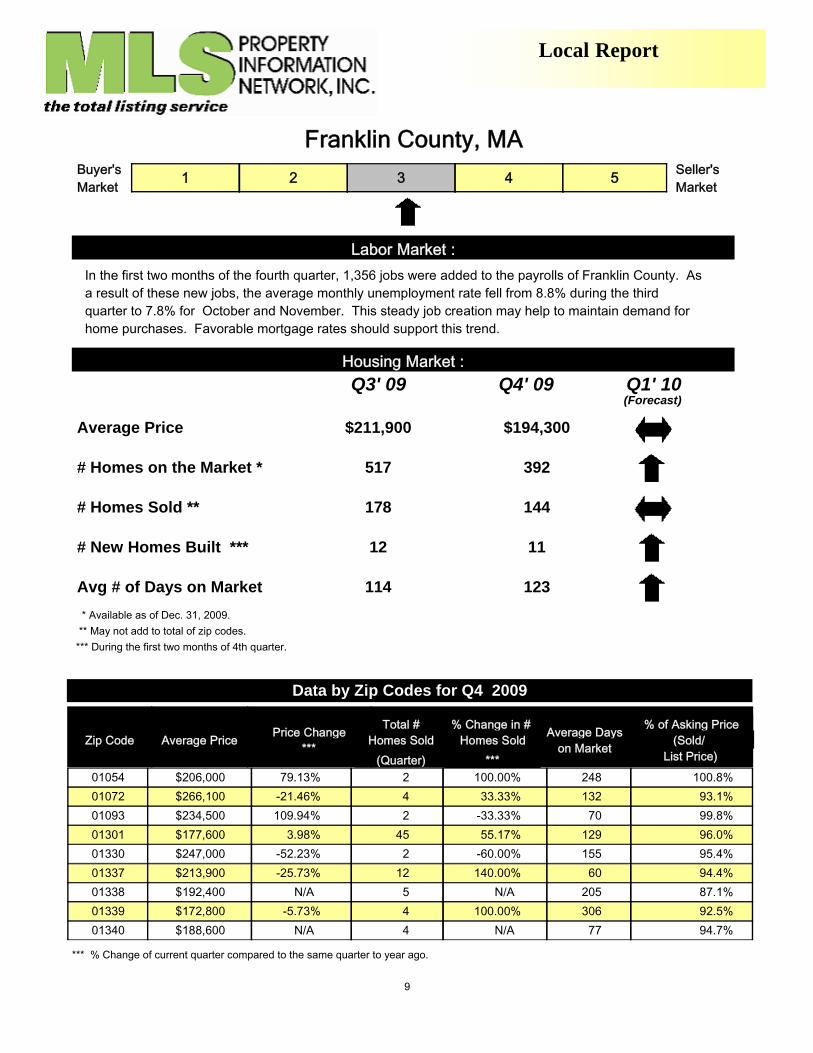
In the first two months of the fourth quarter, 1,356 jobs were added to the payrolls of Franklin County. As a result of these new jobs, the average monthly unemployment rate fell from 8.8% during the third quarter to 7.8% for October and November. This steady job creation may help to maintain demand for home purchases. Favorable mortgage rates should support this trend.
Labor Market :
Housing Market :
(Forecast)Q3' 09 Q4' 09 Q1' 10
$211,900Average Price $194,300
517# Homes on the Market * 392
178# Homes Sold ** 144
12# New Homes Built *** 11 ***
114Avg # of Days on Market 123 * Available as of Dec. 31, 2009.
*** During the first two months of 4th quarter. ** May not add to total of zip codes.
Zip Code Average Price Price Change***
Total #Homes Sold
(Quarter)
% Change in #Homes Sold
***
Average Dayson Market
% of Asking Price(Sold/
List Price)
Data by Zip Codes for Q4 2009
01054 $206,000 79.13% 2 100.00% 100.8%24801072 $266,100 -21.46% 4 33.33% 93.1%13201093 $234,500 109.94% 2 -33.33% 99.8%7001301 $177,600 3.98% 45 55.17% 96.0%12901330 $247,000 -52.23% 2 -60.00% 95.4%15501337 $213,900 -25.73% 12 140.00% 94.4%6001338 $192,400 N/A 5 N/A 87.1%20501339 $172,800 -5.73% 4 100.00% 92.5%30601340 $188,600 N/A 4 N/A 94.7%77
9
*** % Change of current quarter compared to the same quarter to year ago.
Local Report
Franklin County, MA
Zip Code Average Price Price Change***
Total #Homes Sold
(Quarter)
% Change in #Homes Sold
***
Average Dayson Market
% of Asking Price(Sold/
List Price)
Data by Zip Codes for Q4 2009
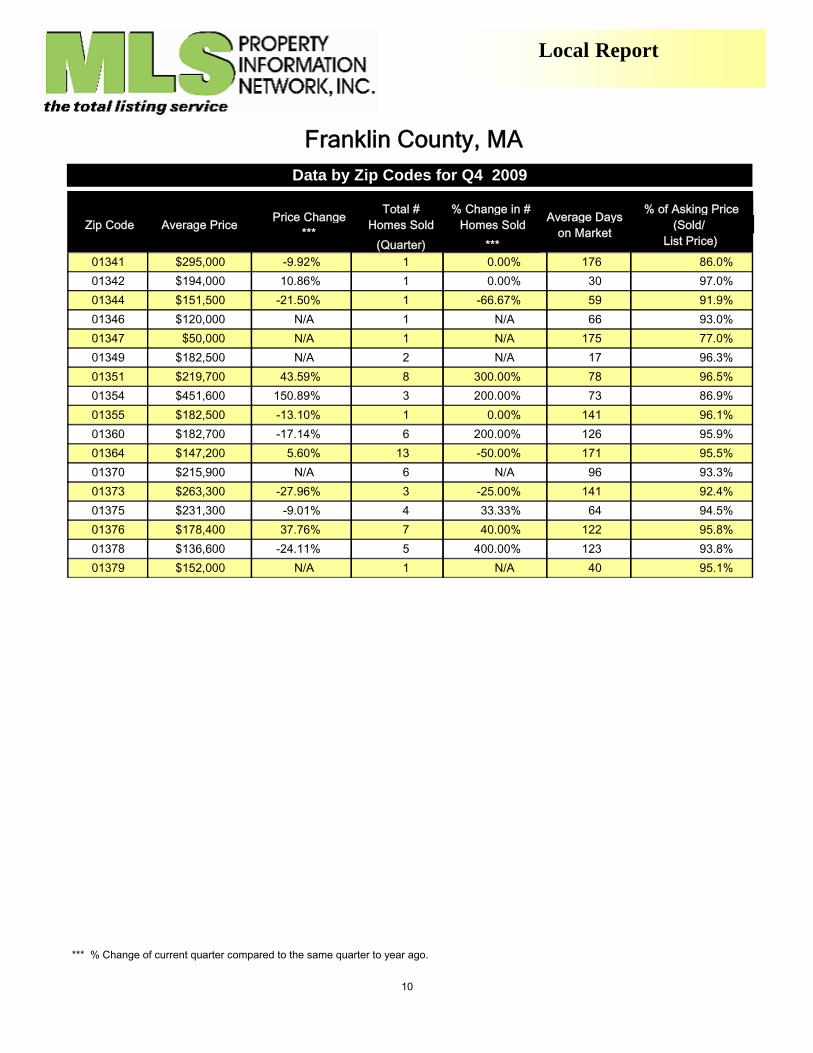
01341 $295,000 -9.92% 1 0.00% 86.0%17601342 $194,000 10.86% 1 0.00% 97.0%3001344 $151,500 -21.50% 1 -66.67% 91.9%5901346 $120,000 N/A 1 N/A 93.0%6601347 $50,000 N/A 1 N/A 77.0%17501349 $182,500 N/A 2 N/A 96.3%1701351 $219,700 43.59% 8 300.00% 96.5%7801354 $451,600 150.89% 3 200.00% 86.9%7301355 $182,500 -13.10% 1 0.00% 96.1%14101360 $182,700 -17.14% 6 200.00% 95.9%12601364 $147,200 5.60% 13 -50.00% 95.5%17101370 $215,900 N/A 6 N/A 93.3%9601373 $263,300 -27.96% 3 -25.00% 92.4%14101375 $231,300 -9.01% 4 33.33% 94.5%6401376 $178,400 37.76% 7 40.00% 95.8%12201378 $136,600 -24.11% 5 400.00% 93.8%12301379 $152,000 N/A 1 N/A 95.1%40
10
*** % Change of current quarter compared to the same quarter to year ago.

Local Report
Hampden County, MA
1 2 3 4 5 Seller's Market
Buyer's Market
In the first two months of the fourth quarter, 3,503 jobs were added to the payrolls of Hampden County. As a result of these new jobs, the average monthly unemployment rate fell from 10.3% during the third quarter to 9.7% for October and November. This steady job creation may help to maintain demand for home purchases. Favorable mortgage rates should support this trend.
Labor Market :
Housing Market :
(Forecast)Q3' 09 Q4' 09 Q1' 10
$202,100Average Price $187,800
2,198# Homes on the Market * 1,599
855# Homes Sold ** 833
51# New Homes Built *** 55 ***
92Avg # of Days on Market 90 * Available as of Dec. 31, 2009.
*** During the first two months of 4th quarter. ** May not add to total of zip codes.
Zip Code Average Price Price Change***
Total #Homes Sold
(Quarter)
% Change in #Homes Sold
***
Average Dayson Market
% of Asking Price(Sold/
List Price)
Data by Zip Codes for Q4 2009
01001 $200,800 -3.04% 26 85.71% 97.8%4701008 $217,000 -15.43% 2 -60.00% 96.5%6401009 $169,000 16.63% 1 0.00% 95.2%45501010 $193,700 -4.91% 7 0.00% 96.9%21401011 $163,500 37.39% 5 66.67% 95.1%14301013 $164,100 12.32% 40 60.00% 98.2%11301020 $181,000 6.91% 54 20.00% 96.9%8501028 $233,000 -14.56% 44 29.41% 97.1%10301030 $247,500 -1.20% 30 100.00% 96.3%99
11
*** % Change of current quarter compared to the same quarter to year ago.
Local Report
Hampden County, MA
Zip Code Average Price Price Change***
Total #Homes Sold
(Quarter)
% Change in #Homes Sold
***
Average Dayson Market
% of Asking Price(Sold/
List Price)
Data by Zip Codes for Q4 2009
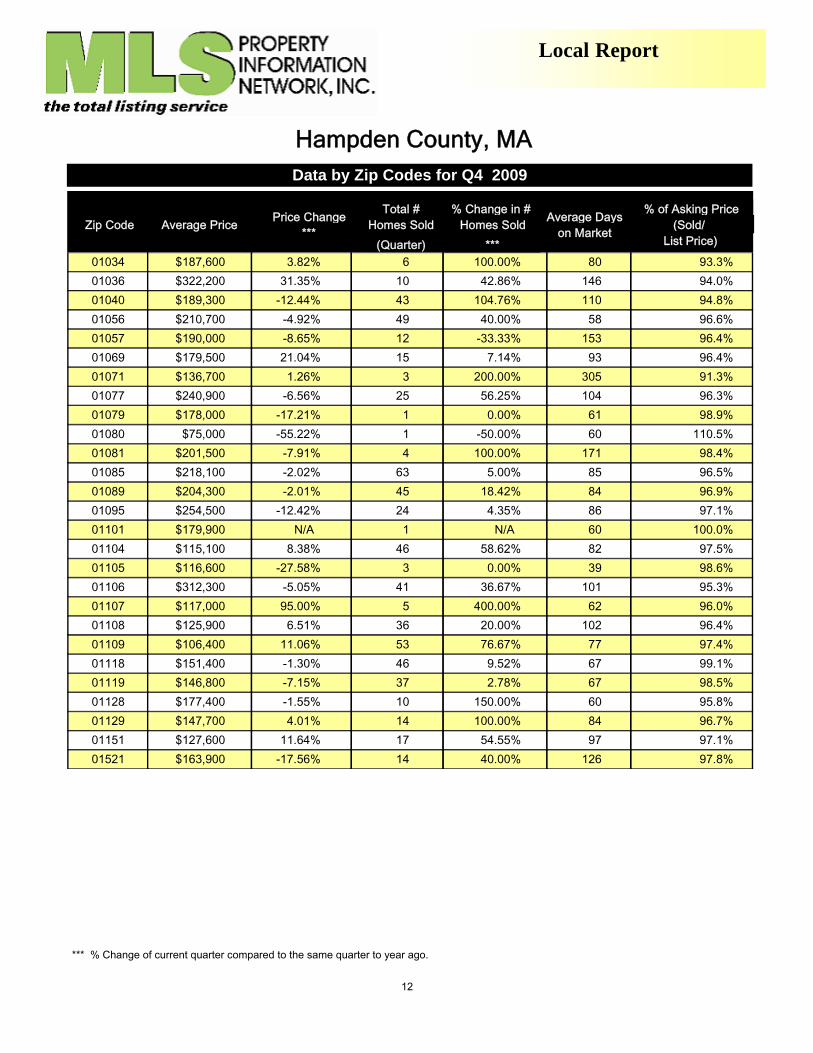
01034 $187,600 3.82% 6 100.00% 93.3%8001036 $322,200 31.35% 10 42.86% 94.0%14601040 $189,300 -12.44% 43 104.76% 94.8%11001056 $210,700 -4.92% 49 40.00% 96.6%5801057 $190,000 -8.65% 12 -33.33% 96.4%15301069 $179,500 21.04% 15 7.14% 96.4%9301071 $136,700 1.26% 3 200.00% 91.3%30501077 $240,900 -6.56% 25 56.25% 96.3%10401079 $178,000 -17.21% 1 0.00% 98.9%6101080 $75,000 -55.22% 1 -50.00% 110.5%6001081 $201,500 -7.91% 4 100.00% 98.4%17101085 $218,100 -2.02% 63 5.00% 96.5%8501089 $204,300 -2.01% 45 18.42% 96.9%8401095 $254,500 -12.42% 24 4.35% 97.1%8601101 $179,900 N/A 1 N/A 100.0%6001104 $115,100 8.38% 46 58.62% 97.5%8201105 $116,600 -27.58% 3 0.00% 98.6%3901106 $312,300 -5.05% 41 36.67% 95.3%10101107 $117,000 95.00% 5 400.00% 96.0%6201108 $125,900 6.51% 36 20.00% 96.4%10201109 $106,400 11.06% 53 76.67% 97.4%7701118 $151,400 -1.30% 46 9.52% 99.1%6701119 $146,800 -7.15% 37 2.78% 98.5%6701128 $177,400 -1.55% 10 150.00% 95.8%6001129 $147,700 4.01% 14 100.00% 96.7%8401151 $127,600 11.64% 17 54.55% 97.1%9701521 $163,900 -17.56% 14 40.00% 97.8%126
12
*** % Change of current quarter compared to the same quarter to year ago.
Local Report
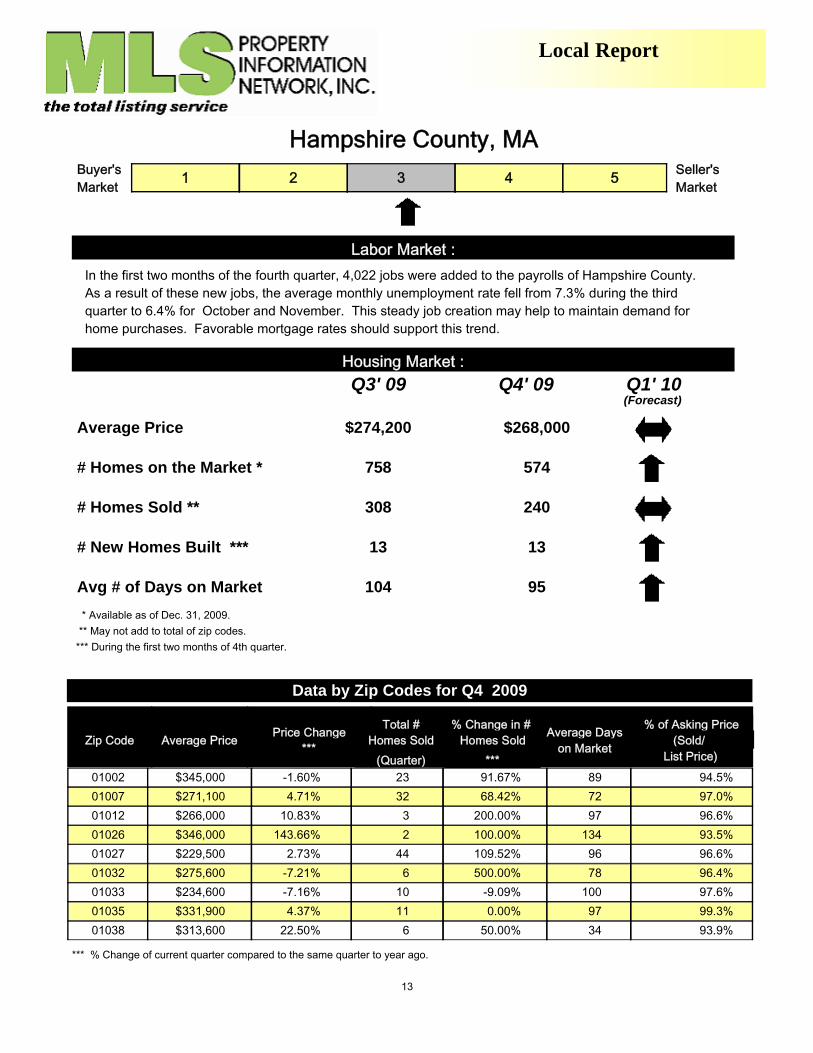
Hampshire County, MA
1 2 3 4 5 Seller's Market
Buyer's Market
In the first two months of the fourth quarter, 4,022 jobs were added to the payrolls of Hampshire County. As a result of these new jobs, the average monthly unemployment rate fell from 7.3% during the third quarter to 6.4% for October and November. This steady job creation may help to maintain demand for home purchases. Favorable mortgage rates should support this trend.
Labor Market :
Housing Market :
(Forecast)Q3' 09 Q4' 09 Q1' 10
$274,200Average Price $268,000
758# Homes on the Market * 574
308# Homes Sold ** 240
13# New Homes Built *** 13 ***
104Avg # of Days on Market 95 * Available as of Dec. 31, 2009.
*** During the first two months of 4th quarter. ** May not add to total of zip codes.
Zip Code Average Price Price Change***
Total #Homes Sold
(Quarter)
% Change in #Homes Sold
***
Average Dayson Market
% of Asking Price(Sold/
List Price)
Data by Zip Codes for Q4 2009
01002 $345,000 -1.60% 23 91.67% 94.5%8901007 $271,100 4.71% 32 68.42% 97.0%7201012 $266,000 10.83% 3 200.00% 96.6%9701026 $346,000 143.66% 2 100.00% 93.5%13401027 $229,500 2.73% 44 109.52% 96.6%9601032 $275,600 -7.21% 6 500.00% 96.4%7801033 $234,600 -7.16% 10 -9.09% 97.6%10001035 $331,900 4.37% 11 0.00% 99.3%9701038 $313,600 22.50% 6 50.00% 93.9%34
13
*** % Change of current quarter compared to the same quarter to year ago.
Local Report
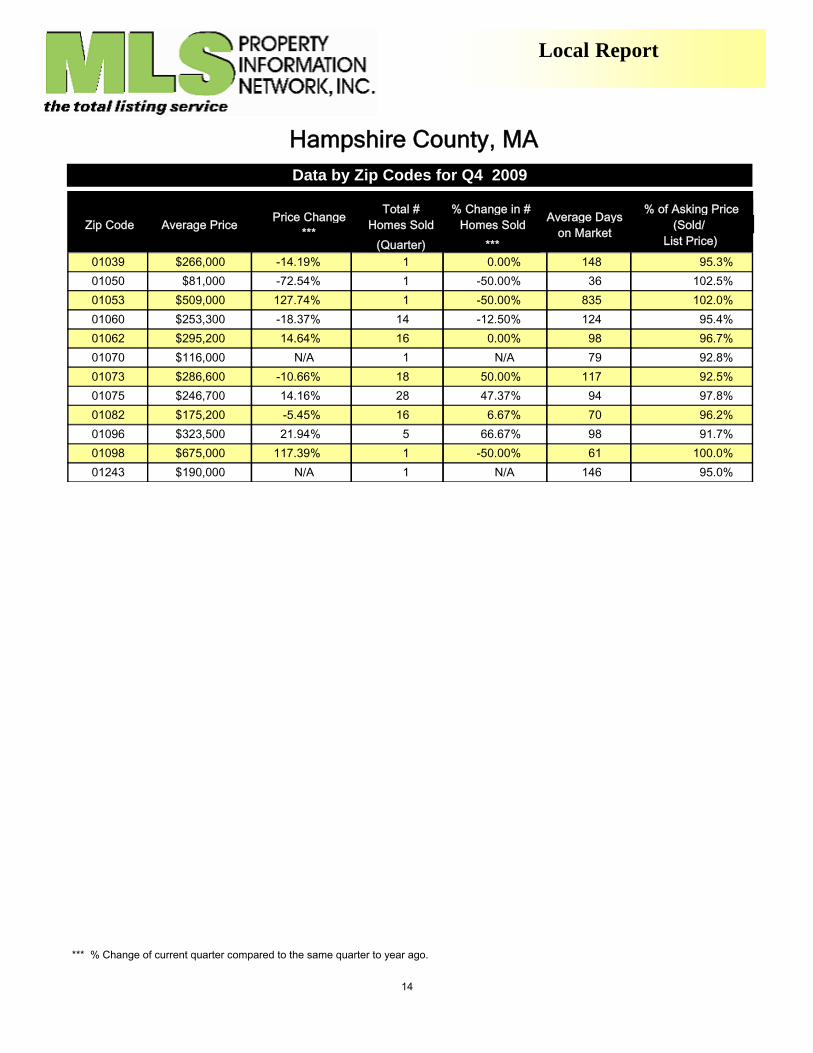
Hampshire County, MA
Zip Code Average Price Price Change***
Total #Homes Sold
(Quarter)
% Change in #Homes Sold
***
Average Dayson Market
% of Asking Price(Sold/
List Price)
Data by Zip Codes for Q4 2009
01039 $266,000 -14.19% 1 0.00% 95.3%14801050 $81,000 -72.54% 1 -50.00% 102.5%3601053 $509,000 127.74% 1 -50.00% 102.0%83501060 $253,300 -18.37% 14 -12.50% 95.4%12401062 $295,200 14.64% 16 0.00% 96.7%9801070 $116,000 N/A 1 N/A 92.8%7901073 $286,600 -10.66% 18 50.00% 92.5%11701075 $246,700 14.16% 28 47.37% 97.8%9401082 $175,200 -5.45% 16 6.67% 96.2%7001096 $323,500 21.94% 5 66.67% 91.7%9801098 $675,000 117.39% 1 -50.00% 100.0%6101243 $190,000 N/A 1 N/A 95.0%146
14
*** % Change of current quarter compared to the same quarter to year ago.
Local Report
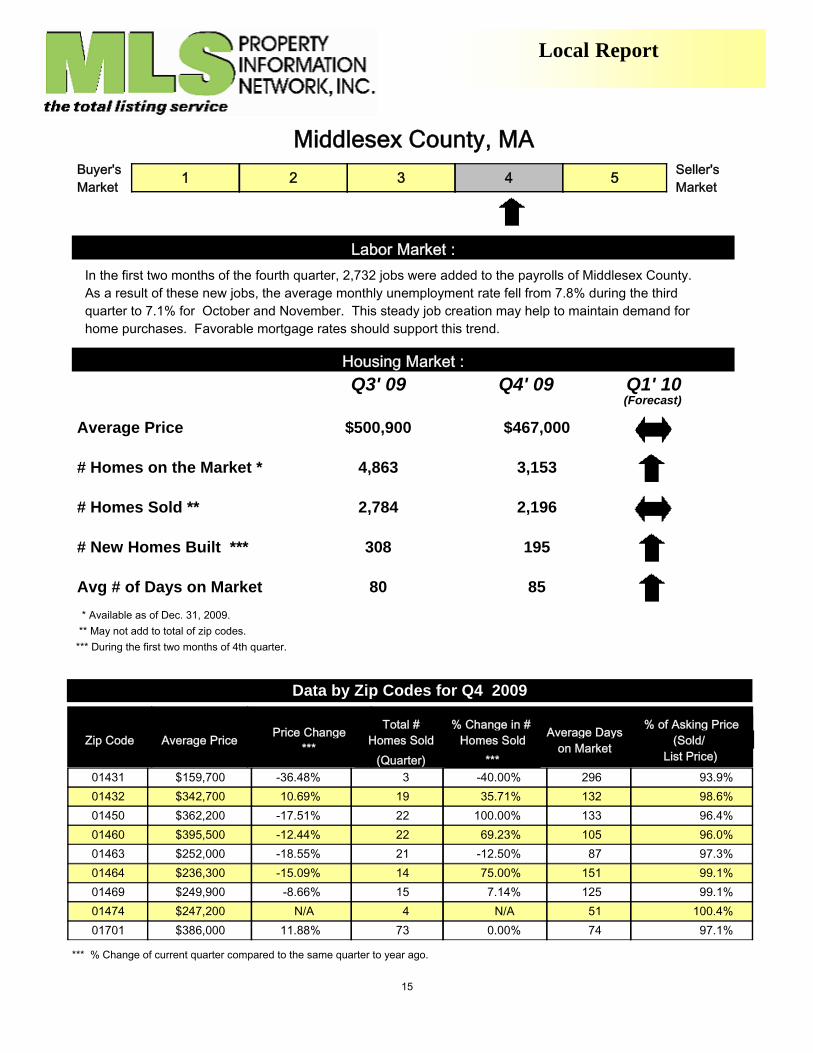
Middlesex County, MA
1 2 3 4 5 Seller's Market
Buyer's Market
In the first two months of the fourth quarter, 2,732 jobs were added to the payrolls of Middlesex County. As a result of these new jobs, the average monthly unemployment rate fell from 7.8% during the third quarter to 7.1% for October and November. This steady job creation may help to maintain demand for home purchases. Favorable mortgage rates should support this trend.
Labor Market :
Housing Market :
(Forecast)Q3' 09 Q4' 09 Q1' 10
$500,900Average Price $467,000
4,863# Homes on the Market * 3,153
2,784# Homes Sold ** 2,196
308# New Homes Built *** 195 ***
80Avg # of Days on Market 85 * Available as of Dec. 31, 2009.
*** During the first two months of 4th quarter. ** May not add to total of zip codes.
Zip Code Average Price Price Change***
Total #Homes Sold
(Quarter)
% Change in #Homes Sold
***
Average Dayson Market
% of Asking Price(Sold/
List Price)
Data by Zip Codes for Q4 2009
01431 $159,700 -36.48% 3 -40.00% 93.9%29601432 $342,700 10.69% 19 35.71% 98.6%13201450 $362,200 -17.51% 22 100.00% 96.4%13301460 $395,500 -12.44% 22 69.23% 96.0%10501463 $252,000 -18.55% 21 -12.50% 97.3%8701464 $236,300 -15.09% 14 75.00% 99.1%15101469 $249,900 -8.66% 15 7.14% 99.1%12501474 $247,200 N/A 4 N/A 100.4%5101701 $386,000 11.88% 73 0.00% 97.1%74
15
*** % Change of current quarter compared to the same quarter to year ago.

Local Report
Middlesex County, MA
Zip Code Average Price Price Change***
Total #Homes Sold
(Quarter)
% Change in #Homes Sold
***
Average Dayson Market
% of Asking Price(Sold/
List Price)
Data by Zip Codes for Q4 2009
01702 $265,000 -13.96% 36 2.86% 97.9%8001719 $557,000 -9.34% 11 83.33% 97.9%9001720 $532,200 2.29% 47 113.64% 95.9%8501721 $334,300 -20.80% 41 57.69% 97.2%8201730 $662,400 1.52% 19 -13.64% 96.9%4201741 $753,200 -22.91% 13 116.67% 93.0%11801742 $779,400 -22.03% 38 31.03% 91.8%13601746 $392,700 7.12% 28 40.00% 95.8%9201748 $506,000 -27.49% 34 25.93% 96.6%7701749 $305,400 2.52% 28 0.00% 96.4%5401752 $302,100 -0.59% 66 17.86% 96.4%9701754 $273,600 -1.76% 21 40.00% 96.0%7201760 $467,200 5.75% 61 29.79% 96.8%9201770 $808,700 44.36% 12 9.09% 89.9%12101773 $889,100 -20.50% 16 23.08% 93.4%10601775 $523,800 5.29% 16 6.67% 97.9%11101776 $591,300 5.34% 40 60.00% 95.2%11901778 $509,400 -8.84% 34 17.24% 95.1%8801801 $371,100 7.72% 52 30.00% 97.8%7201803 $387,000 -1.80% 47 30.56% 96.6%6401821 $311,600 5.02% 56 0.00% 96.9%8401824 $360,000 1.55% 51 30.77% 96.5%8801826 $285,300 -0.63% 60 30.43% 97.0%9301827 $306,200 -30.42% 4 0.00% 91.4%10901850 $148,000 -1.60% 20 -4.76% 97.5%9101851 $212,800 2.55% 25 -3.85% 97.1%10401852 $229,200 -0.22% 41 20.59% 97.8%7401853 $207,000 101.95% 1 -50.00% 103.6%2601854 $238,600 22.86% 17 6.25% 98.6%8801862 $284,300 -0.11% 14 55.56% 96.6%6901863 $308,000 4.98% 12 100.00% 97.8%5301864 $411,600 -14.57% 30 42.86% 97.5%9001867 $434,900 8.40% 51 10.87% 98.0%6701876 $350,700 3.67% 55 83.33% 97.4%8001879 $318,100 -7.04% 18 5.88% 97.2%21901880 $459,800 20.87% 57 23.91% 96.9%83
16
*** % Change of current quarter compared to the same quarter to year ago.

Local Report
Middlesex County, MA
Zip Code Average Price Price Change***
Total #Homes Sold
(Quarter)
% Change in #Homes Sold
***
Average Dayson Market
% of Asking Price(Sold/
List Price)
Data by Zip Codes for Q4 2009
01886 $447,000 2.71% 49 75.00% 98.0%8501887 $363,600 -1.52% 33 -28.26% 96.2%11001890 $693,500 -9.88% 50 19.05% 95.4%10002138 $1,666,800 -10.68% 18 100.00% 93.4%11402139 $679,800 9.33% 8 100.00% 99.8%2902140 $543,500 -14.38% 5 -50.00% 97.6%7202141 $358,700 -24.67% 4 -20.00% 94.5%7702143 $433,900 -18.52% 5 -28.57% 97.5%7102144 $598,300 -2.67% 6 200.00% 95.5%6002145 $320,000 48.01% 8 0.00% 95.6%7702148 $271,300 -9.69% 59 73.53% 96.5%8002149 $236,700 -3.07% 26 18.18% 97.4%11602153 $290,000 N/A 1 N/A 100.0%3502155 $363,900 -0.19% 51 -13.56% 97.4%5502176 $413,200 2.45% 54 54.29% 98.6%6402180 $394,800 1.31% 33 43.48% 95.4%5802420 $752,300 3.75% 41 51.85% 96.8%9202421 $723,700 -10.05% 39 21.88% 96.5%9102451 $377,500 -1.77% 29 26.09% 96.8%8802452 $503,000 11.98% 22 22.22% 94.9%10202453 $395,000 10.00% 23 35.29% 96.8%5202458 $795,300 -13.55% 13 333.33% 94.0%7502459 $805,300 -13.88% 38 65.22% 96.1%7402460 $674,200 -2.01% 9 200.00% 96.9%5702461 $651,700 9.94% 9 -10.00% 96.8%5602462 $440,000 23.42% 3 50.00% 94.4%10702464 $653,300 37.54% 4 300.00% 95.1%6302465 $1,091,900 -4.72% 20 66.67% 95.0%8702466 $556,800 -17.01% 6 -14.29% 97.0%9302467 $1,208,100 17.94% 11 266.67% 96.0%9702468 $978,400 -13.35% 8 -20.00% 96.7%4002472 $440,600 -14.96% 20 66.67% 95.4%5302474 $484,700 -2.65% 38 100.00% 99.0%4502476 $538,800 0.71% 24 14.29% 97.7%4402478 $741,500 -9.44% 40 166.67% 95.5%7002493 $1,190,900 -10.20% 22 57.14% 89.8%147
17
*** % Change of current quarter compared to the same quarter to year ago.
Local Report
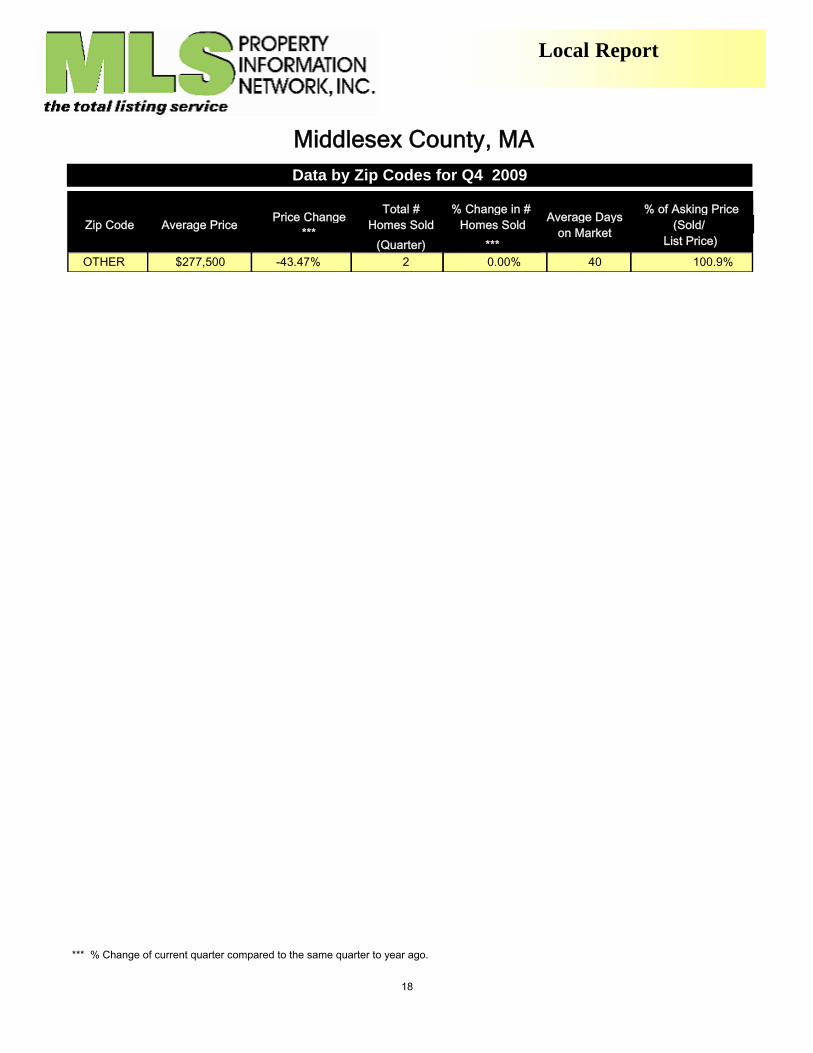
Middlesex County, MA
Zip Code Average Price Price Change***
Total #Homes Sold
(Quarter)
% Change in #Homes Sold
***
Average Dayson Market
% of Asking Price(Sold/
List Price)
Data by Zip Codes for Q4 2009
OTHER $277,500 -43.47% 2 0.00% 100.9%40
18
*** % Change of current quarter compared to the same quarter to year ago.
Local Report
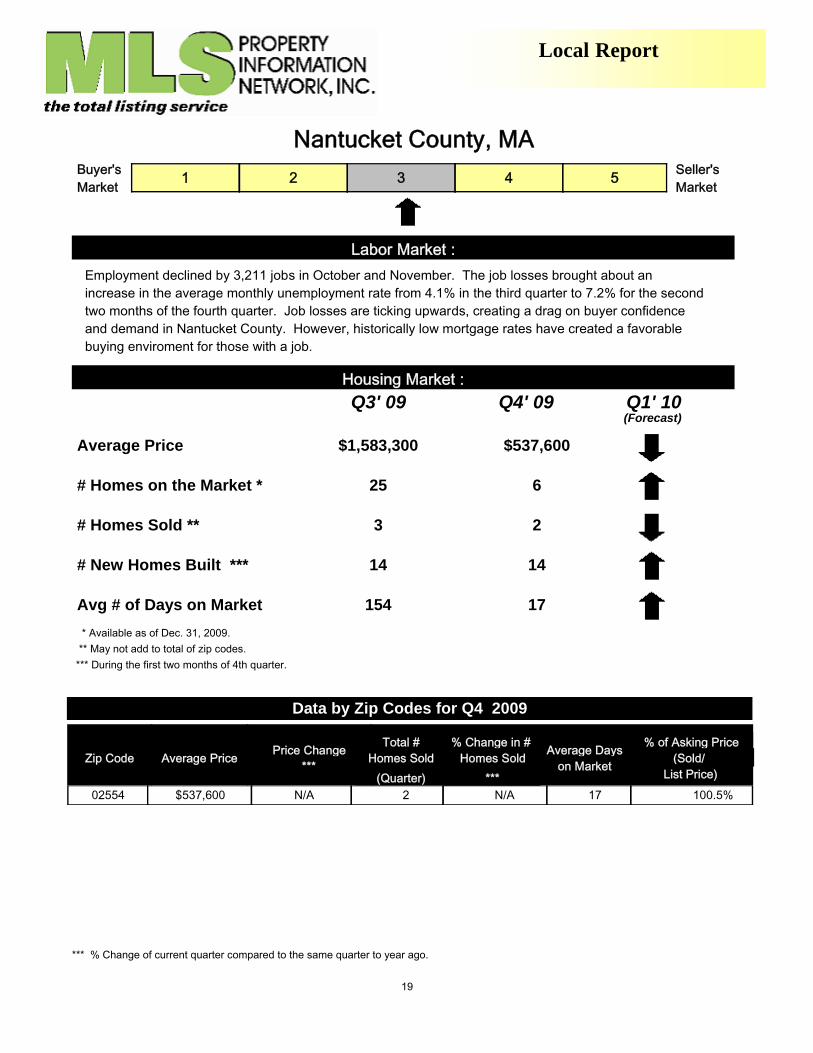
Nantucket County, MA
1 2 3 4 5 Seller's Market
Buyer's Market
Employment declined by 3,211 jobs in October and November. The job losses brought about an increase in the average monthly unemployment rate from 4.1% in the third quarter to 7.2% for the second two months of the fourth quarter. Job losses are ticking upwards, creating a drag on buyer confidence and demand in Nantucket County. However, historically low mortgage rates have created a favorable buying enviroment for those with a job.
Labor Market :
Housing Market :
(Forecast)Q3' 09 Q4' 09 Q1' 10
$1,583,300Average Price $537,600
25# Homes on the Market * 6
3# Homes Sold ** 2
14# New Homes Built *** 14 ***
154Avg # of Days on Market 17 * Available as of Dec. 31, 2009.
*** During the first two months of 4th quarter. ** May not add to total of zip codes.
Zip Code Average Price Price Change***
Total #Homes Sold
(Quarter)
% Change in #Homes Sold
***
Average Dayson Market
% of Asking Price(Sold/
List Price)
Data by Zip Codes for Q4 2009
02554 $537,600 N/A 2 N/A 100.5%17
19
*** % Change of current quarter compared to the same quarter to year ago.

Local Report
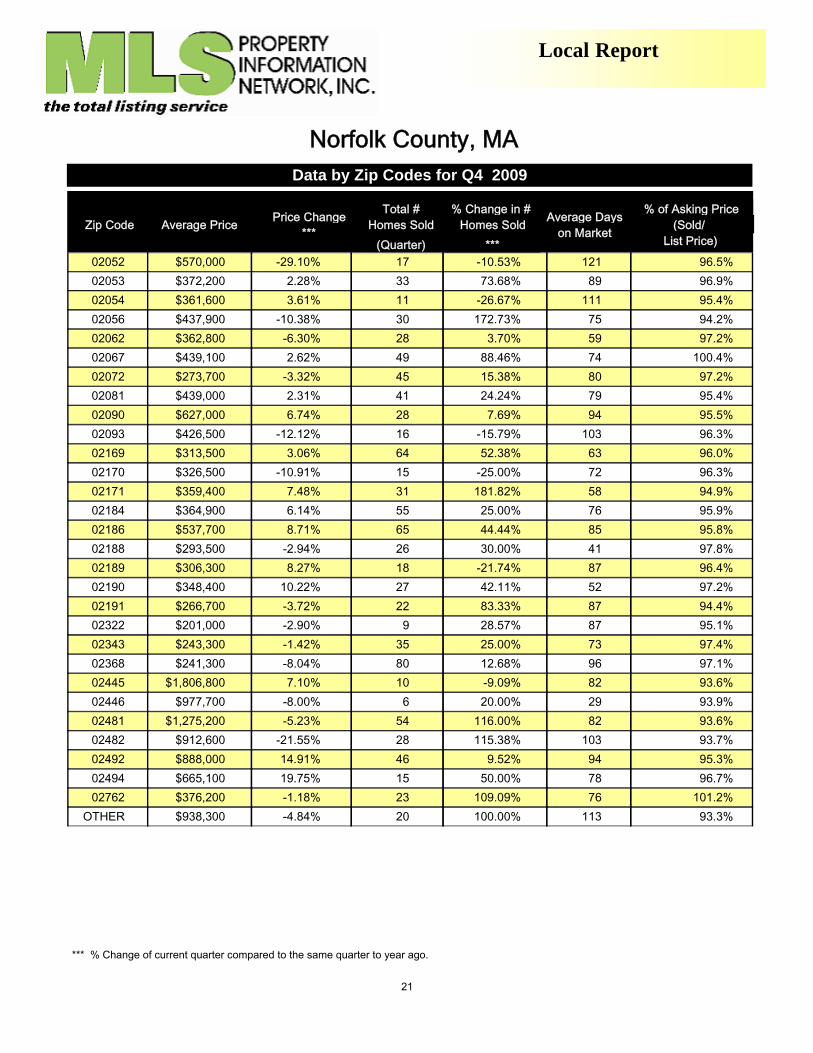
Norfolk County, MA
1 2 3 4 5 Seller's Market
Buyer's Market
In the first two months of the fourth quarter, 1,255 jobs were added to the payrolls of Norfolk County. As a result of these new jobs, the average monthly unemployment rate fell from 8.2% during the third quarter to 7.4% for October and November. This steady job creation may help to maintain demand for home purchases. Favorable mortgage rates should support this trend.
Labor Market :
Housing Market :
(Forecast)Q3' 09 Q4' 09 Q1' 10
$507,000Average Price $493,300
2,825# Homes on the Market * 1,931
1,484# Homes Sold ** 1,202
98# New Homes Built *** 93 ***
86Avg # of Days on Market 86 * Available as of Dec. 31, 2009.
*** During the first two months of 4th quarter. ** May not add to total of zip codes.
Zip Code Average Price Price Change***
Total #Homes Sold
(Quarter)
% Change in #Homes Sold
***
Average Dayson Market
% of Asking Price(Sold/
List Price)
Data by Zip Codes for Q4 2009
02019 $273,500 -3.83% 40 -2.44% 98.3%9502021 $427,700 -6.66% 37 54.17% 95.4%10302025 $957,700 9.82% 24 33.33% 92.3%16202026 $353,400 2.79% 44 -12.00% 96.7%7302027 $310,000 N/A 1 N/A 96.3%12902030 $1,032,900 -36.00% 20 42.86% 90.6%13402032 $431,700 14.94% 3 -25.00% 95.9%5802035 $395,900 1.88% 20 -4.76% 98.0%14002038 $398,500 -5.64% 66 40.43% 97.2%116
20
*** % Change of current quarter compared to the same quarter to year ago.
Local Report
Norfolk County, MA
Zip Code Average Price Price Change***
Total #Homes Sold
(Quarter)
% Change in #Homes Sold
***
Average Dayson Market
% of Asking Price(Sold/
List Price)
Data by Zip Codes for Q4 2009
02052 $570,000 -29.10% 17 -10.53% 96.5%12102053 $372,200 2.28% 33 73.68% 96.9%8902054 $361,600 3.61% 11 -26.67% 95.4%11102056 $437,900 -10.38% 30 172.73% 94.2%7502062 $362,800 -6.30% 28 3.70% 97.2%5902067 $439,100 2.62% 49 88.46% 100.4%7402072 $273,700 -3.32% 45 15.38% 97.2%8002081 $439,000 2.31% 41 24.24% 95.4%7902090 $627,000 6.74% 28 7.69% 95.5%9402093 $426,500 -12.12% 16 -15.79% 96.3%10302169 $313,500 3.06% 64 52.38% 96.0%6302170 $326,500 -10.91% 15 -25.00% 96.3%7202171 $359,400 7.48% 31 181.82% 94.9%5802184 $364,900 6.14% 55 25.00% 95.9%7602186 $537,700 8.71% 65 44.44% 95.8%8502188 $293,500 -2.94% 26 30.00% 97.8%4102189 $306,300 8.27% 18 -21.74% 96.4%8702190 $348,400 10.22% 27 42.11% 97.2%5202191 $266,700 -3.72% 22 83.33% 94.4%8702322 $201,000 -2.90% 9 28.57% 95.1%8702343 $243,300 -1.42% 35 25.00% 97.4%7302368 $241,300 -8.04% 80 12.68% 97.1%9602445 $1,806,800 7.10% 10 -9.09% 93.6%8202446 $977,700 -8.00% 6 20.00% 93.9%2902481 $1,275,200 -5.23% 54 116.00% 93.6%8202482 $912,600 -21.55% 28 115.38% 93.7%10302492 $888,000 14.91% 46 9.52% 95.3%9402494 $665,100 19.75% 15 50.00% 96.7%7802762 $376,200 -1.18% 23 109.09% 101.2%76
OTHER $938,300 -4.84% 20 100.00% 93.3%113
21
*** % Change of current quarter compared to the same quarter to year ago.

Local Report
Plymouth County, MA
1 2 3 4 5 Seller's Market
Buyer's Market
Plymouth County saw 429 layoffs occur during October and November. Despite the decline in employment, the average monthly unemployment rate fell from 9.4% during the third quarter to 8.8% in the first two months of the fourth quarter. Rising job losses are hurting demand, but historically low mortgage rates are improving affordability.
Labor Market :
Housing Market :
(Forecast)Q3' 09 Q4' 09 Q1' 10
$346,200Average Price $334,900
3,316# Homes on the Market * 2,391
1,150# Homes Sold ** 1,072
145# New Homes Built *** 110 ***
104Avg # of Days on Market 106 * Available as of Dec. 31, 2009.
*** During the first two months of 4th quarter. ** May not add to total of zip codes.
Zip Code Average Price Price Change***
Total #Homes Sold
(Quarter)
% Change in #Homes Sold
***
Average Dayson Market
% of Asking Price(Sold/
List Price)
Data by Zip Codes for Q4 2009
02043 $734,200 -6.92% 51 142.86% 94.6%14302045 $352,600 -12.79% 31 3.33% 94.1%14402047 $364,000 N/A 1 N/A 104.0%6602050 $386,500 1.87% 67 81.08% 96.2%10902051 $510,000 -12.07% 1 0.00% 92.9%2302059 $1,418,500 N/A 2 N/A 94.3%16102061 $507,900 9.75% 19 0.00% 96.2%12002066 $547,000 5.25% 30 -11.76% 95.2%13002301 $205,100 12.38% 93 6.90% 98.4%83
22
*** % Change of current quarter compared to the same quarter to year ago.

Local Report
Plymouth County, MA
Zip Code Average Price Price Change***
Total #Homes Sold
(Quarter)
% Change in #Homes Sold
***
Average Dayson Market
% of Asking Price(Sold/
List Price)
Data by Zip Codes for Q4 2009
02302 $167,900 5.93% 92 19.48% 98.5%6302303 $192,500 120.00% 1 0.00% 101.3%702324 $291,700 -14.76% 38 11.76% 97.7%9202330 $282,800 7.24% 20 -35.48% 96.7%13702332 $637,000 5.99% 32 33.33% 92.9%16302333 $286,400 -11.08% 25 -13.79% 97.6%9802338 $302,900 14.00% 28 86.67% 97.1%14902339 $403,100 5.28% 28 21.74% 95.1%7402341 $240,100 -27.18% 10 -33.33% 95.0%7502346 $259,200 -5.30% 55 57.14% 97.2%11802347 $285,000 -13.00% 22 22.22% 96.3%10702351 $286,500 -8.47% 28 21.74% 98.9%7702359 $322,800 -12.94% 28 -6.67% 96.7%10302360 $312,100 9.43% 147 23.53% 95.2%10602364 $359,600 -12.72% 36 63.64% 97.3%9602367 $251,300 -29.43% 6 0.00% 95.0%12602370 $272,100 7.21% 38 18.75% 97.3%9102379 $259,100 -16.69% 14 -6.67% 95.5%6402382 $275,700 1.47% 16 -50.00% 96.4%8802538 $191,400 15.23% 13 -7.14% 94.8%7802558 $205,600 -61.49% 5 25.00% 90.9%9202571 $213,500 -4.77% 34 9.68% 95.1%13602576 $168,900 -50.93% 12 100.00% 93.3%12602738 $765,300 -13.31% 17 41.67% 88.4%14802739 $409,700 -8.14% 20 66.67% 92.6%15502770 $300,600 -37.09% 11 22.22% 93.9%125
OTHER $135,200 -25.47% 1 -75.00% 69.3%236
23
*** % Change of current quarter compared to the same quarter to year ago.

Local Report
Suffolk County, MA
1 2 3 4 5 Seller's Market
Buyer's Market
In the first two months of the fourth quarter, 1,331 jobs were added to the payrolls of Suffolk County. As a result of these new jobs, the average monthly unemployment rate fell from 9% during the third quarter to 8.2% for October and November. This steady job creation may help to maintain demand for home purchases. Favorable mortgage rates should support this trend.
Labor Market :
Housing Market :
(Forecast)Q3' 09 Q4' 09 Q1' 10
$409,300Average Price $389,000
771# Homes on the Market * 547
367# Homes Sold ** 339
29# New Homes Built *** 3 ***
79Avg # of Days on Market 77 * Available as of Dec. 31, 2009.
*** During the first two months of 4th quarter. ** May not add to total of zip codes.
Zip Code Average Price Price Change***
Total #Homes Sold
(Quarter)
% Change in #Homes Sold
***
Average Dayson Market
% of Asking Price(Sold/
List Price)
Data by Zip Codes for Q4 2009
02108 $2,760,000 -49.82% 4 300.00% 89.8%8502114 $2,300,000 39.39% 1 0.00% 95.8%202116 $1,680,100 18.37% 5 150.00% 93.7%24602118 $1,325,000 -2.13% 1 -75.00% 95.3%22402119 $125,600 -40.45% 3 -40.00% 94.6%9402121 $232,300 40.79% 2 0.00% 93.1%5202122 $283,800 4.03% 7 -41.67% 96.4%5702124 $257,800 1.94% 23 53.33% 95.4%8002125 $303,900 68.18% 9 12.50% 99.8%75
24
*** % Change of current quarter compared to the same quarter to year ago.

Local Report
Suffolk County, MA
Zip Code Average Price Price Change***
Total #Homes Sold
(Quarter)
% Change in #Homes Sold
***
Average Dayson Market
% of Asking Price(Sold/
List Price)
Data by Zip Codes for Q4 2009
02126 $195,200 1.35% 21 0.00% 99.3%8202127 $391,000 -18.47% 20 233.33% 96.1%5402128 $197,000 2.66% 12 33.33% 92.1%9902129 $583,900 -14.42% 17 88.89% 95.6%10502130 $642,400 25.76% 17 41.67% 96.8%8602131 $344,100 3.61% 27 58.82% 97.2%7102132 $401,000 3.75% 47 27.03% 96.7%7202135 $420,000 -6.87% 11 266.67% 97.4%5302136 $299,700 27.48% 33 32.00% 97.0%5702150 $166,600 -12.96% 8 33.33% 92.1%8102151 $236,300 -8.20% 54 -15.63% 98.8%8302152 $320,300 1.91% 17 54.55% 95.8%67
25
*** % Change of current quarter compared to the same quarter to year ago.

Local Report
Worcester County, MA
1 2 3 4 5 Seller's Market
Buyer's Market
In the first two months of the fourth quarter, 2,637 jobs were added to the payrolls of Worcester County. As a result of these new jobs, the average monthly unemployment rate fell from 10% during the third quarter to 9.1% for October and November. This steady job creation may help to maintain demand for home purchases. Favorable mortgage rates should support this trend.
Labor Market :
Housing Market :
(Forecast)Q3' 09 Q4' 09 Q1' 10
$255,700Average Price $253,300
4,804# Homes on the Market * 3,616
1,651# Homes Sold ** 1,610
171# New Homes Built *** 112 ***
109Avg # of Days on Market 108 * Available as of Dec. 31, 2009.
*** During the first two months of 4th quarter. ** May not add to total of zip codes.
Zip Code Average Price Price Change***
Total #Homes Sold
(Quarter)
% Change in #Homes Sold
***
Average Dayson Market
% of Asking Price(Sold/
List Price)
Data by Zip Codes for Q4 2009
01005 $186,400 -1.64% 6 -14.29% 95.9%17901037 $273,400 43.89% 9 200.00% 92.0%10401068 $307,500 4.45% 4 0.00% 91.5%15901083 $180,400 14.03% 8 -42.86% 99.3%13701331 $140,300 19.51% 37 -5.13% 96.4%11701366 $240,600 10.72% 3 0.00% 83.5%21301368 $110,000 -41.18% 1 -66.67% 95.7%4501420 $157,100 -3.02% 80 35.59% 97.1%8601430 $231,100 31.01% 23 130.00% 95.5%154
26
*** % Change of current quarter compared to the same quarter to year ago.
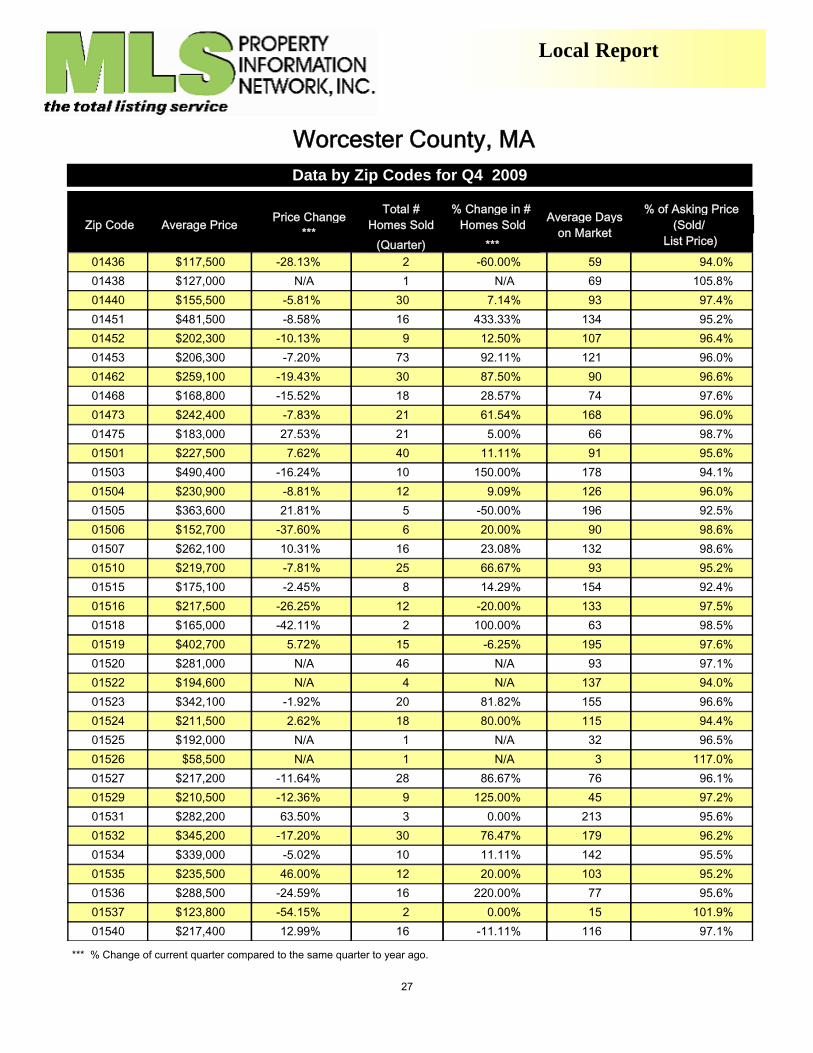
Local Report
Worcester County, MA
Zip Code Average Price Price Change***
Total #Homes Sold
(Quarter)
% Change in #Homes Sold
***
Average Dayson Market
% of Asking Price(Sold/
List Price)
Data by Zip Codes for Q4 2009
01436 $117,500 -28.13% 2 -60.00% 94.0%5901438 $127,000 N/A 1 N/A 105.8%6901440 $155,500 -5.81% 30 7.14% 97.4%9301451 $481,500 -8.58% 16 433.33% 95.2%13401452 $202,300 -10.13% 9 12.50% 96.4%10701453 $206,300 -7.20% 73 92.11% 96.0%12101462 $259,100 -19.43% 30 87.50% 96.6%9001468 $168,800 -15.52% 18 28.57% 97.6%7401473 $242,400 -7.83% 21 61.54% 96.0%16801475 $183,000 27.53% 21 5.00% 98.7%6601501 $227,500 7.62% 40 11.11% 95.6%9101503 $490,400 -16.24% 10 150.00% 94.1%17801504 $230,900 -8.81% 12 9.09% 96.0%12601505 $363,600 21.81% 5 -50.00% 92.5%19601506 $152,700 -37.60% 6 20.00% 98.6%9001507 $262,100 10.31% 16 23.08% 98.6%13201510 $219,700 -7.81% 25 66.67% 95.2%9301515 $175,100 -2.45% 8 14.29% 92.4%15401516 $217,500 -26.25% 12 -20.00% 97.5%13301518 $165,000 -42.11% 2 100.00% 98.5%6301519 $402,700 5.72% 15 -6.25% 97.6%19501520 $281,000 N/A 46 N/A 97.1%9301522 $194,600 N/A 4 N/A 94.0%13701523 $342,100 -1.92% 20 81.82% 96.6%15501524 $211,500 2.62% 18 80.00% 94.4%11501525 $192,000 N/A 1 N/A 96.5%3201526 $58,500 N/A 1 N/A 117.0%301527 $217,200 -11.64% 28 86.67% 96.1%7601529 $210,500 -12.36% 9 125.00% 97.2%4501531 $282,200 63.50% 3 0.00% 95.6%21301532 $345,200 -17.20% 30 76.47% 96.2%17901534 $339,000 -5.02% 10 11.11% 95.5%14201535 $235,500 46.00% 12 20.00% 95.2%10301536 $288,500 -24.59% 16 220.00% 95.6%7701537 $123,800 -54.15% 2 0.00% 101.9%1501540 $217,400 12.99% 16 -11.11% 97.1%116
27
*** % Change of current quarter compared to the same quarter to year ago.

Local Report
Worcester County, MA
Zip Code Average Price Price Change***
Total #Homes Sold
(Quarter)
% Change in #Homes Sold
***
Average Dayson Market
% of Asking Price(Sold/
List Price)
Data by Zip Codes for Q4 2009
01541 $284,800 54.03% 3 -40.00% 93.5%20201542 $205,300 1.63% 2 -50.00% 95.9%11101543 $284,200 -7.46% 27 145.45% 97.7%13101545 $385,500 -5.45% 83 69.39% 96.7%7901550 $158,000 -8.56% 27 0.00% 93.1%9501560 $260,600 -39.86% 6 100.00% 95.1%7301562 $213,500 1.52% 29 45.00% 96.1%15901564 $296,700 -8.48% 15 0.00% 96.5%12001566 $266,200 -8.65% 21 5.00% 96.0%14901568 $426,200 -7.49% 21 61.54% 98.2%19301569 $304,800 23.10% 25 92.31% 97.2%8401570 $185,800 -2.11% 25 19.05% 95.8%12301571 $257,900 21.77% 32 52.38% 96.0%15201581 $413,600 4.42% 38 52.00% 93.7%13301583 $255,700 15.02% 17 30.77% 98.8%12601585 $189,800 -14.35% 9 80.00% 94.7%11001588 $256,500 -16.80% 12 -33.33% 96.3%9001590 $323,200 -9.54% 22 175.00% 95.0%10901602 $203,500 8.07% 55 27.91% 96.6%8501603 $169,600 18.93% 29 20.83% 95.9%7601604 $176,900 -4.17% 48 33.33% 96.2%7901605 $190,300 4.79% 43 38.71% 97.4%11201606 $201,800 3.54% 61 38.64% 98.3%9001607 $176,700 -2.54% 35 218.18% 101.5%7601609 $349,600 37.69% 22 57.14% 92.5%9901610 $125,100 0.24% 8 0.00% 95.5%8201611 $189,200 49.92% 4 -20.00% 98.2%9101612 $296,600 43.91% 10 42.86% 92.6%6201740 $448,400 -22.27% 15 25.00% 94.9%17001747 $247,400 -18.67% 15 114.29% 96.5%10001756 $350,500 1.01% 15 66.67% 96.8%6301757 $263,200 3.18% 49 11.36% 95.2%7001772 $513,500 18.29% 26 116.67% 95.3%97
OTHER $200,000 -24.16% 2 -95.35% 97.8%63
28
*** % Change of current quarter compared to the same quarter to year ago.
Local Report
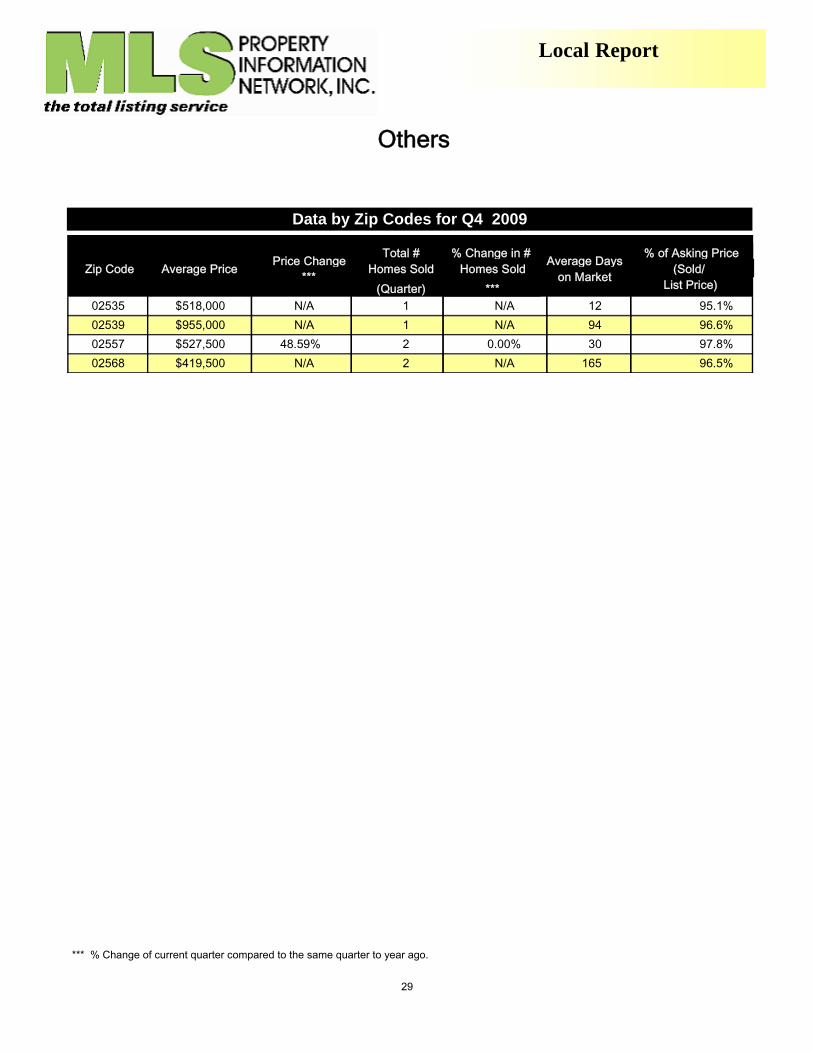
Others
Zip Code Average Price Price Change***
Total #Homes Sold
(Quarter)
% Change in #Homes Sold
***
Average Dayson Market
% of Asking Price(Sold/
List Price)
Data by Zip Codes for Q4 2009
02535 $518,000 N/A 1 N/A 95.1%1202539 $955,000 N/A 1 N/A 96.6%9402557 $527,500 48.59% 2 0.00% 97.8%3002568 $419,500 N/A 2 N/A 96.5%165
29
*** % Change of current quarter compared to the same quarter to year ago.
30
Trends
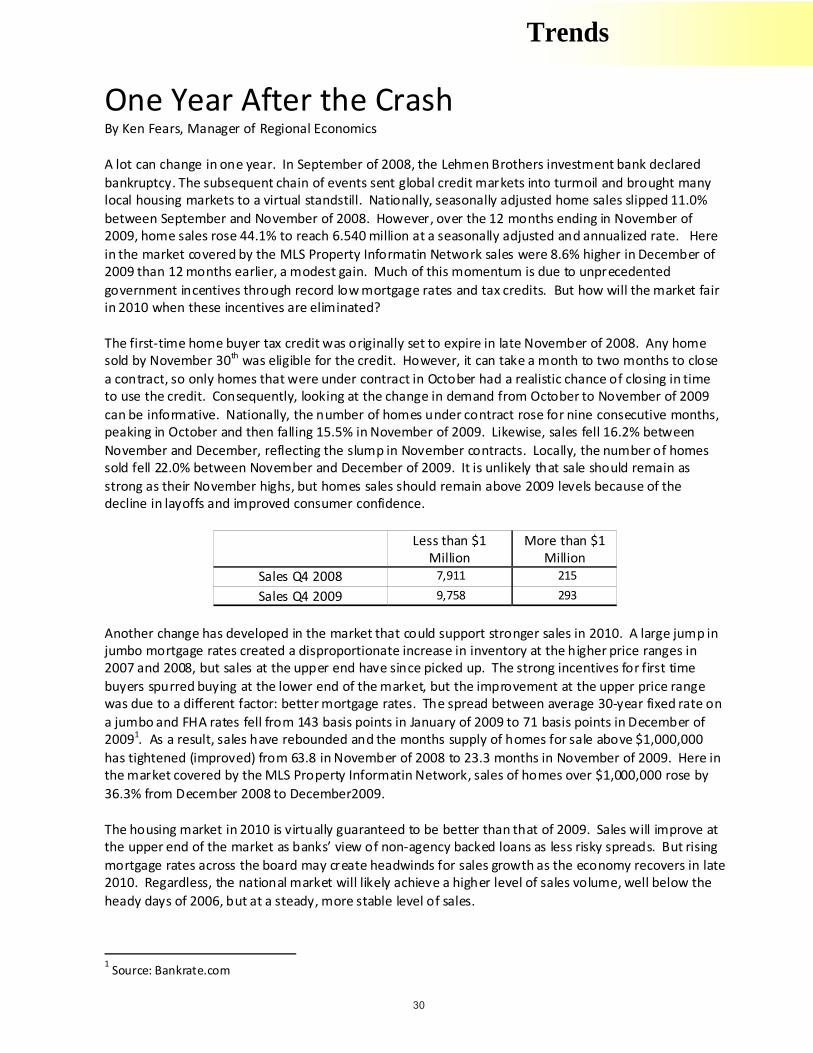
One Year After the Crash By Ken Fears, Manager of Regional Economics A lot can change in one year. In September of 2008, the Lehmen Brothers investment bank declared bankruptcy. The subsequent chain of events sent global credit markets into turmoil and brought many local housing markets to a virtual standstill. Nationally, seasonally adjusted home sales slipped 11.0% between September and November of 2008. However, over the 12 months ending in November of 2009, home sales rose 44.1% to reach 6.540 million at a seasonally adjusted and annualized rate. Here in the market covered by the MLS Property Informatin Network sales were 8.6% higher in December of 2009 than 12 months earlier, a modest gain. Much of this momentum is due to unprecedented government incentives through record low mortgage rates and tax credits. But how will the market fair in 2010 when these incentives are eliminated? The first‐time home buyer tax credit was originally set to expire in late November of 2008. Any home sold by November 30th was eligible for the credit. However, it can take a month to two months to close a contract, so only homes that were under contract in October had a realistic chance of closing in time to use the credit. Consequently, looking at the change in demand from October to November of 2009 can be informative. Nationally, the number of homes under contract rose for nine consecutive months, peaking in October and then falling 15.5% in November of 2009. Likewise, sales fell 16.2% between November and December, reflecting the slump in November contracts. Locally, the number of homes sold fell 22.0% between November and December of 2009. It is unlikely that sale should remain as strong as their November highs, but homes sales should remain above 2009 levels because of the decline in layoffs and improved consumer confidence.
Less than $1 Million
More than $1 Million
Sales Q4 2008 7,911 215
Sales Q4 2009 9,758 293 Another change has developed in the market that could support stronger sales in 2010. A large jump in jumbo mortgage rates created a disproportionate increase in inventory at the higher price ranges in 2007 and 2008, but sales at the upper end have since picked up. The strong incentives for first time buyers spurred buying at the lower end of the market, but the improvement at the upper price range was due to a different factor: better mortgage rates. The spread between average 30‐year fixed rate on a jumbo and FHA rates fell from 143 basis points in January of 2009 to 71 basis points in December of 20091. As a result, sales have rebounded and the months supply of homes for sale above $1,000,000 has tightened (improved) from 63.8 in November of 2008 to 23.3 months in November of 2009. Here in the market covered by the MLS Property Informatin Network, sales of homes over $1,000,000 rose by 36.3% from December 2008 to December2009. The housing market in 2010 is virtually guaranteed to be better than that of 2009. Sales will improve at the upper end of the market as banks’ view of non‐agency backed loans as less risky spreads. But rising mortgage rates across the board may create headwinds for sales growth as the economy recovers in late 2010. Regardless, the national market will likely achieve a higher level of sales volume, well below the heady days of 2006, but at a steady, more stable level of sales.
1 Source: Bankrate.com
Commentary
31
A New Year: Good Prospects, Lingering Challengesby Lawrence Yun, NAR Chief Economist
Happy New Year! I think we were all glad to say good-bye to 2009 and the recession, a suffering jobmarket, and at least for most of the year , very sluggish housing activity .
Fortunately, towards the end of last year things were looking up for housing (finally). As we saw, the firsttime home buyer tax credit provided a strong incentive for buyers to enter the market. From a sales pace of4.5 million units (seasonally adjusted annualized pace) in the immediate months prior to the tax creditstimulus, existing-home sales soared to 6.1 million and 6.5 million in October and November , respectively.Now with the tax credit having been extended (and expanded) and the new deadline not looming until themiddle of 2010, the deep cold winter will bring us a few calm months before another surge in home sales inspring and early summer . Of course, the big question is, once the tax credit goes away in the second half ofthe year, what can we expect?
The key to a real and sustainable housing market recovery can be summed up in one word: jobs! The jobmarket continues to struggle despite recent respectable gains in production. That is, total production asmeasured by GDP grew for the first time in two years in the third quarter of 2009, by a decent 2.2 percentgrowth rate. Early indications are that the economy expanded by better than 4 percent in the final (fourth)quarter of 2009. Based on many economic indicators - from consumer credit and retail sales to the need forinventory restocking and rising exports - GDP is expected to expand by close to 3 percent for all of 2010.While that 3 percent GDP growth is somewhat lackluster coming out of a deep recession, the worst isdefinitively over.
Even as production rises, companies coming out of a recession push their existing workers to do morerather than hiring new workers to raise production. Not surprisingly, the unemployment rate remained high at10 percent in December as far fewer people were working (or even looking for work) during the month. InDecember a net 85,000 payroll jobs were lost according to company survey data in December tracked bythe Bureau of Labor Statistics. In a separate survey of households which asks people whether or not theyhave a job, there were 589,000 net fewer jobs. Since the beginning of the recession two years ago, thecountry has shed 7.2 million jobs. Over the short term, the unemployment rate will, I'm afraid, go higher -possibly even to 10.5 percent, particularly if many of the discouraged workers re-enter the labor force andstart applying for a job.
However, there are several signs pointing towards potentially consistent job creation in the second half ofthe year. In December, temporary help employment rose for a fifth straight month. Because many companiesfirst turn to such "temp" jobs coming out of a recession, this rising trend should imply permanent jobcreations starting in few months. Past historical experience also show that temp jobs rise before permanentjobs.
Sector by sector, manufacturing companies continue to bleed heavily while jobs are still being cut sharply inconstruction because of weak housing starts and near total collapse in new commercial real estateconstruction. Jobs at state and local governments fell slightly in December . There will be continuing pressurethroughout this year for further job cuts as most state and local governments are running relatively highbudget deficits and generally by law have to balance their books.
There are some bright spots. Those sectors that have been gaining jobs consistently have been in health careservice and in education. For a recent college graduate with a nursing or education degree, the job

32
Commentary
prospects are much better. Another sector that had been hammered badly but is now showing job additionsis the professional business service sector (e.g., accounting, management consulting, and law offices) whichadded about 50,000 payrolls in December . That could signal some good news for commercial real estate:these job gains will require office space, so this could be the very first sign of potential improvement andbusiness opportunities for commercial REAL TORS®.
Another bright spot: 2010, fortunately , happens to be the year of the Census and the counting of people.Consequently, the government will hire about one million people this year to collect and process the data.Yes, these jobs will be mostly temporary . But nonetheless it will provide jobs and income support until theprivate sector begins to add jobs on a permanent basis. Currently, the private sector is on the sidelines witha wait-and-see approach. But with overall production continuing to gain respectably , the private sector willeventually need to boost payroll. As the home buyer tax credit expires in June, private sector job creationwill be key to a sustainable housing market recovery . My best guess is about 100,000 net job gains permonth in the second half of the year .
Assuming the job market does turn around then, home sales for the year will be about 10 percent higher in2010 compared to 2009. With inventory being absorbed, home values will likely squeak out a gain for theyear as a whole. That is important in terms of boosting consumer confidence about home buying.
Home values are also important for boosting income for REAL TORS®. Residential brokerage commissionfell in 2009 by 6.2 percent to $40.6 billion according to Real Trends. That figure is roughly in line withNAR's estimated 8 percent decline in average commission income based on 5 percent higher unit sales but13 percent decline in home values in 2009. While it's true that REAL TORS® were much busier than normalin 2009 - both in terms of having more customers as well as having to spend longer on home salestransactions (particularly in regards to short-sales) - lower home values led to overall reduction in income onaverage.
Based on our home sales and home price projections for 2010, I think we can expect about a 12 to 19percent rise in overall commission income in 2010. The forecast is never "on the money" (no pun intended)and the actual figure could be measurably higher or lower . Still, I'm comfortable in saying that following fouryears of a housing market recession, aggregate income is more likely to be up because of the tax credit inthe first half of the year and the job creation in the second half.
However, any rise in the aggregate commission income for REAL TORS® as a whole may not be reflectedin the income for individual REAL TORS® if many more people enter the profession. (Remember , thishappened during the housing boom years.) Those contemplating entering the profession need to be aware ofthe business challenges in the early years of a real estate career. The average income of REA LTORS® withless than two years of experience is well below $20,000 per year before expenses. In addition, referrals andpersonal relationships have been the dominant factors in drawing new clients. Over 80 percent of recenthome buyers and home sellers recommend (or will likely recommend) their specific REAL TOR® tocolleagues, friends, and family members. As with any dynamic entrepreneurial business, there will be somestart-ups who will do very well, but the initial edge in real estate business will be with veterans who haveserved their clients well in the past.
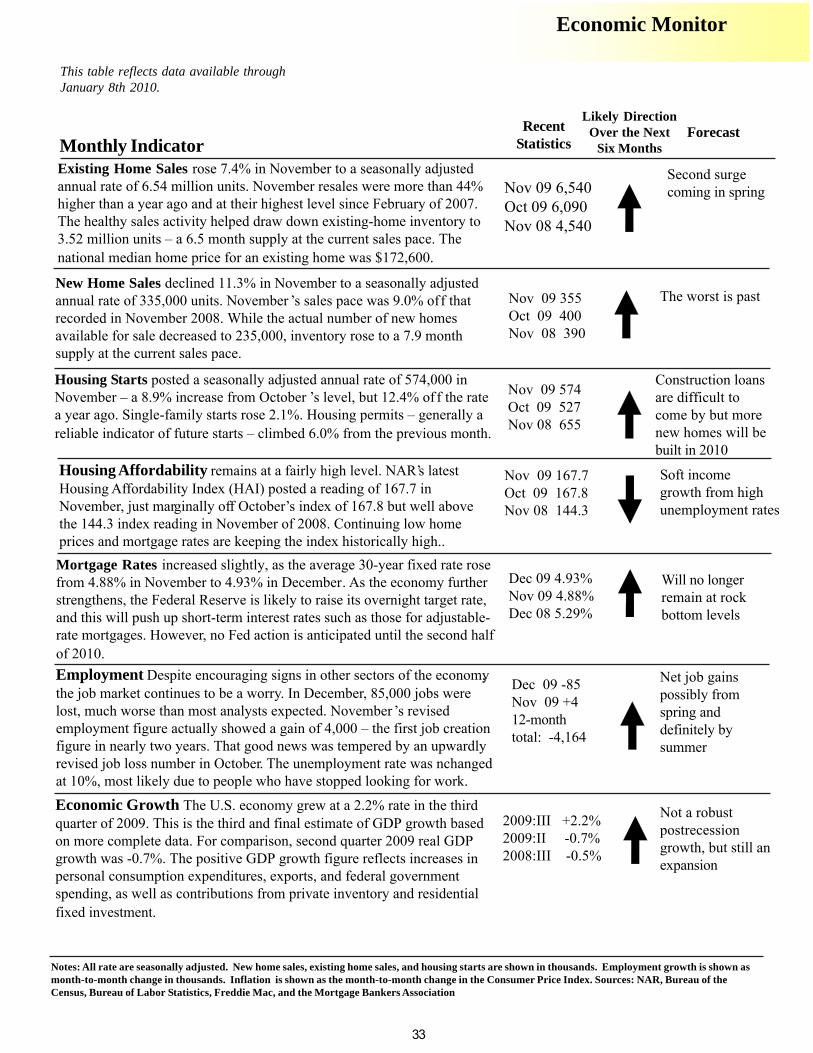
Mortgage Rates increased slightly, as the average 30-year fixed rate rosefrom 4.88% in November to 4.93% in December. As the economy furtherstrengthens, the Federal Reserve is likely to raise its overnight target rate,and this will push up short-term interest rates such as those for adjustable-rate mortgages. However, no Fed action is anticipated until the second halfof 2010.
Existing Home Sales rose 7.4% in November to a seasonally adjustedannual rate of 6.54 million units. November resales were more than 44%higher than a year ago and at their highest level since February of 2007.The healthy sales activity helped draw down existing-home inventory to3.52 million units – a 6.5 month supply at the current sales pace. Thenational median home price for an existing home was $172,600.
New Home Sales declined 11.3% in November to a seasonally adjustedannual rate of 335,000 units. November ’s sales pace was 9.0% off thatrecorded in November 2008. While the actual number of new homesavailable for sale decreased to 235,000, inventory rose to a 7.9 monthsupply at the current sales pace.
Housing Starts posted a seasonally adjusted annual rate of 574,000 inNovember – a 8.9% increase from October ’s level, but 12.4% of f the ratea year ago. Single-family starts rose 2.1%. Housing permits – generally areliable indicator of future starts – climbed 6.0% from the previous month.
Employment Despite encouraging signs in other sectors of the economy,the job market continues to be a worry. In December, 85,000 jobs werelost, much worse than most analysts expected. November ’s revisedemployment figure actually showed a gain of 4,000 – the first job creationfigure in nearly two years. That good news was tempered by an upwardlyrevised job loss number in October. The unemployment rate was nchangedat 10%, most likely due to people who have stopped looking for work.
Economic Growth The U.S. economy grew at a 2.2% rate in the thirdquarter of 2009. This is the third and final estimate of GDP growth basedon more complete data. For comparison, second quarter 2009 real GDPgrowth was -0.7%. The positive GDP growth figure reflects increases inpersonal consumption expenditures, exports, and federal governmentspending, as well as contributions from private inventory and residentialfixed investment.
Housing Affordability remains at a fairly high level. NAR’ s latestHousing Affordability Index (HAI) posted a reading of 167.7 inNovember, just marginally off October’s index of 167.8 but well abovethe 144.3 index reading in November of 2008. Continuing low homeprices and mortgage rates are keeping the index historically high..
Economic Monitor
This table reflects data available throughJanuary 8th 2010.
Dec 09 4.93%Nov 09 4.88%Dec 08 5.29%
Will no longerremain at rockbottom levels
Monthly IndicatorForecastRecent
Statistics
Likely DirectionOver the Next
Six Months
Nov 09 6,540Oct 09 6,090Nov 08 4,540
Second surgecoming in spring
The worst is past
Construction loansare difficult tocome by but morenew homes will bebuilt in 2010
Net job gainspossibly fromspring anddefinitely bysummer
Not a robustpostrecessiongrowth, but still anexpansion
Soft incomegrowth from highunemployment rates
Notes: All rate are seasonally adjusted. New home sales, existing home sales, and housing starts are shown in thousands. Employment growth is shown asmonth-to-month change in thousands. Inflation is shown as the month-to-month change in the Consumer Price Index. Sources: NAR, Bureau of theCensus, Bureau of Labor Statistics, Freddie Mac, and the Mortgage Bankers Association
33
Dec 09 -85Nov 09 +412-monthtotal: -4,164
2009:III +2.2%2009:II -0.7%2008:III -0.5%
Nov 09 355Oct 09 400Nov 08 390
Nov 09 574Oct 09 527Nov 08 655
Nov 09 167.7Oct 09 167.8Nov 08 144.3