economic and financial aspects of the global …...economic and financial aspects of the global...
TRANSCRIPT

GHP Study Paper 2:
ECONOMIC AND FINANCIAL ASPECTS OF THE GLOBAL HEALTH PARTNERSHIPS
This paper forms part of the 2004 DFID Study: Global Health Partnerships: Assessing the Impact.
Mark Pearson DFID Health Resource Centre 27 Old Street London EC1V 9HL Tel: +44 (0) 207 251 9555 Fax: +44 (0) 207 251 9552

Title: Economic and Financial Aspects of the Global Health Partnerships Author: Mark Pearson
DFID Health Resource Centre 27 Old Street London EC1V 9HL Tel: +44 (0) 20 7251 9555 Fax: +44 (0) 20 7251 9552

Table of Contents Abbreviations .......................................................................................................... 1
Executive Summary ................................................................................................ 2
1 Main Report: Key Findings ............................................................................. 5 1.1 Introduction..................................................................................................... 5 1.2 Tracking Expenditure ..................................................................................... 5 1.3 Additionality.................................................................................................... 5 1.4 Adequacy ........................................................................................................ 7 1.5 Sustainability and Aid Dependency .............................................................. 8 1.6 Cost Effectiveness and Efficiency............................................................... 10 1.7 Needs Based Allocation............................................................................... 11 1.8 MDG Perspective .......................................................................................... 13 1.9 Financing Model ........................................................................................... 14 1.10 Financial Management ............................................................................... 14 1.11 Other Constraints ....................................................................................... 15 1.12 Country Level Issues.................................................................................. 15 1.13 DFID Policy Options ................................................................................... 17
Annex 1: Relationship Between Inputs, Outputs and Outcomes....................... 19
Annex 2: Financing Impact................................................................................... 44
Annex 3: Key Funding Source and Needs of the Major GHPS........................... 71
Annex 4: Key Documents ..................................................................................... 74

Economic and Financial Aspects of the Global Health Partnerships 1
DFID Health Resource Centre
ABBREVIATIONS
ART Anti Retroviral Therapy CCM Country Coordinating Mechanism CMH Commission for Macroeconomics and Health CRS Creditor Reporting Systems DAC Development Assistance Committee EPI Expanded Programme of Immunisation GAVI Global Alliance for Vaccines and Immunisation GDF Global Drugs Facility GDP Gross Domestic Product GHP Global Health Programme GFATM Global Fund To Fight AIDS, TB and Malaria GPEI Global Polio Eradication Initiative GPG Global Public Good HIPC Heavily Indebted Poor Countries Initiative IAVI International AIDS Vaccine Initiative IDA International Development Association IFF International Financing Facility IMF International Monetary Fund MAP Multi Country HIV/AIDS Program MDG Millennium Development Goals MoF/(F)MoH (Federal) Ministry of Finance/Health MTEF Medium Term Expenditure Framework NGO Non Government Organisation ODA Official Development Assistance OECD Organisation for Economic Co-operation and Development PEPFAR President's Emergency Plan for AIDS Relief PSA Public Service Agreement
PPP Public Private Partnership PRSP Poverty Reduction Strategy Paper R&D Research and Development RBM Roll Back Malaria STD Sexually Transmitted Diseases SWAp Sector Wide Approach WHO World Health Organisation

Economic and Financial Aspects of the Global Health Partnerships 2
DFID Health Resource Centre
EXECUTIVE SUMMARY
I. Global Health Partnerships (GHPs) have brought, and will continue to bring, welcome additional resources to support country efforts to combat communicable diseases. However, in themselves they will be insufficient to provide countries with the financial means required to deliver a reasonable package of basic health services. Paradoxically, at the same time the very size of the financing GHPs poses major challenges in terms of:
• managing public finances to ensure that the increased aid flows can be absorbed without compromising macroeconomic stability and
• financial sustainability in terms of sustaining the activities supported by the GHPs and the increased aid dependence implied
ii. Although not particularly large in terms of overall funding for health in developing countries, the financing GHPs do play a major funding role in some countries - particularly low income countries. Together with other health initiatives such as PEPFAR and MAP and assuming funds are disbursed as planned, these GHPs are likely to double the level of resources for health in around 10 countries and significantly increase it in many others. It is fairly obvious that these countries will be unable to sustain the activities and services promoted by the GHPs through their own resources in the medium term. The fact that the GHP model often envisages further expansion to develop and introduce new products and/or expand existing ones means there is a major risk that countries future spending patterns will be dictated by the GHPs rather than by the countries’ own priorities (if the two differ, as they are likely to) for some time to come. These pressures will vary by disease – according to GFATM the funding needs for HIV/AIDS are likely to rise steadily for at least a decade, a pattern likely to be repeated for TB, whilst funding requirements for malaria, though subject to much uncertainty, may begin to decline after 2010. The cost savings from GHPs which aim to eliminate or eradicate diseases are likely to be minor – with the exception of polio – and do little to offset these increasing funding needs. An important question for DFID is whether it should focus its efforts on GHP expansion or whether it should seek to assist countries consolidate earlier efforts through budget or sector support where appropriate. Such decisions would need to consider, amongst other things, the overall performance of the GHP in question, the specific programmes or directions being promoted by the GHP, and also the fallout from not supporting a particular GHP. There is a risk there that DFID may become locked into a cycle of support for GHPs either directly or by helping meet their recurrent implications. Similar questions will also apply to the use of the International Financing Facility (IFF). Though the mechanism is due to be piloted as a means of promoting market development of new vaccines, it will presumably also be used to meet the recurrent implications of the GHPs. iii. In terms of macroeconomic stability, the evidence suggests that it is volatility in aid flows rather than the magnitude of support which is the key factor. The demand based approach to proposals adopted by GFATM (by far the largest financial GHP), and the fact that it only guarantees funding for two years, has its strengths but is not necessarily conducive to greater predictability in funding. iv. The GHPs are beginning to deliver significant additional funding for communicable diseases and other GPGs. For malaria and TB, proposed GFATM funding far exceeds recent levels of donor funding for the diseases so even if funding through other channels were to decline, or even stop, overall spending should still increase. For HIV/AIDS GFATM funding is less significant though here there is some evidence,

Economic and Financial Aspects of the Global Health Partnerships 3
DFID Health Resource Centre
at least up to 2002, that funding through alternative bilateral and multilateral sources has been increasing anyway and has supplemented rather than undermined by GFATM flows. These trends need to be seen against a backdrop of strong growth in development assistance for health which has been sustained over the last three decades and has seen significant increases in real donor spending on health and population (of the order of 3% per annum since 1975). Donor support for health has increased rapidly as a share as overall development assistance as the latter stagnated in the 1990s and is only now beginning to increase again. There is little evidence of displacement (or fungibility) at country level – either by donors or by Governments. However, it is perhaps too soon for such changes to be reflected in strategic plans and expenditure frameworks yet and it may be worth revisiting this issue in two or three years time. There are some concerns though that increased support for the GHPs has been at the expense of support for key interventions such as water and sanitation and family planning. Whilst the Foundations – especially the Bill and Melinda Gates Foundation - have provided considerable financial support and been instrumental in the establishment of a number of GHPs there is little evidence that donors have been able to leverage additional funds from a wide range of new sources and significantly diversify the funding base. Other financial contributions from the non Government sector have been modest though there have been additional, but often unquantified, in-kind contributions. Such funding has, however, in some cases provided important seed money to establish GHPs (e.g. MSF and DNDi and Until There’s a Cure for IAVI) which have subsequently attracted additional resources from traditional donors. v. The earmarked nature of GHPs undermines country level control of expenditure management processes. This is compounded by additionality conditions attached to some of the GHPs. Together these factors raise a series of fundamental questions. Who should determine priorities - Governments or donors? Should Governments be allowed to set their own priorities and make their own mistakes or do donors know best? The key question, therefore, is less about whether the GHPs are distortionary but more about whether the distortions introduced improve the global allocation of resources, and more specifically whether such distortions are a price worth paying. The evidence tends to suggest that the financing GHPs do improve the overall allocation of resources but cannot resolve the more important second issue. They appear to be relatively well targeted towards diseases which present the largest burden of ill health and to countries in greatest need in terms of socio economic status and especially so when viewed in relation to recent trends in development assistance for health and population. Typically over 60% of the financing GHP resources are channelled to Africa, where communicable diseases account for over 70% of the burden of disease and infectious and parasitic diseases alone account for more than half. The share of GHP funding going to low income countries is extremely high – over 98% for GAVI and GPEI and almost 78% for GFATM. This compares to around 64% for OECD donors as a whole. Lower income countries tend to get higher per capita allocations than better off ones. The GHPs are largely self targeting in that they focus on diseases which have the largest impact on the poor. However, they often operate within systems which are far from pro poor. It will be important therefore to ensure that investment in GHPs is not at the expense of investments in system strengthening. vi. Most interventions funded by GHPs are potentially highly cost effective. This applies also to the newer vaccines being promoted by GAVI which, although costly, are also likely to be cost effective in many settings. ART is an exception – though perhaps justified on social justice grounds, it cannot be justified on the basis of its cost effectiveness. GHPs also offer the potential to develop new products which, in time, will hopefully offer cost effective alternatives to current methods.

Economic and Financial Aspects of the Global Health Partnerships 4
DFID Health Resource Centre
vii. If DFID is interested in assessing the cost effectiveness of the GHPs, it will be important to get better data on expenditure by type of intervention. In terms of resource allocation DFID will need to consider whether the global allocation of GHP resources is good enough to warrant further investment or, if gaps are identified, whether DFID should channel more resource bilaterally. Key questions will include the balance between diseases, the balance within diseases (e.g. between prevention and cure) and also whether important conditions (e.g. reproductive health) which are not the subject of GHPs but are important for achieving the MDGs and broader systems strengthening are being adequately covered. viii. There is little clarity on funding needs or the timing of these needs. Approaches to financial management and strategic planning differ significantly between GHPs, making assessments of where, and when, to invest extra resources problematic. In addition, important issues such as sustainability are often viewed from the perspective of individual GHPs rather than from a broader perspective. Whilst such efforts at the individual GHP level are to be welcome – and GAVI provides a good example here - it would be helpful to develop a series of resource scenarios mapping out possible future needs, taking into account the timing, cost and likely uptake of new products for GHPs as a whole and also encourage measures to increase consistency in the way that GHPs present their financial plans. ix. Pressure to achieve the MDGs may create a range of short-term incentives which may compromise long term development objectives. For instance, in the run-up to 2015, there is a risk that donors may become less willing to fund R&D GHPs whose products are unlikely to be widely adopted before 2015 but which have enormous potential in the longer term. Again, it will be important for DFID to take a balanced approach and, if necessary, be willing to cover neglected areas.

Economic and Financial Aspects of the Global Health Partnerships 5
DFID Health Resource Centre
1 MAIN REPORT: KEY FINDINGS
1.1 Introduction
This report considers some of the key financial and economic issues related to the Global Health Partnerships. The key findings are reported here with more detail provided in the annexes.
1.2 Tracking Expenditure There is currently no accurate way of tracking expenditure on Global Public Goods (GPGs) or communicable diseases. DAC data are the best means of tracking development assistance flows but suffer from a number of significant weaknesses. At the country level national health accounts data is often weak and insufficiently disaggregated to answer questions in relation to spending on individual diseases. Investment in improving surveillance of financial flows (a global public good in itself) through global efforts under DAC or through national health accounts (NHA) is a clear priority if donors such as DFID are serious about tracking financing trends. Strengthening national health accounts should be the priority – given that domestic funding often predominates – whilst recognising that accounting for donor inputs poses significant challenges. This would involve a change in current approaches and poses difficult, if not intractable, methodological questions. It would also place significant additional burdens on capacity at the country level. However, disease specific NHA can influence policy and encourage action – in Rwanda donors and Government increased expenditure on HIV/.AIDS rapidly when NHA revealed how little was being spent. 1.3 Additionality Donor support for health spending has been increasing continuously over the past decade despite declines in overall ODA during the 1990s (chart below). As a result, the share of health in total ODA has been increasing. The fact that overall ODA flows are also now beginning to increase again – by 7% between 2001 and 2002 and a further 3.9% between 2002 and 2003 – bodes well for the future funding of communicable diseases and GPGs.

Economic and Financial Aspects of the Global Health Partnerships 6
DFID Health Resource Centre
Total Development Assistance for Health and Population by Type since 1973
-
1,000
2,000
3,000
4,000
5,000
6,000
7,000
1973
1974
1975
1976
1977
1978
1979
1980
1981
1982
1983
1984
1985
1986
1987
1988
1989
1990
1991
1992
1993
1994
1995
1996
1997
1998
1999
2000
2001
2002
$m
2002 p
rices c
om
mitm
en
tsPersonnel dvpt: pop. & repro health
Std control including hiv/aids
Family planning
Reproductive health care
Population policy and admin. mgmt
Population policies/programmes & reproductive health
Health personnel development
Health education
Infectious disease control
Basic nutrition
Basic health infrastructure
Basic health care
Basic health, general
Medical services
Medical research
Medical education/training
Health policy & admin. management
Health - general
Health (unspecified)
The major financing GHPs are too new, and the data are too weak, to make definitive assessments as to whether they supplement, or are at the expense of, existing spending. The indications, though, are that there is significant additionality. For malaria, GFATM commitments alone (of around $350m per annum) are around three times greater than recent levels of donor support for malaria. Thus, even if bilateral flows were reduced (of which there is little evidence) or even stopped, overall flows would still be expected to increase overall if resources are spent as planned. There is a similar picture for TB with GFATM accounting for an estimated two-thirds of total donor support. In the case of HIV/AIDS, although GFATM is important in absolute terms (with average annual commitments of around $1bn), it is less significant overall (accounting for only around 20% of total support for HIV/AIDS between 2000 and 2002 though this will no doubt have increased by now). However, donor spending through traditional sources – for both infectious disease control and STD control - appears to have been increasing rapidly since 1996 and there is no evidence of any slowdown at least up to 2002. Due to the positive impact of GHPs on global allocation of resources (see later) whilst it may not be possible to say whether the GHPs are actually at the expense of other type of development assistance, it is possible to say that:
• if the GHPs are at the expense of non-health development assistance, they appear to promote a more pro poor global allocation of resources
• if the GHPs are at the expense of overall health and population assistance, they appear to promote a more pro poor global allocation of resources
• if the GHPs are just substituting for bilateral efforts to combat the communicable diseases, there seems little prospect that it will significantly worsen the overall allocation of resources
There is some evidence that investment through the GHPs is crowding out donor support for interventions such as water and sanitation which, whilst essential for improving health as well as the other MDGs, have seen significant declines in donor funding in recent years. Within health, there is some evidence that donor support for reproductive health including family planning may have suffered as a result of increased spending on communicable diseases since the mid 1990s.

Economic and Financial Aspects of the Global Health Partnerships 7
DFID Health Resource Centre
More reassuringly, much of the increase in development assistance for health and population seems to have been at the expense of investment in productive activities - particularly agriculture, economic infrastructure such as energy, transport and mining and commodity support and programme assistance - which is likely to have had relatively little negative impact on health or on equity. Any additionality may prove to be short lived. Given the magnitude of funds committed through the GHPs, and the fact that they have in many cases been bolted on to existing spending programmes and within extremely rigid and unresponsive expenditure management systems, it would surprising if such funding were not mainly, if not fully, additional in the short term. Indeed, there are few concrete examples of Government or donors changing their spending plans to reflect the GHPs. Ultimately, the majority of funding in most countries for communicable diseases comes from domestic sources and the picture will only become clear when future strategic plans and MTEFs are developed which fully take account of GHPs. It may make sense to revisit this issue in two or three years time. The added value of GHPs is typically seen as one of raising the profile of particular issues and adopting innovative financing approaches which raise funds which could not be accessed through traditional means. There is little evidence that donor funding has been able to leverage additional financial support (with the exception of the foundations, notably the Gates Foundation). Even here, it is the foundations which have often provided seed money which has been used to leverage additional funding from donors. Financial contributions from the private sector have often been rather disappointing though there have been significant, but often unquantified, in kind contributions and support at the country level. Thus, it would appear that the GHPs have largely been an effective way of raising resources from existing sources rather than a means of diversifying the funding base. There may be opportunities to leverage additional resources related to the conditions applied by other donors as has been done recently with DFID's commitment to GFATM to unlock USAID funding. Here there is clear additionality and DFID should look out for similar opportunities elsewhere. 1.4 Adequacy The GHPs are certainly bringing welcome additional funding. However, despite their size and the major implications for sustainability and aid dependence, the financing GHPs currently do little to address the chronic under funding of the services in low income countries. Increasing public expenditure to a minimum of $12 per head – far below the $35 to $40 that the Commission for Macroeconomics and Health thinks is necessary - in the 25 DFID PSA countries in Africa and Asia alone would require an estimated $17bn per annum – some four for five times that proposed though the financing GHPs.

Economic and Financial Aspects of the Global Health Partnerships 8
DFID Health Resource Centre
Per Capita Expenditure on Health in 2001 by Source Source: WHO excludes South Africa public = $92, private = $130
-
10
20
30
40
50
60
Ba
ng
lade
sh
Ca
mb
od
ia
Ch
ina
Ind
ia
Ind
on
esia
Ne
pa
l
Pa
kis
tan
Vie
t Na
m
DR
Co
ngo
Eth
iop
ia
Gh
ana
Ke
nya
Le
soth
o
Ma
law
i
Mo
zam
biq
ue
Nig
eria
Rw
an
da
Sie
rra L
eon
e
Su
da
n
Ug
an
da
Ta
nza
nia
Za
mbia
Zim
ba
bw
e
All P
SA
Co
un
tries
Asia
PS
A C
ou
ntrie
s
Afric
a P
SA
Cou
ntrie
s
Afric
a e
xcl S
ou
thA
frica
$ p
er
he
ad,
20
01
Private
PublicWorld Bank $12
Basic Package
Commission for Macroeconomics and
Health $35 Essential Package
1.5 Sustainability and Aid Dependency Although the financing GHPs are relatively minor in terms of overall public funding for health they do significantly add to existing resource flows in a number of countries. In 13 countries, the GHPs are likely to account for at least a 50% increase in health spend, and in 3 of these it exceeds 100% (Ethiopia, Liberia and Malawi). The issue also has to be viewed in context of other health initiatives such as MAP and PEPFAR which will intensify sustainability and dependency concerns. It is clear that there is little, if any, chance that many low income countries will be able to meet ongoing costs themselves if GHPs funding for current activities ends as planned after a 5 year period and the GHPs embark on programmes to expand coverage. The chart below compares existing spending with that proposed under the various global initiatives.
Expenditure on New Initiatives as % of Previous Public Expenditure on Health (2001 WHO NHA: for all countries where initiatives add at least 5%)
-
100
200
300
400
500
600
tota
l a
s %
of 2
00
1 p
ub
lic
exp
en
ditu
re o
n h
ea
lth
(W
HO
NH
A 2
00
1)
MAP as % of Public Expenditure
PEPFAR as % of Public Expenditure
GPEI as % of Public Expenditure
GAVI as % of Public Expenditure
GFATM as % of Public Expenditure
Current Public Spending
adds 25% adds 10%adds 50%
adds 100%
The absolute size of the GHPs will also pose major challenges in terms of macroeconomic management. It is estimated that in at least 14 countries the average annual GHP commitment exceeds 1% of GDP and in at least 16 countries it exceeds 5% of Government consumption expenditure. This overall impact of these flows will be mitigated to the extent that:

Economic and Financial Aspects of the Global Health Partnerships 9
DFID Health Resource Centre
• GHPs provide commodity support which is likely to have less inflationary impact
• funding is provided in a stable and predictable manner • countries are able to manage public finances more effectively than has been
the case in the past and • that fungibility negates the impact of the GHPs on overall levels of public
spending. This issue is likely to grow in importance as the GHPs are likely to significantly increase aid dependence. It will be important therefore to build up the evidence base in this area. The GHP model, which often focuses on introducing and improving access to new products and leaving the running costs of existing programmes to Government and bilateral/multilateral channels, is likely to perpetuate existing distortions and sustainability issues. In effect, there is a risk that country spending patterns will be dictated by the GHPs, and the need to sustain the activities and services provided by them, rather than by national priorities. It is reassuring to see that GAVI specifically, and other donors more implicitly, no longer equate sustainability with self sufficiency and are considering alternative approaches such as spreading support over a longer period, bridge financing and considering alternative funding sources. Nonetheless, it is important that sustainability is considered before the introduction of new products rather than after as is the case at present. Timing may be a key element in relation to sustainability. The period 2008 to 2010 is likely to be a crunch period with initial GAVI and GFATM commitments coming to an end. At this point Governments will be expected to take on a much larger share of the burden, whilst the GHPs embark on further expansion programmes which serve to build up further recurrent implications and calls on limited Government resources in the future. GAVI is currently considering bridging finance to extend funding beyond this period and allow countries to spread their support over a longer period which may ease the transition. The needs of some GHPs will hopefully decline (e.g. GPEI) and free up some donor resources. However, if the ongoing product development GHPs are to bear fruit this is likely to place greater strain on Governments and donor budgets at around this time. Whilst, it could be argued that this knowledge does give donors and Government’s time to prepare past experience suggests that such rational long term planning is unlikely and that donors and Governments will have to make sharp unplanned adjustments when the time comes. Whilst the IFF is currently being thought of in terms of addressing specific needs (e.g. speeding market maturity for vaccines) consideration might be given to using the additional funds as a way of making existing services sustainable rather than promoting new ones. Given that the majority of the financial benefits from polio eradication are likely to be enjoyed by developed countries, it could be argued than non-ODA sources (OECD health budgets in this case) should contribute to filling this financing gap. GHPs tend to be looked at in isolation and not in terms of other developments at the global level. With the possible exception of GFATM, the impact on overall financing is probably not so great so this is perhaps understandable. However, taken together – and allowing for other new initiatives such as MAP and PEPFAR - the implications are potentially huge. It would be useful to develop a number of resource scenarios bringing together the needs of all the GHPs, incorporating assumptions about the

Economic and Financial Aspects of the Global Health Partnerships 10
DFID Health Resource Centre
timing, cost and likely coverage of the outputs of the R&D Public Private Partnerships (PPPs) into some form of global MTEF. Though individual GHPs have attempted this, overall needs remain unclear. Such planning would also usefully be linked with ongoing discussion about the International Financing Facility to ensure that funds are available when needed. To this extent, the IFF may prove to be a useful insurance mechanism as well as financing specific interventions. 1.6 Cost Effectiveness and Efficiency The GHPs are generally investing in potentially highly cost effective interventions. However, the extent to which this potential is translated into reality will depend on a number of factors, including health system capacity and disease prevalence. Support for ART is an exception - it might be justified for humanitarian/social justice reasons but currently not on economic/cost effectiveness grounds (though there are suggestions that current approaches do not fully capture the effects of HIV/AIDS on society as a whole – an area which might warrant further investigation). The evidence also strongly supports the efficiency case for expanding access to the expensive, but still highly cost effective, newer vaccines being promoted by GAVI. Overall, it is highly probable that, of the financing GHPs, GAVI is likely, on average, to offer the best value for money in terms of health improvements per pound spent. Accelerating progress towards the MDGs will require actions in other key areas notably female education and water and sanitation – and will also require higher levels of efficiency in translating resources for health into health outputs and outcomes than has been the case in the past. It is not possible to assess the likely cost effectiveness of the outputs of the R&D GHPs as it will be dependant on a number of factors especially the cost of the final product. Cost Effectiveness of Health Interventions Aimed at Priority Diseases
Condition Cost per DALY Source TB DOTS for smear positive patients BCG DOTS for smear negative patients
<$40 <$50 $10 to $20
CMH Working Group 5: Paper 8
Immunisation EPI plus Measles
$12 to $17 $2.5 to $5
CMH Working Group 5: Paper 10
HIV/AIDS Condom distribution Improved Blood Safety Prevention of MTCT (nevirapine) Peer Education for CSWs HAART
$1-$100 $1-$43 $1-12 $4-7 $1,100 to $1,800
Creese 2002
Malaria Insect treated bednets Residual spraying Chaemoprophylaxis for children
$19 to 85 $16 to $29 $8 to $41
Goodman, Coleman and Mills (2000)
One of the key problems in identifying very ambitious basic health care packages such as that identified by the CMH is that they give little specific guidance on how countries might prioritise. For a country spending $4 per head on health, the relevant question would be “how do we spend the fifth dollar?” not necessarily “what would we do with the thirty fifth dollar?” Using cost effectiveness as a criteria there would be

Economic and Financial Aspects of the Global Health Partnerships 11
DFID Health Resource Centre
little case for using early increases in the amount of available resources to expand access to ART. Monitoring cost effectiveness would involve more detailed analysis of GHP spending by intervention rather than the current approach which looks more at functional use e.g. expenditure on commodities, salaries etc. Reviews have been unable to make definitive judgements on the efficiency of GHPs or to make comparisons, given the differing core functions. Most reviews suggest that administrative costs appear reasonable and in some cases it can be argued that efficiency savings made through the GHP operations can in part offset the cost of the partnership itself. Donors often have unrealistic expectations as to just how “lean and mean” GHPs can be. 1.7 Needs Based Allocation
The review considered whether the financing GHPs were allocating resources according to need (in terms of burden of disease), by region (with a particular focus on sub Saharan Africa) and according to income status (in terms of average per capita incomes), comparing results against recent trends in donor support for health and population. Concerns have been raised about the allocation criteria and allocation of funds to higher income countries. Approaches vary from very hands off demand led approaches (GFATM) to ones based on estimates of needs at the country level (GPEI, GAVI). GAVI has a strict income related criteria for eligibility (per capita income < $1000) whilst GFATM provides a sliding scale of support by income status. All the key GHPs appear to take a needs based approach within their own area of operation. Allocation by GHPs appear to be more focussed on poorer countries than recent trends in overall donor assistance for health and population in the past, and at least as pro poor and probably more pro poor than development assistance for infectious disease and STD control (using allocations to Africa and income status as a proxy and acknowledging the shortcomings in the data). Though GFATM does provide support to higher income countries, its allocation pattern is no less pro poor than existing allocations of development assistance for health and for malaria and TB is more pro poor than recent allocations for infectious diseases.

Economic and Financial Aspects of the Global Health Partnerships 12
DFID Health Resource Centre
Commitments of the Financing Global Health Parterships by Economic Status(excludes GFATM allocation to Equitorial Guinea)
0
20
40
60
80
100
120
140
160
180
200
- 2,000 4,000 6,000 8,000 10,000 12,000 14,000
Per Capita Income 2001 PPP US$
Avera
ge A
nn
ual L
ifetim
e C
om
mitm
ent $
GAVI
GFATM
GPEI
GPEI
$1,963
GAVI
$1,385
GFATM
$2,457
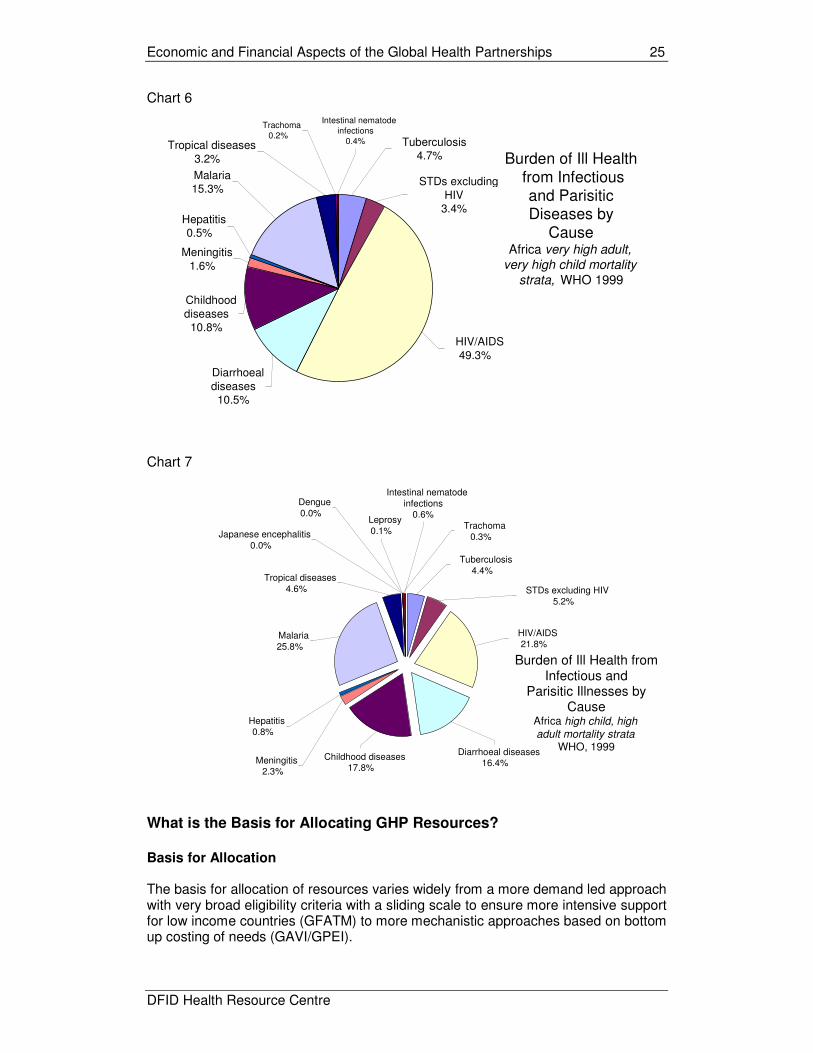
GAVI has a heavy focus on low income countries, especially in Africa, and provides additional support for countries with the greatest outstanding needs. There are some outliers e.g. the low share of GFATM resources for HIV/AIDS going to Africa in view of its share of the burden of disease, raising the question of whether steps should be taken to increase this share. Comparison of Share of Burden of Disease faced by Africa with Allocation from relevant GHP by Disease
% Burden of Disease in Africa
% Allocation by Relevant GHP
Infectious and parasitic diseases 54.6 n/a
Tuberculosis 26.2 31.6% (GFATM)
HIV/AIDS 82.9 61.0% (GFATM) and 91% of HIV-TB
Childhood diseases 47.1 65.0% (GAVI)
Malaria 81.9 78.4% (GFATM)
Poliomyelitis 16.2 29.3% (GPEI)
Meningitis 36.8 See GAVI
Hepatitis 42.0 See GAVI
Tropical diseases 54.9 n/a
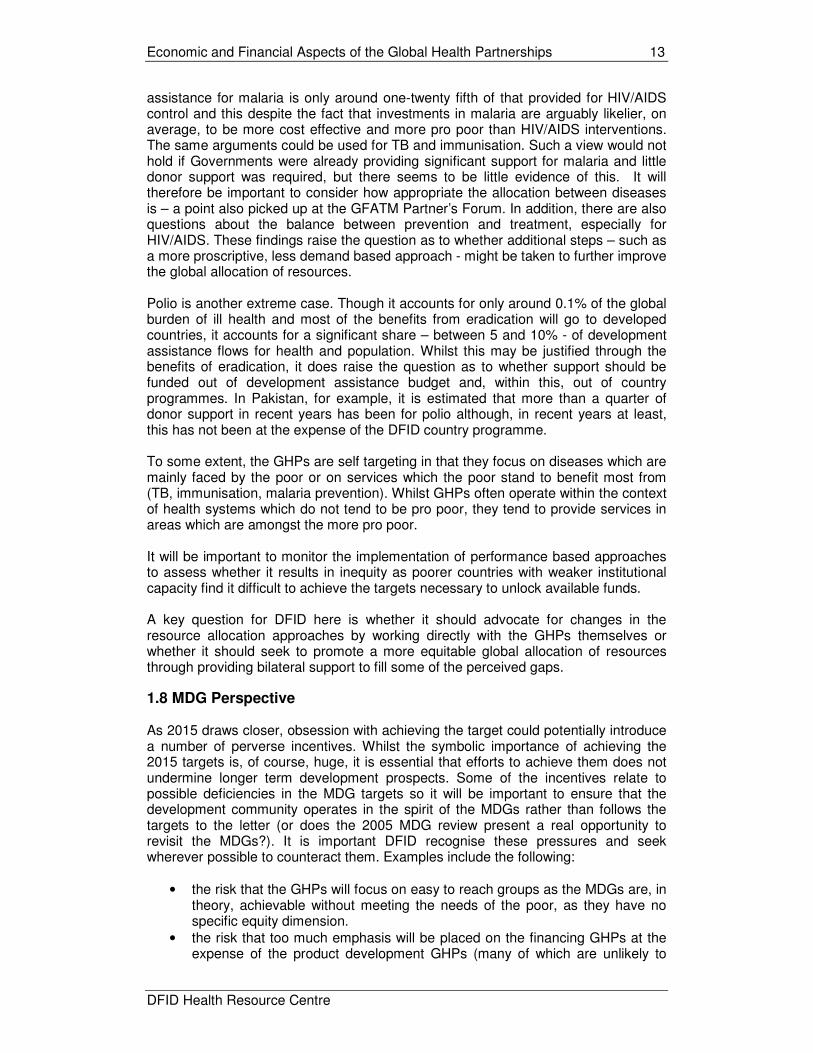
Whilst funding for communicable diseases is undoubtedly insufficient to meet outstanding needs, the issue of whether it is under funded in the context of other priorities, the chronic under funding of health sectors as a whole and the modest prospects for future growth in funding is more open to debate. Recent analysis of spending on HIV/AIDS control suggests that spending in this area may represent around half of total aid flows for health. Yet HIV/AIDS only accounts for around 5% of the global burden of disease and only in Africa does it exceed 10% (it is up to 27% in high adult high child mortality countries and just under 20% overall). Malaria accounts for around half of the HIV/AIDS burden of ill health yet development
Economic and Financial Aspects of the Global Health Partnerships 13
DFID Health Resource Centre
assistance for malaria is only around one-twenty fifth of that provided for HIV/AIDS control and this despite the fact that investments in malaria are arguably likelier, on average, to be more cost effective and more pro poor than HIV/AIDS interventions. The same arguments could be used for TB and immunisation. Such a view would not hold if Governments were already providing significant support for malaria and little donor support was required, but there seems to be little evidence of this. It will therefore be important to consider how appropriate the allocation between diseases is – a point also picked up at the GFATM Partner’s Forum. In addition, there are also questions about the balance between prevention and treatment, especially for HIV/AIDS. These findings raise the question as to whether additional steps – such as a more proscriptive, less demand based approach - might be taken to further improve the global allocation of resources. Polio is another extreme case. Though it accounts for only around 0.1% of the global burden of ill health and most of the benefits from eradication will go to developed countries, it accounts for a significant share – between 5 and 10% - of development assistance flows for health and population. Whilst this may be justified through the benefits of eradication, it does raise the question as to whether support should be funded out of development assistance budget and, within this, out of country programmes. In Pakistan, for example, it is estimated that more than a quarter of donor support in recent years has been for polio although, in recent years at least, this has not been at the expense of the DFID country programme. To some extent, the GHPs are self targeting in that they focus on diseases which are mainly faced by the poor or on services which the poor stand to benefit most from (TB, immunisation, malaria prevention). Whilst GHPs often operate within the context of health systems which do not tend to be pro poor, they tend to provide services in areas which are amongst the more pro poor. It will be important to monitor the implementation of performance based approaches to assess whether it results in inequity as poorer countries with weaker institutional capacity find it difficult to achieve the targets necessary to unlock available funds. A key question for DFID here is whether it should advocate for changes in the resource allocation approaches by working directly with the GHPs themselves or whether it should seek to promote a more equitable global allocation of resources through providing bilateral support to fill some of the perceived gaps.
1.8 MDG Perspective As 2015 draws closer, obsession with achieving the target could potentially introduce a number of perverse incentives. Whilst the symbolic importance of achieving the 2015 targets is, of course, huge, it is essential that efforts to achieve them does not undermine longer term development prospects. Some of the incentives relate to possible deficiencies in the MDG targets so it will be important to ensure that the development community operates in the spirit of the MDGs rather than follows the targets to the letter (or does the 2005 MDG review present a real opportunity to revisit the MDGs?). It is important DFID recognise these pressures and seek wherever possible to counteract them. Examples include the following:
• the risk that the GHPs will focus on easy to reach groups as the MDGs are, in theory, achievable without meeting the needs of the poor, as they have no specific equity dimension.
• the risk that too much emphasis will be placed on the financing GHPs at the expense of the product development GHPs (many of which are unlikely to

Economic and Financial Aspects of the Global Health Partnerships 14
DFID Health Resource Centre
deliver before 2010 and, as a result, are will probably make little impact before 2015).
• the risk that too little attention will be placed on diseases targeted for eradication or elimination which, although GPGs, will have little impact on the MDGs (e.g. polio, other neglected diseases). Equally, there is a risk that donors will invest too much in these areas – perhaps securing quick wins but doing little to progress towards the MDGs
• the risk that accelerating funding to achieve the 2015 targets will be at the expense of longer term funding flows and may undermine progress post 2015
• the risk that some important interventions may actually impede progress towards some MDGs. For example, whilst ART will play a key role in terms of reducing the number of AIDS orphans, it may actually increase the prevalence of HIV in the population.
1.9 Financing Model As already noted, the GHP model often sees Governments taking over the responsibility for traditional products whiles the GHP moves upstream to develop and increase access to new ones. It is immediately clear that in many, if not most countries, Government will be unable to meet the recurrent costs associated with the GHPs. The question facing DFID is whether it should be willing to meet such costs and plan accordingly now as the GHPs move onto newer and more innovative approaches. Otherwise DFID risks locking itself into a never ending cycle of support for the GHPs. DFID will need to consider whether, and at what point, it should be looking to shift resources into consolidating existing programmes rather than promoting further increases in coverage by the GHPs. Considerations will include:
• the overall performance of the GHP in question, • the specific direction its proposed expansion takes, • the minimum contribution DFID can realistically make, • the overall financing situation and sustainability challenges faced in recipient
countries and the viability of alternative financing instruments 1.10 Financial Management It is important for GHPs to adopt prudent (business like) approaches to expenditure management. Practices vary widely between GHPs, from what might be characterised as extremely conservative approach (GFATM - with some concerns that it is sitting on a cash mountain) to a high risk approach (the Global Drug Facility of the Stop TB Partnership where commitments have been made in the absence of confirmed funding). There is little to say one has been more effective than the other as the GDF has always been able to fulfil its commitments. In fact, there has been some degree of convergence already in the approach to financial management within these GHPs. However, the different practices make it very difficult for donors and other key stakeholders to make informed decisions about the magnitude and timing of future resource needs. In principle, DFID should seek to ensure greater transparency and consistency in approaches to financial planning. There may be a case for the development of resource based budgets in additional to needs based budgets as has been attempted both by GHPs (e.g. GDF) and at country level (e.g. Ghana). Estimates of GHP funding requirements tend to be made on an individual basis. There is often a great deal of uncertainty and little consistency in how the estimates are arrived at. In some cases, funding requirements may be more of an advocacy

Economic and Financial Aspects of the Global Health Partnerships 15
DFID Health Resource Centre
tool (GDF) whereas in other cases (GFATM) there is more acknowledgment that plans need to be resource based. Again it is difficult to see how donors can make informed decisions about funding. In many cases the funding requirements are so unachievable that they give little guidance as to how marginal resources should be used – in such cases intermediate targets would be helpful. Many of the GHPs stress the importance of diversifying their funding sources. Whilst this may make sense at the level of the individual GHP, it may not for GHPs as a whole. It could just mean that the same amount of money gets spread more thinly with increased transactions costs, as differing GHPs chase the same resources. There may be a case for DFID operating in a more flexible manner, not necessarily investing in the most effective GHPs but the most relatively under funded ones.
1.11 Other Constraints Finance is not necessarily the major constraint at country level. The lack of human resources is arguably the binding constraint and the GHPs place major demands on limited capacity and could introduce massive distortions in the use of human resources. The issue of capacity constraints is also relevant in terms of the light touch lender of last resort approach being promoted by the GHPs, especially GFATM. This applies equally to the relatively affluent countries such as Swaziland and Namibia which have been awarded very large amounts of funding but still have weak systems and need considerable support to ensure the funds are used effectively. In these countries, DFID is unable to provide significant support due to the country’s income status and other donors are often unwilling to do so believing that their needs are being met through the GHPs. It is not clear how this issue can be addressed. 1.12 Country Level Issues
A range of issues are relevant from the country perspective, some of which reinforce the findings set out above:
Additionality The additionality conditions included in some GHPs are inappropriate in the sense that they undermine national ownership. There are also serious questions as to whether additionality is measurable and, even if it is, whether it is enforceable. There are questions as to whether the most effective and most sustainable way of increasing spending on communicable disease should be through negotiation with Government – and convincing Ministries of Health and Finance and the population as a whole that increased spending on communicable diseases is warranted – rather than through the earmarked funding approach adopted by the GHPs. In most cases GHPs appear to have resulted in additional public expenditure. In most cases it has been used to cover financing gaps under existing programmes, suggesting at least that this is consistent with the rational and planned allocation of resources within the communicable diseases sub-sector. In some cases GHP funding has been used to fund new programmes which are likely to have been driven more by the availability of funds that any rational assessment of priorities. The general assumption seems to be that, if GHPs cover existing funding gaps, they are not distortionary. This is almost certainly untrue. The relevant question to ask is “if money had been made available without strings would Government have spent

Economic and Financial Aspects of the Global Health Partnerships 16
DFID Health Resource Centre
money on this?” The answer would invariably be no. There is little evidence that donor and Government funding decisions have been influenced so far by allocations though the real test will comes when Governments update health plans and MTEFs. Irrespective of what they fund, the earmarked nature of GHP support and any additionality conditions attached undermine the strategic planning role of the Finance Ministry as it attempts to allocate resources in line with national priorities. Whilst this may be less damaging in some settings, it can seriously undermine the credibility of efforts to develop credible medium term expenditure frameworks. The Ministry of Finance in Tanzania expressed such concerns as follows: "We are concerned that the mechanism of aid delivery proposed by the Global Fund against AIDS, Tuberculosis and Malaria, has the potential of undermining government accountability and negate all efforts made so far to improve development partnership and aid effectiveness." In some cases Governments have tried to stick to expenditure ceilings implying that GHP funding would have to be at the expense of other public expenditure (Uganda) or expenditure on HIV/AIDS (India). In both cases the matter has not yet been fully resolved. Even if Governments do retain control over public expenditure totals and it is still possible that GHP spending could crowd out alternative programmes which might have been more pro poor. The question seems to be less “are the GHPs are distortionary or not?”. They are. The more important question is whether the distortions introduced are a good or a bad thing. Here, it may be important to distinguish between countries with a mature, well respected and highly participatory approach to the establishment of national priorities such as Uganda, and countries where this is not the case. The impact of additionality and earmarking are likely to be more destructive in the former. Uncertainty
The uncertainty of GHP funding has caused problems. In some cases (e.g. Ghana), where Government has identified programmes for GHPs as part of its national strategies, distortions have been created by non approval of GFATM proposals. In some cases proposals rejected by donors have been approved by GHPs – though it is not clear whether they were poor proposals or were marginal ones which were justified when more resources became available. Given the size of GHP commitments, any measures which improve predictability of funding will assist overall expenditure management. This may happen automatically as the track record of GFATM develops – an alternative approach might be to move towards indicative (needs based) allocations. Coordination GHPs have generally not been well coordinated either with Government planning processes or even between themselves. There has been some movement towards greater utilisation of local systems but there has often been destabilisation of SWAp approaches and concerns about impact on macroeconomic stability. There have been some promising moves – for example GFATM is willing to channel resources through the common fund in Mozambique and monitor performance against outputs not inputs. Some countries have adapted their approaches e.g. by developing needs based budgets as well as resource based budgets in Ghana – though this has had capacity implications. Concerns have been expressed in many settings about the lack of absorptive capacity. These are alleviated somewhat when funding is for NGOs or the private sector though here long term sustainability issues come to the fore.

Economic and Financial Aspects of the Global Health Partnerships 17
DFID Health Resource Centre
Allocation Concerns have been expressed about the balance between disease specific programmes and system backbone investments such as strengthening of district management capacity, quality assurance, training and supervision reinforced by an approval system which creates incentives for a vertical approach. This suggests a key role for traditional funding sources in covering health systems needs (but also in responding to any inequities in the disease wise allocation by the GHPs). Poverty Impact Proposals tend to give little indication as to how the investments will focus on the poor. There are few explicit policies (Ghana is one example) regarding the criteria for rationing access and costs of using ARVs. This is largely relevant only because GHPs are not properly integrated into country planning and budgeting approaches. Where they are fully integrated, this would be less of a concern as country efforts would be best judged on the basis of PRSPs and performance against its targets and there would be no need to hold the GHPs to higher standards than other areas of expenditure Capacity Implications There are concerns about the shortcomings of the light touch approach adopted by some of the GHPs. In middle income countries with severe capacity constraints are receiving large awards from GHPs (Swaziland, Namibia). At the opposite end of the spectrum, countries in, or emerging from, crisis e.g. Sierra Leone. Should/could DFID or other donors provide top sliced funding to support such countries to ensure GHP funding is put to effective use? Chasing GHPs funding has often diverted the attention of staff away from ongoing country level processes. There are concerns that transactions costs are increased by new reporting requirements and the requirement for GHPs budgets to use standard and not country level budget classifications, and that CCMs add little in situations where participatory arrangements are already fairly well developed. Despite claims that GFATM is radically policy free, in some settings there has been a feeling that it is becoming an agency in itself with its own rules and procedures. At the same time, some have voiced concern about the lack of guidance in other areas e.g. on how much countries should be bidding for. Finally, there are concerns that the approaches perpetuate vertical programmes and that opportunities to strengthen systems have not been fully utilised.
1.13 DFID Policy Options
Possible approaches in relation to the financing GHPs include:
• placing less emphasis on additionality • advocating a shift towards longer term, equity based allocation approaches
(especially GFATM) which are more consistent with ongoing country level processes and could promote greater predictability in funding flows
• increasing focus on sustainability and ensure it is fully considered before major decisions are made.

Economic and Financial Aspects of the Global Health Partnerships 18
DFID Health Resource Centre
In relation to funding, the GHPs are clearly here to stay but there is no reason why DFID cannot channel support for communicable diseases through the bilateral programmes as well as through the GHPs. To some extent, the choice depends upon the performance of the GHPs and any gaps it leaves, and whether DFID’s role should change after the initial start up phase or completion of the first phase of funding. Options might include:
• ensuring sufficient resources are allocated to systems-strengthening approaches in all settings – countries under stress as well as middle income countries
• targeted bilateral support for communicable diseases where it is felt the GHPs are leaving gaps – to be provided for through a global pot, not from the country programme, especially for diseases whether cross border externalities are great
• provision of budget support or sector support where appropriate to support Governments in ensuring the sustainability of GHPs especially after 2008 (or when necessary)
• to consider how to respond to the polio dividend once eradication is achieved. This will include money freed up from the aid programme but also the Government’s health budget.

Economic and Financial Aspects of the Global Health Partnerships 19
DFID Health Resource Centre
ANNEX 1: RELATIONSHIP BETWEEN INPUTS, OUTPUTS AND OUTCOMES
Assessment of Impact Questions considered here include:
• is it possible to assess impact? • what evidence is available so far? • what approaches might be taken to assessing impact? • how do the GHPs make the economic case for their existence?
As illustrated in box 1 below, there are several key drawbacks preventing a proper assessment of impact:
• it is too early to assess impact, given that many GHPs are still in their early stages
• it is difficult to attribute any impacts to the partnerships • it is all but impossible to identify the counterfactual (see box 1).
Box 1: IAVI Evaluation “it is impossible to examine IAVI’s performance against any “counterfactual.” Nonetheless, in the end, the panel believes that it is useful, even if largely conjectural, to create a “counterfactual for the future,” by asking: “What would happen in key areas of IAVI’s activities if IAVI were to “cease operations?” The panel believes that, in that case, global efforts on advocacy, communications, and the policy and access agendas would decrease quickly and significantly. Some funding for AIDS vaccines would also erode. In addition, the panel believes that no other organization could fill the gaps in these areas in any reasonable period of time. In this case, the enabling environment for the uptake of an eventual vaccine would be undermined in a number of countries now and more countries later”
Few attempts have been made to carry out a full cost benefit analysis (box 2 below) Box 2: Economic evaluation of Mectizan distribution “Economic evaluations of the Onchocerciasis Control Program (OPC) in West Africa have calculated a net present value – equivalent discounted benefits minus discounted costs – of $485 million for the programme over a 39-year period, using a conservative 10% rate to discount future health and productivity gains. The net present value for the African Program for Onchocerciasis Control (APOC) is calculated at $88 million over a 21-year time period, also using a 10% discount rate. Cost-effectiveness analyses of ivermectin distribution have found a cost of $14–$30 per disability-adjusted life-year prevented – estimates comparable with other priority disease control programmes. However, the economic success of ivermectin distribution is sensitive to the fact that the drug itself has been donated free of charge. The market value of Merck’s donations to the APOC for just 1 year considerably outweighs the benefits calculated for both the OPC and the APOC over the life of

Economic and Financial Aspects of the Global Health Partnerships 20
DFID Health Resource Centre
these projects. Pending the development of an effective macrofilaricide, the distribution of ivermectin will remain a public health priority into the foreseeable future”. Waters, Rehwinkel Burnham
How Do The GHPs Make Their Own Economic Case?
The main financing GHPs make the economic case for accelerated actions based on:
• impact on economic growth at the macro level (by affecting the most economically productive sections of the population)
• impact on income at the individual level • poverty focus (especially for malaria and TB) • low cost of interventions • the proposed strategies being the most cost effective way of addressing the
disease in question However, only GAVI makes the key case that the interventions are a cost effective way of improving health outcomes – probably because immunisation is amongst the most cost effective of available interventions. This reinforces the fact that the GHPs tend to view their role in isolation from other efforts. This makes it difficult for potential funders as well as potential beneficiaries to gauge the relative merits of different approaches.
The Financial Case for the GHPs?
Benefits of Eradication Estimating the costs and benefits of eradication is extremely problematic. However, in the case of polio, the net benefits appear large. Bart et al found that based on eradication in 2005, the cost savings from not having to treat those with polio amounted to some $13.6bn to 2040 – not including annual savings of around $1.7bn through not having to immunise. Break even would be achieved within 2 years of eradication being achieved. Of the $1.7bn savings a high proportion – around 60% - would accrue to developed countries who could discontinue their expensive immunisation programmes. Net Costs of the GHP: Stop TB Another way of assessing the viability of GHPs is to compare any cost savings which can be attributed to the GHPs to the costs of maintaining the partnership. If the savings outweigh the costs, one can argue the partnership is, in effect, cost free. This approach was taken in a review of the Stop TB Partnership (box 3)
Box 3: Net Costs of the Stop TB Partnership The direct costs of the Partnership are relatively modest - US$ 18.05m for the Secretariat in 2002, of which US$13.0m was for the GDF. The Secretariat claim that GDF procurement results in savings of the order of 30% and the available evidence

Economic and Financial Aspects of the Global Health Partnerships 21
DFID Health Resource Centre
tends to support this. Such savings1 (which are not considered to be the most important benefit of GDF) have in part offset the actual costs incurred by the Partnership2. Though a rather artificial comparison, this is nonetheless illustrative. On the same basis, if the GDF grant facility had been expanded in line with its Strategic Plan, or even its approved 2002 budget, all non- GDF Secretariat costs would have been offset. Stop TB Evaluation IHSD 2003
Impact of the GHPs on Macroeconomic Stability It is also important to flag up the potential impact of the global programmes on macroeconomic stability. The GHPs imply large increases in aid flows and possibly substantial increases in aid dependence. The issue is partly one of the magnitude of aid flows and related concerns about the Dutch Disease effect through which increased aid renders a country uncompetitive through its effects on inflation and exchange rates and through the crowding out of private sector activity. As charts 1 and 2 show, the GHPs’ commitments often exceed 1% of GDP and 5% of Government consumption expenditure3. Chart 1
Countries Where Average Annual GHP Commitment Exceeds 0.2% of GDP
-
0.5
1.0
1.5
2.0
2.5
3.0
3.5
4.0
4.5
Angola
Benin
Burk
ina F
aso *
Buru
ndi
Cam
bodia
Cam
ero
on *
Centra
l Afric
an R
epublic
Chad
Com
oro
s
Dem
. Republic
of C
ongo **
Djib
outi
Eritre
a
Eth
iopia
Gam
bia
Ghana *
Guin
ea-B
issau
Guyana *
Haiti
Kenya
Kyrg
yzsta
n
Lao P
eople
's Dem
. Rep.
Lesoth
o *
Lib
eria
Madagascar
Mala
wi *
Mali
Moza
mbiq
ue
Nam
ibia
Nig
er
Nig
eria
Papua N
ew
Guin
ea
Rw
anda *
Sao T
om
e
Senegal *
Sie
rra L
eone
Sw
azila
nd **
Tajikis
tan
Tanzania
*
East T
imor
Togo
Uganda *
Zam
bia
%
1 The benefits (the savings) accrue to countries and result in greater provision than would otherwise be the case and
hence directly benefit those suffering from TB. Figures presented here are based on a 30% reduction in drug prices as a result of GDF procurement. 2 For example, in 2002 savings of 30% on the $10.75m expenditure on drugs amounts to some $3.22m, almost 2/3
of non-GDF Secretariat spending 3Tthe GHP commitments cannot always be directly compared to Government spending levels as some is to be
disbursed through the private or NGO sector.

Economic and Financial Aspects of the Global Health Partnerships 22
DFID Health Resource Centre
Chart 2
Countries Where Annual GHP Commitments Exceed 0.75% of Government Consumption Expenditure
0
5
10
15
20
25
Ba
ngla
desh
**
Be
nin
Bu
rkin
a F
aso *
Bu
run
di
Ca
mb
odia
Ca
me
roo
n *
Ce
ntra
l Afric
an
Re
pub
lic
Ch
ad
Co
mo
ros
De
m. R
epu
blic
of C
ong
o **
Cô
te d
'Ivo
ire
Do
min
ica
n R
epu
blic
Eritre
a
Eth
iopia
Ga
mbia
Ge
org
ia
Gh
an
a *
Gu
ine
a *
Gu
ine
a-B
issa
u
Gu
yan
a *
Ho
nd
ura
s
Ke
nya
Kyrg
yzsta
n
Le
so
tho
*
Ma
dag
ascar
Ma
law
i *
Ma
li
Mo
za
mb
ique
Na
mib
ia
Ne
pa
l
Nig
er
Nig
eria
Rw
an
da
*
SA
O T
OM
E
Se
neg
al *
Sie
rra L
eo
ne
Sw
azila
nd **
Ta
jikis
tan
Ta
nzan
ia *
To
go
Ug
an
da *
Ye
men
Za
mbia
%
Sources: GHP commitment data; World Development Indicators 2003 The overall impact of these flows will depend heavily on the quality of public expenditure management. The role of the World Bank and IMF, as well as bilaterals such as DFID who are also active in this area, will be vital. There are perhaps some grounds for optimism that practices have improved in this area in recent years. It will also be affected by the quality and the content of the programmes funded to the extent that high quality investments are likely to promote growth, and commodity based programmes are likely to have less serious macroeconomic implications. The issue of volatility in aid flows is arguably a far greater problem. Slower than anticipated disbursements and rejected applications have contributed to uncertainty about resource flows in a number of countries though such factors are not specific to GHPs. Perhaps it is not unexpected that there would be teething problems as both the GHP and the countries become familiar with using a new mechanism. The lack of clarity has resulted in a situation for GFATM where there are pressures from some quarters to increase the size of applications (often by donors) with counterbalancing pressures to reduce the size of any application to maximise the chances of approval (often Governments who tend to adopt a more risk averse approach). A key question here is whether such problems might be expected to decline over time as predictability improves, or whether there is a case for providing greater predictability through, for example, the development of indicative allocations by country. Related to this is the concern that by insisting on additionality, the GHPs undermine the very processes (MTEFs) which are designed to increase predictability. A further concern is that the GHPs may adopt project based approaches to avoid macroeconomic ceilings as appears to be the case in Uganda. Whilst increasing overall public spending which still has the same macroeconomic effects it also introduces additional inefficiencies such as greater transactions costs associated with project based approaches. Why does macroeconomic stability matter? Health outcomes are far more closely linked with overall economic progress than investment in the health sector. The positive effects of increased health investment are likely to be more than offset if

Economic and Financial Aspects of the Global Health Partnerships 23
DFID Health Resource Centre
economic prospects are compromised. It is important therefore that such concerns are not glossed over. The performance focus inherent in the financing GHPs may also cause problems associated with uncertainty about funding flows – and these are more likely to be pressing in the lower income/capacity constrained countries which are perhaps less likely to meet agreed targets. This raises the question as to whether it would be helpful to establish “early warning systems” or some alternative means of ensuring that Finance Departments are aware of the possibility of future shocks related to shortfalls in disbursement of GHP funds. Caveats: GHPs as a Lender (or Supporter) of Last Resort In a way it is not appropriate to compare what the GHPs are financing against what is being funded through country programmes. If the GHPs are funding existing gaps and effectively acting as a “supporter of last resort”, you would expect them to be funding more marginal, and therefore, less cost effective activities. It would only be possible to question the use of funds where less cost effective interventions are being financed whilst proven cost effective interventions remain under funded. Along these lines the Global Fund “seeks to promote the importance of balance between interventions, but does not require that each proposal be so balanced, as long as it contains sufficient information to demonstrate that this balance is achieved through the combined efforts of all partners”.
Assessment of Allocative Efficiency Questions considered here include:
• are GHPs shifting resources away from conditions which are best treated at country level (e.g. non communicable diseases/injuries)?
• are GHPs allocating resources to the diseases which present the greatest disease burden (or, more specifically, diseases for which additional spending can reduce the disease burden)?
• are GHPs allocating resources to the countries most in need? Allocation compared to Burden of Disease Charts 3 to 7 indicate clearly that the overall burden of disease in sub Saharan Africa is around 5 to 6 times that in developed countries and that overall 70% of this burden is due to communicable diseases with around 50% due to infectious and parasitic diseases alone. HIV/AIDS accounts for almost half of the burden of disease caused by infectious diseases in high adult, very high child mortality countries in Africa and just under a quarter in high adult, high child mortality countries. On these grounds one might expect a considerable share of GHP funding to go to sub Saharan Africa.

Economic and Financial Aspects of the Global Health Partnerships 24
DFID Health Resource Centre
Chart 3
Burden of Disease by Source by Region
-
0.10
0.20
0.30
0.40
0.50
0.60
0.70
High child,
high adult
High child,
very high
adult
Very low
child,
very low
adult
Low child,
low adult
High child,
high adult
Low child,
low adult
High child,
high adult
Very low
child,
very low
adult
Low child,
low adult
Low child,
high adult
Low child,
low adult
High child,
high adult
Very low
child,
very low
adult
Low child,
low adult
AFRICA THE AMERICAS EASTERN
MEDITERRANEAN
EUROPE SOUTH-EAST ASIA
DA
LY
s lost per pers
on p
er year
Injuries
Non Communicable Diseases
Nutritional deficiencies
Perinatal conditions
Maternal conditions
Respiratory infections
Infectious and parasitic diseases
Chart 4
Burden of Disease by Source by Region
0%
10%
20%
30%
40%
50%
60%
70%
80%
90%
100%
Hig
h c
hild,
hig
h a
dult
Hig
h c
hild,
very
hig
h a
dult
Very
low
child,
very
low
adult
Low
child
,
low
adult
Hig
h c
hild,
hig
h a
dult
Low
child
,
low
adult
Hig
h c
hild,
hig
h a
dult
Very
low
child,
very
low
adult
Low
child
,
low
adult
Low
child
,
hig
h a
dult
Low
child
,
low
adult
Hig
h c
hild,
hig
h a
dult
Very
low
child,
very
low
adult
Low
child
,
low
adult
AFRICA THE AMERICAS EASTERN
MEDITERRANEAN
EUROPE SOUTH-EAST ASIA
%
Injuries
Non Communicable Diseases
Nutritional deficiencies
Perinatal conditions
Maternal conditions
Respiratory infections
Infectious and parasitic diseases
Chart 5
Burden of Disease by Region from Infectious and Parasitic Diseases WHO 1999
0
0.05
0.1
0.15
0.2
0.25
0.3
0.35
0.4
High child,
high adult
High child,
very high
adult
Very low
child,
very low
adult
Low child,
low adult
High child,
high adult
Low child,
low adult
High child,
high adult
Very low
child,
very low
adult
Low child,
low adult
Low child,
high adult
Low child,
low adult
High child,
high adult
Very low
child,
very low
adult
Low child,
low adult
AFRICA THE AMERICAS EASTERN
MEDITERRANEAN
EUROPE SOUTH-EAST ASIA
DA
LY
S lost per head o
f popula
tion in 1
999
Intestinal nematode infections
Trachoma
Japanese encephalitis
Dengue
Leprosy
Tropical diseases
Malaria
Hepatitis
Meningitis
Childhood diseases
Diarrhoeal diseases
HIV/AIDS
STDs excluding HIV
Tuberculosis
Economic and Financial Aspects of the Global Health Partnerships 25
DFID Health Resource Centre
Chart 6
Burden of Ill Health from Infectious
and Parisitic Diseases by
Cause Africa very high adult,
very high child mortality
strata, WHO 1999
Diarrhoeal diseases
10.5%
HIV/AIDS49.3%
Childhood diseases
10.8%
Hepatitis0.5%
Meningitis1.6%
Malaria15.3%
STDs excluding HIV
3.4%
Tuberculosis4.7%
Intestinal nematode infections
0.4%
Trachoma0.2%
Tropical diseases 3.2%
Chart 7
Burden of Ill Health from Infectious and
Parisitic Illnesses by Cause
Africa high child, high adult mortality strata
WHO, 1999
HIV/AIDS21.8%
Diarrhoeal diseases16.4%
Childhood diseases17.8%
Leprosy0.1%
Malaria25.8%
Dengue0.0%
Meningitis2.3%
Hepatitis0.8%
Trachoma0.3%
Tuberculosis4.4%
Japanese encephalitis0.0%
Intestinal nematode infections
0.6%
Tropical diseases 4.6% STDs excluding HIV
5.2%
What is the Basis for Allocating GHP Resources?
Basis for Allocation The basis for allocation of resources varies widely from a more demand led approach with very broad eligibility criteria with a sliding scale to ensure more intensive support for low income countries (GFATM) to more mechanistic approaches based on bottom up costing of needs (GAVI/GPEI).

Economic and Financial Aspects of the Global Health Partnerships 26
DFID Health Resource Centre
Countries are eligible for GAVI funding if they have a GNP of less than $1000. In addition, they must have a functioning interagency coordination committee (ICC) or equivalent means of collaborating with government and international aid organizations working within the communities, provide a recent immunisation assessment and have an existing multi-year immunisation plan in place.
For GFATM, eligibility is on a sliding scale. IDA eligible low income countries are fully eligible. Lower middle income countries are required to secure co-financing, focus on poor or vulnerable populations and move towards greater domestic financing. Upper middle income countries are only eligible if they face a very high current disease burden. High income countries are not eligible. There is increased emphasis on the development of performance based systems. The Vaccine Fund has established a system of performance-based grants. For those countries receiving financial support to strengthen their immunisation systems, as opposed to those countries receiving only vaccines and safe injection equipment, the Vaccine Fund will provide a “share” worth $20 toward immunising each child. This share will be delivered in two stages in order to reward progress: the first half up-front as an investment in improving immunisation services and the second half retrospectively as a reward for having immunised additional children. Independent Data Quality Audits are used to verify performance. Countries must report annually on the progress they have made and those that do not meet their targets will not receive the second set of shares. Follow on funding for GFATM (after the initial 2 year approval) is dependent upon performance against agreed targets which in some cases relate to financial inputs from Government. Given past experience with the application of conditionalities and concerns that a performance focus may compromise equity objectives (as poorer countries are less able to meet the requirements), it will be important to track where objectives are not being met and why and what impact this has on overall allocation patterns.
What are the results – who gets what?
Chart 8 shows allocations by county by socio economic status. There is a clear tendency for resources to be channelled to poorer countries though there are also significant differences between the average economic status of the recipients of the financing GHPs. The average recipient of GAVI funds has an average per capita income of just under $1,400 per head (2001 at Purchasing Power Parity) around the level of Uganda, for GPEI it is over 40% higher at just over $1950, similar to Pakistan and Ghana, whilst for GFATM it is around 77% at just over $2450 around the level of India or Bolivia.

Economic and Financial Aspects of the Global Health Partnerships 27
DFID Health Resource Centre
Chart 8
Commitments of the Financing Global Health Parterships by Economic Status(excludes GFATM allocation to Equitorial Guinea)
0
20
40
60
80
100
120
140
160
180
200
- 2,000 4,000 6,000 8,000 10,000 12,000 14,000
Per Capita Income 2001 PPP US$
Ave
rag
e A
nn
ua
l Lifetim
e C
om
mitm
en
t $
GAVI
GFATM
GPEI
GPEI $1,963
GAVI $1,385
GFATM
$2,457
Regional Allocations GFATM: According to the GFATM website, 60% of commitments are for Africa; 60% is for AIDS. Half of the money will be used by governments; half by non-governmental partners. Nearly half is for the purchase of medicines and commodities, and half is for infrastructure, training and other support costs. GAVI: According to the GAVI website, 66% of funding is for Africa. GPEI: According to GPEI’s estimates of resource requirements, 9.9% of needs for 2004 and 2005 are for Africa, reflecting the fact that resources are highly concentrated in the 6 remaining polio-endemic countries. Although GFATM guidelines indicate a preference for lower income countries, actual commitments are only loosely associated with a country’s socio economic status (Chart 9). For GAVI there is a much more pronounced gradient. Chart 9
Association between GFATM Allocations and Per Capita Income
-
5
10
15
20
25
- 2,000 4,000 6,000 8,000 10,000 12,000 14,000
GDP per capita 2001 $ at PPP
avera
ge a
nnual per capita
GFA
TM
allo
cation U
S $
Swaziland
Namibia
Zambia
Malawi
Guyana

Economic and Financial Aspects of the Global Health Partnerships 28
DFID Health Resource Centre
Chart 10
Association between GAVI Commitments and Per Capita Income
-0.1
0
0.1
0.2
0.3
0.4
0.5
0.6
0.7
0.8
- 500 1,000 1,500 2,000 2,500 3,000 3,500 4,000 4,500 5,000
2001 per capita income $ PPP
pc
annual G
AV
I co
mm
itment
Zambia, Uganda, Rwanda,
Malawi, Ghana, Burundi, Gambia
Guyana
Comparison with Existing Flows
Africa Focus The following charts compare the regional allocation of resources with those under existing approaches using Africa as a proxy for income status. DAC data also shows that the share of development assistance for health and population to Africa has declined significantly since the 1970s and, though it has begun to increase since the mid 1990s (chart 11). However, it remains far below the share allocated by GAVI and GFATM (see chart 13 overleaf). In short, donor support for the GHPs appears to have more of an Africa focus than development assistance for health as a whole. Thus, if donor support for GHPs is at the expense of other health programmes, the distributional impact appears to be positive. Chart 11
0
10
20
30
40
50
60
1975 1977 1979 1981 1983 1985 1987 1989 1991 1993 1995 1997 1999 2001
Share of Offical Development Assistance for Health and Population to Africa (Source: DAC)
% to Africa 5 yearmoving average

Economic and Financial Aspects of the Global Health Partnerships 29
DFID Health Resource Centre
As a follow on, past trends in allocation for infectious diseases and STD control were compared to commitments made by the financing GHPs. In both cases, although the share of donor support going to Africa has been increasing, it has still been below the share allocated through GAVI and GFATM (chart 12), This suggests that if funding for GHPs has been at the expense of traditional support for communicable diseases, the distributional effect is likely to have been positive (again using allocation to Africa as a proxy). Chart 12
Share of Commitments to AfricaNB need to add in unspecified
0
10
20
30
40
50
60
1989 1990 1991 1992 1993 1994 1995 1996 1997 1998 1999 2000 2001
%
STD Control
Infectious Diseases
Chart 13 compares the GHPs allocation by region with DAC data on recent trends4 in development assistance for health and population. The data support the view that the GHPs are more Africa focused than overall health and population flows over recent years, GPEI being an exception here. Chart 13
Allocation By Region: GHPs Compared to Recent Trends
-
20
40
60
80
100
120
GAVI GFATM
Overall
GFATM
HIV/AIDS
GFATM
Malaria
GFATM TB GFATM
Other
GPEI All Flows Grants Basic
Health
Care
Infectious
Disease
Control
STD
Control
GHPs Recent Trends in Donor Commitments
%
Europe
Oceania
Latin America
Middle East
Asia
North of Sahara
Sub Saharan Africa
4 taking an average for 1998 to 2002. As noted elsewhere, there are significant shortcomings in the DAC data and
these are compounded by the fact that up to 20% of recorded assistance is not specified by country. Figures shown here refer only to data where specified.

Economic and Financial Aspects of the Global Health Partnerships 30
DFID Health Resource Centre
Allocation by Income Group Chart 14 illustrates the fact that GHP resources are also more heavily focused on low income countries than recent donor commitments. On the whole, a comparison of allocations by disease (as far as is possible) suggests that GHP allocations seem to be at least as pro poor as past allocations in these areas – perhaps more pro poor for malaria, slightly less so for HIV/AIDS. Finally, chart 15 shows that GHPs allocations are also considerably more pro poor than the overall aid programmes of the major contributors to the GHPs, especially USAID, Spain, Germany and France. The GHPs are also on average more pro poor than other donors which are amongst the more pro poor bilaterals such as DFID, Netherlands, Japan and Italy. Chart 14
Allocation by Income Group: GHPs Compared to Recent Trends
-
20
40
60
80
100
120
GAVI GFATM
Overall
GFATM
HIV/AIDS
GFATM
Malaria
GFATM
TB
GFATM
Other
GPEI All Flows
for H&P
Grants for
H&P
Basic
HealthCare
Infectious
Diseases
STD
Control
GHPs Recent Trends in Donor Commitments
%
Countries in Transition
High Income
Upper Middle Income
Lower Middle Income
Other Low Income
Least Developed
Chart 15
Allocation by Income Status By Donor 2001/2 includes imputed multilateral ODA
0
20
40
60
80
100
120
Austra
lia
Austria
Belg
ium
Canada
Denm
ark
Fin
land
Fra
nce
Germ
any
Gre
ece
Irela
nd
Italy
Japan
Luxe
mbourg
Neth
erla
nds
New
Zeala
nd
Norw
ay
Portu
gal
Spain
Sw
eden
Sw
itzerla
nd
Unite
d K
ingdom
Unite
d S
tate
s
%
High Income
Upper Middle Income
Lower Middle Income
Other Low Income
Least Developed
Shares to Low Income
Countries (LLDC + Other Low
Income)
GPEI 99.3%
GAVI 98.6%GFATM (malaria) 94.2%
GFATM 77.8%
GFATM (TB) 81.8%
GFATM HIV/AIDS 73.1%
DAC average 64.1%
Share of
Recent Donor Commitments for
Health 1998-2002
All flows: 67.6%Grants: 73.8%
of which basic health 79.0%
infectious diseases 87.8%
STD (inc HIV/AIDS) 83.7%
Thus, whilst it may not be possible to say whether the GHPs are actually at the expense of other type of development assistance, it is possible to say that:

Economic and Financial Aspects of the Global Health Partnerships 31
DFID Health Resource Centre
• if the GHPs are at the expense of non-health development assistance, they appear to promote a more pro poor global allocation of resources
• if the GHPs are at the expense of overall health and population assistance, they appear to promote a more pro poor global allocation of resources
• if the GHPs are just substituting for bilateral efforts to combat the communicable diseases, there seems little prospect that they will significantly worsen the overall allocation of resource.
At the same time some donors are providing relatively little development assistance in relation to GDP (chart 16), relatively little support for health and population in relation to their overall programmes (chart 17) and not focusing their resources on countries in need (chart 15). Measures to increase overall bilateral spending and focus it on the social sectors in low income countries could clearly change this comparison with the GHPs. Chart 16
Net Official Development Assistance as a % of Gross National Income
0
0.2
0.4
0.6
0.8
1
1.2
Austra
lia
Austria
Belg
ium
Canada
Denm
ark
Fin
land
Fra
nce
Germ
any
Gre
ece
Irela
nd
Italy
Japan
Luxem
bourg
Neth
erla
nds
New
Zeala
nd
Norw
ay
Portu
gal
Spain
Sw
eden
Sw
itzerla
nd
Unite
d K
ingdom
Unite
d S
tate
s
%
UN Target 0.7% of GDP
Chart 17
Share of Development Assistance to Health and Population by Donor
0
5
10
15
20
25
30
Austra
lia
Austria
Belg
ium
Ca
nada
De
nm
ark
Fin
land
Fra
nce
Germ
any
Gre
ece
Irela
nd
Italy
Jap
an
Luxem
bourg
Ne
therla
nd
s
N Z
eala
nd
No
rway
Portu
ga
l
Spain
Sw
ed
en
Sw
itzerla
nd
UK
US
Tota
l DA
C
Tota
l
EC
World
Bank
Re
gio
nal D
Bs
%
Population
Other Health
Basic Health

Economic and Financial Aspects of the Global Health Partnerships 32
DFID Health Resource Centre
How Cost Effective are the Key Strategies?
Most interventions aimed at communicable diseases are highly cost effective (table 1) although, as Mills points out, it is not clear whether it is better to address specific diseases as opposed to an overall package of essential health services. Moreover, it is clear that cost effectiveness results are highly dependant upon the quality of health systems and in the provision of other complementary inputs such as education, water and sanitation etc. Table 1: Cost Effectiveness of Health Interventions Aimed at Priority Diseases
Condition Cost per DALY Source TB DOTS for smear positive patients BCG DOTS for smear negative patients
<$40 <$50 $10 to $20
CMH Working Group 5: Paper 8
Immunisation EPI plus Measles
$12 to $17 $2.5 to $5
CMH Working Group 5: Paper 10
HIV/AIDS Condom distribution Improved Blood Safety Prevention of MTCT (nevirapine) Peer Education for CSWs HAART
$1-$100 $1-$43 $1-12 $4-7 $1,100 to $1,800
Creese 2002
Malaria Insect treated bednets
Residual spraying Chaemoprophylaxis for children
$19 to 85 $16 to $29 $8 to $41
Goodman, Coleman and Mills (2000)
Table 1 shows that there is significant variance in the cost effectiveness of the key interventions supported through the GHPs. Although actual cost effectiveness will depend upon local circumstances – cost factors, the strengthen of health systems, epidemiological factors- most of the interventions outlined above would be considered extremely cost effective uses of limited resources. The exception is ART. Based on existing evidence, ART is not a cost effective use of resources5 – its use can be justified on humanitarian but not economic grounds. Though declining prices of ARVs would improve its cost effectiveness even if drugs were free, it would still be a less cost effective intervention than most funded under the GHPs. Indeed, Mills finds that ART is the only intervention, amongst a range of key interventions, for which costs actually exceed benefits. This is of relevance as the majority of GFATM commitments are for HIV/AIDS, of which a large, though unclear, proportion of funding is for ART.
There is also a pronounced shift over time towards support for malaria at the expense of TB (chart 18) though it is less clear what implications this has for overall cost effectiveness.
5 unless, as some argue, provision of ARTs is an essential component of the overall care package that incentivises
people to come for testing and therefore can help people know their status, and therefore can aid in prevention

Economic and Financial Aspects of the Global Health Partnerships 33
DFID Health Resource Centre
Chart 18
GFATM: Allocation by Disease by Round
0% 10% 20% 30% 40% 50% 60% 70% 80% 90% 100%
Round 1
Round 2
Round 3
Round 4
Malaria
HIV/AIDS
TB
Integrated
HIV/TB
There are no clear trends in terms of allocation by region (table 2). East Asia and the Pacific did well out of the first round but not the second, whereas Sub Saharan Africa did relatively poorly in the third round but did well in the fourth.
Table 2: Trends in GFATM Allocations by Region and Round
EAST ASIA & THE PACIFIC
EASTERN EUROPE & CENTRAL ASIA
LATIN AMERICA & THE CARIBBEAN
NORTH AFRICA & THE MIDDLE EAST
SOUTH ASIA SUB-SAHARAN AFRICA
$m % of Round
$m % of Round
$m % of Round
$m % of Round
$m % of Round
$m % of Round
Round 1 132.3 23.7 27.2 4.9 71.4 12.8 4.7 0.9 13.7 2.5 308.0 55.3
Round 2 65.2 7.6 72.7 8.5 98.7 11.5 53.4 6.2 65.5 7.7 500.1 58.4
Round 3 88.9 13.9 58.9 9.2 89.4 14.0 45.8 7.1 31.6 4.9 326.4 50.9
Round 4 114.9 11.9 53.1 5.5 26.5 2.7 28.7 3.0 82.1 8.5 662.6 68.5
Total 401.2 13.3 211.9 7.0 286.0 9.5 132.6 4.4 192.9 6.4 1,797.1 59.5
Serious doubts have been expressed about the value for money offered by the newer vaccines currently being promoted by GAVI. Although such vaccines are undoubtedly more expensive and generally less cost effective than existing vaccines, they are still highly cost effective (in most circumstances) and should still be a priority use of limited resources (table 3). Expansion of newer vaccines should not take place at the expense of traditional ones but at the expense of other less cost effective interventions.
Table 3: Cost Effectiveness of New Vaccines in Low Income Settings
Deaths Deaths Prevented
Life Years Saved
Cost $m
Cost per Life Year Saved $
High Low Low High Low High Low High
Hep B 607 850 391 547 6.8 9.5 103 11 15 Hib 143 163 87 96 103 21 22 Rotavirus 312 324 104 192 6.0 11.6 187 16 31 SP Conjugate
745 993 363 727 21.1 42.2 825 20 39

Economic and Financial Aspects of the Global Health Partnerships 34
DFID Health Resource Centre
Source: Miller, McCann 2000
If DFID were serious in wanting to emphasise cost effectiveness, it would be useful to track expenditure by GHP by intervention over time – looking at what the GHPs are actually delivering rather than what they are spending on. At present, only superficial analyses of spend are carried out. For example, GFATM provides data on spending by functional use e.g. commodities, salaries and by disease but not by intervention. At the GFATM Partners Forum, it was argued by some that “efficiency and cost-effectiveness should be included in the rationale for allocating Global Fund monies” and that Global Fund country experiences should be promptly publicised.
Do the Global Partnerships Affect Financing Patterns at the Country Level?
The commitments of the global programmes remain relatively modest in the context of overall health spending in developing countries. Current GFATM commitments – amounting to around $1.6bn over the next 5 years - compare to estimated annual public spending on health of some $110.2bn in GFATM recipient countries (heavily skewed by the inclusion of Argentina, Russia, Turkey and Iran). For GAVI, the annual commitment of $200m compares to average annual expenditure of some $38.8bn in GAVI recipient countries. Even for the top 25 GFATM and GAVI recipients, annual commitments totalling $1.25bn only accounted for 2-3% of total public spending on health of $50.9bn. For GPEI the impact is greater, with average expenditure of $320m set against total public spending of some $8.8bn in recipient countries. These averages conceal more than they reveal. Chart 19 shows that at the country level the situation is rather different. 5 countries have GHP commitments in excess of $5 per capita per year (and over $18 in Swaziland). In 11 countries, the commitments from the financing GHPs exceed 50% of WHO’s estimates of total 2001 public expenditure on health. For Ethiopia, Liberia and Malawi it exceeds 100%, largely due to low public spend in the first two and a combination of low public spending and high allocations from global funds in the last6. The GHPs also need to be seen in the context of significant additional flows through MAP and PEPFAR as shown in the chart below.
6 Note – these figures are crude. Current spending figures are from WHO WHR 2003 and refer to 2001 and may
therefore also include spending on polio eradication. They may not agree with countries’ own estimates. PEPFAR figures are illustrative and assume funding is allocated in proportion to the estimated number of people living with HIV and does not account for the fact that a significant share of the funds may not be spent in country.

Economic and Financial Aspects of the Global Health Partnerships 35
DFID Health Resource Centre
Chart 19
Expenditure on New Initiatives as % of Previous Public Expenditure on Health (2001 WHO NHA: for all countries where initiatives add at least 5%)
-
100
200
300
400
500
600
tota
l as %
of 2
00
1 p
ublic e
xpe
nd
itu
re o
n h
ealth
(W
HO
NH
A 2
00
1)
MAP as % of Public Expenditure
PEPFAR as % of Public Expenditure
GPEI as % of Public Expenditure
GAVI as % of Public Expenditure
GFATM as % of Public Expenditure
Current Public Spending
adds 25% adds 10%adds 50%
adds 100%
Less information is available in terms of the balance of effort between different diseases at country level though there are some concerns (see box 4 on Tanzania). The GFATM Partners forum also reflected concerns that “resources are currently concentrated on AIDS, and should be allocated more equitably to TB and malaria efforts”.
Box 4: Too Little HIV/AIDS Spending on Prevention?
There is already some evidence that the pattern of spending is becoming unbalanced, with a big increase in commitments to care and treatment, while prevention interventions remain too small scale and localised, and mitigation continues to lack policy direction or significant funding. Foster and Mwinyimvua PUBLIC EXPENDITURE REVIEW HIV/AIDS MULTI-SECTORAL UPDATE FOR 2004
Complementarity with other new initiatives
It is interesting to note that commitments under MAP appear to complement those of the Global Fund (chart 20), whilst those for PEPFAR may reinforce GFATM spending patterns as the initiative is focused on countries due to receive significant funding from GFATM.

Economic and Financial Aspects of the Global Health Partnerships 36
DFID Health Resource Centre
Chart 20
Association Between GFATM and MAP Funding
0
0.5
1
1.5
2
2.5
3
3.5
4
0 5 10 15 20 25
$ per capita GFATM current commitments (Africa only)
$ p
er capita M
AP
curr
ent com
mitm
ents
Allocation of Resources According to Burden of Disease As already noted, the GHPs seem to have targeted resources more effectively to low income countries than existing mechanisms. Some GHPs have done this better than others. Charts 21 and 22 examine whether there is any correspondence between the allocation of resources by the GHPs and measures of need. In general they show that, within disease categories, resources tend to be allocated in relation to needs although the relationship is often relatively weak. Chart 21
Association between GFATM Support and Needs: HIV/AIDS
y = 0.3687x + 0.3397
R2 = 0.3846
-
2
4
6
8
10
12
14
16
18
20
- 5 10 15 20 25
HIV Prevalence Rate (% of total population infected source: UNAIDS 2004)
Avera
ge a
nnual per
capita G
FA
TM
com
mitm
ent fo
r H
IV/A
IDS
and H
IV-T
B a
llocation
Swaziland
Namibia
GuyanaZambia
Malawi
BotswanaLesotho
ZimbabweSouth Africa

Economic and Financial Aspects of the Global Health Partnerships 37
DFID Health Resource Centre
Chart 22
Association between TB Prevalence Rate and GFATM Commitment for TB
y = 0.3262x + 0.042
R2 = 0.1657
-
0.1
0.2
0.3
0.4
0.5
0.6
0.7
0.8
0.9
1.0
- 0.2 0.4 0.6 0.8 1.0 1.2
TB Prevalence Rate - Estimated Cases as % of Population
Avera
ge A
nnu
al G
FA
TM
Com
mitm
ent
for
TB
and
HIV
-T
B $
LesothoMoldova
Zimbabwe and Botswana
Djibouti
Swaziland
Zambia
South Africa
Rwanda
Kenya
Cambodia Namibia
Analysis of the GAVI pattern of commitments in charts 23 and 24 shows that allocations do appear to be based on outstanding need in terms of their potential targets (at least when outliers – India and China – are excluded) but also are equitable in the sense that additional support is provided to countries with lower coverage rates at the outset. Chart 23
GAVI: Association between Funding and "Demand" excluding India and China
-
1,000
2,000
3,000
4,000
5,000
6,000
0 10 20 30 40 50 60 70 80 90
GAVI 5 year commitment
nu
mb
er
of
surv
ivin
g c
hild
ren
at firs
t ap
pro
val 0
00

Economic and Financial Aspects of the Global Health Partnerships 38
DFID Health Resource Centre
Chart 24
GAVI: Association between Funding and "Needs"
0
20
40
60
80
100
120
0 0.1 0.2 0.3 0.4 0.5 0.6 0.7 0.8
Average per capita annual GAVI commitment US$
DP
T 3
Co
ve
rage
Ra
te a
t firs
t ap
pro
val
Assessment of Technical and Administrative Efficiency Questions considered here include:
• are the partnerships lean and mean? • what are the net costs?
There are no specific benchmarks for what constitutes an appropriate level of spending by GHPs on their core functions – especially where the core functions of the organisation differ significantly. The few evaluations have been unable to make specific value for money judgements. According to the IAVI evaluation, “the panel cannot make a detailed judgment about the “value for money” of this expenditure. However, it believes that IAVI has prudently managed the funds entrusted to it and that its accomplishments for this level of expenditure have to be seen as very substantial. In addition, as also noted earlier, about 85% of IAVI’s expenditure has gone for program efforts, which appears to be very reasonable, especially for an organization only 7 years old”. The Stop TB evaluation found that the direct costs of the Partnership to be modest (US$ 18.05m for the Secretariat in 2002, of which US$13.0m was for the GDF) but also that the cost savings from reduced procurement costs associated with bulk buying by the GDF partially offset the costs of the Partnership7. The review also found that the costs paid by the Partnership to WHO (to meet the costing of hosting the partnership) more or less equalled the costs actually incurred by the host organisation, deflecting concerns that the arrangement was seen as a way for WHO to raise money. In short, “the general conclusions (were) that the partnership does add value, that any value it does add will have large health benefits compared to the
7 It is difficult to attribute the changes in price to GDF but expert opinion suggests it was at least, in part, responsible.
It could also be argued that countries derived additional benefits from the overall reductions in price in the market and that had GDF operated in line with its Strategic Plan targets the costs of the Partnership would have been more than offset.

Economic and Financial Aspects of the Global Health Partnerships 39
DFID Health Resource Centre
costs involved and also in comparison with other uses of funds and that in any case the “net” costs of the Partnership are low8”. Overheads tend to be low in comparison to levels of commitments:
• The Vaccine Fund uses 98 percent of its contributions for programmes • less than 3% of annual commitments are used for central administration and
management of the Global Fund each year. An additional 2% is used for local oversight of grants by Local Fund Agents.
The expectations of donors are often unrealistic - DFID initially envisaged that the GFATM would have a core staff of some 15 professionals (“A Secretariat staff of 12-15 professionals with associated support staff is envisaged (it is suggested 8-10 would be sufficient”) – original working paper). Clearly this has not been achieved but this does not mean that GFATM does not need these additional staff to function effectively. Most reviews have suggested that it is often not pure numbers of staff but the structure, skill mix and problems such as turnover or recruitment difficulties which represent greater problems. Table 4 provides some key information on the size of the secretariat for a number of GHPs Table 4: Key Characteristics of the Major GHPs
Feature
Stop TB GAVI RBM
GFATM
Administration - nos. - prof/general - budget
Secretariat 26 staff in post (19 professional, 7 support staff. Secretariat expenditure (excluding GDF) of 2.5m in 2001 5.05m in 2002. Country level commitments of $53.8m (included projected TRC 7)
Secretariat 16, (8 professional and 4 general staff 4 short term staff). Secretariat budget of $3.9m for 2003. Country level commitments of $1.03bn over 5 years
Secretariat 16 professionals + 3 support staff)
Secretariat 74 staff (58 permanent 16 interim) .Secretariat staff $38.7m budget for 2003, $16 m of which is for in-country Local Fund Agents to oversee those entities in charge of grant implementation (PRs). Actual expenditure was $31.8m of which $10.1m on LFA fees $922m committed over 5 years during R1 and R2; $130m disbursed to date. Budget for 2004 is $52.7m of which $22.2m is LFA fees
Assessment of Equity Key questions include:
• do the GHPs focus resources on poor countries? • do the GHPs focus resources on the countries with the greatest disease
burdens? • are the GHPs self targeting in that they focus on diseases of the poor? • do the GHPs take any steps to ensure most benefits go to the poor?
8 Whilst the Secretariat attempts to capture the full formal costs of the Partnership including specific in-kind costs, it
does not purport to capture the full costs (e.g. cost of donor Board attendance). The working assumption here would be that the partner considers that the benefits outweigh the costs involved.

Economic and Financial Aspects of the Global Health Partnerships 40
DFID Health Resource Centre
Do resources go to countries in need?
Charts 25 to 27 build on the results shown in chart 8 earlier to demonstrate that the average recipient country has a low income per head and the level of support tends to decline with increasing economic status Chart 25
GFATM Commitments by Economic Status
-100
0
100
200
300
400
500
600
700
- 5,000 10,000 15,000 20,000 25,000 30,000 35,000
Per Capita Income 2001 PPP US$
Lifetim
e B
udget $m
Average = $2,457
Chart 26
GAVI Commitments by Economic Status
0
10
20
30
40
50
60
70
80
90
- 500 1,000 1,500 2,000 2,500 3,000 3,500 4,000 4,500 5,000
Per Capita Income 2001 US$ PPP
Com
mitm
ents
$m
Average = $1,385
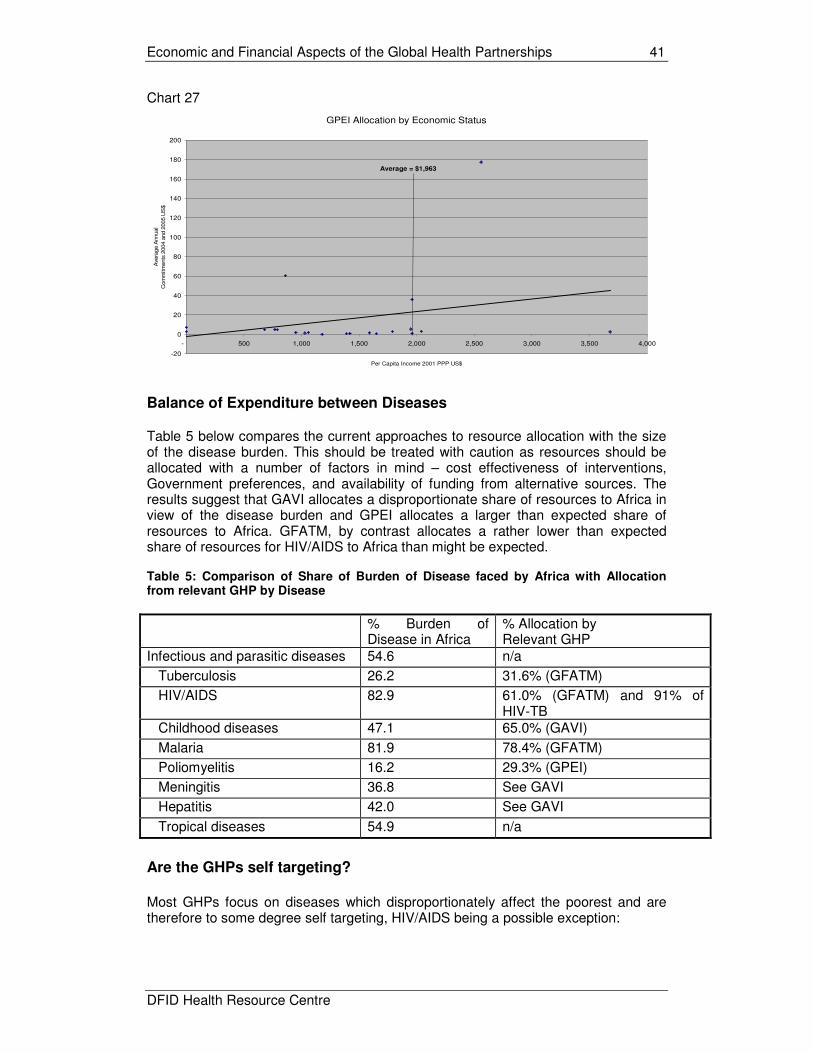
Economic and Financial Aspects of the Global Health Partnerships 41
DFID Health Resource Centre
Chart 27
GPEI Allocation by Economic Status
-20
0
20
40
60
80
100
120
140
160
180
200
- 500 1,000 1,500 2,000 2,500 3,000 3,500 4,000
Per Capita Income 2001 PPP US$
Avera
ge A
nnual
Com
mitm
ents
2004 a
nd 2
005 U
S$
Average = $1,963
Balance of Expenditure between Diseases
Table 5 below compares the current approaches to resource allocation with the size of the disease burden. This should be treated with caution as resources should be allocated with a number of factors in mind – cost effectiveness of interventions, Government preferences, and availability of funding from alternative sources. The results suggest that GAVI allocates a disproportionate share of resources to Africa in view of the disease burden and GPEI allocates a larger than expected share of resources to Africa. GFATM, by contrast allocates a rather lower than expected share of resources for HIV/AIDS to Africa than might be expected. Table 5: Comparison of Share of Burden of Disease faced by Africa with Allocation from relevant GHP by Disease
% Burden of Disease in Africa
% Allocation by Relevant GHP
Infectious and parasitic diseases 54.6 n/a
Tuberculosis 26.2 31.6% (GFATM)
HIV/AIDS 82.9 61.0% (GFATM) and 91% of HIV-TB
Childhood diseases 47.1 65.0% (GAVI)
Malaria 81.9 78.4% (GFATM)
Poliomyelitis 16.2 29.3% (GPEI)
Meningitis 36.8 See GAVI
Hepatitis 42.0 See GAVI
Tropical diseases 54.9 n/a
Are the GHPs self targeting?
Most GHPs focus on diseases which disproportionately affect the poorest and are therefore to some degree self targeting, HIV/AIDS being a possible exception:

Economic and Financial Aspects of the Global Health Partnerships 42
DFID Health Resource Centre
• HIV/AIDS – there is little unambiguous evidence to show whether HIV/AIDS is a disease of the poor. Cogneau and Grimm9 2003 maintain that “only partial evidence is available suggesting that urban, more educated people, teachers, and truck-drivers are more exposed to the risk of HIV/AIDS”. In South Africa, the HSRC Study of HIV/AIDS 2002 found a negative correlation between HIV and socio-economic status which disappeared when only Africans were considered. Similarly, it found negative correlation between level of schooling and prevalence of HIV/AIDS which reverses when white South Africans are excluded.
• Malaria – though there is little consistent evidence of socio economic
differentials in incidence, the poor are more vulnerable to the consequences of infection due to inequality in access to prevention and treatment. Expenditure on prevention is more strongly correlated with income than treatment – suggesting investment in prevention is likely to be more pro poor – whilst recognising that the poor often seek care from traditional sources than through modern medicine10.
• TB – usually considered to be a disease of the poor and whilst prevalence
does indeed tend to be greater amongst the poor, there is growing evidence that the better off also suffer11.
• Immunisation – Demographic and Health Surveys clearly show that better
off groups have higher coverage rates than the poor, suggesting that increased efforts are likely to have a disproportionate effect on the poor (for the traditional vaccines at least). As shown in the chart the socio economic gradient is perhaps less pronounced than for some other services.
Chart 28
Access to Essential Health Services by Socio Economic Group population w eighted average 21 Sub Saharan African countries: Source DHA various years
0
10
20
30
40
50
60
70
80
90
Poorest
20%
Second
20%
Middle
20%
Fourth
20%
Richest
20%
Average
% c
overa
ge
All Immunisations
Attended Delivery
It may not be enough to say that funds are targeting on conditions primarily faced by the poor in situations where funding is being channelled through health systems
9 Socio-economic status, sexual behaviour, and differential AIDS mortality Evidence from Cote d’Ivoire Cogneau and
Grimm 2003 10
Eve Worralla, Suprotik Basub, and Kara Hanson “Ensuring that malaria control interventions reach the poor” 2002. 11
The economic impacts of tuberculosis: Stop TB Partnership Ahlburg 2000

Economic and Financial Aspects of the Global Health Partnerships 43
DFID Health Resource Centre
which themselves are not pro poor (chart 28). The GHPs have few specific measures to ensure resources focus on the needs of the poor. Nonetheless, there is some evidence that investment in primary care, where much of the GHP funding is allocated, is more pro poor than for secondary of tertiary care (Gwatkin 2003).

Economic and Financial Aspects of the Global Health Partnerships 44
DFID Health Resource Centre
ANNEX 2: FINANCING IMPACT
This section considers:
• what are the recent trends in the financing of health services and what implications do they have?
• have the GHPs provided additional funds and developed new funding sources?
• are the GHPs distortionary and, if so, was this a good thing? • were additional funds the major constraint? • what are the implications for sustainability and aid dependency? • who should fund what?
Approaches To Health Financing Data on recent trends in health spending in DFID PSA countries show:
• private expenditure dominates the financing of health services in both regions (but especially so in Asia).
• the vast majority of private expenditure (especially in Africa) is accounted for by out of pocket expenditure which has long been recognised as an inefficient and inequitable way of financing health care.
• risk pooling is generally minimal and confined to the better off - with some notable exceptions
• some evidence that health spending is increasing as a share of GDP in both regions and that the public share of health spending is increasing in Africa - probably reflecting greater aid flows and resulting in increasing levels of aid dependence.
Financing patterns vary widely within regions and averages are highly skewed by China and South Africa. Table 6: Key Health Financing Indicators: DFID PSA Countries
Indicator Average by
Region 1997 1998 1999 2000 2001 Ranges and Comments
Asia PSA Countries
4.60 4.61 4.83 4.93 4.98 Health as % of GDP Africa PSA
Countries 4.53 4.70 4.57 4.68 4.78
<2.5% in Indonesia to >11.5% in Cambodia
Asia PSA Countries
28.84 29.86 29.14 28.35 28.77 Public Share of Total Health Expenditure
Africa PSA Countries
33.12 34.63 34.08 35.29 37.69
<15% in Cambodia to >75% in Lesotho
Asia PSA Countries
8.28 8.10 7.38 6.93 6.66 Health as % of Total Public Expenditure
Africa PSA Countries
7.91 7.86 7.22 7.68 7.60
<5% in India, Nigeria, Sudan to >15% in Mozambique, Uganda and Cambodia
Asia PSA Countries
2.05 2.30 2.47 2.51 1.64 External Resources as % of Total Health Expenditure
Africa PSA Countries
9.43 12.82 13.72 15.70 16.92
<0.2% in China to >45% in Zambia
Asia PSA Countries
96.60 96.20 96.25 96.54 96.62 Out of Pocket Expenditure as % of Private Expenditure
Africa PSA Countries
80.62 81.03 79.71 79.66 79.76
<25% in South Africa to 100% in many countries
Economic and Financial Aspects of the Global Health Partnerships 45
DFID Health Resource Centre
Asia PSA Countries
8.11
8.46
8.98
9.91
10.22
Per Capita Public Expenditure on Health (current exchange rate)
Africa PSA Countrie35s
17.53
15.43
13.95
13.75
12.27
<$5 in Ethiopia to >$220 in South Africa
Source: WHO World Health Report 2003 – note figures do not necessarily correspond to country figures
Lack of Government funding for health is a major constraint (chart 29). Within the African context, only Uganda and Mozambique were reported to exceed the Abuja Declaration target of allocating at least 15% of Government spending to health. Public spending in the 25 PSA countries averaged only $10.5 per head in 2001 (and only $4.3 per head in the African PSA countries once South Africa is excluded). This is well below that required to deliver any decent package of basic health care. Spending in Uganda and Tanzania, for example, is around a third and a half, respectively, of that required to deliver the locally defined minimum essential package of care. There are only 4 countries in which estimated public spending in 2001 exceeded the $12 to fund the World Bank essential health package (China, Lesotho, South Africa and Zimbabwe) and only in South Africa did it exceed the $35 package identified in 2001 by the Commission for Macroeconomics and Health Ethiopia spends around $1 per person per year on health through the public sector. Chart 29
Per Capita Expenditure on Health in 2001 by Source Source: WHO excludes South Africa public = $92, private = $130
-
10
20
30
40
50
60
Ba
ng
lade
sh
Ca
mb
od
ia
Ch
ina
Ind
ia
Ind
on
esia
Ne
pa
l
Pa
kis
tan
Vie
t Na
m
DR
Co
ngo
Eth
iop
ia
Gh
ana
Ke
nya
Le
soth
o
Ma
law
i
Mo
zam
biq
ue
Nig
eria
Rw
an
da
Sie
rra L
eon
e
Su
da
n
Ug
an
da
Ta
nza
nia
Za
mbia
Zim
ba
bw
e
All P
SA
Co
un
tries
Asia
PS
A C
ou
ntrie
s
Afric
a P
SA
Cou
ntrie
s
Afric
a e
xcl S
ou
th
Africa
$ p
er
he
ad,
20
01
Private
PublicWorld Bank $12
Basic Package
Commission for Macroeconomics and
Health $35 Essential Package
Ultimately most spending on communicable diseases is in the form of out of pocket payments, which account for around three quarters of total health spending in low income countries (box 5)
Box 5: Spending on Malaria in Tanzania Tanzania spends approximately $US 2.14 per person per annum on malaria services. This is approximately 15% of spending on health in the average developing country. In Tanzania it represents approximately 39% of all health expenditures. Malaria accounts for 30% of the total burden of disease. Approximately three-quarters of malaria expenditures are household expenditures in the formal and informal private sector. Government contributes 20%; donors 9%. Of total malaria expenditure, one-third is spent on anti-malarial drugs, and almost half on bednets, insecticides and coils. Anecdotal evidence suggests that the use of traditional healers for malaria treatment is small. Source: Jowett et al, 2000

Economic and Financial Aspects of the Global Health Partnerships 46
DFID Health Resource Centre
Recent Trends
The HIPC initiative has resulted in an increased share of resource going to the health sector and in some cases HIPC funds are specifically tied to spending on health (Ghana, Ethiopia). However, many of the gains appear to have been made in the run up to the HIPC completion point and a review of PRSPs carried out by WHO indicates that, although spending on health is expected to increase in absolute terms, it is only likely to increase marginally as a share of public or social sector spending. Progress in improving health outcomes and access to essential services
Health indicators and coverage of MDG relevant health services vary widely both between countries and between socio economic groups within countries (chart 30): overall infant mortality rates vary from 20 per 100,000 live births in Vietnam to 165 in Sierra Leone and Afghanistan whilst the share of attended deliveries varies from around 12% in Afghanistan to around 85% in Vietnam and South Africa. infant and child mortality rates for the poorest quintile are considerably higher than for the richest quintile whilst the poorest quintile are much less likely to use modern contraceptive methods, immunise their children against measles and have an attended delivery. Chart 30
Differential Health Outcomes and Access to Essential Services by
Socio-Economic Group 15 DFID PSA Countries Source: DHS various years
0.0
20.0
40.0
60.0
80.0
100.0
120.0
140.0
160.0
180.0
IMR U5MR Measles Immunisation Skilled Attendants at Birth Contraceptive Prevalance
Rate (female)
%/d
eath
s p
er live b
irth
/% o
f 12-2
3 m
onth
s im
munis
ed Poorest
II
III
IV
Richest
Outcomes and access have generally improved though not for some countries and rarely at rates necessary to achieve the MDGs. Of the 24 PSA countries for which data are available, infant mortality has actually increased in 8 and only in 4 is the IMR MDG likely to be achieved if present trends are maintained (chart 31).

Economic and Financial Aspects of the Global Health Partnerships 47
DFID Health Resource Centre
Chart 31
Progress Towards the MDG
Improvements in Health Outcomes between 1990 and 2002
-
20
40
60
80
100
120
140
160
180
Bangla
desh
Cam
bodia
Chin
a
Congo D
R
Eth
iopia
Ghana
India
Indonesia
Kenya
Lesoth
o
Mala
wi
Mozam
biq
ue
Nepal
Nig
eria
Pakis
tan
Rw
anda
Sie
rra L
eone
South
Afric
a
Sudan
Tanzania
Uganda
Vie
tnam
Zam
bia
Zim
babw
e
2002 a
s %
of 1990
IMR
U5MR
On Track
Off track but
progress
Off track and
no progress
MDG
Target
for
2015
Has development assistance for health declined? The ToRs ask whether funding through the GHPs has offset the decline in development assistance for health. In practice it would appear that assistance for health has increased rapidly over the last few decades. Although development assistance as a whole declined over the 1990s and has only just exceeded its 1990 levels in real terms, support for health seems to have increased throughout. According to DAC analysis, development assistance for health increased by 3% per annum between 1975 and 199812 to around $3.5bn per annum by 1998. Updating this analysis suggests the figure has now increased to just under $5bn per annum is 2003. Support for health and population activities accounts for roughly 7% of official development assistance from bilateral and multilateral sources. In broad terms, around a third has supported basic health (including infectious disease control and immunisation), just over a third for reproductive health and population activities (including STDs and HIV/AIDS control), with the balance going on general and non basic services. Chart 32 (below) illustrates both the increases as well as the change in distribution.
12
Recent Trends in Official Development Assistance to Health September 2000 OECD
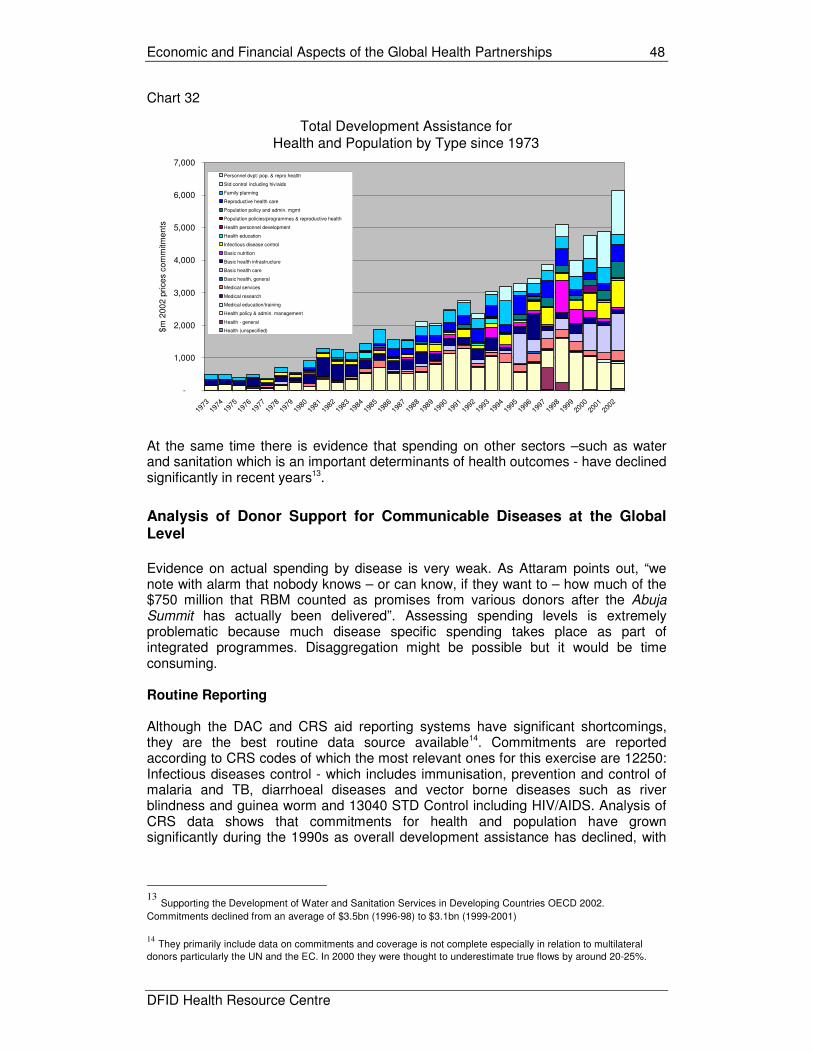
Economic and Financial Aspects of the Global Health Partnerships 48
DFID Health Resource Centre
Chart 32
Total Development Assistance for Health and Population by Type since 1973
-
1,000
2,000
3,000
4,000
5,000
6,000
7,000
1973
1974
1975
1976
1977
1978
1979
1980
1981
1982
1983
1984
1985
1986
1987
1988
1989
1990
1991
1992
1993
1994
1995
1996
1997
1998
1999
2000
2001
2002
$m
200
2 p
rice
s co
mm
itme
nts
Personnel dvpt: pop. & repro health
Std control including hiv/aids
Family planning
Reproductive health care
Population policy and admin. mgmt
Population policies/programmes & reproductive health
Health personnel development
Health education
Infectious disease control
Basic nutrition
Basic health infrastructure
Basic health care
Basic health, general
Medical services
Medical research
Medical education/training
Health policy & admin. management
Health - general
Health (unspecified)
At the same time there is evidence that spending on other sectors –such as water and sanitation which is an important determinants of health outcomes - have declined significantly in recent years13.
Analysis of Donor Support for Communicable Diseases at the Global Level
Evidence on actual spending by disease is very weak. As Attaram points out, “we note with alarm that nobody knows – or can know, if they want to – how much of the $750 million that RBM counted as promises from various donors after the Abuja Summit has actually been delivered”. Assessing spending levels is extremely problematic because much disease specific spending takes place as part of integrated programmes. Disaggregation might be possible but it would be time consuming. Routine Reporting
Although the DAC and CRS aid reporting systems have significant shortcomings, they are the best routine data source available14. Commitments are reported according to CRS codes of which the most relevant ones for this exercise are 12250: Infectious diseases control - which includes immunisation, prevention and control of malaria and TB, diarrhoeal diseases and vector borne diseases such as river blindness and guinea worm and 13040 STD Control including HIV/AIDS. Analysis of CRS data shows that commitments for health and population have grown significantly during the 1990s as overall development assistance has declined, with
13
Supporting the Development of Water and Sanitation Services in Developing Countries OECD 2002.
Commitments declined from an average of $3.5bn (1996-98) to $3.1bn (1999-2001)
14
They primarily include data on commitments and coverage is not complete especially in relation to multilateral
donors particularly the UN and the EC. In 2000 they were thought to underestimate true flows by around 20-25%.

Economic and Financial Aspects of the Global Health Partnerships 49
DFID Health Resource Centre
the share of health and population increasing from 5% in 1991 to 8.2% in 2000 (based on 3 year moving averages). As chart 33 shows, most support for the health sector is highly concessionary with limited flows through loans and other flows through the multilaterals (primarily lending by the World Bank and regional development banks at near market rates). Chart 33
Commitments for Health and Population by Source
-
1,000
2,000
3,000
4,000
5,000
6,000
7,000
1973
1974
1975
1976
1977
1978
1979
1980
1981
1982
1983
1984
1985
1986
1987
1988
1989
1990
1991
1992
1993
1994
1995
1996
1997
1998
1999
2000
2001
2002
$m
2002 p
rices S
ourc
e D
AC C
RS
Equity Investment
OOF(Multilateral only)
ODA/OA Loans
ODA /OA Grants
Commitments for infectious diseases and STD control – which contain the majority of spending on communicable diseases - have grown rapidly in real terms (chart 34). Chart 34
Commitments for STD Control and Infectious Diseases
-
500
1,000
1,500
2,000
2,500
1986
1987
1988
1989
1990
1991
1992
1993
1994
1995
1996
1997
1998
1999
2000
2001
2002
$m
2002 p
rices
Std control including hiv/aids
Infectious disease control
For STD control in particular and also, but to a lesser degree, infectious disease control, commitments have increased as a share of total commitments for health and population (chart 35).

Economic and Financial Aspects of the Global Health Partnerships 50
DFID Health Resource Centre
Chart 35
Commitments for STD Control and Infectious Diseases as % of Total Commitments for Health and Population
0
5
10
15
20
25
1986 1987 1988 1989 1990 1991 1992 1993 1994 1995 1996 1997 1998 1999 2000 2001 2002
%
Std control including hiv/aids
Infectious disease control
Funding Sources A few key donors have been responsible for the majority of support in these areas over the last decade or so with the US, World Bank and UK, for example, accounting for 36.7%, 18.7% and 9.1% of spending on STD control respectively (chart 36). Chart 36
Reported Commitments to STD Control by Donor since 1990
0
200
400
600
800
1000
1200
1400
1600
1990 1991 1992 1993 1994 1995 1996 1997 1998 1999 2000 2001 2002
$m
200
2 p
rices
UNFPA
UNAIDS
UNICEF
UNDP
IDA
IBRD
CEC (EDF)
AfDF
United States
United Kingdom
Switzerland
Sweden
Spain
Portugal
Norway
New Zealand
Netherlands
Luxembourg
Japan
Italy
Ireland
Greece
Germany
France
Finland
Denmark
Canada
Belgium
Austria
Australia
US
UK
IBRD
Economic and Financial Aspects of the Global Health Partnerships 51
DFID Health Resource Centre
Specific Studies Global Expenditure on HIV/AIDS An analysis of aid spending on HIV/AIDS control has just been completed (June 2004) by DAC in collaboration with UNAIDS. It is more reliable than routine analysis of DAC statistics as it carried out a more in depth analysis of multilateral spending and also incorporates the multisectoral aspects of spending on HIV/AIDS (so is not necessarily comparable with other figures quoted in this paper). The average annual commitment between 2000 and 2002 was estimated at between $2.18bn and $2.43bn. Of this, some $1.04bn was accounted for by bilateral support (of which the US and the UK alone accounted for over 70% with $567m and $147m respectively)15. The Global Fund accounted for a further $474m and imputed expenditure by the multilaterals at $575m (of which IDA accounted for $338m, the EC $123m and UNICEF $81m). UNAIDS accounted for a further $88m per annum. In absolute terms, Nigeria, Kenya and Uganda were the largest beneficiaries (with $91m, $61m and $53m respectively). Grenada, Barbados and Sao Tome all received over $10 per head of population, whilst in Barbados, Botswana and Zambia over 15% of all aid flows were for HIV/AIDS control. Global Expenditures on TB
WHO prepares an annual report on financing for TB in the high burden countries “Global tuberculosis control - surveillance, planning, financing”. The key table in relation to funding is reproduced below.
15
An additional $254m was estimated as possible bilateral support for HIV/AIDS control

Economic and Financial Aspects of the Global Health Partnerships 52
DFID Health Resource Centre
Table 7: Overview of TB Spending
Global Expenditures on Malaria On the basis of analysing DAC data, Attaram reports that “the total amount of international aid dedicated to malaria control, from the 23 richest donor countries plus the World Bank, remains in the range of $100 million annually – a figure that is virtually unchanged since the start of RBM. This lack of progress toward increasing funding very seriously threatens RBM and demands that WHO regularly audit and report on malaria control funding, with the certainty that RBM will fail to meet its deadline of 2010 if this is not done”. To the extent that GFATM is committed to disbursing some $350m for malaria per annum (current commitment overall of around $1.8bn) this will result in additional funding for malaria even if there is some (or even total) displacement of existing flows provided, of course, that these funds are actually disbursed. IHSD is just in the process of completing a survey of international funding for TB and malaria control on behalf of the Stop TB Partnership and Roll Back Malaria which should shed further light on the subject. Results are expected in November 2004. National Health Accounts Exercises: Country Spending Data on current health spending at the country level is weak and highly aggregated. Although national health accounts exercises are becoming more widespread, they do not generally provide data on expenditure by programme. There are certain cases where this has been done e.g. HIV/AIDS accounts in Rwanda, reproductive health

Economic and Financial Aspects of the Global Health Partnerships 53
DFID Health Resource Centre
accounts in Rajasthan. Thought is also being given to piloting malaria accounts by RBM. In practice, such exercises have not been well integrated into overall health accounts. If the donor community is serious about tracking flows for the major communicable diseases, major investments will be required in support of NHA which go beyond the current methodologies agreed in international fora. Whilst donor support is important, most funding for HIV/AIDS control comes from Government or from out of pocket spending by individuals. The Rwanda HIV NHA found that around 93% of spending on HIV was out of pocket spending. The focus on donor support is also becoming more unreliable as some countries such as Uganda move rapidly toward budget rather than project support. The ultimate solution to tracking expenditures for health should be down to comprehensive coverage of national health accounts. In Rwanda, the first NHA HIV/AIDS sub analysis in 1998 showed that only 10 percent of all health expenditures in the country went toward prevention and treatment of the disease. Moreover, while donors financed more than half the health sector, only 1 percent of their funds went toward HIV/AIDS services and programs. Households were the primary financiers of HIV/AIDS services, providing 93.5 percent of total HIV/AIDS funding; donors provided 6 percent while the government contributed less than 1 percent. Revelation of the financial burden on households and the paucity of donor funds led the donor community to increase its contribution to the fight against HIV/AIDS in Rwanda by tripling its assistance from $0.5 million in 1998 to $1.5 million in 2000. Additionally, NHA enabled the Ministry of Health to design and implement policy interventions targeted at improving the financing of prevention activities and increasing access to basic health care services for people living with HIV/AIDS. Are the GHPs distortionary and have they provided additional funding? The presumption is that the GHPs have delivered additional funding. For GFATM, it is a requirement with the guidelines requiring that any proposal “demonstrate that Global Fund financing will be additional to existing efforts to combat HIV/AIDS, tuberculosis, and malaria, rather than replacing them”. This requirement, if fulfilled, is by definition distortionary. This is true even if the funding is used to cover the financing gaps under existing plans. Where countries have defined essential service packages (such as Uganda, Tanzania, Malawi and Zambia) available funding currently falls well short in many areas not just those covered by the GHPs. The true test of whether global flows are distortionary would be to ask “if the funds were available to the Ministry of Finance (or Ministry of Health), would they be spent on the activities set out in the GFATM proposal”. Though it will never be possible to answer that question, reality suggests that the answer will invariably be no. As such the more relevant question is “is the inevitable distortionary effect of the GHPs on funding a good or a bad thing?” In terms of additionality, DAC data suggests that support for infectious disease control and particularly STD control increased before the establishment of GFATM (though it did coincide with rapid increased in spending on GPEI from 1996 and may also reflect better reporting). Most of this seems to be down to the fact that the share of donor assistance for the health and population sector going to STD control and infectious diseases began to increase sharply from the mid 1990s. In short, the increase appears to predate the establishment of the key financing GHPs and thus suggests that there has certainly been additional spending in these areas over the last decade, even if it not yet possible to say if the GHPs have displaced some, all or none of the existing spending.

Economic and Financial Aspects of the Global Health Partnerships 54
DFID Health Resource Centre
HIV/AIDS commitments from bilateral donors doubled from some $692m in 2000 to $964m in 2001 and $1,253bn in 2002 suggesting that GFATM support has been additional at least during this period or at least that it has not been associated with a decline in spending from other sources. For malaria, GFATM will be the main financier and funding will still increase even if other donors immediately stopped funding malaria as proposed commitments under GFATM exceed past spending on malaria. GFATM proposals to date imply commitments of the order of $350m per annum on malaria control with a further $13m per annum on integrated activities – though this would decline if disbursement is slow and funding is not continued after year 2. Nonetheless GFATM still appears to significantly increase funding for malaria activities. There are concerns in some countries that GFATM funding is displacing other donor spending e.g. Ghana reducing their support for malaria in view of proposed GFATM funding. The situation for TB is similar, with GFATM as a dominant financier. Grants account for around 10% of overall spending and GFATM accounts for two thirds of this. This picture is skewed by the fact that many of the high burden countries are relatively wealthy and fund all TB costs domestically (South Africa, Brazil, Thailand) whilst a number of countries finance more than 90% of costs domestically (India, China, Indonesia, Vietnam, Philippines, Russia and Vietnam). An outstanding funding gap of some $80m was reported for 2003, of which around $49m was accounted for by the 22 TB High Burden Countries. Bhutan, China, Latvia and Mozambique all reported financing gaps exceeding $5m. At the same time it is also worth pointing out that donor support for other interventions essential for improving health have declined. Average commitments for water and sanitation declined from an average of $3.48bn over the period 1996-8 to $3.10bn in 1999-2001. The US and UK bucked this trend but Japan and Germany (the two biggest bilateral donors in the sector) significantly reduced their support. As such, the question may not be whether the GHPs are being financed at the expense of investment in the health sector – rather that they are being financed at the expense of other essential health interventions. Either way, the implications are the same – that the overall impact on health outcomes may be negated. Given the heavy reliance on domestic funding for communicable disease control, additionality is if anything more likely to be undermined by Government action rather than that of donors. However, with the partial exception of TB, the amounts that countries spend by programme is largely unknown. This is largely inevitable – in practice such figures are unknowable to any degree of precision where programmes are integrated. (Vertical programmes at least have the advantage of greater clarity on costs). Expenditure reviews – including programme specific expenditure reviews such as that on HIV/AIDS in Tanzania - and more detailed health accounts exercises incorporating programme wise analysis would cast greater light on this but also come at a high cost in terms of funding and use of scarce capacity. Additionality in the longer term?
The fact that the GHPs were established and became operational so quickly is likely to have increased the element of additionality in the short term as GHP programmes were simply added to existing strategic plans or programmes of work and added to existing Government expenditure plans. The real question will be whether donors withdraw their assistance from areas currently covered by the GHPs (and whether Government can fill these gaps) or whether Governments amend their own spending

Economic and Financial Aspects of the Global Health Partnerships 55
DFID Health Resource Centre
plans to reflect likely inputs from the GHPs which, once they have developed a track record, should deliver more predictable amounts of funding. Bearing this in mind it may be worthwhile to revisit this issue in two or three years time.
Have the GHPs developed additional funding sources?
Most GHPs have been heavily reliant on a small number of funding sources. In many cases this has been traditional donor sources. With the exception of the foundations, especially Gates16, the GHPs do not seem to have brought significant additional financial resources to the table. Private financial contributions have been very modest. GFATM has secured only modest cash contributions from the private sector (Winterthur, Eni, Statoil and the Gates Foundation) and is committed to increasing this. The Fund is also investigating innovative approaches to securing additional contributions from companies and individuals. The Board is also considering options for accessing in kind contributions given that the recent private sector study estimated that “between 15 and 30 percent of funds awarded in Round 2 could be substituted with in-kind contributions” though this would require the use of a third party to manage the support on GFATM’s behalf (notably the Global Drug Facility under the Stop TB Partnership and the AIDS Drug and Diagnostic Facility currently being developed by WHO). However, support has been provided in other ways. Other types of support include pro bono technical advice. This would ideally be quantified and included in financial statements (Stop TB provides a possible model for this). Equally, there are in country contributions, for example workplace treatment and preventions services developed by the private sector Most funds continue to be provided by the traditional donors. 97.3% of pledges for GFATM are from donor countries (chart 37) although for GAVI, the Gates Foundation has played a key role. Chart 37
GFATM Pledges by Type of Donor and Time Period
200
400
600
800
1,000
1,200
1,400
1,600
1,800
2001-2 2003 2004 2005 2006 2007 2008 To Be
Confirmed
$m
Individuals and Events
Corporations
Foundations and Non Profits
Donor Countries
In other cases new players such as the foundations provide significant funding for seed money (e.g. Gates for GAVI, MSF for DNDi and Until There’s a Cure for IAVI) and more traditional donors provide more significant support later. Thus, rather than
16
The Bill and Melinda Gates Foundation has an endowment of some $27bn and has made grants of some $7.2bn
since its inception16
. The Foundation made grants of $576m and $507m for global health in 2003 and 2002 – just under half of total grants. Major grants include The Vaccine Fund ($750 million) and International AIDS Vaccine Initiative ($126.5 million). Though relatively small in terms of overall aid flows, the GF has invested strategically in a number of areas.

Economic and Financial Aspects of the Global Health Partnerships 56
DFID Health Resource Centre
donor funding leveraging new sources of funding, it can be argued that the opposite is taking place. OECD estimates suggest that foundations contribute of the order of $3bn per annum for development activities. Most of this comes from US Foundations and relatively little goes to sub Saharan Africa. Of the $2.5bn provided by US Foundations in 2000, it is estimated that just under $950m or 38.5% was for health care, with almost a third going to reproductive health care. Implications for Sustainability and Aid Dependency? The flip side of the additional donor financing is increasing aid dependency. Given the amounts of development assistance involved, aid dependency could increase significantly in many countries. Sustainability concerns are compounded as the World Bank and USAID have also been significantly increasing their support for HIV/AIDS through the MAP and PEPFAR initiatives. Under PEPFAR, the US plan to provide $15bn over 5 years ($10bn of this is new money of which $1bn is expected to go to the GFATM and $9bn to be disbursed bilaterally). It aims to “treat… at least two million HIV-infected persons with anti-retroviral therapy, preventing seven million new infections, and providing care and support for 10 million persons infected with or affected by HIV, including orphans and vulnerable children in 15 focus countries17. Under the Multi-Country HIV/AIDS Program (MAP) for Africa, the World Bank is assisting countries in scaling up national HIV/AIDS efforts thorough the provision of IDA resources “as well as leveraging co-financing on a country-by-country basis through the International Partnership Against AIDS in Africa (IPAA)”. As of July 2004, 28 African countries and three regional programs have received US$1,088.2 million within the MAP approach and MAP projects are being prepared in another ten countries and for regional programmes. Both provide significant additional resources concentrated in a relatively small number of countries. Under PEPFAR, the US plans to provide an additional $2.85 per capita per year to the 15 target countries (or $78.5 per person infected with HIV/AIDS). This exceeds current Government spending in Ethiopia and is more than 50% of existing public health spending in Tanzania, Nigeria, Mozambique, Zambia and Kenya 18. Resources under MAP are smaller but are also significant averaging $0.61 per head of population (over $3 per head in Eritrea and Gambia) and $21.5 per person infected with HIV/AIDS19. It represents an additonal 80% over total Government expenditures on health in Burundi and between 30 and 50% extra in Gambia, Eritrea, Democratic Republic of Congo and Niger.
17 Botswana, Cote d'Ivoire, Ethiopia, Guyana, Haiti, Kenya, Mozambique, Namibia, Nigeria, Rwanda, South Africa,
Tanzania, Uganda, Vietnam, and Zambia.
18 Indicative only – assumes all funds are allocated to countries according to the number of HIV-infected. Actual
figures will depend on how funds are actually allocated. A high proportion of funds is currently going to US base organisations to run programmes. 19
An underestimate as it excludes number of HIV infected in Sierra Leone and Guinea Bissau and also ignores inputs from regional MAP programmes.
Economic and Financial Aspects of the Global Health Partnerships 57
DFID Health Resource Centre
Possible inputs from the Global Fund, GAVI and GPEI and PPFAR and MAP alone could double overall health spending (which is already highly dependant on aid) in 10 countries (8 of which are DFID PSA countries). They could quadruple funding in Ethiopia as well as increasing it by a half in a further 25 countries (5 of which are DFID PSA countries). Perhaps not surprisingly, the impact on South Africa, India and Vietnam is small. This does raise the question of
• sustainability - once the initial funding from these initiatives is exhausted will they be continued?
• aid allocation – is the rapid shift towards development assistance for health warranted in the light of other priorities if these initiatives are funded from existing programmes?
• macroeconomic impact – the impact of the additional aid flows on macroeconomic variables.
It is inconceivable that the most aid dependent countries will be able to assume much more than a minor share of the recurrent financing burden incurred by the GHPs even in the medium term. This means that support for the GHPs will need to be extended and/or bilateral or other forms of support will be required to cover the funding gaps if the benefits achieved through the GHPs are to be sustained. The issue is acknowledged by GAVI with the Board accepting the following definition of financial sustainability in June 2001: "Although self-sufficiency is the ultimate goal, in the nearer term sustainable financing is the ability of a country to mobilize and efficiently use domestic and supplementary external resources on a reliable basis to achieve current and future target levels of immunization performance in terms of access, utilization, quality, safety and equity". The development of Financial Sustainability Plans is an important step forward in helping to identify the future financial implications. However, whilst a positive step it could also be argued that sustainability should have been considered before funding decisions were made. The issue has not been considered explicitly by GFATM, which is likely to have much larger recurrent implications. However, it has refined its eligibility criteria replacing the previous criteria of “co-financing” and “moving over time to an increasing reliance on domestic resources” with a single criterion termed “counterpart financing.” which incorporates funding from all sources. In the light of this the implications of not sustaining GHP activities need to be considered. In the case of some activities (e.g. ART, treatment of bednets) it will affect existing beneficiaries and reduce the cost effectiveness of the interventions supported. In the case of others (e.g. immunisation) it will not affect those who have already benefited from GHPs but will reduce the number of potential future beneficiaries. The Need for a Global Perspective
One of the key problems is that sustainability, perhaps quite understandably, tends to be viewed only from the perspective of the individual GHPs. For example, meeting the increased recurrent costs associated with GAVI may require only minor shifts in the allocation of resources to the health or within the health but the implications can be quite considerable when all GFATM is also considered, This is best analysed when looking at the implications in a range of countries – Kenya with poor domestic revenue prospects and large GHP commitments, Cambodia with relatively good expenditure prospects and modest GHP commitments and Ghana which falls somewhere in between (see schematic below).

Economic and Financial Aspects of the Global Health Partnerships 58
DFID Health Resource Centre
Key Factors Affecting Sustainability Kenya Cambodia Ghana
Size of GAVI Financing Gap large small modest Prospects for Domestic Expenditure on Health poor good modest Degree of Competition from Other Sources (GFATM)
very high modest modest
Implications for Affordability Increasing Problems of Affordability Source: IHSD, 2003
Table 8 shows projections on how much Government funding for immunisation would have to rise both in dollar terms and as a share of domestic spending on health to cover the financing gap, depending on whether the gap is funded by Government, donors or a combination of the two. Table 8: Annual Budget Required for Immunisation under Different Scenarios for Covering the Financing Gap
Method of Covering Financing Gap
Amount (Share) of Domestic Funding to Immunisation 2001 ($m)/(%)
Amount (Share) of Domestic Financing to Immunisation to Cover Financing Gap Average 2003/6
Amount (Share) of Domestic Financing to Immunisation to Cover Financing Gap Average 2007/2009
100% Government funded $7.7m (6.9%) $17.8m (15.7%) $43.1 (31.9%) 50% donor/50% Government
$7.7m (6.9%)
$15.0m (13.3%) $29.2m (21.6%) Kenya
100% Donor Funded
$7.7m (6.9%)
$12.2m (10.9%) $15.4m (11.4%)
100% Government funded $3.7m (4.5%) $15.1m (10.0%) Ghana 50% donor/50%
Government N/a $2.7m (3.3%) $7.6m (5.0%
Kenya Ghana Cambodia
Financing Gap can be filled by
anticipated growth in public expenditure
without any need for reallocation of
resources
Financing Gap can be filled with realistic
reallocation of existing resources
as set out in PRSP/MTEF etc
Financing Gap can only be achieved
with significant reallocation of
resources
Financing Gap unlikely to be
covered

Economic and Financial Aspects of the Global Health Partnerships 59
DFID Health Resource Centre
100% Donor Funded
$1.7m (2.1%) - (0.0%)
100% Government funded $1.2m (3.4%) $4.9m (8.5%) $6.6m (9.2%) 50% donor/50% Government
$1.2m (3.4%)
$2.5m (4.3%)
$3.3m (4.6%)
Cambodia
100% Donor Funded
$1.2m (3.4%)
$0.1m (0.2%) $0.03m (0.1%)
Notes: Base case scenarios are used; other scenarios are considered in the background paper. Kenya case relates to scenario A, which plans for 90% coverage. Ghana - figures relate to 2002-2006 and 2007-2011
In Kenya, it was estimated that the share of health spending going to immunisation will have to almost double over the next 5 years even if the financing gap estimated in the Financial Sustainability Plan (FSP) is fully funded by donors – at the same time it will be faced with finding more than $40m per annum to sustain GFATM funded activities. Another key dimension to this is that the additional recurrent implications are unlikely to hit countries in a gradual manner but may be concentrated in the period 2008 to 2010. It also raises the question as to whether DFID’s role might be a) to continue to support expansion of global funds after the first wave of commitments has been completed or b) revert to providing support at the country level to enable existing gains to be consolidated. Another effect of the financing model adopted by some of the GHPs is that, over time, the pattern of health spending is dictated by the direction of the GHPs rather than the priorities of Governments. As the GHPs develop and establish new programmes, countries are expected to take over the running costs. However, having achieved that, the model suggests that the GHPs will then move on to the establishment of new programmes e.g. introduction of new vaccines expansion, from 3 by 5 to 5 by 7 etc. as illustrated in the schematic below (chart 38) DFID will need to consider whether, and at what point, it should be looking to shift resources into consolidating existing programmes rather than promoting further increases in coverage by the GHPs. Considerations will include:
• the overall performance of the GHP in question, • the specific direction its proposed expansion takes, • the minimum contribution DFID can realistically make, • the overall financing situation and sustainability challenges faced in recipient
countries and the viability of alternative financing instruments

Economic and Financial Aspects of the Global Health Partnerships 60
DFID Health Resource Centre
Chart 38
GHPs - Dictating How Additional Funds are Allocated
-
500
1,000
1,500
2,000
2,500
1 2 3 4 5 6 7 8 9 10 11 12 13 14 15 16 17 18 19 20 21 22 23 24 25 26 27 28 29 30
year
$m
Donors
Government
Programme Expansion
Self Sufficiency
Clearly there are also other dimensions to the sustainability debate which relate to issues beyond financing (box 6) but these are not dealt with here.
Box 6: APOC Evaluation “A large amount of energy and initiative has been unleashed by the joint action of CSA, APOC Headquarters staff, the NGDO Co-ordination Group, JAF and TCC, and the cascade of nationals who have in turn been empowered and enthused by them. This activity has been made possible by the availability large sums of donor money. The evaluation team is deeply concerned about the sustainability of this activity and enthusiasm, once APOC funding comes to an end. There appears in many instances to be a lack of understanding that CDTI may have to continue to 2020 and beyond, with little definitive planning to mobilise the resources and set in place the routines which will ensure the continuation of the programme”.
Funding Requirements - What Is Required?
Global Estimates
Estimating what is required to achieve the MDGs is fraught with difficulty. One approach is to estimate how much support is needed to generate the levels of economic growth required to achieve the poverty target. However, the evidence shows that income growth and other complementary investments play a far more important role in improving health outcomes than investment in health itself (Filmer and Pritchett). Income growth would not only improve health outcomes, it would also strengthen Government finances and their ability to fund health programmes. An alternative way is to estimate the direct cost of achieving the individual MDGs. The cost of achieving the health MDGs has been estimated by the World Bank at $20-25bn per annum as part of the US$35-76 billion20 required to achieve all of the non income MDGs. The CMH puts the figure rather higher (table 9). Investments in education (the additional costs of achieving universal primary education are estimated to be $9-$15bn) and water and sanitation ($5-21bn p.a) will also contribute to improved health outcomes.
20
Devarajan, Miller and Swanson, 2002.

Economic and Financial Aspects of the Global Health Partnerships 61
DFID Health Resource Centre
Table 9: Expenditure Required to Achieve the MDGs: Commission for Macroeconomics and Health Incremental Costs
2007 ($bn 2002)
Incremental Costs 2015 ($bn 2002)
TB Treatment 0.08 0.44 Malaria Prevention 1.03 2.33 Treatment 0.85 1.95 HIV/AIDS Prevention 4.25 8.7 Care 9.45 26.45 HAART 3.95 5.7 Total 19.3 45.8 Source: CMH; midpoint of ranges taken
However, little progress has been made over the last decade in increasing health expenditure. In addition, there is little evidence that health spending is related at all to health outcomes. This raises the issue of whether it is additional resources or the better use of existing resources which is more important, and furthermore whether access to finance is the binding constraint or whether implementation capacity is more important. What is clear is that additional spending on health can only be justified if it is more effective than has been the case in the past. It is also clear is that existing spending is well below that required to make sustained progress towards the MDGs. To bring public spending on health in all DFID priority countries in Africa up to at least $12 per head would cost an additonal $17bn per annum (more than half of which would be for India alone) – four to five times the proposed annual commitments of the financing GHPs. In short, at the current levels, the GHPs do relatively little to close the overall financing gaps.
What Do the Individual GHPs Require?
In some cases, the GHPs estimate a country wise breakdown of the costs of achieving global objectives (GPEI). In others (GFATM), funding is essentially supply led. Although revenue mobilisation targets are still based on global needs, in practice allocations are determined by available funds and the partnership’s rules in relation to financial prudence (GAVI, GDF/Stop TB). Whilst GFATM has quite strict rules about the level of commitments it can enter into, GDF financial management has been more relaxed, adopting a more high risk strategy based on building up commitments rapidly without necessarily having officially pledged funding. Although greater emphasis on Product Development PPPs may be warranted given the long lead times, it seems relatively unlikely that they will make a major contribution to the MDGs. Without wanting to downplay the importance of achieving the 2015 targets, it probably makes sense for DFID to consider the longer term view and focus on longer term/high impact interventions than short term/low impact ones. Requirements of the key financing GHPs:
• GFATM: The Fund acknowledges that its size is the outcome of a subtle interplay
between demand, availability of finance, and its role in the broader development finance landscape. Based on its current funding policies, it estimates that it needs $1.3bn to fund renewals and a further $2bn for new proposals during 2005 (and

Economic and Financial Aspects of the Global Health Partnerships 62
DFID Health Resource Centre
possibly up to $700m more when appeals are considered). Current pledges for 2005 amount to some $886m. Board members have been circulated projections outlining how the Fund might reach a steady state of $3bn per annum per annum by 2008. This is double current levels but half of what is considered to be an ideal amount and much less than the $8bn referred to in the CMH report and the $10bn per annum figure highlighted by the UN Secretary General. The Fund estimate that “the demand for international development finance in HIV/AIDS will continue to rise steadily for at least a decade and probably much longer”, implying that significant additional resources will be needed for anti retroviral therapy. Needs for TB are expected to increase along similar lines, whilst for malaria the situation is less clear. GFATM is already the major global funder of malaria and needs for external assistance may decline after 2010.
• Stop TB: The Stop TB Partnership estimate that $950m is required in 2004 and
$1.1bn in 2005 to allow targets to be met in 21 of the 22 High Burden Countries. Given current estimated expenditure, the shortfall is some $300m for both 2004 and 2005. In addition, the Russian Federation’s 5-year plan (2003–7) indicates resource requirements of more than US$ 400 million per year, with a funding gap of around US$ 200 million in each year. Around 70% of the total resources requirements are typically met by governments, with 10% from grants, of which GFATM accounts for two-thirds. The funding gap is around 20% of total requirements in 2004 and 2005 and is greatest in countries with relatively poor case detection. GFATM funding has reduced, but not eliminated, the gaps in Nigeria, Pakistan, Ethiopia, and China, whilst some countries such as Afghanistan, Kenya, Tanzania and Cambodia have funding gaps which although small in absolute terms are large in relation to their total resource requirements. The Stop TB Partnership plan to prepare a second global plan covering the period 2006 to 2015 to be inaugurated in September 2005. One of the aims of this will be to identify resource needs and gaps and present the latest evidence on cost effectiveness.
• Polio: For 2004–2005, funds are required primarily to interrupt polio transmission
globally. The currently estimated funding gap of $ 130 million is some 17% of projected costs of $765 m. For 2006–2008, funding is required to achieve global certification, develop products for the cessation of Oral Polio Vaccine use and mainstream the polio eradication infrastructure. It is estimated that $380m will be required during this period – around $200m in 2006, falling to below $100m in 2007 and 2008.
• GAVI: Plans to develop a long term strategic plan to (2015) by the end of
December 2004 and a work plan for 2006-7 by December 2005. It has already taken steps to integrate its plans into country processes. Financial sustainability plans (which have been carried out in 30 countries by 2004) are signed by finance ministers, and the Financing Task Force is investigating further measures to integrate FSPs into national planning and budgeting processes (including PRSPs and MTEFs). The Vaccine Fund plans a resource mobilisation consistent with the strategic plan objective which are yet to be defined but milestones for 2005 and 2006 and $325 and $400m respectively. GAVI is also planning to pilot innovative financing mechanisms such as advance purchase contracts. Initial expectations have not been met – additional financing for immunisation has not been forthcoming and prices of vaccines have not dropped as expected. Countries have therefore not been able to extend coverage as expected and are considering dropping expensive vaccines such as Hib. GAVI is considering

Economic and Financial Aspects of the Global Health Partnerships 63
DFID Health Resource Centre
options for bridge financing and possibilities of providing initial subsidies to support the introduction of new vaccines until such time as prices drop.
Table 10: GAVI Estimated Requirements
(in millions of dollars) 2006-2010
2011-2015 2006-2015
Strengthen immunization systems to reach higher levels of coverage
$2,205 M $2,210 M $4,415 M
Procure and introduce new and underused vaccines into national immunization programmes
$221 $2,017 $2,238
Launch supplemental immunization activities to reduce mortality due to measles and maternal and neonatal tetanus.
$715 $458 $1,173
Create the polio vaccine stockpile $235 $235 Immunization IFF funds needed $3,376 $4,685 $8,061
Product Development: Recent work by Towse suggests that there is at least a $2 billion funding gap and there are concerns that the activities of many PPPs are being distorted (e.g. undertaking relatively cheaper research) and that such suboptimal approaches may not lead to the ideal results. The need for multiyear commitments is also stressed. Table 11: Estimated Costs of Selected Public Private Partnerships
Objective Current
Commitments to 2007
Required Funding to 2007
Shortfall
IAVI 8 to 12 novel vaccine candidates into clinical trials and advance the best 2 or 3 to final stage testing phase III by 2007
174 1036 862
IPM To accelerate the discovery, development and accessibility of safe and effective microbicides
94.5 775 680
TB Alliance
1 new drug for registration by 2010
35.75 249 213
DNDi 6-7 new registered drugs by 2015
0 255 255
MMV 1 new drug every 5 years starting in 2010
97 152 83
Total 401 2467 2066
Source: Towse (2004) Costs depend on the nature of the output, failure/attrition rates and estimated costs at different stages of development minus any in kind support from industry at below market cost. There is great uncertainty with estimated costs ranging from $400m to $4bn.

Economic and Financial Aspects of the Global Health Partnerships 64
DFID Health Resource Centre
Box 7: Estimated Requirements for PPPs: Commission for Macroeconomics and Health To help channel the increased R&D outlays, we endorse the establishment of a new Global Health Research Fund (GHRF), with disbursements of around $1.5 billion per year. This fund would support basic and applied biomedical and health sciences research on the health problems affecting the world’s poor and on the health systems and policies needed to address them. Another $1.5 billion per year of R&D support should be funded through existing channels. These include the Special Programme for Research and Training in Tropical Diseases (TDR), the Initiative for Vaccine Research (IVR), the Special Programme of Research, Development and Research Training in Human Reproduction (HRP) (all housed at WHO) and the public-private partnerships for AIDS, TB, malaria, and other disease control programs that have recently been established.
Estimates are often based on well meaning, but very flimsy, premises21. It therefore makes relatively little sense to aggregate requirements. What would be useful would be an exercise to estimate requirements through independent means in a consistent manner.
There is a case for developing a number of resource scenarios bringing together the needs of all the GHPs – a sort of global MTEF. Though, individual GHPs have attempted this overall needs remain unclear. Such planning would also usefully be linked with ongoing discussion about the International Financing Facility to ensure that funds are available when needed. To this extent the IFF may prove to be a useful insurance mechanism as well as financing specific interventions.
A more detailed breakdown of funding needs by GHP is an annex 3.
When is Funding Needed?
There is a distinction between how much is needed on the ground, and when and how much the partnerships need and when. Concerns have been expressed that some partnerships may be seen as overcapitalised and sitting on money or run the risk of being seen that way – either due to their prudent financial guidelines (GFATM) or failure to develop a vaccine (IAVI).
Funding Policies GFATM: As at end May 2004, contributions received amounted to some $2.32bn against disbursements of just $347m., $1.36bn committed and $74.5m operating expenses (income on investment more than 10% of total disbursements). Overall, $1.07bn was available for commitment; with $796m waiting signed grant agreement, $211m was available for new commitments. GFATM can only make commitments up to the cumulative uncommitted amount pledged through the calendar year of the
21
"The annual direct economic cost of malaria across Africa... will exceed $3.5bn (in 2000), twice what it was in 1995". A possible benchmark might be to consider what should be spent on malaria research in Africa is the ratio of resources that the pharmaceutical industry allocates for its R&D. In the drug industry, research ranges from 8-18% of the total budget. Setting a conservative goal of investing 10% of the cost of African malaria in research suggests that at least $350 million should be funding work to understand malaria and its control. Ideally, at least 10% of this $350 million, $35 million, should be directed through MIM to support activities in research capacity building. The Panel recognizes that such a dramatic increase in funding is not realistic. For the time being, however, a more realistic goal would be to double the current total funds spent on MIM, from approximately $8million to $16 million. Every effort should be made to achieve, at the very least, this level of growth”. MIM evaluation

Economic and Financial Aspects of the Global Health Partnerships 65
DFID Health Resource Centre
Board decision. Assets to meet the full cost of approved grants must be deposited with Trustee or readily available. The Global Drugs Facility has taken a higher risk approach to managing its finances – making commitments well in excess of proven commitments. In practice this has been effective as a key donor – CIDA – has been willing to fund the gap. Which is best? Strategically GHPs should manage a financial portfolio prudently. However, donors do not always respond to this. Tactically, it is often a more effective approach to spend money hand over fist, create periodic crises and hope donors will bail you out. Although more high risk, this is often more effective. In practice there has been some degree of convergence. The Fund is currently considering whether these funding principles can be amended (relaxed) in view of experience to date. At the same time, the GDF has been developing a resource based as well as a needs based budget.
Overall, the different practices related to fund management make it very difficult for donors and other key stakeholders to make informed decisions about the magnitude and timing of future resource needs. In principle, DFID should seek to ensure greater transparency and consistency in approaches to financial planning.
Is Financing the Main Constraint?
An extremely important constraint facing programme expansion is a lack of human resources. Zambia is an extreme example. Estimates show that providing HAART to everyone who is clinically eligible would, after five years, require twice the number of laboratory technicians and half the doctors currently available in the public health system. Even at more modest levels of population coverage, the human resource constraint may be more binding on HAART expansion than the financial constraint. Thus, the success of Zambia’s HAART programme over the medium term could depend more on its human resource capacity than on its budget capacity. Applying similar staffing levels across Africa shows that the additional requirement for physicians is up to 50% of the existing stock (chart 39). The situation in Tanzania, where the human resource stock has been declining is particularly pressing (table 12).

Economic and Financial Aspects of the Global Health Partnerships 66
DFID Health Resource Centre
Chart 39
Additional Physicians and Required to Achieve CMH Targets as % o f latest stock
0
10
20
30
40
50
60
%2007
2015
Table 12: Human Resource Implications of HAART in Tanzania
Additional Staffing Requirements according to target Coverage of PLWA end 2005
Current Stock
65,000 260000 Strict* Loose**
Annual Output** *
Requirement as % of current stock****
Annual Production as % of Additional Requirement****
Doctors 81.9 335.4 510 1571 105 21.3 31.3 Nurses 81.9 335.4 3290 10729 553 3.1 164.9 Lab Technicians 199.08 815.28 458 1327 101 61.4 12.4 Pharmacists 94.5 387 111 365 66 106.0 17.1 1.13.1.1 Notes
* medical officers, nursing officers, lab technicians, pharmacists ** also includes medical specialists, assistance medical officers, nurse , nurse/midwives, pharmaceutical technicians and assistants and laboratory assistants
*** loose definition
**** high target, loose definition
Selected Country Experiences Key findings from discussions with DFID advisers and review of key documents suggest:
• that GHPs have generally not been well coordinated either with Government planning processes or between themselves. GHPs resulted in destabilisation of SWAp approaches and raise concerns about impact on macroeconomic stability. There are some promising moves e.g. GFATM is willing to channel resources through the common fund in Mozambique and monitor performance against outputs not inputs. Some countries have adapted their approaches e.g. Ghana. has developed needs based budgets as well as resource based budgets – though this has had capacity implications
Economic and Financial Aspects of the Global Health Partnerships 67
DFID Health Resource Centre
• limited evidence that donor and Government funding decisions have been influenced by GHP allocations
• some movement towards greater utilisation of local systems, if not completely integrating with SWAp processes.
• that chasing GHPs funding has diverted the attention of staff away from ongoing country level processes.
• concerns that transactions costs are increased by new reporting requirements, and that CCMs add little in situations where participatory arrangements are already fairly well developed. Despite claims that GFATM is radically policy free, in some settings there is a feeling that it is becoming an agency in itself with its own rules and procedures. On the other hand, there is too little guidance in other areas e.g. on how many countries should be bidding for.
• money is welcome but has undermined existing budgeting and planning processes especially any MTEF processes. Lack of transparency has made budgeting harder – where Governments have tried to plan for GFATM inputs, they have been left in trouble when no award has been made.
• concerns that the approaches perpetuate vertical programmes and that opportunities to strengthen systems which whilst to some extent available are not utilised
• concerns about longer term sustainability and balance between interventions The extent to which GHP funding has been incorporated into overall planning and budgeting processes has depended very much on the stage of the budget cycle. In many ways GFATM has been a victim of its own success – it was established so quickly that it was not possible to consider it as part of ongoing processes. However, lack of clarity on likely resource flows has also hampered the integration process. The real question is whether GHPs are being integrated into currently ongoing processes. Of the recent case studies, Uganda seems the only case in which spending may be at the expense of existing public programmes though the outcome is still unclear. The GFATM has, for perfectly valid reasons, decided to adopt a demand based approach. This has posed countries a dilemma – should they put forward a reasonable proposal with some expectation of success or an ambitious one with more limited chances of success. There is evidence that donors have been active in encouraging Governments to inflate their proposals. There have been complaints about a lack of transparency in the application process. There have been particular problems where countries have assumed the GFATM will cover certain gaps and have struggled when support has not been forthcoming. It is understood that GFATM is considering a shift towards a line of credit type approach rather than closed applications – going to the Board in November Country Experiences22
Southern Africa GFATM funding in South Africa is additional and is provided in parallel to Government systems mainly to 2 large NGOs (even though there are procedures at district, provincial and central levels for providing such support and a well developed MTEF). RSA has made a number of applications but has a poor record. The CCM approach is to package the proposals it receives rather uncritically and forward them
22
utilises examples from a SWAp Mapping Study carried out by IHSD in 2003

Economic and Financial Aspects of the Global Health Partnerships 68
DFID Health Resource Centre
to the Fund resulting in proposals which are somewhat of a hotchpotch. The jury is out on the proposals themselves. There are some questions as to whether one, Love Life, focusing on a social marketing approach to changing lifestyles, is working though another providing more traditional support for youth centres and youth groups seems to be sound. There is some concern about the effects of the GHPs in middle income countries such as Swaziland and Namibia. GFATM is intentionally “light touch” but is also the dominant and often the only donor in such countries such as Swaziland. Yet such Governments are in great need of support (technical assistance rather than financial support) to strengthen their health systems and put the GFATM money to good use. Though GFATM has not actually displaced existing donors others are standing back and no donor is willing to lead. This might suggest additionality needs to be considered in a rather different way in terms of additional support to make sure the GHPs work effectively. Should some DFID support for the GHPs be top sliced to provide direct support to countries or should the GHPs be encouraged to provide a more operational role? Mozambique There were initial concerns that possible access to GFATM funding was undermining the nascent SWAp process. However, the situation now seems rather more positive. The MoH has completed a TA-assisted study for rolling out ART and this has resulted in a single plan with all funds to be channelled through the Common Fund. Although GFATM still has “some hoops to jump through”, in principle they are happy to channel their resources through the Common Fund though they will require evidence of progress against targets. Some of the other initiatives have created more problems – PEPFAR in particular is off budget and it is providing extremely difficult for donors to find out what is going on. Ethiopia There are a large number of global initiatives active in the health sector. The resources implied vastly exceed those available through Government. Though necessary and very welcome they place huge burden on implementation and absorptive capacity. There are concerns that vertical tendencies are reinforced and that there is little attention to system strengthening. Only GFATM is seen as providing the option to strengthen systems (and this option was not taken up). The GHPs are seen as undermining the emerging SWAp and creating an additional burden on Government. All planning has been done at federal level and the Woredas, who will be responsible for implementation, have little ownership. There is a major confusion about reporting formats. The centre has no powers to ensure lower levels comply. Human resources are a major constraint significantly enhanced planning skills, significantly increased numbers of qualified health personnel to implement the programmes, and much better partnership with NGOs to help achieve the targets. Within the federal Ministry of Health 24% of posts are vacant and there is no proactive recruitment to fill these posts. The global initiatives also encourage a parallel career path for promising recruits. There are significant shortcomings in financial management. Late releases of GFATM funds have delayed procurement and there are concerns about supply interruptions. Disbursement is slow and one region reported receiving less than $ 3,000, which may have cost more in administration costs than the value of the disbursement. Global initiatives are not harmonised either among themselves or with the Ethiopian planning, allocation and reporting cycles.

Economic and Financial Aspects of the Global Health Partnerships 69
DFID Health Resource Centre
Ghana Activities which were not envisaged in the SWAp were the new global initiatives such as GAVI and GFATM. These proposals have the potential to disrupt financial plans by distorting the resource envelope and MTEF framework, especially in terms of long term sustainability of funds for continuing activities. Earmarked project funds from some partners (USAID, JICA) are often still negotiated separately and, whilst attempts are made to integrate these into the strategic framework, it is very difficult to determine, project and plan for the funding levels. GFATM funding has been incorporated into current planning processes by asking programmes to develop both resource based and needs based budgets which adds to the burden especially at district level. This has diverted the attention of health staff but the funding is welcome as helping Ghana to where it should be financially. The process skewed priorities and has also led to uncertainty. A rejected proposal left a major funding gap for treatment. There is no real evidence of diversion though some suspect donors will make different decisions about malaria. Systems are fairly parallel – MoH is principal recipient and, though money is not pooled, it is channelled through existing systems. There are some questions about what value the CCM adds. given that there is already a relatively strong civil society voice. There are some concerns about mission creep – that the Fund is developing its own rules and procedures. For GAVI, support for systems strengthening has been extremely important and has been incorporated within existing sector plans and budgets. Expenditure has gone up from $3m to $14m, raising massive concerns about sustainability. This has been alleviated slightly to the extent that GAVI is allowing Ghana to spread its support over a longer period to ease the transition. Tanzania GFATM funding has been approved for HIV/AIDS ($5.4m for one year) and malaria ($19m over 3 years). The malaria funding is intended to cover one element of the National Malaria Medium Term Strategic Plan, and has been programmed into the Malaria Control Programme MTEF. Initial injections of funding can probably be absorbed, but the issue of longer term subsidy and the relative balance of funding between priority diseases remain of concern In terms of HIV/AIDS, all funds are outside the framework of the existing strategy, including large sums of money expected from the Clinton Foundation and Bush Initiative. These, along with the resubmitted TB/HIV GFATM proposal, and the longer term sustainability concerns arising from the GAVI funding for new vaccines, are compounding concerns around the financing of the sector programme. Indeed, concern was expressed by the MoF in December 2002 regarding the possible use of parallel systems by GFATM: "We are concerned that the mechanism of aid delivery proposed by the Global Fund against AIDS, Tuberculosis and Malaria, has the potential of undermining government accountability and negate all efforts made so far to improve development partnership and aid effectiveness." (MOH Dec 2002) Senegal Funding mechanisms such as GAVI and GFATM were not included in the PDIS (sector programme), and Senegal has already benefited from both (GAVI extension

Economic and Financial Aspects of the Global Health Partnerships 70
DFID Health Resource Centre
of EPI to include hepatitis B and GFATM money towards malaria, TB and AIDS treatment (ARVs)). These sums are large both in relation to previous funding for the activities and also in relation to donor contributions to the PDIS. They are already affecting the pattern of health financing, although the longer term impacts are yet to be seen. One example quoted is that of an NGO in Senegal that USAID has decided to stop funding but are now receiving more funding than they had previously due to the huge influx of funds from GFATM.

Econom
ic a
nd F
inancia
l A
spects
of th
e G
lobal H
ealth P
art
ners
hip
s
71
DF
ID H
ealth R
esourc
e C
entr
e
AN
NE
X 3
: K
EY
FU
ND
ING
SO
UR
CE
AN
D N
EE
DS
OF
TH
E M
AJO
R G
HP
S
S
pendin
g to d
ate
K
ey
funders
F
utu
re R
equirem
ents
G
FA
TM
C
om
mitm
ents
of
$8.0
5bn o
ver
5 y
ear
period
under
firs
t 4 r
ounds. $540m
spent to
date
K
ey
Donors
–
US
AID
, F
ran
ce,
EC
, G
erm
any,
It
aly
, U
K,
Neth
erlands, D
enm
ark
B
etw
een
2002 and 200
4,
ple
dges
tota
l U
S$ 3.1
bill
ion,
with an
additio
nal
US
$
1.9
bill
ion
ple
dged
for
2005
to
2008
or
for
an
unspecifi
ed p
eriod
Ideally
$7-8
bn r
ath
er
less t
han t
he $
10bn p
er
annum
requeste
d b
y K
ofi
Annan. $3bn p
er
annum
seen a
s r
ealis
tic c
ruis
ing a
ltitu
de
GP
EI
~ $
2.5
bn b
etw
een 1
988 a
nd 2
003
Key
donors
R
ota
ry
Inte
rnational,
US
(C
DC
),
World
Bank,
UK
, U
SA
ID, Japan
$765m
for
2004-5
(of
whic
h f
undin
g g
ap o
f $130m
) and $
380m
for
2006-
8.
OP
V a
nd N
ID/S
NID
s a
cco
unt
for
bulk
of
spendin
g –
exp
ecte
d t
o b
e
com
ple
te b
y end 2
006
GA
VI
Com
mitm
ents
of
$1.0
5bn
over
5
year
period.
Secre
tariat
bie
nnia
l budgets
~
$7.2
bn.
By
June 2
004 $
429m
dis
burs
ed (
of
whic
h
$282m
fo
r vaccin
es)
and
$341m
re
ceiv
ed in
countr
y
Gate
s, U
SA
ID,
Norw
ay,
Neth
erlands, U
K, M
erc
k (in k
ind)
Late
st
GA
VI
estim
ate
s suggest
$8.0
6bn
required
betw
een
2006
and
2015
DN
Di
Pro
jecte
d ~
$20m
by
end 2
004
Seed
money
up
to
$7.5
m
from
M
SF
, som
e
EU
fu
ndin
g
fro
art
esunate
pro
jects
$258m
fro
m 2
003 t
o 2
014 o
f w
hic
h ~
$40 f
ixed c
ost
s a
nd $
218m
pro
ject
rela
ted c
osts
T
ow
se e
stim
ate
s $
255m
required b
y 2007
IAV
I $84.1
m to e
nd 2
002
IAV
I has been support
ed by
a num
ber
of
NG
Os,
inclu
din
g U
ntil
There
’s
a
Cure
and
Cru
said
. F
oundations
such
as
Rock
efe
ller,
S
loan,
and S
tarr
were
early
donors
to I
AV
I. Y
ahoo!
and B
D (
Bect
on
Dic
kin
son)
have p
rovid
ed I
AV
I w
ith i
mport
ant
in-k
ind c
ontr
ibutions
and B
D i
s a
lso p
rovid
ing d
irect
fin
ancia
l support
. In
additio
n,
eig
ht
govern
ments
are
no
w h
elp
ing t
o f
inance I
AV
I’s
work
, in
clu
din
g t
he
US
, C
anada, and s
ix E
uro
pean g
overn
ments
, D
enm
ark
, Ir
ela
nd, th
e
Neth
erlands, N
orw
ay,
Sw
ede
n,
and t
he U
nite
d K
ingdom
Have c
alle
d f
or
R&
D s
pendin
g o
n v
acc
ines t
o i
ncre
ase
fro
m $
650m
to
$1.3
bn
Desired o
pera
ting b
udget $30m
per
annum
C
urr
ent
com
mitm
ent
of
$310m
to
2008
again
st
est
imate
d
needs
of
$655m
. T
ow
se e
stim
ate
s n
eeds o
f $
1.0
4bn b
y 2007 –
of
whic
h s
hort
fall
is $
862m
IPM
$94.5
m c
om
mitt
ed u
p to 2
007
Launched w
ith fundin
g fro
m R
ocke
felle
r G
ate
s F
oundation
acc
ounts
fo
r ju
st
under
2/3
of
com
mitm
ents
. O
ther
larg
e d
onors
incl
ude R
ock
efe
ller,
Ire
land a
nd N
eth
erlands
IPM
est
imate
$500m
is r
equired g
lobally
to d
evelo
p a
first
genera
tion
pro
duct
To
wse e
stim
ate
s $
775m
required b
y 2007 o
f w
hic
h s
hort
fall
is $
680m
M
IM
$2.7
m c
om
mi9
tted in 2
003 –
la
rgest
donors
in
clude
US
N
IH,
Sid
a
and
National
Lib
rary
of
Medic
ine U
S
MM
V
$55m
com
mitt
ed
Bill
and
Melin
da
Gate
s
Foundation,
Exx
on
Mobil
Corp
ora
tion,
Glo
bal
Foru
m
for
Health
Researc
h,
Inte
rnational
Federa
tion
of
Pharm
aceutical
Manufa
ctu
rers
A
ssocia
tions
(IF
PM
A),
W
HO
, th
e
Rockefe
ller
Foundation,
the W
orld B
ank,
Roll
Back
Mala
ria G
lobal
part
ners
hip
, T
DR
, th
e U
nited K
ingdom
Depart
ment
for
Inte
rnational
Develo
pm
ent
(DF
ID),
S
wis
s
Agency
for
Develo
pm
ent
and
Coopera
tion,
the
Neth
erlands
Min
iste
r fo
r D
evelo
pm
ent
Desired o
pera
ting b
udget $30m
per
annum
T
ow
se e
stim
ate
s $
152m
required b
y 2007

Econom
ic a
nd F
inancia
l A
spects
of th
e G
lobal H
ealth P
art
ners
hip
s
72
DF
ID H
ealth R
esourc
e C
entr
e
Coopera
tion a
nd the W
ellc
om
e T
rust
MD
P
“The
OP
C
and
AP
OC
pro
gra
mm
e
exp
enditure
s,
while
sig
nific
ant, a
re d
warf
ed
by
the
valu
e
of
Merc
k’s
contr
ibutions
thro
ugh
the
MD
P.
In
the
year
2001,
the
valu
e o
f th
e iverm
ect
in c
ontr
ibute
d b
y M
erc
k
– c
alc
ula
ted a
t $1.5
0 p
er
table
t_– w
as $
28.1
m
illio
n for
the O
CP
, $143.6
mill
ion f
or
AP
OC
and
$3.0
m
illio
n
for
the
OE
PA
. T
he
additio
nal costs
of
the M
DP
paid
by
Merc
k –
ship
pin
g the iv
erm
ectin fro
m F
rance w
here
it
is
pro
duced
to
the
dest
ination
countr
ies,
cust
om
s
cle
ara
nce
, and
pro
gra
mm
e
managem
ent
and adm
inis
tration – am
ount
to just 1.1
% o
f to
tal pro
gra
mm
e c
osts
.
MD
P’s
work
on o
nchocerc
iasis
is
fully
support
ed b
y M
erc
k &
Co.,
Inc.
w
hile
its
work
on
LF
is
jo
intly
support
ed
by
Merc
k
and
Gla
xoS
mithK
line
A p
lan o
f actio
n a
nd c
orr
espondin
g
5-y
ear
budget
has b
een p
repare
d for
the 2
003–2007 tim
e
period –
antic
ipating $
14.2
mill
ion in
exp
enditure
s d
uring
this
tim
e p
eriod, 32.9
% o
f w
hic
h is
for
aerial o
pera
tions
(JP
C 2
002; K
ale
et al.
2002).
After
this
period, any
oth
er
specia
l effort
s w
ill b
e t
he r
esponsib
ility
of national
auth
orities.
MV
I sta
rted w
ith s
eed f
undin
g o
f $50 m
illio
n f
rom
th
e B
ill &
Melin
da G
ate
s F
oundatio
n in J
une
1999
Launched w
ith $
50m
seed m
oney
from
the G
ate
s F
oundation i
n
1999.
Additi
onal
$100m
pro
vid
ed i
n 2
003P
art
ners
inclu
de m
ala
ria
exp
ert
s a
round t
he w
orld,
govern
ment
agenci
es,
academ
ia,
public
and p
rivate
researc
h inst
itutions, and v
accin
e p
roducers
Ne
w f
undin
g w
ill a
llow
more
of
what
has b
een d
iscovere
d o
ver
the p
ast
10-1
5 y
ears
to f
inally
be e
valu
ate
d i
n p
eople
-curr
ently
the o
nly
way
to
kno
w if
pote
ntial m
ala
ria v
acc
ines m
ight
work
.
AP
OC
T
ota
l budget 196-2
007 o
f $131m
K
ey
donors
World B
ank $
3m
1996-2
002 –
als
o U
S (
$13m
), G
ate
s ($
10m
) and C
IDA
($5m
) O
CP
was l
aunched i
n 1
974 a
nd c
losed i
ts o
pera
tions o
n 3
1 D
ecem
ber
2002 h
avin
g m
et its
obje
ctiv
e to e
limin
ate
onch
ocerc
iasis
as a
pro
ble
m o
f public
health
import
ance
and
an
impedim
ent
to
socio
econom
ic
develo
pm
ent
in W
est
Afr
ica.
There
are
still
5 S
pecia
l In
terv
entio
n Z
ones
inclu
din
g S
ierr
a Leone,
BU
T A
PO
C covers
diff
ere
nt
countr
ies and is
ongoin
g
with
a
pla
n
fro
phasin
g
out
2008-2
010.
This
seem
s
a
bit
mis
leadin
g.
SC
I
GA
ELF
In
1998 G
laxo
Sm
ithK
line a
nd W
HO
sig
ned
a c
ontr
ibutio
n M
OU
, covering a
mongst
oth
er
thin
gs
the
donatio
n
of
the
alb
enda
zole
re
quired f
or
the L
F E
limin
ation P
rogra
mm
e.
(In
support
of
World
Health
Assem
bly
R
esolu
tion W
HA
50.2
9 1997 calli
ng fo
r th
e
elim
ination
of
LF
(
In 1999 M
erc
k &
C
o.
exp
anded
its
donation
of
Mectiza
n
for
onchocerc
iasis
to
in
clude th
e tr
eatm
ent
of
LF
in
A
fric
an
countr
ies
where
onchocerc
iasis
and L
F d
isease
Gate
s F
oundation, W
orld B
ank
Gla
xoS
mithK
line a
nd M
erc
k (in k
ind)
In 1
998,
Sm
ithK
line B
eecham
, now
Gla
xoS
mithK
line (
GS
K),
agre
ed t
o
donate
its
dru
g
alb
endazo
le
free-o
f-charg
e
until
the
dis
ease
is
elim
inate
d.
This
is l
ikely
to b
e a
donation o
f betw
een 4
-6 b
illio
n t
able
ts
over
a 20-y
ear
period.
Merc
k &
C
o., In
c.
als
o p
ledged to
exp
and its
Mect
izan D
onation P
rogra
m fo
r O
nchocerc
iasi
s in
all
are
as of
Afr
ica
whe
re t
he t
wo d
iseases c
o-e
xist. I
n F
ebru
ary
200
1 t
he B
ill &
Melin
da
Gate
s F
oundation
gave
$20
mill
ion
to
acc
ele
rate
th
e
elim
inatio
n
of
Lym
phatic F
ilariasis
(LF
) during t
he f
irst
five y
ears
of
the 2
0-y
ear
glo
bal
pro
gra
m
To 2
020 o
r until LF
is e
limin
ate
d a
s a
public
health p
roble
m w
orld
wid
e
ITI
$58m
com
mitt
ed t
o d
ate
M
ajo
r donors
are
Gate
s F
oundation $
25m
and P
fizer
$22m
GA
EL
Com
menced in
1995
usin
g donation
from
th
e N
ippon F
oundation
Nip
pon F
ound
ation,
DA
NID
A,
Novart
is,
Sasakaw
a M
em
orial H
ealth
Foundation, W
orld H
ealth O
rganiz
ation (
WH
O)
and the W
orld B
ank
Under
the t
erm
s o
f th
e M
oU
with N
ovart
is a
nd t
he N
ovart
is F
oundation
for
Susta
inable
Develo
pm
ent,
MD
T t
o t
he
valu
e o
f aro
und U
S$ 3
0 m
illio
n
will
be d
onate
d f
ree o
f cost
to a
ll co
untr
ies in n
eed u
p t
o t
he e
nd o
f 2005
no
w b
ein
g e
xtended to 2
010

Econom
ic a
nd F
inancia
l A
spects
of th
e G
lobal H
ealth P
art
ners
hip
s
73
DF
ID H
ealth R
esourc
e C
entr
e
The N
ippon F
oundation a
nd t
he S
asaka
wa M
em
orial
Health
Foundation
have p
ledged to c
ontr
ibute
US
D 2
4m
2000-2
005
G
WE
P
The
cam
paig
n
brings
togeth
er
WH
O,
UN
ICE
F,
the C
DC
, th
e W
orld B
ank,
oth
er
org
aniz
ations,
indust
ry
and
countr
ies
in
a
pro
gra
mm
e
of
era
dic
ation effort
s,
train
ing,
and
researc
h.
Dupont
has
donate
d
more
th
an 2
mill
ion s
quare
mete
rs o
f nyl
on c
loth
to
fil
ter
drinkin
g
wate
r –
a
key
ste
p
in
inte
rrupting
transm
issio
n.
Additi
onally
, a
larv
icid
e i
s d
onate
d b
y A
merican C
yanam
id
(no
w p
art
of B
AS
F
Majo
r fu
nders
in
clu
de:
BA
SF
, B
ill
& M
elin
da
Gate
s F
oundation,
DuP
ont, J
ohnson &
Johnson, and P
recis
ion F
abrics
RB
M
$35m
spent
thro
ugh R
BM
in 2
002 w
ith a
n
additio
nal
$95m
of
donor
fundin
g
outs
ide
RB
M
Key
funders
WH
O,
DF
ID a
nd U
SA
ID w
ith s
malle
r in
puts
fro
m I
taly
and J
apan, W
orld B
ank a
nd o
thers
.
Afr
ican
Heads
of
Sta
te
request
ed
$1
bill
ion
for
RB
M
in
the
Abuja
D
ecla
ration
CM
H e
stim
ate
s th
at
by
2007,
a s
cale
d-u
p e
ffort
of
mala
ria c
ontr
ol w
ould
cost
fro
m $
1.5
– $
2.5
bill
ion p
er
annum
of
whic
h $
0.5
– $
1.1
bill
ion w
ould
be f
or
sub-S
ahara
n A
fric
a
S
top T
B
$11.8
m
in
2001
and
$18.1
m
in
2002
of
whic
h s
om
e 8
0%
is f
or
the G
DF
. K
ey
funders
of
ST
BP
CID
A a
nd N
eth
erlands (
GD
F)
and U
SA
ID,
UK
, N
eth
erlands
oth
ers
fo
r S
ecre
tariat
–
sig
nifi
cant
in
kin
d
contr
ibutions
$9.1
bn u
nder
curr
ent
Glo
bal
Pla
n t
o S
top T
B.
New
pla
n c
urr
ently
under
develo
pm
ent.
WP
ES
S
Aventis
has d
onate
d $
25m
over
the n
ext
5
years
A
ventis,
B
risto
l-M
yers
S
quib
b
pro
vid
ing
mate
rials
and
fundin
g
- $400k -
over
2 y
ear
period.
MS
F p
rovid
ing i
n k
ind s
upport
Majo
r fu
nders
inclu
de:
BA
SF
, B
ill &
Melin
da G
ate
s F
oundatio
n,
DuP
ont,
Johnson &
Johnson,
and P
reci
sio
n F
abrics
Aventis d
onate
d $
25 m
illio
n f
or
the n
ext
fiv
e y
ears
and w
ill w
ork
in c
lose
colla
bora
tion
with
WH
O
on
a
thre
e-p
oin
t str
ate
gy
inclu
din
g
dru
g
donations (
eflorn
ithin
e,
penta
mid
ine,
mela
rsopro
l),
dis
ease m
anagem
ent,
and r
esearc
h a
nd d
evelo
pm
ent. B
rist
ol-M
yers
Squib
b h
as c
om
mitt
ed t
o
fund t
he c
ost
of
supply
ing t
he b
ulk
mate
rial fo
r eflorn
ithin
e (
one y
ear
and
400 0
00 U
SD
for
a t
wo y
ears
period)
and B
aye
r has a
gre
ed t
o r
esta
rt
pro
duction a
nd d
onate
tw
o o
ther
dru
gs u
sed t
o t
reat
sle
epin
g s
ickn
ess:
sura
min
and
nifurt
imox.
M
édecin
s
sans
Fro
ntière
s,
whic
h
acte
d
with
W
HO
to b
ring t
hese dru
gs
back
into
pro
duction,
will
pro
vid
e s
tora
ge,
packagin
g,
dis
trib
ution,
and a
dm
inis
tratio
n o
f th
e d
rugs,
in a
ccord
ance
with
W
HO
’s
direct
ions,
to
national
contr
ol
pro
gra
mm
es
and
nongovern
menta
l org
aniz
ations.
D
ura
tion:
A fiv
e-y
ear
period, until J
une 2
006.

Economic and Financial Aspects of the Global Health Partnerships 74
DFID Health Resource Centre
ANNEX 4: KEY DOCUMENTS
Saving Lives, Buying Time: Economics of Malaria Drugs In an Age of Resistance (2004) Board on Global Health (BGH) PUBLIC EXPENDITURE REVIEW HIV/AIDS MULTI-SECTORAL UPDATE FOR 2004 Foster and Mwinyimvua November 2003 MACROECONOMICS GUIDANCE NOTE No. 2 a Checklist of Macroeconomic Issues for Scaling-Up Aid Flows DFID July 2004 GLOBAL HEALTH PARTNERSHIPS: MAPPING A SHIFTING TERRAIN Kent Buse February 2003 African Programme for Onchocerciasis Control (APOC Report: External Mid-Term Evaluation Olikoye Ransome-Kuti et al Sept 2000
APPRAISING A HEALTH PROJECT: Economic Benefits of the Onchocerciasis Control Programme in West Africa HCO DISSEMINATION NOTES Human Capital Development and Operations Policy January 8, 1996
GLOBAL FUND COUNTRY CASE STUDIES REPORT Cheri Grace January 2003 Emerging Lessons in Preparing For Uptake of New Vaccines Gargle Ghosh Centre for Global Development, USA Financial Flows to Global Health Partnerships Panos Kanavos and Paul Holmes 17 February 2004 Vaccine Fund Strategic Plan 2002-2006 WHO REPORT 2004 Global Tuberculosis Control Surveillance, Planning, Financing The Economic Impacts of Tuberculosis Dennis A. Ahlburg, 2001 Partners For Health Reformplus April 2004 Fact Sheet on HIV/AIDS in Rwanda Using The National Health Accounts Sub analysis To Track Resource Flows for HIV/AIDS PHR Plus 2004 Global Polio Eradication Initiative t2004-2008 Demonstrating Value: Performance Metrics for Health Product Development Public-Private Partnerships Marc Pfitzer Foundation Strategy Group, Switzerland 2004 REVIEW OF THE MULTILATERAL INITIATIVE ON MALARIA (MIM) 2002 Bockarie et al Copenhagen Consensus: Challenge Paper On Communicable Diseases Mills and Shillcutt* February 2004

Economic and Financial Aspects of the Global Health Partnerships 75
DFID Health Resource Centre
POLICY ANALYSIS OF THE USE OF HEPATITIS B, HAEMOPHILUS INFLUENZAE TYPE B-, STREPTOCOCCUS PNEUMONIAE-CONJUGATE AND ROTAVIRUS VACCINES IN NATIONAL IMMUNIZATION SCHEDULESMILLER and McCann Health Econ. 9: 19–35 (2000) Mectizan Donation Program: Evaluation of a Public–Private Partnership Peters and Phillips Tropical Medicine and International Health Volume 9 No 4 Pp A4–A15 Suppl April 2004 Economic Evaluation of Mectizan Distribution H. R. Waters, J. A. Rehwinkel and G. Burnham Tropical Medicine and International Health Volume 9 No 4 Pp A16–A25 Suppl April 2004 EU Focus On Global Public Goods European Commission B-1049 Brussels Economic Analysis of Malaria Control in Sub-Saharan Africa Goodman, Coleman and Mills May 2000 Strategic Review of Resource Allocation Priorities DFID January 2003 Drug Development for Neglected Diseases: A Deficient Market And A Public-Health Policy Failure Trouiller et al THE LANCET • Vol 359 • June 22, 2002 Recent Trends in Official Development Assistance to Health September 2000 OECD Analysis of Aid In Support Of HIV/AIDS Control, 2000-2002 OECD 2004 International Grant making By US Foundations: A Report by the Hudson Institute Adelman and Sebag, Research Fellow PPPs And Product Development: Innovative Financing Opportunities and the Need for a 'Business Case' Approach Batson et al Supporting the Development of Water and Sanitation Services In Developing Countries OECD 2003 Malaria Expenditure Analysis Tanzania Case Study Prepared For DFID-EA (Tanzania) And the Roll Back Malaria Initiative March 2000 Jowett et al Roll Back Malaria? The Scarcity of International Aid for Malaria Control Narasimhan and Attaran April 2003 The Relationship between Socio-Economic Status and Malaria: A Review of the Literature Background Paper Prepared Worralla et al September 2002. Philanthropic Foundations and Development Co-operation Off-Print of the DAC Journal 2003, Volume 4, No. 3 The Long-Run Economic Costs of AIDS: Theory and an Application to South Africa Bell, Devarajan and Gersbach June 2003

Economic and Financial Aspects of the Global Health Partnerships 76
DFID Health Resource Centre
Independent Evaluation of The International AIDS Vaccine Initiative April 2003 Skolnik et al Global Public Goods: How Much Should DFID Allocate To Global Actions and Funding Melanie Speight 2002 Partnership Summary of E-forum Discussions GFATM: Country Coordinating Mechanisms (CCMs) July 2004 GFATM: Update on Resource Needs 27 July 2004
GFATM Guidelines for Performance-Based Funding July 200