economic and budgetary outlook for the european union 2017 · economic and budgetary outlook for...
TRANSCRIPT

STUDYEPRS | European Parliamentary Research Service
Authors: Alessandro D’Alfonso, Angelos Delivorias,Magdalena Sapała, Andrej Stuchlik
Members' Research ServiceJanuary 2017 — PE 595.915 EN
Economic andbudgetaryoutlook for theEuropeanUnion 2017


EPRS | European Parliamentary Research Service
Economic and budgetary outlook forthe European Union 2017
This study, intended to be the first in an annual series, presents theeconomic and budgetary situation in the EU and likely futuredevelopments. It summarises main economic indicators in the EUand euro area and their two-year trends. It explains the EU budgetand provides an overview of its headings for 2017, and sets out thewider budgetary framework – the multiannual financial framework(MFF) – currently covering the 2014-2020 period. A special 'economicfocus' looks at the investment gap in Europe, and various EU-levelinitiatives to close it.

AUTHORSAlessandro D'Alfonso, Angelos Delivorias, Magdalena Sapała, Andrej StuchlikTo contact the authors, please email: [email protected]
Graphics by Christian Dietrich and Giulio Sabbati.The authors thank Philipp Wegner, trainee in the Budgetary Policies Unit, for researchassistance.
ABOUT THE PUBLISHERThis paper has been drawn up by the Members' Research Service, within the Directorate–General forParliamentary Research Services of the Secretariat of the European Parliament.
LINGUISTIC VERSIONSOriginal: EN
This document is available online at:http://www.eprs.ep.parl.union.eu (intranet)http://www.europarl.europa.eu/thinktank (internet)http://epthinktank.eu (blog)
DISCLAIMERThis document is prepared for, and addressed to, the Members and staff of the European Parliamentas background material to assist them in their parliamentary work. The content of the document isthe sole responsibility of its author(s) and any opinions expressed herein should not be taken torepresent an official position of the Parliament.
Original manuscript completed in January 2017.Brussels © European Union, 2017.
PE 595.915ISBN 978-92-846-0484-5doi:10.2861/543320QA-06-16-374-EN-N

Economic and budgetary outlook for the European Union 2017 Page 1 of 69
EXECUTIVE SUMMARY
This study presents the 2017 economic and budgetary outlook for the European Union,explores the most recent developments in EU budgetary negotiations, and focuses onthe investment gap in the EU, as a major economic challenge for the Union.
In 2016, the EU and euro-area economies continued their moderate growth (less than2 %), which was also accompanied by the creation of jobs. While these trends areprojected to continue over the next two years, some positive factors which underpinthem are, or may soon be, exhausted. Moreover, they may be further dampened by thebroader economic, political and geopolitical challenges which the EU faces.
Amounting to €157.86 billion, the 2017 EU budget represents only some 2 % of totalpublic spending in the European Union – approximately 1 % of gross national income(GNI). However, the budget has features that increase its impact, such as the capacity toleverage additional funding from other sources and to target areas where the pooling ofresources can provide added value to the EU as a whole (e.g. research, innovation anddevelopment cooperation). Adopted by the European Parliament and the Council of theEuropean Union following intense negotiations, the 2017 budget has a structuredetermined by the 2014-2020 multiannual financial framework (MFF). With a view toincreasing the resources devoted to major policy challenges emerging in recent years,however, resort is made to the flexibility provisions of the EU's financial planning tool.
These policy challenges include the European financial and sovereign debt crisis and itsimpact on growth and employment, and the growing instability in Europe's eastern andsouthern neighbourhood, which caused an important increase in migration flows andnumerous security concerns. The 2017 budget accordingly focuses on stimulating growthand creating new jobs, especially for young people, as well as addressing the migrationcrisis and security issues.
Taking into consideration the aforementioned challenges, and in the context of thediscussion on the preparation of the post-2020 programming period, many wouldwelcome further EU budgetary streamlining, to increase capacity to respond to theconcerns of EU citizens and to the unprecedented challenges the EU faces. Relevantdevelopments include the mid-term revision of the 2014-2020 MFF currently undernegotiation, the proposal for the next MFF to be tabled by the end of 2017, and possiblechanges in the EU financing system.
This year's economic focus examines investment in the EU and prioritises the subduedinvestment level in almost all EU Member States (i.e. gross fixed capital formation inrelation to the gross domestic product (GDP), following the financial crisis of 2008. Thisinvestment gap, in turn, impacts the fragile economic recovery adversely andundermines the EU's international competitiveness.
In this context, the EU institutions have tried, both through the EU budget and by othermeans (European Investment Bank operations, the European Fund for StrategicInvestments (EFSI), or the Capital Markets Union), and in line with the philosophy of co-financing, to entice private investors to invest in strategic long-term sectors such asinfrastructure, research or education, and to facilitate cross border investments andcapital flows. While initial EFSI results are encouraging, and have led the Commission topropose an extension to 2020, concerns have been raised by the European Court ofAuditors. Proposals have also been formulated by academia and other stakeholders,which involve either an additional goal, a different orientation for EFSI, or envision acomplete overhaul of the fund.

Economic and budgetary outlook for the European Union 2017 Page 2 of 69

Economic and budgetary outlook for the European Union 2017 Page 3 of 69
TABLE OF CONTENTS
1. Introduction................................................................................................................... 7
2. EU economy 2017.......................................................................................................... 8
2.1. Overview................................................................................................................. 8
2.2. Main indicators....................................................................................................... 92.2.1. Gross domestic product ............................................................................................... 9
2.2.2. Labour market ............................................................................................................ 10
2.2.3. Public finances............................................................................................................ 13
2.2.4. Trade and developments at global level .................................................................... 14
2.3. Inflation and monetary policy .............................................................................. 14
2.4. Going forward....................................................................................................... 16
3. EU budget in perspective............................................................................................. 16
3.1. Size and the role of the EU budget....................................................................... 16
3.2. Structure of the EU budget: revenue and multiannual planning ......................... 20
3.3. Main institutional actors in two key phases of the budgetary cycle.................... 21
3.4. Challenges in recent years.................................................................................... 22
4. EU budget 2017 ........................................................................................................... 23
4.1. Result of the budgetary procedure ...................................................................... 23
4.2. Budget headings in detail ..................................................................................... 26
4.3. Scrutiny of EU spending: procedures in the EP .................................................... 31
5. EU budget in the medium- and long-term .................................................................. 33
5.1. Second half of the 2014-2020 MFF ...................................................................... 33
5.2. Debate on the post-2020 MFF.............................................................................. 36
6. Economic focus: public and private investment in the EU.......................................... 40
6.1. Main challenges.................................................................................................... 406.1.1. Investment gap – data................................................................................................ 40
6.1.2. Investment gap – causes and effects ......................................................................... 43
6.2. EU investment support......................................................................................... 456.2.1. European Investment Bank operations...................................................................... 45
6.2.2. European Fund for Strategic Investments (EFSI)........................................................ 47
6.2.3. Potential of the capital markets union initiative........................................................ 52
6.3. Potential developments ....................................................................................... 546.3.1. Public investment in the EU in the near future.......................................................... 54
6.3.2. Possible EFSI evolutions ............................................................................................. 54
7. Main references........................................................................................................... 57
8. Annexes ....................................................................................................................... 61

Economic and budgetary outlook for the European Union 2017 Page 4 of 69
List of figures
Fig 1: Real GDP growth in the EU Member States, 2017 forecast, in %
Fig 2: Unemployment rates in the EU Member States, 2017 forecast, in %
Fig 3: Employment rates in selected OECD Member States 1995-2007, 2016, in %
Fig 4: Budget balance in the EU Member States, 2017 forecast, in %
Fig 5: EU budget and general government public spending in the EU (2015, € billion)
Fig 6: EU budget as a share of public spending in individual Member States (2015)
Fig 7: EU revenue in 2015
Fig 8: 2014-2020 multiannual financial framework by heading (€ billion, currentprices)
Fig 9: 2017 EU budget (commitments, € billion, current prices)
Fig 10: A comparison of EU budgets in 2016 and 2017 (commitment and paymentappropriations, € billion)
Fig 11: Subheading 1a Competitiveness for growth and jobs, 2017 commitmentappropriations
Fig 12: Subheading 1b Economic, social and territorial cohesion, 2017 commitmentappropriations
Fig 13: Heading 2 Sustainable growth: natural resources, 2017 commitmentappropriations
Fig 14: Heading 3 Security and citizenship, 2017 commitment appropriations
Fig 15: Heading 4 Global Europe, 2017 commitment appropriations
Fig 16: Heading 5 Administration, 2017 commitment appropriations
Fig 17: Discharge procedure for the EU budget from the perspective of the EP
Fig 18: Payment ceiling sustainability
Fig 19: Timeline of main MFF 2014-2020 events
Fig 20: Gross fixed capital formation in the EU Member States, 1995-2015 (2000=100)
Fig 21: Gross fixed capital formation, core and cohesion countries, in % of GDP (2015)
Fig 22: Gross fixed capital formation, vulnerable countries, in % of GDP (2015)
Fig 23: Gross fixed capital formation, selected EU countries, 1995-2015, in % of GDP
Fig 24: Sectoral coverage of EFSI transactions, approved as of November 2016, in %
Fig 25: Regional coverage of EFSI transactions, approved as of December 2016(€ million)

Economic and budgetary outlook for the European Union 2017 Page 5 of 69
List of main acronyms used
AMIF: Asylum, Migration and Integration Fund
BUDG: Committee on Budgets (European Parliament)
CA: Commitment appropriation
CEF: Connecting Europe Facility
CONT: Budgetary Control Committee (European Parliament)
COSME: Competitiveness of Enterprises and Small and Medium-sized Enterprises
DAS: statement of assurance (from the French: déclaration d'assurance)
DCI: Development Cooperation Instrument
EAGF: European Agriculture Guarantee Fund
ECA: European Court of Auditors
ECON: Committee on Economic and Monetary Affairs (European Parliament)
EDF: European Development Fund
EFRD: European Fund for Rural Development
EFSD: European Fund for Sustainable Development
EFSI: European Fund for Strategic Investments
EIAH: European Investment Advisory Hub
EIB: European Investment Bank
EIF: European Investment Fund
ELTIFs: European Long-Term Investment Funds
EMFF: European Maritime and Fisheries Fund
ENI: European Neighbourhood Instrument
ERDF: European Regional Development Fund
ESF: European Social Fund
ESI Funds: European Structural and Investment Funds
GDP: Gross domestic product
GNI: Gross national income
ILO: International Labour Organization
IPA: Instrument for pre-accession assistance
ISF: Internal Security Fund
MFF: Multiannual financial framework
NPBs: National promotional banks
PA: Payment appropriation
SMEs: small and medium-sized enterprises
STS: Simple, transparent and standardised securitisations
YEI: Youth Employment Initiative

Economic and budgetary outlook for the European Union 2017 Page 6 of 69

Economic and budgetary outlook for the European Union 2017 Page 7 of 69
1. IntroductionIn 2016, the real GDP growth rate of the EU-28 stood at an average of 1.8 %,1 well belowits pre-crisis peaks (3.3 % in 2006 and 3.1 % in 2007), and the global GDP growth rate for2016 (3.0 %). The projections do not inspire optimism: in its latest forecast, the EuropeanCommission expects that in the next two years, GDP growth will remain more or lessstagnant (at 1.6 % in 2017 and 1.8 % in 2018). Similarly, labour market conditions remainweak: in 2016, the unemployment rate stood at 8.6 % (10.1 % for the euro area) and isnot expected to reach pre-crisis levels in the near future (at least not until 2018,according to European Commission forecasts). In addition to economic concerns, for thelast few years the EU has been confronted with a number of significant challenges:growing instability in its eastern and southern neighbourhood, an important increase inmigration flows, and numerous security concerns. In this context, media headlines focusto a great degree on political decisions taken by individual Member States. At the sametime, European institutions also contribute to the European response to those crises,using various tools and initiatives, which, while less visible than high-level summits,nevertheless deserve attention. This study delves into two of these: the European Unionbudget and the way it has been reoriented to tackle some of the aforementionedchallenges, and EU and the European Investment Bank/Fund investment-orientedinitiatives to close the significant gap in investment Europe faces, in comparison with theperiod leading up to the crisis.
The economic situation in the EU and the euro area, as well as two-year projections forthe main economic indicators are presented first (Section 2). While 2016 continued thetrend of recovery from the depths of the financial (2008-2009) and sovereign debt (2011-2013) crises, and while economic recovery is accompanied by the creation of new jobs,growth is still weak and considerable differences exist between Member States. Inaddition, the capacity of the banking sector, which is the most important financeprovider for the real economy, remains impaired. Furthermore, the recovery isunderpinned by factors (such as low energy prices, the accommodative monetary policyof the ECB and a weaker euro), which are temporary, and whether growth is robustenough to continue in their absence is questioned.
This study introduces the EU budget, its nature and role (Sections 3 and 4), as well asgiving an overview of the budget for 2017. It is a limited budget – the €134.49 billion oftotal payments agreed (€136.64 billion in 2016) is less than the public expenditure of acountry such as Denmark, or 10 % of the budgeted government expenditures of acountry such as Germany. The commitments adopted for 2017 amount to €157.86 billion(€155.28 billion in 2016) and represent only 1.05 % of EU gross national income (GNI).The EU budget is oriented towards creating growth and jobs and tackling the migration,refugee and security crises. It also seeks to trigger additional funding from other publicand/or private sources to reach its goals. The study then explains the wider budgetaryframework – the multiannual financial framework (MFF) (Section 5). The current MFFcovers the period 2014-2020 and – possibly because it was negotiated at the peak of theEuropean sovereign debt crisis – is the first to have lower resources in comparison withthe previous programming period. A mid-term revision is currently under negotiation,with job creation, growth, migration, and security challenges identified as areas requiringreinforcement of resources. These reinforcements would not, however, change the
1 European Commission, European Economic forecast, November 2016.

Economic and budgetary outlook for the European Union 2017 Page 8 of 69
overall MFF ceilings. In addition, 2017 will see a gain in momentum in the debate on thepost-2020 financial framework.
A way to render economic growth more robust is through investment, but since 2008,investment levels in the EU are lagging, both vis-à-vis other major economies and withregards to previous investment levels. Therefore, in this year's economic focus(Section 6), we analyse the investment gap in Europe, and the EU-level initiatives (theEIB's role, the recently created European Fund for Strategic Investments (EFSI) and thecapital markets union action plan), as well as proposals for their potential developments.
2. EU economy 20172.1. OverviewThe EU and euro-area economies have continued their moderate growth, with the euroarea projected to grow by 1.7 % in 2016 and the EU-28 by 1.8 %. Moderate growth shouldcontinue in the coming two years (1.5 % in 2017 and 1.7 % in 2018 for the euro area;1.6 % and 1.8 % for the EU-28 respectively).2
Furthermore, this recovery is accompanied by the creation of new employmentopportunities: The European Commission estimates that up to eight million new jobshave been created since 2013, reducing the EU unemployment rate for the euro area to8.6 % and for the EU-28 to 10.1 % (2016), its lowest level since 2009. Factors supportingthe recovery included low energy prices3 and the depreciation of the euro since 2014,4
as well as the ECB's accommodative monetary policy and a more growth-supportive fiscalpolicy stance5 in some EU Member States. However, the impact of some of those factorsis already diminishing. The euro exchange rate remains at a relatively low level but,according to the Commission, some positive effects of the currency's depreciation inearly 2015 on exports and economic growth already appear to be exhausted; the sameapplies to the boost in disposable household income resulting from lower prices forenergy consumption.
The EU's economic recovery is hampered by a number of external and internalchallenges: (i) elevated geopolitical and political uncertainty6 (crises in the European
2 European Commission, European Economic Forecast - Autumn 2016, Brussels, 9 November 2016, p.185 and appendix 6. Growth projections for the USA indicate real growth of 2.1 % in 2017 and 1.9 % in2018.
3 For an overview on the causes and possible effects of low prices, see, among others, A. M. Husain etal. ‘Global Implications of Lower Oil Prices’, IMF Staff discussion note, July 2015.
4 See Eurostat ‘Exchange rates and interest rates’, statistics explained series.5 Understood as ‘the orientation given to fiscal policy by governments' discretionary decisions on tax and
expenditure’. See European Commission, Towards a positive fiscal stance for the euro area,COM(2016) 727 final.
6 The resulting uncertainty, in turn, can lead private households to increase precautionary savings (whichcan reduce current private consumption) or firms to postpone investment projects. For more on the
The EPRS ‘Economic and Budgetary outlook for the European Union’ is the first in aplanned annual series, to be published in January each year. The study will presenteconomic forecasts and budgetary developments, and each year focus on differentspecific economic issues. Budgetary data and the MFF review reflect the situation asof December 2016.

Economic and budgetary outlook for the European Union 2017 Page 9 of 69
neighbourhood, the United States (USA) presidential elections, and the United Kingdom(UK) referendum); (ii) slowing growth outside the EU;7 (iii) weak global trade;8 (iv) highunemployment rates;9 (v) high levels of (private and public) debt;10 (vi) an ageingpopulation,11 which puts pressure on the financial sustainability and adequacy of socialprotection systems; (vii) high levels of inequality, and considerable, albeit slowlydampening, risks of poverty and social exclusion. Lastly, (viii) the capacity of the bankingsector12 of some Member States to finance the real economy is impaired, due toimportant volumes of non-performing loans, as well as the continuous process of balancesheet repair and deleveraging that began after the crisis.13
2.2. Main indicators2.2.1. Gross domestic productTentative results for 201614 indicatethat euro area gross domesticproduct (GDP) grew by 1.7 % and inthe EU-28 by 1.8 % at constant prices.For 2017, the European Commissionprojects euro area GDP growth willreach 1.5 % in 2017 and 1.7 % in2018, while EU-28 GDP growthshould reach 1.6 % and 1.8 % in 2017and 2018 respectively.15 In a similarvein, the International MonetaryFund (IMF) estimates the euro area togrow by 1.6 % in 2017 and 2018.16
Presumably, mostly domesticdemand (private and public
impact of uncertainty, see European Central Bank, The impact of uncertainty on activity in the euroarea, ECB Economic Bulletin, Issue 8, 2016, pp. 55-74.
7 See below ‘Trade and developments at global level’.8 According to the European Central Bank, this slowdown in global trade is due to compositional effects,
which dampen the global income elasticity of trade and to various developments, which have loweredtrade elasticities at the country level. European Central Bank, Determinants of the slowdown in globaltrade: what is the new normal?, ECB Economic Bulletin, Issue 6, 2016, pp. pp. 30-33.
9 In 2016, six EU Member States (EL, ES, FR, IT, CY and PT) had unemployment rates equal or higher than10 %.
10 In 2016, seven Member States (BE, EL, ES, FR, IT, CY and PT) had gross general government debt veryclose to, or higher, than 100 % of GDP and those numbers are not projected to change significantly inthe coming years.
11 According to Eurostat, in 2015, the share of persons aged 65 or over in the EU population reached18.9 %, an increase of 2.3 % compared with 10 years earlier. Member States with the higher share ofpersons 65 or over were Italy (21.7 %), Germany (21.0 %) and Greece (20.9 %).
12 Which finances 75 % of the European economy.13 European Commission, European Economic Forecast. op. cit.14 Data drawn from European Economic Forecast. op. cit., last updated in November 2016.15 Nonetheless, it must be noted that there are wide disparities with regards to this GDP growth: Ireland
is projected to have grown by 4.1 % in 2016, while the projections for Italy stand at 0.7 %. Similarly, thecumulated GDP growth since the crisis varies significantly among EU Member States.
16 International Monetary Fund, World Economic Outlook - Update, Washington DC, January 2017, p. 7.
Figure 1 – Real GDP growth in the EU MemberStates, 2017 forecast, in %
Source: European Commission, autumn forecast,November 2016.

Economic and budgetary outlook for the European Union 2017 Page 10 of 69
consumption) and employment growth will drive this modest increase of the EUeconomy.
However, real GDP will not grow evenly across Member States (see Figure 1). Forecastslook most promising for Romania (3.9 %), Luxembourg (3.8 %), Malta (3.7 %), Ireland (3.6%), Poland (3.4 %), and Slovakia (3.2 %). At the other end of the spectrum, theCommission expects lower growth rates for France (1.4 %), Belgium (1.3 %), Portugal(1.2 %), the United Kingdom (1.0 %), Italy (0.9 %), and Finland (0.8 %). While theprospects for Italy and Finland may not change in 2018, with expected growth rates of1.0 % (Italy) and 1.1 % (Finland) respectively, the outlook for Greece has improved. Afternegative growth of -0.3 % in 2016, the Greek economy is expected to grow by 2.7 % in2017 and 3.1 % in the year after.
In 2016, private consumption benefited from strong employment growth and a rise indisposable household income,17 in turn due to higher labour income and gains inpurchasing power resulting from low inflation. In 2017-2018, this expansion shouldcontinue benefitting from steady but decelerating employment growth, from improvedbank lending conditions, and from moderately increasing wages. These should helpoffset the impact on real disposable incomes18 of the small rise in consumer prices andthe unchanged household saving rate (despite the fall in nominal interest rates).19
Government consumption has also contributed to economic growth and is expected tocontinue doing so for the next two years, albeit in a more moderate way (from 1.9 % in2016 for the euro area, to 1.3 % in 2017 and 2018; and from 1.8 %, to 1.2 % and 1.3 %for the EU-28). The picture here varies between Member States, with refugee andsecurity related expenditures remaining a determinant of public consumption in someMember States, while important consolidation efforts characterise others.20
2.2.2. Labour marketUnemployment in 2016 is set at 10.1 % for the euro area and 8.6 % for the EU as a whole.Unemployment is expected to decrease further over the next two years (to 9.7 % in 2017and 9.2 % in 2018 for the euro area and to 8.3 % in 2017 and 7.9 % in 2018 for the EU asa whole), also in view of expected increased participation rates and the gradualintegration of refugees in the labour market.21 More specifically, both 'general'unemployment and youth unemployment have been slowly receding – with youthunemployment still at higher levels but also decreasing at a faster pace than generalunemployment – although significant variances exist between Member States. Similarly,long-term unemployment continues to decrease, but remains at much higher levels thanbefore the crisis.
17 The total amount of money available for spending and saving after subtracting income taxes andpension contributions.
18 Income after taxes and benefits, adjusted for the effects of inflation.19 The Commission further notes that, this stability can seem difficult to reconcile with the observation of
increased income inequality and a larger share of incomes earned by households with a relatively highsaving rate which would then depress demand. However, ‘an increased propensity to consume of poorand middle-class households in times of increased awareness of inequality (trickle-down consumption)could offset the higher savings of high-income earners’.
20 For example, Germany is projected to have experienced a 3.9 % increase in government consumptionexpenditure over the previous year, France 1.5 % and Greece -0.7 %.
21 See e.g. Eurofound, Approaches to the labour market integration of refugees and asylum seekers,Publications Office of the European Union, Luxembourg, 2016.

Economic and budgetary outlook for the European Union 2017 Page 11 of 69
However, the somewhat positive outlookof decreasing unemployment at theaggregate level does not automaticallyimply a reduction of disparities between EUMember States (see Figure 2). Theunemployment rate for the EU-28 ispredicted to fall from 8.6 % in 2016 to 8.3 %in 2017, but prospects for Member Stateslike Spain (18 %), Italy (11 %), or Portugal(10 %), remain mixed. Spain'sunemployment rates for instance havebeen falling since 2013 and could reach16.5 % in 2018, reducing the total number
(from a peak of 6.05 million in 2013).22
However, rates in Italy are projected to fallonly marginally (2015: 11.9 %; 2016:11.5 %; 2017: 11.4 %; 2018: 11.3 %).Accordingly, the number of unemployedpersons will drop to 2.934 million in 2017(2.952 million in 2016). Similarly, unemployment in Portugal is expected to fall to 10 %in (2016: 11.1 %) but to remain above the EU average the year after (2018: 9.5 %; EU-28:9.3 %).
Positive conditions in countries such as the Netherlands (5.8 %) or Germany (4.3 %) will
Overall, the European Commission stresses that the strong increase in unemploymentrates following the 2008 financial crisis has not been fully reversed as yet. This trend notonly suggests persisting slack23 in European labour markets, but also dampens alreadyrecord low inflation levels (see below).
Employment in the EU and the euro area picked up and grew by 1.4 % in 2016, which isfaster than in previous years. This job creation has benefited from growth based ondomestic (intra-EU) demand, and moderate wage increases, as well as fiscal policymeasures and structural reforms implemented in some Member States. In the euro area,employment is projected to decelerate in the next two years, but remain positive ataround 1.0 % in 2017 and 2018. In the EU-28, employment levels may fall somewhatfurther, due to the slowdown in the UK economy (0.9 % in 2017 and 0.8 % in 2018).
Employment rates in EU Member States not only reflect differences in absolute levels,but also concern the scope of change over time: Figure 3 displays OECD data onemployment activity as average performance during the years 1995-2005, as well as thelatest available point in time, 2016. This combination allows us to grasp the significantchanges in EU countries: employment rates in Estonia, for instance, averaged 57.6 % until
22 Data from AMECO (European Commission Annual Macro-economic database, last update9 November 2016) and Eurostat ‘Total unemployment’. Eurostat indicator [une_rt_a], last update24 January 2017.
23 Slack can be defined as the ‘quantity of labour and capital that could be employed productively, butisn't’. For a comprehensive non-specialist description, see the blog post ‘Labor Market Slack: A Guidefor the Perplexed’.
Figure 2 – Unemployment rates in the EUMember States, 2017 forecast, in %
Source: European Commission, autumn forecast,November 2016.
of unemployed persons to 3.759 million
continue to produce significantly lower unemployment rates in 2017.

Economic and budgetary outlook for the European Union 2017 Page 12 of 69
2007, but climbed to 66.9 % in 2016. This positive development is in line with an EasternEuropean emerging market perspective prevalent in the mid-1990s, and can be observedto a similar extent in Latvia (average 53.4 %; 2016: 60.6 %), or Hungary (average 48.2 %;2016: 56.7 %), albeit at lower absolute levels. However, Germany experienced acomparable upward shift from an average rate of 57.5 % until 2007 to 66.0 % in 2016.
Figure 3 – Employment rates in selected OECD Member States 1995-2007, 2016, in %
Source: OECD, Economic Outlook, Volume 2016, Issue 2, Paris, 17 December 2016, Ratio of total employment to thepopulation aged 15-74 years. Euro area data for those 16 Member States also members of the OECD, data as of28 November 2016.
Aggregate data for the euro area only changed from 54.6 % to 57.4 %. The social costs ofthe economic and financial crisis are clearly visible in Portugal and Greece. In bothMember States, the 2016 employment rate was below the average rate during 1995 and2007.
Despite being one of the headline indicators of the so-called EU2020 strategy,employment rates have not yet reached the envisaged target of 75 % of the workingpopulation (aged 20-64) in the Union to date. Latest available data for 2015 indicate thatonly Denmark, Estonia, Germany, the Netherlands, Sweden and the United Kingdomsurpassed this threshold. The average value for the EU-28 is 70.1 %.24
Cyclical elements (strong rebounds follow large decreases in employment) and individualmeasures (employment increases underpinned by short-term fiscal measures) havedriven employment growth in the last few years. Structural changes – such as thetransition from the manufacturing to the services sector, the increase of the share ofpart-time employment and the fall in employment protection – have also contributed,by shaping a more flexible labour market than before the crisis.25
Furthermore, specifically this increase in part-time contracts – which partly expressesbusinesses' need for flexibility due to the economic uncertainty they face – resulted inthe increase in headcount employment not been mirrored in increased hours worked by
24 Note that contrary to OECD calculations, the EU2020 indicator measures employment for a narrowerage group: ‘Increasing the employment rate of the population aged 20-64 to at least 75%’. This leadsto lower absolute values in the OECD case. See Eurostat. EU-data for 2016 are not yet available.
25 European Central Bank, The employment-GDP relationship since the crisis, ECB Economic Bulletin,Issue 6, 2016.

Economic and budgetary outlook for the European Union 2017 Page 13 of 69
employees. More worryingly, survey data by Eurofound covering the quality of workingconditions across the EU suggest that job insecurity remains at the same level as in 2010.Almost 20 % of all workers feel they could lose their job in the next six months.26
2.2.3. Public financesBoth the general government deficit-to-GDP and gross debt-to-GDP ratios in the euroarea continued to decline in 2016, driven by the ongoing economic expansion and verylow interest rates. These are projected to keep falling, albeit at a slower pace than inprevious years.
More specifically, the euro area deficit is expected to decrease from -1.8 % of GDP thisyear to -1.5 % in 2017 and 2018, while the EU-28 deficit is expected to decrease from -2 % in 2016 to -1.7 % in 2017 and -1.6 % in 2018 (for 2017 see Figure 4). The EuropeanCommission expects this reduction to be driven by a slower fall in the revenue-to-GDPratio,27 rather than a fall in generalgovernment expenditure-to-GDP ratio.28 Infact, the reduction derives from both higherprimary surpluses and a more favourablesnowball effect driven by reduced interestexpenditure, modest real GDP growth, andthe expected uptick in inflation (see below).
Similarly, the general government debt-to-GDP ratio is expected to continue itsdownward trend to 91.6 % in the euro area(86.0 % in the EU-28) in 2016, and isprojected to continue a gradual declineuntil 2018. In the euro area, it is forecastedto fall to 90.6 % in 2017 (85.1 % in the EU)and to 89.4 % in 2018 (83.9 % in the EU).Factors driving this reduction are higherprimary surpluses and the combined effectof reduced interest expenditure, modestreal GDP growth and a low increase ininflation.
Figure 4 displays the variety across the EUcountries. Projections for 2017 look most favourable for Germany (surplus of 0.4 %),Luxembourg (balanced 0.0 %), Sweden (-0.1 %), and Austria (-0.3 %). The other end ofthe spectrum predicts deficit values for Spain (-3.8 %), Romania (-3.2 %), Poland (-3.0 %),the United Kingdom (-2.6 %), and Italy (-2.4 %).
26 Latest available data from 2015. See Eurofound, Sixth European Working Conditions Survey: 2015(EWCS), Dublin, 17 November 2016.
27 Reflecting the reduced weight (as a percentage of GDP) of income taxes and social contributions,stemming from measures to reduce the tax burden on labour. The euro area government revenue-to-GDP ratio should fall from 46.2 % in 2016, to 46.1 % in 2017 and 45.9 % in 2018, while the EU-28government revenue-to-GDP ratio should fall from 44.9 % in 2016, to 44.9 % in 2017 and 44.7 % in2018.
28 Both in the euro area (from 48.0 % in 2016 to 47.7 % in 2017 and 47.4 % in 2018) and the EU (from46.9 % in 2016 to 46.6 % in 2017 and 46.3 % in 2018), because of reduced expenditure on socialtransfers, in turn due to the economic recovery and falling unemployment, wage bill moderation in thepublic sector and lower interest expenditure.
Figure 4 – Budget balance in the EU MemberStates, 2017 forecast, in %
Source: European Commission, autumn forecast,November 2016.

Economic and budgetary outlook for the European Union 2017 Page 14 of 69
2.2.4. Trade and developments at global levelIn 2016, trade between Member States remained resilient, but EU (and euro area)exports suffered from the current weakness of global trade. While world trade isprojected to strengthen gradually, its effects may be dampened by the increasingprotectionist sentiment in some EU Member States and in some of the EU's biggesttrading partners. While it is too early to evaluate the effects of 'Brexit', the significantdepreciation of the pound vis-à-vis the euro since the referendum will most likelyadversely affect Member States' exports to the UK, while uncertainty relating to the newrelationship the UK will forge with the EU is likely to impact negatively on trade flows.This decline reflects factors including lower social transfers because of fallingunemployment, wage bill moderation in the public sector, and lower interestexpenditure.
As for growth outside the EU, the Commission expects this to bottom out at 3.2 % in2016, marginally lower than in 2015, and to pick up modestly to 3.7 % in 2017 and 3.8 %in 2018. This recovery reflects the bottoming out of the downturn in many emergingmarket economies, but overall economic growth there is expected to remain below pasttrends.
In the USA, activity is expected to rebound in the second half of 2016 and to continue ata relatively robust pace in 2017, as the drag from destocking, past dollar appreciationand low energy prices gradually fades. Nevertheless, in 2018, expansion is set tomoderate as the economic cycle matures. In Japan, supportive macroeconomic policiesare expected to, temporarily, boost growth this year, before some of these effectsunwind and growth slows again in 2018. In China, growth is expected to ease to 6.0 % by2018, assuming that macroeconomic policies remain supportive and that currentfinancial fragilities remain under control. However, this outlook remains subject tosignificant and increasingly negative risks.
Finally, economic activity in emerging markets as a whole remains subdued. After severalyears on a downward trend, GDP growth appears to have bottomed out in 2015 (at 3.8 %,the weakest since 2009) and is set for a mild recovery in 2016 (to 4.0 %) and some furtherstrengthening in 2017 and 2018 (to 4.6 % and 4.7 %, respectively). This recovery, whichdrives the upswing in the global economy over the forecast horizon, depends to a largeextent on the assumption of a continued gradual increase in commodity prices, a 'softlanding' and orderly rebalancing in China, and progressive improvements in economiescurrently affected by economic, political and geopolitical stress.
2.3. Inflation and monetary policyInflation in the euro area remained low in 2016. While inflation stood at 0.3 % in January,falling energy prices led to negative values until June, before picking up again, reaching0.6 % in November.29 However, such ultra-low levels of inflation seem to have reached aturning point at the end of 2016. Eurostat data indicate a rise to 1.1 % in December 2016for the euro area and up to 1.2 % for the European Union as a whole.30
According to the ECB, inflation rates are likely31 to climb further to 1.3 % in 2017 and1.5 % in 2018, mainly driven by increasing energy prices.32 Apart from energy however,
29 ECB data.30 Eurostat, news release, Luxembourg, 18 January 2017. Annualised data.31 Based on the current prices of oil futures.32 ECB Economic Bulletin, Issue 8/2016 – Economic and monetary developments.

Economic and budgetary outlook for the European Union 2017 Page 15 of 69
low inflation rates in the EU also indicate significant slack in the labour market and aremirroring the long-term inflation expectations of customers. The current and projectedrise in consumer prices in the euro area might put the Member States in a difficultsituation.33 Ample spare capacity, for instance in the Italian and Spanish labour markets,implies that to return to the European Central Bank's target of close to 2 %, 'will requireother economies, notably Germany, to generate inflation rates well above 2 %'.34
The European Central Bank has continued with its unconventional monetary policy in2016, adding to its asset purchase programme bonds from the corporate sector.35 Underthis additional programme, launched in June 2016, the ECB purchased €51 billion ofcorporate bonds in six months, to strengthen the capacity of monetary policy toameliorate financing conditions in the real economy. At the same time, the bank has keptits other three programmes running, reaching total holdings of €1 477 billion inNovember 2016.36 While the pace of the purchases will decrease after March 2017 (from€80 billion per month to €60 billion), the programmes are set to continue at least untilDecember 2017.37
The programmes and the current level of very low interest rates contributed in a gradualrise in the growth rate of loans to the private sector38 (although the picture was morenuanced in 'vulnerable' southern Member States39), and to an increase in the issuanceof corporate bonds and equity. While the growth of funding from financial marketsshould continue in the next two years, sustained by the ECB's purchase programmes andby the expectations of further external corporate funding, further increases in banklending will strongly depend on the improvement of the state of the banking sector40 inmany Member States and, thus, the reduction of deleveraging in which banks arecurrently engaged.
The euro's exchange rate remained broadly unchanged in nominal effective terms overthe first three quarters of 2016. However, this stability masks significant swings inbilateral exchange rates, notably vis-à-vis the pound sterling and the Japanese yen onthe back of political uncertainty and changing expectations about the future path ofmonetary policy in the UK and Japan. While the euro did not show a clear trend against
33 C. Jones, Soaring eurozone inflation presents ECB with dilemma, Financial Times, 4 January 2017.34 The Economist, Inflation: a welcome revival, 14 January 2017.35 The ‘political’ dimension of how to fight deflationary tendencies is visible in the minutes of the ECB’s
December meeting of the governing council. European Central Bank, Account of the monetary policymeeting of the Governing Council of the European Central Bank, Frankfurt, 7-8 December, 2016.
36 €22.5 billion for the ABSPP, €202.7 billion for the CBPP3, €47.2 for the CSPP and €1 204.4 billion for thePSPP (November 2016 data).
37 In the words of the ECB ‘until the end of December 2017, or beyond, if necessary, and in any case untilthe Governing Council sees a sustained adjustment in the path of inflation consistent with its inflationaim’.
38 According to the Commission ‘In particular, annual growth of adjusted loans to households increasedto 1.8 % in September from 1.5 % in April and that to nonfinancial corporations to 1.9 % in September,from 1.2 % in April’.
39 The Commission notes, for instance, that Italy, Spain and Portugal still experienced negative annualgrowth rates of lending to nonfinancial corporations in 2016.
40 In this regard, the persisting amount of non-performing loans (NPLs) on many banks’ balance sheetsremains a major challenge. According to the European Banking Authority (EBA), the ratio of NPLs in theEU was 5.4 % in Q3/2016. See EBA, Risk Dashboard, London, 13 January 2017; M. Magnus andA. Duvillet-Margerit, Bank stress testing: stock taking and challenges, European Parliament/EGOV,Brussels 18 March 2016.

Economic and budgetary outlook for the European Union 2017 Page 16 of 69
the US dollar, fluctuating within the US$1.08-1.14 range over the last five months, theeuro strengthened against a number of other European currencies and most emergingmarket currencies.
2.4. Going forwardGiven the above situation and projected developments (fragile recovery, moderateuncertainty), the European Commission41 recommended a positive fiscal stance for theeuro area through a 'fiscal expansion of up to 0.5 % of GDP at the level of the euro areaas a whole' on 16 November 2016. In the report's accompanying document,42 theCommission further noted that an effective response to exiting the current situation ofsluggish demand growth and inflation below target despite record low monetary policyrates could be 'coordinated action to mobilise resources for public and privateinvestment and support the recovery'. While fiscal policies remain mainly within EUMember States' remit, they are increasingly coordinated at EU level through processessuch as the European Semester.43
3. EU budget in perspectiveThe EU budget represents a limited share of public spending in the European Union, buthas features that can increase its impact. Challenges emerging in recent years havewidened the debate on the budget's role and its possible reform.
3.1. Size and the role of the EU budgetAmounting to €145.2 billion in 2015, the EU budget is around 1 % of the EuropeanUnion's gross national income (GNI), while Member States' public spending represents,on average, 49 % of their GNI. The EU budget therefore amounts to some 2 % of totalpublic spending in the European Union (see Figure 5), reflecting the fact that spendingcompetences and resources in most policy areas are mainly at national and/or locallevels. These data show a situation very different from that of federal entities, wherefederal spending usually represents at least some 50 % of final public spending (or15-20 % of gross domestic product) in decentralised models, such as the USA.44
Figure 5 – EU budget and general government public spending in the EU (2015, € billion)
Source: EPRS, based on European Commission (DG Budget and Eurostat) data.
41 European Commission, Towards a positive fiscal stance for the euro area, COM(2016) 727 final,Brussels, 16 November 2016.
42 European Commission staff working document, Report on the Euro Area concerning theRecommendation for a Council Recommendation on the economic policy of the euro area, SWD(2016)391 final, Brussels, 22 November 2016.
43 J. Angerer and M.T. Bitterlich, 2017, Key features of 2017 Draft Budgetary Plans, European Parliament,EGOV, Brussels, 9 January 2017.
44 C. Cottarelli and M. Guerguil (eds.), ‘Designing a European Fiscal Union. Lessons from the experienceof existing federations’, Routledge, 2015. The authors examine the budgetary arrangements betweenthe central and subnational level of government in a sample of 13 federations (all those with a nominalGDP higher than US$400 billion in 2011).

Economic and budgetary outlook for the European Union 2017 Page 17 of 69
Analysts45 note that, to date, the EU budget has played two of the three functions thateconomic theory traditionally attributes to public finance: the provision of public goods(e.g. promotion of research and innovation activities); and some redistribution ofresources to reduce disparities,46 in line with the objectives of economic, social andterritorial cohesion between EU regions enshrined in the Treaty on the Functioning ofthe European Union (TFEU).47 The two functions do not exclude each other, since a policyarea with redistributive objectives, such as cohesion, can also provide public goods.
Studies often draw attention to the relatively small size of the EU budget, concluding thatthis and other features limit its overall capacity to provide public goods and to play aredistributive role. For example, one paper48 estimates that the annual redistribution ofresources operated by the EU budget over the last 15 years corresponds to 0.2 % of thearea's GNI,49 as compared to 1.5 % for the federal budget in the USA. In other words,80 % of the resources returned to the same Member State that provided them.
However, the role that the EU budget can play in the economy, and the achievement ofEU policy objectives due to a number of its characteristics, should not beunderestimated. Examples include the share of the EU budget devoted to investments(as compared to national budgets, where most resources are usually allocated forconsumption and transfers), its capacity to leverage complementary sources of financing(e.g. through innovative financial instruments), and to achieve advantages such aseconomies of scale in policy areas where the pooling of resources at EU level may helpto meet objectives more effectively (e.g. in the field of development cooperation withthird countries).
In some countries, the EU budget may represent a significant source of resources forinvestment.50 For example, in 12 Member States, mainly among those which joined theEuropean Union after April 2004, the EU budget, as a share of total public spending, issignificantly higher than 2 %, with figures ranging between 4.85 % for Slovenia and12.90 % for Bulgaria (Figure 6).51
45 A. Bénassy-Quéré, X. Ragot, G. B. Wolff, Which Fiscal Union for the Euro Area?, Les notes du conseild'analyse économique, No 29, Paris, February 2016.
46 The third function, which is not covered by the EU budget, is macroeconomic stabilisation.47 Part Three, Title XVIII, TFEU.48 P. Pasimeni, S. Riso, The redistributive function of the EU budget, IMK – Hans-Böckler-Stiftung, Working
Paper No 174, November 2016.49 In recent years, the figure has reached 0.3 % as a consequence of an increasing diversity in the EU,
determined on the one hand by the accession of 13 Member States with lower per capita income as of2004, and on the other by growing divergence in economic performance and unemployment ratesfollowing the financial and economic crisis.
50 While the European Commission publishes the allocation of expenditure to Member States, itunderlines that this is only an accounting exercise, which does not provide a complete overview of thebenefits that each Member State derives from EU membership: Annex 1 recapitulates this allocationfor each major category of EU spending in 2015.
51 The group also includes some pre-2004 Member States. For example, the case of Luxembourg (7.10 %)is mainly explained by the size of the country, its role as host to a number of EU institutions, and theadministrative expenditure attributed to the country on this basis. As for the EU budget, the graph doesnot include either spending in countries outside the EU or spending which could not be attributed toindividual Member States. In 2015, this figure amounted to €15.1 billion.

Economic and budgetary outlook for the European Union 2017 Page 18 of 69
Figure 6 – EU budget as a share of public spending in individual Member States (2015)
Source: EPRS, based on European Commission (DG Budget and Eurostat) data.
In addition, when focusing on investments only, the contribution of the EU budget topublic investment in the Union is higher: according to the European Commission,2007-2013 cohesion policy alone represented 6.5 % of government capital investment inthe Union on average, with peaks over 50 % in four Member States (Hungary, Latvia,Lithuania, and Slovakia).52 As regards investment in research and innovation,Horizon 2020 is the world's largest transnational programme devoted to such activities:in 2015, the largest recipients were the United Kingdom, Germany, the Netherlands,France and Belgium (in decreasing order according to the total amount beneficiarieslocated in their territories received from the programme).
In this perspective, the European Commission stresses53 that the EU budget is differentin nature and function from national budgets, since it is mainly an investment budgetwith a focus on measures with European added value. The current multiannual financialframework (MFF), which sets the EU budgetary structure for the 2014-2020 period, seeksto focus spending priorities on sustainable growth, employment and competitiveness,pursuant to the objectives of the Europe 2020 strategy and in line with the priorities ofthe Juncker Commission.54
Co-financing is a characteristic of the EU budget that can increase its impact on jobcreation and growth. This means that EU spending is normally used in conjunction withfunding from other public and/or private sources, thus resulting in total investmentshigher than the EU contribution proper. To some extent, this is already the case fortraditional grants. In addition, with a view to maximising the so-called multiplier effectof the EU budget, innovative financial instruments (triggering equity, quasi-equity, debtor guarantee funding) have been developed to support economically viable investmentsin line with EU objectives.
52 Commissioner C. Creţu, Cohesion policy: Delivering added value to the EU and its citizens, presentationgiven at the EU budget focused on results conference, 27 September 2016. It should also be noted thatthe benefits of cohesion policy are not limited to the Member State directly receiving the resources,since projects implementing the programmes may be awarded to companies from other MemberStates.
53 European Commission staff working paper, The added value of the EU budget (SEC (2011)0867),29 June 2011.
54 The ten priorities of the Juncker Commission are jobs, growth and investment; the digital single market,the energy union and climate; a deeper and fairer internal market; a deeper and fairer economic andmonetary union; a balanced EU-US free trade agreement; justice and fundamental rights; migration;the EU’s external action; and democratic change.

Economic and budgetary outlook for the European Union 2017 Page 19 of 69
While innovative financial instruments are not deemed to fit all kinds of public spending,they have features that make them attractive for some policy areas and objectives,notably by: 1) attracting additional funding from other sources (leverage effect); and2) generating income through amounts repaid by beneficiaries of funding that can beused for new operations in line with the same policy objectives (revolving nature of theinstruments). The leverage effect can vary significantly from one instrument to another.For example, the European Progress Microfinance Guarantee Facility has an estimatedleverage effect of 13: this means that the €23.6 million funded by the EU budget shouldmobilise additional financing from other sources, resulting in a total of €284.9 millionavailable for final beneficiaries of the scheme.55
The High-Level Group on own resources (see Section 5.2) notes that, based on a study56
it commissioned, wealthier Member States have a comparative advantage in attractingresources linked to the main financial instruments.57 Therefore, the distribution of suchresources differs from that in traditional EU spending areas (e.g. cohesion andagriculture). Due to the leverage effect and the revolving nature of these instruments,this confirms that the standard representation of the allocation of EU expenditure toMember States (see Annex 1) provides only a partial picture of the overall benefitsderiving from the EU budget and EU membership.58
In some policy areas, the pooling of resources at EU level may bring advantages such aseconomies of scale and elimination of duplication, producing EU added value andenabling a more effective achievement of results. For example, the OECD considers thegeographic reach, scale and scope of EU programmes as three comparative advantagesof the EU in development cooperation.59 The EU and its Member States are the world'sbiggest development aid donor. However, in addition to EU programmes, Member Stateschannel development assistance by means of national and/or intergovernmentalschemes. According to cost of non-Europe papers drafted for the European Parliamentin 2013, further coordination of EU donors could save some €800 million per year inoverhead costs associated with activities such as programming, implementation andmonitoring of assistance, while increasing the overall impact of development actions.60
In conclusion, the EU budget is relatively small in size, but has features that can reinforceits overall impact. Nevertheless, in the debate on the preparation of the post-2020financing period, many analysts and stakeholders agree that, while the EU budget hasalready undergone many changes, it needs further modification and streamlining toincrease its capacity to respond to the concerns of EU citizens and to the unprecedented
55 For more details on the advantages and challenges of financial instruments, please see: EuropeanCommission staff working document, Activities relating to financial instruments, (SWD(2016) 335),24 October 2016; and European Court of Auditors, Implementing the EU budget through financialinstruments – lessons to be learnt from the 2007-2013 programme period (Special Report No 19/2016).
56 J. Núñez Ferrer, J. Le Cacheux, G. Benedetto and M. Saunier, Study on the potential and limitations ofreforming the financing of the EU budget, 3 June 2016, CEPS, Université de Pau et des Pays de l’Adour,LSE Enterprise and Deloitte.
57 High Level Group on Own Resources, Future financing of the EU: Final report and recommendations,December 2016.
58 See footnote 50.59 European Union – DAC Peer Review of Development Co-operation, Organisation for Economic
Cooperation and Development, 2012.60 M. Nogaj, The Cost of Non-Europe in Development Policy: Increasing coordination between EU donors,
European Parliament, European Added Value Unit, 2013; A. Bigsten, Quantifying the economic benefitsof increased EU donor coordination, 2013.

Economic and budgetary outlook for the European Union 2017 Page 20 of 69
challenges the EU is facing. For example, an analysis by the CEPS think-tank61 argues thatthere is a need to clarify the key objectives of the EU budget in today's world, movingfrom a perspective in which each Member State is mainly interested in its net balance,to an approach where the EU budget complements national budgets and furtherincreases its focus on EU objectives that can be better achieved at EU level.
3.2. Structure of the EU budget: revenue and multiannual planningThe 'own resources' system sets out how the EU budget is financed, while the structureof the expenditure side of the budget is determined, for a period of at least five years,by a multiannual planning tool – the multiannual financial framework (MFF).
Unlike national budgets, the EU budget cannot run a deficit. Its financing is ensured bythree main sources of revenue: 1) traditional own resources (customs duties and sugarlevies); 2) an own resource based on a harmonised base of value added tax (VAT); and3) an own resource linked to Member States' GNIs, which plays the role of balancing thebudget. The maximum level of resources available for the EU budget is set at 1.23 % ofEU GNI (the 'own resources ceiling', which has remained virtually unchanged since the1990s).62
Currently, the bulk of revenue (more than 80 %in 2015, see Figure 7) is provided by a GNI-based resource and a VAT-based resource,which Member States perceive as nationalcontributions rather than EU own resources.According to a number of analysts andstakeholders, including the EuropeanParliament (EP), this contributes to a focus inbudgetary negotiations on Member State netbalances and programmes with geographicallypre-allocated expenditure. In the currentconfiguration of the system,63 permanentand/or temporary correction mechanismsreduce the contributions of the followingMember States: Austria, Denmark, Germany,the Netherlands, Sweden and the UnitedKingdom.64 Annex 2 recapitulates nationalcontributions by Member State and traditional own resources collected on behalf of theEU in 2015.
As for the expenditure side of the budget, the 2014-2020 MFF sets the maximum levelof resources ('ceiling') for each major category ('heading') of EU spending for a period ofseven years. Negotiated between 2011 and 2013 against the backdrop of the economiccrisis and fiscal consolidation in Member States, the current MFF is the first to have lower
61 J. Núñez Ferrer, The Multiannual Financial Framework post-2020: Balancing political ambition andrealism, CEPS Policy Paper No 2016/2, 18 November 2016.
62 For more details on the system: A. D’Alfonso, How the EU budget is financed. The ‘own resources’system and the debate on its reform, European Parliament, EPRS, 2014.
63 Council Decision of 26 May 2014 on the system of own resources of the European Union (2014/335/EU,Euratom).
64 A. D’Alfonso, The UK 'rebate' on the EU budget: An explanation of the abatement and other correctionmechanisms, European Parliament, EPRS, 2016.
Figure 7 – EU revenue in 2015
Data source: European Commission, see Annex 2.

Economic and budgetary outlook for the European Union 2017 Page 21 of 69
resources in comparison with the previous programming period (2007-2013). The shareof EU GNI devoted to the MFF was set at 1 % for commitments and 0.95 % for payments(down from 1.12 % and 1.06 % for 2007-2013).
The MFF resources for commitments over the entire 2014-2020 period amount to€1 087.1 billion in current prices (or €963.5 billion in 2011 prices). Figure 8 shows theirdistribution among the six major categories of EU spending (one category has twosubcategories or 'subheadings'). The MFF details the annual ceilings for newcommitments in each spending category and an overall ceiling for annual payments. Inaddition, it contains some special instruments outside the MFF ceilings (e.g. theEmergency Aid Reserve, the European Globalisation Adjustment Fund and the EuropeanUnion Solidarity Fund) and flexibility provisions, to give some room for manoeuvre in thecase of unexpected events. The challenge is to strike the right balance betweenpredictability of investments and the capacity to address the unforeseen events and newpriorities, which can emerge during a rather long programming period.
Figure 8 – 2014-2020 multiannual financial framework by heading (€ billion, current prices)
Data source: EPRS, based on European Commission.
3.3. Main institutional actors in two key phases of the budgetary cycleThe European Parliament (EP) and the Council of the European Union are the two armsof the EU budgetary authority. Among other tasks, they intervene at the authorisationstage, establishing the annual EU budget and its amendments, which they negotiate onthe basis of a proposal from the European Commission and within the requirements setout by the own resources system and the MFF Regulation (see Section 3.2 above).
The EP and the Council's powers differ depending on the issue at stake, for the annualbudgetary procedure they enjoy an equal footing. The decision on the design of the ownresources system requires the unanimity of the Member States in the Council, while theEP is only consulted. The Council also unanimously adopts the regulation establishing theMFF, but in this case needs to obtain the EP's consent beforehand.
This asymmetry in the powers of the two arms of the budgetary authority is said tosharpen the differences in their perspectives on budgetary issues.65 In addition, the
65 See for example: B. Patterson, Understanding the EU budget, 2011.

Economic and budgetary outlook for the European Union 2017 Page 22 of 69
requirement of unanimity in the Council for the adoption of own resources and the MFFis often seen as an obstacle to major EU budget reform. While the budget has beenmodified over the years, stakeholders generally acknowledge that further changes areneeded.66 However, the veto power enshrined in the procedures would tend to favourthe continuation of the status quo, which has up to now ensured an equilibrium betweenMember States that join forces in subgroups sharing the same interests (e.g. debates onbudgetary negotiations often refer to groups, such as net contributors and netbeneficiaries; and 'friends of cohesion', 'friends of better spending or correctionmechanisms', and 'friends of agriculture'). The European Parliament has long pushed forEU budgetary reform, including in areas where its powers are more limited, such as ownresources and the MFF, with the aim of shifting the focus of budgetary discussions tomeasures with EU added value.67
As regards the implementation stage, the European Commission is ultimatelyresponsible for the execution of the EU budget. However, implementation involves awide range of actors under the three different management modes set out by the EUFinancial Regulation. In practice, Member States implement some 80 % of the EU budgetin 'shared management' with the European Commission, which applies to mostexpenditure under subheading 1b 'Economic, social and territorial cohesion' andheading 2 'Sustainable growth: natural resources'. The remaining 20 % of the budget isimplemented either under 'direct management' (European Commission and EUexecutive agencies) or under 'indirect management' (other entities such as third-countryauthorities, international organisations, EU decentralised agencies and the EuropeanInvestment Bank).
3.4. Challenges in recent yearsSince the beginning of the 2014-2020 programming period, the EU budget has beenconfronted with a number of challenges, including: constant pressure on the 'securityand citizenship' and 'global Europe' headings in the context of growing instability in theEU's neighbourhood, the migration crisis, and security threats; a continued significantinvestment gap in the EU many years after the outbreak of the financial and economiccrisis; and a high abnormal payments backlog at the end of both 2014 and 2015.
The response of EU institutions and Member States to such challenges has included alarge resort to the resources available under the relevant flexibility provisions of the MFFand the creation of budgetary tools at least partially outside the EU budget, which try toleverage funding from other public and/or private sources (e.g. the European Fund forStrategic Investments (EFSI) to address the investment gap; and EU Trust Funds and theFacility for Refugees in Turkey to deal with the migration crisis).
Furthermore, efforts to tackle the euro crisis and strengthen European monetary unionhave raised discussion of the possible role of the EU budget. However, in its currentconfiguration, the EU budget is deemed unable to play a stabilisation role in the case ofeconomic shocks, due to its size and limited flexibility in the context of MFF planning (see
66 See for example: Dutch Presidency of the Council, Towards a forward-looking and flexible MultiannualFinancial Framework, Presidency report, 30 May 2016.
67 See for example: EP resolution of 6 July 2016 on the preparation of the post-electoral revision of theMFF 2014-2020: Parliament’s input ahead of the European Commission’s proposal (P8_TA(2016)0309).

Economic and budgetary outlook for the European Union 2017 Page 23 of 69
Sections 3.1 and 3.2 above). One idea proposed is the creation of a specific 'fiscalcapacity' for the euro area as a subsection of the EU budget itself.68
4. EU budget 2017On 1 December 2016, the European Parliament69 confirmed a deal, reached in theConciliation Committee, on the general budget of the EU for the 2017 financial year.According to Kristalina Georgieva – at that time the Commissioner responsible for the EUbudget – this year's budget will '...help buffer against shocks, providing a boost to oureconomy and helping to deal with issues like the refugee crisis'.70 Although the totalamount of commitments agreed, expressed as a share of the EU-28 GNI, does not differvery much from the 2016 budget, changes can be seen in the details of the distributionof the resources between different EU priorities, as well as between the levels ofcommitment and payment appropriations under individual headings and programmes.In order to finance growing needs in some areas, especially those related to migration,the refugee crisis and security issues, the budgetary authority had to resort extensivelyto the flexibility tools provided for in the MFF Regulation.
4.1. Result of the budgetary procedureTotal commitments of the 2017 EU budget were set at €157.86 billion and totalpayments at €134.49 billion (€155.28 billion and €136.64 billion in 2016 respectively).The 2017 budget commitments represent about 1.05 % of the EU-28 GNI, which isslightly less than in 2016 (for detailed figures see Annex 3).
Figure 9 – 2017 EU budget (commitments, € billion, current prices)
Source: A. D'Alfonso, Conciliation agreement on the 2017 EU budget, 28 November 2016, EPRS.
Based on the proposal and the amending letter 1/2017 from the European Commission,the budget was negotiated in the annual budgetary procedure between the Parliamentand the Council (see Box 1 below). The overall figures of the adopted budget are close tothe initial proposal of the European Commission (presented on 30 June 2016), which hadbeen cut by the Council and increased by the Parliament in their respective readingsduring the procedure leading to adoption (Figure 9 above). However, the distribution ofresources changes partially in comparison with the draft budget tabled by theCommission in July 2016.
68 A. D’Alfonso and A. Stuchlik, A fiscal capacity for the euro area?, European Parliament, EPRS,September 2016.
69 Data on leading EP committees involved in budgetary procedures are available in Annex 4.70 European Commission, Press release, IP/16/3743, Brussels, 17 November 2016.

Economic and budgetary outlook for the European Union 2017 Page 24 of 69
Box 1 – 2017 budgetary procedure milestones
July 2016: The European Commission tables the draft EU budget for 2017.
September 2016: The Council formally adopts its position on the draft 2017 EU budget.
October 2016: The European Parliament amends the Council's position on the draft 2017 EUbudget.
October 2016: The European Commission tables modifications to its proposal for next year's EUbudget by means of amending letter (AL) 1/2017.
Amendments proposed in the amending letter 1/2017:
1) phasing-in of higher allocations proposed in the mid-term review/revision for the'Competitiveness for growth and jobs' subheading;
2) higher allocations to address the root causes of migration under the 'Global Europe' heading;
3) the update of the estimated needs for agricultural expenditure and fisheries;
4) administrative technical adjustments (e.g. increase of staff resources for Europol, to reinforceits capacity to provide operational support).
November 2016: European Parliament and Council negotiators agree on a joint text (taking intoaccount AL 1/2017) within the conciliation procedure.
December 2016: The EP approved the joint text agreed by the Conciliation Committee.
Stimulating growth and creating new jobs, especially for young people, as well asaddressing the migration crisis and security issues are the focus of the EU budget in 2017.Following an announcement in the mid-term review/revision of the MFF and theamending letter 1/2017, it was decided that actions in these areas be reinforced incomparison to the European Commission's initial proposal in the draft general budget2017. The additional commitment appropriations were allocated to subheading1a 'Competitiveness for growth and jobs' and heading 4 'Global Europe'. As a result, incomparison with the budget for 2016, total commitments in 2017 increased by 1.7 %. Tothe contrary, total payment appropriations decreased by 1.6 %. This is mostly due to thesignificant drop in payments needs (11.2 %) under subheading 1b 'Economic, social andterritorial cohesion' (figure 10).

Economic and budgetary outlook for the European Union 2017 Page 25 of 69
Figure 10 – A comparison of EU budgets in 2016 and 2017 (commitment and paymentappropriations, € billion)
Source: European Commission, DG Budget, 2016.
Since the beginning of the current financial period, the EU budget has had to deal withmany unforeseen circumstances and crises. Extraordinary resources had to be redirectedto actions aimed at dealing with migration and refugee issues, neighbourhood policy,employment, and investment policy. As a result, the implementation of annual budgetswithin MFF limitations and ceilings proved challenging. In this respect, the 2017 budgetis no different. In order to finance 2017 budget priorities and reinforcements, and giventhe exhaustion of resources under some headings, it was necessary to extensively utilisethe 2014-2020 MFF's unallocated margins and flexibility provisions. From the moment ofadoption of the 2017 budget it was decided to mobilise three of these: the Global Marginfor Commitments, the Flexibility Instrument, and the Contingency Margin (Table 1).
Specified in Articles 9 to 15 of the MFF Regulation, these special flexibility instrumentscan be applied when an expenditure cannot be financed within the limits of the ceilingsavailable under the headings. However, the additional amounts that can be mobilisedunder these instruments are limited, and what was previously available has already beenused (Annex 5).71 Such intensive recourse to the flexibility tools as early as the first halfof the current MFF does not leave much room for adjustment in the years remaining to2020.
71 The possibility to shift available margins between headings and years, known as ‘the flexibility’, was animportant issue during the negotiations on the MFF 2014-2020. The EP strongly supported enforcedflexibility provisions and the relevant articles introduced in the MFF Regulation are an importantnegotiation achievement. These were already very useful during the first years of implementation ofthe current MFF. In its mid-term review/revision, the European Commission therefore proposed toexpand the flexibility instruments and thereby increase the capacity of the EU budget to respond tounexpected challenges and new priorities (see Section 5.1.).

Economic and budgetary outlook for the European Union 2017 Page 26 of 69
Table 1 – Flexibility tools mobilised with the adoption of the 2017 EU budget
Instrument Amount mobilised Goal
Global Margin for Commitments €1 439.1 million
To finance additional allocationsunder subheading 1a'Competitiveness for growth andjobs'
Contingency Margin €1 906.2 million72To finance heading 3 'Security andcitizenship' (€1 176 million) and4 'Global Europe' (€730.1 million)
Flexibility Instrument €530 million73To address the migration andrefugee crisis under heading 3'Security and Citizenship'
Source: EPRS, based on data from the European Parliament Legislative Observatory, 2016.
4.2. Budget headings in detailHeading 1 'Smart and inclusive growth' is the largest in the 2014-2020 MFF (47 %) andfinances investments in EU priority areas in the Member States and their regions. It isdivided into subheading 1a 'Competitiveness for growth and jobs' and subheading1b 'Economic, social and territorial cohesion'.
Figure 11 – Subheading 1a Competitiveness for growth and jobs, 2017 commitmentappropriations
Source: EPRS, based on European Commission data. Figures for the 2017 budget were approved, and await finalpublication in the Official Journal of the European Union, see also Annex 3.
Subheading 1a includes EU investments in research and innovation, education andtraining, trans-European networks in transport, communication and energy, social policyand development of enterprises. It finances such programmes and instruments asHorizon 2020, the EFSI, Connecting Europe Facility and Erasmus+.
Compared with the previous year, the commitment appropriations under subheading 1ain 2017 increased by 12.1 %. This is a demonstration of the EU's determination toreinforce investment in the areas conducive to growth and jobs. In total, an additional€200 million were allocated to the following programmes: Horizon 2020 for research andinnovation (€50 million), COSME programme for small business (€50 million), ConnectingEurope Facility – Energy (€50 million) and Erasmus+ (€50 million). These programmeshave been very successful in attracting many, high-quality applications. However, due to
72 This amount will be partly offset against the unallocated margin under heading 2 ‘Sustainable Growth:Natural Resources’ (€575 million in 2017) and partly against the unallocated margins under heading 5‘Administration’ (€507.3 million in 2017, €570 million in 2018 and €253.9 million in 2019).
73 This mobilisation exhausted the available amount under this instrument in 2017.

Economic and budgetary outlook for the European Union 2017 Page 27 of 69
the lack of resources, only part of the positively evaluated proposals could be financed.74
The decision to allocate additional resources to the subheading should allowimprovements to the impact of the programmes.75 The increases are part of a financialpackage proposed in the mid-term review/revision of the MFF. It will be financed fromthe unallocated margins in subheading 1a and the Global Margin for Commitments.
Another fund included in subheading 1a, and of growing importance for investmentstimulation, is the European Fund for Strategic Investments (EFSI). Given the fund'ssuccessful implementation since it was established in 2015, the European Commissionproposed in its mid-term review/revision of the MFF to double its duration and size. Inthe 2017 budget the commitments for EFSI amount €2.66 billion (see Section 6.2.2).
Figure 12 – Subheading 1b Economic, social and territorial cohesion, 2017 commitmentappropriations
Source: EPRS, based on European Commission data, see above and Annex 3.
This subheading covers EU expenditure on cohesion policy and supports harmoniouseconomic, social and territorial development of EU regions and cities. Most of theexpenditure in the subheading is pre-allocated to the Member States and implementedthrough the European Structural and Investment (ESI) Funds, i.e. the European RegionalDevelopment Fund (ERDF), European Social Fund (ESF) and Cohesion Fund.76 Besides,the subheading includes specific contributions to the Connecting Europe Facility and theYouth Employment Initiative.
Late agreement on the 2014-2020 MFF triggered a significant delay to the start of the ESIFunds implementation cycle. Moreover, implementation of the 2007-2013 MFFprogrammes is coming to an end. As a result, the Commission estimated that paymentneeds in 2017 will be relatively low. The 2017 EU budget therefore includes a significant(11.2 %) drop in payment appropriations under subheading 1b. This mostly affects theprogrammes in less developed regions and investments under the Cohesion Fund.However, it is expected that in the course of the year absorption of the funds willimprove. This should result in an increased volume of payment claims and a growingpressure on payment appropriations in the following years.77
As promoting youth employment remains an important challenge for many regions inthe EU, the conciliation agreement on the 2017 budget provides for the continuation of
74 For example, less than one third of the proposals in the Horizon 2020 programme could be financed.European Commission SWD(2016) 299 final, 14 September 2016 p. 7.
75 Amending letter No 1 to the Draft General Budget 2017, COM(2016) 679 final.76 The remaining two out of five ESI Funds are the European Fund for Rural Development (EFRD),
European Maritime and Fisheries Fund (EMFF) and are included under heading 2 ‘Sustainable growth:natural resources’.
77 European Commission SWD(2016) 299 final, 14 September 2016. The question of payments needs andthose forecast up to the end of the 2020 is discussed further in Section 5.1 of the study.

Economic and budgetary outlook for the European Union 2017 Page 28 of 69
the Youth Employment Initiative (YEI). The specific, supplementary allocation for the YEIwill amount to €500 million. Introduced in an amending budget in the course of 2017, itwill be financed by the Global Margin for Commitments (see Box 2).
Box 2 – Continuation of the Youth Employment Initiative 2017-2020
The YEI was created to support young, unemployed people living in regions with youthunemployment rates over 25 %. Originally, the allocation for the programme was frontloaded to2014 and 2015. Based on the European Commission's proposal, presented in the mid-termreview/revision of the MFF, the YEI would continue with an extra €1 billion over 2017-2020 (andcoupled with a corresponding amount from the ESF). As part of this overall increase, theconciliation agreement on the 2017 budget provided €500 million, which will be financed by theGlobal Margin for Commitments. Continuation of the YEI has strong support from the EuropeanParliament (see Section 5.1.).
Apart from the changes mentioned above, subheading 1b of the 2017 budget includesthe technical upward adjustment of the ceilings in line with movements in the MemberState's GNI. The MFF Regulation provides for this operation, and its financial impact isspread in equal tranches over 2017-2020 (see Box 3).
Box 3 – Technical adjustment of heading 1b allocations for 2017-2020
In accordance with Article 7 of the MFF Regulation, taking the most recent statistics on evolutionof Member States' and regions' GNI into account, the European Commission reviewed allocationsfor the European Regional Development Fund, European Social Fund and Cohesion Fund(excluding allocations for European Territorial Cooperation) for 2017-2020. As a result, theceilings of subheading 1b were modified. The commitment appropriations increased by€4 642 million (current prices), and payment appropriations by €1 367 million over the 2017-2020 period. Consequently, the allocation for 11 Member States increased (for instance Greece,Italy, and Spain) and reduced for five (Czech Republic, Estonia, Hungary, Slovakia, and Sweden).There was no change in allocation for 12 countries. The European Commission encourages theMember States that benefit the most from the adjustment to spend the additional resources onmigration-related actions, youth employment programmes and on actions promotinginvestments in combination with the EFSI.78
Figure 13 – Heading 2 Sustainable growth: natural resources, 2017 commitmentappropriations
Source: EPRS, based on European Commission data, see above and Annex 3.
This heading covers EU expenditure on the common agricultural policy, commonfisheries policy, rural development, and environmental measures. It includes such fundsas the European Agricultural Guarantee Fund (EAGF), European Agricultural Fund forRural Development (EAFRD), European Maritime and Fisheries Fund (EMFF) and LIFEprogramme (environment and climate action).
78 Source: European Commission, COM(2016) 311 final, 30 June 2016.

Economic and budgetary outlook for the European Union 2017 Page 29 of 69
Apart from pre-programmed commitments for market measures, direct payments andrural development programmes implemented through the EAGF, EAFRD and EMFF, theagreement on the 2017 budget provides for exceptional support for EU farmersexperiencing difficulties. Amounting to €500 million, this assistance is a continuation ofthe package agreed in July 2016, and was included in amending letter 1/2017. Thesupport is targeted at farmers still suffering from the crisis triggered by the Russian banon imports from the EU and the end of milk quotas in 2015. Of this amount, €150 millionis dedicated to supporting the dairy sector, with €350 million for livestock sectors.79
The conciliation agreement also includes a joint statement of the European Parliament,Council and Commission, in which they confirm that the margin under heading 2 issufficient to address possible unforeseen needs and can be mobilised if required.
Figure 14 – Heading 3 Security and citizenship, 2017 commitment appropriations
Source: EPRS, based on European Commission data, see above and Annex 3.
Representing only about 2.7 % of the total EU budget in 2017, heading 3 is the smallestin the MFF. At the same time, it finances EU actions of high and growing importance,such as border protection, migration and asylum policy, public health, consumerprotection, culture, youth, information and dialogue with citizens. Spending related tomigration, refugees and security represent most of this heading in 2017. The biggestfunds under this heading are the Asylum, Migration and Integration Fund (AMIF) andInternal Security Fund (ISF).
Since the beginning of the current programming period, the financial needs of theprogrammes under heading 3 have been extraordinary. To provide the necessaryresources, flexibility tools had to be mobilised as early as in 2015 and 2016. The amountsavailable under the annual ceiling also proved to be insufficient for 2017 needs andfurther implementation of actions in the field of migration, refugees and security is onceagain only possible through the use of the MFF's flexibility provisions. In 2017, therefore,some 40 % of expenditure under heading 3 will be financed via the Flexibility Instrument(€530 million) and the Contingency Margin (€1 176 million).
EU actions planned for implementation in 2017 will focus, for example, on support forMember States to tackle migration and asylum problems, protect external borders andthe Schengen area, as well as on a number of measures to deliver on the EuropeanAgenda on Security (as part of the fight against terrorism and cybercrime). Apart from
79 In 2017, commitments under heading 2 decreased by 6.2 %. According to the European Commission,this is the ‘technical’ result of reprogramming unspent commitments from 2014 to 2016. Thereprogramming was agreed in the revision of the MFF approved in 2015 (in accordance with Article 19of the MFF Regulation). Without this effect, the commitments under heading 2 increase by 1.3 %. See:Statement of estimates of the European Commission for the financial year 2017, SEC(2016)280,June 2016.

Economic and budgetary outlook for the European Union 2017 Page 30 of 69
this, the 2017 budget provides for a 25.3 % rise in payment appropriations to meet thegrowing payment needs of the actions launched since 2014.
Figure 15 – Heading 4 Global Europe, 2017 commitment appropriations
Source: EPRS, based on European Commission data, see above and Annex 3.
Heading 4 covers external actions of the EU, focusing on development assistance,humanitarian aid and the EU Common Foreign and Security Policy. The programmesunder the heading promote democracy and peace, poverty reduction, and solidarity inneighbouring countries. The largest instruments are the Development CooperationInstrument (DCI), European Neighbourhood Instrument (ENI) and Instrument for Pre-accession assistance (IPA).80
Expenditure included under heading 4 plays an important role in addressing the externaldimension of the refugee crisis. As in the case of heading 3, the ceilings agreed under theMFF also proved to be insufficient. To finance the growing needs under the 2017 budget,additional appropriations – €730.1 million – had to be made available throughmobilisation of the Contingency Margin.
Expenditures secured under the heading in 2017 will continue to support developmentcooperation, humanitarian aid, and addressing the refugee crisis and the root causes ofmigration. Commitments under heading 4 will increase by 10.9 %, mainly because of thereinforcements in the IPA in relation to the recently established Facility for Refugees inTurkey (€750 million).81 The budgetary authority also decided to secure €275 millionunder the 2017 budget for the new European Fund for Sustainable Development (EFSD)Guarantee Fund. Proposed in the mid-term review/revision of the MFF 2014-2020, theEFSD aims to catalyse investment from public and private sources to tackle root causesof migration in the European neighbourhood and Africa. The legal act setting up the EFSDis in preparation.82
80 Apart from the programmes and funds allocated under heading 4, EU Member States also providefinancial support to third countries and regions through the European Development Fund (EDF). Thisintergovernmental fund, however, is not part of the EU budget.
81 At the same time, payment appropriations decrease by 6.6 %. This is explained by the fact that the2016 budget had to absorb an abnormal payments backlog, making the 2016 figure exceptionally high.The situation is expected to return to normal in 2017. See: Statement of estimates of the EuropeanCommission for the financial year 2017, SEC(2016)280, June 2016, p. 64.
82 Legislative Observatory 2016/0281(COD).

Economic and budgetary outlook for the European Union 2017 Page 31 of 69
Figure 16 – Heading 5 Administration, 2017 commitment appropriations
Source: EPRS, based on European Commission data, see above and Annex 3.
Heading 5 covers the administrative expenditure of all EU institutions, pensions forformer staff and former Members of the institutions, as well as financing for Europeanschools. The amount secured for this purposes in the 2017 budget remains stable anddoes not differ significantly from 2016.
The 2017 budget for the EU administration reflects the efforts to reduce staffing levelsand introduce rationalisation and savings.83 Drivers of the slight increase inappropriations under heading 5 include the increase of pensions for former staff andMembers (due to the growing number of pensioners expected), and the introduction ofexceptional security measures in the European institutions, following the terroristattacks in Paris and Brussels.84
4.3. Scrutiny of EU spending: procedures in the EPIn accordance with the cycle of scrutiny of the EU annual budget, the management andexecution of the 2017 budget will be evaluated during the course of 2018 and 2019(figure 17). The procedure shall begin in the middle of 2018 after adoption of finalaccounts by the European Commission (stage A), and finish with a decision of theEuropean Parliament adopted before 15 May 2019 (stage D) or in October 2019 in caseof postponement (stage E).
In 2017, the European Parliament is expected to take a discharge decision on the 2015financial year. The ongoing discharge procedure is at the stage of hearings withrespective commissioners and representatives of EU agencies, conducted by the EP'sBudgetary Control Committee (CONT) (stage C). Following this stage, and after receivingthe Council recommendation on the discharge, the EP is expected to take its decision bymid-May 2017.85
The European Parliament is also responsible for initiating the next discharge procedurein 2017, covering the 2016 budgetary year. The procedure will begin with the publicationof a series of budgetary reports and evaluations by the European Commission. Followingthis stage, the European Court of Auditors presents its annual report with the statementof assurance (DAS)86 on the implementation of the 2016 financial year. In addition, in the
83 Since 2013, the institutions have effectively reduced staffing levels, aiming at a 5 % decrease by 2017.84 Statement of estimates of the European Commission for the financial year 2017, SEC(2016)280,
June 2016, p. 71.85 The discharge procedure for the 2015 financial year can be followed on the EP’s Budgetary Control
Committee website.86 Statement of assurance (known as DAS) is the official opinion issued by the ECA on reliability of the
accounts and on the legality and regularity of the underlying transactions (Article 287 TFEU andArticle 148 Financial Regulation).

Economic and budgetary outlook for the European Union 2017 Page 32 of 69
course of 2017, the ECA will publish thirty special reports evaluating EU expenditureunder the 2007-2013 and 2014-2020 MFF.87
Figure 17 – Discharge procedure for the EU budget from the perspective of the EP
Source: EPRS.
The European Parliament plays a crucial role in the democratic scrutiny and control ofthe implementation of the EU budget.88 Within the annual discharge procedure it notonly signs off the financial year, but also makes recommendations for improvement offinancial management and implementation of the EU budget. After receiving arecommendation from the Council, it ascertains whether the European Commissionrespected the principles of sound financial management, applicable rules and regulationsin implementing the budget.89 The Parliament grants separate discharge to the other EUinstitutions for the management of their sections of the general budget, and to theagencies and joint undertakings for their budgets.
Apart from scrutinising the regularity and legality of the budget's implementation, thedischarge procedure increasingly focuses on performance culture, performanceinformation and achievement of goals. The principles of performance orientation havegradually permeated many aspects of the management, implementation and control ofthe EU budget. Since 2015, the principles are included in the Commission's 'EU budgetfocused on results' initiative. This wider approach to the assessment of EU spending isstrongly supported by the European Parliament and the ECA. Many of the improvementsintroduced so far in this respect were triggered by opinions and demands expressedduring the budgetary discharge procedure, for instance in the ECA's annual and specialreports90 and the EP's reports on EU budget discharge.91
87 For the complete list of topics to be covered in the ECA’s special reports in 2017, please see the ECA2017 Work Programme.
88 Please see: R. Corbett, F. Jacobs, D. Neville, The European Parliament, 9th edition, John HarperPublishing, 2016, pp. 333-337; A. D’Alfonso, Discharge procedure for the EU budget. Political scrutinyof budget implementation, Briefing, European Parliament, EPRS, April 2016.
89 For the methods of implementation of the EU budget please see Section 3.3.90 For example: Making the best use of EU money: a landscape review of the risks to the financial
management of the EU budget, Landscape review, European Court of Auditors, 2014; Annual report onthe implementation of the budget concerning the financial year 2015, European Court of Auditors,OJ C 375 (especially chapter 3).
91 For an overview of the EP resolutions referring to the topic please see: Performance-based budgeting,Note, DG for Internal Policies, Policy Department D, European Parliament, 2015. For a recent exampleplease see: the Report on discharge in respect of the implementation of the general budget of theEuropean Union for the financial year 2014, Section III – European Commission and executive agencies,Committee on Budgetary Control, European Parliament, 13 April 2016.

Economic and budgetary outlook for the European Union 2017 Page 33 of 69
5. EU budget in the medium- and long-termThe current MFF sets out the structure of EU spending to 2020. In 2017, a number ofdevelopments may have an impact on the EU budget, both in the current and the nextprogramming period.
5.1. Second half of the 2014-2020 MFFTable 2 compares commitments in the adopted EU budget for 2017 and the ceilingsavailable for each heading in the remaining years of the current MFF. The figures in boldhighlight the categories of spending for which it was necessary to mobilise the FlexibilityInstrument and/or the Contingency Margin in 2017: subheading 1a 'Competitiveness forgrowth and jobs', heading 3 'Security and citizenship' and heading 4 'Global Europe'.Until 2020, pressure on the expenditure ceilings may be expected to recur for some ofthese categories, such as 'Security and citizenship', which receives around 40 % of its2017 financing from special instruments.
While modifications to 2018-2020 MFF ceilings appear unlikely, a number ofdevelopments may have an impact on the framework up to 2020. In particular, theEuropean Commission presented the compulsory mid-term review of the MFF on14 September 2016, analysing the functioning of the framework to date, the mainchallenges encountered (see Section 3.4 above) and the implementation of the differentbudgetary headings.
Table 2 – EU budget 2017 commitments and 2018-2020 MFF ceilings by heading (€ millions,current prices)92
Heading/subheading 2017 2018 2019 2020
1a Competitiveness for growth and jobs 21 312 21 239 23 082 25 191
1b Economic, social and territorial cohesion 53 586 55 181 56 842 58 470
2 Sustainable Growth: Natural Resources 58 584 60 267 60 344 60 421
3 Security and citizenship 4 284 2 656 2 801 2 951
4 Global Europe 10 162 9 825 10 268 10 510
5 Administration 9 394 10 346 10 786 11 254
Total 157 323 159 514 164 123 168 797
Data source: European Commission, DG Budget.
On this basis, the Commission put forward a proposal for mid-term revision of the MFFRegulation.93 Its objective is to reinforce the MFF's flexibility provisions and specialinstruments, as their capacity to address unforeseen events and new priorities waslargely used during the framework's first years, while several challenges persist bothwithin the EU and externally.
The MFF revision proposal, part of a broader package of legislative and non-legislativeinitiatives (see Table 3), seeks to allocate an extra €6.33 billion to job creation, growth,migration and security challenges, without modifying MFF ceilings. The EP, which has
92 The total for 2017 is lower than the overall appropriations of the 2017 EU budget, since it does notinclude the instruments that are outside the MFF ceilings.
93 A. D’Alfonso, 2014-2020 Multiannual Financial Framework (MFF): Mid-term revision, EuropeanParliament, EPRS, December 2016.

Economic and budgetary outlook for the European Union 2017 Page 34 of 69
long pushed for MFF revision, provided input to the process ahead of the Commission'smid-term review.94
Table 3 – MFF review package: core objectives of the main proposals
Core objective Examples of related proposals and procedure file(s)
Increasing EU budget capacity to reactto unforeseen challenges - Revision of the MFF Regulation – (2016/0283 (APP))
Avoiding pressure on paymentceilings during the final years of the2014-2020 MFF
- Revision of the MFF Regulation – (2016/0283 (APP))- Contingency margin mobilised in 2014: bringing offsetting forward from2018-2020 to 2017 (2016/2233(BUD))
Increasing EU tools and/or meansaddressing job creation and growth
- Revision of the EFSI Regulation to extend the duration of EFSI to 2020and increase its means (2016/0276(COD))- Creation of a Wifi4EU initiative to promote the availability of internetconnectivity in local communities (2016/0287(COD))
Increasing EU tools and/or meansaddressing migration and securitychallenges
As part of the Commission's external investment plan of June 2016:- Setting-up a European Fund for Sustainable Development(2016/0281(COD))- Extension of the European Investment Bank's mandate for itsinvestment activities outside the EU (2016/0275(COD)) and revision ofthe Guarantee Fund for external actions (2016/0274(COD))
Simplifying implementing rules for EUfunds and increasing their impact
- Revision of the EU's Financial Regulation and of related basic acts inspecific spending areas such as agriculture, cohesion, Connecting EuropeFacility and space (2016/0282(COD))
Source: A. D'Alfonso, 2014-2020 MFF: Mid-term revision, European Parliament, EPRS, December 2016.
On 15 November 2016, the Council reached a broad consensus on a compromise text forthe revision of the MFF Regulation (flexibility provisions and special instruments) andpart of the financial envelope to reinforce activities related to job creation, growth,migration and security. While one Member State was unable to lift its reservation on thetext at that point, the adopted 2017 EU budget has already phased in some elements ofthe MFF revision, such as €200 million of additional allocations for successfulprogrammes under heading 1a (Erasmus+, COSME, Horizon 2020 and Connecting EuropeFacility; see Section 4.2 above).
Table 3 shows the other objectives that, according to the European Commission, need tobe addressed in the current programming period. Different procedures apply to theseproposals, which are currently in the pipeline for consideration by the legislative andbudgetary authority.
In particular, the European Commission aims to simplify the implementing rules for EUfunds and increase their impact, through a revision of the EU Financial Regulation andrelated provisions. This is in line with the objectives of the 'EU budget focused on resultsinitiative' (see Section 4.3 above). The European Parliament and the Council are currentlyconsidering the legislative proposal. The objective is to have an agreement in 2017 forthe revised rules to be applicable as of 2018.
Various proposals in the mid-term review/revision package aim to avoid a repetition ofan abnormal payments backlog at year-end towards the end of the current programmingperiod. The issue of unpaid claims95 at the end of the year was particularly difficult during
94 European Parliament resolution of 6 July 2016 on the preparation of the post-electoral revision of theMFF 2014-2020: Parliament’s input ahead of the European Commission’s proposal (P8_TA(2016)0309).
95 At the worst moment, in 2014, the level of payment backlog was estimated at some €26 billion. Mostof this was accumulated under subheading 1b ‘Economic, social and territorial cohesion’, but someserious problems occurred also under the Erasmus and research programmes, neighbourhood and

Economic and budgetary outlook for the European Union 2017 Page 35 of 69
the final period of the previous MFF and the beginning of the new one. An intenseinterinstitutional dialogue to tackle the problem resulted in the decision to resort to2014-2020 MFF flexibility provisions and to improve the forecasting and management ofpayment needs, which contributed to normalising the year-end backlog.96
However, this challenge may recurin the coming years. Although thepressure on payments hassignificantly decreased, this is alsodue to the delayed start andsluggish implementation of theprogrammes in cohesion andagriculture policies.97 Thesituation, however, is verydynamic and it is expected that inthe course of 2017 and 2018 theimplementation of ESI Funds willreach cruising speed. In thefollowing years, this will trigger anincrease in payment claims and arisk of their accumulating if theauthorised payments areinsufficient. The effect isillustrated in Figure 18. The Commission estimates that, in the last two years of thecurrent MFF, increasing payment needs may surpass available payment appropriations.The European Commission therefore proposes to remove some of the limitationscurrently in place for the flexibility provisions applicable to payments. The Commissionalso underlines that, during the second half of the current MFF, the overall paymentceiling is only sufficient on condition that the payments for special flexibility instrumentsare counted over and above the ceilings in the same way as commitments.98
Apart from the outcome of the negotiations on the various proposals in the mid-termreview/revision package, other factors may have an impact on the MFF by 2020 and/orbeyond. For example, if the United Kingdom (UK) triggers the Article 50 procedure toleave the EU (possible 'Brexit'), budgetary relations will need to be settled.
Scenarios evoked in the press range from an exit bill covering outstanding liabilitiesunder the common budget with no further participation in EU activities, to continued
humanitarian aid programmes. For a thorough analysis of the problem see: D’Alfonso, A., Sapala, M.,Payments backlog in in recent EU budgets. Lessons learnt and outlook, EPRS, European Parliament,November 2015.
96 It is worth noting that forecasting the payments, especially in Heading 1b is very difficult. TheCommission estimates that in this heading +/- 1 % of change in pace of implementation leads to a+/- €4 billion change in payment needs. See: European Commission SWD, Mid-term review/revision ofthe multiannual financial framework 2014-2020. An EU budget focused on results, p. 56.
97 As a result, the payment needs have dropped leading to a reduction of payment appropriations by€7.3 billion in 2016 (DAB 4/2016).
98 Since 2014 when the Contingency margin was mobilised for the first time under the 2014-2020 MFFRegulation, the Council and the Parliament have a different interpretation of how the payments of thespecial instruments should be budgeted. According to the Parliament (and the Commission), theyshould be counted, just like the commitments, over and above the annual MFF ceilings. The Counciltakes a contrary view.
Figure 18 – Payment ceiling sustainability
Source: European Commission, SWD(2016) 299 final, 14 September 2016.* includes contingency margin 2014 (offset in 2017), global margin forpayments 2014 and 2015, technical adjustment of the MFF based onArticle 7 MFF regulation.

Economic and budgetary outlook for the European Union 2017 Page 36 of 69
participation in a number of activities and associated contributions. According to ananalysis by the CEPS think tank, both scenarios would have a limited and manageableimpact on the EU budget and other Member States' contributions. The authors considerthat the UK's net contribution would be partly compensated by financial participation inEU activities in one scenario, or by customs duties in the case of an exit from the singlemarket.99 Other analysts identify a possible 'Brexit' as an opportunity for broader reformof the EU budget.100 Over the years, critics of the current EU financing system have oftenargued that its complexity and opacity also result from the UK rebate and othercorrection mechanisms,101 which hinder the reform of both the revenue and theexpenditure side of the EU budget.102 A policy paper by Notre Europe – Jacques DelorsInstitute identifies four different ways of adjusting the EU budget to a 'Brexit', concludingthat this would represent either a threat or an opportunity for the EU budget, dependingon the path that EU Member States decide to follow.103
5.2. Debate on the post-2020 MFFAccording to Article 25 of the MFF Regulation, the Commission shall present a proposalfor the post-2020 MFF before 1 January 2018. While debate on reform of the EU budgetand the changes that could be introduced to the next MFF is longstanding, it is expectedto gain further momentum. In 2017, several developments will contribute to thepreparation of the post-2020 MFF. Among the most important are the presentation ofthe final report of the High-Level Group (HLG) on own resources (see Box 4) and thepresentation of important mid-term evaluations and reports on a number of EU sectoralpolicies and spending programmes, e.g. seventh cohesion report, Erasmus+ for studentexchange, LIFE for environment and climate action (figure 19). Finally, as mentioned inSection 5.1, a possible 'Brexit' may also have implications for the post-2020 MFF.
99 J. Núñez Ferrer and D. Rinaldi, The Impact of Brexit on the EU Budget: A non-catastrophic event, CEPSPolicy Brief No 347, 7 September 2016.
100 H. Enderlein, What should happen? What is likely to happen? Notes on Brexit, Jacques Delors Institut– Berlin, 30 June 2016.
101 For example, this criticism has been expressed on many occasions by the European Parliament(e.g. legislative resolution P7_TA(2014)0432 of 16 April 2014) and by the European Court of Auditors(e.g. Opinion No 4/2005).
102 See for example: F. Zuleeg, 'Britain outside Europe? Fewer EU concessions to UK post-Brexit', EuropeanPolicy Centre, 2014; and Q. Peel, 'A fair deal demands that Britain rethink the rebate', Financial Times,8 December 2005.
103 J. Haas and E. Rubio, Brexit and the EU budget: threat or opportunity?, Notre Europe – Jacques DelorsInstitute, Policy paper, January 2017.

Economic and budgetary outlook for the European Union 2017 Page 37 of 69
Box 4 - The High Level Group (HLG) on own resources
Launched by the EP, the Council and the Commission in February 2014, the HLG on own resourcesis the first interinstitutional group to be tasked with a thorough review of the EU's financingsystem. The EP promoted its creation strongly, deeming a reform of own resources crucial to thestreamlining of the EU budget.104 Chaired by Mario Monti, President of Bocconi University,former Prime Minister of Italy and former Commissioner, the HLG published its final report on17 January 2017.105 The HLG concludes that both the revenue and expenditure sides of the EUbudget need to be overhauled, with a view to increasing budgetary capacity to respond tocurrent challenges and to focus on European added value. The report stresses that reform of thefinancing system will not increase the size of the budget, but is meant to modify the EU revenuemix, reduce the role of national contributions and simplify the system. In this respect, the HLGunderlines the possible advantages of a combination of new resources based on production,consumption and environmental policies, which could ensure financing and, at the same time,serve EU policy objectives (e.g. strengthening the single market and contributing to fightingclimate change). Overall, the report makes nine recommendations, including: the exploration ofrevenue options other than own resources; the abolition of correction mechanisms; and thepossibility of introducing some degree of differentiation in duly justified cases if a group ofMember States is willing to advance in specific areas (e.g. further development of the euro areaand policies under enhanced cooperation). The European Commission will now assess whetherthe outcome of the work justifies new initiatives in the field of own resources, which could beput forward alongside the proposal for the post-2020 MFF by the end of 2017.
So far, the EU institutions have contributed initial ideas and views to the discussion onvarious occasions. The European Commission includes some preliminary reflections onthe future MFF in its document presenting the mid-term review/revision of the MFF. TheParliament has recently highlighted its considerations in the resolutions concerning themid-term review/revision of the MFF 2014-2020.106 A vivid exchange of ideas took placeduring the conference dedicated to the future MFF organised by the Dutch Presidencyof the Council on 28 January 2016.107 In a briefing note on the mid-term review of theMFF, the European Court of Auditors made a number of recommendations on thepreparation of the post-2020 framework.108
Many other stakeholders are involved in the debate, and some have already expressedtheir views. There is general agreement that the EU budget needs reform. Focus onresults, leverage, synergies, conditionality and European added value are oftenmentioned among the principles that should underpin any changes. Stakeholders fromacademic, expert and political circles underline that in a rapidly evolving world, thedesign of the EU budget has to ensure the right balance between predictability ofinvestments and capacity to respond to new challenges and priorities. The problems thatthe current MFF faces demonstrate how difficult the task is, and the weaknesses of the
104 A. D’Alfonso, 'Monti' Group's first assessment of EU own resources, European Parliament, EPRS,February 2015.
105 High Level Group on Own Resources, Future financing of the EU: Final report and recommendations,December 2016.
106 European Parliament, resolution on the preparation of the post-electoral revision of the MFF 2014-2020: Parliament’s input ahead of the Commission’s proposal (P8_TA-PROV(2016)0309), Strasbourg,6 July 2016; European Parliament, Resolution of 26 October 2016 on the mid-term revision of the MFF2014-2020 (P8_TA-PROV(2016)0412).
107 Report of the presidency Conference on the Multiannual Financial framework (MFF), 28 January 2016.108 European Court of Auditors, EU budget: time to reform? A briefing on the mid-term review of the
Multiannual Financial Framework 2014-2020, Luxembourg, 2016.

Economic and budgetary outlook for the European Union 2017 Page 38 of 69
EU financing system.109 In summary, the main issues highlighted by the EU institutionsand stakeholders at the current stage of the debate are:
Reform of the financing side of the budget – the current system of EU own resourcesis widely criticised and there is a growing consensus on the necessity for reform. It isexpected that the HLG's recommendations on own resources will significantlycontribute to the debate and to the Commission's concrete proposals for change,which could be tabled together with the post-2020 MFF proposal.
Duration of the MFF – the current, seven-year MFF is not synchronised with the five-year political cycle determined by the political terms of the European Commission andthe European Parliament. Proposals that could fix the problem include a five-year MFFaligned to the political mandates of the main EU institutions; five + five years with acompulsory mid-term review; ten years with compulsory mid-term revision forprogrammes requiring long-term programming and five years for other elements ofthe MFF. According to others, the seven-year MFF has its advantages and should notbe changed.
MFF priorities and structure – some analyses consider the current structure of theMFF outdated, too focused on past priorities and insufficiently supportive ofinitiatives with high European added value. In this perspective, aligning the budget toa new and evolving set of EU strategic priorities appears a crucial aspect of the reform.New areas frequently identified as requiring stronger financial EU intervention includeborder management, migration and refugees, security challenges and defence, and areinforced investment policy.
Flexibility – experience of the implementation of the current MFF appears to showthat the capacity to respond swiftly to new challenges requires that more flexibilityand reserve capacity is built into the MFF. There is considerable demand for greaterpossibilities to shift resources within and between MFF headings; for creation of aspecial crisis reserve; to re-use de-committed amounts and fines; or to secure biggermargins under annual ceilings. At the same time, however, the question of ensuringthe MFF's predictability is also raised.
Unity of the budget – the proliferation of new instruments for financing EU actions,especially in external policy, and partially outside the EU budget (e.g. the EFSI; EU trustfunds for external action; and the Facility for Refugees in Turkey), raise questionsabout the principle of the unity of the budget and democratic accountability.
109 Some interesting considerations on the reform of the EU budget can be found in: J. Núñez Ferrer,November 2016 op. cit.; P. Becker, The EU budget’s mid-term review: with its promising reformproposals, the European Commission lays the groundwork for the next, post-2020 budget, StiftungWissenschaft und Politik, SWP Comments 48/2016, Berlin, 2016.

Economic and budgetary outlook for the European Union 2017 Page 39 of 69
Financial instruments – the use of innovative financialinstruments has become an important feature of thecurrent MFF. While these can present advantages tothe budget's effectiveness, some aspects of theirfunctioning in the EU budget will have to bereconsidered, for instance their interplay with grants,capacity to leverage public and private investments,simplification of delivery, etc.
European Development Fund (EDF) budgetisation –the €30.5 billion EDF, an intergovernmental tool fordevelopment cooperation with the African, Caribbeanand Pacific Group of States (ACP), is not currentlyincluded in the EU budget. In the 2013interinstitutional agreement on budgetary matters,the Commission declared its intention to propose theEDF's inclusion in the EU budget as of 2021.
Role of the budget in EU economic governance – thereare proposals to strengthen and extend the existinglinks between the EU budget and the economicgovernance framework of the Union (for example,macro-conditionality of the ESI Funds and links withcountry-specific recommendations).
Changes to the decision-making process – the currentprocedure leading to agreement on the MFF with aunanimity vote in the Council is seen as one of themain obstacles to budget reform. Stakeholders call forgreater transparency in the process and involvementof EU citizens. Some proposals emphasise thenecessity to shift towards qualified majority voting inthe Council or to give more power to the EuropeanParliament.
Figure 19 – Timeline of mainMFF 2014-2020events
Source: EPRS.

Economic and budgetary outlook for the European Union 2017 Page 40 of 69
6. Economic focus: public and private investment in the EUThe analysis of developments in public and private investment in EU Member Statessince 1995, and especially diverging trends following the economic and financial crisis of2008, reveals particular challenges for EU financial support initiatives.
6.1. Main challengesInvestment can mean very different things depending on the context and the perspectiveof investors or other stakeholders, such as governments, banks, or borrowers.110
Investments can contribute to growth by increasing demand in the sector that providesthe investment goods; or by raising output due to greater employment and/or higherproductivity. One of the major concerns for the EU is that the global economic andfinancial crisis of 2008-2009 and the global recession that followed 'caused aninvestment gap to open up, both in relation to pre-crisis investment rates and in relationto growing investment rates in many competing economies – emerging economies inparticular.'111
6.1.1. Investment gap – dataOne lasting effect of the financial crisis is the subdued investment level in almost all EUMember States. Investment activity (gross fixed capital formation112 in relation to GDP)declined significantly in the euro area and in the EU-28. Investment activity in theEuropean Union declined by about €323.29 billion (+14 %) from peak to trough. It fellfrom a peak of €2 934 billion (22.5 % of GDP) in 2008 to €2 610.7 billion (19.3 % of GDP)in 2013, before rising to €2 868 billion (19.5 % of GDP) in 2015. As for investment activityin the euro area (19 countries), investment declined by about €232.67 billion (-15.5 %)from peak to trough. From a 2007 peak of €2 179.6 billion (23.2 % of GDP), investmentactivity fell to €1 947 billion (19.6 % of GDP) in 2013, before picking up very slightly in2015 at €2 063.1 billion (19.7 % of GDP). The European Commission's in-house thinktank, the European Political Strategy Centre (EPSC), finds that investment in the EU is stillwell below its pre-crisis level, even if benchmarked against a ten-year average.113 Theadvisory body estimates a quarterly shortfall of about €61.4 billion (euro area:€50.4 billion) at the end of 2015. Expressed in terms of foregone potential GDP, this'investment gap' amounts to 1.7 % of GDP for the EU (and 1.9 % for the euro area).
However, aggregate values cover disparities across countries (see figure 20): Split inthree groups of Member States (core, vulnerable, and cohesion),114 data since 1995 not
110 According to Michael Dauderstädt, 'In the national accounts statistics, investment is an expenditure ona good ..., which is used in production and whose lifetime or use exceeds the given time period, usuallya year. ... From a macro-economic perspective, investment is an expenditure, which increases theactual or potential output of an economy thus leading to stronger growth'. Finally, 'from theperspective of the (private) investor, an investment is an expenditure, which is supposed to give areturn that should exceed the original investment.' Dauderstädt, Michael, How to close the Europeaninvestment gap? Friedrich-Ebert-Stiftung, 2015, p. 2.
111 Calleja Crespo, Daniel, How to close the EU investment gap, in: Austrian Federal Ministry of Science,Research and Economy, Investing in Europe’s Future. Restarting the Growth Engine, Vienna, June 2015,pp. 17-32.
112 Net increase in physical assets (capital stock such as equipment, buildings and other intermediategoods; investment minus disposals) within the measurement period.
113 Data refer to 1995 Q1 – 2006 Q2, see European Political Strategy Centre (EPSC), The European Fundfor Strategic Investments (EFSI), EPSC Strategic Notes, Brussels, April 2016, p. 1.
114 'Core countries': Austria, Belgium, Denmark, Finland, France, Germany, Luxembourg, the Netherlands,Sweden and the UK; 'Vulnerable Member States': Cyprus, Greece, Ireland, Italy, Portugal, Slovenia and

Economic and budgetary outlook for the European Union 2017 Page 41 of 69
only illustrates the abrupt end of the economic upswing preceding 2008, but also verydifferent paths of subsequent recovery. The seven Member States, labelled as'vulnerable' in this sample (Cyprus, Greece, Ireland, Italy, Portugal, Slovenia and Spain),faced a much stronger reduction in investment activity, in decline until 2014.
Figure 20 – Gross fixed capital formation in the EU Member States, 1995-2015 (2000=100)
Source: Eurostat, GDP and main components (output, expenditure and income) [nama_10_gdp], here: gross fixedcapital formation (investments) at current prices, percentage of gross domestic product (GDP), 2 000 as 100 index, lastupdate 13 December 2016.
In contrast, cohesion countries also experienced a severe reduction after 2008 and arecurrently back to mid-1990s levels of investment per GDP. However, except in2013/2014, they have higher investment ratios per GDP than core countries and displayan upward trend (see Annex 6). Core countries are still below pre-crisis levels, butmanaged to halt the decline after 2011.
As for the present situation: In 2015, Sweden and Belgium had the highest investmentlevels of core countries, whereas the Czech Republic, Malta and Romania led the groupof cohesion countries (see Figure 21).
Spain; 'Cohesion countries': Bulgaria, Croatia, the Czech Republic, Estonia, Hungary, Latvia, Lithuania,Malta, Poland, Romania and Slovakia. This classification follows an approach used in recent OECD andEIB publications, such as European Investment Bank, Investment and Investment Finance in Europe,November 2016.

Economic and budgetary outlook for the European Union 2017 Page 42 of 69
Figure 21 – Gross fixed capital formation, core and cohesion countries, in % of GDP (2015)
Source: Eurostat, see above. Gross fixed capital formation (investments) at current prices in per cent of gross domesticproduct (GDP).
The group of selected vulnerablecountries includes Ireland, currentlywith 21.2 % of gross fixed capitalformation of GDP, as well as Greece,with only 11.5 % (see Figure 22).However, developments since 1995are interesting: while Spain (31%),Ireland (31 %) and Greece (26 %)witnessed above-average rates in2006/2007, investment rates in threecountries fell substantially thereafter(Figure 23). Ireland dropped to 17.2 %in 2011, but has since seen ratesimproving. Investment activity inGreece halved by 2014 (11.6 %) andseems to have stabilised in 2015(11.7 %).115 Data for Portugal suggest less cyclical variation but a similar decline inactivity; after peaking in 2014 (23.4 %), the country witnessed continually decreasingvalues until 2013 (14.8 %) but appears to have stabilised since.
In 2015, no euro area country had returned to pre-crisis investment heights of 2006-2008.However, Austria, Belgium, France, and Germany witnessed comparatively less change ininvestment activity during the past ten years, indicating a more stable investmentenvironment.
115 Data quality is an issue, as Eurostat considers values for Greece since 2011 to be ‘provisional’. Grossfixed capital formation (investments), source Eurostat [tec00111].
Figure 22 – Gross fixed capital formation,vulnerable countries, in % of GDP(2015)
Source: Eurostat, see above.

Economic and budgetary outlook for the European Union 2017 Page 43 of 69
Figure 23 – Gross fixed capital formation, selected EU countries, 1995-2015, in % of GDP
Source: Eurostat national accounts, [tec00011]. Gross fixed capital formation (investments) at current prices,Percentage of gross domestic product (GDP).
In an international comparison, the EU and the USA followed similar trends, exceptduring the period from the second half of 2011 to early 2013, where most EU MemberStates' economies went into recession, while investment and output growth acceleratedin the USA. Following this brief period, investment trends resumed in the EU, albeit at alower rate.116 For the EU as a whole, the public investment-to-GDP ratio has reached thesame level as before the crisis. However, countries that had to undergo sizable fiscaladjustments witnessed deteriorating rates, which threaten to entrench weak growthpaths.
6.1.2. Investment gap – causes and effectsFor the European Investment Bank (EIB), one of the major obstacles to the recovery oftotal fixed capital formation to pre-crisis levels is investment in new construction, whichfell significantly after the crisis (from 50 % to around 33 %).117 This, in turn, is due to theconstruction sector and its customers' high dependence on bank credit (whilst creditsupply shrunk during the crisis), and compounding of tight credit and high indebtednessby falling investment returns since 2008 across the non-financial corporate sector,particularly in the construction sector. In addition, governments also reduced investmentby about 16 % between 2010 and 2013.
The two most troubling consequences of this growing investment gap are the negativeimpact on economic recovery – which took longer than for many economies outside theEU – as well as the adverse effects on EU competitiveness internationally (due todivergence with the USA and other economies in the 2011-2013 period). ConcerningEurope's economic recovery, given that investment spending multipliers exceed others,especially during recessions,118 (lack of) investment may be one of the possible causes
116 European Investment Bank, Investment and Investment Finance in Europe, November 2016, p. 29; Thereport notes that 'assuming that [investment] growth maintains its current pace, it will take anotherthree years ... to get back to 2008 levels of investment', p. 31.
117 European Investment Bank ‘Investment and Investment Finance in Europe’, November 2016, pp. 41-43.118 See, for example, Sebastian Gechert, Andrew Hughes Hallett and Ansgar Rannenberg ‘Fiscal multipliers
in downturns and the effects of Eurozone consolidation’, CEPR Policy insights, February 2015. See alsoJan David Schneider ‘Growth for Europe - is the Juncker plan the answer?’, European Policy Centre,

Economic and budgetary outlook for the European Union 2017 Page 44 of 69
explaining the recovery's slow pace. For the latter issue, the gap to 'catch up' incompetitiveness is estimated to be even higher than the aforementioned investmentgap: The EIB notes annual investment shortfalls amount to around €345 billion per yearand include €100 billion to upgrade energy networks, integrate renewables, improveenergy efficiency, and ensure security of supply; €80 billion to upgrade transportnetworks, reduce congestion costs, and trade bottlenecks; €65 billion to reach EU digitalagenda standards in broadband, data centre capacity, and cyber security; €10 billion forstate-of-the-art education facilities, to reach USA standards, mostly in higher education;and €90 billion to rehabilitate environmental services and ensure water security in theface of climate change.119
While the challenge to increase investment levels is widely acknowledged,120 somecaveats remain and additional factors need to be taken into account. First of all, pastinvestment levels for other countries might not be reliable benchmarks121 (a positionthat is echoed by the Bundesbank, according to which those weak investment figuresshould be viewed against the backdrop of exuberance and the build-up of massivemacroeconomic imbalances122 prior to the financial and economic crisis; and byDaniel Gros,123 who notes that it is 'natural' that investment increases during a boom –such as the one before the 2008 crisis – and decreases during a bust). In addition,investment per se, cannot lead to economic growth, if it is not correctly focused (Grosnotes that 'the experience of some countries proves that excessive investment in thewrong sectors (e.g. housing) will do little to create conditions for sustainable growth').
Lastly, formulating the problem of economic growth solely in terms of investment gapimplies 'that one simply has to fill the gaps in order to solve the problems'.124 However,such a strategy 'treats the symptoms rather than the causes. Instead, it is important tounderstand also the reasons for low investment, which might be manifold.' Similarly,Gros notes that 'what is rarely recognised for Europe is how quickly demographic trendshave turned recently, implying a significantly lower potential growth rate, which in turnimplies that a lower (equilibrium) investment-to-GDP ratio is needed to keep thecapital/output ratio constant. ... Given that the investment rate during the credit boomwas probably in excess of the steady state one has to conclude that much of the fall ininvestment (not only in construction) after 2008/2009 will be permanent.
March 2015. The author notes that the paper follows a Workshop on Growth and Investment organisedby the EPC, and that in that workshop, participants ‘stressed that boosting productive publicinvestment either at national level or by providing a more favourable framework at European levelcould also accelerate the recovery’.
119 EIB Restoring EU competitiveness (2016 updated version).120 See, among others, Wolff, Guntram B., The Juncker plan – no risk, no return, in: Austrian Federal
Ministry of Science, Research and Economy, Investing in Europe’s Future. Restarting the GrowthEngine, Vienna, June 2015, pp. 33-43, or Dauderstädt, Michael, How to close the European investmentgap? Friedrich-Ebert-Stiftung, 2015
121 See Wolff, Guntram B., The Juncker plan – no risk, no return, op. cit.122 Deutsche Bundesbank, Investment in the euro area, Monthly Report, Frankfurt a. M., January 2016,
p. 49.123 Gros, Daniel, Investment as the key to recovery in the euro area?, in: Austrian Federal Ministry of
Science, Research and Economy, Investing in Europe’s Future. Restarting the Growth Engine, Vienna,June 2015, pp. 45-62.
124 See Wolff, Guntram B., op. cit.

Economic and budgetary outlook for the European Union 2017 Page 45 of 69
6.2. EU investment supportThe 2008 financial (and later economic) crisis has hit both the private and the publicsector in Member States. In the private sector, firms found it more difficult to obtainaccess to finance, as banks engaged in conservative lending in the context of theirdeleveraging, and as bond markets became less liquid. On the public side, governmentsmade considerable efforts in fiscal consolidation following the significant stimuluspackages they enacted in 2008-2009 to support demand.125
In this context, many of the proposals126 formulated recently share the idea that theprivate sector must constitute the main source of financing, 'ideally by using existingfinancial wealth not yet invested in the real economy'. The problem then becomes howto entice those private investors, providing them with a decent risk-profit proposition,especially for sectors like infrastructure, or research and education, which can contributeto long-term growth but do not have evident short-term returns. The EU has taken atwofold approach to the problem: the EIB and EFSI provide finance to support privateand public investment at country level, while the capital markets union initiative aims atfacilitating cross border investments and flows of capital.
6.2.1. European Investment Bank operationsEstablished in 1958, the European Investment Bank (EIB)127 is the EU's public bank forlong-term loans. In 1994, the European Investment Fund (EIF)128 was set up to supportthe development of high-growth small and medium-sized enterprises (SMEs) and/orthose active in new technologies.
The EIB is the majority shareholder and operator of the EIF. In 2000, the EIB Group wascreated, consisting of the EIB and the EIF. Within the Group, the EIB grants medium- andlong-term bank loans, while the EIF specialises in venture-capital operations andproviding guarantees for SMEs. According to Article 309 TFEU, the EIB's task is tocontribute to the balanced and steady development of the internal market in the interestof the Union.
Direct project loans are subject to certain conditions, e.g. total investment costs mustexceed €25 million, and the loan can only cover up to 50 % of the project costs. In 2014and 2015, the financing activities of the EIB Group amounted to a total of€80.3/84.5 billion (see Table 4), split between energy and infrastructure
125 For the German fiscal stimulus, see, Alina Carare et al. The German fiscal stimulus package inperspective; for the Netherlands’ economic recovery plans, see Sylvester Eijffinger Banking rescue andeconomic recovery plans in the Netherlands and other EU Member States: Why the Dutch should domore. Finally, for a broader discussion, see the European Parliament’s compilation of briefing papersEconomic Recovery Packages in EU Member States.
126 Michael Dauderstädt examines eleven of these, which include the European Commission’s Investmentplan, plans from the parliamentary groups of the European Parliament (S&D, Greens and ALDE), as wellas plans from the German Trade Union Federation (DGB), the then Polish Finance MinisterMateusz Szczurek or the European NGO Europe 2030.
127 The EIB’s tasks are codified in Articles 308 and 309 of the Treaty on the Functioning of the EuropeanUnion (TFEU). Further provisions contain Articles 15, 126, 175, 209, 271, 287, 289 and 343 TFEU.Additionally, Treaty protocols No 5 and No 28 provide for the statute of the European Investment Bankand specify EIB’s role regarding economic, social and territorial cohesion (see EIB statute).
128 The European Investment Fund was set up as a public-private partnership (PPP) with three mainshareholder groups: the EIB, as majority shareholder with 62.2 %, the European Commission (30 %),and several public and private financial institutions (7.8 %). It offers equity and debt products, as wellas promoting social inclusion via microfinance.

Economic and budgetary outlook for the European Union 2017 Page 46 of 69
€31.5/31.0 billion, industry €13.8/15.4 billion and projects outside the EU€7.9/7.8 billion.129 Signed financing provided by the EIF doubled and almost reached€7 billion in 2015.
Table 4 – EIB Group financing provided (signed), per sector in 2014, 2015, in € million
2014 % of total 2015 % of total
Energy and infrastructure- Energy- Transport- Telecommunications- Water, sewerage- Solid waste- Urban development- Composite infrastructure
31 49910 30512 9652 2702 255417
2 798489
45.614.918.83.33.30.64.00.7
30 9578 185
12 4231 8063 331247
3 1531 811
44.411.717.82.64.80.44.52.6
Industry, services, education, health, agriculture- Industry- Services (incl. research and development)- Education- Health- Agriculture, fisheries, forestry
13 8225 2572 0434 7411 406375
20.07.63.06.92.00.5
15 4346 4122 9734 2961 708
46
22.19.24.36.22.50.1
Total individual loans/framework loans 45 321 65.6 46 391 66.6
Total credit lines 23 760 34.4 23 300 33.4
EIB funding (within EU) 69 081 100 69 691 100
EU partner countries 7 875 - 7 830 -
Total EIB funding 76 956 - 77 521 -
European Investment Fund (signed)* 3 320.8 - 6 963 -
Total EIB Group funding 80 276.8 - 84 484 -
Source: EIB Statistical Reports 2014 and 2015. *EIF financing has been raised to €4.5 billion. In view of theCommission's Capital Markets Union action plan and its ambition to revive the SME market, new debt finance andequity products have been grouped under the 'EIB Group Risk Enhancement Mandate'. By 2020, the EIB aims tocontribute up to €4 billion to this initiative. See also EIB Activity Report 2014, March 2015, EIB Activity Report 2015,May 2016. For 2016, the EIG group reports ‘signed’ financing operations amounting to €83.75 billion (EIB: €74.98billion; EIF: €9.45 billion). See press conference, 24 January 2017.
However, project finance is spread heterogeneously across Member States: In 2014,more than half of EIB financing of €77 billion (total €80.3 billion – EIF €3.3 billion) wasattributed to four countries alone: Spain, 15.5 %, Italy, 14.1 %, France, 10.7 %, andGermany, 10.0 %.130
According to the latest EIB report 'Investment and Investment Finance in Europe',131 in2015, the EIB provided €77.5bn in long-term finance to support private and publicproductive investment, with the EIF providing €7 billion. At a first estimate, this helpedrealise investment projects worth roughly €230 billion and €27 billion respectively.
129 EIB group (European Investment Bank and European Investment Fund): key statutory figures.130 EIB Financial Report 2014, p. 8. For individual country data see EIB Statistical Report 2014.131 European Investment Bank, Investment and Investment Finance in Europe, November 2016, op. cit.

Economic and budgetary outlook for the European Union 2017 Page 47 of 69
Small and medium-sized enterprises have been of particular interest to the EIB,132 giventhat they employ two thirds of the active working population. In 2014, the EIB Groupfinanced SMEs and midcaps133 in the EU with €25.5 billion (EIB €22.2 billion, EIF€3.3 billion), with a further €2.6 billion financed outside the EU. The bank reports thattotal support was provided to approximately 285 000 firms within the EU (EIB: 110 000,EIF: 175 000), out of 19 million currently operating in the EU.
6.2.2. European Fund for Strategic Investments (EFSI)As explained in Section 4.2., the European Union budget provides support for investmentactivities in the Member States in several ways: Under subheading 1a, programmes suchas 'Horizon 2020' or the 'Connecting Europe facility (CEF)' see allocations of €10.3 and€2.6 billion respectively in 2017. The total amount devoted to investment, jobs andgrowth in the 2017 budget is €74.9 billion (see Annex 3 for details). Nevertheless, theslow recovery path of many Member States led to a conviction that additional 'collectiveand coordinated efforts at European level are needed'.134
In July 2015, the EU launched the European Fund for Strategic Investments (EFSI).135 Akey pillar of the so-called 'Juncker Plan', and envisaged as a coordinated effort to restoreinvestor confidence, the role of EFSI was spelled out in the European Commissioncommunication entitled 'An Investment Plan for Europe'.136 According to theCommission, the guiding principle of EFSI is to 'stimulate private, market-basedinvestments, not to replace them'. Thus, it will 'provide risk-sharing through public funds'(€21 billion),137 and help to unlock private capital of at least €315 billion over three years(2015-2017) through leverage effects (€240 billion for innovation and infrastructure,€75 billion for SMEs through loans, as well as through equity and venture capital). Theexpected amount corresponds, more or less, to 0.714 % of GDP for 2014 (€13 996 billion)and 0.68 % of GDP for 2015 (€14 702 billion) – assuming that the plan mobilises€100 billion per annum.
However, according to the OECD, the EIB will need to increase financing of higher-riskprojects to enhance EFSI's impact.138 An early comment with regards to the plan was
132 European Investment Bank, SMEs and Midcaps, online information. See also European InvestmentBank, 2014 SME report and 2015 SME report.
133 Defined by the European Commission, SMEs employ less than 250 persons and have an annual turnoverof up to €50 million, or a balance sheet total of no more than €43 million. Midcaps are enterprises withless than 3 000 full-time equivalent employees (Commission Recommendation 2003/361/EC (OJ L124,20 May 2003, p. 36); Source: Eurostat and EIB.
134 European Commission, investment plan.135 Regulation (EU) No 1017/2015, the European Fund for Strategic Investments, the European Investment
Advisory Hub and the European Investment Project Portal, 25 June.136 European Commission, An investment plan for Europe, COM(2014) 903 final, 26 November 2016.137 Funding comes from a €16 billion EU budget guarantee (of which €8 billion is paid up), which will offer
specific cover to the investments financed by the EIB Group in case there are any losses. In addition,the EIB contributes a €5 billion capital allocation. The €5 billion acts as a guarantee fund of €61 billionfor additional EIB investments. These will be risk products (guarantees and counter-guarantees,subordinated debt, equity loans, equity participation, credit enhancement). The €61 billion, spreadbetween €49 billion in infrastructure and R&D, and €12 billion for SMEs, will attract private investors,to a total of €240 billion for the 'infrastructure and innovation window' and €75 billion for the 'SMEwindow', i.e. a total of €315 billion. See: Olivier Marty, The Juncker Plan, Fondation Robert Schuman,March 2015.
138 OECD, Stronger growth remains elusive: Urgent policy response is needed, Interim Economic Outlook,18 February 2016, p. 8.

Economic and budgetary outlook for the European Union 2017 Page 48 of 69
whether a leverage factor of 15 was actually feasible.139 The EIB group outlook for2016-2018 reckons that the number of new operations reaching financial closure everyyear might increase by more than 50 % as a result of EFSI volumes.140 While it usuallyfocuses on small numbers of large projects (with low risk), the introduction of EFSI maylead to the EIB assuming more and riskier projects.
By June 2016, in its one year of existence, a total of 263 finance agreements were signedunder EFSI (see Table 5), amounting to approved funds of €14.4 billion. These funds areexpected to have triggered investment of up to €106.4 billion, or around 34 % of the€315 billion target of the Juncker Plan.141 Under the 'SME Window',142 a total of 186operations were approved, with a volume of €3.4 billion and a signed amount of€3.3 billion. During the first year of EFSI, 77 operations fell into the category ofinfrastructure and innovation. The approved financing of these projects totalled€11 billion, out of which €4.7 billion have been signed to date.
Table 5 – EFSI state of play as of June 2016
Infrastructure andInnovation window
(EIB)
SME window(EIF) Total
Number of approved projects/financing agreements 77 186 263
Approved financing under EFSI (€ billion) 11 3.4 14.4
Signed financing under EFSI (€ billion) 4.7 3.3 8.0
Total expected investment triggered (€ billion) 58 48.4 106.4
Total expected investment triggered (%) 54.5 % 45.5 % 100 %
Source: European Commission, Executive summary of the evaluation, SWD(2016) 298 final, Brussels,14 September 2016, data as of 30 June 2016.
Data from November 2016 illustrates the sectoral coverage of EFSI transactions, which havebeen approved to date with most funding addressed to SMEs and Energy (see Figure 24).
139 See Guntram B. Wolff 2016, op. cit.140 European Investment Bank, Operational Plan 2016-2018, Luxembourg, January 2016, p. 9.141 While this figure increased from around 25 % in March 2016, the European Commission reported that
by November 2016, 49 % of the overall target was reached, i.e. an amount of €154 billion of triggeredinvestment.
142 'Infrastructure and innovation window' and 'SME window' are the two pillars of EFSI: The SME window,implemented through the EIF, guarantees supporting loans to SMEs with a higher-risk profile (COSME);guarantees supporting loans to innovative and research-intensive SMEs and Small Midcaps (InnovFin –Horizon 2020) and equity investment in venture capital and equity funds (without EU guarantee – RiskCapital Resource). Out of the 186 operations under the SME window, 71 were equity projects,43 COSME, and 72 InnovFin guarantee operations. See European Commission, Executive summary ofthe evaluation, SWD(2016) 298 final, Brussels, 14 September 2016, p. 2.

Economic and budgetary outlook for the European Union 2017 Page 49 of 69
Figure 24 – Sectoral coverage of EFSI transactions, approved as of November 2016, in %
Source: European Commission, data as of 15 November 2016. See also Commission's separate sector factsheets.143
While the European Commission, the EIB, and the EIF do provide data for individual EUMember States and on individual operations, consolidated cross-country comparisons(including approved vs. signed operations) are not easily available. Experience fromstandard EIB operations indicates some concentration of operations (see above).European Commission data on approved financing in the EU Member States illustrateshow the investment plan has worked out so far (see Figure 25). Combined investmentfor infrastructure and innovation and to SMEs since 2015 amounts to over €4 billion inItaly and France. The United Kingdom (€3.5 billion) and Spain (€3.4 billion) rank third andfourth. While SME financing, implemented by the EIF, has a relatively low share of totalEFSI lending in Poland (only €44 million out of €1.4 billion), the situation is reversed inthe Czech Republic (€275 million under the EIF’s SME window and only €79 million underthe EIB's infrastructure and innovation window).
143 Admittedly, EFSI financing is a dynamic process and projects often cover several sectors butunfortunately European Commission publications, even if published the same day, sometimes differregarding sectoral coverage data. Generally speaking, European Commission and EIB publications arenot perfectly in sync: While the Commission reports signed EFSI financing of €8 billion (see Table 5),the EIB’s own ‘operations evaluation’ of September lists €10.45 billion. Both publications refer to thesame period: as of 30 June 2016. European Commission, Evaluation, SWD(2016) 297 final, Brussels,14 September 2016; European Investment Bank, Operations evaluation, Luxembourg,September 2016.
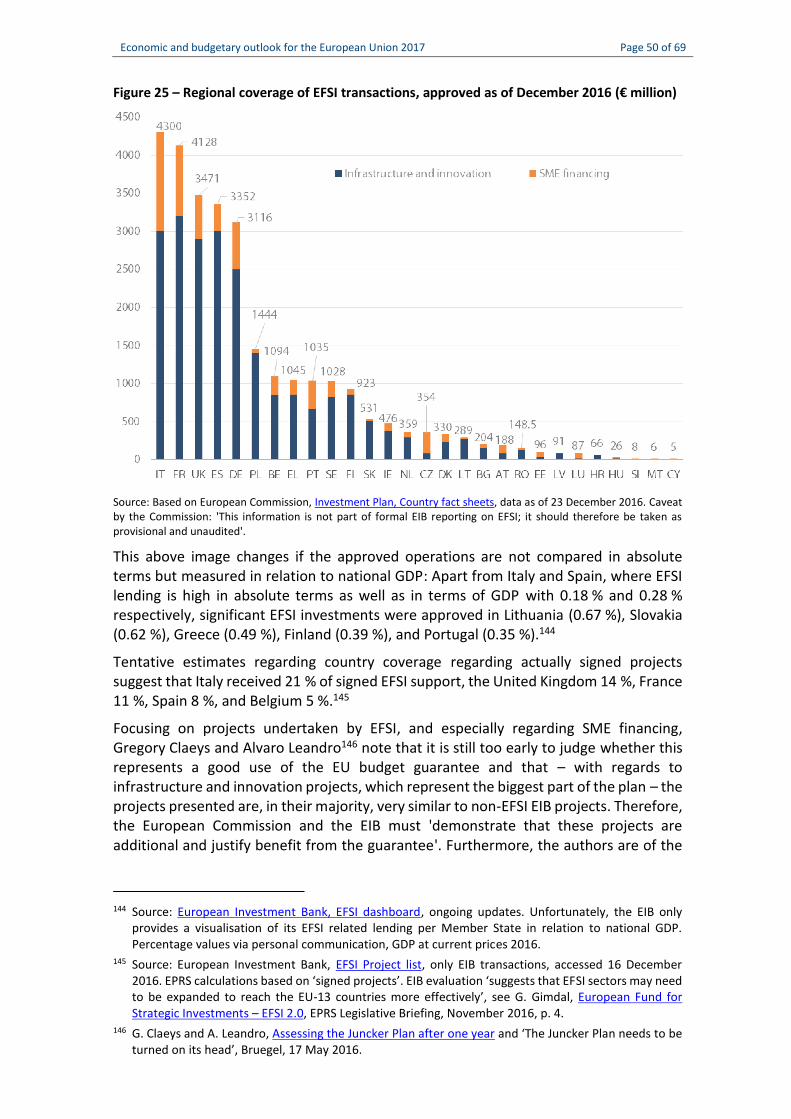
Economic and budgetary outlook for the European Union 2017 Page 50 of 69
Figure 25 – Regional coverage of EFSI transactions, approved as of December 2016 (€ million)
Source: Based on European Commission, Investment Plan, Country fact sheets, data as of 23 December 2016. Caveatby the Commission: 'This information is not part of formal EIB reporting on EFSI; it should therefore be taken asprovisional and unaudited'.
This above image changes if the approved operations are not compared in absoluteterms but measured in relation to national GDP: Apart from Italy and Spain, where EFSIlending is high in absolute terms as well as in terms of GDP with 0.18 % and 0.28 %respectively, significant EFSI investments were approved in Lithuania (0.67 %), Slovakia(0.62 %), Greece (0.49 %), Finland (0.39 %), and Portugal (0.35 %).144
Tentative estimates regarding country coverage regarding actually signed projectssuggest that Italy received 21 % of signed EFSI support, the United Kingdom 14 %, France11 %, Spain 8 %, and Belgium 5 %.145
Focusing on projects undertaken by EFSI, and especially regarding SME financing,Gregory Claeys and Alvaro Leandro146 note that it is still too early to judge whether thisrepresents a good use of the EU budget guarantee and that – with regards toinfrastructure and innovation projects, which represent the biggest part of the plan – theprojects presented are, in their majority, very similar to non-EFSI EIB projects. Therefore,the European Commission and the EIB must 'demonstrate that these projects areadditional and justify benefit from the guarantee'. Furthermore, the authors are of the
144 Source: European Investment Bank, EFSI dashboard, ongoing updates. Unfortunately, the EIB onlyprovides a visualisation of its EFSI related lending per Member State in relation to national GDP.Percentage values via personal communication, GDP at current prices 2016.
145 Source: European Investment Bank, EFSI Project list, only EIB transactions, accessed 16 December2016. EPRS calculations based on ‘signed projects’. EIB evaluation ‘suggests that EFSI sectors may needto be expanded to reach the EU-13 countries more effectively’, see G. Gimdal, European Fund forStrategic Investments – EFSI 2.0, EPRS Legislative Briefing, November 2016, p. 4.
146 G. Claeys and A. Leandro, Assessing the Juncker Plan after one year and ‘The Juncker Plan needs to beturned on its head’, Bruegel, 17 May 2016.

Economic and budgetary outlook for the European Union 2017 Page 51 of 69
view that, for better use of the current strategy, the EIB should 'turn it on its head'147 byusing EFSI only to finance innovative and risky projects that are unable to find fundingbecause of market failures; by the EIB financing a smaller share of each of its usual low-risk, non-EFSI, projects to avoid crowding out private investors; and instead increasingthe size of its investments in high-risk high-return projects, and being ready to take thefirst losses on these projects.
Rubio et al148 find several prerequisites necessary to trigger EFSI's full potential: asufficiently equipped European Investment Advisory Hub (EIAH) budget; reinforcedadvisory support for countries with 'less sophisticated financial markets and weakerpublic administrations'; clarified additionality149 conditions; as well as the conditions forgranting the EU guarantee to national promotional banks.
On 14 September 2016, the European Commission, in accordance with Article 18 ofRegulation (EU) 2015/1017, proposed an extension of EFSI's duration to31 December 2020, and the introduction of technical enhancements for that fund andthe European Investment Advisory Hub. The new proposal, referred to as EFSI 2.0,150
includes an increase in the EU guarantee from €16 to €26 billion and in EIB capital from€5 to €7.5 billion, which should mobilise private and public investment of €500 billion(up from €315 billion) over the period to 2020. The proposal also focuses on projectsustainability, enhancement of geographical coverage, and ways to reinforce take-up inless developed regions, while also aiming at enhancing the transparency of investmentdecisions and governance procedures, and reinforcing the social dimension by means ofadditional financial instruments.
On 11 November 2016, the European Court of Auditors (ECA) issued an opinion on theEuropean Commission proposal.151 The Court criticised the decision to propose theprolongation of EFSI in numerous ways: 'The Commission proposed an extension to EFSIonly one year after its launch, but there is little evidence that the proposed increase isjustified'. The deadline to submit a prolongation proposal was 5 July 2018 and 'was setby the co-legislators to ensure an assessment could take place after sufficient time hadpassed to allow the initial outcomes and impact of EFSI to be identified and measured'.152
The auditors also question the deletion of the provision linking the continuation of EFSIto the results of an independent evaluation'. In the ECA's view, 'reducing the provisioningrate for the guarantee fund from 50 % to 35 % is an opportunity to use scarce EU budgetresources more efficiently, but it will also increase the likelihood of further calls on theEU budget'. The Commission's decision to increase the EU guarantee from €16 to
147 Ibid, The Juncker Plan needs to be turned on its head, Bruegel, 8 June 2016.148 E. Rubio, D. Rinaldi, and T. Pellerin-Carlin, Investment in Europe. Making the best of the Juncker Plan,
Notre Europe, Jacques Delors Institute, Paris, March 2016, p. 167.149 ‘Additionality’ refers to ‘the criterion that a project should be selected only if it would not have been
realised at all or in this form without EFSI support. Obviously, not all projects are equally different orinnovative but all projects have to pass this general additionality test’ ... ‘EFSI projects must be“additional” in the sense that they point to a market failure or suboptimal investment situations andtherefore would – in principle – not have been financed in the same period by the EIB without EFSIsupport, or not to the same extent.’ Source: European Commission, Investment plan for Europe: Oneyear of the European Fund for Strategic Investments (EFSI) – Frequently Asked Questions, Brussels,1 June 2016.
150 See G. Gimdal, European Fund for Strategic Investments – EFSI 2.0, op. cit.151 European Court of Auditors, EFSI: An early proposal to extend and expand, Opinion No 2/2016,
Luxembourg, 11 November 2016.152 Op. cit, pp. 7-8.

Economic and budgetary outlook for the European Union 2017 Page 52 of 69
€26 billion, thus significantly increasing the EU budget's potential liability, means that'this in itself will be more than the total EU contribution to financial instruments undershared, indirect and direct management during the programming period 2007-2013.153
Regarding the implication that the Commission proposal to prolong EFSI could mean areduction in Horizon 2020 as well as CEF flows (as was actually the case for the CEF in theCommission document), in July 2016 the European Parliament stated that 'while fullyconfirming the notion of large-scale political and financial support for EFSI, the EU budgetshould not be financing new initiatives to the detriment of existing Union programmesand policies'.154 As early as 2015, Parliament voiced concerns regarding the initialCommission proposal. The Commission proposed that EU budget contribution to the EFSIcome from the Connecting Europe Facility (€3.3 billion), Horizon 2020 (€2.7 billion) andunallocated margins of the EU's Multiannual Financial Framework (€2 billion) in 2015.155
During the negotiations leading to the political agreement on EFSI, the EP insisted onfully offsetting the cuts made for the provision of the new Fund to the Horizon 2020 andCEF, which were ultimately lower than the proposed (€2.2 billion and €2.8 billionrespectively). The reinforcements introduced to both programmes in the 2016 and 2017annual budgets partly restore their budgets to initial levels. However, the 2016 proposalto extent the EFSI's duration to the end of 2020 involves additional redeployment of€500 million from the CEF. The Council agreed its position to extend the lifespan of EFSIon 6 December 2016. As of January 2017, the proposal awaits Parliaments' Committees'position.
6.2.3. Potential of the capital markets union initiativeAlongside EFSI, an important pillar of the European Commission's efforts to close theinvestment gap in the EU is the capital markets union initiative (CMU), translated in 2015into an ambitious action plan of 33 actions and related measures.156 The initiative seeksto address the lack of investment 'indirectly' – that is, among other things, by identifyingand eliminating barriers to cross-border investments, adopting measures that supportinfrastructure investment, and facilitating alternative sources of finance, to complementbank financing.157
An example of such measures is the European Commission's Delegated Regulation158 onthe calculation of risk-based capital requirements for insurance and reinsurancecompanies, when they invest in (among other things) infrastructure projects. Therationale is that insurers – in their role as long-term investors – could invest more in
153 Op. cit., p. 8. The sum of ERDF, ESF, rural development and financial instruments indirect managementfor the2017-2013 period was €16.1 billion (see table p. 9).
154 European Parliament, Resolution on the preparation of the post-electoral revision of the MFF 2014-2020: Parliament’s input ahead of the Commission’s proposal (P8_TA-PROV(2016)0309), Strasbourg,6 July 2016, Pt 43. See EP legislative observatory, procedural file 2016/0246(COD).
155 Committee on Budgets and Committee on Economic and Monetary Affairs Report on the proposal forregulation of the European Parliament and of the Council on the European Fund for StrategicInvestments and amending Regulations, 23 April 2015, Procedural file 2015/0009(COD).
156 European Commission, Action Plan on Building a Capital Markets Union, COM(2015) 468 final, Brussels,30 September 2015.
157 For more information on the six main areas of the plan and the implementation table of the variousinitiatives, see European Commission, DG FISMA, capital markets union – implementation table.
158 Delegated Regulation (EU) No 467/2016 of 30 September 2015 amending Commission DelegatedRegulation (EU) 2015/35 concerning the calculation of regulatory capital requirements for severalcategories of assets held by insurance and reinsurance undertakings. The Delegated Regulation enteredinto force on 2 April 2016.

Economic and budgetary outlook for the European Union 2017 Page 53 of 69
infrastructure projects (or in European Long-Term Investment Funds)159 if they did nothave to hold the current levels of capital against those investments. In September 2015,the European Commission estimated that EU insurers held less than 0.3 % of their totalassets (about €22 billion)160 in infrastructure investments and noted that, if the loweringof capital requirements proposed by the Delegated Regulation encouraged them toincrease their investment to 0.5 % of total assets, this would amount to an extra€20 billion invested in infrastructure in the EU.
The Regulation thus amends Solvency II,161 the prudential framework for insurers andreinsurers, providing that 'qualifying infrastructure investments'162 will benefit fromlower risk calibrations than they did. Similarly, it lowers the capital charges underSolvency II for investments in European long-term investment funds (ELTIFs), by loweringtheir capital charge to the level of equities traded on regulated markets.163
Another example is the European Commission's simple, transparent and standardised(STS) securitisation initiative. Securitisation is a financing technique by whichhomogeneous income-generating assets – which on their own may be difficult to trade– are pooled and sold to a specially created third party, which uses them as collateral toissue securities and sell them in financial markets. This allows issuing banks to transferthe risk of the underlying exposures to other investors (other banks, investment funds,etc.) and thus to diminish the capital they previously had to hold to protect themselvesfrom the risk of these exposures, thus 'freeing' capital which can potentially be used fornew loans to business and households.
While securitisation in the EU never reached the peaks of the USA, the Commissionestimated that, if it reached its pre-crisis averages, it could generate 'between€100-150 billion in additional funding for the economy'.164 Unfortunately, although theEuropean securitisation market grew significantly in the run-up to the 2008 financialcrisis, and European securitisation products weathered the crisis much better than theirUSA equivalents, the market has dramatically contracted since and currently remainssubdued, for a variety of reasons.165 To revive the market, the Commission proposed tworegulations: one introduces a set of criteria to identify STS securitisations,166 and one
159 European Long-Term Investment Funds, or ‘ELTIFs’, are funds which are meant to stimulate investmentin asset classes that require a long-term investor commitment. Regulation (EU) No 760/2015, OJ L 123,19 May 2015.
160 European Commission, New EU rules to promote investments in infrastructure projects, fact sheet,MEMO/15/5734, 30 September 2015.
161 Directive 2009/138/EC of the European Parliament and of the Council of 25 November 2009 on thetaking-up and pursuit of the business of insurance and reinsurance
162 See Delegated Regulation (EU) No 467/2016, OJ L 85, 1 April 2016, pp. 10-13.163 That is, 39 %, instead of the calibration of 49 % which applies to other equities.164 European Commission, Capital Markets Union: an Action Plan to boost business funding and
investment financing, press release, IP/15/5731, Brussels, 30 September 2015.165 For more, see Delivorias, Angelos, ‘Understanding securitisation – background − benefits − risks’, EPRS,
October 2015.166 Proposal for a regulation laying down common rules on securitisation and creating a European
framework for simple, transparent and standardised securitisation and amending Directives2009/65/EC, 2009/138/EC, 2011/61/EU and Regulations (EC) No 1060/2009 and (EU) No 648/2012. Seealso an explanatory factsheet by the European Commission and A. Delivorias, Common rules and newframework for securitisation, EPRS, July 2016.

Economic and budgetary outlook for the European Union 2017 Page 54 of 69
amends167 the Capital Requirements Regulation (CRR),168 to make the capital treatmentof securitisations for banks and investment firms more risk-sensitive and able to properlyreflect the specific features of STS securitisations.
The aforementioned examples show that, while the CMU does not involve 'tangibleamounts', such as the money committed through EFSI or by the EIB, it can potentiallycontribute significantly to an increase in investment in the EU, by removing obstacles tofinancial flows and by increasing access to finance for a variety of actors.
6.3. Potential developments6.3.1. Public investment in the EU in the near futureAccording to the EIB, public investment in the EU is expected to remain at similar levelsin 2016 and 2017. National budgetary documents presented during the 2016 EuropeanSemester (national reform and stability programmes) by large European economies donot contemplate significant increases in public investment levels over the medium term.Substantial heterogeneity remains, however. France, Italy and the Netherlands areexpected to register an all-time low in terms of public investment in this period. Publicinvestment in Germany, Denmark, Finland, Sweden and Belgium, on the other hand, isexpected to be above long-term averages and pre-crisis levels. Among the largeEuropean economies, the Polish stability programme is the only document reporting afairly significant increase in public investment, with 4.6 % of GDP in 2017 and 4.8 % in2018, 0.5 percentage points higher than the level expected in 2016.169
6.3.2. Possible EFSI evolutionsWhile the EFSI has been welcomed generally, several proposals have been voiced withregards to its potential evolution. These proposals fit broadly into two categories: thosewhich involve an additional goal or a different orientation for EFSI, and those whichinvolve a fundamental evolution of the fund.
In the first category, Michael Dauderstädt170 notes that, apart from closing theinvestment gap, the investment programme should also focus on 'restoring theimbalances in the European economy, in particular within the euro area'. To thispurpose, he is of the view that the supported projects should increase the capacity ofdebtor countries,171 such as Greece, Spain, Portugal or Italy, to sell goods and services tocreditor countries, such as Germany. Such an approach implies assistance to enterprisesand industries in the export sector of debtor countries. The author also considers analternative option, i.e. orienting investment towards import-substituting industries inthe debtor countries. This way, the countries in question could lower their currentaccount deficits (or create surpluses) that could then be used to reduce their debt.
According to the International Labour Organization (ILO), while '1.8 million direct andindirect jobs (0.8 % of total employment) can be created if the investment plan succeeds'
167 Proposal for a regulation amending Regulation (EU) No 575/2013 on prudential requirements for creditinstitutions and investment firms. See A. Stuchlik, Securitisation and capital requirements, EPRS,July 2016.
168 Regulation (EU) No 575/2013 of the European Parliament and of the Council of 26 June 2013 onprudential requirements for credit institutions and investment firms and amending Regulation (EU)No 648/2012, text with EEA relevance.
169 European Investment Bank, Investment and Investment Finance in Europe, op. cit., p. 39.170 M. Dauderstädt, How to close the European investment gap?, Friedrich-Ebert-Stiftung, 2015.171 The author refers to countries with current account deficits, who invest and consume more than they
save. See figure 5, p. 7.

Economic and budgetary outlook for the European Union 2017 Page 55 of 69
further gains in employment could be made if 'part of the funds were distributed byMember States' level of unemployment'172 (+200 000 jobs), and if 5 % of the financingstructure were reallocated 'towards measures to support improvement in skills'(+100 000 jobs).
In the second category, in a proposal formulated in view of EFSI, Natacha Valla et alproposed a 'eurosystem of investment banks', established by treaty and structuredaround 'a pan-European financial capacity that would coordinate the actions of thenational public investment banks of euro area Member States and add to their fundingcapacity'.173 The central node of this fund, the Fede Fund (ex EIB) would work as a federalentity, 'coordinating the activities of national entities with a clear European map inmind'174 and 'channelling the euro area's excess savings towards investment in the rightplaces throughout the continent'175 in an economically sustainable way, in return forMember State commitments to growth-enhancing structural reforms and economicpolicies. Eulalia Rubio et al note that, while the proposal is interesting, it presentssignificant challenges such as the 'enormous heterogeneity that exists between nationalpromotional banks (NPBs) in Europe in terms of size, funding sources or sheerexistence,176 to name but a few, or the hierarchical nature of the system, the politicalacceptance of which might be too radical in the present economic and political context.Instead, they propose to 'reinforce and expand cooperation initiatives between the EIBand NPBs'177 or to 'see NPBs putting money into EFSI's capital, thus converting thepermanent EU investment fund into a real joint initiative'.
Another proposal in this category would see the European Fund for Strategic Investmentbe converted after June 2017 into what the five Presidents' report calls a 'a commonmacroeconomic stabilisation function to better deal with shocks that cannot be managedat the national level alone'.178 While Rubio et al express their doubts on whether EFSIcould perform such a function,179 they think that EFSI has the potential to evolve insteadinto a 'fiscal mechanism to boost the aggregate demand of the whole euro area indifficult times'. This could be achieved by creating an investment platform for the euroarea, co-financed by EFSI and euro area NPBs. This platform would be similar to EFSI in
172 The ILO notes that ‘an analysis of the geographical destination of EIB funding reveals a high degree ofconcentration across EU Member States, with France, Germany, Italy and the United Kingdom receivingmore than 45 % of all funding’. At the same time, countries with a disproportionate increase inunemployment due to the crisis have not received more financing from the EIB. The ILO gives theexample of Greece (which receives 2.3 % of EIB funding, while hosting 5.1 % of the unemployed) andSpain (which receives 16.6 % of EIB funding, while hosting 23.1 % of all unemployed). As tounemployment rates per Member State see figure 2 and Annex 6.
173 Natacha Valla, Thomas Brand and Sébastien Doisy ‘A New Architecture for Public Investment in Europe:The Eurosystem of Investment Banks and the Fede Fund’, CEPII, July 2014.
174 E. Rubio, D. Rinaldi, and T. Pellerin-Carlin, op. cit.175 N. Valla et al. op. cit.176 Rubio et al. note that, ‘in some EU countries there are no NPBs at all’.177 Which could eventually lead to the creation of an ‘EU advisory council on investment’ involving the EIB
and all NPBs, providing advice to the European institutions and coordinating NPB investment.178 Jean-Claude Juncker, Donald Tusk, Jeroen Dijsselbloem, Mario Draghi, and Martin Schulz, Completing
Europe’s Economic and Monetary Union, Brussels, 22 June 2015.179 The focus of the function would be the euro area and not the whole EU. Thus, if EFSI was to play that
role, the guarantees backing EFSI should change, from EU budget guarantees, to guarantees only frominsured countries. In addition, the authors note that such a choice would necessitate the introductionof conditionality criteria, to prevent the allocation from undermining the incentives for soundeconomic and fiscal policy.

Economic and budgetary outlook for the European Union 2017 Page 56 of 69
that it would be free to select the projects it would finance, but it would differ in that itwould pursue a stabilisation function, prioritising those projects that have the mostimportant short-term impacts on jobs and growth, at the expense of longer-termprojects.

Economic and budgetary outlook for the European Union 2017 Page 57 of 69
7. Main referencesBassot, É., Hiller, W., Key policy challenges for the EU in 2017, EPRS, European Parliament,June 2016.
Becker, P., The EU Budget's Mid-term Review: With Its Promising Reform Proposals, theCommission Lays the Groundwork for the Next, Post-2020 Budget, Stiftung Wissenschaft undPolitik, SWP Comments 48, Berlin, November 2016.
Bénassy-Quéré, A., Ragot, X., Wolff, G. B., Which Fiscal Union for the Euro Area?, Les notes duconseil d'analyse économique, No 29, Paris, February 2016.
Bigsten, A., Quantifying the economic benefits of increased EU donor coordination, 2013.
Claeys, G., Leandro, A., Assessing the Juncker Plan after one year , Bruegel, May 2016.
Claeys, G., Leandro, A., The Juncker Plan needs to be turned on its head, Bruegel, June 2016.
Corbett, R., Jacobs, F., Neville, D., The European Parliament, 9th edition, John Harper Publishing,2016.
Cottarelli, C., Guerguil, M. (eds.), Designing a European Fiscal Union. Lessons from the experienceof existing federations, Routledge, 2015.
Council of the European Union, Council Decision of 26 May 2014 on the system of own resourcesof the European Union (2014/335/EU, Euratom).
D'Alfonso, A., How the EU budget is financed. The 'own resources' system and the debate on itsreform, EPRS, European Parliament, 2014.
D'Alfonso, A., Discharge procedure for the EU budget. Political scrutiny of budgetimplementation, EPRS, European Parliament, 2016.
D'Alfonso, A., The UK 'rebate' on the EU budget: An explanation of the abatement and othercorrection mechanisms, EPRS, European Parliament, 2016.
D'Alfonso, A., 2014-2020 Multiannual Financial Framework (MFF): Mid-term revision, EPRS,European Parliament, December 2016
D'Alfonso, A., Sapała, M., Payments backlog in in recent EU budgets. Lessons learnt and outlook,EPRS, European Parliament, November 2015.
D'Alfonso, A., Stuchlik, A., A fiscal capacity for the euro area?, EPRS, European Parliament,September 2016.
Dutch Presidency of the Council, Towards a forward-looking and flexible Multiannual FinancialFramework, Presidency report, 30 May 2016.
Enderlein, H., What should happen? What is likely to happen? Notes on Brexit, Jacques DelorsInstitut – Berlin, 30 June 2016.
European Central Bank, Determinants of the slowdown in global trade: what is the new normal?,ECB Economic Bulletin, Issue 6, 2016, pp. 30-33.
European Central Bank, The employment-GDP relationship since the crisis, ECB EconomicBulletin, Issue 6, 2016, pp. 53-71
European Central Bank, The impact of uncertainty on activity in the euro area, ECB EconomicBulletin, Issue 8, 2016. pp. 55-74.
European Commission, Commission staff working paper, The added value of the EU budget(SEC (2011)0867), 29 June 2011.
European Commission, Statement of estimates of the European Commission for the financialyear 2017, SEC(2016)280 – June 2016.

Economic and budgetary outlook for the European Union 2017 Page 58 of 69
European Commission, Commission staff working document, Mid-term review/revision of themultiannual financial framework 2014-2020. An EU budget focused on results, SWD(2016) 299final, 14 September 2016.
European Commission, Amending letter No 1 to the Draft General Budget 2017, COM(2016) 679final, 17 October 2016.
European Commission, Commission staff working document, Activities relating to financialinstruments, (SWD(2016) 0335), 24 October 2016.
European Commission, European Economic Forecast Autumn 2016, Brussels, 9 November 2016.
European Commission, Annual Growth Survey 2017, COM(2016) 725 final, Brussels,16 November 2016.
European Commission, Report on the Euro Area concerning the Recommendation for a CouncilRecommendation on the economic policy of the euro area', SWD(2016) 391 final, Brussels,22 November 2016.
European Commission, Communication, Investment Plan for Europe: evaluations give evidenceto support its reinforcement, COM(2016) 764 final, 29 November 2016.
European Commission, Directorate-General for Budget,http://ec.europa.eu/budget/index_en.cfm [Accessed December 2016].
European Court of Auditors, Opinion No 4/2005 on a proposal for a Council decision on thesystem of the European Communities' own resources and on a proposal for a Council regulationon the implementing measures for the correction of budgetary imbalances in accordance withArticles 4 and 5 of the Council Decision of (…) on the system of the European Communities' ownresources, OJ C 167, Luxembourg, 7 July 2005.
European Court of Auditors, Making the best use of EU money: a landscape review of the risksto the financial management of the EU budget, landscape review, 2014.
European Court of Auditors, Annual report on the implementation of the budget concerning thefinancial year 2015, OJ C 375, Luxembourg, 13 October 2016.
European Court of Auditors, EU budget: time to reform? A briefing on the mid-term review ofthe Multiannual Financial Framework 2014-2020, Luxembourg, 28 October 2016.
European Court of Auditors, Implementing the EU budget through financial instruments – lessonsto be learnt from the 2007-2013 programme period (Special Report No 19), Luxembourg,7 July 2016.
European Court of Auditors, EFSI: An early proposal to extend and expand, Opinion No 2/2016,Luxembourg, 11 November 2016.
European Investment Bank, 2014 Activity Report, Luxembourg, March 2015.
European Investment Bank, 2014 Financial Report, Luxembourg, March 2015.
European Investment Bank, The EIB Group Operational Plan 2016-2018, Luxembourg,January 2016.
European Investment Bank, 2015 Financial Report, Luxembourg, April 2016.
European Investment Bank, 2015 Statistical Report, Luxembourg, April 2016.
European Investment Bank, 2015 Activity Report, Luxembourg, May 2016.
European Investment Bank, 2015 Annual Report on EIB operations inside the EU, Luxembourg,July 2016.
European Investment Bank, Investment plan for Europe. The first year, Luxembourg,September 2016.
European Investment Bank, Investment and Investment Finance in Europe 2016, Luxembourg,November 2016.

Economic and budgetary outlook for the European Union 2017 Page 59 of 69
European Parliament, Report on the European Investment Bank (EIB) annual report 2014,2015/2127(INI).
European Parliament, Report on discharge in respect of the implementation of the generalbudget of the European Union for the financial year 2014, Section III – Commission and executiveagencies, 13 April 2016.
European Parliament, Legislative resolution of 16 April 2014 on the draft Council decision on thesystem of own resources of the European Union, P7_TA(2014)0432.
European Parliament, Performance-based budgeting, DG for Internal Policies, Policy DepartmentD, 2015.
European Parliament, European Fund for Sustainable Development (EFSD), EFSD Guarantee andEFSD Guarantee Fund, 2016/0281(COD).
European Parliament, Resolution of 6 July 2016 on the preparation of the post-electoral revisionof the MFF 2014-2020: Parliament's input ahead of the Commission's proposal(P8_TA(2016)0309).
European Parliament, Resolution of 26 October 2016 on the mid-term revision of the MFF 2014-2020 (P8_TA-PROV(2016)0412).
Gimdal, G., European Fund for Strategic Investments – EFSI 2.0, EPRS, European Parliament,November 2016.
Haas, J., and Rubio, E., Brexit and the EU budget: threat or opportunity?, Notre Europe - JacquesDelors Institute, Policy paper, January 2017.
High Level Group on Own Resources, Future financing of the EU: Final report andrecommendations, December 2016.
International Monetary Fund, World Economic Outlook, Washington D.C., October 2016.(January 2017 Update).
Nogaj, M., The Cost of Non-Europe in Development Policy: Increasing coordination between EUdonors, European Added Value Unit, European Parliament, 2013.
Núñez Ferrer, J., Le Cacheux, J., Benedetto, G., and Saunier, M., Study on the potential andlimitations of reforming the financing of the EU budget, 3 June 2016, CEPS, Université de Pau etdes Pays de l'Adour, LSE Enterprise and Deloitte.
Núñez Ferrer, J, and Rinaldi, D., The Impact of Brexit on the EU Budget: A non-catastrophic event,CEPS Policy Brief No 347, 7 September 2016.
Núñez Ferrer, J., The Multiannual Financial Framework post-2020: Balancing political ambitionand realism, CEPS Policy Paper No 2, 18 November 2016.
OECD, European Union - DAC Peer Review of Development Co-operation, 2012.
OECD, Economic Outlook, Volume 2016, Issue 2, Paris, 17 December 2016.
Pasimeni, P., Riso, S., The redistributive function of the EU budget, IMK – Hans-Böckler-Stiftung,Working Paper No 174, November 2016.
Patterson, B., Understanding the EU budget, Searching Finance, London, 2011.
Peel, Q., 'A fair deal demands that Britain rethink the rebate', Financial Times, 8 December 2005.
Rubio, E., Rinaldi, D., Pellerin-Carlin, T., Investment in Europe. Making the best of the JunckerPlan, Notre Europe, Jacques Delors Institute, Paris, March 2016.
Sapała, M., Mid-term review/revision of the MFF. Kay issues at the outset of the debate, briefing,EPRS, European Parliament, January 2016.
Sapała, M., Mid-term review of the Multiannual Financial framework 2014-2020 – A round-up ofkey issues at stake, Perspectives on Federalism, Vol. 8, issue 2, 2016.

Economic and budgetary outlook for the European Union 2017 Page 60 of 69
Stuchlik, A., The European Investment Bank. Annual Report 2014 and outlook, briefing, EPRS,European Parliament, April 2016.
Szczepański, M., Public investment to support long term economic growth in the EU, briefing,EPRS, European Parliament, July 2016.
The World Bank, Global Economic Prospects. Weak investment in uncertain times, WashingtonD.C., January 2017.
Zuleeg, F., 'Britain outside Europe? Fewer EU concessions to UK post-Brexit', European PolicyCentre, 2014.

Economic and budgetary outlook for the European Union 2017 Page 61 of 69
8. AnnexesAnnex 1 – EU spending allocation by Member State in 2015 (€ million)
Heading 1 2 3 4 5 9
Subheading 1a 1b
2015 (€ million)Co
mpe
titi
vene
ssfo
r gro
wth
and
jobs
Econ
omic
, soc
ial
and
terr
itor
ial
cohe
sion
SUST
AIN
ABL
EG
ROW
TH:
NA
TURA
LRE
SOU
RCES
SECU
RITY
AN
DCI
TIZE
NSH
IP
GLO
BAL
EURO
PE
AD
MIN
ISTR
ATI
ON
SPEC
IAL
INST
RUM
ENTS
TOTA
LEX
PEN
DIT
URE
BE 1 155.6 412.0 657.1 202.7 0.0 4 521.6 2.9 6 951.9
BG 118.1 1 421.2 1 107.3 27.2 25.4 11.5 18.9 2 729.5
CZ 104.1 5 808.5 1 140.0 6.3 0.6 15.1 0.0 7 074.7
DK 285.6 102.8 1 074.1 12.7 0.0 53.5 0.0 1 528.6
DE 1 913.1 2 704.2 6 041.0 148.0 0.0 206.9 0.0 11 013.3
EE 53.4 154.8 181.6 43.6 0.6 8.6 0.0 442.6
IE 194.3 129.1 1 618.2 18.9 0.0 47.7 0.4 2 008.6
EL 254.7 3 067.6 2 774.6 63.7 0.0 28.9 20.0 6 209.7
ES 1 220.1 5 458.1 6 764.6 156.7 0.0 96.2 0.0 13 695.7
FR 2 221.1 2 670.8 9 031.9 189.9 0.0 328.8 25.9 14 468.4
HR 32.5 222.6 258.0 18.7 46.4 8.9 17.6 604.6
IT 1 060.2 5 219.8 5 473.0 250.5 0.0 259.3 75.6 12 338.5
CY 36.6 62.3 82.9 13.8 0.1 7.5 0.0 203.3
LV 47.9 663.0 253.7 7.5 0.2 9.3 0.0 981.6
LT 99.0 197.9 528.4 41.3 0.4 10.3 0.0 877.2
LU 175.3 14.9 56.0 22.1 0.0 1 381.1 0.0 1 649.4
HU 81.5 3 693.2 1 791.4 42.2 6.4 14.5 0.0 5 629.1
MT 19.1 76.8 17.0 14.1 0.0 7.0 0.0 134.2
NL 962.5 196.4 915.3 186.6 0.0 98.4 0.0 2 359.2
AT 307.2 262.7 1 144.9 49.9 0.0 22.9 0.0 1 787.4
PL 166.8 7 985.6 5 079.0 68.6 26.9 29.6 1.3 13 357.7
PT 212.4 1 215.7 1 097.8 36.2 0.0 33.2 0.0 2 595.4
RO 77.4 3 392.5 2 987.7 23.6 29.3 19.1 8.5 6 538.0
SI 76.3 624.5 191.3 19.4 1.4 8.7 18.4 939.9
SK 61.6 3 086.3 566.5 9.0 0.5 10.9 0.0 3 734.8
FI 208.4 106.9 960.3 21.6 0.0 30.2 2.6 1 330.0
SE 298.5 140.0 904.0 90.6 0.0 34.6 0.0 1 467.7
UK 1 589.6 1 782.7 3 788.5 149.5 0.0 147.4 0.0 7 457.6
EU-28 13 032.7 50 872.9 56 486.0 1 935.0 138.0 7 451.8 192.2 130 108.6
earmarked 851.2 245.9 1 430.7 47.3 231.9 424.8 35.5 3 267.2
other 1 228.0 54.8 24.0 5.3 1 611.6 828.0 0.0 3 751.7
non-EU 1 690.0 33.7 124.9 31.0 5 902.9 273.0 60.2 8 115.7
Total 16 801.9 51 207.3 58 065.5 2 018.5 7 884.4 8 977.6 287.9 145 243.2
Source: EPRS, based on European Commission, Financial report 2015.

Economic and budgetary outlook for the European Union 2017 Page 62 of 69
Annex 2 – Own resources by Member State in 2015 (€ million and % of GNI)
VA
T-ba
sed
reso
urce
GN
I-bas
ed
reso
urce
UK
corr
ecti
on
TOTA
Lna
tion
alco
ntri
buti
on
Trad
itio
nal o
wn
reso
urce
s (T
OR)
,ne
t (75
%)
TOTA
L ow
n
reso
urce
s
1 2* 3** 4=1+2+3*** % GNI 5 6=4+5 % GNI
BE 584.7 2 826.4 280.8 3 691.9 0.89 % 1 778.8 5 470.7 1.32 %
BG 61.1 333.0 30.0 424.1 0.99 % 59.8 484.0 1.13 %
CZ 206.1 1 007.2 101.9 1 315.2 0.87 % 227.2 1 542.4 1.02 %
DK 294.5 1 715.4 180.6 2 190.6 0.80 % 330.6 2 521.2 0.92 %
DE 3 673.2 20 249.5 360.7 24 283.4 0.79 % 3 842.0 28 125.5 0.91 %
EE 29.1 141.5 14.1 184.8 0.92 % 25.3 210.1 1.05 %
IE 222.1 1 216.6 119.8 1 558.4 0.86 % 280.9 1 839.3 1.01 %
EL 171.1 916.9 117.7 1 205.6 0.68 % 137.2 1 342.8 0.76 %
ES 1 255.0 6 768.1 749.3 8 772.5 0.81 % 1 317.0 10 089.4 0.93 %
FR 2 849.1 14 669.2 1 494.2 19 012.5 0.85 % 1 593.7 20 606.2 0.93 %
HR 61.1 269.5 26.1 356.8 0.82 % 40.3 397.1 0.91 %
IT 1 486.9 11 619.4 1 125.2 14 231.6 0.87 % 1 688.7 15 920.3 0.97 %
CY 35.5 162.5 13.8 211.9 1.21 % 18.3 230.2 1.32 %
LV 28.5 161.6 15.8 205.9 0.85 % 29.7 235.6 0.97 %
LT 42.9 247.4 25.6 315.8 0.88 % 73.9 389.7 1.09 %
LU 60.2 274.3 15.7 350.3 1.02 % 16.5 366.8 1.07 %
HU 134.2 738.2 73.5 945.8 0.89 % 127.8 1 073.6 1.02 %
MT 15.6 70.4 6.4 92.3 1.08% 11.8 104.1 1.22 %
NL 770.7 4 902.1 86.4 5 759.2 0.85 % 2 187.9 7 947.1 1.17 %
AT 445.3 2 047.6 36.3 2 529.2 0.75 % 197.1 2 726.4 0.81 %
PL 542.5 2 898.5 277.0 3 718.0 0.90 % 518.4 4 236.4 1.03 %
PT 253.9 1 153.4 121.4 1 528.7 0.87 % 117.7 1 646.4 0.94 %
RO 153.0 1 058.1 108.3 1 319.4 0.84 % 127.0 1 446.4 0.92 %
SI 56.9 257.7 26.0 340.7 0.89 % 62.7 403.4 1.06 %
SK 85.0 473.4 49.5 607.9 0.80 % 88.9 696.8 0.92 %
FI 265.6 1 328.9 134.5 1 729.1 0.83 % 125.1 1 854.1 0.89 %
SE 565.4 2 898.1 49.8 3 513.3 0.77 % 506.0 4 019.3 0.88 %
UK 3 737.5 20 555.6 -6 083.6 18 209.4 0.72 % 3 199.9 21 409.3 0.85 %
EU-28 18 087.0 100 960.4 -443.0 118 604.3 0.81 % 18 730.4 137 334.7 0.94 %
Surplus from previous year 1 434.6
Surplus external aid guarantee fund 0.0
Other revenue 7 258.2
Total revenue 146 027.4
Source: EPRS based on European Commission, Financial report 2015, p. 29.

Economic and budgetary outlook for the European Union 2017 Page 63 of 69
Annex 3 – The EU budget 2016, 20172016 Budget(incl. AB1-6) 2017 Budget Difference
CA PA CA PA CA PA
SMART AND INCLUSIVE GROWTH 69 841.150 59 290.698 74 898.754 56 521.764 7.2 % -4.7 %
Competitiveness for growth and jobs 19 010.000 17 402.424 21 312.156 19 320.945 12.1 % 11.0 %
— Large infrastructure projects 1 767.856 1 564.805 1 827.610 1 810.612 3.4 % 15.7 %
— European satellite navigation systems(EGNOS and Galileo) 851.569 523.400 897.465 687.500 5.4 % 31.4 %
— International Thermonuclear ExperimentalReactor (ITER) 330.120 458.805 322.713 426.340 -2.2 % -7.1 %
— European Earth Observation Programme(Copernicus) 586.167 582.600 607.432 696.772 3.6 % 19.6 %
— Nuclear Safety and Decommissioning 135.644 150.000 138.357 150.092 2.0 % 0.1 %
— European Fund for Strategic Investments (EFSI) 2 128.908 525.000 2 661.000 2 316.800 25.0 % 341.3 %
— Common Strategic Framework (CSF) Researchand Innovation 9 856.162 10 344.860 10 687.139 10 543.977 8.4 % 1.9 %
— Horizon 2020 9 539.427 10 069.144 10 345.931 10 196.300 8.5 % 1.3 %
— Euratom Research and Training Programme 316.735 275.716 341.208 347.677 7.7 % 26.1 %
— Competitiveness of enterprises and small andmedium-sized enterprises (COSME) 295.257 262.254 349.314 369.164 18.3 % 40.8 %
— Education, Training and Sport (Erasmus+) 1 733.970 1 805.095 2 064.157 1 886.872 19.0 % 4.5 %
— Employment and Social Innovation (EaSI) 127.095 90.278 136.044 97.420 7.0 % 7.9 %
— Customs, Fiscalis and Anti-Fraud 125.592 124.293 137.053 117.247 9.1 % -5.7 %
— Connecting Europe Facility (CEF) 2 137.656 1 673.822 2 547.020 1 211.604 19.2 % -27.6 %
— Energy 548.684 177.849 699.730 123.244 27.5 % -30.7 %
— Transport 1 448.057 1 415.932 1 723.333 970.528 19.0 % -31.5 %
— Information and CommunicationsTechnology (ICT) 140.915 80.042 123.957 117.833 -12.0 % 47.2%
— Energy projects to aid economic recovery (EERP) 0.000 176.000 0.000 110.000 ∞ -37.5 %
— Other actions and programmes 211.280 203.431 219.945 196.307 4.1 % -3.5 %
— Actions financed under the prerogatives of theCommission and specific competencesconferred to the Commission
134.861 123.437 143.878 131.271 6.7 % 6.3 %
— Pilot projects and preparatory actions 29.575 32.130 56.390 43.831 90.7 % 36.4 %
— Decentralised agencies 326.145 327.019 344.249 335.748 5.6 % 2.7 %
Economic, social and territorial cohesion 50 831.150 41 888.274 53 586.599 37 200.819 5.4 % -11.2 %
— Investment for growth and jobs 46 656.745 39 112.643 49 278.457 34 603.458 5.6 % -11.5 %
— Regional convergence (Less developedregions) 24 766.664 24 674.260 26 121.899 19 314.948 5.5 % -21.7 %
— Transition regions 5 028.787 1 960.003 5 627.243 3 313.970 11.9 % 69.1 %
— Competitiveness (More developed regions) 7 905.138 5 764.291 8 251.458 5 853.379 4.4 % 1.5 %
— Outermost and sparsely populated regions 217.673 98.017 222.029 139.873 2.0 % 42.7 %
— Cohesion fund 8 738.484 6 616.072 9 055.828 5 981.288 3.6 % -9.6 %
— Connecting Europe Facility (CEF) – CFcontribution 2 376.534 382.813 1 593.295 382.682 -33.0 % 0.0 %
— European territorial cooperation 1 048.839 695.510 1 939.824 968.901 84.9 % 39.3 %
— Youth Employment initiative (specific top-upallocation)
0.000 1 050.000 0.000 600.000 ∞ -42.9 %

Economic and budgetary outlook for the European Union 2017 Page 64 of 69
— Technical assistance and innovative actions 200.950 173.771 215.966 190.091 7.5 % 9.4 %
— European Aid to the Most Deprived (FEAD) 535.583 461.430 546.257 441.430 2.0 % -4.3 %
— Pilot projects and preparatory actions 12.500 12.107 12.800 14.257 2.4 % 17.8 %
SUSTAINABLE GROWTH: NATURAL RESOURCES 62 469.515 54 972.404 58 584.444 54 913.970 -6.2 % -0.1 %
— European Agricultural Guarantee Fund (EAGF)— Market related expenditure and directpayments
42 219.086 42 212.046 42 612.572 42 562.968 0.9 % 0.8 %
— European Agricultural Fund for RuralDevelopment (EAFRD) 18 676.290 11 746.393 14 365.516 11 208.461 -23.1 % -4.6 %
— European Maritime and Fisheries Fund (EMFF) 891.356 431.853 911.742 577.385 2.3 % 33.7 %
— Sustainable Fisheries Partnership Agreements(SFPAs) and compulsory contributions toRegional Fisheries Management Organisations(RFMOs) and to other internationalorganisations
135.670 132.265 138.400 133.400 2.0 % 0.9 %
— Environment and climate action (LIFE) 462.796 355.254 493.737 363.668 6.7 % 2.4 %
— Other actions and measures 30.000 30.000 0.000 0.000 -100.0 % -100.0 %
— Actions financed under the prerogatives of theCommission and specific competencesconferred to the Commission
0.300 0.805 0.000 0.000 -100.0 % -100.0 %
— Pilot projects and preparatory actions 7.900 17.671 7.700 13.311 -2.5 % -24.7 %
— Decentralised agencies 46.116 46.116 54.777 54.777 18.8 % 18.8 %
SECURITY AND CITIZENSHIP 4 292.067 3 022.388 4 284.031 3 786.957 -0.2 % 25.3 %
— Asylum, Migration and Integration Fund 1 920.289 1 049.085 1 620.259 1 182.103 -15.6 % 12.7 %
— Internal Security Fund 715.534 394.985 738.555 747.655 3.2 % 89.3 %
— IT systems 19.321 29.783 19.708 16.907 2.0 % -43.2 %
— Justice 51.450 44.610 53.831 41.489 4.6 % -7.0 %
— Rights, Equality and Citizenship 59.952 51.700 62.615 46.800 4.4 % -9.5 %
— Union Civil protection Mechanism 30.574 27.750 31.025 30.925 1.5 % 11.4 %
— Europe for Citizens 25.340 23.813 26.441 26.370 4.3 % 10.7 %
— Food and feed 252.996 241.860 256.228 234.470 1.3 % -3.1 %
— Health 62.160 70.209 64.529 57.709 3.8 % -17.8 %
— Consumer 25.893 20.991 26.923 20.731 4.0 % -1.2 %
— Creative Europe 191.813 195.987 207.912 176.861 8.4 % -9.8 %
— Instrument for Emergency Support within theUnion (IES) 150.000 90.200 200.000 219.000 33.3 % 142.8 %
— Actions financed under the prerogatives of theCommission and specific competencesconferred to the Commission
99.320 88.427 100.908 102.328 1.6 % 15.7 %
— Of which 'Communication actions' 71.073 64.137 76.253 73.805 7.3 % 15.1 %
— Pilot projects and preparatory actions 11.075 16.807 11.650 19.463 5.2 % 15.8 %
— Decentralised agencies 676.349 676.180 863.447 864.147 27.7 % 27.8 %
GLOBAL EUROPE 9 167.033 10 155.590 10 162.120 9 483.081 10.9 % -6.6 %
— Instrument for Pre-accession assistance (IPA II) 1 662.287 2 079.168 2 114.743 1 716.169 27.2 % -17.5 %
— European Neighbourhood Instrument (ENI) 2 186.519 2 328.575 2 440.357 2 357.990 11.6 % 1.3 %
— Development Cooperation Instrument (DCI) 2 629.886 2 728.965 3 168.186 2 768.536 20.5 % 1.5 %
— Partnership instrument for cooperation withthird countries (PI)
125.648 109.044 133.713 135.871 6.4 % 24.6 %
— European Instrument for Democracy andHuman Rights (EIDHR) 185.506 180.507 188.998 168.353 1.9 % -6.7 %

Economic and budgetary outlook for the European Union 2017 Page 65 of 69
— Instrument contributing to Stability and Peace(IcSP) 326.650 316.419 273.280 294.180 -16.3 % -7.0 %
— Humanitarian aid (HUMA) 1 108.772 1 471.155 945.429 1 145.810 -14.7 % -22.1 %
— Common Foreign and Security Policy (CFSP) 327.270 298.635 327.270 294.051 0.0 % -1.5 %
— Instrument for Nuclear Safety Cooperation(INSC) 71.802 96.987 62.331 81.447 -13.2 % -16.0 %
— Macro-financial Assistance (MFA) 79.669 79.669 45.828 45.828 -42.5 % -42.5 %
— Guarantee Fund for external actions (GF) 257.122 257.122 240.540 240.540 -6.4 % -6.4 %
— Union Civil Protection Mechanism 17.551 18.861 20.711 19.578 18.0 % 3.8 %
— EU Aid Volunteers initiative (EUAV) 17.874 14.189 22.011 23.718 23.1 % 67.2 %
— Other actions and programmes 83.760 78.210 84.148 92.770 0.5 % 18.6 %
— Actions financed under the prerogatives of theCommission and specific competencesconferred to the Commission
63.762 60.756 66.055 67.310 3.6 % 10.8 %
— Pilot projects and preparatory actions 3.000 17.372 8.750 11.159 191.7 % -35.8 %
— Decentralised agencies 19.956 19.956 19.771 19.771 -0.9 % -0.9 %
ADMINISTRATION 8 951.016 8 950.916 9 394.514 9 394.600 5.0 % 5.0 %
— Of which: Administrative expenditure of theinstitutions
7 134.870 7 134.770 7 418.903 7 418.989 4.0 % 4.0 %
— Pensions and European Schools 1 816.146 1 816.146 1 975.611 1 975.611 8.8 % 8.8 %
— Pensions 1 640.510 1 640.510 1 789.856 1 789.856 9.1 % 9.1 %
— European schools 175.636 175.636 185.755 185.755 5.8 % 5.8 %
— Administrative expenditure of the institutions 7 134.870 7 134.770 7 418.903 7 418.989 4.0 % 4.0 %
— European Parliament 1 838.414 1 838.414 1 909.295 1 909.295 3.9 % 3.9 %
— European Council and Council 545.054 545.054 561.576 561.576 3.0 % 3.0 %
— Commission 3 356.929 3 356.829 3 498.411 3 498.497 4.2 % 4.2 %
— Court of Justice of the European Union 379.981 379.981 399.323 399.323 5.1 % 5.1 %
— Court of Auditors 137.557 137.557 141.240 141.240 2.7 % 2.7 %
— European Economic and Social Committee 130.586 130.586 133.807 133.807 2.5 % 2.5 %
— Committee of the Regions 90.546 90.546 93.295 93.295 3.0 % 3.0 %
— European Ombudsman 10.384 10.384 10.650 10.650 2.6 % 2.6 %
— European data-protection Supervisor 9.288 9.288 11.325 11.325 21.9 % 21.9 %
— European External Action Service 636.130 636.130 659.980 659.980 3.7 % 3.7 %
APPROPRIATIONS FOR HEADINGS 154 720.781 136 391.995 157 323.863 134 100.371 1.7 % -1.7 %
Appropriations as % of GNI 1.05% 0.93% 1.05% 0.89%
Other special instruments 556.087 250.475 533.924 390.000 -4.0 % 55.7 %
— Emergency Aid Reserve (EAR) 309.000 139.000 315.000 315.000 1.9 % 126.6 %
— European Globalisation Adjustment Fund (EGF) 165.612 30.000 168.924 25.000 2.0 % -16.7 %
— European Union Solidarity Fund (EUSF) 81.475 81.475 50.000 50.000 -38.6 % -38.6 %
TOTAL APPROPRIATIONS 155 276.868 136 642.471 157 857.787 134 490.371 1.7 % -1.6 %
Appropriations as % of GNI 1.06 % 0.93 % 1.05 % 0.89 %
Source: EPRS, based on European Commission data. Figures for the 2017 budget have been approved (see Section 4),and await final publication in the Official Journal of the European Union. See also European Parliament, LegislativeObservatory 2016/2047(BUD). The heading 'Compensations' is only part of the 2014-2020 MFF because of theinclusion of a dedicated budget line due to Croatia's accession in the annual budget of 2014.

Economic and budgetary outlook for the European Union 2017 Page 66 of 69
Annex 4 – List of rapporteurs of main budgetary procedures relevant for 2017
Committee on Budgets (BUDG)
Chair: Jean Arthuis (ALDE, France)
Multiannual financial framework for the years 2014-2020: special instruments
Rapporteurs: Jan Olbrycht (EPP, Poland), Isabelle Thomas (S&D, France)
Shadow rapporteurs: Richard Ashworth (ECR, United Kingdom), Gérard Deprez, (ALDE,Belgium), Liadh Ní Riada (GUE-NGL, Ireland), Younous Omarjee (GUE-NGL, France), ErnestMaragall (Greens–EFA, Spain), Marco Zanni (EFDD, Italy)
2017 general budget: all sections
Rapporteurs: Jens Geier (S&D, Germany), Indrek Tarand (Greens–EFA, Estonia)
Shadow rapporteurs: Siegfried Mureșan (EPP, Romania), Bernd Kölmel (ECR, Germany),Gérard Deprez (ALDE, Belgium), Liadh Ní Riada (GUE-NGL, Ireland), Ernest Maragall (Greens,Spain), Marco Zanni (EFDD, Italy), Stanisław Żółtek (ENF, Poland)
Financial rules applicable to the general budget of the Union: simplification
Rapporteur: Ingeborg Grässle (EPP, Germany)
Shadow rapporteurs: Vladimir Maňka (S&D, Slovakia), Liadh Ní Riada (GUE-NGL, Ireland),Indrek Tarand (Greens–EFA, Estonia)
Budgetary Control Committee (CONT)
Chair: Ingeborg Grässle (EPP, Germany)
2015 Discharge – European Commission
Rapporteur: Joachim Zeller (EPP, Germany)
Shadow rapporteurs: Boguslaw Liberadzki (S&D, Poland), Anders Primdahl Vistisen (ECR,Denmark), Martina Dlabajová (ALDE, Czech Republic), Luke Ming Flanagan (GUE-NGL, Ireland),Bart Staes (ALDE, Belgium), Marco Valli (EFDD, Italy), Louis Aliot (ENF, France)
2015 Discharge – ECA Special Reports in the context of 2015 Discharge to the EuropeanCommission
Rapporteur: Joachim Zeller (EPP, Germany)
Shadow rapporteurs: Boguslaw Liberadzki (S&D, Poland), Anders Primdahl Vistisen (ECR,Denmark), Martina Dlabajová (ALDE, Czech Republic), Miguel Viegas (GUE-NGL, Portugal), BartStaes (ALDE, Belgium), Marco Valli (EFDD, Italy), Louis Aliot (ENF, France)

Economic and budgetary outlook for the European Union 2017 Page 67 of 69
2015 Discharge – The European Development Funds (EDF)
Rapporteur: Younous Omarjee (GUE-NGL, France)
Shadow rapporteurs : Claudia Schmidt (EPP, Austria), Karin Kadenbach (S&D, Austria), AndersPrimdahl Vistisen (ECR, Denmark), Martina Dlabajová (ALDE, Czech Republic), Indrek Tarand(Greens–EFA, Estonia), Marco Valli (EFDD, Italy), Louis Aliot (ENF, France)
2015 Discharge – European Parliament
Rapporteur : Dennis De Jong, (Netherlands, GUE-NGL)
Shadow rapporteurs : Tamas Deutsch (EPP, Hungary), Derek Vaughan (S&D, United Kingdom),Anders Primdahl Vistisen (ECR, Denmark), Nedzhmi Ali (ALDE, Bulgaria), Benedek Jávor(Greens–EFA, Hungary), Marco Valli (EFDD, Italy), Louis Aliot (ENF, France)
2015 Discharge – Other Institutions
Rapporteurs: Bart Staes (ALDE, Belgium) (for the European Council and the Council, theEuropean Data Protection Supervisor, the Committee of Regions and the Economic and SocialCommittee), Benedek Javor (ALDE, Hungary) (for the Court of Justice, the Court of Auditors,the Ombudsman and the European External Action Service)
Shadow rapporteurs: Marian-Jean Marinescu (EPP, Romania), Catalin Sorin Ivan (S&D,Romania), Monica Macoveim (ECR, Romania)( for the Court of Justice and the Court ofAuditors), Ryszard Czarnecki (ECR, Poland) (for all the other institutions), Michael Theurer(ALDE, Germany), Dennis De Jong, (Netherlands, GUE-NGL), Marco Valli (EFDD, Italy), LouisAliot (ENF, France)
2015 Discharge – Agencies
Rapporteur: Inés Ayala Sender (S&D, Spain)
Shadow rapporteurs : Tomas Zdechovsky (EPP, Czech Republic), Raffaele Fitto (ECR, Italy),Nedzhmi Ali (ALDE, Bulgaria), Dennis De Jong, (Netherlands, GUE-NGL), Benedek Jávor(Greens–EFA, Hungary), Marco Valli (EFDD, Italy), Louis Aliot (ENF, France)
2015 Discharge – Joint Undertakings
Rapporteur: Miroslav Poche (S&D, Czech Republic)
Shadow rapporteurs: Brian Hayes (EPP, Ireland), Raffaele Fitto (ECR, Italy), Gerben-Jan Gerbrandy (ALDE, Netherlands), Younous Omarjee (GUE-NGL, France), Indrek Tarand(Greens–EFA, Estonia), Marco Valli (EFDD, Italy), Louis Aliot (ENF, France)
Source: European Parliament Legislative Observatory.

Economic and budgetary outlook for the European Union 2017 Page 68 of 69
Annex 5 – Flexibility provisions and special instruments employed so far in the 2014-2020MFF
The table does not include funds mobilised under the European Globalisation Adjustment Fund (€81 millionin 2014, €44.2 million in 2015), and the EU Solidarity Fund (€126.7 million in 2014 and €50 million in 2015)as they are more frequently applied instruments to tackle specific problems.
Instrument Amount DecisionLegal basisin the MFFregulation
Purpose
ContingencyMargin
€3.2 billion (paymentappropriations)
Decision (EU)2015/435 of17 December 2014
Article 13 To reduce the backlog inpayments in 2014.
FlexibilityInstrument
€66.1 million(commitmentappropriations)
Decision (EU)2015/2248 of28 October 2015
Article 11
To finance immediate measuresfor managing the refugee crisis(under the European Agenda onMigration) in heading 3 'Securityand citizenship'
Global Margin forCommitments
€543 million(commitmentappropriations)
DAB 1/2015EP resolution of7 July 2015
Article 14 To finance the European Fundfor Strategic Investments (EFSI).
Revision in case oflate adoption ofrules ofprogrammes undersharedmanagement
€21.1 billion(commitmentappropriations)
Council Regulation2015/623 of20 April 2015
Article 19
Transfer of unused allocationsfor 2014, due to the lateagreement on the MFF anddelayed start of implementation(headings 1b, 2 and 3).
ContingencyMargin
€240.1 million(commitmentappropriations)
DAB 4/2016EP resolution of1 December 2016
Article 13
Reinforcement of heading 3'Security and citizenship': theemergency support instrumentwithin the Union, Asylum,Migration and Integration Fund(AMIF), Internal Security Fund(ISF).
FlexibilityInstrument
€530.0 million(commitmentappropriations)
EP resolution of1 December 2016 Article 11
Reinforcement of heading 3'Security and citizenship' toaddress the on-going migration,refugee and security crisis.
ContingencyMargin
€1 906.2 million(commitmentappropriations)
EP resolution of1 December 2016 Article 13
Reinforcement of heading 3'Security and citizenship'(€1 176 million) and heading 4'Global Europe' (€730.1 million)to tackle internal security crisesand the current humanitarian,migratory and refugeechallenges.
Global margin forcommitments
€1 439.1 million(commitmentappropriations)
EP legislativeresolution of1 December 2016
Article 14
To finance the increases inheading 1a 'Competitiveness forgrowth and jobs' for theprogrammes: Horizon 2020,COSME, CEF, Erasmus+.
Outside of the EU budget
Emergency AidReserve
€98.1 million in 2014,€282.5 million in2015€150 million in 2016
Union's generalbudgets for thefinancial year2014, 2015 and2016
Article 9To tackle migration crisis(humanitarian aid, civil crisismanagement etc.).
Source: EPRS, based on M. Sapała, Mid-term review of the Multiannual Financial framework 2014-2020 - A round-upof key issues at stake, Perspectives on Federalism, Vol. 8, issue 2, 2016.

Economic and budgetary outlook for the European Union 2017 Page 69 of 69
Annex 6 – Key economic figures
Real GDP (annualchange in %) Budget balance Unemployment rate
Gross fixed capitalformation (annual
change in %)
2016 2017 2018 2016 2017 2018 2016 2017 2018 2016 2017 2018
BE 1.2 1.3 1.5 -3.0 -2.3 -2.4 8.0 7.8 7.6 3.3 2.9 2.9
DE 1.9 1.5 1.7 0.6 0.4 0.3 4.4 4.3 4.2 2.5 1.9 2.9
EE 1.1 2.3 2.6 0.5 -0.4 -0.2 6.5 7.4 8.3 3.2 5.3 4.8
IE 4.1 3.6 3.5 -0.9 -0.5 -0.4 8.3 7.8 7.6 16.0 6.8 5.0
EL -0.3 2.7 3.1 -2.5 -1.0 0.9 23.5 22.2 20.3 4.0 13.7 14.2
ES 3.2 2.3 2.1 -4.6 -3.8 -3.2 19.7 18.0 16.5 4.2 3.6 3.8
FR 1.3 1.4 1.7 -3.3 -2.9 -3.1 10.0 9.9 9.6 2.9 3.2 4.2
IT 0.7 0.9 1.0 -2.4 -2.4 -2.5 11.5 11.4 11.3 2.1 2.6 3.2
CY 2.8 2.5 2.3 -0.3 -0.4 0.0 12.5 11.1 10.0 9.1 8.3 6.4
LV 1.9 2.8 3.0 -0.8 -1.1 -1.2 9.6 9.2 8.8 -6.5 5.5 4.2
LT 2.0 2.7 2.8 -0.6 -0.8 -0.7 7.6 7.4 7.0 -0.9 6.0 3.0
LU 3.6 3.8 3.6 1.3 0.0 0.1 6.2 6.1 6.2 5.3 3.6 3.0
MT 4.1 3.7 3.7 -0.7 -0.6 -0.6 5.0 5.2 5.2 4.0 5.0 -4.0
NL 1.7 1.7 1.8 -0.8 -0.3 -0.1 6.1 5.8 5.4 6.9 4.4 3.2
AT 1.5 1.6 1.6 -1.5 -1.3 -1.1 5.9 6.1 6.1 3.1 2.3 1.7
PT 0.9 1.2 1.4 -2.7 -2.2 -2.4 11.1 10.0 9.5 -1.4 3.7 4.1
SI 2.2 2.6 2.2 -2.4 -2.0 -1.5 8.4 7.7 7.2 -3.9 5.3 6.4
SK 3.4 3.2 3.8 -2.2 -1.5 -0.5 9.7 8.7 7.5 -0.9 4.9 4.3
FI 0.8 0.8 1.1 -2.4 -2.5 -2.0 9.0 8.8 8.7 4.3 3.0 2.6
Euroarea 1.7 1.5 1.7 -1.8 -1.5 -1.5 10.1 9.7 9.2 3.3 3.1 3.5
BG 3.1 2.9 2.8 -0.9 -0.8 -0.7 8.1 7.1 6.3 -0.8 3.2 3.6
CZ 2.2 2.6 2.7 -0.2 -0.6 -0.7 4.2 4.1 4.0 -2.8 2.5 3.3
DK 1.0 1.7 1.8 -0.9 -2.0 -1.4 6.1 5.9 5.6 1.0 3.2 3.6
HR 2.6 2.5 2.3 -2.1 -1.8 -1.4 13.4 11.7 10.3 4.8 6.1 5.3
HU 2.1 2.6 2.8 -1.5 -2.3 -2.3 5.1 4.7 4.1 -8.2 5.9 3.0
PL 3.1 3.4 3.2 -2.4 -3.0 -3.1 6.2 5.6 4.7 -1.5 3.7 4.9
RO 5.2 3.9 3.6 -2.8 -3.2 -3.2 6.5 6.4 6.3 6.3 6.4 6.5
SE 3.4 2.4 2.1 0.0 -0.1 0.1 6.8 6.4 6.4 6.6 3.5 2.9
UK 1.9 1.0 1.2 -3.5 -2.8 -2.3 4.9 5.2 5.6 1.3 -2.2 -0.9
EU 1.8 1.6 1.8 -2.0 -1.7 -1.6 8.6 8.3 7.9 2.8 2.5 3.1
Source: All data in per cent. European Commission, European economic forecast, November 2016.


This study presents the economic and budgetary outlookfor the European Union (EU) in 2017 and beyond.Economic estimates point to moderate growth andcreation of new employment against a backdrop ofpersistent external and internal challenges that mayhinder recovery. An investment gap persist in almost all EUMember States and a number of EU measures contributeto addressing it. While fiscal policies remain mainly withinEU Member States' remit, they are increasinglycoordinated at EU level through rules and processes suchas the European Semester. However, a central tool of fiscalstabilisation is missing, as the EU budget was not designedto play this role. This is due to the size of the EU budget(only some 1 % of the area's gross national income) and itslimited flexibility in the context of multiannual financialplanning.
While the structure of the 2017 EU budget is largelydetermined by the 2014-2020 Multiannual FinancialFramework (MFF), EU institutions have used the flexibilityprovisions of the MFF to strengthen resources in areasconsidered of key concern – the economic and migrationcrises, and emerging security issues. The need to resort tosuch provisions appears to be a constant feature of thecurrent MFF. The debate on the future of the EU budget isexpected to gain momentum in 2017 in the run-up to theEuropean Commission proposal for a post-2020 MFF. In arapidly evolving world, the design of the EU budget has toensure the right balance between predictability ofinvestments and capacity to respond to new challengesand priorities.
This is a publication of theMembers' Research Service
Directorate-General for Parliamentary Research Services, European Parliament
This document is prepared for, and addressed to, the Members and staff of the EuropeanParliament as background material to assist them in their parliamentary work. The content of thedocument is the sole responsibility of its author(s) and any opinions expressed herein should notbe taken to represent an official position of the Parliament.
PE 595.915ISBN 978-92-846-0484-5doi:10.2861/543320
QA
-06-16-374-EN-N