economic and annual report monetary reviewmalaysia’s gdp growth to be between -2.0% and 0.5% in...
TRANSCRIPT

Annual ReportEconomic and Monetary Review

Contents
1 Foreword
4 Key Highlights
9 Executive Summary
13 Economic, Monetary and Financial Developments in 2019
32 Box Article: Securing Future Growth through Quality Investments
47 Outlook and Policy in 2020
Annex

Governance
ii AnnuAL REPORT 2019

Economic developments in 2020 have taken a dramatic turn. Initially projected as a year of modest recovery, the expected stabilisation in the global economy was interrupted by the sudden outbreak of COVID-19, which has since developed into a global health crisis. While some countries have seen an abatement of cases, the pandemic is escalating elsewhere and has spread to more than 100 countries.
In response, national authorities across the world have taken unprecedented measures to contain this pandemic. These include inbound and outbound travel restrictions, bans on large social gatherings, shutdowns of non-essential services, enforced business closures and most restrictively, blanket quarantine orders on all segments of the population. While these “social distancing” measures are crucial for public health, they have triggered concurrent supply and demand shocks. Latest indicators suggest that the pace of economic activities in many countries is contracting sharply, and growth prospects for both advanced and emerging market economies are deteriorating. This in turn has led to heightened turbulence in global financial markets, further amplified by uncertainty in the global oil market.
Recognising these exceptional circumstances, governments and central banks have introduced significant fiscal and monetary interventions. These expansionary measures are crucial to cushion the impact of the contraction in economic activity, and to preserve income and employment as much as possible. Effective containment efforts and policy support will contribute towards ensuring the economic shock of the pandemic is temporary, such that global economic activity can resume once the health crisis is contained.
Malaysia has not been spared. While relevant authorities and frontliners are doing their best to mitigate the spread of the virus, the economic impact is already being deeply felt by households and businesses alike. Spillovers from the pandemic and the implementation of the Movement Control Order to contain its spread will result in large output losses for the Malaysian economy in 2020. Significant policy intervention to support individuals, households and businesses is needed to prevent what should be a transitory economic disruption from becoming permanent. Such support should aim to avert large-scale business failures that could result in a more lasting impact to the economy, even after the health crisis has receded.
It is for this reason that the Government and the Bank have responded swiftly through a combination of monetary, financial and fiscal measures. The Government has introduced two major economic stimulus packages. These aim to support household income and safeguard jobs, notably through programmes such as the Bantuan Prihatin Nasional cash transfers and wage subsidy scheme for SMEs to retain workers. For the business community, measures such as a dedicated loan guarantee facility, lower utility costs and income tax deferments will help reduce expenses and ease the cashflow of affected SMEs and corporations.
On our part, the Bank has taken steps to ensure that monetary and liquidity conditions remain supportive of economic activity. The Monetary Policy Committee lowered the Overnight Policy Rate (OPR) in January and March this year, by a total of 50 basis points. In addition, the Statutory Reserve Requirement (SRR) ratio was lowered by 100 basis points, with allowance provided for Government securities to be recognised for SRR compliance. These combined SRR measures will release approximately RM30 billion worth of liquidity into the banking system. A 6-month moratorium has also been extended for loan and financing payments. Alongside this, the Bank has provided temporary supervisory and regulatory flexibilities and special funds in order to support efforts by banking institutions to assist individuals, SMEs and corporations through this period. Relief measures have also been made available to affected policyholders and takaful participants, while iTEKAD was introduced as a social finance initiative to facilitate access to funding among B40 micro-entrepreneurs.
Foreword

Amid these developments, the baseline projection is for Malaysia’s economic growth to be within -2.0 to 0.5% in 2020, on expectations of a synchronised slowdown in both external and domestic demand. The growth outlook remains subject to significant uncertainty as developments surrounding the spread of the virus continue to evolve.
As we look into the future, it is important to maintain a sense of perspective. While our current circumstances seem grim, the Malaysian economy retains a degree of resilience. Our diversified sources of growth and external trade structure help to mitigate the economic impact of domestic and external developments. Continued surpluses in the current account, adequate levels of international reserves, and a flexible exchange rate also accord some buffer against external shocks. The financial sector remains a source of strength, giving assurance that financial intermediation will carry on uninterrupted.
As this situation progresses, we will remain vigilant of developments in the financial system and the wider economy. Should the need arise, the Bank can utilise its policy levers as appropriate to cushion the impact of the economic downturn. Monetary policy considerations remain guided by the evolving downside risks to growth amid price stability. The Bank’s monetary operations will ensure liquidity conditions remain sufficient for uninterrupted financial intermediation, and financing continues to be available to support households and viable businesses through the health crisis and future economic recovery. Given the heightened uncertainty on global and domestic growth prospects, financial market volatility is also expected to remain high. In this environment, the Bank will continue to facilitate the efficient and orderly functioning of the domestic financial markets, and to manage excessive volatility in the financial markets and exchange rate.
The Bank has a range of policy instruments at our disposal to preserve monetary and financial stability, and ultimately support growth. These include monetary policy, macroprudential and microprudential policy, as well as our supervisory oversight over financial institutions. These policy instruments have served us well in the past and will continue to afford us the flexibility and agility we need to fulfil our mandates.
In steering the economy, complementarities between monetary, financial, fiscal, and structural policies are key to ensure policy responses are comprehensive and coordinated effectively. The Malaysian economy managed to recover quickly from past crises partly because these policies were implemented collectively in a timely manner. The various measures announced recently underscores the multi-pronged approach that will help the country endure and recover from the economic impact of COVID-19.
Beyond these near-term concerns, the Bank continues to be mindful of the path to recovery and will collaborate closely with the Government in matters of structural policies and reform. Despite the current difficulties, we will not lose sight of longer-term concerns such as the rising cost of living, persistent income inequality, and rejuvenating investments. All of these must continue to be addressed. In this publication, we present our views on securing future growth through quality investments, especially on the need to holistically reform the national investment ecosystem. The gravity of the current health crisis has also reinforced the need to continue to invest in our healthcare system.

Despite these testing times, I am pleased to introduce the Bank’s inaugural Economic and Monetary Review (EMR). This flagship publication will communicate the Bank’s economic assessments and research on important policy topics. Communication serves a crucial policy function, and this new publication will play an important role for us to articulate the issues at hand, trade-offs being considered, and outcomes we have in mind on matters of public policy. I trust that having a dedicated platform to weigh in on economic and monetary policy issues will go a long way towards enhancing public understanding, and ultimately, the efficacy of the policies we pursue.
It is my hope that, in the next EMR, we will be able to note that the global community has overcome this health crisis and report on how Malaysia has weathered the storm. For now, difficult choices must be made for our nation to come out stronger on the other side. We will all need to persevere and come together for the sake of our collective future. We have done this before, and I do not doubt that we can do it again. On our part, the Bank will remain steadfast in discharging our mandates through this challenging and unpredictable time.
Nor Shamsiah Yunus3 April 2020

Economic Developments and Outlook Key Highlights on
Malaysia’s GDP growth to be between -2.0% and 0.5% in 2020
p
▼
▼
▼
…partially mitigated by
Real GDP Growth Growth prospects weighed by…
Commodities supply disruptions
Movement Control Order (MCO)
Output loss from COVID-19
-2
-1
0
1
2
3
4
2016 2017 2018 2019 2020f
0.5
-1.5
0.7
Headline Inflation (Annual change, %)
The downward pressure on headline inflation reflects low global oil prices
Subdued inflationary pressure in 2020
0.8
0
1
2
3
4
2016 2017 2018 2019 2020f
1.31.5
Core inflation1 to remain positive, averaging between 0.8 – 1.3%
Core Inflation (Annual change, %)
● Economic stimulus and policy rate cuts● Progress of public projects & higher public spending
Households & SMEs Cash flow relief
Loan moratorium
Businesses
Monetary Easing
Growth supported by RM250bn economic & monetary stimulus
Risks to growth tilted to downside
Higher impact from 2020 Economic
Stimulus
COVID-19 pandemicCommodities supply
disruptions
Liquidity supportJob retention 50bps OPR cut
SRR cut
InfrastructureHigher Govt
spending
1 Core inflation is computed by excluding price-volatile and price-administered items. It also excludes the estimated direct impact of tax policy changes. f Forecast
2019 2020f
-3
-2
-1
0
1
2
3
4
5
2019 2020f

Box ArticleKey Highlights on
Securing Future Growth through Quality InvestmentsGreater focus needed to enhance the quality of investment in Malaysia
Holistic reform necessary to reinvigorate investment
Lower capital stock at the current stage of development
Slowing private investment growth in recent years
Low share of Machinery and Equipment Investment
12982
13
11
18.4
Malaysia BenchmarkEconomies (Avg)
Malaysia
6.3
1.5
2010 2015 2019
Source: Department of Statistics, MalaysiaSource: Penn World Tables 9.1 and
staff calculations Source: Penn World Tables 9.1 and
staff calculations
Real Private InvestmentAnnual Change, %
Real Capital Stock Per Capita‘000 USD
Share of M&E to Total Capital StockShare, %
3 Key Areas of Reform Ideas for Reform
Investment Policy
Investment Promotion
Establish a National Investment Aspirations aligned to Malaysia’s developmental objectives
Tax Incentives Administration
Streamline investment promotion and elevate investor services to facilitate realisation of investment
Develop a clear, transparent, and predictable tax incentives administration system
BenchmarkEconomies (Avg)

Key Highlights
6 Financial Stability Review - Second HalF 2019

Executive Summary Executive Summary
7Economic and monEtary rEviEw 2019
Executive Summary

Executive Summary
8 Economic and monEtary rEviEw 2019

Executive Summary
9Economic and monEtary rEviEw 2019
Economic and Financial Developments in 2019The global economy and global trade expanded by 2.9% and 1.0%, respectively in 2019 (2018: 3.6% and 3.7%, respectively), amid protracted and unresolved trade tensions which exacerbated the cyclical downturn in global manufacturing and investment activities. Heightened risk aversion in financial markets led to sustained demand for safe haven assets, exchange rate volatility as well as capital flow reversals from emerging market economies (EMEs). Amid this challenging global economic environment and domestic supply disruptions, the Malaysian economy expanded by 4.3% in 2019, supported by resilient private sector spending. Headline CPI inflation was lower at 0.7% (2018: 1.0%), while underlying inflation remained relatively stable (2019: 1.5%; 2018: 1.6%). The Monetary Policy Committee (MPC) meeting in May 2019 decided to reduce the OPR from 3.25% to 3.00% in order to preserve the degree of monetary accommodativeness, thus ensuring a conducive monetary environment for continued growth amid price stability. In addition, the Statutory Reserve Requirement (SRR) ratio was reduced from 3.50% to 3.00% in November 2019, which further supported the efficient functioning of the domestic financial markets.
Outlook and Policy in 2020The global economy is projected to register negative growth in 2020, due mainly to the significant economic repercussions arising from the unprecedented coronavirus disease (COVID-19) pandemic. The IMF is expecting the global economy to undergo a recession in 2020 that is at least as bad as the GFC, with a projected recovery in 2021. Growth prospects for advanced countries and EMEs will be weak, with advanced economies in particular expected to experience a contraction in growth.
Executive Summary
Measures implemented to contain the rapid spread of COVID-19, including broad-based travel restrictions, enforced business closures and restrictions on social activities, will suppress private sector activity globally. Nonetheless, the unprecedented nature and scale of fiscal and monetary policy intervention across economies is expected to cushion the economic disruptions caused by COVID-19. These measures will support a gradual normalisation in economic activities upon the successful containment of the pandemic.
Risks to global growth are tilted to the downside, mainly reflecting the significant uncertainties surrounding the COVID-19 pandemic. The extent of the economic impact arising from this pandemic would be contingent on the severity and duration of the outbreak in various economies and the corresponding measures undertaken to contain this global health crisis. The weakness in the real economy could be further weighed down by a prolonged tightening of global financial conditions.
Against this highly challenging global economic outlook, Malaysia’s GDP growth is projected to be between -2.0 to 0.5% in 2020 (2019: 4.3%). The domestic economy will be impacted by the necessary global and domestic actions taken to contain the outbreak. Of significance, tourism-related sectors are expected to be affected by broad-based travel restrictions and travel risk aversion, while production disruptions in the global supply chain will weigh on the manufacturing sector and exports. The implementation and subsequent extension of the Movement Control Order (MCO), while critical, will dampen economic activity following the suspension of operations by non-essential service providers and lower operating capacity of manufacturing firms. Beyond the MCO period, reduced social and recreational activities until the pandemic is fully controlled globally and domestically will continue to dampen consumption and investment activity. Apart from the pandemic, the domestic economy will also

Executive Summary
10 Economic and monEtary rEviEw 2019
be affected by the sharp decline and volatile shifts in crude oil prices and continued supply disruption in the commodities sector. Unfavourable weather conditions and maintenance works will weigh on the production of oil palm, crude oil and natural gas.
Given the significant headwinds to growth arising from COVID-19, the Government and Bank Negara Malaysia have introduced large countercyclical policy measures to mitigate the economic impact of the pandemic. Two economic stimulus packages amounting to RM250 billion were introduced to provide immediate relief to affected households and businesses. These packages also include loan guarantees and an automatic 6-month moratorium on loan repayments for individuals and small and medium enterprises (SMEs). The economic stimulus measures were complemented by two consecutive Overnight Policy Rate (OPR) reductions early this year and measures to provide additional liquidity in the banking system.
Private consumption is expected to be dampened by weak labour market conditions, mobility restrictions and subdued sentiments. Nonetheless, policy measures introduced in the two economic stimulus packages, including cash transfers to vulnerable households, flexibility to withdraw from EPF savings and the moratorium on loan repayments will increase disposable income and improve cash flow for households. In addition to supporting household spending, these broad-based measures will facilitate a gradual recovery in private consumption as labour market conditions eventually stabilise following the projected improvement in global and domestic economic activities.
Domestic growth prospects are expected to improve towards the end of the year, in line with the projected recovery in global demand and amid continued support from policy measures. Recovering external demand will lift growth in the export-oriented sectors. Consumer sentiments are also expected to gradually improve following the easing of travel restrictions and resumption of tourism activities as risks from the pandemic subside. In addition, the anticipated recovery from supply disruptions in the commodities sector and higher public sector expenditure will support the gradual improvement in the Malaysian economy in the latter part of the year. Public sector spending will be underpinned by the continuation of large-scale transport-related projects by public corporations and the implementation of more small-scale projects worth RM4 billion by the Federal Government.
Overall risks to the domestic growth outlook are tilted to the downside, mainly due to the risk of a prolonged and wider spread of COVID-19 and its effects on the global and domestic economy. Domestic growth also remains susceptible to a recurrence of commodities supply shocks and continued low commodity prices which could pose additional risks to production in the commodities sector, exports and income growth. In addition, heightened financial market volatility due to ongoing external uncertainties may lead to tighter domestic financial market conditions. The baseline growth projection could, however, be lifted by a stronger-than-expected impact from the various stimulus measures by the Federal Government and additional measures implemented by several state governments.
Headline inflation is forecasted to average within the range of -1.5 to 0.5% in 2020 (2019: 0.7%), mainly reflecting significantly lower global oil and commodity prices. Without the direct downward impact from lower global oil prices, underlying inflation, as measured by core inflation, is projected to remain positive, averaging between 0.8 to 1.3%. This reflects subdued demand pressures, expectations for a negative output gap this year, as well as weak labour market conditions.
Monetary policy in 2020 will focus on providing support to domestic economic growth in an environment of subdued price pressures. The OPR was reduced in January and March 2020 by a total of 50 basis points to 2.50% to provide a more accommodative monetary environment to support economic growth amid price stability. The Statutory Reserve Requirement (SRR) ratio was also reduced further by 100 basis points in March 2020 along with the granting of flexibility to Principal Dealers to recognise Malaysian Government Securities (MGS) and Malaysian Government Investment Issues (MGII) for SRR compliance, releasing an additional liquidity of RM30 billion into the banking system. In addition, the Bank undertook measures to ensure continued financial intermediation including providing additional funds for SMEs, amounting to a total allocation of RM13.1 billion under the BNM’s Fund for SMEs and improving features of the funds. These measures, together with lower borrowing costs for the private sector, will reinforce support to financing activity. Monetary policy will continue to take into account the continuously evolving balance of risks surrounding the outlook for growth and inflation.

Economic, Monetary and Financial Developments in 2019
11Economic and monEtary rEviEw 2019
Economic, Monetary and Financial Developments
in 2019
32 Box Article: Securing Future Growth through Quality Investments

12 Economic and monEtary rEviEw 2019

13Economic and monEtary rEviEw 2019
Economic, Monetary and Financial Developments in 2019
MODERATE GROWTH PERFORMANCE AMID HEADWINDSChallenging global environmentThe global economy and global trade expanded by 2.9% and 1.0%, respectively in 2019 (2018: 3.6% and 3.7%, respectively), which were the lowest since 2009 (Chart 1.1). The sharp moderation in growth of both economic and trade activities was due mainly to the protracted and unresolved global trade tensions which exacerbated the cyclical downturn in global manufacturing and investment activities. Firm consumer demand and timely policy actions, however, provided some support to global growth.
The cycles of intensification and de-escalation of trade tensions in 2019 generated significant uncertainties, which affected business sentiments and resulted in intermittent spikes in financial market volatility (Chart 1.2). Throughout the year, the trade dispute between the US and PR China broadened to encompass more products and moved
beyond tariffs on goods to include company-specific sanctions, particularly in the technology industry. Increasingly, the trade dispute has led multinational corporations to reassess their global production strategies, prompting a reconfiguration of global value chains.
The trade dispute compounded the ongoing cyclical downturn in global trade and dampened investment activity (Chart 1.3). Amidst weak demand conditions, the automotive industry was severely affected by supply disruptions, while the tech cycle was on a downturn. Investment activity in many major economies was thus weakened by the concurrent effects of a poor near-term business outlook and uncertainties surrounding the trade dispute.
Despite weaker trade and investment activities, steady consumption demand provided some support to global growth. Domestic demand in major economies was supported by resilient private consumption, underpinned by favourable labour market conditions with stable wage growth and lower unemployment rates. Expansionary fiscal policies in the US and most emerging market economies (e.g. PR China and developing Asia) also helped to cushion growth.
Chart 1.2: Global Economic Policy Uncertainty (PPP-adjusted GDP weights)
0
50
100
150
200
250
300
2008 2009 2010 2011 2012 2013 2014 2015 2016 2017 2018 2019
Source: www.policyuncertainty.com
Index
Global Growth Global Trade
Chart 1.1 : Global Growth and Trade
-0.1
2.9
-10.4
1.0
-15
-10
-5
0
5
10
15
2008 2009 2010 2011 2012 2013 2014 2015 2016 2017 2018 2019e
Annual change (%)
e Estimate
Source: International Monetary Fund (IMF)

Economic, Monetary and Financial Developments in 2019
14 Economic and monEtary rEviEw 2019
Global growth was also supported by broad-based monetary policy easing in an environment of low inflation. Major central banks turned more accommodative towards mid-2019 amid broad-based weakness in growth and the materialisation of idiosyncratic risks. After raising its Federal Funds Rate (FFR) nine times from 2015 to 2018, the US Federal Reserve reduced the FFR three times in 2019.1 Similarly, the European Central Bank reduced its deposit rate, and announced the resumption of quantitative easing. The prospect of weaker domestic growth conditions was also prevalent in emerging market economies, where policy rate reductions followed suit.
Financial markets dominated by global risk aversionAgainst this uncertain global environment, global capital flows were volatile, primarily dominated by risk aversion during the year. Moreover, country-specific risks such as the prolonged state of Brexit negotiations and political unrest in Hong Kong SAR and Latin America, resulted in episodes of sharp capital flows and exchange rate movements, as uncertainty levels were elevated and investor sentiments were subdued. These amplified global risk aversion, which led to a sustained demand for safe haven assets such as the US dollar and gold, and safer financial asset classes, such as sovereign bonds, as well as capital flow reversals from emerging market economies.
Reflective of global drivers, and to some extent domestic factors, Malaysia’s financial markets experienced significant two-way portfolio flows throughout the year. Apart from trade tensions, shifts in non-resident portfolio flows were also triggered by idiosyncratic events such as the FTSE Russell’s review on Malaysia’s potential exclusion from the World Government Bond Index (WGBI). Notwithstanding the two-way capital flow movements throughout the year, Malaysia registered net non-resident portfolio inflows amounting to RM11.0 billion (equivalent to USD2.7 billion) in 2019. The international reserves position in US dollar terms increased by USD2.2 billion to USD103.6 billion as at end-2019 (end-2018: USD101.4 billion) and was largely attributed to positive investment returns on the Bank’s reserves assets amounting to USD5.4 billion in 2019, as well as the Government’s 10-year Samurai Bond issuance amounting to JPY200 billion (equivalent to USD1.8 billion).
Despite financial market volatility, the ringgit ended the year with an appreciation against the US dollar and the trade-weighted basket of currencies of Malaysia’s major trading partners (NEER). The ringgit appreciated by 1.1% to close at RM4.0925 against the US dollar, while the NEER appreciated by 0.8% (Chart 1.4).
1 The target range for the FFR was raised from 0.25-0.50% in December 2015 to 2.25-2.50% in December 2018. By the end of 2019, the target range was reduced to 1.50-1.75%.
Chart 1.3: World Trade Volume and Industrial Production
World Trade Volume World Industrial Production
Annual change (%)
Source: Netherlands Bureau for Economic Policy Analysis
-2
0
2
4
6
8
J F M A M J J2015
A S O N D J F M A M J J2016
A S O N D J F M A M J J2017
A S O N D J F M A M J J2018
A S O N D J F M A M J J2019
A S O N D

Economic, Monetary and Financial Developments in 2019 Economic, Monetary and Financial Developments in 2019
15Economic and monEtary rEviEw 2019
Two-way portfolio flows and periods of exchange rate volatility in 2019 In 2019, Malaysia experienced significant shifts in portfolio flows amid intermittent periods of heightened exchange rate volatility. This was due mainly to shifting investor risk sentiments driven by global developments. Domestic factors to some extent, also played a role in affecting investor sentiments.
Non-resident portfolio flows and ringgit developments in 2019 can be characterised into three distinct phases (Chart 1). In the first phase (1Q 2019), the global risk-on investment cycle took place amid expectations of the US Federal Reserve’s more accommodative monetary policy stance. Higher investor appetite for riskier assets drove portfolio inflows to the region, resulting in an appreciation of the ringgit against the US dollar, in line with most regional currencies. However, this trend reversed during the second phase (2Q – 3Q 2019), due mainly to higher global risk aversion amid the escalation of trade disputes between the US and PR China. The FTSE Russell’s review on Malaysia’s potential exclusion from the WGBI in April also weighed on investor sentiments. In the final phase (4Q 2019), there was a resumption in non-resident portfolio inflows as investor sentiments improved amid some progress in the trade talks between the US and PR China. This subsequently led to the ringgit appreciating by 1.1% in 2019 to close at RM4.0925 against the US dollar.
Amid a challenging global environment, the flexibility in the ringgit exchange rate plays an important role as a shock absorber to the changing external conditions thus helping to preserve macroeconomic stability and growth. At the same time, the Bank remains cognisant that an excessively volatile ringgit could lead to heightened uncertainties, financial instability and may disrupt economic activity. As such, the Bank conducted two-way foreign exchange intervention operations to manage excessive exchange rate volatility and ensure orderly foreign exchange market conditions. Ongoing financial market liberalisation efforts by the Bank had also increased accessibility and flexibility for market participants to better manage foreign exchange risks.
As Malaysia is an open economy, bilateral currency movements alone, such as the ringgit against the US dollar or Thai baht, is neither a good measure of overall ringgit performance nor does it fully reflect Malaysia’s
Chart 1: Movement of Ringgit against the US dollar and Non-resident Portfolio Flows in 2019
MYR per USD (MYR/USD)
Note: Regional average reflects the movements of selected regional currencies against the US dollar, which includes Chinese renminbi, Indonesian rupiah, Korean won, Philippine peso, Singapore dollar, New Taiwan dollar and Thai baht
Source: Department of Statistics, Malaysia and Bank Negara Malaysia
4.05
4.10
4.15
4.20
+1.4%
+0.5%
+2.3%
+2.6%
-2.5%
-1.0%
J F M A M J J A S O N D
-RM13.0billion
Non-residentPortfolio Flows
RM13.5billion
Non-residentPortfolio Flows
RM10.6billion
Non-residentPortfolio Flows
Phase 1(1Q 2019)Risk-on
Phase 2(2Q & 3Q 2019)
Risk-off
Phase 3(4Q 2019)Risk-on
Regional Average
MYR/USD

Economic, Monetary and Financial Developments in 2019
16 Economic and monEtary rEviEw 2019
Meanwhile, performance of the domestic bond and equity markets diverged, with non-resident inflows into the bond market and outflows from the equity market. In the bond market, the decision by FTSE Russell to retain Malaysia in the WGBI in September 2019 reinforced positive sentiments in the bond market. As a result of the inflows and the reduction in the Overnight Policy Rate (OPR) in May 2019, Government bond yields2 trended lower over the course of the year by 49 – 77 basis points across the tenures (Chart 1.5). Correspondingly, yields on the higher-rated corporate bonds3 also declined by 71 – 85 basis points. The equity market,4 in contrast, trended lower by 6.0% (2018: -5.9%) to end at 1,588.8 points (2018: 1,690.6 points) amid a net sell-off by non-resident investors (-RM6.7 billion). Domestic equities were further weighed down by moderate corporate earnings outlook, particularly in the financial services, and industrial products and services sectors, which saw sizeable stock price decrease during the year (Chart 1.6).
underlying fundamentals. In the short-term, bilateral exchange rate movements can be largely driven by sentiments surrounding specific factors regarding the currency pair in question, such as the economic, monetary policy or political situation of the country. For example, movements in the ringgit against the US dollar in 2019 was due partially to developments in the US and the US dollar being a safe haven currency during periods of risk aversion. Instead, the overall performance of the ringgit is better reflected through the ringgit’s performance against a trade-weighted basket of currencies of Malaysia’s major trading partners (i.e. Nominal Effective Exchange Rate (NEER)). In 2019, the ringgit NEER appreciated by 0.8% (2018: 1.1%). In the medium- to longer-term, the performance of the ringgit will reflect Malaysia’s economic fundamentals.
2 Refers to yields on benchmark Malaysian Government Securities (MGS) across the 1 - 10 year tenures.
3 Refers to AAA- and AA-rated papers across the 3 – 10 year tenures.4 Refers to the benchmark FTSE Bursa Malaysia Kuala Lumpur
Composite Index (FBM KLCI).
Chart 1.4 : Performance of Major and Regional Currencies against the US Dollar and RinggitNominal Effective Exchange Rate (NEER)
Note: (+) indicates an appreciation of currencies against the US dollarNEER shows the value of the ringgit against a trade-weightedbasket of Malaysia's major trading partners’ currencies
Source: Bank Negara Malaysia
2019
--
-
3.82.1
1.4-0.8
1.11.3
1.61.9
3.43.7
4.28.9
-10 -5 0 5 10
KRWEURCNYAUDMYRSGDJPY
TWDGBPPHPIDR
THB
Annual change (%)
NEER 0.8
20183.0
3.5
4.0
4.5
5.0
5.5
J F M A M J J A S O N D J F M A M J J A S O N D
%
AA
AAA
MGS
2018 2019
Chart 1.5: 10-year MGS and 10-year CorporateBond Yields
Source: Bank Negara Malaysia
Chart 1.6: Performance of Sectoral Equity Indices
Source: Bloomberg
FBM
KLC
I
Fina
ncia
lse
rvic
es
Indu
stri
al p
rodu
cts
and
serv
ices
Prop
erty
Plan
tati
on
Tech
nolo
gy
Cons
truc
tion
2019 2018
-5.9
2.6
-4.8
-28.6
-12.7
-29.9-50.2
-6.0 -10.6 -7.9 -5.2
12.0
29.2 34.3
-80
-40
0
40
Annual change (%)

Economic, Monetary and Financial Developments in 2019 Economic, Monetary and Financial Developments in 2019
17Economic and monEtary rEviEw 2019
The Malaysian economy expanded by 4.3% in 2019Growth of the Malaysian economy was supported by resilient private sector spending, which grew by 6.2% amid a challenging external environment. In particular, household spending remained firm and provided support to overall growth. In line with most emerging market economies, however, weaker external demand weighed on Malaysia’s exports and investment activity (Chart 1.7). In the second half of the year, the economy was affected by supply disruptions in the commodities sector.
highly uncertain global outlook, a broad-based decline in corporate profitability and continued weakness in the domestic property market (Charts 1.8 and 1.9). Meanwhile, investments by the public sector were particularly weak due mainly to lower capital spending by public corporations and the review of some large projects.
However, weakness in investment activity was mitigated by several factors. First, large multi-year investment projects in the resource-based and electrical and electronic (E&E) manufacturing subsectors continued to make steady progress. Second, the resumption of several rail transport projects, mainly in the second half of the year, provided some lift to investment growth. Third, broadly stable global oil prices in 2019 also supported further capital outlay by companies in the mining sector.
5.7
4.74.3
-2
-1
0
1
2
3
4
5
6
2017 2018 2019p
Gross Fixed Capital Formation (GFCF) Total consumption
Change in stocks Net exports
Real GDP
Chart 1.7: Real GDP by Expenditure
Annual change (%), Contribution to growth (percentage points)
p Preliminary
Source: Department of Statistics, Malaysia
Chart 1.8: Foreign Direct Investment
p Preliminary
Source: Department of Statistics, Malaysia and Bank Negara Malaysia
0
10
20
30
40
50
2017 2018 2019p
RM billion
Chart 1.9: Business Tendency Survey
0
10
20
30
2017 2018 2019
Confidence indicator Gross revenue: Net balance
Source: Department of Statistics, Malaysia
4Q moving average(%)
Private consumption remained firm in 2019 (7.6%, 2018: 8.0%). In 2018, consumer spending was lifted by the 3-month tax holiday prior to the transition to the Sales and Services Tax (SST) and the dissipation of this one-off factor resulted in a more moderate expansion in private consumption in 2019. Notwithstanding, household spending was supported by continued income and employment growth. Lower income households also benefitted from key Government measures such as the increase in minimum wage and cash transfers (e.g. Bantuan Sara Hidup).
In addition to lower global demand, investment activity in Malaysia was weighed down by weak investor sentiments. While foreign direct investment (FDI) remain sustained, investments by the private sector were affected by the

Economic, Monetary and Financial Developments in 2019
18 Economic and monEtary rEviEw 2019
Table 1.1
Malaysia - Key Economic Indicators2017 2018 2019p
Population (million persons) 32.0 32.4 32.6Employment (million persons) 14.5 14.8 15.1Unemployment (as % of labour force) 3.4 3.3 3.3Per Capita Income (RM) 41,627 43,086 45,034
(USD) 9,680 10,678 10,871
NATIONAL PRODUCT (% change)
Real GDP at 2015 prices 5.7 4.7 4.3 (RM billion) 1,299.9 1,361.5 1,420.5Agriculture, forestry and fi shery 5.7 0.1 1.8Mining and quarrying 0.4 -2.6 -1.5Manufacturing 6.0 5.0 3.8Construction 6.7 4.2 0.1Services 6.2 6.8 6.1Nominal GNI 9.7 4.7 5.2 (RM billion) 1,333.0 1,395.3 1,467.3Real GNI 5.7 3.6 5.1 (RM billion) 1,280.8 1,327.1 1,394.9Real aggregate domestic demand1 6.5 5.5 4.3Private expenditure 7.4 7.1 6.2 Consumption 6.9 8.0 7.6 Investment 9.0 4.3 1.5Public expenditure 3.4 0.1 -2.7 Consumption 5.5 3.3 2.0 Investment 0.3 -5.0 -10.8Gross national savings (as % of GNI) 29.2 26.7 24.9
BALANCE OF PAYMENTS (RM billion)
Goods balance 117.1 119.2 125.5 Exports 801.4 832.8 817.8 Imports 684.3 713.6 692.2Services balance -22.9 -17.7 -10.9Primary income, net -38.7 -51.6 -43.5Secondary income, net -17.3 -19.3 -21.4Current account balance 38.3 30.6 49.7 (as % of GDP) 2.8 2.1 3.3Bank Negara Malaysia international reserves, net2 414.6 419.5 424.0 (in months of retained imports) 7.2 7.4 7.5
PRICES (% change)
Consumer Price Index (2010=100) 3.7 1.0 0.73
Producer Price Index (2010=100) 6.7 -1.1 -1.43
1 Exclude stocks2 All assets and liabilities in foreign currencies have been revalued into ringgit at rates of exchange ruling on the balance sheet date and the gain/loss has
been refl ected accordingly in the Bank Negara Malaysia’s audited accounts3 Actual fi gures for 2019p Preliminary
Note: Figures may not necessarily add up due to rounding
Source: Department of Statistics, Malaysia and Bank Negara Malaysia

Economic, Monetary and Financial Developments in 2019 Economic, Monetary and Financial Developments in 2019
19Economic and monEtary rEviEw 2019
Malaysia - Financial and Monetary IndicatorsFEDERAL GOVERNMENT FINANCE (RM BILLION) 2017 2018 2019pRevenue 220.4 232.9 264.4Operating expenditure 217.7 231.0 263.3Net development expenditure 43.0 55.3 52.6Overall balance -40.3 -53.4 -51.5Overall balance (% of GDP) -2.9 -3.7 -3.4Public sector net development expenditure 131.8 142.0 139.1Public sector overall balance (% of GDP) -3.6 -4.6 -6.5EXTERNAL DEBTTotal debt (RM billion) 885.2 924.9 946.3 Medium- and long-term debt 533.4 519.6 554.5 Short-term debt 351.8 405.3 391.8Debt service ratio1 (% of exports of goods and services) Total debt 15.3 11.8 12.8 Medium- and long-term debt 15.0 11.3 12.2
MONEY AND BANKINGChange in 2017 Change in 2018 Change in 2019
RM billion % RM billion % RM billion %Money supply M1 42.0 11.0 4.9 1.2 24.8 5.8 M3 81.2 4.9 158.1 9.1 67.0 3.5Banking system deposits 70.6 4.1 163.2 9.2 55.5 2.9Banking system loans2 62.9 4.1 121.4 7.7 65.8 3.9Loan to fund ratio (%, end of year)3,4 83.9 83.1 83.2Loan to fund and equity ratio (%, end of year)3,4,5 73.5 72.6 72.9INTEREST RATES (%, AS AT END-YEAR) 2017 2018 2019Overnight Policy Rate (OPR) 3.00 3.25 3.001-month interbank 3.08 3.45 3.08Commercial banks Fixed deposit 3-month 2.94 3.15 2.90 12-month 3.10 3.33 3.09 Savings deposit 0.97 1.07 0.97 Weighted average base rate (BR) 3.64 3.91 3.68 Base lending rate (BLR) 6.68 6.91 6.71Treasury bill (3-month) 2.86 3.29 2.98Malaysian Government Securities (1-year)6 2.89 3.45 2.96Malaysian Government Securities (5-year)6 3.56 3.78 3.18EXCHANGE RATES (AS AT END-YEAR) 2017 2018 2019Movement of Ringgit (%) Change against SDR 5.2 -0.2 1.9 Change against USD 10.4 -1.8 1.1
1 Includes prepayment of medium- and long-term debt 2 Includes loans sold to Cagamas 3 Loans exclude loans sold to Cagamas and loans extended to banking institutions. Beginning July 2015, loans exclude fi nancing funded by Islamic
Investment accounts. 4 Funds comprise deposits (excluding deposits accepted from banking institutions and Bank Negara Malaysia) and all debt instruments (including
subordinated debt, debt certifi cates/sukuk issued, commercial papers and structured notes) 5 Equities comprise ordinary and preferred shares, share premium and retained earnings 6 Refers to data from Fully Automated System for Issuing/Tendering (FAST), Bank Negara Malaysia
p Preliminary
Source: Ministry of Finance, Malaysia and Bank Negara Malaysia
Table 1.2

Economic, Monetary and Financial Developments in 2019
20 Economic and monEtary rEviEw 2019
The domestic economy continued to be affected by supply disruptions in the production of key commodities in 2019. Following the severe supply disruptions in 2018, growth in the agriculture and mining sectors rebounded in the first half of 2019 driven mainly by the recovery in oil palm and natural gas production. In the second half of the year, however, growth in the agriculture sector contracted as the lagged impact of dry weather conditions and a cutback in fertiliser application in the early part of the year affected oil palm yields. Similarly, growth in the mining sector also declined as facility closures and maintenance work had affected both crude oil and natural gas output.
The lower commodity production compounded the subdued external demand and ongoing trade tensions, resulting in a decline of 1.7% in Malaysia’s gross exports in 2019 (2018: 7.3%) (Chart 1.10). Nevertheless, the adverse impact of lower demand from any single market or product was partially mitigated by Malaysia’s diversified exports market and product base (Chart 1.11). In addition, Malaysia also benefitted from some trade diversion which partially offset the negative impact of trade tensions on exports during the year.
Collectively, the decline in external demand and investment activity resulted in lower demand for imports, which declined by 3.5% in 2019 (2018: 5.2%). In tandem with the decline in exports, imports for further processing as well as imports for re-export activity were subdued in 2019. The lower investment activity also reduced demand for capital imports, particularly machinery and transport equipment.
The larger contraction in goods imports vis-à-vis weak export growth contributed towards a higher current account surplus of RM49.7 billion or 3.3% of GDP (2018: RM30.6 billion or 2.1% of GDP) . The higher current account surplus was also attributable to an increase in tourism receipts. This was further supported by a lower primary income deficit, in line with more moderate FDI income during the year.
-50
0
50
100
150
200
-5
0
5
10
15
20
2017 2018 2019
Gross exports Gross imports
Source: Department of Statistics, Malaysia
Chart 1.10: Gross Exports, Gross Imports and Trade Balance
Annual change (%) RM billion
Trade balance (RHS)
98.5
18.8 19.7
-3.5-1.7
5.27.3
137.3123.8
Exports by product Exports by market
Chart 1.11: Share of Exports by Product and Marketin 2019
Note: 1) G3 includes the US, the euro area and Japan2) Newly Industrialised Economies (NIEs) refers to Hong Kong SAR,
Korea and Chinese Taipei
Source: Department of Statistics, Malaysia
E&E37.8%
22.5%ASEAN28.8%
Non-E&E 46.8%
G324.1%
Commodities 14.7%
PR China14.2%
NIEs 13.9%
Rest of the world 19.0%
4.3%5.0%6.0%
Telecommunicationsequipment
Office and ADP machines
Electrical machineryand partsSemiconductors
Others0.7%
Economic, Monetary and Financial Developments in 2019 Economic, Monetary and Financial Developments in 2019
21Economic and monEtary rEviEw 2019
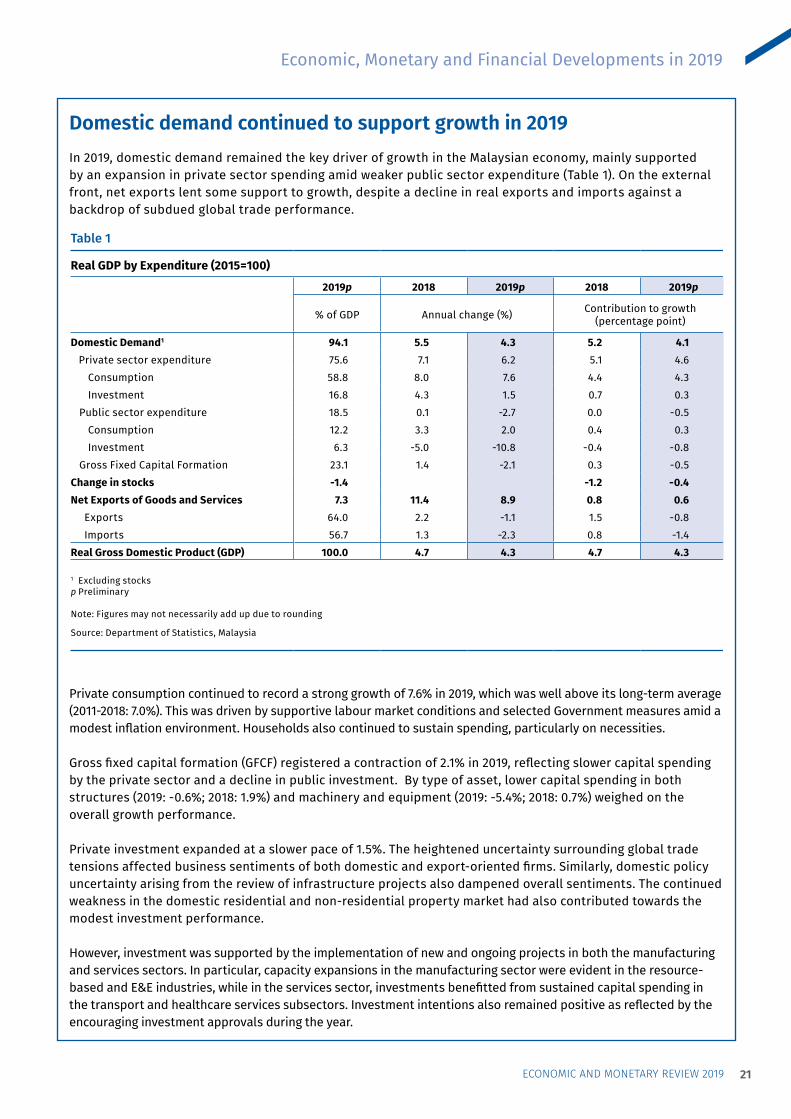
Domestic demand continued to support growth in 2019In 2019, domestic demand remained the key driver of growth in the Malaysian economy, mainly supported by an expansion in private sector spending amid weaker public sector expenditure (Table 1). On the external front, net exports lent some support to growth, despite a decline in real exports and imports against a backdrop of subdued global trade performance.
Private consumption continued to record a strong growth of 7.6% in 2019, which was well above its long-term average (2011-2018: 7.0%). This was driven by supportive labour market conditions and selected Government measures amid a modest inflation environment. Households also continued to sustain spending, particularly on necessities.
Gross fixed capital formation (GFCF) registered a contraction of 2.1% in 2019, reflecting slower capital spending by the private sector and a decline in public investment. By type of asset, lower capital spending in both structures (2019: -0.6%; 2018: 1.9%) and machinery and equipment (2019: -5.4%; 2018: 0.7%) weighed on the overall growth performance.
Private investment expanded at a slower pace of 1.5%. The heightened uncertainty surrounding global trade tensions affected business sentiments of both domestic and export-oriented firms. Similarly, domestic policy uncertainty arising from the review of infrastructure projects also dampened overall sentiments. The continued weakness in the domestic residential and non-residential property market had also contributed towards the modest investment performance.
However, investment was supported by the implementation of new and ongoing projects in both the manufacturing and services sectors. In particular, capacity expansions in the manufacturing sector were evident in the resource-based and E&E industries, while in the services sector, investments benefitted from sustained capital spending in the transport and healthcare services subsectors. Investment intentions also remained positive as reflected by the encouraging investment approvals during the year.
1ECONOMIC MONETARY REPORT 2019
Table 1
Real GDP by Expenditure (2015=100)
2019p 2018 2019p 2018 2019p
% of GDP Annual change (%) Contribution to growth(percentage point)
Domestic Demand1 94.1 5.5 4.3 5.2 4.1 Private sector expenditure 75.6 7.1 6.2 5.1 4.6 Consumption 58.8 8.0 7.6 4.4 4.3 Investment 16.8 4.3 1.5 0.7 0.3 Public sector expenditure 18.5 0.1 -2.7 0.0 -0.5 Consumption 12.2 3.3 2.0 0.4 0.3 Investment 6.3 -5.0 -10.8 -0.4 -0.8 Gross Fixed Capital Formation 23.1 1.4 -2.1 0.3 -0.5Change in stocks -1.4 -1.2 -0.4Net Exports of Goods and Services 7.3 11.4 8.9 0.8 0.6 Exports 64.0 2.2 -1.1 1.5 -0.8 Imports 56.7 1.3 -2.3 0.8 -1.4Real Gross Domestic Product (GDP) 100.0 4.7 4.3 4.7 4.3
1 Excluding stocksp Preliminary
Note: Figures may not necessarily add up due to rounding
Source: Department of Statistics, Malaysia

Economic, Monetary and Financial Developments in 2019
22 Economic and monEtary rEviEw 2019
Public investment declined by 10.8%, due mainly to the completion of large-scale projects by public corporations. The continued rationalisation efforts by the Government, as reflected by the ongoing review of several large-scale infrastructure projects had also contributed to lower spending by public corporations. Nevertheless, capital expenditure remained supported by Federal Government spending, particularly in the education and housing sectors.
Public consumption expanded at a moderate pace of 2.0%, as continued growth in emoluments was weighed down by lower Government spending on supplies and services. This is in line with the Government’s commitment to optimise expenditure without affecting the delivery of public services.
Moderate growth in major economic sectorsThe services and manufacturing sectors remained as key contributors to growth (Table 1). However, these sectors expanded at a more moderate pace mainly on account of weaker external demand and a normalisation in the growth of household spending. The agriculture and mining sectors benefitted from an improvement in oil palm yields, and a recovery in natural gas production from pipeline disruptions in 2018, respectively. These sectors, which had improved in the first half of the year, subsequently contracted in the second half amid a recurrence in supply disruptions which had affected the production of oil palm, natural gas and crude oil. Growth in the construction sector moderated, following the completion of large projects, smaller scale and fewer number of new projects and an oversupply of properties.
The services sector expanded by 6.1% (2018: 6.8%), as growth normalised following a robust performance in 2018, when the tax holiday period encouraged greater consumer spending. Growth in the wholesale and retail trade as well as food, beverages and accommodation subsectors remained firm, lifted by firm household spending amid supportive labour market conditions. The transport and storage subsector benefitted from higher transhipment activity, despite being partially offset by slower global trade activity. Growth in the finance and insurance subsector moderated amid slower loan and deposit growth. However, this was partially mitigated by the rebound in the fee-based income as a result of more IPO offerings during the year. Growth in the information and communication subsector moderated, following the one-off price reduction in fixed broadband prices under the Mandatory Standard Access Pricing regulation in 2018.
The manufacturing sector recorded a slower growth of 3.8% in 2019 (2018: 5.0%). Within the export-oriented clusters, weak external demand affected manufacturing activity in the electrical and electronics (E&E) cluster, while the supply disruptions in key commodities led to lower production in primary-related clusters. Growth in both clusters, however, remained positive, supported by the presence of Malaysian E&E firms in diversified, fast-growing product segments such as automotive electronics, medical devices and cloud computing, as well as the recovery in natural gas output. Domestically, the frontloading of demand for passenger cars during the tax holiday period in 2018 had weighed on the production of transport equipment in 2019.
Growth in the agriculture sector improved to 1.8% during the year (2018: 0.1%), due mainly to a turnaround in oil palm yields from production constraints and adverse weather conditions in 2018. Nevertheless, the recovery was interrupted by the impact of exceptionally dry weather and a cutback in fertiliser application in the early part of the year, which negatively affected oil palm yields in the latter part of 2019. Natural rubber production also rebounded, as higher rubber prices induced more rubber tapping activity.
The mining sector continued to register a contraction (-1.5%; 2018: -2.6%), as crude oil output was weighed down mainly by maintenance works and voluntary supply adjustments by PETRONAS. Nevertheless, the pace of the contraction in the sector eased, following the recovery in natural gas production from the pipeline disruptions in 2018.

Economic, Monetary and Financial Developments in 2019 Economic, Monetary and Financial Developments in 2019
23Economic and monEtary rEviEw 2019
Growth in the construction sector moderated to 0.1% (2018: 4.2%), reflecting mainly the completion and near-completion of large infrastructure and mixed development projects. In the non-residential and residential subsectors, fewer and smaller new projects amid the commercial property glut and elevated level of unsold residential properties also contributed to the lower growth. While the civil engineering subsector remained the key contributor to growth, the delay in construction work for major highways, in addition to the completion of large petrochemical projects, led to a moderation in construction growth during the year.
Supportive labour market conditions in 2019Labour market conditions remained supportive of growth in 2019, despite being softer. Employment grew by 2.1% (2018: 2.5%), amounting to an additional employment gain of 316,000 persons, while unemployment rate remained stable at 3.3% (Table 1). The labour force participation rate also rose to 68.9% (2018: 68.3%).
In 2019, employment growth was mainly driven by high- and low-skilled workers, which grew by 3.9% and 6.5% respectively. Mid-skilled workers continued to account for the largest share of total employed persons at 59.5% (2018: 60.4%), followed by high-skilled workers at 27.6% (2018: 27.2%).
From a sectoral perspective, employment growth was driven mainly by the services sector (3.2%), followed by the manufacturing (2.1%) and agriculture (1.6%) sectors (Chart 1). In particular, the food, beverages and
1ANNUAL REPORT 2019
Table 1
Selected Labour Market Indicators
2015 2016 2017 2018 2019pEmployment ('000 persons) 13,992 14,177 14,451 14,810 15,126
(% change) 1.3 1.9 2.5 2.1Unemployment rate (% of labour force) 3.1 3.4 3.4 3.3 3.3Labour force participation rate (% of working age population) 67.9 67.7 68.0 68.3 68.9Retrenchments (persons) 38,499 37,699 35,097 23,168 29,605Foreign workers (‘000 persons) 2,135 1,866 1,797 2,016 2,000
p Preliminary
Note: The 2019 unemployment and labour force participation rates were estimated based on the quarterly averages of 2019 fi gures from the Labour Force Survey, while the 2019 employment growth was sourced from the Labour Productivity Statistics.
Source: Department of Statistics, Malaysia and Ministry of Human Resources
1ANNUAL REPORT 2019
Table 1
Real GDP by Kind of Economic Activity (2015=100)
2019p 2018 2019p 2018 2019p
% of GDP Annual change (%) Contribution to growth (ppt)1
Services 57.7 6.8 6.1 3.8 3.5Manufacturing 22.3 5.0 3.8 1.1 0.8Mining and quarrying 7.1 -2.6 -1.5 -0.2 -0.1Agriculture 7.1 0.1 1.8 0.0 0.1Construction 4.7 4.2 0.1 0.2 0.0Real Gross Domestic Product (GDP) 1001 4.7 4.3 4.7 4.3
1 Figures may not necessarily add up due to rounding and exclusion of import duties componentp Preliminary
Source: Department of Statistics, Malaysia

Economic, Monetary and Financial Developments in 2019
24 Economic and monEtary rEviEw 2019
Resilient external sector amid challenging global developmentsMalaysia maintained a healthy current account surplus while the financial account continued to register FDI inflows. Residents increasingly diversified their portfolios abroad and the domestic bond market saw non-resident inflows during the year.
The current account surplus widened to RM49.7 billion or 3.3% of GDP in 2019 (2018: RM30.6 billion or 2.1% of GDP) (Table 1). From a savings-investment perspective, the higher current account surplus reflected a sharper decline in investments. By components, the improvement in the current account balance was driven by lower deficits in the primary income and services accounts amid a higher goods surplus (Chart 1). The goods surplus increased as a result of a sharper decline in imports relative to exports.
accommodation subsector; and wholesale and retail trade subsector recorded strong employment growth of 7.7% and 3.3% respectively (2018: 8.1% and 3.2% respectively). Meanwhile, retrenchments rose to 29,605 persons per annum (2018: 23,168 persons; long-run average1: 34,530 persons).
Aggregate nominal wages in the private2 and public sectors grew at a slower rate of 4.2% and 3.7% respectively in 2019 (2018: 6.0% and 4.5%, respectively). The services sector registered a higher wage growth (4.1%, 2018: 3.8%), supported by food and beverages subsector; as well as information and communication subsector. The manufacturing sector registered a lower wage growth of 4.3% (2018: 10.8%). The moderation was broad-based across most manufacturing industries, but particularly evident in export-oriented industries, which included the E&E subsector (2019: 5.7%, 2018: 13.9%) and petroleum, chemical, rubber and plastic products subsector (2019: 3.6%, 2018: 11.6%). In 2019, wage per worker growth in the manufacturing sector moderated (2.9%, 2018: 8.6%), but still remained higher than that of the services sector (1.5%, 2018: 1.2%).
Labour productivity3 growth slowed to 2.2% in 2019 (2018: 3.4%), with broad-based moderation across all sectors. Services sector productivity growth moderated to 2.7% (2018: 5.0%), given the normalisation in production growth post-tax holiday and longer working hours. Productivity growth in the manufacturing sector also moderated (2.5%; 2018: 3.3%) due largely to slower production in the E&E subsector.
Chart 1: Employment Growth by Sector, 2016 - 2019p
1.31.9
2.5 2.1
-2
0
2
4
2016 2017 2018 2019p
Services Manufacturing Agriculture
Construction Mining Total
Contribution to growth (percentage points)
p PreliminarySource: Labour Productivity Statistics published by the Department of
Statistics, Malaysia
1 The long-run average is the average annual retrenchments from 1997 - 2018. Data is sourced from Ministry of Human Resources.2 Private sector wages are derived from the salaries and wages data published in the Monthly Manufacturing Statistics and Quarterly Services
Statistics by the Department of Statistics, Malaysia. It covers 62.9% of total employment.3 Measured by real value-added per hour worked.

Economic, Monetary and Financial Developments in 2019 Economic, Monetary and Financial Developments in 2019
25Economic and monEtary rEviEw 2019
The services account recorded a smaller deficit of RM10.9 billion (2018: -RM17.7 billion), due mainly to an increase in travel receipts and lower net payments for transportation and construction services. The travel account surplus widened to RM30.9 billion (2018: RM30.0 billion) following higher tourist arrivals and per capita spending, particularly by tourists from regional economies. Meanwhile, the deficits in the transportation and construction services accounts narrowed following more moderate trade and investment activity, respectively.
In the income account, the primary income deficit narrowed significantly to RM43.5 billion (2018: -RM51.6 billion). This reflected higher income earned by resident investors and lower income accrued to non-resident investors. Of note, the lower deficit in the direct investment income account, which moderated to RM33.3 billion (2018: -RM35.9 billion), was due to lower income accrued to foreign companies in Malaysia, particularly in the mining and manufacturing sectors. At the same time, Malaysian firms investing abroad in the information and communication services and agriculture sectors reported higher income. Portfolio investment income receipts increased following higher returns for resident investors from their investments in equity securities abroad.
The secondary income account recorded a larger deficit of RM21.4 billion (2018: -RM19.3 billion), reflecting an increase in outward remittances by foreign workers.
In 2019, the financial account recorded a net outflow of RM34.3 billion (2018: +RM18.6 billion). This was mainly on account of higher investments by residents in portfolio assets abroad and sustained direct investment abroad (DIA) which were partially offset by long-term FDI inflows.
The direct investment account registered a net inflow of RM9.4 billion (2018: +RM11.3 billion). In 2019, FDI inflows amounted to RM32.8 billion, equivalent to +2.2% of GDP (2018: +RM32.6 billion; +2.3% of GDP) (Chart 2). Of note, during the first quarter of the year, FDI recorded its highest-ever quarterly inflows to date, contributed mainly by the acquisition of a private healthcare group by a Japanese investor and the formation of a joint venture in the oil and gas sector. For the rest of the year, however, FDI was affected by subdued global investor sentiments. Advanced economies such as Japan (29.9% of net FDI flows for the year), Hong Kong SAR (25.7%) and the Netherlands (15.9%) were major contributors of FDI.
1ANNUAL REPORT 2019
Table 1
Balance of Payments1
Item (Net)2017 2018 2019p
RM billionCurrent account 38.3 30.6 49.7
Goods2 117.1 119.2 125.5Services -22.9 -17.7 -10.9Primary income -38.7 -51.6 -43.5Secondary income -17.3 -19.3 -21.4
Capital account 0.0 -0.1 0.3Financial account -4.7 18.6 -34.3
Direct investment 16.2 11.3 9.4Portfolio investment -15.4 -44.4 -37.7Financial derivatives -0.2 1.0 -0.4Other investment -5.3 50.7 -5.7
Net errors and omissions3 -17.1 -41.3 -7.3Overall balance 16.4 7.8 8.41 In accordance with the Balance of Payments and International
Investment Position Manual, Sixth Edition (BPM6) by the International Monetary Fund (IMF)
2 Adjusted for valuation and coverage of goods for processing, storage and distribution
3 As at 1Q 2018, the net E&O excludes reserves revaluation changes. This practice is backdated to 1Q 2010
p Preliminary
Source: Department of Statistics, Malaysia and Bank Negara Malaysia
p Preliminary
Chart 1: Current Account Balance
38.3 30.649.7
2.8 2.13.3
-2.0
0.0
2.0
4.0
-100
-50
0
50
100
150
2017 2018 2019p
RM billion
Goods Services
Secondaryincome
Current accountbalance
Current account balance,% of GDP (RHS)
Primary income
% of GDP
Source: Department of Statistics, Malaysia and Bank Negara Malaysia

Economic, Monetary and Financial Developments in 2019
26 Economic and monEtary rEviEw 2019
DIA outflows were slightly higher at RM23.3 billion; -1.5% of GDP (2018: -RM21.3 billion; -1.5% of GDP). Notable investments during the year included the acquisition of two offshore fields in Brazil and additional investments in existing projects abroad by a domestic oil and gas company. Brazil (25.2% of net DIA flows for the year), Australia (12.9%) and the Netherlands (11.9%) were the major recipients of DIA in 2019.
The portfolio investment account registered a net outflow of RM37.7 billion (2018: -RM44.4 billion), attributed mainly to higher resident investments abroad (-RM48.7 billion; 2018: -RM9.1 billion) (Chart 3). These investments were led by domestic institutional investors into both equity instruments and debt securities for the purposes of diversifying risk exposures and investment incomes. Meanwhile, non-resident portfolio investment flows remained volatile. For 2019 as a whole, non-resident portfolio flows registered a net inflow of RM11.0 billion (2018: -RM35.3 billion).
The other investment account recorded a net outflow of RM5.7 billion (2018: +RM50.7 billion), reflecting interbank placements abroad by resident banks, amid a net drawdown of external loans by the private sector. Net errors and omissions (E&O) amounted to -RM7.3 billion or -0.4% of total trade (2018: -RM41.3 billion, or -2.2% of total trade) during the year.
1 Foreign direct investment and direct investment abroad as defined according to the Balance of Payments and International Investment Position Manual, Fifth Edition (BPM5) by the International Monetary Fund (IMF)2 Negative values refer to net inflows
p PreliminaryNote: Figures may not necessarily add up due to rounding
Source: Department of Statistics, Malaysia and Bank Negara Malaysia
Chart 2: Net Foreign Direct Investment and Direct Investment Abroad1 by Sector
10.815.1
5.6 3.5
15.5 6.3
0.6 1.7
0.0
5.5
10.0 10.2
5.6 3.9
8.5 8.9
0.7 1.8
-0.6
0.7
0.1 0.2
-2.8 -1.6-5
0
5
10
15
20
25
30
35
2018 2019p 2018 2019p
RM billion
Non-financial services Mining and quarrying Financial services AgricultureManufacturing Construction
Direct investment abroad2
2019p: RM23.3 billionForeign direct investment
2019p: RM32.8 billion
p Preliminary
Source: Department of Statistics, Malaysia and Bank Negara Malaysia
-60
-40
-20
0
20
2015 2016 2017 2018 2019p
RM billion
Chart 3: Portfolio Investments
Non-resident Resident Net portfolio investment

Economic, Monetary and Financial Developments in 2019 Economic, Monetary and Financial Developments in 2019
27Economic and monEtary rEviEw 2019
Improvement in Net International Investment Position Malaysia’s net international investment position (IIP) registered a lower net liability position of RM47.3 billion as at end-2019 (2018: -RM77.7 billion) (Chart 1). This improvement mainly reflected an increase in external assets by RM91.7 billion, primarily in portfolio investments, which more than offset the increase in external liabilities of RM61.3 billion.
Malaysia’s external position was also strengthened by more favourable composition of external liabilities. In particular, the increase in external liabilities were due mainly to higher inflows of long-term FDI, mainly composed of equity holdings and retained earnings, which are less susceptible to capital reversals.
Overall, Malaysia’s external debt increased to RM946.3 billion as at end-2019, or 62.6% of GDP (end-2018: RM924.9 billion or 63.9% of GDP). Higher external debt was mainly accounted by increases in non-resident (NR) holdings of domestic debt securities and deposits, and external loans by corporations (Chart 2). These were partially offset by the decrease in intercompany loans and interbank borrowings.
Risks surrounding external debt were well contained given its favourable maturity and currency profiles, coupled with the Bank’s prudential and hedging requirements.1 As at end-2019, the external debt-at-risk for corporations2 and banks3 amounted to RM59.7 billion and RM67.7 billion, respectively. Cumulatively, these amounted to 13.5% of Malaysia’s total external debt and 30.0% of international reserves.
More than half of the outstanding external debt was of medium- and long-term tenures, with low rollover risk (Chart 3). Meanwhile, almost one-third of the external debt was denominated in ringgit (32.8%; end-2018: 30.2%), and not affected by valuation changes arising from fluctuations in the exchange rate. The remainder of external debt that was denominated in foreign currencies (FCY) was largely supported by FCY earnings and subject to prudential requirements on liquidity and funding risk management.4 Moreover, intercompany loans, which accounted for 14.1% of FCY external debt were generally available on flexible and concessionary terms. In addition, banks and corporations held sizeable FCY external assets amounting to RM1.3
-10
-5
0
5
10
15
-100
-50
0
50
100
150
2013 2014 2015 2016 2017 2018 2019p
RM billion % of GDP
Chart 1: Net International Investment Position (IIP)
-4.6%-1.6%
9.3%
5.6%
-2.2%
-5.4%-3.1%
RM billion (LHS) % of GDP (RHS)
p Preliminary
Source: Department of Statistics, Malaysia
Inte
rcom
pany
loan
s
Exch
ange
rate
val
uati
onef
fect
s
Inte
rban
kbo
rrow
ings
Oth
ers²
Bond
s an
dno
tes
NR d
epos
its
Loan
s
NR h
oldi
ngs
of d
omes
tic
debt
sec
urit
ies
Net change1: +RM21.4 billion
Chart 2: Change in External Debt
1 Changes in individual debt instruments exclude exchange ratevaluation effects
2 Comprises trade credits, IMF allocation of SDRs and otherdebt liabilities
Note:
Source: Ministry of Finance, Malaysia and Bank Negara Malaysia
NR refers to non-residentsFigures may not necessarily add up due to rounding
30
-7.4-2.5 -2.3 -1.5
2.65.3 6.4
20.8
-15
0
15
1 For more details on Malaysia’s external debt management, please refer to BNM Annual Report 2018 Box Article titled ‘Malaysia’s Resilience in Managing External Debt Obligations and the Adequacy of International Reserves’.
2 Based on the assessment on about 70% of offshore loans raised and bonds issued by corporations, in which interest coverage ratio is less than the prudent threshold of two times.
3 Refers to the portion of banks’ external debt that were more susceptible to sudden withdrawal shocks. These include interbank borrowings (RM46.9 billion), deposits accepted (RM16.6 billion) and other short-term debt (RM4.3 billion) from unrelated counterparties. For further details on banks’ external debt trend, refer to BNM Financial Stability Review – Second Half 2019.
4 Including requirements imposed on banks under local banking regulations.

Economic, Monetary and Financial Developments in 2019
28 Economic and monEtary rEviEw 2019
trillion. This further reinforces the repayment capacity of these entities to meet their external obligations.
BNM’s international reserves, which accounted for 23.9% of the country’s external assets, remained an important policy buffer against external shocks. The international reserves amounted to USD103.6 billion as at end-2019 (end-2018: USD101.4 billion), sufficient to finance 7.5 months of retained imports and is 1.1 times the short-term external debt.
In 2019, Malaysia maintained a sizeable net foreign currency asset position. About 94.5% of external assets were denominated in foreign currency compared to 41.4% of total external liabilities. This demonstrated Malaysia’s ability in responding to external shocks. In particular, a bout of depreciation in the ringgit will result in a larger increase in external assets compared to external liabilities, thus enhancing Malaysia’s external position. This stabilising mechanism, coupled with the favourable nature and composition of Malaysia’s IIP, accords the economy with resilience against potential external shocks.
By currencyBy maturity
Chart 3: Breakdown of Malaysia's Total External Debt (% share)
Short-term 41.4%
Medium- to long-term
58.6%
Ringgit-denominated debt32.8%
Subjected to prudential
and hedging requirements
Foreign currency- denominated debt
67.2%
1 Includes trade credits, IMF allocation of SDRs and miscellaneous, such as insurance claims yet to be disbursed and interest payables on bonds and notes
Source: Bank Negara Malaysia
Note: Figures may not necessarily add up due to rounding
By instrument By institution
Offshore borrowings
Others1
8.4%
NR holdings of domestic debt securities
21.2%
Interbank borrowings
21.1% Bonds and notes16.5%
Intercompany loans13.5%
Loans 8.3%
NR deposits 10.9%
Banks 38.3%
Public corporations 11.3%
Bank Negara Malaysia 1.3%
Federal Government 21.9%
Private corporations 27.1%
Limited rollover risks
1 Consist of portfolio investments and currency and deposits2 Consist of deposits and interbank placements, bonds and notes and money market instruments3 Including the forward leg of currency swaps
497.8 391.8
108.756.7
424.0
17.3
0
200
400
600
800
1,000
1,200
Liquid external assets
Potential claims on reserves
RM billion
Banks' liquid external assets2
Corporations' liquidexternal assets1
Short-termexternal debt
Maturing FCY loans,securities & deposits
BNM’s net international reserves
BNM’s FCY short forward position3
Source: Bank Negara Malaysia
Chart 4: Liquid External Assets and Potential Claims on International Reserves

Economic, Monetary and Financial Developments in 2019 Economic, Monetary and Financial Developments in 2019
29Economic and monEtary rEviEw 2019
5 Measured by the annual percentage change in the Consumer Price Index (CPI).
6 Refers to the combined impact of the zeroisation of the Goods and Services Tax (GST) rate and the implementation of the Sales and Services Tax (SST).
7 Core inflation is computed by excluding price-volatile and price-administered items. It also excludes the estimated direct impact of tax policy changes.
Core inflation Fuel
Net impact of consumption tax policy changes
Others*
Headline inflation (RHS) Core inflation (RHS)
Chart 1.12: Contribution to Headline Inflationby Components
* Others include price-volatile items and other price-administered items
Source: Department of Statistics, Malaysia and Bank Negara Malaysia
-2.0
-1.0
0.0
1.0
2.0
3.0
-2.0
-1.0
0.0
1.0
2.0
3.0
J F M A M J J A S O N D J F M A M J J A S O N D
Contribution (percentage points)
2018 2019
Annual growth (%)
Lower headline inflationAverage headline inflation5 was lower at 0.7% (2018: 1.0%) (Chart 1.12). The extension of fuel price ceilings and festive price control scheme on food items contained fuel and food inflation, while changes in consumption tax policy in 20186 continued to exert an overall downward pressure on prices. Apart from these factors, relatively lower global oil prices and improved food supply conditions also contributed to the lower fuel and food prices, respectively. The decline in inflation in import partners’ economies further helped contain domestic inflationary pressures.
Underlying inflation as indicated by core inflation,7 on the other hand, remained relatively stable (2019: 1.5%; 2018: 1.6%). This indicates that demand-driven inflationary pressures were relatively subdued amid the lack of impetus from the labour market. Along with the stable real wage growth per worker in the private sector, the presence of spare capacity in domestic industries supported the stability of the underlying inflation.
Monetary policy remained conducive for continued growth amid price stabilityThe OPR was reduced by 25 basis points to 3.00% at the May 2019 meeting, to ensure a conducive monetary environment for a steady growth path amid low inflation. In the Monetary Policy Committee’s (MPC) assessment, downside risks to Malaysia’s growth prospects had increased, mainly stemming from external factors. At the same time, heightened uncertainties in the domestic environment, the risk of extended weakness in commodity-related sectors and some signs of tightening in financial conditions factored into the MPC’s considerations. Therefore, the OPR reduction was intended to preserve the degree of monetary accommodativeness, thus ensuring that monetary policy remained conducive for continued growth and price stability. The MPC was also mindful that measures beyond monetary policy such as structural reforms would be pertinent to raise potential growth.
The policy rate reduction had the intended impact on lending rates in the economy, as the wholesale and retail interest rates subsequently declined (Chart 1.13). The pass-through to the interbank market was strong and immediate, as the Kuala Lumpur Interbank Offered Rate (KLIBOR) declined by 23 – 25 basis points across tenures within a day of the OPR reduction. In the retail segment, all banks also revised downward their respective base rates by 25 basis points, resulting in a lower weighted average base rate of 3.68% as at end-2019 (2018: 3.91%). Lending rates as indicated by the weighted average lending rate (ALR) on outstanding loans gradually trended downwards to end the year at 5.16% (2018: 5.43%). The overall transmission to
Chart 1.13: Policy, Interbank and Lending Rates(at end-period)
Source: Bank Negara Malaysia and Bloomberg
3.0
4.0
5.0
6.0
2019J F M A M J J A S O N D
%
Weighted average lending rate (ALR)
Weighted average base rate (BR)
OPR3-month KLIBOR

Economic, Monetary and Financial Developments in 2019
30 Economic and monEtary rEviEw 2019
8 Nonetheless, slower loan growth in 2019 as observed in the data reflected, in part, a statistical revision to include loans from a newly licensed commercial bank for April 2018 onwards. Excluding this factor which inflated loan growth slightly in 2018, the moderation in loan growth in 2019 would be less severe.
9 Excluding a single large issuance in the finance, insurance, real estate and business services sector in May 2019, total corporate bond issuances amounted to RM96.3 billion (2018: RM92.8 billion) (Note: Excluding issuances by Cagamas and non-residents).
10 For related analysis on lending trends, banks’ risk appetite and an examination of loan rejections, refer to the BNM Quarterly Bulletin Third Quarter 2019 Box Article titled ‘Banking on Banks: Are They Lending Enough?’.
11 Total loans disbursed by the banking system and development financial institutions (DFIs) in 2019 amounted to RM1,275.7 billion, comparable to the three-year average (2016-2018) of RM1,182.4 billion.
Chart 1.14 : Total Net Financing Through Banks, Non-Bank Financial Institutions and Corporate Bonds
6.3 5.85.0
0
2
4
6
8
2017 2018 2019
Contribution to growth (percentage points)
Source: Bank Negara Malaysia
Outstanding loans1 Outstanding corporate bonds2
Note: Effective June 2019, banking system loans data for April 2018 onwards were revised to include data from a newly licensed commercial bank. It was previously classified as a non-bank financial institution.
1
2 Excludes issuances by Cagamas and non-residents
Loans from the banking system, development financial institutions (DFIs) and major non-bank financial institutions (NBFIs)
Chart 1.15: Outstanding Loans by Borrowers
Businesses1 Households2 Others1,3
Contribution to growth (percentage points)
1 Loans from the banking system and development financial institutions (DFIs) only2 Loans from the banking system, DFIs and major non-bank financial institutions (NBFIs)3 Includes loans of financial institutions, NBFIs, Government, domestic other entities, and foreign entities
Note: Effective June 2019, banking system loans data for April 2018 onwards were revised to include data from a newly licensed commercial bank. It was previously classified as a non-bank financial institution.
Source: Bank Negara Malaysia
3.9
5.2
4.0
0
2
4
6
8
2017 2018 2019
lending rates was strong given the high share of floating-rate loans in the banking system (about 75%), strong market competition, and the decline in banks’ cost of funds.
Nevertheless, financing to the private sector moderated in line with economic activity, mainly weighed down by cautious borrowing sentiments during the year. This was reflected in net financing growth, which expanded by 5.0% (2018: 5.8%), where outstanding loans grew by 4.0% (2018: 5.2%)8 while growth in outstanding corporate bonds was sustained at 8.0% (2018: 8.0%) (Charts 1.14 and 1.15). The demand-driven moderation in loan growth was more pronounced in the business segment, further compounded by high loan repayment trends and cautious lending by banks to selected sectors experiencing weakness. The bond market also lacked impetus amid the review in large infrastructure projects, despite a lower yield environment.9 However, following the OPR reduction in May, demand for loans improved, with applications increasing for both business and household loans. This, in turn, translated into some improvement in loan growth, particularly in the business segment, towards the end of the year.
Financing supply conditions were continuously monitored by the Bank to ensure lending remained supportive of economic activity, supplemented by ongoing and new measures to enhance the financing ecosystem.10 Relatively stable funding and liquidity conditions for banks continued to facilitate credit intermediation, with no significant changes in overall loan granting criteria reported by banks. Stable loan approval rates and loan disbursements at levels comparable to recent averages11 indicated there had not been a general reduction in credit available to borrowers, including small and medium enterprises (SMEs). For instance, about three out of four housing and SME loans continued to be approved in 2019. Supportive home ownership initiatives such as the Home Ownership Campaign which was launched in 2019, and financing schemes for first-time home buyers
including BNM’s Affordable Home Fund, also provided further impetus to housing loans. More broadly, a variety of direct funds, financing guarantee, debt restructuring, financial advisory and capacity building programmes for homebuyers and SMEs have been put in place over the years to improve access to financing for the underserved segments and to promote a more holistic financing ecosystem.

Economic, Monetary and Financial Developments in 2019 Economic, Monetary and Financial Developments in 2019
31Economic and monEtary rEviEw 2019
Chart 1.16: Outstanding Ringgit Liquidity Placed with Bank Negara Malaysia (at end-period)
RM billion
D50
100
150
200
250
J F M A M J J A S O N O ND J F M A M J J A S2018 2019
Source: Bank Negara Malaysia
Others
Statutory Reserve Requirement (SRR)
Repos
Bank Negara Monetary Notes and Bank Negara Interbank Bills
Money Market Borrowings (excluding repos)
Monetary operations ensured sufficient liquidity The Bank conducted monetary operations to ensure sufficient liquidity to support the orderly functioning of the interbank and foreign exchange markets, amid capital flow volatility during the year. In particular, the Bank’s liquidity injection operations through reverse repos and foreign exchange swaps mitigated the contractionary impact on banking system liquidity arising from intermittent periods of large portfolio outflows.
Accordingly, as spillovers to banking system liquidity remained contained, this ensured continued financial intermediation to support economic activity. At the system level, aggregate outstanding liquidity placed with the Bank amounted to RM168.9 billion (2018: RM185.0 billion)
(Chart 1.16). At the institutional level, most banking institutions continued to maintain surplus liquidity positions with the Bank. Overall, the price discovery process in the domestic money market remained uninterrupted, as evidenced by broadly stable interbank rates.
The reduction in the Statutory Reserve Requirement (SRR) ratio from 3.50% to 3.00% in November 2019 resulted in a broad-based release of liquidity into the domestic banking system. The SRR ratio was reduced to provide additional liquidity to the banking system on a more permanent basis. This was in view of the need to absorb less excess liquidity from the banking system, as the previous build-up in excess liquidity over the years of strong inflows has partially reversed. The release of liquidity amounting to RM7.4 billion would continue to support the efficient functioning of the domestic financial markets and facilitate effective liquidity management by the banking institutions.

Economic, Monetary and Financial Developments in 2019
32 Economic and monEtary rEviEw 2019
Securing Future Growth through Quality Investments
Malaysia’s Aspirations to Become a High-Income and Inclusive Economy Hinge on Quality Investment
Over the past half a century, sustained high economic growth has put Malaysia on the cusp of a high-income nation. Malaysia has successfully leapfrogged from being predominantly an agricultural-based economy to an open and industrialised economy with multiple sources of growth. Now, to successfully transition into a high-income nation, bold and targeted policies are required as few countries have successfully transitioned into a high-income nation within a few generations.1
The country’s economic transformation in the past was supported by effective policies that focused on export-orientation, liberalising trade and investment as well as economic diversification. The success of these policies was underpinned by strong investment from both foreign and domestic sources, which encouraged the development of new industrial clusters and generated significant job opportunities.
However, Malaysia’s commendable rate of investment growth of the past has slowed markedly in recent years. This is compounded by a landscape of declining cross-border investment and increasing competition to attract foreign direct investments (FDI) globally. A persistent slowdown in investment growth poses a risk to Malaysia’s future growth potential, with an adverse impact on technological progress and productivity growth. Without swift and effective reforms, the lack of quality investments will impede the transition towards a high-income, innovation-driven, and inclusive economy. This article examines the recent slowdown of investment in Malaysia, assesses the current state of investment needs and explores potential policy options to enhance the overall investment ecosystem. The end goal is to attract more quality investments that will help the nation transform into a high-value added and high-income nation.
A. Recent investment trends are not aligned with Malaysia’s growth aspirations Over the last decade, investment growth in Malaysia has generally been modest. While the recent
moderation in public investment is attributable to the Government’s fiscal consolidation efforts, the broad-based slowdown in private investment compared to its long-term average warrants attention. In 2019, private investment expanded by 1.5%, which is the lowest growth recorded since the Global Financial Crisis (GFC) (Chart 1).
Chart 1: Real Gross Fixed Capital Formation (GFCF) and Real Private Investment Growth
-80-60-40-20
0204060
1990
1991
1992
1993
1994
1995
1996
1997
1998
1999
2000
2001
2002
2003
2004
2005
2006
2007
2008
2009
2010
2011
2012
2013
2014
2015
2016
2017
2018
2019
Private Investment GFCF
Source: Department of Statistics, Malaysia
Annual change (%)
1990 –2019 Pvt. Inv.average: 7.9%
1 Over 1996 to 2014, less than 10% of economies (16 out of 182 countries) have reached high-income status (Source: Cherif R. and Hasanov F (2019). ‘The Return of the Policy That Shall Not Be Named: Principles of Industrial Policy’).

Economic, Monetary and Financial Developments in 2019 Economic, Monetary and Financial Developments in 2019
33Economic and monEtary rEviEw 2019
In particular, despite continued strong foreign direct investments (FDI) approvals (Chart 2), realised foreign investments has slowed substantially over the recent years (Chart 3). Compared to the strong average growth of 14.4% between 2011 and 2013, realised foreign investment growth has declined to an average of 1.2% between 2014 and 2018, resulting in a smaller share of foreign affiliates2 investment to nominal private investment of 27% in 2018 (2011: 41%). This sharp moderation is due to slower growth mainly in the mining and manufacturing sectors. Chart 3 also highlights the relatively weak contribution of services investment by foreign affiliates. This is of concern as FDI in the services sector is widely acknowledged to bring a wider range of technological transfers than manufacturing FDI.3 While manufacturing FDI mainly transfers equipment and industrial processes, services FDI tends to transfer technical, management and marketing know-how, and organisational skills which create more high-skilled jobs for Malaysian graduates.
This trend is also evident in domestic investment4 growth in Malaysia, which has moderated from an average of 13.5% between 2011 and 2013 to 6.0% between 2014 and 2018. This can mainly be attributed to slower investment growth in the mining, agriculture and construction sectors.
Chart 2: Manufacturing Sector Investment Approval, by Origin
20 19 12 16 13 18 20
33 46
22 29 34
21 31
40
22 27 22
58
10
0
20
30
40
50
60
70
80
90
100
2000 2001 2002 2003 2004 2005 2006 2007 2008 2009 2010 2011 2012 2013 2015 2016 20172014 2018
Foreign Investments Domestic Investments
RM Billion 2014 – 2018 Manufacturing Foreign Investment Approvals
average: RM37.5 billion
Note: Total foreign investment approvals in the manufacturing sector in 2018 was at a record high (RM58 billion), underpinned by the high approvals particularly in the petroleum products, E&E, basic metal products, and paper, printing and publishing which amounted toRM43 billion (75% of total foreign investments approved).
Source: Malaysian Investment Development Authority (MIDA)
2 Foreign affiliates refer to companies operating in Malaysia that are controlled by foreign investors (the holding of equity interest is more than 50 per cent) (Source: Department of Statistics, Malaysia).
3 Doytch N (2016). ‘The Worldwide Shift of FDI to Services- How does it Impact Asia? New Evidence from Seventeen Asian Economies’. 4 Domestic investment is estimated by deducting GFCF by Foreign Affiliates from total Nominal GFCF.5 World Investment Report (2019).
The slower growth of investment in Malaysia can be attributed to cyclical factors emanating from both external and domestic developments:
• Challengingglobalmacroeconomicbackdrop The recent slowdown in capital expenditure is not unique to Malaysia. In the post-GFC period, the global
economy has been subjected to several headwinds including weak growth performance, trade and geopolitical tensions, sharp decline in energy prices, volatile capital flows and bouts of policy uncertainty in major economies. Given these circumstances, the trend in global FDI has seen lacklustre growth since 2008. According to UNCTAD, the average net FDI growth globally dropped from 8% (2000-2007) to only 1% in the recent decade.5 In Malaysia, net FDI declined by an average of 11% a year between 2016 and 2019 (Chart 4).

Economic, Monetary and Financial Developments in 2019
34 Economic and monEtary rEviEw 2019
The weakening external demand coupled with greater uncertainty over trade tensions in the last two years has affected business sentiments and investment decisions, particularly for export-oriented firms. This is evident in business surveys where firms have cited faltering orders affecting their capacity expansion intentions. This had a pronounced effect on total capital expenditure, as export-oriented firms account for over 50% of total private investment expenditure.6
Chart 3: Nominal Gross Fixed Capital Formation (GFCF) by Foreign Affiliates
Mining (42%) Manufacturing (39%) Services (19%)
Others (1%)
17.7
12.812.9
2.5 3.6
-2.9
1.8 0.9
-10
-5
0
5
10
15
20
2011 2012 2013 2014 2015 2016 2017 2018
Notes:1 Numbers in brackets refer to share of the sector to total foreign
affiliates’ investment in 2018.2 Others refer to the Agriculture and Construction sectors. Shares do not
add up due to rounding.
Source: Department of Statistics, Malaysia
2014 –2018average: 1.2%
2011 –2013average: 14.4%
Annual change (%),ppt. contribution
Chart 4: Malaysia Net FDI
p Preliminary
RM billion
47
40
33 33
0
10
20
30
40
50
2008 2009 2010 2011 2012 2013 2014 2015 2016 2017 2018 2019p
Source: Department of Statistics, Malaysia and Bank Negara Malaysia
2016 -2019 CAGR: -11%
Chart 5: Real Gross Fixed Capital Formation (GFCF)Growth, Contribution by Type of Asset
Annual change (%),ppt. contribution
Structures Real GFCFM&E Others
11.3
5.3 4.9 3.6 2.6 2.4
-0.31.1
-5
0
5
10
15
20
2012 2013 2014 2015 2016 2017 2018 2019
Note: Numbers refer to percentage point (ppt) contribution to growth from structures investment
Source: Department of Statistics, Malaysia
6 Export-oriented firms refer to sectors with indirect/direct exports that amount to over 50% of total output based on Department of Statistics, Malaysia’s Input Output Table, 2015. Share refers to the share of investment of export-oriented firms in 2018.

Economic, Monetary and Financial Developments in 2019 Economic, Monetary and Financial Developments in 2019
35Economic and monEtary rEviEw 2019
• Oversupplyinthedomesticpropertymarket An idiosyncratic issue that has affected private investment growth in Malaysia is the slowdown in
residential and commercial property construction. Chart 5 illustrates the significant decline in the contribution from structures investment since the peak in 2012. This decline has partly been driven by the slower work done in the residential and non-residential segments (Chart 6), which make up about 50% of total construction work done. The slowdown in both residential and non-residential construction was due to the oversupply situation and persistent imbalances in these markets.7
• Sharpfallinoilprices The sharp decline in oil prices since late-2014 led to a significant contraction of investment in the
mining sector. Since 2015, capital expenditure by firms in the oil and gas sector has contracted for four consecutive years, resulting in a fall of the share of the mining sector to private investment from 15% in 2015 to 10% in 2018.
Chart 6: Total Construction Work Done
Residential (24%) Non-Residential (26%) Civil (45%) Special Trade (5%)
5.7
25.5
12.6 12.8 12.110.3 9.2
5.1 0.6
-10
-5
0
5
10
15
20
25
30
2011
Note: Number in brackets refer to share of segment to total work done in 2019
Source: Department of Statistics, Malaysia
2012 2013 2014 2015 2016 2017 2018 2019
Annual change (%),ppt. contribution
7 Bank Negara Malaysia (2017). ‘Imbalances in the Property Market’.8 Capital stock per capita is estimated as the total capital stock divided by the population size of a country. It is a proxy of the relative capital intensity of
countries, which is a measure of the ratio of capital to workers employed (Source: Lim, D (1979). ‘On the Measurement of Capital Intensity’).9 Holding state of development constant refers to the first year in which PPP adjusted Real GDP per capita is above USD26,000. This figure is chosen
as a control so that benchmark economies can be directly compared to Malaysia’s PPP Adjusted GDP per capita of USD26,001 in 2017.
B. Encouraging higher capital spending in productive assets to elevate Malaysia’s economic development Capital Stock While cyclical factors explained the recent slowdown in private investment, of concern is the overall low
level of capital stock and quality of investment in Malaysia. Capital stock per capita8 is an essential factor in improving labour productivity. Workers are able to produce a higher level of output with greater access to more sophisticated and efficient infrastructure and machinery. Higher capital stock in new technology also permits greater specialisation and improvement in skills of the labour force, effectively raising the quality of human capital and the capacity of the economy to grow in the long run.
In general, countries with higher capital stock per capita tend to have higher income (Chart 7a). Malaysia’s overall capital stock is slightly lower than the average of countries at a similar stage of development. In addition, the capital stock per capita of countries that achieved high-income status over the last two decades was markedly higher than that of Malaysia when these countries were at Malaysia’s current stage of development9 (Chart 7b).

Economic, Monetary and Financial Developments in 2019
36 Economic and monEtary rEviEw 2019
Chart 7a: Scatterplot of Real Gross Domestic Product per Capita and Real Capital Stock per Capita
Source: Bank Negara Malaysia estimates using data from Penn World Tables 9.1
Australia
Canada
PR China
France Germany
Indonesia
Japan
Malaysia
South Korea
Thailand
UnitedKingdom
UnitedStates
India
Spain
Estonia
Portugal
AustriaItaly
Argentina
Denmark
R² = 0.85
0
50
100
150
200
250
0 10 20 30 40 50 60
'000 USD
Real
Cap
ital S
tock
per
Cap
ita
'000 USDPPP Adjusted Real GDP per Capita
Chart 7b: Level of Real Capital Stock per Capita Controlling for Real GDP per Capita
95108
146 140119
93
200
82
0
50
100
150
200
250
Australia(1988)
Canada(1984)
France(1996)
Germany(1991)
Japan(1990)
South Korea(2004)
Singapore(1995)
Malaysia(2017)
'000 USD
Benchmark Average: 129
Note: For benchmark economies, the year was chosen such that their PPP adjusted real GDP per capita is similar to that of Malaysia in 2017 (~USD26,000)
Source: Bank Negara Malaysia estimates using data from Penn World Tables 9.1
Real
Cap
ital
Sto
ck p
er C
apit
a

Economic, Monetary and Financial Developments in 2019 Economic, Monetary and Financial Developments in 2019
37Economic and monEtary rEviEw 2019
Furthermore, the growth of capital stock per capita at Malaysia’s current stage of development has been slower than that of benchmark economies10. In the past, the benchmark economies generally accumulated capital at a faster rate compared to Malaysia (Chart 8a). The compounded annual growth rate (CAGR) of capital stock per capita in the benchmark economies was on average 4.7% compared to Malaysia’s 4.0% over the last nine years. It is worth noting that for some countries such as Japan and South Korea, these figures also include periods of economic recessions11. Although investment growth in Japan and South Korea moderated during these periods, the share of investment to GDP remained significantly higher than that of Malaysia (Chart 8b). In Malaysia, the share of investment to GDP fell sharply during the AFC from its peak of 49% in 1997 to 25% in 2000, and never recovered to above 30%. The decline is mainly attributable to the sharp decline in private investment, from 36% to 13% of GDP in the same period.
Note: Markers refer to 7-year compounded annualised growth rates (CAGR, RHS) of the real capital stock per capita in respective economiesFor benchmark economies, the initial year was chosen such that their base real capital stock per capita level is similar to that of Malaysia in 2010 (~USD62,000)
Source: Bank Negara Malaysia estimates using data from Penn World Tables 9.1
Chart 8a: Real Capital Stock per Capita Level and Growth Rates
'000 USD
2.4 3.05.0 4.8 4.7 5.0
7.94.0
-10-6-22610
050
100150200250
Aust
ralia
(197
0)
Cana
da(1
966)
Fran
ce(1
968)
Germ
any
(196
6)
Japa
n(1
976)
Sout
h Ko
rea
(199
7)
Sing
apor
e(1
975)
Mal
aysi
a(2
010)
% CAGR
t t+7
Real
Cap
ital
Sto
ck p
er C
apit
a BenchmarkAverage: 4.7%
Chart 8b: Share of GFCF to GDP
Japan South Korea Malaysia
% Share to GDP
Note: *Average GFCF share to GDP calculated for Japan is between1980 to 1983 as detailed comparable GFCF data is only available from 1980
Source: Bank Negara Malaysia estimates using data from International Monetary Fund (IMF)
1520253035404550
19831980 1986 1989 1992 19981995 2001 20042007 2010 20162013 2019
South Korea '96 - '04average: 33%
Japan '80 - '83average: 32%
Malaysia ‘09 - ‘17 average: 25%
10 Benchmark against selected countries that have successfully transitioned into high-income economies, namely Australia, Canada, France, Germany, Japan, South Korea and Singapore. Between 1960 and 2013, only 29 countries have successfully transitioned into high-income economies (Source: Filipe J., Kumar U. and Galope R (2014). ‘Middle Income Transitions: Trap or Myth?’).
11 These refer to the Recession of the 1980s for Japan and the Asian Financial Crisis (1998) for South Korea.12 In national accounting, there are three main asset classes of investments which are structures (e.g. buildings, factories and residential), machinery
and equipment (M&E) (e.g. machinery for manufacturing and transport equipment) and other assets (e.g. livestock and research and development).13 Bank Negara Malaysia (2018). ‘Are Malaysian Workers Paid Fairly?: An Assessment on Productivity and Equity’.
Investment in Machinery and Equipment In terms of type of investment12, generally, as countries become more developed, investment tends to shift
from infrastructure-heavy capital to advanced machinery and equipment. For Malaysia, the average share of capital stock in machinery and equipment (M&E) is lower than that of the benchmark economies (Chart 9). Even when compared to other emerging markets such as Thailand and Brazil, Malaysia’s lower share of M&E is apparent, despite these countries having a lower overall capital stock per capita. One of the factors that explains Malaysia’s lower share of M&E is the availability of cheap foreign labour13, which has resulted in firms employing more labour instead of investing in new technology to expand production.
Ownership In terms of ownership, capital stock in Malaysia is still largely concentrated in the public sector (Chart 10). In
developed countries, the private sector owns a significantly larger portion of capital stock, with an average ratio of private to public capital of over three times. This underscores the importance of the private sector as the main engine of investment growth for developed countries. Successful private sector firms drive growth, create jobs and pay taxes that finance public sector services and investment. Private companies also generate positive spillovers through increased demand for domestic goods and services through sourcing of local raw materials and utilisation of financial and telecommunications services.

Economic, Monetary and Financial Developments in 2019
38 Economic and monEtary rEviEw 2019
Quality of Investments Importantly, there are evidences that the quality of investments in Malaysia has diminished over the last
decade. Firstly, investment in Malaysia tends to exhibit lower innovation creation and slower development of forward and backward linkages relative to regional peers.14 This remains a concern as higher innovation and greater linkages are crucial in ensuring that investments generate wider spillovers to the economy. Secondly, economic complexity gains in Malaysia have been slower than most regional economies15 where investments have been focused in sectors that are substantially more diversified and complex. Economic complexity is important as studies have documented how higher economic complexity has a positive effect on growth and levels of income. Thirdly, the insufficient number of high-skilled jobs created to absorb graduates
PR China Malaysia
Vietnam JapanNew ZealandThailand
United States LuxembourgFranceEstonia SingaporeSouth Korea
CanadaSri Lanka Turkey AustriaItalySwitzerlandPhilippines Germany
Costa Rica IrelandBelgiumBrazil
Indonesia R² = 0.20
0
1
2
3
4
5
6
7
0 20 40 60 80 100 120
'000 USDPPP Adjusted Real GDP per Capita (2017)
Source: Bank Negara Malaysia estimates using data from Penn World Tables 9.1 and the International Monetary Fund (IMF)
Rati
o of
Pri
vate
to G
ener
al G
over
nmen
tCa
pita
l Sto
ck
Chart 10: Ratio of Private to General Government Real Capital Stock to Real GDP per Capita
Note: For benchmark economies, the year chosen was such that their base real capital stock per capita level is similar to that of Malaysia in 2017 (~USD80,000). For Brazil and Thailand, the most recent share of M&E capital stock is used because capital stock per capita in these countries have yet to exceed USD80,000 M&E in Penn World Tables refers to computers, communication equipment and other machinery but excludes transport equipment
Chart 9: Share of M&E Capital Stock to Total Capital Stock
0
5
10
15
20
25
1111
910
13 1214
23
12
18
Malaysia(2017)
Australia(1981)
Canada(1975)
France(1973)
Germany(1972)
Japan(1981)
South Korea(2002)
Singapore(1979)
Brazil(2017)
Thailand(2017)
Source: Bank Negara Malaysia estimates using data from Penn World Tables 9.1
Benchmark Average: 13%
% Share
14 Bank Negara Malaysia (2017). ‘Rethinking Investment Incentives’. 15 Bank Negara Malaysia (2018). ‘Complexity and Growth: Malaysia’s Position and Policy Implications’.

Economic, Monetary and Financial Developments in 2019 Economic, Monetary and Financial Developments in 2019
39Economic and monEtary rEviEw 2019
entering the labour force16 could also be attributed to weaker investment into high-value areas. In this regard, investments have not been successful in leveraging on the labour force in Malaysia to produce high-value-added goods and services. Fourth, the higher share of investments concentrated in broad property suggests that investment in Malaysia has not transitioned towards more productive assets (e.g. research and development, ICT equipment and computer software), which are crucial in improving labour productivity. The share of broad property to total investment has increased between 2010 and 2017, attributed primarily to the rising share of residential investment (Chart 11).
Chart 11: Share of Property to Total Nominal Investment
* Special trades include works such as painting, carpentry, electrical and plumbing** Other assets include mineral exploration, R&D, etc.
Note: Share of residential, non-residential, civil and special trades to total structures investment estimated using shares from total construction work done
Source: Bank Negara Malaysia estimates using data from Department of Statistics, Malaysia
9.2 8.0
42.3 34.1
4.52.7
12.621.4
21.6 17.4
9.8 16.4
2010 2017
Machinery &Equipment
Special Trades*Civil Engineering
Residential
Other Assets**
Total Residential andNon-residential
31%
Total Residential andNon-residential
34%
Non-Residential
Selected Initiatives in Other Countries to Improve Overall Investment Ecosystem
In order to attract more investments in the increasingly competitive global environment, various countries have undertaken efforts to reform their investment ecosystem. These range from short-term policies to benefit from current geopolitical tensions to longer-term measures to ensure sustained investment growth. The examples highlight the different approaches adopted, tailored to different circumstances, but with a similar aim of maximising investments.
India Establishment of Lead National FDI Promotion Agency (2009) InvestIndia, a dedicated agency to lead the country’s national investment promotion for FDI. Key characteristics include: • Flatorganisationalstructurewithrecruitmentofhigh-calibre
management and 90% of staff have private-sector experience
16 Bank Negara Malaysia (2018). ‘Are Malaysian Workers Paid Fairly?: An Assessment of Productivity and Equity’. 17 Some of the proposed areas of reform are drawn from the ongoing research collaboration between the World Bank and Bank Negara Malaysia on
‘Investment Policies and Reform in Incentives Framework’.
C. Current challenges necessitate reforms to strengthen Malaysia’s investment ecosystem17

Economic, Monetary and Financial Developments in 2019
40 Economic and monEtary rEviEw 2019
Turkey
New Investment Ecosystem Framework (2006) Various changes to overall investment institutional framework, including: • IntroducedInvestmentSupportandPromotionAgencyofTurkey(ISPAT),
a dedicated foreign investment promotion agency with no regulatory or incentives functions
• EnhancedbusinesssupportforFDIestablishmentandaftercareservices• Implementssector-specificpromotionactionplansTechnology-Focused Industry Move Programme (2019)A new programme to encourage advanced technology production in the domestic market. The incentives include:• Taxexemptionsforcorporationsprovidinglogisticsservicesfor
production companies• Investmentincentivesforadvancedtechnologyproductionincertain
prioritised products
Thailand
Thailand Plus (2019)Encourages foreign investors to relocate to Thailand amid the US-PR China trade war. The measures include:• Extensionofcorporateincometaxexemptionperiodforselected
investments above a certain amount• Specialtaxdeductionsforinvestmentsinhumandevelopment,
specifically in science, technology, engineering and mathematics (STEM) fields
• 50%corporateincometaxreductionforfirmsthatinvestatleastTHB1bn by the end of 2021
5G Commercialisation (2020)Government has begun 5G licence spectrum allocation to ensure swift roll out of latest technology that will improve the efficiency of businesses
Sri LankaEnhancement to Boost the Investment Climate (2017)Key changes to Board of Investment (BOI) processes and the introduction of a new Inland Revenue Act to streamline administration of incentives. Key changes include:• Shiftfromcomplicatedtaxsystemtoafairandtransparenttaxpolicy• IntroducedtargetedinvestmentpromotionbytheBOI
Indonesia
New Negative Investment List (2016)Revised Investment List to provide more opportunities for foreign investors and increase regional competitiveness. Amendments include:• Increasedorfullforeignownershipforcertainindustries• Streamlininginvestmentprocessesbyremovingcertainbureaucratic
steps that require unnecessary approvals or recommendations from ministries
• Reducethecomplexityoftheinvestmentframework

Economic, Monetary and Financial Developments in 2019 Economic, Monetary and Financial Developments in 2019
41Economic and monEtary rEviEw 2019
VietnamAmendment and Supplement to the Law on Investment (2016)Amendments on the Law on Investment was made to create an improved investment climate and reduce investment framework complexity. Key amendments include:• Removingcertainproceduresofland,constructionandenvironmentin
order to create a more favourable investment climate
South KoreaForeign Investment Promotion Act (FIPA) 1999 (2017)Revised FIPA to promote foreign investors entering South Korea by providing investment incentives, which include:• Reductionincorporateandincometaxes• Cashgrantsavailableforlandandleaseexpenses• Governmentleaseslandtoforeigncompaniesatareasonablerate
Source: Newsflows, World Bank, UNESCAP, UNCTAD and national authorities
A holistic review of the current investment ecosystem is critical to ensure that the current slowdown does not persist. Given the multidimensional nature of the investment ecosystem, the policy approach to reinvigorating private investment, both domestic and foreign, needs to be comprehensive. Legal, regulatory, procedural and institutional barriers in all phases of the investment life cycle need to be addressed to establish a competitive investment ecosystem that is favourable for attracting, facilitating and retaining investment. In this regard, the Government’s Budget 2020 announcement to review the investment incentives policy, as well as the strategies in the upcoming 12th Malaysia Plan and the new Industrial Masterplan are timely and positive efforts towards improving the investment ecosystem in line with Malaysia’s developmental aspirations. This article outlines three key areas of reform to improve the overall investment ecosystem in Malaysia.
1. Establish overall investment policy goals in line with national developmental objectives Investment policy relates to the national strategy, institutions, laws, regulations and practices that directly
enable investment and enhance the returns from investment. In turn, investment policies directly influence the decisions of investors, whether small or large, domestic or foreign. Investment policy begins with establishing a clear vision and strategic direction for the economy at the national level.
On this front, the “National Investment Aspirations” (NIAs), outlines the key criteria for quality investments necessary for Malaysia (Diagram 1). These five NIAs would ensure that prospective investments in Malaysia are focused on increasing economic complexity, creating high-value jobs, extending domestic linkages, developing new and existing clusters, and improving economic inclusivity. Anchoring new investments to these objectives would push growth into technologically-sophisticated sectors and strengthen forward and backward linkages, which would greatly accelerate development. Further, clearly outlining greater innovation as an objective would encourage firms to emphasise innovation and technology at every stage of the development process.
One important aspect in operationalising the NIAs is that investment incentives policy should shift away from predominantly targeting specific sectors, towards encouraging high-value activities (e.g. advanced Research and Development (R&D)). This would ensure incentives remain relevant even as business models evolve, given for example, the proliferation of cutting edge digital investments that transverse sectors.

Economic, Monetary and Financial Developments in 2019
42 Economic and monEtary rEviEw 2019
At a broader level, the overall national economic development policy needs to include the role of the Government in facilitating private sector investment aligned to the NIAs. The role of the Government has to expand beyond the traditional role of providing infrastructure, developing human capital and creating a business-friendly environment. A critical aspect is to have policies that encourage investment in more sophisticated and complex products, as well as facilitating firms, especially domestic firms, to continuously innovate and develop homegrown technology. This would include appropriate incentives targeted at nudging technology and innovation adoption by domestic firms, and an export-oriented strategy to expose firms to global competition. A recent IMF working paper18 advocates for policies to support domestic firms to produce more sophisticated products and create their own technology.
To ensure investment policy remains relevant and effective, it is important to periodically evaluate and review the strategic investment policy. This process needs to be complemented with consultations with the private sector, in order to incorporate their feedback on pragmatic ways to improve the overall investment climate.
Diagram 1: National Investment Aspirations
• Improve development in underserved areas and communities
• Development of sophisticated products and services
• High local R&D and innovation intensity
• High-skilled, high-income employment for locals
• Development of high-productivity sectors
• Development of new products and services locally
• High use of domestic inputs
• Increased breadth and depth of domestic supply chain
Increase economiccomplexity
Create high-value jobs
Develop new andexisting clusters
Improve inclusivity
Extend domestic linkages
Source: World Bank and Bank Negara Malaysia
2. Streamlining investment promotion and elevating investor services to facilitate the realisation of investment Within the overarching objectives, the key enablers in ensuring continued investment attraction and
realisation are investment promotion and investor services. Effective investment promotion and investor services reinforce a coherent investment ecosystem. Due to the large scope of investor services involved, the institutional framework governing them will be inherently complex. The success of this system hinges on a strategic division of mandates to avoid confusion among investors and a well-structured, well-coordinated institutional framework.
Diagram 2 outlines the broad type of services that the Investment Promotion Agencies (IPAs) provide to investors – and that investors typically expect – at different stages of the investor journey. In the initial stage, the services include investor attraction strategies and support for investors in navigating the practical and legal steps the investor must complete to undertake the investment. In the post establishment stage, this comprises an effective mechanism to address issued faced by investors. Taken together, these services will greatly improve the overall investor experience and facilitate firms to grow, expand and diversify further.
In this regard, three possible enhancements to the existing investment ecosystem that the Government could consider are first, a single agency to be tasked to lead FDI promotion to improve the efficacy and efficiency of FDI attraction. This agency will act as the single point of contact for new investors until establishment. Thereafter, investors will be seamlessly handed over via a lead referral system to region-
18 Cherif R. and Hasanov F. (2019). ‘The Return of the Policy That Shall Not Be Named: Principles of Industrial Policy’.

Economic, Monetary and Financial Developments in 2019 Economic, Monetary and Financial Developments in 2019
43Economic and monEtary rEviEw 2019
specific IPAs. Second, the regional and state IPAs could play a bigger role in providing facilitation services and addressing key issues faced by the investor at the post-establishment stage. Importantly, proactive engagements with existing investors and firms by the regional and state IPAs are critical to encourage the retention of investment and developing greater domestic linkages with the local economy. Third, at the national level, there should be a platform that would ensure coherent coordination between the lead FDI promotion agency and other state and regional IPAs, thus ensuring investors are handled diligently at every stage of the journey. This arrangement should facilitate the implementation of investments by reducing bureaucracy at both the Federal and State level.
3. Clear, transparent and predictable tax incentives administration Investment tax incentives are an important tool in encouraging new and existing businesses to invest. While
incentives should be effective and targeted, they should also be efficient and transparent to allow investors to make informed decisions on investing. The recent centralisation of incentives approvals under the National Committee on Investments (NCI) is a positive step towards streamlining and strengthening the incentives administration framework.
For standard cost-based incentives, an automatic approval system can be introduced with transparent criteria and self-assessed outcomes reported during the annual tax return. However, in attracting high-quality and strategic investments, customised incentives remain a key attraction for strategic investors. For this, it will be beneficial for Malaysia to define these strategic investors such as those with investments that exhibit unique merits allowing Malaysia to acquire new skills, talent and establish leadership in emerging technology. In complementing the incentives and administration, it is also important to improve the ability to monitor investor compliance and the desired outcomes. It will facilitate a systematic feedback of data for continuous evaluation of the effectiveness and relevance of incentives.
Conclusion: Review of existing investment policies required amid rapidly-evolving environment Attracting the right kind of investments remains the key enabler in transforming the Malaysian economy. In summary, this article presents three key policy reforms, all of which have the potential to improve the quality of investments in the country and achieve its long-term objectives. Firstly, investment policies should be focused on clearly-defined developmental goals, which are encapsulated by the five National Investment Aspirations. Secondly, a cohesive and well-coordinated institutional framework to attract investment, which enhances the provision of investor services and ensures smooth facilitation of quality investments is essential. Finally, enhancing the administration of investment tax incentives would ensure better transparency to investors, expedite incentive approvals and allow for better monitoring of investment outcomes. These reforms would strategically position Malaysia towards becoming a high-income, inclusive and future-ready economy.
Diagram 2: Investment Lifecycle
4-StageInvestmentLifecycle
Retention / Expansion
Linkages / Spillovers
Entry / Establishment
Attraction
Explore
Select location
EstablishOperate
Expand / Diversify
Link
Transition
Plan
Source: World Bank

Economic, Monetary and Financial Developments in 2019
44 Economic and monEtary rEviEw 2019
References
Anon (2011). ‘Investment and Productivity’. Conference Board of Canada. [Online] Available at: https://www.conferenceboard.ca/hcp/hot-topics/investProd.aspx
Bank Negara Malaysia (2017). ‘Imbalances in the Property Market’. Box article in Third Quarter 2017 BNM Quarterly Bulletin. Kuala Lumpur.
Bank Negara Malaysia (2017). ‘Rethinking Investment Incentives’. Box article in Third Quarter 2017 BNM Quarterly Bulletin. Kuala Lumpur.
Bank Negara Malaysia (2018). ‘Complexity and Growth: Malaysia’s Position and Policy Implications’. Box article in Annual Report 2017. Kuala Lumpur.
Bank Negara Malaysia (2018). ‘Are Malaysian Workers Paid Fairly?: An Assessment of Productivity and Equity’. Box article in Annual Report 2018. Kuala Lumpur.
Cherif R. and Hasanov F (2019). ‘The Return of the Policy That Shall Not Be Named: Principles of Industrial Policy’. IMF Working Paper. Washington.
Davies R. and Callan M (2014). ‘The Role of the Private Sector in Supporting Economic Growth and Reducing Poverty in the Indo-Pacific Region’. The Australian National University. Canberra.
Doytch N (2016). ‘The Worldwide Shift of FDI to Services - How does it Impact Asia? New Evidence from Seventeen Asian Economies’. CUNY Brooklyn College and Asian Institute of Management. New York.
Filipe J., Kumar U. and Galope R (2014). ‘Middle Income Transitions: Trap or Myth?’. ADB Economics Working Paper Series. Manila.
Kose, A., Ohnsorge F., Ye L. S. and Islamaj E (2017). ‘Weakness in Investment Growth: Causes, Implications and Policy Responses’. World Bank Policy Research Working Paper. Washington.
Lim, D (1979). ‘On the Measurement of Capital Intensity’. Review of World Economics Journal.
United Nations Conference on Trade and Development (2019). ‘World Investment Report 2019’. United Nations. New York and Geneva.

Outlook and Policy in 2020
45economic and monetary review 2019
Outlook and Policy in 2020

Outlook and Policy in 2020
46 economic and monetary review 2019

47
Outlook and Policy in 2020
1 IMF Managing Director, Kristalina Georgieva’s statement following a G20 Ministerial Call on the COVID-19 Emergency on 23 March 2020.
GROWTH WEAKENED BY THE COVID-19 PANDEMIC Markedly weaker global growth prospectsThe global economy is projected to register a negative growth in 2020. The ongoing COVID-19 pandemic has significantly weakened global growth prospects, with the outlook heavily contingent on how countries across the world successfully contain the pandemic over the remainder of the year. The IMF1 is expecting a recession in 2020 that is at least as bad as during the global financial crisis in 2009, and is projecting a recovery in 2021.
The COVID-19 pandemic has evolved into a global health crisis that is causing a sharp growth slowdown in the affected countries, including most major advanced and emerging market economies. The measures taken to contain the spread of COVID-19, including travel restrictions, enforced business closures and restricted social activities, while critical, are suppressing private sector activity, both in the domestic-oriented and tourism-related sectors, as well as in the manufacturing sector. The pandemic is simultaneously causing demand and supply shocks through weaker final demand and supply-chain disruptions. Prospects for global growth will depend on how fast the pandemic is contained and stopped.
Latest indicators suggest that global growth in the first half of the year will be significantly weak. The Purchasing Managers’ Indices (PMIs) for manufacturing and exports, which were showing incipient signs of recovery towards end-2019, declined sharply in the first three months of 2020 (Chart 2.1 and Chart 2.2). The impact from PR China’s extended production shutdown and quarantine between late January and
March is evident in the marked decline in the PMI for emerging markets. As advanced economies affected by COVID-19 adopt similar containment measures in March, a similar trajectory is also observed.
The spread of COVID-19 to the advanced economies is projected to result in a growth contraction in these economies. In the US, GDP growth is forecasted to contract. Household expenditure would be affected by lower income from subdued labour conditions, while corporate investment would be dampened by moderating profits and poor sentiments. Similarly, growth in the euro area is likely to contract as the increasing number of COVID-19 cases has prompted more restrictive quarantine measures. These developments have exacerbated the already weak outlook from the lacklustre automobile manufacturing sector, particularly as spending on non-essential goods diminishes.
30
35
40
45
50
55
60Index
> 50 indicates expansion
J F M2018 2019 2020J F M A M J J A S O N D J F M A M J J A S O N D
World Developed Markets 1 Emerging Markets1 Including average of Flash Composite PMIs for March 2020
Source: IHS Markit
Chart 2.1: Manufacturing Purchasing Managers' Index (PMI)

Outlook and Policy in 2020
48 economic and monetary review 2019
-25
-20
-15
-10
-5
0
5
10
15
20
25
G31 EA-82
Annual change (%)
Chart 2.2 : Exports Growth (USD terms)
1 G3 refers to the US, euro area and Japan 2 EA-8 refers to PR China, Hong Kong SAR, Indonesia, Malaysia, South Korea, Singapore, Chinese Taipei and Thailand. The value of PR China's most recent export growth is the average of the combined
release for January and February
J
2018 2019 2020J F M A M J J A S O N D J F M A M J J A S O N D
Source: Bloomberg and Bank Negara Malaysia
Growth prospects for the regional economies, including PR China, are forecasted to be weak. Quarantine measures are expected to lead to poor consumption and investment activities, and may result in negative growth in some countries. In line with the projected contraction in the advanced economies, subdued external demand conditions and disruptions in the global supply chain will further weigh on growth in the trade-dependent Asian region.
There is a possibility that the evolution of the COVID-19 pandemic globally would peak by the first half of 2020. The first epidemic in PR China started in January and has since tapered, with zero domestic cases by March. Elsewhere, COVID-19 entered a subsequent phase, with outbreaks observed in more than 100 countries, across Asia, the Middle East, the euro area, North America and most emerging economies.
The economic impact of COVID-19 is, however, expected to be partly mitigated by the significant monetary and fiscal stimulus measures introduced by authorities across the world. Globally, fiscal spending has been promptly increased, with funds primarily channelled towards containing COVID-19, supporting affected households against income and employment losses and providing liquidity
support for firms. Among the key measures that have been introduced are direct cash assistance, job retention programmes, tax relief and public guarantees to facilitate access to financing. These measures are complemented by monetary policy responses to provide further liquidity support for households, businesses and the banking sector, as well as to ensure continued smooth provision of credit to the real economy. The unprecedented nature and scale of policy intervention across economies is expected to cushion the economic disruptions caused by COVID-19 and support a gradual recovery in real economic activity upon the successful containment of the pandemic.
Balance of risks are tilted to the downsideRisks to global growth are tilted to the downside, mainly from uncertainties arising from the COVID-19 pandemic. The economic impact of this outbreak remains uncertain at this juncture and is highly contingent on how prolonged and severe the health crisis will be, as well as the consequent measures that governments undertake to contain the pandemic. This includes the extent of economic policy support to mitigate the economic impact of the outbreak.
Global financial conditions have tightened in recent months, corresponding with a sharp rise in volatility, sell-offs in major equity markets, and a depreciation in many currencies (Chart 2.3). This has been attributable to a confluence of factors, most pertinently from COVID-19 developments and the uncertainties in the global crude oil market. If such conditions intensify further or remain prolonged, the tightening of financial conditions, especially in emerging market economies could cause adverse spillovers that exacerbate the current weakness in the real economy.
The operating environment also remains susceptible to risks that have been present since last year. Key among these is the lingering trade dispute. While trade tensions between US and PR China have eased in recent months, a re-escalation of trade tensions as well as geopolitical conflict in the Middle East remain key downside risks to the global economy.

Outlook and Policy in 2020
49economic and monetary review 2019
Source: Bloomberg
Chart 2.3 : Chicago Board Options Exchange (CBOE) Volatility Index (VIX)
0
10
20
30
40
50
60
70
80
90Index
Mar
-07
Sep-
07
Mar
-08
Sep-
08
Mar
-09
Sep-
09
Mar
-10
Sep-
10
Mar
-11
Sep-
11
Mar
-12
Sep-
12
Mar
-13
Sep-
13
Mar
-14
Sep-
14
Mar
-15
Sep-
15
Mar
-16
Sep-
16
Mar
-17
Sep-
17
Mar
-18
Sep-
18
Mar
-19
Sep-
19
Mar
-20
Malaysia’s GDP projected to be between -2.0% and 0.5% in 2020Global economic and financial conditions, which deteriorated sharply in the first quarter as the COVID-19 pandemic escalated, are expected to deteriorate further, with significant impact on the Malaysian economy. The domestic economy is also facing the economic effects from the necessary actions taken to contain COVID-19 locally and continued supply disruptions in the commodities sector. These shocks, particularly the significant economic repercussions induced by the unprecedented COVID-19 health crisis, are expected to weigh significantly on growth prospects for the year. The containment measures undertaken by authorities globally and domestically, which are critical and necessary, are projected to weigh on growth in the first half of the year. When the health crisis is eventually addressed, growth will be supported by the gradual improvement in household spending, further progress in the implementation of transport-related projects and higher public sector expenditure. The monetary policy responses and economic stimulus measures undertaken in the first half of the year will provide additional support to growth. The economy is subsequently expected to normalise in 2021, in line with the projected recovery in the global economy.
2 Compared to the same period last year. This includes both international and domestic passengers. Source: Malaysian Airport Holdings Berhad (MAHB).
f Forecast
Source: Department of Statistics, Malaysia, Bank Negara Malaysia estimates
Chart 2.4: Malaysia's GDP Growth
4.4
5.7
4.74.3
-2.0
0.5
-2.0
-1.0
0.0
1.0
2.0
3.0
4.0
5.0
6.0
7.0
2016 2017 2018 2019 2020f
The COVID-19 pandemic and the measures taken to contain it are causing simultaneous supply and demand shocks to the domestic economy. The pandemic is adversely impacting tourism-related and manufacturing sectors. Broad-based restrictions and aversion to travel activities will have a sizeable impact on Malaysia’s tourism sector, which accounts for 11.8% of Malaysia’s GDP. Airport passenger traffic declined by 8.2%2 in the first two months of 2020, just

Outlook and Policy in 2020
50 economic and monetary review 2019
5 Japan and PR China are major importers of Malaysia’s LNG, accounting for 39.2% and 24% of LNG exports in 2019, respectively.
6 Accounting for 38.6% of agriculture production in 2019.
3 Intermediate inputs from PR China amounted to 21.9% of Malaysia’s total imported intermediate goods. Further disruptions in advanced economies such as the US and EU will affect an additional 22.1% of Malaysia’s imported intermediate inputs.
4 Daily new cases globally increased from 1,981 on 1 March 2020 to 43,733 on 24 March 2020. Source: www.worldometers.info/coronavirus/coronavirus-cases/#daily-cases.
as COVID-19 started to escalate and some economies began to take precautionary measures, such as travel bans and quarantines. These measures have since become more widespread and a sharp decline in tourist arrivals is expected. This will significantly impact spending in the tourism-related sectors, particularly hotels, retail trade, food and beverage and transport services.
In the manufacturing sector, prolonged factory closures in key industrial hubs in the COVID-19 affected countries is disrupting production activity across the global supply chain. As countries implement containment measures, firms are only able to operate at limited capacity amid labour and logistics constraints, resulting in domestic firms facing difficulty in procuring inputs3 from source countries. The production disruptions abroad would also lower demand for Malaysian manufactured products, which are often used as input in the affected economies’ exports to the rest of the world. Overall, this would compound the effects of weaker final demand from affected countries, thus weighing further on Malaysia’s manufacturing activity and exports performance.
The rise in COVID-19 cases domestically since early March 2020 has necessitated implementation of measures to contain the spread. Accordingly, a two-week Movement Control Order (MCO) was implemented on 18 March 2020 and subsequently extended by another fortnight. Despite the continued provision of and access to essential services during this period, economic activity would nevertheless be impacted as non-essential services cease to operate and selected manufacturing firms operate only at partial capacity. Post-MCO, the reduced social and recreational activities are expected to continue until the pandemic is fully controlled globally and domestically, thus dampening consumption and investment activity.
The rapid spread of COVID-19 in the first three months of 2020 underscores the challenges of forecasting with precision the economic impact during this period. Globally, new COVID-19 cases have increased 22-fold in less than a month4. Its rapid transmission
has prompted governments globally to implement unprecedented actions to stem the spread in their respective economies. Given Malaysia’s high integration with the global economy, forecasting efforts are further complicated by the diversity in the nature, scope and intensity of the policy actions, as well as the severity of the outbreak in other economies.
Apart from the health crisis, the Malaysian economy is expected to be affected by the sharp decline and volatile shifts in crude oil prices. While this is partially a consequence of significantly softer global demand, crude oil prices are also weighed by the OPEC+ decision of not pursuing additional voluntary output adjustments. Prolonged low global oil prices will impact the income, employment and investment prospects in the mining-related sectors directly. Nonetheless, lower oil prices may alleviate cost pressures on consumers and businesses. Prices of other major commodities are projected to be lower. The price of Liquefied Natural Gas (LNG) is forecasted to moderate, weighed mainly by slower demand from Japan and PR China following further progress in the restart of nuclear plants5 and production disruptions due to COVID-19, respectively. The price of crude palm oil (CPO) is projected to be relatively sustained, as weaker external demand is offset by the decline in CPO production.
The continued supply disruption in the commodities sector will continue to weigh on domestic growth. The low oil palm production6 since end-2019 is expected to extend to the early months of 2020, due mainly to the lagged impact of severe dry weather conditions experienced in 2019 as well as output constraints arising from the MCO. These disruptions are, however, anticipated to dissipate gradually as weather conditions normalise and oil palm production benefit from higher fertiliser application in early-2020. Meanwhile, crude oil and natural gas production will be affected by continued maintenance works and to a certain extent, reduced operating capacity due to the MCO. The operationalisation of new fields in Sarawak and the commencement of the PETRONAS Floating LNG Dua (PFLNG2) facility in Sabah will partially offset the decline in output of the mining sector.

Outlook and Policy in 2020
51economic and monetary review 2019
7 Additional measures were announced by the Prime Minister on 16 March 2020 and 23 March 2020.
8 For more details, please refer to the BNM press release dated 27 February 2020 on ‘Measures to Assist Businesses and Households Affected by the COVID-19 Outbreak’.
9 Refers to Bantuan Prihatin Nasional and Bantuan Sara Hidup.
In response, large countercyclical policy measures have been introduced by the Government and Bank Negara Malaysia to mitigate the economic impact of the COVID-19 pandemic. On 27 February 2020, the Government announced the first economic stimulus package, amounting to RM20 billion with funds to ease cashflow constraints for businesses, provide financial assistance and training for affected individuals and spur investment. The stimulus package was complemented by two consecutive reductions in the Overnight Policy Rate by a total of 50 basis points and measures to provide additional liquidity in the banking system. These were also supplemented by additional measures to increase household disposable income, which include flexibility for monthly cash withdrawal from the Employees’ Provident Fund (EPF) for a year and the deferment in repayment of education loans7. The additional measures form part of the second economic stimulus package that was announced on 27 March 2020. This stimulus package, totalling RM230 billion, includes a moratorium on loan payments and loan guarantees. Overall, the second stimulus package aims to provide further relief mainly by increasing broad-based financial assistance for households, supporting employment retention and accelerating public sector spending on infrastructure upgrades. These measures are complemented with measures to temporarily defer loan repayments and facilitate the restructuring of loan and credit facilities, particularly for individuals and small and medium enterprises (SMEs)8. Cumulatively, these policy measures will provide a buffer and avert a sharper contraction in economic activities for the year.
These policy measures will mitigate the severe impact of COVID-19 on income and provide crucial support to household spending. Private consumption is expected to be weighed by weak labour market conditions, mobility restrictions and subdued sentiments in the first half of the year. During this challenging period, cash assistance to vulnerable households amounting to more than RM10 billion9 and the flexibility to withdraw from EPF savings will increase household disposable income by an additional RM40 billion. On a broader scale, other measures were also introduced to
reduce cost of living, sustain employment and improve cash flow for households. These measures include subsidies for utilities and wage subsidies, in addition to the deferment of loan repayments. Importantly, the broad-based policy support would cushion the impact of COVID-19 on household spending and enable a gradual recovery as labour market conditions eventually stabilise following the projected gradual improvement in global and domestic economic activities.
An increase in public sector expenditure will further support growth. The continuation of large-scale transport-related projects, such as MRT2, LRT3 and Pan Borneo highway and the implementation of upstream oil and gas, telecommunication and power generation projects by public corporations underpin the improvement in investment by the public sector. Higher spending by the Federal Government on the economic stimulus packages will lend further impetus to growth. These include the implementation of more small-scale projects worth RM4 billion, higher special allowances for medical personnel, the hiring of temporary contract nurses and increased allocation for the Ministry of Health.
On the external front, net exports of goods and services is expected to contract due mainly to a larger decline in exports. Gross merchandise exports are projected to register a larger negative growth, reflecting primarily weaker global demand conditions following the spread of COVID-19 across many major economies. Commodities exports are expected to contract further due mainly to lower prices of crude oil and LNG, as well as weaker commodities production.
Gross imports performance is projected to register a larger contraction, mainly reflecting weaker external and domestic demand. Intermediate imports are projected to decline, mainly in line with the weakness in manufactured exports. Capital imports will register a smaller contraction as slower domestic investment activity will be partially offset by the delivery of the PFLNG2 in the first half of the year. Consumption imports are also likely to decline amid slower domestic demand conditions. Consequently, the current account surplus is projected to narrow to 1.0 - 2.0% of GDP in 2020 (2019: 3.3% of GDP).

Outlook and Policy in 2020
52 economic and monetary review 2019
Nonetheless, the Malaysian economy is expected to benefit from the projected improvement in global demand towards the end of the year, which will aid to lift growth in the export-oriented sectors. As risks from the pandemic subside, consumer sentiments can also be expected to gradually improve when travel retrictions are eased and tourism activities resume. In addition, production in the mining and agriculture sectors are projected to improve in the second half of the year amid the expected recovery from the supply disruptions. Malaysia’s domestic growth prospects is therefore projected to improve towards the end of the year and subsequently in 2021.
Given the constantly evolving risks in the external and domestic environment, however, overall risks to the growth projection is tilted downside. The baseline growth forecast could be lifted by a stronger-than-expected impact from the various stimulus measures and the additional measures implemented by several state governments. Meanwhile, the main downside risk is a prolonged and wider spread of COVID-19 ands its effects on the global and domestic economy. The baseline growth projection is therefore, highly contingent on the effectiveness of efforts to contain COVID-19. Growth also remains susceptible to a recurrence of commodity supply shocks, which may adversely affect the production of oil palm, natural gas and crude oil. Low commodity prices pose additional risks to production in the commodities sector, exports and income growth. Meanwhile, periods of heightened financial market volatility due to ongoing external uncertainties may lead to tighter domestic financial conditions.
Subdued inflationary pressure in 2020Headline inflation is forecasted to average within the range of -1.5 to 0.5% (2019: 0.7%) (Chart 2.5). The downward pressure on inflation predominantly reflects the expectation of significantly lower global oil and commodity prices. The trajectory of headline inflation is contingent upon the developments surrounding global commodity prices, particularly global oil prices, which remain highly uncertain.
Without the direct downward impact from lower global oil prices, underlying inflation, as measured by core inflation, is projected to remain positive, averaging between 0.8 – 1.3% (Chart 2.6). This is amid subdued demand pressures and reflects the negative output gap that is expected this year. In addition, labour market conditions are expected to be weaker in 2020.
Chart 2.5: Malaysia's Headline Inflation,Annual Change (%)
f Forecast
Source: Department of Statistics, Malaysia and Bank Negara Malaysiaestimates
-1.5
2016 2017 2018 2019 2020f
0.5
2.1
3.7
1.00.7
Chart 2.6: Malaysia's Core Inflation, Annual Change (%)
Note: Core inflation is computed by excluding price-volatile andprice-administered items. It also excludes the estimated directimpact of tax policy changes.
Source: Department of Statistics, Malaysia and Bank Negara Malaysiaestimates
f Forecast
1.3
0.8
2.1
2.3
1.61.5
2016 2017 2018 2019 2020f

Outlook and Policy in 2020
53economic and monetary review 2019
Monetary policy to be premised upon balance of risks to growth and inflation outlookMonetary policy in 2020 will focus on providing support to domestic economic growth in the environment of subdued price pressures. Following the notable increase in risks to the growth outlook since end-2019, especially arising from the COVID-19 pandemic, the OPR was reduced in January and March 2020 by a total of 50 basis points to 2.50%. Both adjustments were intended to provide a more accommodative monetary environment to support economic growth amid low inflation.
Future monetary policy considerations will continue to be guided by the balance of risks surrounding the outlook for domestic growth and inflation, which are continuously evolving. Meanwhile, the Bank’s monetary operations will continue to ensure that domestic liquidity in the financial system remains sufficient to support the orderly functioning of the domestic financial markets. As it stands, the lowering of the Statutory Reserve Requirement (SRR) ratio by 100 basis points to 2.00% in March 2020 and additional SRR flexibilities granted to Principal Dealers by recognising MGS and MGII for SRR compliance have released approximately RM30 billion worth of liquidity into the banking system.
Additional measures complement the accommodative monetary policy in ensuring continued intermediation In the wake of the COVID-19 pandemic, Bank Negara Malaysia has implemented additional measures to ensure continued financial intermediation in support of the economy and to mitigate the economic impact of COVID-19 on households and businesses. These include providing additional funds for SMEs, amounting to a total allocation of RM13.1 billion under BNM’s Fund for SMEs, together with some adjustments to the funds’ features to further enhance access. In addition, an automatic 6-month moratorium on loan repayments is being implemented for individuals and SMEs to ease the financial burden of borrowers in this difficult period. Banking institutions have also been encouraged to facilitate requests by corporations to defer or restructure their loans or financing repayments in a way that will enable viable corporations to preserve jobs and swiftly resume economic activities when conditions improve10. Malaysian banks have the financial capacity to assist borrowers and ensure continued availability of financing to the economy, drawing on strong capital, liquidity and provisioning buffers built up over the years. At the start of the year, banks had projected sustained loan growth, reflecting their capacity and willingness to sustain credit flows to eligible borrowers. While projected loan growth is likely to be impacted by unfolding developments surrounding COVID-19, the accommodative monetary policy will reinforce support to financing activity. The OPR reductions in January and March 2020 have lowered borrowing costs for the private sector11, while the pre-emptive boost in liquidity through the SRR ratio reduction should also provide support to banks.
10 For details, please refer to the BNM press release dated 27 February 2020 on ‘Measures to Assist Businesses and Households Affected by the COVID-19 Outbreak’, and another dated 25 March 2020 on ‘Measures to Assist Individuals, SMEs and Corporates Affected by COVID-19’.
11 Following the January and March 2020 OPR reductions, all banks have further reduced their respective base rates by a cumulative 50 basis points.

Outlook and Policy in 2020
54 economic and monetary review 2019
Potential output and the output gap of the Malaysian economyPotential output is the highest non-inflationary level of output that can be produced in an economy. It indicates the sustainable growth path of an economy based on prevailing factors of production and level of technology. However, due to business cycle fluctuations, actual output can differ from potential output. A negative output gap arises when actual output falls below potential output1. This normally indicates the presence of slack in the economy arising from weak demand and disinflationary pressures. Thus, the level of potential output and the output gap is a key economic measure which aids the Bank in carrying out its mandate of maintaining price stability for sustainable economic growth2.
In 2019, potential output growth moderated to 4.5% (2018: 4.7%, 2011-2018 average: 5.0%). This was mainly attributable to the contraction in investment activity (-2.1%; 2018: 1.4%) as a result of softer business sentiments and the continued rationalisation efforts by the Government. This was partially offset by the marginal improvement in labour force growth in 2019 (2.1%; 2018: 2.0%).
The actual GDP growth of 4.3% in 2019 was below potential output growth. This was due mainly to weaker external demand and supply disruptions in the commodities sectors that led to an underutilisation of resources. This led to the narrowing of the positive output gap to 0.4% during the year (2018: 0.6%). As such, price pressures were benign as the inflation rate remained stable at 0.7% (Core inflation: 1.5%) during the year.
Going forward, the output gap is projected to turn negative in 2020. While potential output is expected to grow between 4.3 – 4.8%, actual output will be significantly affected by the adverse impact from the COVID-19 pandemic. Hence, actual output is projected to continue to grow at a slower pace relative to potential output in 2020.
1 The output gap is formally defined as (Actual output level - Potential output level) / Potential output level x 100%.2 Central Bank of Malaysia Act 2009.

Annex
Economic and monEtary rEviEw 2019 P i
Annex

Annex
Economic and monEtary rEviEw 2019P ii

Annex
Economic and monEtary rEviEw 2019 P iii
Annex
cONTENTS
Key Economic and Financial StatisticsNational AccountsA.1 Gross Domestic Product by Kind of Economic Activity at Constant 2015 Prices P 1A.2 Growth in Manufacturing Production (2015=100) P 2A.3 Services Sector Performance at Constant 2015 Prices P 2A.4 GNI by Demand Aggregates P 3A.5 Savings-Investment Gap P 3
External SectorA.6 Balance of Payments P 4A.7 Gross Exports P 5A.8 Gross Imports P 6A.9 Malaysia’s Trading Partners P 7A.10 Outstanding External Debt and Debt Servicing P 8
Consumer and Producer Prices IndexA.11 Consumer Price Index P 9A.12 Producer Price Index P 9
Financial IndicatorsA.13 Movements of the Ringgit P 10
Public FinanceA.14 Consolidated Public Sector Finance P 11


Annex
Economic and monEtary rEviEw 2019 P 1
Gross Domestic Product by Kind of Economic Activity at Constant 2015 Prices
2016 2017 2018 2019p
RM million
Agriculture 93,977 99,381 99,470 101,287
Mining and quarrying 105,368 105,838 103,135 101,565
Manufacturing 273,899 290,463 304,847 316,355
Construction 59,508 63,522 66,218 66,252
Services 680,561 722,617 771,861 819,220
Plus: Import duties 16,000 18,076 16,002 15,812 GDP at purchasers’ prices1 1,229,312 1,299,897 1,361,533 1,420,490
Annual change (%)Agriculture -3.7 5.7 0.1 1.8
Mining and quarrying 2.2 0.4 -2.6 -1.5
Manufacturing 4.4 6.0 5.0 3.8
Construction 7.4 6.7 4.2 0.1
Services 5.7 6.2 6.8 6.1
Plus: Import duties 8.8 13.0 -11.5 -1.2GDP at purchasers’ prices 4.4 5.7 4.7 4.3
1 Numbers may not necessarily add up due to roundingp Preliminary
Source: Department of Statistics, Malaysia
Table A.1

Annex
Economic and monEtary rEviEw 2019P 2
Growth in Manufacturing Production (2015=100)
2016 2017 2018 2019 2017 2018 2019Index Annual change (%)
Export-oriented industries 105.0 111.9 116.9 120.2 6.7 4.4 2.9Electronics and electrical products cluster 107.4 115.7 122.4 126.3 7.8 5.8 3.2
Electronics 109.4 120.5 128.5 131.9 10.2 6.6 2.6Electrical products 105.0 110.2 115.4 120.0 4.9 4.7 4.0
Primary-related cluster 103.5 109.7 113.5 116.6 5.9 3.5 2.7Chemicals and chemical products 105.3 109.5 114.4 116.8 4.0 4.4 2.1Petroleum products 103.1 106.7 110.2 113.2 3.5 3.4 2.7Textiles, wearing apparel and footwear 106.8 115.3 120.2 126.6 8.0 4.3 5.3Wood and wood products 105.6 110.7 115.7 121.6 4.8 4.6 5.1Rubber products 104.1 110.5 115.8 123.9 6.1 4.8 7.0Off-estate processing 96.9 114.1 114.1 112.4 17.7 0.0 -1.5Paper products 104.9 110.3 114.7 119.6 5.1 4.1 4.2
Domestic-oriented industries 102.9 108.0 114.1 119.9 4.9 5.6 5.1Construction-related cluster 104.2 109.3 114.7 119.5 5.0 4.9 4.2
Non-metallic mineral products 104.4 109.1 115.1 120.3 4.5 5.5 4.5Basic iron & steel and non-ferrous metal 102.1 107.6 112.1 116.6 5.4 4.2 4.0Fabricated metal products 105.2 110.5 116.0 120.7 5.0 4.9 4.0
Consumer-related cluster 102.0 107.0 113.6 120.2 4.9 6.1 5.8Food products 105.8 111.7 119.1 127.4 5.7 6.6 7.0Transport equipment 96.3 101.0 107.7 114.8 4.8 6.7 6.5Beverages 109.7 119.8 123.7 127.5 9.2 3.3 3.1Tobacco products 103.2 105.4 107.3 113.6 2.1 1.8 5.8Others 104.8 107.7 114.4 117.6 2.7 6.3 2.7
Total 104.3 110.7 116.0 120.1 6.1 4.8 3.6Source: Department of Statistics, Malaysia, Bank Negara Malaysia
Table A.2
Services Sector Performance at Constant 2015 Prices
2016 2017 2018 2019p 2016 2017 2018 2019pAnnual change (%) Share to GDP (%)
Services 5.7 6.2 6.8 6.1 55.4 55.6 56.7 57.7Intermediate services 5.6 6.6 7.0 6.3 20.1 20.3 20.7 21.1
Finance and insurance 2.7 4.6 5.7 4.7 6.6 6.5 6.6 6.6Real estate and business services 6.9 7.4 7.6 7.8 4.5 4.5 4.7 4.8Transport and storage 5.7 6.2 6.4 6.8 3.6 3.6 3.7 3.8Information and communication 8.0 8.4 8.3 6.6 5.5 5.6 5.8 5.9
Final services 5.8 6.0 6.7 6.0 35.2 35.3 36.0 36.6Wholesale and retail trade 6.3 7.1 8.1 6.7 15.9 16.1 16.7 17.0Food & beverages and accommodation 7.2 7.5 8.9 9.6 3.2 3.2 3.3 3.5Utilities 5.4 2.8 4.9 6.0 2.7 2.6 2.6 2.7Government services 4.8 4.7 4.5 3.7 8.5 8.4 8.4 8.3Other services 4.9 5.1 5.5 5.5 4.9 4.9 4.9 5.0
p PreliminaryNote: Numbers may not necessarily add up due to roundingSource: Department of Statistics, Malaysia
Table A.3

Annex
Economic and monEtary rEviEw 2019 P 3
GNI by Demand Aggregates
2015 2016 2017 2018 2019p
at Current Prices(RM million)
Consumption 789,121 841,704 926,807 1,003,787 1,080,004Private consumption 635,099 684,681 759,746 830,829 903,295 Public consumption 154,021 157,023 167,061 172,958 176,709
Investment 304,423 318,895 343,931 350,297 346,807 Private investment 198,150 211,525 234,514 245,712 251,984 Public investment 106,274 107,370 109,417 104,585 94,823
Change in stocks1 -5,195 5,970 6,656 -8,626 -30,724 Exports of goods and services 817,370 834,491 960,778 994,860 987,146 Imports of goods and services 728,778 751,363 866,524 893,403 872,469 GDP at purchasers’ value 1,176,941 1,249,698 1,371,648 1,446,914 1,510,765 Balance of primary income -32,112 -34,592 -38,658 -51,586 -43,509 GNI 1,144,829 1,215,105 1,332,990 1,395,328 1,467,256
at Constant 2015 Prices (RM million)
Consumption 789,121 827,900 882,577 945,069 1,007,734 Private consumption 635,099 672,260 718,320 775,431 834,622 Public consumption 154,021 155,640 164,257 169,638 173,112
Investment 304,423 312,190 331,082 335,554 328,367 Private investment 198,150 206,977 225,594 235,291 238,904 Public investment 106,274 105,213 105,488 100,264 89,463
Change in stocks1 -5,195 297 745 -14,344 -19,356 Exports of goods and services 817,370 828,155 900,064 920,105 909,651 Imports of goods and services 728,778 739,230 814,571 824,852 805,905 GDP at purchasers’ value 1,176,941 1,229,312 1,299,897 1,361,533 1,420,490 Balance of primary income -21,075 -18,011 -19,050 -34,417 -25,595 GNI 1,155,866 1,211,301 1,280,848 1,327,116 1,394,895
1 Includes statistical discrepancyp PreliminarySource: Department of Statistics, Malaysia and Bank Negara Malaysia
Table A.4
1ANNUAL REPORT 2019
Table A.5
Savings-Investment Gap
2015 2016 2017 2018 2019p
RM millionGross national savings 334,383 354,773 388,883 372,259 365,823 (as % of GNI) 29.2 29.2 29.2 26.7 24.9Gross domestic capital formation 299,229 324,865 350,587 341,671 316,083 (as % of GNI) 26.1 26.7 26.3 24.5 21.5Balance on current account 35,155 29,907 38,296 30,588 49,740 (as % of GNI) 3.1 2.5 2.9 2.2 3.4p Preliminary
Source: Department of Statistics, Malaysia

Annex
Economic and monEtary rEviEw 2019P 4
Balance of Payments1
Item (Net)2015 2016 2017 2018 2019p
RM millionGoods2 109,224 102,046 117,113 119,182 125,533Services -20,632 -18,917 -22,859 -17,726 -10,856
Transportation -24,565 -23,459 -29,622 -27,571 -25,810Travel 26,941 31,515 32,470 30,048 30,930Other services -22,405 -26,309 -24,308 -19,445 -15,221Government goods and services n.i.e. -603 -665 -1,398 -758 -755
Balance on goods and services 88,592 83,128 94,255 101,456 114,678Primary income -32,112 -34,592 -38,658 -51,586 -43,509
Compensation of employees -5,595 -5,606 -4,848 -7,654 -9,091Investment income -26,517 -28,986 -33,811 -43,933 -34,418
Secondary income -21,325 -18,629 -17,300 -19,282 -21,428Balance on current account 35,155 29,907 38,296 30,588 49,740
% of GDP 3.0 2.4 2.8 2.1 3.3Capital account -1,136 102 -26 -91 312
Financial account -55,350 -249 -4,730 18,609 -34,326Direct investment -1,810 13,792 16,171 11,341 9,430
Assets -39,698 -42,246 -24,234 -23,290 -27,618Liabilities 37,888 56,038 40,405 34,632 37,049
Portfolio investment -26,122 -14,203 -15,358 -44,402 -37,655 Assets -9,098 -15,009 -19,442 -9,112 -48,663 Liabilities -17,024 806 4,084 -35,290 11,008Financial derivatives -663 -802 -197 971 -390Other investment -26,755 964 -5,346 50,699 -5,711
Assets 593 -6,260 -18,081 6,577 -14,898Liabilities -27,348 7,225 12,735 44,121 9,187
Balance on capital and fi nancial accounts -56,486 -148 -4,756 18,518 -34,014Net errors and omissions3 -32,222 -23,899 -17,132 -41,348 -7,309Overall balance -53,553 5,860 16,409 7,758 8,416Bank Negara Malaysia international reserves, net 4
USD million 95,283 94,488 102,431 101,429 103,599RM million 409,096 423,874 414,591 419,511 424,032Foreign exchange revaluation gain (+) / loss (-) 57,303 8,918 -25,691 -2,838 -3,895Reserves as months of retained imports 8.4 8.7 7.2 7.4 7.5
1 In accordance with the Balance of Payments and International Investment Position Manual, Sixth Edition (BPM6) by the International Monetary Fund (IMF)
2 Adjusted for valuation and coverage of goods for processing, storage and distribution
3 As at 1Q 2018, the net E&O excludes reserves revaluation changes. This practice is backdated to 1Q 2010
4 All assets and liabilities in foreign currencies have been revalued into ringgit at rates of exchange ruling on the balance sheet date and the gain/ loss has been refl ected accordingly in Bank Negara Malaysia’s audited accountsp Preliminary n.i.e. Not included elsewhere Note: Numbers may not add up due to rounding Assets: (-) denotes outfl ows due to the acquisition of assets abroad by residents Liabilities: (+) denotes infl ows due to the incurrence of foreign liabilities
Source: Department of Statistics, Malaysia and Bank Negara Malaysia
Table A.6

Annex
Economic and monEtary rEviEw 2019 P 5
Gross Exports
2017 2018 2019p 2017 2018 2019p 2018 2019p
RM million Annual change (%)
% share
Manufactures 765,858 837,071 834,153 18.6 9.3 -0.3 83.4 84.6of which:
Electrical and electronic products 343,070 381,545 372,671 19.2 11.2 -2.3 38.0 37.8Semiconductors 178,142 220,355 221,687 23.1 23.7 0.6 22.0 22.5Offi ce machines and automatic data
processing equipment 62,702 62,387 49,343 17.1 -0.5 -20.9 6.2 5.0Electrical machinery, apparatus and
appliances, and parts 58,279 57,977 59,412 18.4 -0.5 2.5 5.8 6.0Telecommunications and sound-recording
and reproducing equipment 43,947 40,825 42,229 8.8 -7.1 3.4 4.1 4.3Petroleum products 71,813 76,161 71,494 31.4 6.1 -6.1 7.6 7.2Chemicals and chemical products 47,138 57,715 57,006 13.9 22.4 -1.2 5.8 5.8Manufactures of metal 37,937 44,664 41,493 13.7 17.7 -7.1 4.5 4.2Machinery, equipment and parts 40,133 40,668 41,386 7.0 1.3 1.8 4.1 4.2Optical and scientifi c equipment 32,395 36,563 38,561 12.7 12.9 5.5 3.6 3.9Rubber products 26,308 26,491 25,634 29.9 0.7 -3.2 2.6 2.6Palm oil-based manufactured products 23,785 22,783 21,736 21.6 -4.2 -4.6 2.3 2.2Processed food 19,713 19,414 21,770 4.0 -1.5 12.1 1.9 2.2Transport equipment 15,605 18,033 19,135 15.8 15.6 6.1 1.8 1.9
Agriculture 78,072 67,001 64,862 10.9 -14.2 -3.2 6.7 6.6of which:
Palm oil and palm oil-basedagricultural products 54,023 44,733 43,103 11.7 -17.2 -3.6 4.5 4.4
Sawn timber and moulding 4,738 4,526 4,246 12.5 -4.5 -6.2 0.5 0.4Natural rubber 4,726 3,774 3,773 30.8 -20.1 0.0 0.4 0.4
Minerals 81,836 89,907 80,371 25.8 9.9 -10.6 9.0 8.1of which:
Liquefi ed natural gas (LNG) 41,417 42,322 41,537 26.6 2.2 -1.9 4.2 4.2Crude petroleum 28,255 36,649 26,346 26.6 29.7 -28.1 3.7 2.7
Others 9,161 9,608 6,991 60.2 4.9 -27.2 1.0 0.7
Total 934,927 1,003,587 986,377 18.8 7.3 -1.7 100.0 100.0
p Preliminary Source: Department of Statistics, Malaysia
Table A.7

Annex
Economic and monEtary rEviEw 2019P 6
Gross Imports
2017 2018 2019p 2018 2019p 2019p
RM million Annual change (%)
% share
Capital goods 115,567 112,453 100,306 -2.7 -10.8 11.8Capital goods (except transport equipment) 102,507 96,475 91,885 -5.9 -4.8 10.8Transport equipment industrial 13,060 15,978 8,421 22.3 -47.3 1.0
Intermediate goods 478,931 462,212 467,247 -3.5 1.1 55.0Food and beverages, mainly for industry 19,141 17,777 18,049 -7.1 1.5 2.1Industrial supplies 199,909 215,123 220,922 7.6 2.7 26.0Fuel and lubricants 47,921 56,132 57,093 17.1 1.7 6.7Parts and accessories of capital goods (except transport equipment) 183,230 143,121 138,672 -21.9 -3.1 16.3
Parts and accessories of transport equipment 28,729 30,060 32,511 4.6 8.2 3.8
Consumption goods 71,036 73,053 74,013 2.8 1.3 8.7Food and beverages, mainly for household consumption 28,873 29,366 30,767 1.7 4.8 3.6Transport equipment non-industrial 942 803 1,017 -14.8 26.7 0.1Consumer goods, n.e.s 41,221 42,884 42,229 4.0 -1.5 5.0
Others 170,889 232,086 207,501 35.8 -10.6 24.4of which:
Dual use goods 25,054 30,019 32,508 19.8 8.3 3.8Re-exports 142,800 199,252 171,196 39.5 -14.1 20.2
Total 836,422 879,804 849,067 5.2 -3.5 100.0
p Preliminaryn.e.s. Not elsewhere specifi edNote: Numbers may not necessarily add up due to rounding Source: Department of Statistics, Malaysia
Table A.8

Annex
Economic and monEtary rEviEw 2019 P 7
Chart A.9
Malaysia’s Trading Partners
Malaysia's Import Markets 2019
G323.2%
East Asia-855.1 %
Rest of the world21.7%
Malaysia's Import Markets
Malaysia's Total Trade by Market 2019
G323.7%
East Asia-853.8 %
Rest of the world22.5%
Malaysia's Total Trade by Markets
Malaysia's Export Markets 2019
G324.1%
East Asia-852.6 %
Rest of the world23.3%
Shar
e of
tota
l exp
orts
, %
G3 Total = 24.1%
Malaysia's Export Markets
Shar
e of
tota
l im
port
s, %
G3Total = 23.2%
Shar
e of
tota
l tra
de, %
G3Total = 23.7%
10
20
0
30
Japan
United States
Euro area
9.0
7.7
7.0
2019
Source: Department of Statistics, Malaysia
14.2
13.9
6.7
5.73.73.43.11.8
0
10
20
30
40
50
60
Shar
e of
tota
l exp
orts
, %
East Asia-8Total = 52.6%
PR China
Singapore
Thailand
Hong Kong SAR
Korea
Philippines
Chinese Taipei
Indonesia
2019
20.7
10.5
6.7
5.24.64.61.71.1
0
10
20
30
40
50
60
Shar
e of
tota
l im
port
s, %
East Asia-8Total = 55.1%
PR China
Singapore
Thailand
Hong Kong SAR
Korea
Philippines
Chinese Taipei
Indonesia
2019
17.2
12.3
5.5
5.14.44.03.81.5
0
10
20
30
40
50
60
Shar
e of
tota
l tra
de, %
East Asia-8Total = 53.8%
PR China
Singapore
Thailand
Hong Kong SARKorea
Philippines
Chinese Taipei
Indonesia
2019
9.7
7.8
6.6
2019
Japan
United States
Euro area
10
20
0
30
Japan
United States
Euro area
8.1
7.6
7.5
2019
10
20
0
30

Annex
Economic and monEtary rEviEw 2019P 8
Table A.10
Outstanding External Debt and Debt Servicing
2015 2016 2017 2018 2019pRM million (unless stated otherwise)
Total external debt 836,985 914,464 885,218 924,887 946,292USD million equivalent 192,991 201,900 215,902 220,951 228,546 % of GDP 71.1 73.2 64.5 63.9 62.6Annual change (%) 11.9 9.3 -3.2 4.5 2.3
By instrumentBonds and notes 159,771 165,709 151,364 153,170 156,030 Interbank borrowings 161,345 170,977 172,199 204,102 199,824 Intercompany loans 93,062 139,234 131,341 136,477 128,005 Loans 52,597 55,010 53,680 73,194 78,606 NR holdings of domestic debt securities 211,347 212,767 207,389 180,228 201,015 NR deposits 81,615 86,274 92,025 98,238 102,928 Others1 77,249 84,492 77,221 79,478 79,884
Maturity profi leMedium- and long-term 485,108 536,418 533,402 519,552 554,484 Short-term 351,876 378,046 351,816 405,336 391,808
Currency composition (% share) 100.0 100.0 100.0 100.0 100.0 Ringgit 36.0 34.0 33.9 30.2 32.8US dollar 51.5 53.9 50.6 55.4 51.2Japanese yen 2.6 2.4 2.2 2.2 2.9Others 9.8 9.7 13.3 12.2 13.1
Total servicing (including short-term interest payment) 185,772 206,719 146,763 117,357 126,064 of which:
Medium- and long-term debt 184,272 204,659 144,213 112,289 120,210 Repayment2 172,391 191,142 130,631 96,343 104,425
of which:Redemption of matured domestic debt
securities held by NR 27,695 24,403 27,105 22,012 19,731
Interest payment 11,881 13,517 13,582 15,946 15,785 of which interest payment on:
NR holdings of domestic debt securities 6,575 7,409 6,089 8,170 7,255
Debt service ratio (% of exports of goods and services) Total debt 22.7 24.8 15.3 11.8 12.8
Medium- and long-term debt of which: 22.5 24.5 15.0 11.3 12.2NR holdings of domestic debt securities 4.2 3.8 3.5 3.0 2.7
1 Comprises trade credits, IMF allocation of SDRs and other debt liabilities2 Includes prepaymentp PreliminaryNote: Numbers may not necessarily add up due to rounding NR refers to non-residentsSource: Ministry of Finance, Malaysia and Bank Negara Malaysia

Annex
Economic and monEtary rEviEw 2019 P 9
Table A.11
Consumer Price Index
Weights (%) (2010=100)
2016 2017 2018 2019Annual change (%)
Total 100.0 2.1 3.7 1.0 0.7
Food and non-alcoholic beverages 29.5 3.9 4.0 1.6 1.7 Alcoholic beverages and tobacco 2.4 17.2 0.2 -0.1 1.5 Clothing and footwear 3.2 -0.4 -0.3 -2.0 -2.0 Housing, water, electricity, gas and other fuels 23.8 2.4 2.2 2.0 1.9 Furnishings, household equipment and routine
household maintenance 4.1 2.4 2.1 0.3 1.4 Health 1.9 2.7 2.5 0.8 0.7 Transport 14.6 -4.6 13.2 1.6 -3.1 Communication 4.8 -1.5 -0.4 -1.7 0.4 Recreation services and culture 4.8 2.5 1.9 -0.4 0.7 Education 1.3 2.1 1.7 1.1 1.4 Restaurants and hotels 2.9 2.8 2.5 1.6 1.2 Miscellaneous goods and services 6.7 2.9 1.2 -1.4 0.4
Source: Department of Statistics, Malaysia
Table A.12
Producer Price Index
Weights (%) (2010=100)
2016 2017 2018 2019Annual change (%)
Total 100.0 -1.1 6.7 -1.1 -1.4
Crude materials for further processing 16.4 3.4 14.8 2.6 -3.9 Foodstuffs and feedstuffs 3.2 1.8 6.2 -2.0 0.2 Non-food materials 13.2 4.0 17.9 3.7 -4.7 Intermediate materials, supplies and components 56.1 -3.2 6.7 -1.9 -1.4 Materials & components for manufacturing 29.6 2.2 5.6 -5.2 -3.7 Materials & components for construction 2.9 0.3 2.0 -1.4 0.1 Processed fuel & lubricants 11.9 -16.6 15.3 8.7 2.3 Containers 0.6 1.5 5.5 2.3 1.6 Supplies 11.2 0.5 0.3 -3.8 0.5 Finished goods 27.5 0.4 0.9 -2.4 0.6 Finished consumer goods 11.5 0.9 1.7 -2.2 -1.4 Capital equipment 16.0 0.3 0.5 -2.5 2.0
Source: Department of Statistics, Malaysia

Annex
Economic and monEtary rEviEw 2019P 10
Table A.13
Movements of the Ringgit
RM to one unit of foreign currency1 Annual change (%) Change (%)2005 2018 2019
2018 201921 Jul. '05 -
21 Jul.2 End-Dec. Dec. '19SDR 5.5049 5.7565 5.6509 -0.2 1.9 -2.6US dollar 3.8000 4.1385 4.0925 -1.8 1.1 -7.1Singapore dollar 2.2570 3.0322 3.0387 0.2 -0.2 -25.7100 Japanese yen 3.3745 3.7475 3.7655 -3.9 -0.5 -10.4Pound sterling 6.6270 5.2532 5.3722 4.1 -2.2 23.4Australian dollar 2.8823 2.9228 2.8660 8.3 2.0 0.6Euro 4.6212 4.7340 4.5852 2.5 3.2 0.8100 Thai baht 9.0681 12.701 13.683 -2.1 -7.2 -33.7100 Indonesian rupiah 0.0386 0.0286 0.0295 4.8 -2.9 31.1100 Korean won 0.3665 0.3721 0.3540 2.1 5.1 3.6100 Philippine peso 6.8131 7.8739 8.0720 3.2 -2.5 -15.6100 New Taiwan dollar 11.890 13.541 13.644 1.0 -0.8 -12.9Chinese renminbi 0.4591 0.6017 0.5866 3.5 2.6 -21.71 US dollar rates are the average of buying and selling rates at noon in the Kuala Lumpur Interbank Foreign Exchange Market. Rates for foreign currencies other than US dollar are cross rates derived from rates of these currencies against the US dollar and the RM/US dollar rate.2 Ringgit was unpegged against the US dollar

Annex
Economic and monEtary rEviEw 2019 P 11
Table A.14
Consolidated Public Sector Finance
2016 2017 2018 2019pRM billion
Revenue1 222.4 230.6 230.5 237.2 % growth 3.0 3.7 -0.04 2.9
Operating expenditure 236.4 251.5 265.4 300.9 % growth -2.8 6.4 5.5 13.4
Current balance of NFPCs2 90.7 103.3 110.8 104.6
Total public sector current balance 76.7 82.4 75.9 40.9 % of GDP 6.1 6.0 5.2 2.7
Development expenditure3 139.1 131.8 142.0 139.1 % growth -1.0 -5.2 7.7 -2.0
General Government4 46.8 49.2 63.1 59.2 NFPCs 92.3 82.6 78.9 80.0
Overall balance -62.4 -49.4 -66.0 -98.2 % of GDP -5.0 -3.6 -4.6 -6.51 Excludes transfers within General Government2 Refers to 28 NFPCs from 2017 onwards 3 Adjusted for transfers and net lending within public sector 4 Comprises Federal Government, state and local governments, and statutory bodies p Preliminary Note: Numbers may not add up due to rounding Source: Ministry of Finance, Malaysia and Non-Financial Public Corporations (NFPCs)

For further information about Bank Negara Malaysia and its publications:
write to: Director
Strategic Communications DepartmentBank Negara Malaysia
P.O. Box 1092250929 Kuala Lumpur
Malaysia
Tel: +(603) 2698 8044Fax: +(603) 2693 6919
or visit our World Wide Web site: http://www.bnm.gov.my
In reproducing or quoting contents, acknowledgement of source is requested.
ISSN 2716-6252