economic analysis of the south pole traverse · the contents of this report are not to be used for...
TRANSCRIPT
ERD
C/CR
REL
TR-1
4-7
Engineering for Polar Operations, Logistics, and Research (EPOLAR)
Economic Analysis of the South Pole Traverse
Cold
Reg
ions
Res
earc
h an
d En
gine
erin
g La
bora
tory
James H. Lever and Paul Thur May 2014
Approved for public release; distribution is unlimited.

The U.S. Army Engineer Research and Development Center (ERDC) solves the nation’s toughest engineering and environmental challenges. ERDC develops innovative solutions in civil and military engineering, geospatial sciences, water resources, and environmental sciences for the Army, the Department of Defense, civilian agencies, and our nation’s public good. Find out more at www.erdc.usace.army.mil.
To search for other technical reports published by ERDC, visit the ERDC online library at http://acwc.sdp.sirsi.net/client/default.

Engineering for Polar Operations, Logistics, and Research (EPOLAR)
ERDC/CRREL TR-14-7 May 2014
Economic Analysis of the South Pole Traverse
James H. Lever Cold Regions Research and Engineering Laboratory (CRREL) U.S. Army Engineer Research and Development Center 72 Lyme Road Hanover, NH 03755-1290
Paul Thur Lockheed Martin - Antarctic Support Contract 7400 S. Tucson Way Centennial, CO 80112
Final Report
Approved for public release; distribution is unlimited.
Prepared for National Science Foundation, Division of Polar Programs, Antarctic Infrastructure and Logistics Arlington, VA 22230
Under Engineering for Polar Operations, Logistics, and Research (EPOLAR) EP-ANT-12-05, “SPoT Mobility Field Support”

ERDC/CRREL TR-14-7 iv
Abstract
The U.S. Antarctic Program (USAP) operates the South Pole Traverse (SPoT) to resupply Amundsen-Scott South Pole Station from McMurdo Station. During its first three operational seasons (2008–2011), SPoT’s eight tractors delivered an average annual payload of 768,000 lb, most of which was fuel traveling in high-efficiency bladder sleds. These deliveries offset an average of 30 annual LC130 flights to South Pole.
We present here an economic analysis of the payback achieved by SPoT during its first three seasons. Costs include SPoT annualized capital and annual operating expenses, and benefits are reduced LC130 costs appor-tioned per round-trip to South Pole. SPoT’s net economic benefits of $2.0M/year result from significantly lower delivery costs per pound com-pared with LC130 airlift ($3.60/lb versus $6.10/lb, respectively). Addi-tional benefits of SPoT include reduced air emissions, ability to transport outsized or overweight cargo, and increased availability of LC130s to sup-port other science operations in Antarctica.
The results here are structured to guide future USAP investments. For ex-ample, sled-efficiency improvements dramatically boost benefits: perfor-mance gains from using black rather than tan bladders could increase SPoT’s annual fuel delivery per round trip by 58% and more than double its net economic benefits to $4.6M/year.
DISCLAIMER: The contents of this report are not to be used for advertising, publication, or promotional purposes. Citation of trade names does not constitute an official endorsement or approval of the use of such commercial products. All product names and trademarks cited are the property of their respective owners. The findings of this report are not to be construed as an official Department of the Army position unless so designated by other authorized documents. DESTROY THIS REPORT WHEN NO LONGER NEEDED. DO NOT RETURN IT TO THE ORIGINATOR.

ERDC/CRREL TR-14-7 v
Contents Abstract .......................................................................................................................................................... iv
Illustrations .................................................................................................................................................... vi
Preface ...........................................................................................................................................................vii
Acronyms and Abbreviations ................................................................................................................... viii
Unit Conversion Factors ............................................................................................................................. ix
Executive Summary .......................................................................................................................................x
1 Introduction ............................................................................................................................................ 1
2 South Pole Traverse Fleet Composition and Deliveries................................................................. 4
3 South Pole Traverse Costs ................................................................................................................... 6 3.1 SPoT capital costs ........................................................................................................... 7 3.2 SPoT operating costs .................................................................................................... 10 3.3 SPoT total delivery costs .............................................................................................. 11
4 LC130 Airlift Costs..............................................................................................................................12 4.1 LC130 operating costs ................................................................................................. 13 4.2 LC130 capital costs ...................................................................................................... 14 4.3 Other airlift costs .......................................................................................................... 15 4.4 LC130 total delivery costs ............................................................................................ 15
5 Economic Benefits of the South Pole Traverse ............................................................................. 17 5.1 Average economic benefits .......................................................................................... 17 5.2 Incremental benefits from efficiency gains ................................................................. 17 5.3 Other SPoT economic benefits ..................................................................................... 18
6 Air Emissions Benefits ....................................................................................................................... 19
7 Estimating Benefits for Other Traverse Missions ......................................................................... 21
8 Discussion ............................................................................................................................................ 22
9 Summary and Conclusions ............................................................................................................... 25
References ................................................................................................................................................... 26
Report Documentation Page

ERDC/CRREL TR-14-7 vi
Illustrations
Figures
1 South Pole Traverse proven route, 1030 miles one-way from McMurdo to South Pole ................................................................................................................................................... 2
2 Three SPoT sled trains heading up the Leverett Glacier en route to South Pole during the 2008–09 season ........................................................................................................ 4
3 Examples of SPoT tractors: Case Quadtrac (upper) and AGCO MT865 (lower) ..................... 7 4 Two photos showing SPoT fleet-support sleds ........................................................................... 8 5 Bladder sleds towed during SPoT09–10 .................................................................................... 9 6 LC130 at South Pole about to off-load passengers and cargo .............................................. 12
Tables
1 Summary of SPoT deliveries to South Pole for its first three operational seasons ............... 5 2 Summary of SPoT capital and operating costs .......................................................................... 6 3 Cost summary for LC130 South Pole airlift, 2011 dollars ...................................................... 13 4 Annual air emissions for SPoT08–11 compared with those by LC130 airlift ...................... 20

ERDC/CRREL TR-14-7 vii
Preface
This study was conducted for the National Science Foundation (NSF), Di-vision of Polar Programs (PLR), Antarctic Infrastructure and Logistics un-der Engineering for Polar Operations, Logistics, and Research (EPOLAR) EP-ANT-12-05, “SPoT Mobility Field Support.” The technical monitor was George L. Blaisdell, Chief Program Manager, U.S. Antarctic Program, NSF-PLR.
The work was performed by Dr. James Lever (Force Projection and Sus-tainment Branch, Edel Cortez, Chief), U.S. Army Engineer Research and Development Center, Cold Regions Research and Engineering Laboratory (ERDC-CRREL), and Paul Thur, Traverse Operations Manager, Lockheed Martin–Antarctic Support Contract (LM-ASC). At the time of publication, Dr. Justin Berman was Chief of the Research and Engineering Division. The Deputy Director of ERDC-CRREL was Dr. Lance Hansen, and the Di-rector was Dr. Robert Davis.
The authors thank G. L. Blaisdell and J. C. Weale for their helpful reviews of the manuscript. We also thank the South Pole Traverse field crews for their dedication and hard work to make SPoT an important contribution to the U.S. Antarctic Program.
The Commander of ERDC is COL Jeffrey R. Eckstein, and the Director of ERDC is Dr. Jeffery P. Holland.

ERDC/CRREL TR-14-7 viii
Acronyms and Abbreviations
ACL Allowable Cabin Load
AMC Air Mobility Command
ASC Antarctic Support Contract
AW Airlift Wing
CEE Comprehensive Environmental Evaluation
CRREL U.S. Army Cold Regions Research and Engineering Laboratory
DOD Department of Defense
EPA U.S. Environmental Protection Agency
GrIT Greenland Inland Traverse
HMW-PE High Molecular Weight Polyethylene
MOA Memorandum of Agreement
NDCF National Defence and the Canadian Forces
NSF-PLR The National Science Foundation’s Division of Polar Programs
NYANG New York Air National Guard
p.a. Per Annum
R&D Research and Development
RPSC Raytheon Polar Services Company
SAAM Special Aircraft Airlift Mission
SPoT South Pole Traverse
SPoT2 South Pole Traverse 2
USAP U.S. Antarctic Program
ERDC/CRREL TR-14-7 ix
Unit Conversion Factors
Multiply By To Obtain
feet 0.3048 meters
gallons (U.S. liquid) 3.785412 E-03 cubic meters
inches 0.0254 meters
miles (U.S. statute) 1,609.347 meters
miles per hour 0.44704 meters per second
pounds (mass) 0.45359237 kilograms

ERDC/CRREL TR-14-7 x
Executive Summary
The U.S. Antarctic Program (USAP) now operates over-snow traverses to resupply Amundsen-Scott South Pole Station from McMurdo Station, a one-way distance of 1030 miles. During its first three operational seasons (2008–2011), the South Pole Traverse (SPoT) fleet of eight towing tractors delivered an average annual payload of 768,000 lb, most of which was fuel traveling in high-efficiency bladder sleds. These deliveries offset an aver-age of 30 annual LC130 flights to the South Pole that are otherwise needed to deliver the same payload.
We present here an economic analysis of the payback achieved by SPoT during its first three seasons. Costs include SPoT annualized capital and annual operating expenses, and benefits are reduced LC130 costs appor-tioned per round trip to the South Pole. SPoT’s net economic benefits of $2.0M/year result from significantly lower delivery costs per pound com-pared with LC130 airlift ($3.60/lb versus $6.10/lb, respectively). SPoT’s annual net savings in operating costs pay for its capital investment in about 2.3 years for an approximately 43% return on capital investment. Additional benefits of SPoT include reduced air emissions, the ability to transport outsized or overweight cargo, and increased availability of LC130s to support other science operations in Antarctica.
The results here are structured to guide future USAP investments to im-prove traverse technology and to resupply other remote locations in Ant-arctica. For example, sled-efficiency improvements dramatically boost benefits: performance gains from using black rather than tan bladders could increase SPoT’s annual fuel delivery per roundtrip by 58% and more than double its net economic benefits to $4.6M/year. Because we appor-tion LC130 costs per flying hour, it is also straightforward to estimate trav-erse benefits to resupply other Antarctic locations.

ERDC/CRREL TR-14-7 1
1 Introduction
The National Science Foundation’s Division of Polar Programs (NSF-PLR) operates the U.S. Antarctic Program (USAP) through a logistics contractor, most recently Lockheed Martin Antarctic Support Contract (ASC). USAP’s mission is to conduct science projects in Antarctica, and for this purpose it maintains three year-round stations and numerous seasonal camps across the continent. McMurdo Station, on Ross Island, is USAP’s largest facility, and it serves as the resupply hub for the Amundsen-Scott South Pole Sta-tion on the Polar Plateau. Until 2008, essentially all fuel and cargo trans-ported to South Pole was delivered via airlift using ski-equipped LC130 Hercules aircraft. While effective, this airlift is expensive, susceptible to weather delays, and demands a high tempo of operations to achieve up to 380 flights per 120-day summer season at South Pole.
Beginning in 2003, USAP initiated a four-year effort to develop an over-snow, heavy-haul traverse to resupply South Pole Station from McMurdo Station. Four rubber-tracked tractors and one bulldozer pulled trains con-sisting of steel fuel, cargo, and support sleds directly over unprepared snow. Using ground-penetrating radar, a lighter tracked vehicle surveyed for crevasses in advance of the fleet. This proof-of-concept effort estab-lished a 1030-mile safe route across the Ross Ice Shelf, up the Leverett Glacier, and across the Polar Plateau to South Pole (Wright 2006). Figure 1 shows the proven route.
Engineers at the U.S. Army Cold Regions Research and Engineering La-boratory (CRREL) supported the proof-of-concept effort via numerous safety and mobility studies. Importantly, this USAP-CRREL partnership developed high-efficiency fuel sleds consisting of flexible fuel bladders strapped to flexible sheets of plastic. Compared to the well-performing steel sleds, the bladder sleds are one-sixth the cost, are one-tenth the weight, and triple the fuel delivered per tractor to the South Pole (Lever and Weale 2012).
The South Pole Traverse (SPoT) became an operational department of USAP in 2007, and during the 2008–09 season it conducted the first large-scale, over-snow resupply of South Pole Station. SPoT repeated this success in 2009–10 and 2010–11. During these three seasons, the SPoT

ERDC/CRREL TR-14-7 2
fleet of eight towing tractors delivered an average annual payload of 768,000 lb to South Pole, most of which was fuel towed in bladder sleds. These deliveries offset an average of 30 annual LC130 flights to South Pole. Based in part on this success, USAP expanded its traverse capability to include a second eight-tractor fleet (SPoT2) and two smaller fleets to support science camps in West Antarctica and on the Ross Ice Shelf. NSF-PLR also initiated a traverse in Greenland to resupply from Thule Air Base its science stations on the ice cap (Lever and Weale 2011a, 2011b).
Figure 1. South Pole Traverse proven route, 1030 miles one-way from McMurdo to South Pole.
Blaisdell (2000) and Blaisdell et al. (1997) conducted feasibility analyses, including an economic assessment, to assist NSF-PLR with its decision to initiate the South Pole traverse. We now have sufficient performance and cost data to assess whether SPoT has performed well as in investment in USAP logistics capabilities.

ERDC/CRREL TR-14-7 3
We present here an analysis of the economic payback achieved by SPoT during its first three seasons. Costs include annualized capital and annual operating expenses, and benefits are reduced LC130 airlift costs appor-tioned per flight offset by SPoT. Our objectives are to quantify the net benefit of SPoT as an investment by USAP, to use these results to estimate benefits for traverse resupply operations elsewhere in Antarctica, and to estimate benefits likely to result from additional improvements in traverse technology.
ERDC/CRREL TR-14-7 4
2 South Pole Traverse Fleet Composition and Deliveries
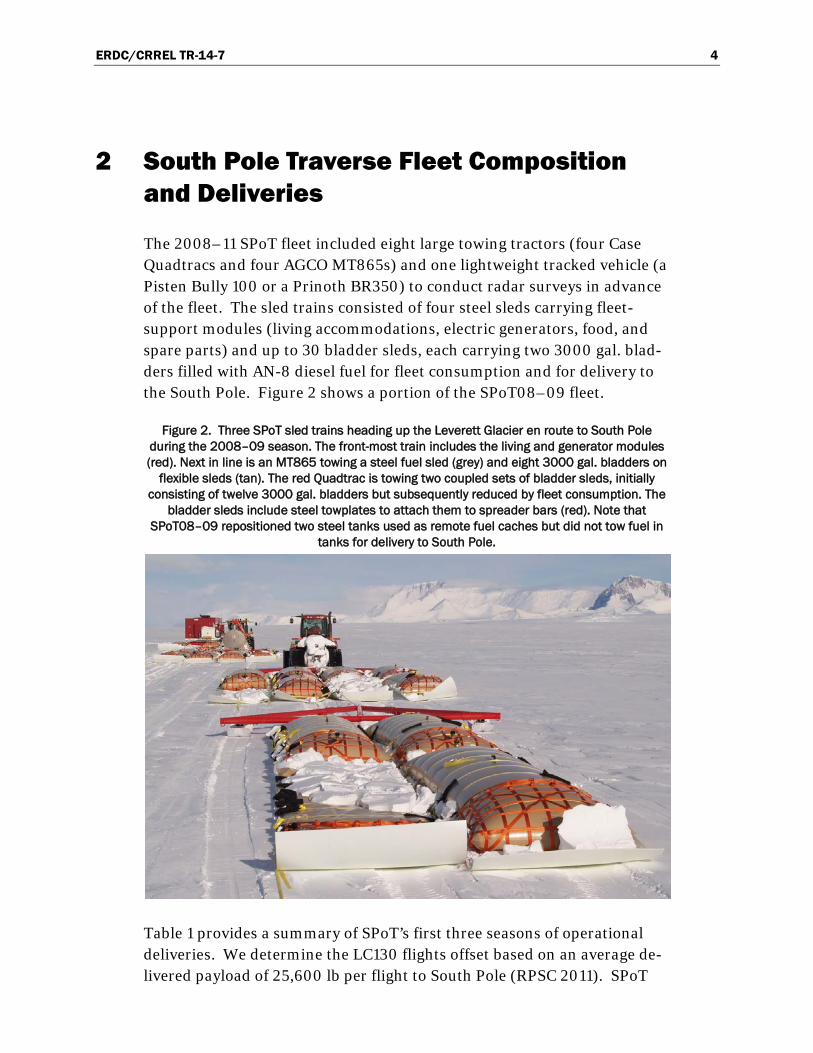
The 2008–11 SPoT fleet included eight large towing tractors (four Case Quadtracs and four AGCO MT865s) and one lightweight tracked vehicle (a Pisten Bully 100 or a Prinoth BR350) to conduct radar surveys in advance of the fleet. The sled trains consisted of four steel sleds carrying fleet-support modules (living accommodations, electric generators, food, and spare parts) and up to 30 bladder sleds, each carrying two 3000 gal. blad-ders filled with AN-8 diesel fuel for fleet consumption and for delivery to the South Pole. Figure 2 shows a portion of the SPoT08–09 fleet.
Figure 2. Three SPoT sled trains heading up the Leverett Glacier en route to South Pole during the 2008–09 season. The front-most train includes the living and generator modules (red). Next in line is an MT865 towing a steel fuel sled (grey) and eight 3000 gal. bladders on
flexible sleds (tan). The red Quadtrac is towing two coupled sets of bladder sleds, initially consisting of twelve 3000 gal. bladders but subsequently reduced by fleet consumption. The
bladder sleds include steel towplates to attach them to spreader bars (red). Note that SPoT08–09 repositioned two steel tanks used as remote fuel caches but did not tow fuel in
tanks for delivery to South Pole.
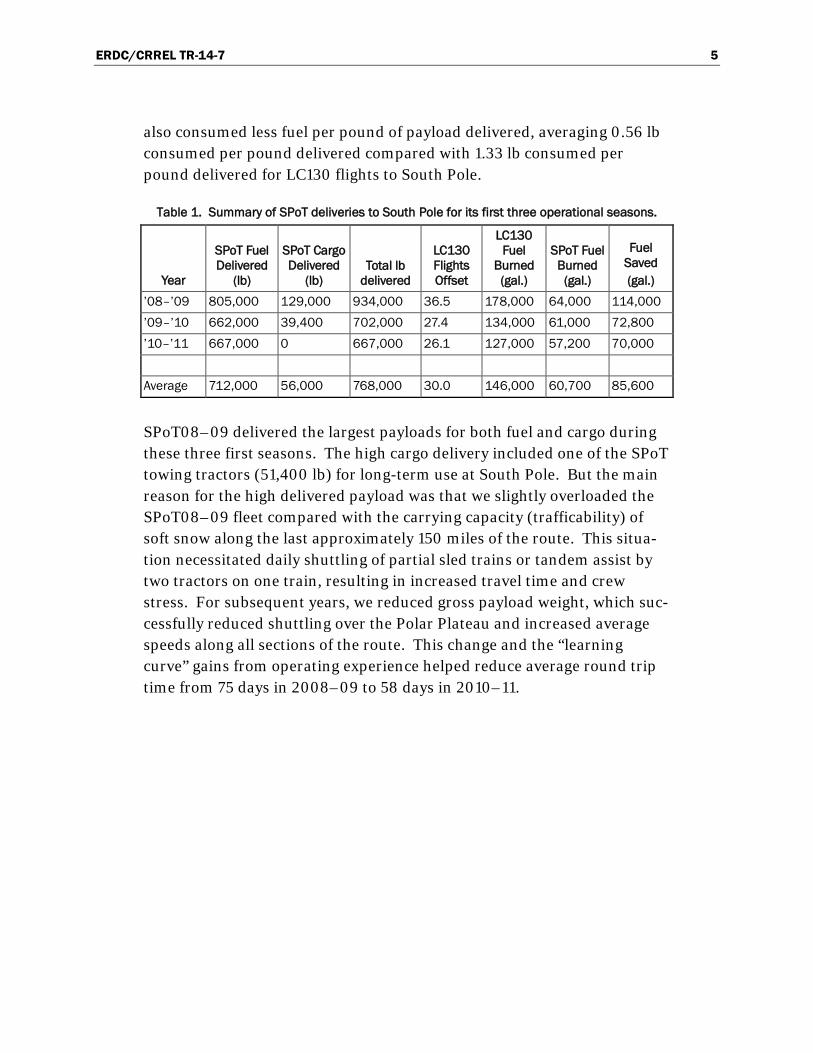
Table 1 provides a summary of SPoT’s first three seasons of operational deliveries. We determine the LC130 flights offset based on an average de-livered payload of 25,600 lb per flight to South Pole (RPSC 2011). SPoT
ERDC/CRREL TR-14-7 5
also consumed less fuel per pound of payload delivered, averaging 0.56 lb consumed per pound delivered compared with 1.33 lb consumed per pound delivered for LC130 flights to South Pole.
Table 1. Summary of SPoT deliveries to South Pole for its first three operational seasons.
Year
SPoT Fuel Delivered
(lb)
SPoT Cargo Delivered
(lb) Total lb
delivered
LC130 Flights Offset
LC130 Fuel
Burned (gal.)
SPoT Fuel Burned
(gal.)
Fuel Saved (gal.)
’08–’09 805,000 129,000 934,000 36.5 178,000 64,000 114,000 ’09–’10 662,000 39,400 702,000 27.4 134,000 61,000 72,800 ’10–’11 667,000 0 667,000 26.1 127,000 57,200 70,000 Average 712,000 56,000 768,000 30.0 146,000 60,700 85,600
SPoT08–09 delivered the largest payloads for both fuel and cargo during these three first seasons. The high cargo delivery included one of the SPoT towing tractors (51,400 lb) for long-term use at South Pole. But the main reason for the high delivered payload was that we slightly overloaded the SPoT08–09 fleet compared with the carrying capacity (trafficability) of soft snow along the last approximately 150 miles of the route. This situa-tion necessitated daily shuttling of partial sled trains or tandem assist by two tractors on one train, resulting in increased travel time and crew stress. For subsequent years, we reduced gross payload weight, which suc-cessfully reduced shuttling over the Polar Plateau and increased average speeds along all sections of the route. This change and the “learning curve” gains from operating experience helped reduce average round trip time from 75 days in 2008–09 to 58 days in 2010–11.

ERDC/CRREL TR-14-7 6
3 South Pole Traverse Costs
Table 2 summarizes the capital and operating costs for SPoT for its first three operational seasons. As a USAP cost center, SPoT’s cost are relative-ly easy to establish. We selected a 2% p.a. (per annum) discount rate to annualize capital costs across the working life of each asset. Brief descrip-tions of each of the major cost items follow. All costs are in 2011 dollars.
Table 2. Summary of SPoT capital and operating costs.
Capital Costs Unit Cost Life Annualized Unit Cost Number
Annualized Cost
Quadtrac (incl. spares) $450,000 7 $69,500 4 $278,000 MT865 (incl. spares) $540,000 7 $83,400 4 $334,000 Radar vehicle $220,000 10 $24,500 1 $24,500 Living-generator module $250,000 10 $27,800 2 $55,700 Tool shed/food module $110,000 10 $12,200 2 $24,500 Bladder sled (6000 gal. capacity) $30,000 3 $10,400 31 $322,000 Spreader $20,000 10 $2,230 15 $33,400 misc (e.g., radios, GPS, tents, etc.) $200,000 5 $42,400 1 $42,400 CRREL R&D* to initiate $1,000,000 20 $61,200 1 $61,200
Total annualized capital costs $1,180,000 * Research and development
Operating Costs Rate ($/mo) Months Persons Annual Cost
Management $9,480 12 2 $228,000 Summer mechanic $4,500 6 4 $108,000 Winter mechanic $2,250 6 2 $27,000 Traverse labor $7,000 6 6 $252,000 Staging labor $5,500 2 5 $55,000 Maintenance parts $100,000 Materials $200,000 Fuel ($4.70/gal.) $285,000 Food $30,000 Travel $30,000 Subcontracts & training $60,000 CRREL annual R&D $200,000 Total operating costs $1,570,000 SPoT total annual cost $2,750,000 SPoT cost/lb delivered $3.58
ERDC/CRREL TR-14-7 7
3.1 SPoT capital costs
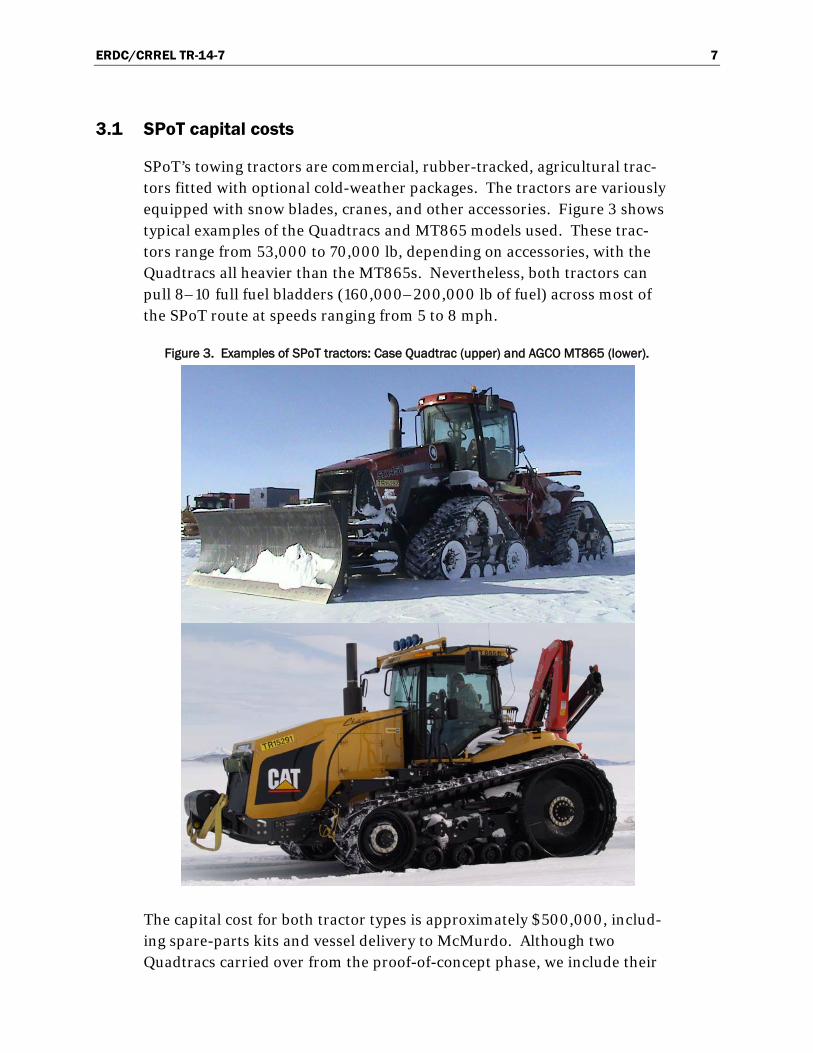
SPoT’s towing tractors are commercial, rubber-tracked, agricultural trac-tors fitted with optional cold-weather packages. The tractors are variously equipped with snow blades, cranes, and other accessories. Figure 3 shows typical examples of the Quadtracs and MT865 models used. These trac-tors range from 53,000 to 70,000 lb, depending on accessories, with the Quadtracs all heavier than the MT865s. Nevertheless, both tractors can pull 8–10 full fuel bladders (160,000–200,000 lb of fuel) across most of the SPoT route at speeds ranging from 5 to 8 mph.
Figure 3. Examples of SPoT tractors: Case Quadtrac (upper) and AGCO MT865 (lower).
The capital cost for both tractor types is approximately $500,000, includ-ing spare-parts kits and vessel delivery to McMurdo. Although two Quadtracs carried over from the proof-of-concept phase, we include their

ERDC/CRREL TR-14-7 8
costs here as if they were purchased new for SPoT08–09. Based on a rec-ommended engine overhaul at 3500 hours and 500 hours per year of use, we estimate the working life of the tractors to be seven years. These trac-tors are likely to have residual value for USAP after this time in locations less demanding than the remote SPoT route. However, we ignore any re-sidual value here.
SPoT used a Pisten Bully 100 during 2008–10 as its radar vehicle to sur-vey for crevasses in advance of the fleet. This vehicle also carried over from the proof-of-concept phase. For 2010–11, SPoT purchased a Prinoth BR350 to serve as its new radar vehicle. The costs of these vehicles are similar ($220,000), and we include one here with a 10-year life.
Figure 4 shows SPoT’s steel fleet-support sleds en route to South Pole in 2008. The living module contained berthing for the crew, a galley, and a communications center. The generator module contained two diesel-electric generators, shower, laundry, snow melting facilities, and an incin-erating toilet. A refrigeration module was built into a 20 ft long shipping container, which carried frozen and dry food. A similar sled (called the tool shed) carried fleet spare parts.
Figure 4. Two photos showing SPoT fleet-support sleds. The red living and generator modules are usually towed as a coupled pair. The white module with red borders contains frozen and dry food. A similar sled carries fleet spare parts in a standard shipping container. The small
red vehicle in the upper photo is the Pisten Bully 100 used in 2008–09 to conduct radar surveys for crevasse detection in advance of the fleet.

ERDC/CRREL TR-14-7 9
These sleds are heavy relative to their payload carried: the steel undercar-riages supporting each module weigh 20,000–25,000 lb. They also devel-op greater towing resistance per unit weight than bladder sleds. However, they operate reliably and were carried over from the proof-of-concept phase. We include their capital costs here as if they were purchased new for SPoT08–09. The living and generator modules cost about $250,000 each; the refrigeration module and tool shed cost about $110,000 each. We estimate their useful lives to be 10 years. We hope eventually to re-place their undercarriages with more efficient lightweight sleds.
Figure 5 shows typical bladder-sled trains towed by SPoT. Each sled con-sists of two 3000 gal. fuel bladders strapped to a sheet of 8 ft wide × 68 ft long × 0.5 in. thick high molecular weight polyethylene (HMW-PE). Nor-mally, four sleds (eight bladders) are attached to the same spreader bar (red in Figure 5) to tow as a unit. If desired, a second group of two or four bladders can be towed behind a set of eight via a long towrope connecting the spreader bars. As noted, compared to the well-performing steel sleds, the bladder sleds are one-sixth the cost, are one-tenth the weight, and tri-ple the fuel delivered per tractor to South Pole (Lever and Weale 2012). All fuel delivered to South Pole by SPoT through the three seasons of in-terest (2008–11) was towed there in bladder sleds.
Figure 5. Bladder sleds towed during SPoT09–10.
The components of bladder sleds are relatively inexpensive: $10,000 per fuel bladder; $5000 per HMW-PE sheet; and $5000 for towplates, strap-

ERDC/CRREL TR-14-7 10
ping, and fittings. These sum to $15,000 per 3000 gal. transport capacity. By comparison, the proof-of-concept 3000 gal. steel fuel tanks were about $100,000 each. While efficiency and cost are excellent, SPoT uses the bladders and HMW-PE sheets at lower temperatures and with much more flexing than their normal, stationary service conditions. Consequently, the sleds have experienced a variety of failures (e.g., cracking of HMW-PE sheets when underway, cracks in bladder material when folded for stor-age), and SPoT has needed to replace 10%–30% of the components each year. We expect to improve the reliability of bladder sleds, via materials designed specifically for traverse purpose, but use here a 3-year life to re-flect their service record to date.
The spreader bars used to tow bladder sleds cost about $20,000 each and should last at least 10 years. We also include miscellaneous gear (e.g., ra-dios, GPS receivers, tools, safety gear) as capital equipment at a total cost of $200,000 with a 5-year life.
A major cost to initiate SPoT was CRREL’s research and development ef-forts related to crevasse detection and mobility improvements, including full-scale laboratory tests to verify the safety of the new bladder sleds (Lever et al. 2004, 2006, 2010; Weale and Lever 2008). Some of this ef-fort was specific to the proof-of-concept phase (e.g., establishing the McMurdo shear-zone crossing, improving the performance of steel tank and fleet-support sleds), but much of it has enduring value. We estimate the latter component as $1M and amortize it over 20 years. We also in-clude annual CRREL support to SPoT as $200,000 per year for ongoing improvements to crevasse-detection and sled technologies.
3.2 SPoT operating costs
Table 2 also lists SPoT annual operating costs. Labor is the single largest expense (43% of the operating costs), followed by fuel (18%), materials (13%), and CRREL R&D support (13%). SPoT requires substantial labor to maintain its tractors and to stage the traverse, including an annual need to inspect bladders and HMW-PE sheets and to reassemble bladder sleds.
Fuel stores in McMurdo provide all fuel for SPoT and LC130 operations to South Pole. USAP’s bulk fuel purchase over the past several years has av-eraged just over $3 per gal.; tanker-charter and icebreaker costs raise this to about $4.70 per gal. (Blaisdell and Knuth 2011). This figure does not include off-loading costs, storage, and other costs to maintain the McMur-

ERDC/CRREL TR-14-7 11
do fuel stores. Other SPoT operating costs include maintenance parts, food, travel, and support contracts (Table 2).
3.3 SPoT total delivery costs
For the first three operational seasons, SPoT’s annualized capital costs were $1.18M; and its annual operating costs averaged $1.57M. Its total annual cost thus averaged about $2.75M or about $3.60 per pound of pay-load delivered to South Pole (768,000 lb 3-year average).

ERDC/CRREL TR-14-7 12
4 LC130 Airlift Costs
USAP has used ski-equipped LC130 Hercules aircraft (Figure 6) to resup-ply its stations and field camps since the 1960s. Airlift operations from McMurdo provided essentially all of South Pole’s fuel and cargo until Year 4 of the proof-of-concept traverse arrived in December 2005. The tempo of airlift operations from 2003 to 2008 was impressive, ranging from 300 to 380 flights per 120-day summer season at South Pole. The pace dropped to an average of 215 flights per season from 2008 to 2011 after completion of the new station and with the onset of SPoT deliveries (RPSC 2011).
Figure 6. LC130 at South Pole about to off-load passengers and cargo.
In general, LC130 costs are established for the entire USAP airlift effort and are not broken down by destination. However, many components of LC130 costs scale with flying hours (e.g., crew labor, fuel consumption, maintenance). Therefore, we will apportion costs to the South Pole airlift based on its fraction of the total LC130 flying hours conducted for USAP.
We analyzed data from the 2010–11 season (RPSC 2011; Blaisdell and Knuth 2011), which had 214 LC130 flights to South Pole and thus should be typical of the 2008–11 period of interest here. Each round trip requires 6.5 hours of flying time. The 214 South Pole resupply flights conducted in 2010–11 thus required 1391 hours or 56% of the total 2506 hours of on-continent LC130 flying hours. By comparison, the next largest fractions of

ERDC/CRREL TR-14-7 13
flying hours were for trips to camps at Byrd and WAIS (12% and 10%, re-spectively). The average round trip LC130 flight to all destinations was 6.4 hours, so results here would be very similar if apportioned on a per-flight rather than per-hour basis. For 2010–11, the average payload delivered to South Pole was 25,600 lb per flight, very close to the LC130’s allowable cabin load (ACL) of 26,000 lb for a South Pole flight.
4.1 LC130 operating costs
The LC130 fleet consists of 4 aircraft owned by NSF and 6 aircraft owned by the Department of Defense (DOD). Through a Memorandum of Agreement (MOA), the 109th Airlift Wing (AW), New York Air National Guard (NYANG), operates and maintains the fleet on behalf of NSF for Po-lar airlift missions (Antarctica and Greenland). To support USAP, the 109th AW flies the planes from the U.S. to Antarctica, stages them in McMurdo for on-continent operations, conducts those operations, and flies the planes home at the end of the Antarctic summer. USAP paid $36.4M to the 109th AW for this support for the 2011–12 season (Sakadolsky 2012). We will use $36M as the average for 2008–11, the sea-sons of interest here. This represents $14,400 per on-continent flying hour (Table 3).
Table 3. Cost summary for LC130 South Pole airlift, 2011 dollars (rounded to three significant figures). Discount rate for capital costs is 2% p.a. Operating costs are apportioned
on the basis of South Pole airlift hours as a fraction of the USAP total. Capital costs are for NSF-owned aircraft and are apportioned on the basis of annual flight hours to support NSF-
PLR (including Arctic operations).
Capital Costs Unit Cost Life Annualized Unit Cost Number
Annualized Cost Cost/hr Cost/flight
LC130 (NSF owned)
$90,000,000 50 $2,860,000 4 $11,500,000 $3,810 $24,800
Operating Costs Annual Cost Cost/hr Cost/flight
109th AW contract $36,000,000 $14,400 $93,400 Christchurch maintenance $6,000,000 $2,390 $15,600
Overhaul/upgrade $200,000 $80 $520 Fuel ($4.70/gal.) $3,530 $24,900 Total operating costs $20,400 $132,000 Total cost $24,200 $157,000 Cost/lb delivered $6.15

ERDC/CRREL TR-14-7 14
NSF-PLR also contracts Air New Zealand to provide a facility in Christ-church, New Zealand, to conduct planned depot-level maintenance and unplanned drop-in maintenance. The planned maintenance interval for each LC130 equates to about 70 months, so that 1–2 aircraft receive this maintenance each year. The 109th AW rotates planes from McMurdo to Christchurch for depot-level maintenance and to swap crew. The Air New Zealand contract costs about $6M per year (NSF 2011) or $2,400 per on-continent flying hour.
Note that through the MOA, the NSF must pay to repair an LC130 dam-aged during missions to support NSF (operational or training flights). In addition, NSF must pay to upgrade its own aircraft to satisfy new DOD re-quirements for LC130s. These aircraft are currently 20–30 years old. At present, we do not have access to historical repair, overhaul, or upgrade costs. We include a modest value of $50,000 per year for each of the four NSF-owned LC130s but note that these costs could increase substantially as the aircraft continue to age.
The LC130 fleet draws fuel from the McMurdo stores for its on-continent operations. As noted for SPoT operations, this fuel costs about $4.70/gal. The LC130s burn on average 750 gal. per flying hour, representing about a $3,500/hr fuel cost.
4.2 LC130 capital costs
Clearly, the LC130 fleet represents a substantial capital investment for DOD and NSF, and some of its annualized capital cost should be appor-tioned to the South Pole airlift. While NSF is currently the major user of all 10 LC130s, it is possible that DOD will replace its six aircraft when the need arises. Thus, we limit NSF’s capital investment to that of four LC130 aircraft. As with previous replacements, we assume a wheeled C130 would be purchased and retrofitted with skis. A new C130J is likely to cost ap-proximately $70M to $80M depending on the number ordered (Wikipedia 2012; NDCF 2011). We assume the addition of skis would increase the re-placement cost of an LC130 to about $90M per plane.
Estimating the useful life of the LC130 is difficult. The 109th AW aircraft are 20–30-year-old LC130-H series, which replaced earlier LC-130Ds after 25 years of service (Firebirds 2012; NYANG 2012). The NSF-owned air-craft are older airframes, transferred from the Navy’s VXE-6 squadron, but were upgraded to LC130-H in the early 2000s. It is possible that these

ERDC/CRREL TR-14-7 15
aircraft could be maintained, overhauled, and upgraded indefinitely, but this seems unlikely. Rather, we use 50 years as the life for these assets and note that repair and upgrade costs will probably escalate from historical levels. We again use a 2% p.a. discount rate.
Note that the LC130 fleet also provides airlift support for the Arctic pro-gram of NSF-PLR with flights from the 109th AW base at Scotia, NY, to Kangerlussuaq and Thule, Greenland, and between these airfields and Summit Station and other camps on the ice cap (Lever and Weale 2011a, 2011b). This Arctic airlift averages about 500 flying hours per year. That is, the LC130 fleet flies about 3000 hours per year on behalf of NSF-PLR. The annualized capital cost of the four NSF-owned LC130s thus converts to $3,810 per flying hour.
4.3 Other airlift costs
USAP annually prepares and maintains airfields at McMurdo and South Pole and staffs operations at both locations to conduct airlift operations. These are substantial undertakings in terms of equipment and personnel involved. McMurdo airfield supports USAP intercontinental and on-continent flights for all aircraft types. It would be reasonable to apportion McMurdo costs to the South Pole airlift based on its fraction of total flights. Nearly all airfield costs at South Pole are incurred to support the LC130 airlift (minor passenger flights by Bassler and Twin Otter aircraft notwithstanding). Identifying and apportioning these airfield costs would require substantial effort. We omit them here but note that this tends to underestimate total South Pole airlift costs.
4.4 LC130 total delivery costs
Table 3 summarizes the cost components for the LC130 South Pole airlift per hour and per flight. The 109th AW annual contract is the largest com-ponent (59%), followed by annualized capital costs (16%), fuel (15%), and depot-level maintenance (10%). The costs sum to $157,000 per South Pole flight or $24,200/hr of flying time. This equates to $6.10/lb deliv-ered based on the 2010–11 average delivered payload of 25,600 lb per flight.
We may crosscheck these costs with those determined for the LC130 airlift in Greenland (Lever and Weale 2011b). In 2009, NSF-PLR paid $6,816/hr of LC130 flying time, the so-called SAAM or Special Aircraft Airlift Mission
ERDC/CRREL TR-14-7 16
rate. This figure includes fuel and a 10% discount for early scheduling. The SAAM rate increased to $8,017/hr in 2012. In addition, NSF-PLR must pay to position the aircraft in Greenland, which has averaged 75% of in-Greenland flight-hour costs. Thus, the average LC130 airlift cost during 2009–11 was $12,000–$14,000 per in-Greenland flying hour, including fuel. This range is close to the figure determined here for the South Pole airlift: $17,900/hr including fuel and positioning costs (the latter included in 109th AW annual contract). The higher figure for the South Pole airlift likely results from higher 109th AW costs to position planes in Antarctic and to station crew in McMurdo rather than in their home base in Scotia, NY.
While $6.10/lb for the South Pole airlift might seem expensive, it is similar to commercial costs to fly goods from the U.S. to Thule Air Base in Green-land. For example, the U.S. Air Force Air Mobility Command (AMC) con-tracts weekly flights to Thule from Baltimore, MD. In 2011, CRREL shipped approximately 200 lb of equipment on these flights at a cost of $7.10/lb. While the distance is greater than McMurdo to South Pole, these AMC flights also carry paying passengers to offset costs.
ERDC/CRREL TR-14-7 17
5 Economic Benefits of the South Pole Traverse
5.1 Average economic benefits
During its first three operations seasons, 2008–11, SPoT averaged 768,000 lb of payload delivered annually to South Pole (Table 1). These deliveries offset 30 annual LC130 flights to South Pole, based on an aver-age payload of 25,600 lb/flight. SPoT’s annual cost to achieve this per-formance was $2.75M (total operating and annualized capital cost, Table 2). Conversely, the annualized capital and operating costs of LC130 airlifts to deliver the same payload sums to $4.72M. That is, the net benefit of SPoT to USAP was approximately $2.0M/year or $5.9M over its first three seasons of operation.
SPoT08–11 operating costs averaged $1.57M/year. SPoT thus achieved a net operational savings to USAP of $3.14M/year compared with LC130 airlifts, sufficient to pay all its capital costs ($7.33M) in 2.3 years of opera-tion. This is an excellent return on capital investment (43%).
Note that SPoT achieves net benefits regardless of how USAP consumes these benefits. USAP could reduce its total LC130 airlift costs (i.e., save money on logistics) or it could reprogram the offset flights to support deep-field science in Antarctica (i.e., expand its science capabilities). The net benefits derive from USAP’s investment in SPoT as an alternative to LC130 resupply of South Pole.
5.2 Incremental benefits from efficiency gains
Since the proof-of-concept phase, CRREL has worked with SPoT to in-crease sled efficiency (payload carried per unit towing force required). Lever and Weale (2012) summarize these gains for bladder sleds: they es-sentially triple the fuel delivered to South Pole per towing tractor com-pared with steel tank sleds. Collaboration with NSF-PLR’s Greenland In-land Traverse (GrIT) shows potential to achieve similar gains for cargo sleds (Lever et al. 2012). In both cases, lightweight high-efficiency sleds perform better and cost less than their steel counterparts. They increase the per-tractor payload delivered to South Pole for essentially the same operating costs (fuel consumption, labor, maintenance, etc.).

ERDC/CRREL TR-14-7 18
We have included ongoing $200,000/year R&D costs for SPoT to seek ad-ditional efficiency gains. The recently documented dependence of sled towing resistance on sled–snow interface temperature provides a good ex-ample (Lever 2011; Lever and Weale 2012). Warmer sleds tow easier than colder ones, and passive solar gain on black bladders produces significant performance gains. That is, simply replacing worn-out tan bladders with black ones will increase SPoT’s per-tractor fuel delivery capacity. This has a dramatic effect on the net benefits achieved.
The 2008–11 average outbound towing capacity of SPoT equated to 57 fuel bladders (1.2M lb of fuel) plus the four fleet-support sleds. The towing ca-pacity of 1.5 tractors was needed to tow the fleet-support sleds. The re-maining fleet capacity averaged about 9 fuel bladders per tractor (sled trains of 8–10 bladders). Field tests near McMurdo indicated that black bladders could boost per-tractor capacity to 12–16 bladders (Lever and Weale 2012). The second SPoT fleet achieved this performance across a portion of the Ross Ice Shelf during the 2011–12 season. Even without improving the fleet-support sleds, 12 bladders per tractor represents a po-tential delivery increase of 64,000 gal. per year or 58% more than the 2008–11 average. The effect on net annual benefits is even more impres-sive: it more than doubles, from $2.0M/year to $4.6M/year (an additional 17.4 LC130 flights offset). Because the SPoT fleet already covers its costs, efficiency gains dramatically boost benefits.
5.3 Other SPoT economic benefits
SPoT can achieve significant benefits beyond reductions in cost per pound of payload delivered. The most straightforward examples result from transport of items that are too large or too heavy for a single LC130 flight. SPoT can tow (or drive) intact tractors, bulldozers, and other heavy equipment needed at South Pole. It should also be able to tow prefabricat-ed buildings and large science equipment on efficient, lightweight cargo sleds (Lever et al. 2012). LC130 airlift requires labor to disassemble the equipment in McMurdo (or at the U.S. originating supplier) and labor and facilities to reassemble it at South Pole, plus the cost per pound for multi-ple LC130 flights. These benefits can be quantified for specific cargo; addi-tional benefits derive from the convenience and quality assurance that re-sults by transporting large equipment intact from the U.S. through to South Pole.

ERDC/CRREL TR-14-7 19
6 Air Emissions Benefits
Lever and Weale (2011b) estimated reductions in air emissions for the proposed GrIT compared with LC130 airlift to resupply Summit Station. They based their analysis on the Comprehensive Environmental Evalua-tion (CEE) prepared by NSF to assess potential environmental impacts of Antarctic traverses (NSF 2004). We repeat the key points here and apply the method to estimate the air emissions benefits of SPoT.
NSF-PLR prepared a CEE to identify and to evaluate potential environ-mental and operational impacts of surface traverses in Antarctica, partly to support SPoT’s proof of concept. The CEE was subject to the scrutiny of and approval by other member countries covered by the Antarctic Treaty.
Section 6.3.2 of the CEE presented estimates of cargo weights, fuel usage, and air emissions for SPoT scenarios and LC130 resupply flights. It used models developed by the U.S. Environmental Protection Agency (EPA) to estimate annual emission for air pollutants from hydrocarbon fuel com-bustion and included emissions from traverse tractors, generators, heat-ers, and snowmobiles and LC130 engines. Table 6-3 of the CEE summa-rized these results.
We now know the actual performance of SPoT for 2008–11 in terms of payload delivered and fuel consumed. The CEE’s traverse scenarios, equipment anticipated, distances traveled, and LC130 flight profiles are sufficiently similar that we may use normalized predicted emissions (lb/1000 lb fuel consumption) to estimate actual emissions. Table 4 pre-sents the results for all five combustion byproducts analyzed in the CEE.
SPoT offers impressive reductions in all air emissions compared with LC130 flights. The main reductions result from much lower emissions per unit fuel consumed (about two orders-of-magnitude). Secondary reduc-tions derive from lower fuel consumption to deliver the same payload to South Pole (about a 60% reduction). For simplicity, we also present the average reduction for all five pollutants, ignoring differences in environ-mental impacts from these pollutants. By this simple measure, SPoT’s emissions of five key air pollutants average less than 1% of those from the LC130 airlift.

ERDC/CRREL TR-14-7 20
Table 4. Annual air emissions for SPoT08–11 compared with those by LC130 airlift. The first three rows derive from Table 6-3 of the CEE for South Pole resupply (NSF 2004), normalized by fuel consumed. The last row presents the SPoT/LC130 emission ratios to resupply South
Pole.
Normalized Emissions (lb/1000 lb fuel consumption)
Delivery Mode
Fuel Consumed (1000 lb)
Sulfur Oxides
Nitrogen Oxides
Carbon Monoxide
Exhaust Hydro-
carbons Particulates
Average Emission
Ratio SPoT (CEE) 1387 0.079 0.043 0.016 0.002 0.003 LC130 (CEE) 2220 1.35 10.66 7.16 3.19 2.93 SPoT/LC130 emission ratio per unit fuel use (CEE)
5.9% 0.40% 0.22% 0.07% 0.12% 1.3%
SPoT/LC130 average fuel use 2008–11
0.422
SPoT/LC130 emission ratio per unit payload delivered to South Pole 2008–11
2.5% 0.17% 0.09% 0.03% 0.05% 0.56%
Since the date of the CEE, carbon-dioxide emissions have become an im-portant environmental concern. They scale primarily with quantity of fuel burned, so the CO2 emission of SPoT is 42% that of the LC130 airlift, less impressive but still significant.
Note that this analysis ignores differences in the location of the air emis-sions between SPoT and LC130 resupply profiles. All emissions by SPoT are at ground level while most of the LC130 emissions occur at their flight altitude. These location differences also imply different environmental impacts. By design, both SPoT and LC130 resupply missions approach South Pole away from the clean-air and quiet sectors to minimize impacts on science activities.

ERDC/CRREL TR-14-7 21
7 Estimating Benefits for Other Traverse Missions
We have apportioned LC130 operating and capital costs according to on-continent flying hours ($24,200/hr total) and have calculated SPoT flight offsets based on the average payload delivered per flight to South Pole (25,600 lb). We may generalize this calculation for any Antarctic destina-tion by determining the round trip flying time and ACL for that location. However, additional airlift costs occur for remote destinations (i.e., those without existing skiways and infrastructure). These include low ACL flights to establish a camp, skiway preparation and camp costs, field-crew labor, etc.
We may estimate traverse costs for other missions based on round trip transit time and SPoT labor rates, fuel consumption, maintenance, and annualized capital costs per hour. Traverses tow their own accommoda-tions and food and can arrive with considerable labor capacity to install, resupply, or remove remote camps. Thus, traverse transit and on-site costs are easy to estimate. Less well known is the per-tractor payload ca-pacity across unknown snow conditions to new, remote sites. Soft snow across the Polar Plateau can dramatically reduce payload capacity, and un-certainty in snow conditions unfortunately demands planning for conser-vatively low payloads.
While beyond the present scope, it would be worthwhile to compare costs for specific traverse missions with LC130 airlift costs for those same mis-sions. The resulting difference (net benefits) could then be compared with the benefits lost by diverting SPoT assets to perform the missions or the extra costs to acquire additional traverse equipment and personnel.
ERDC/CRREL TR-14-7 22
8 Discussion
The analysis here shows that SPoT saved USAP approximately $5.9M over its first three seasons of operation by offsetting LC130 flights to South Pole. This figure accounts for the annualized capital and annual operating costs of both resupply modes.
We have good documentation of costs and payload delivered by SPoT be-cause it is essentially an independent USAP work center. Several factors quantifying the LC130 South Pole airlift are also well known: the average payload, fuel consumption, and flight hours; the total USAP LC130 airlift hours; the 109th AW annual contract; the depot-level maintenance con-tract; and McMurdo fuel cost (also applied to SPoT). Less well known are historical LC130 repair, overhaul, and upgrade costs and how they trend as the planes age. The estimate used here ($50,000 per plane per year) is low relative to other cost components. It seems likely that repair, over-haul, and upgrade costs will increase substantially as the planes age. Fol-low-on research should yield a better estimate of these costs.
The annualized capital cost of the LC130 fleet is also somewhat uncertain. The purchase price assumed here ($90M per plane) uses recent C130J prices boosted to allow for ski retrofit. The working life of an LC130 is also an estimate. The planes are now 20–30 years old. We have used 50 years, a long life, which tends to minimize LC130 annualized capital cost. The choice of a 2% p.a. discount rate to annualize capital costs reflects current government bond rates. A higher value would increase LC130 total annual costs. Importantly, we have assumed that DOD will replace its six aircraft when the need arises. However, NSF-PLR is currently the major user of LC130 airlift capacity; it is potentially exposed to replacement costs for all the aircraft it needs, including those owned by DOD.
In principle, we could assess the incremental economic benefits and in-cremental costs to USAP of investing in SPoT. Essentially all SPoT costs are incremental as this is a new capability to USAP. Incremental benefits would be the incremental reductions in LC130 airlift costs for 30 annual South Pole flights offset. These benefits would be the same as determined here provided all LC130 costs scale with flying hours.
ERDC/CRREL TR-14-7 23
LC130 fuel, maintenance, and crew costs scale primarily with flying hours, as should repair, overhaul, and upgrade costs and the reduction in useful life. Nevertheless, some LC130 costs are probably fixed costs, say some fractions of the 109th AW annual contract and the Air New Zealand maintenance contract. The best way to determine the fixed-cost fractions would be to have these contracts explicitly identify fixed and variable costs. Absent this information, we have used the simpler approach of scal-ing all LC130 costs with flying hours. This approach tends to overstate the economic benefits of SPoT.
We have omitted airfield infrastructure from LC130 costs, and this tends to counterbalance the aforementioned simplification. Some airfield costs are fixed to support any level of USAP airlift operations. However, the South Pole airlift represents the majority (56%) of all LC130 on-continent flights and must incrementally increase McMurdo airfield costs via fuel and cargo handling, firefighting, maintenance, tower, and transportation costs. Essentially all airfield costs at South Pole should be applied to the LC130 airlift, and a substantial proportion would scale with the number of flights. Neglecting these costs tends to understate the economic benefits of SPoT.
The McMurdo food and lodging costs for the 109th aircrew also scale pri-marily with crew size and hence with flying hours. SPoT incurs similar costs during staging and winter maintenance, but it pays for (and tows) its in-field food and lodging. We neglect these costs for both modes as they partially cancel each other. The same is true for USAP-provided airfares to and from New Zealand: they are small and partially cancel for both modes.
SPoT efficiency gains from CRREL R&D have already yielded big benefits: fuel bladder sleds tripled the fuel delivery possible per SPoT tractor com-pared with proof-of-concept steel tank sleds. Annual R&D investment, in-cluded in SPoT operating costs as $200,000/year, offers the potential for similarly impressive payback. Solar gain via black bladders can boost the per-tractor capacity to 12 bladders from the 2008–11 average of roughly 9 bladders. This would more than double the net economic benefit per SPoT round trip, from $2.0M/year to $4.6M/year, and represent a return on the annual R&D investment of a whopping 1300%. Lightweight, high-efficiency cargo sleds, jointly developed with GrIT, offer the potential to tow prefabricated buildings and science equipment intact to South Pole.
ERDC/CRREL TR-14-7 24
Besides lower delivery costs per pound, SPoT delivery would save addi-tional costs for disassembly and reassembly otherwise needed for airlift delivery.
Robotic leader-follower technology could offer additional efficiency gains. At present, the SPoT crews work 12 hours per day with 10 hours of driving and 2 hours for startup, lunch, cleanup, and refueling. Four robotic fol-lower tractors per fleet would enable the same crews to operate in two shifts, doubling normal daily advance while retaining the option to operate all tractors manually if needed. The round trip travel times would thus drop from approximately 45 days to 25–30 days, providing a sufficient margin to enable each SPoT fleet to conduct two round trips per season. The method outlined here provides a means to estimate the net economic benefits, and hence payback, of an investment in robotic tractors.
Air emission benefits by SPoT delivery compared with LC130 airlift, while not monetary, are nonetheless important. Reductions in five types of air pollutants average two orders of magnitude, owing to lower tractor emis-sions per pound of fuel burned. Lower fuel burned per pound of cargo de-livered (42%) increases this benefit and produces proportional reductions in CO2 emissions.

ERDC/CRREL TR-14-7 25
9 Summary and Conclusions
USAP now operates over-snow traverses to resupply Amundsen-Scott South Pole Station from McMurdo Station, a one-way distance of 1030 miles. During its first three operational seasons (2008–11), the SPoT fleet of eight towing tractors delivered an average annual payload of 768,000 lb, most of which was fuel towed in high-efficiency bladder sleds. These deliveries offset an average of 30 annual LC130 flights to South Pole otherwise needed to deliver the same payload.
We developed an economic analysis of the payback achieved by SPoT dur-ing its first three seasons. Costs include SPoT annualized capital and an-nual operating costs, and benefits are reduced LC130 costs apportioned per round trip to South Pole. SPoT’s net economic benefits of $2.0M/year result from significantly lower delivery costs per pound compared with corresponding LC130 costs ($3.60/lb versus $6.10/lb, respectively). SPoT’s annual net savings in operating costs pays for its capital investment in about 2.3 years for an approximately 43% return on capital investment. Additional benefits of SPoT include significantly reduced air emissions, the ability to transport outsized or overweight cargo, and the increased availability of LC130s to support other science operations in remote sec-tors of Antarctica.
The results here were structured to help guide USAP investments to im-prove traverse technology and to resupply other remote locations in Ant-arctica by this method. For example, sled-efficiency improvements dra-matically boost benefits: performance gains from using black rather than tan bladders could increase SPoT’s annual fuel delivery per round trip by 58% and more than double its net economic benefits to $4.6M/year. Be-cause we apportion LC130 costs per flying hour, it is also straightforward to estimate traverse benefits to resupply other Antarctic locations.

ERDC/CRREL TR-14-7 26
References Blaisdell, G. L., P. W. Richmond, F. C. Kaiser, and R. G. Alger. 1997. Development of a
modern heavy-haul traverse for Antarctica. In Proceedings of the 7th International Offshore and Polar Engineering Conference, Honolulu, 2:529–536.
Blaisdell, G. L. 2000. Analysis of McMurdo to South Pole traverse as a means to increase LC-130 availability in the USAP. In Proceedings of the NSF-OPP Workshop on Enhanced Airlift Options, 14–16 June, Washington, DC.
Blaisdell, G. L., and M. Knuth. 2011. Unpublished spreadsheets and descriptions of data for LC130 on-continent flying hours by destination and LC130 fuel consumption for 20010-11 USAP season; historic bulk-fuel costs. Arlington, VA: National Science Foundation.
Firebirds. 2012. From Schenectady to the Poles. The 109th Airlift Wing, New York ANG. www.firebirds.org/menu7/109thny.htm (accessed 16 February 2012).
Lever, J. H., and J. C. Weale. 2011a. Mobility and Economic Feasibility of the Greenland Inland Traverse (GrIT). ERDC/CRREL TR-11-9. Hanover, NH: U.S. Army Engineering Research and Development Center.
Lever, J. H., and J. C. Weale. 2011b. Feasibility of Overland Traverse to Re-Supply Summit Camp: Fleet Configuration and Economic Analysis. ERDC/CRREL TR-11-7. Hanover, NH: U.S. Army Engineering Research and Development Center.
Lever, J. H., and J. C. Weale. 2012. High efficiency fuel sleds for polar traverses. Journal of Terramechanics 49 (3–4): 207–213.
Lever, J. H., J. C. Weale, P. Thur, and J. Burnside. 2012. High efficiency sleds for Polar cargo transport. In Proceedings of Transportation Systems Workshop, March 2012, Austin, TX.
Lever, J. H. 2011. Greenland Inland Traverse (GrIT): 2010 Mobility Performance and Implications. ERDC/CRREL TR-11-16. Hanover, NH: U.S. Army Engineering Research and Development Center.
Lever, J. H., J. C. Weale, R. G. Alger, and G. L. Blaisdell. 2004. Mobility of Cargo Trains during Year Two of the Proof-of-Concept South Pole Traverse. ERDC/CRREL TR-04-22. Hanover, NH: U.S. Army Engineering Research and Development Center.
Lever, J. H., J. C. Weale, R. G. Alger, G. L. Blaisdell, and J. H. Wright. 2006. Mobility solutions for the South Pole traverse tractor-sled trains. In Proceedings of the 10th European Conference of the International Society for Terrain-Vehicle Systems (ISTVS), Budapest, Hungary (CD-ROM).
J. H. Lever, J. C. Weale, G. Gooch, and J. L. Mercer. 2010. CRREL bladder sled durability tests. Contract report. Arlington, VA: National Science Foundation, Office of Polar Programs.

ERDC/CRREL TR-14-7 27
National Defence and the Canadian Forces (NDCF). 2011. CC-130J Hercules Tactical Airlift. National Defence and the Canadian Armed Forces. www.forces.gc.ca/site/pri/2/pro-pro/hercules-eng.asp (accessed 16 February 2012).
National Science Foundation (NSF). 2011. Ski-equipped LC-130 Maintenance, Solicitation Number: DACS12P-NZ. Federal Business Opportunities. National Science Foundation, Division of Acquisition and Cooperative Support. http://www.fbo.gov (accessed 26 October 2011).
National Science Foundation (NSF). 2004. Development and implementation of surface traverse capabilities in Antarctica, Comprehensive environmental evaluation. Arlington, VA: National Science Foundation.
New York Air National Guard (NYANG). 2012. 109th Airlift Wing History. 109th Airlift Wing. http://www.109aw.ang.af.mil/history/ (accessed 16 February 2012).
Raytheon Polar Services Company (RPSC). 2011. Section 2, South Pole Airlift. In RPSC Logistics, USAP Transportation Summary 2010–11. Contract report. Centennial, CO: U.S. Antarctic Program, Raytheon Polar Services Company.
Sakadolsky, M. 2012. Personal communications based on review of 109th Air Wing NYANG billing for 2011–12 USAP season. Arlington, VA: National Science Foundation.
Weale, J., and J. H. Lever. 2008. Innovations in over-snow cargo transport. Cold Regions Science and Technology 52:166–176.
Wright, J. H. 2006. South Pole Traverse Project Year 4, McMurdo to Pole and Back: The Concept is Proved. Contract report. Centennial, CO: United States Antarctic Program, Raytheon Polar Services Company.
Wikipedia. 2012. Lockheed Martin C-130J Super Hercules. Wikipedia. http://en.wikipedia.org/wiki/Lockheed_Martin_C-130J_Super_Hercules (accessed 3 February 2012).

REPORT DOCUMENTATION PAGE Form Approved
OMB No. 0704-0188 Public reporting burden for this collection of information is estimated to average 1 hour per response, including the time for reviewing instructions, searching existing data sources, gathering and maintaining the data needed, and completing and reviewing this collection of information. Send comments regarding this burden estimate or any other aspect of this collection of information, including suggestions for reducing this burden to Department of Defense, Washington Headquarters Services, Directorate for Information Operations and Reports (0704-0188), 1215 Jefferson Davis Highway, Suite 1204, Arlington, VA 22202-4302. Respondents should be aware that notwithstanding any other provision of law, no person shall be subject to any penalty for failing to comply with a collection of information if it does not display a currently valid OMB control number. PLEASE DO NOT RETURN YOUR FORM TO THE ABOVE ADDRESS. 1. REPORT DATE (DD-MM-YYYY)
29-05-2014 2. REPORT TYPE
Technical Report/Final 3. DATES COVERED (From - To)
4. TITLE AND SUBTITLE
Economic Analysis of the South Pole Traverse
5a. CONTRACT NUMBER
5b. GRANT NUMBER
5c. PROGRAM ELEMENT NUMBER
6. AUTHOR(S)
James H. Lever and Paul Thur
5d. PROJECT NUMBER
5e. TASK NUMBER EP-ANT-12-05
5f. WORK UNIT NUMBER
7. PERFORMING ORGANIZATION NAME(S) AND ADDRESS(ES) 8. PERFORMING ORGANIZATION REPORT NUMBER
Cold Regions Research and Engineering Laboratory (CRREL) U.S. Army Engineer Research and Development Center 72 Lyme Road Hanover, NH 03755-1290
ERDC/CRREL TR-14-7
9. SPONSORING / MONITORING AGENCY NAME(S) AND ADDRESS(ES) 10. SPONSOR/MONITOR’S ACRONYM(S) National Science Foundation, Division of Polar Programs, Antarctic Infrastructure and Logistics Arlington, VA 22230
NSF 11. SPONSOR/MONITOR’S REPORT NUMBER(S)
12. DISTRIBUTION / AVAILABILITY STATEMENT Approved for public release; distribution is unlimited.
13. SUPPLEMENTARY NOTES
Engineering for Polar Operations, Logistics, and Research (EPOLAR)
14. ABSTRACT The U.S. Antarctic Program (USAP) operates the South Pole Traverse (SPoT) to resupply Amundsen-Scott South Pole Station from McMurdo Station. During its first three operational seasons (2008–2011), SPoT’s eight tractors delivered an average annual payload of 768,000 lb, most of which was fuel traveling in high-efficiency bladder sleds. These deliveries offset an average of 30 annual LC130 flights to South Pole.
We present here an economic analysis of the payback achieved by SPoT during its first three seasons. Costs include SPoT annualized capital and annual operating expenses, and benefits are reduced LC130 costs apportioned per round-trip to South Pole. SPoT’s net economic benefits of $2.0M/year result from significantly lower delivery costs per pound compared with LC130 airlift ($3.60/lb versus $6.10/lb, respectively). Additional benefits of SPoT include reduced air emissions, ability to transport outsized or overweight cargo, and increased availability of LC130s to support other science operations in Antarctica.
The results here are structured to guide future USAP investments. For example, sled-efficiency improvements dramatically boost benefits: performance gains from using black rather than tan bladders could increase SPoT’s annual fuel delivery per round trip by 58% and more than double its net economic benefits to $4.6M/year.
15. SUBJECT TERMS Antarctica Efficiency
EPOLAR NSF Over-snow resupply
Polar logistics Return on investment South Pole Traverse
16. SECURITY CLASSIFICATION OF: 17. LIMITATION OF ABSTRACT
18. NUMBER OF PAGES
19a. NAME OF RESPONSIBLE PERSON
a. REPORT
U
b. ABSTRACT
U
c. THIS PAGE
U None 38 19b. TELEPHONE NUMBER (include area code)
Standard Form 298 (Rev. 8-98) Prescribed by ANSI Std. 239.18