economic analysis of reaching a 20% share of renewable...
TRANSCRIPT

Executive Summary
Economic analysis of reaching a 20% share of renewable energy sources in 2020 Mario Ragwitz, Felipe Toro Fraunhofer - ISI Gustav Resch, Thomas Faber, Reinhard Haas - EEG Monique Hoogwijk, Monique Voogt, Max Rathmann - ECOFYS
August 2006 by order of the: European Commission DG Environment ENV.C.2/SER/2005/0080r


RES 2020 - Least Cost I
Table of Contents
Page
1 EC policy context and purpose and objectives of the study.......................... 1
European policy context .................................................................................... 1
This project........................................................................................................ 2
2 Methodology for analysis ............................................................................... 3
Green-X model .................................................................................................. 3
Modelling approach ........................................................................................... 3
3 Scenario parameters and sensitivity cases.................................................. 5
Overview of parameters and sensitivity cases .................................................. 5
Energy demand ................................................................................................. 6
Fossil fuel and reference energy prices ............................................................ 7
CO2 prices ........................................................................................................ 7
RES-potential .................................................................................................... 7
RES-targets....................................................................................................... 8
RES-cost ........................................................................................................ 8
4 Key Results...................................................................................................... 9
Effect on CO2-emissions ................................................................................. 10
Effect on security of supply ............................................................................. 10
Effect on investments and costs...................................................................... 11
Effect on electricity prices................................................................................ 12
Effect on sector-specific RES-deployment ...................................................... 13
Effect on technology-specific RES-deployment .............................................. 15
Effect on country-specific RES-deployment .................................................... 17
5 Conclusions................................................................................................... 18


RES 2020 - Least Cost 1
1 EC policy context and purpose and objectives of the study
European policy context Energy from renewable sources (RES) plays a vital role in mitigation of greenhouse gas (GHG) emissions. Moreover, it has several other well recognised benefits such as improved security of supply, contributing to improve air quality and creation of new jobs and businesses – many of them in rural areas. These benefits were recently pointed out again in the Commission’s Commu-nication on the support of electricity from renewable energy sources 1. Since the publication of the White Paper "Energy for the future" and the adoption of the RES-E2 Directive3 the European market has developed in a dynamic way. All EU member states have implemented policies to support the market introduction of RES-E and most of them have started to improve the corresponding administrative framework conditions. With solid support frameworks (being) set up to meet 2010 targets the current discussion process among others concentrates on securing an increasing use of RES for the period post 2010. The importance of providing such a longer term perspective for RES has been well acknowledged by the European Commission (EC) – as stated in the Commission’s Communication ‘The share of renewable en-ergy’4 at least for the following reasons: • considering in particular the infant nature of the renewable energy industry • the need to ensure sufficient investors security Recently the importance of RES and the need for a longer term policy framework was again emphasised in the Green Paper Energy5 where the EC announced a Renewable Energy Road Map. This road map should in particular look at future targets and objectives beyond 2010 and at "the nature of such targets, in order to provide long term certainty for industry and investors, as well as the active programmes and measures needed to make this a reality. Any such targets could be complemented by extended operational targets on electricity, fuels and possibly heat-ing." Obviously, extensive efforts are required to provide a comprehensive knowledge base for the process of deciding on future targets. One of the key studies to analyse this future target setting is the study “FORRES 2020”6. This study among others showed that a 20% share of renewable 1 Communication from the Commission “The support of electricity from renewable energy sources”, COM(2005) 627,
Brussels, 7.12.2005.
2 Electricity, heat and transport fuels from renewables energy sources are respectively indicated as RES-E, RES-H and RES-T.
3 Directive 2001/77/EC on the promotion of the electricity produced from renewable energy source in the internal electricity market
4 Communication from the Commission to the Council and the Parliament “The share of renewable energy in the EU”, COM (2004) 366 final, Brussels, 26.5.2004.
5 Communication from the Commission "A European Strategy for Sustainable, Competitive and Secure Energy", COM(2006) 105, Brussels, 8.3.2006.
6 Analysis of the Renewable Energy Sources’ evolution up to 2020, project conducted by Fraunhofer Isi, EEG, Ecofys, REC and KEMA, Tender No. TREN/D2/10-2002.

RES 2020 - Least Cost
2
energy in 2020 is possible provided that an active set of policy instruments is applied throughout Europe. In September 2005 the European Parliament called for this 20% target to be imple-mented as a mandatory target. In order to support achieving this target, in February 2006 the Par-liament requested the Commission to formulate a Directive to increase the share of renewable energy for heating and cooling. DG Environment is, as part of its key task to integrate environmental considerations into other policy areas, actively following these and other studies to obtain a full understanding of the vari-ous impacts of future renewable energy targets setting. This study provides input to the inter-service group in the Commission that prepares the impact assessment for the consideration of post-2010 targets for renewable energy. This work builds upon the outcomes of the above men-tioned “FORRES 2020” study as well as on PRIMES modelling and other sources of relevance. It includes economic impacts of renewable energy target settings and investigates the least cost approach for high shares of RES.
This project The objective of this project is to facilitate informed decision making on future RES targets and policy. This is done by developing a least-cost RES portfolio in order to analyse (cost) implica-tions of key policy choices. In order to optimally support policy making, results should be as comparable and reliable as possible. Therefore it was explicitly decided to not develop a com-plete new scenario approach, but to base modelling on the well known Green-X model and to use widely accepted data from PRIMES and FORRES 2020 as input. The project provides an assessment and in-depth analysis on the effects of a 20% RES target in terms of primary energy demand in the year 2020. Various scenarios and sensitivity cases have been analysed to obtain a thorough understanding of the possibilities for long-term renew-able energy targets and the costs and benefits associated with these targets. The research, involving all sectors of renewable energies (i.e. electricity, heat and transport) within the Euro-pean Union, concentrates on the following: • Identification of the least cost portfolio of a 20% RES target for the sectors electricity, heat
and transport • Identifying the technology-specific RES-deployment • Determining the additional costs for generation of 20% renewable energy • Determining the avoided (costs of) fossil fuel use and benefits in terms of security of supply • Calculating the avoided CO2-emissions • Identifying the impact on electricity prices • Identifying the country-specific RES-deployment • Analysing the impact of different assumptions regarding the evolution of primary energy
prices on costs and benefits and the above mentioned modelling outputs.

RES 2020 - Least Cost 3
2 Methodology for analysis
Green-X model The quantitative analysis is centred around the well known Green-X model7. The model allows a comparative, quantitative analysis of interactions between RES, conventional energy and combined heat and power (CHP) generation, demand-side management activities and CO2-reduction, both within the EU as a whole, as well as for individual Member States. The model forecasts the deployment of RES under various scenarios regarding supporting policy instru-ments, the availability of resources and generation technologies as well as energy, technology and resource price developments. The Green-X model matches demand and supply of energy sources. Demand is based on the EU energy outlook. Supply is described by means of a cost-resource curve build up in two parts: • A static cost resource curve that describes the relationship between technical available po-
tentials and the corresponding costs of utilisation of this potential • A dynamic cost resource curve, which is based on the static cost resource curve including
dynamic parameters as technological change (using the concept of experience curves or expert judgment) and the dynamic barriers for the implementation, determining the yearly available RES potential. The dynamic curve is endogenous to the model and determined annually.
The Green-X model calculations are complemented by simulations from the GreenNet model that determines additional costs for system operation and grid extension resulting from intermittent RES-E.
Modelling approach The key approach in the modelling calculations is that the European energy market optimizes the additional generation costs for RES against the background of a 20% RES target in the year 2020. This overall optimization is modelled by comparing the difference between RES genera-tion costs and conventional reference prices across all sectors (heat, electricity and biofuels), all technologies and all countries. Results are presented in terms of additional costs, that is, the total costs of generation per energy output minus the reference cost of energy production per unit of energy output. The optimisation is conducted across all three sectors (RES-E, RES-H and RES-T). As biomass may play a role in all sectors, the allocation of biomass resources is a key issue. Consequently the overall optimization across sectors includes an integrated optimiza-tion of the distribution of biomass among the sectors.
7 The Green-X model was originally developed under Microsoft Windows by EEG in the EC-funded project Green-X
(5th FWP – DG Research, Contract No: ENG2-CT-2002-00607). For more details see: http://www.green-x.at

RES 2020 - Least Cost
4
While in the political discussions RES targets are based on the EUROSTAT method, the cost optimisation in the Green-X model is based on an extended substitution principle.8 By using this approach the saved amount of conventional energy for a given target is maximised which therewith is a very good proxy for the key energy policy objectives of the EU on security of sup-ply and climate change. The cost optimisation is a good indicator for other key objectives of the EU such as competitiveness of the European markets and other objectives formulated in the Lisbon agenda. The modelling approach is policy neutral in the sense that it does not assume a specific policy framework. Besides the overall least-cost optimization no support scheme for RES or sector-/ country-specific target is assumed. Hence, the least-cost approach does not represent a simula-tion of any policy framework. Therefore intermediate results (e.g. for 2010) do not necessarily coincide with existing RES targets, nor are they a forecast for the situation in 2010 based on the current regulatory framework.
8 The main difference between both methods is in their treatment of RES-E. Under the substitution method, the con-
tribution of RES-E counts for about 2½ times as much primary energy as under the EUROSTAT method, because the conventional fuels substituted are taken into account. In this study we use this principle for all RES technolo-gies.

RES 2020 - Least Cost 5
3 Scenario parameters and sensitivity cases The RES2020 reference scenario describes a least-cost scenario in which a target of 20% RES is achieved in the year 2020. This section describes the parameters used for the scenario runs. Overall a conservative approach has been taken in terms of assumptions e.g. with respect to technology learning of RES technologies.
Overview of parameters and sensitivity cases In order to ensure maximum consistency with existing EU scenarios and projections key RES2020 reference scenario parameters are derived from the PRIMES modelling and from the FORRES 2020 study. Table 1 shows which parameters are based on PRIMES and which have been defined for this study.
Table 1 Input sources for parameters Based on PRIMES Defined for this study Sectoral energy demand 20% target Primary energy prices Reference electricity prices Conventional supply portfolio and conversion efficiencies RES cost (incl. biomass)
CO2 intensity of sectors RES potential (FORRES) Biomass import restrictions Technology diffusion Learning rates The costs and benefits of RES are largely affected by variations in key parameters such as en-ergy demand, energy and CO2 prices or the availability of biomass. To enable better informed policy making seven sensitivity cases have been defined next to the RES2020 reference sce-nario. In six out of seven sensitivity cases only one parameter is changed, all other parameters remain as in the RES2020 reference scenario. In one sensitivity case the combined effect of Higher energy prices & Accelerated technological learning is analysed. An overview of the main sce-nario parameters and the conducted sensitivity cases is shown in Table 2 below. Following the table a more detailed description of the parameters and sensitivity cases is given.

RES 2020 - Least Cost
6
Table 2 Overview of parameters in the RES2020 reference scenario and the sensitivity cases Parameter RES2020 reference
scenario Sensitivity case Title of sensitivity case Energy demand / energy efficiency policy
PRIMES energy efficiency scenario
PRIMES baseline scenario Less energy efficiency policies
Energy prices PRIMES reference prices
PRIMES high en-ergy price scenario Higher energy prices
CO2 prices 20 €/t 50 €/t Higher CO2 prices
RES potential
FORRES 2020 & Import limited to 15% of solid bio-mass and 30% of
biofuel use
FORRES 2020 & No import to EU No import of biomass to the EU
RES target 2020 20% 16%, 18% and 22% Variation in RES targets
RES cost Learning rates & expert forecast
+/- 15% to default learning rates
Accelerated or decelerated technological learning
PRIMES high en-ergy price and 15% to default learning
rates
Higher energy prices & Accelerated technological learning
Energy demand The energy consumption data for the RES2020 reference scenario are based on the PRIMES energy efficiency scenario, which assumes a 13.5% increase in energy efficiency compared to the PRIMES baseline scenario. In one sensitivity case the impact of significantly lower energy efficiency efforts is analysed. The energy demand data used in this sensitivity case correspond with the data used in the PRIMES baseline scenario. Table 3 provides the energy consumption parameters for the RES2020 reference scenario and the sensitivity case with Less energy effi-ciency policies.
Table 3 Energy consumption parameters Parameter RES2020 reference scenario
2005 2010 2020
Less energy efficiency policies (sensitivity case)
2010 2020 Total consumption in TWh (Eurostat convention) (Mtoe in brackets)
20314 20739 19808 (1747) (1783) (1703)
21286 22482 (1830) (1933)
Gross electricity consumption in TWh 3206 3390 3390 3509 4030 Gross heat consumption in TWh (Mtoe in brackets)
6860 6975 6785 (590) (600) (583)
7160 7560 (616) (650)
Gross consumption of transport fuels in TWh (Mtoe in brackets)
4119 4261 4207 (296) (311) (312)
4353 4642 (313) (332)
Note: Data for total consumption was initially taken from PRIMES (efficiency respectively baseline), but had to be endogenously corrected within Green-X due to the differing RES penetration. Expressed figures refer to the output of the Green-X model runs - i.e. the RES2020 reference scenario (left) respectively the sensitivity case on less energy efficiency policies (right). Please note that Gross heat consumption as expressed in Table 3 summarises the final residual demand for energy of all relevant economic activities, i.e. comprising the sectors of industry, service and agriculture as well as the residential sector. Residual in that sense as it excludes consumption of electricity, transport fuels and, besides district heat supply, inputs to other transformation proc-esses as well as non-energetic uses.

RES 2020 - Least Cost 7
Fossil fuel and reference energy prices National reference energy prices are based on calculations done in line with corresponding PRIMES baseline scenario assumptions. In particular for the electricity sector such reference prices are taken from the Green-X model. Based on the primary energy prices, the CO2-price and the country-specific power sector, the country-specific electricity price is modelled.
0
10
20
30
40
50
60
70
80
90
2000 2005 2010 2015 2020
Prim
ary
ener
gy p
rices
[$20
05/b
oe]
Oil - baseline
Oil - high price
Gas - baseline
Gas - high price
Coal - baseline
Coal - high price
Figure 1 Primary energy price assumptions (source: PRIMES scenarios) Compared to current energy prices the price assumptions in the PRIMES energy efficiency and baseline scenario are low for the later years up to 2020. A sensitivity analysis is therefore con-ducted for Higher energy price assumptions, taken from the PRIMES high energy price sce-nario. Figure 1 provides the development of energy prices assumed in both cases.
CO2 prices The CO2-price in the RES2020 reference scenario is exogenously set at 20 €/t, again similar to existing EU scenarios. A sensitivity case is defined with a Higher CO2-price of 50 €/t. In the model, it is assumed that CO2-prices are passed through to electricity prices. This is done fuel-specific based on the PRIMES CO2-emission factors. Increased RES-deployment can have a CO2-price reducing effect as it reduces the demand for CO2-reductions. As RES-deployment should be anticipated in the EU Emission Trading System and the CO2-price in the RES2020–scenarios is exogenously set, this effect is not included, which is a rather conservative approach.
RES-potential A broad set of different renewable energy technologies exists today. Obviously, for a compre-hensive investigation of the future development of RES it is of crucial importance to provide a detailed investigation of the country-specific situation – e.g. with respect to the potential of the certain RES in general as well as their regional distribution and the corresponding generation cost. Major efforts have been recently taken within the study “FORRES 2020” to assess

RES 2020 - Least Cost
8
Europe’s RES resource base in a comprehensive manner. Consequently, this project directly builds on these consolidated outcomes as presented in the Commission’s Communication ‘The share of renewable energy’. Given the overall optimisation across sectors the availability of biomass and the allocation of biomass resources across sectors are crucial. The total domestic availability of solid biomass was set at 219 Mtoe/yr. Biomass data has been cross-checked with DG TREN, EEA and the GEMIS database.9 In the RES2020 reference scenario we assume that biomass can be im-ported to the European market. Specifically: • Solid biomass in the form of wood products and wood residues can be imported to a maxi-
mum of 15% of the total additional primary input. • Liquid biofuel in the form of ethanol and biodiesel products can be imported to a maximum
of 30% of the total biofuel output. A sensitivity case analyses the effect that a waiving of biomass imports to the EU would have on RES-deployment (sensitivity case No import of biomass to the EU).
RES-targets The RES2020 reference scenario assumes achieving a target of 20% RES in the year 2020.10 As the current political debate among others concentrates on this long-term target setting, sen-sitivity cases are conducted to analyse the effect of a lower or higher RES-target (16%, 18% or 22% instead of 20%) on additional RES generation costs and the deployment of various RES technologies (sensitivity case Variation in RES-target).
RES-cost Parameters on long-term cost developments of RES in the RES2020 reference scenario are based on the FORRES 2020 project. Costs are adapted endogenously on the basis of technol-ogy-specific learning rates. Exceptions to this rule are the cost developments specified for solar thermal, tidal and wave energy, for which expert cost forecasts are used. In order to obtain a better understanding on the relation between long-term cost developments and resulting overall costs of meeting future RES targets, the rate of technology learning is varied in sensitivity cases. Model results are obtained for Accelerated and Decelerated technological learning, as-suming a 15% higher and lower learning rate for each technology (compared to default learning rates), respectively. Prices for imported biomass are set exogenously: • The price of imported wood is set country specific, indicating trade constraints and transport
premiums. On European average a figure of 16 €/MWh occurs at present. • The price of imported biofuels is assumed to equal a European average of 62 €/MWh.
9 For example the recent EEA report "How much bio-energy can Europe produce without harming the environment?"
gives 235 Mtoe in 2020 for total biomass under the assumption of significant ecological constraints on biomass use.
10 The target of 20% is based on the Eurostat convention. This corresponds to 24.8% based on the classical substi-tution principle and 22.3% based on the extended substitution principle used in this study.

RES 2020 - Least Cost 9
4 Key Results This section presents the main results obtained from the modelling calculation for the RES2020 reference scenario. Where results are very sensitive to changing parameters, the respective results from the sensitivity analysis are also given. Table 4 shows that the least-cost achievement of a 20% RES target in the year 2020 is achieved with a relatively high share of renewable electricity. This is clearly affected by the methodological choice of least-cost optimisation using the substitution principle as this favours among others wind power. The share of biofuels in transport fuel demand remains in this least cost scenario very low in the first years, but reaches 10.6% in 2020.11 Figure 2 pictures the de-velopment in the share of RES over time. Results on the sector-, technology- and country-specific RES-deployment are provided at the end of this section.
Table 4 Share of renewables in electricity, heat and transport fuel demand 2004 2010 2020
Share of RES-E in electricity demand 13.6% 25.6% 42.8%
Share of RES-H in heat demand 8.4% 11.3% 16.3%
Share of RES-T in transport fuel demand 0.6% 0.7% 10.6%
Share of RES in primary demand - Eurostat convention
6.1% 10.7% 20.0% -Classical Substitution principle 9.4% 14.5% 24.8%
0%
5%
10%
15%
20%
25%
30%
35%
40%
45%
2005
2006
2007
2008
2009
2010
2011
2012
2013
2014
2015
2016
2017
2018
2019
2020
RES
-dep
loym
ent -
in re
lativ
e te
rms
(i.e
. as
shar
e of
cor
resp
ondi
ng
gros
s de
man
d) [%
]
RES-electricity (& CHP)
RES-heat
RES-transport
RES primary(substitution)
Figure 2 Projected shares of RES-E, RES-H, RES-T and total RES (2005-2020)
11 This study compares biofuel production to the total transport fuel demand (excluding electricity), while
the target setting in the biofuels directive is based on road transport demand. In 2020 road transport demand makes up 86% of total transport fuel demand according to the PRIMES efficiency scenario. 10.6% of total transport fuel demand would correspond to 12.5% of road transport demand.

RES 2020 - Least Cost
10
Effect on CO2-emissions The additional RES-deployment in the RES2020 reference scenario reduces CO2-emissions by 369 Mt/yr in 2010, 677 Mt/yr in 2015 and 892 Mt/yr in 2020, which in 2020 corresponds to 17% of total EU 25 GHG emissions in 199012. Figure 3 shows the development of avoided CO2-emissions over time and the split-up in electricity, heat and biofuels.
0
100
200
300
400
500
600
700
800
900
1.000
2005
2006
2007
2008
2009
2010
2011
2012
2013
2014
2015
2016
2017
2018
2019
2020
Avo
ided
CO
2 em
issi
ons
(due
to n
ew R
ES p
lant
(2
005
to 2
020)
) [M
t CO
2]
RES-T - imports
RES-T - 2nd generation
RES-T - 1st generation
RES-H - non grid
RES-H - district heat
RES-E&H - CHP
RES-E - pure power
Note that 2nd generation biofuels are more efficiently produced than 1st generation biofuels and thus avoid more CO2 per litre. For biofuel imports CO2 emissions during production are not considered as they occur in the exporting countries.
Figure 3 Avoided CO2-emissions from new RES deployment (2005-2020) The amount of avoided CO2-emissions is obviously sensitive to a Variation in RES targets. In case of an 18% target instead of the 20% target in the RES2020 reference scenario 8.9% less CO2 would be avoided, while a 22% target would lead to an increase of 7.4% in avoided emis-sions. In case of Less energy efficiency policies more RES would be produced and thus avoided CO2-emissions would increase by 6.9%.
Effect on security of supply The increased RES-deployment in the RES2020 reference scenario reduces fossil fuel demand and therewith is an important element in improving the security of energy supply in Europe. In 2020 the avoided oil consumption due to new RES capacities installed between 2005 and 2020 equals 12% of the default total EU oil import.13 In the case of gas, it equals 30% of the default EU gas import needs by 2020. In the year 2020 a total of 57 billion € per year can be saved on fossil fuels. Table 5 provides the major results of the RES2020 reference scenario in terms of avoided fuels and the corresponding avoided fossil fuel expenses, particularly for imports of fossil fuels.
12 GHG emissions in 1990, the base year of the Kyoto Protocol, were 5231 Mt CO2 equivalents according to EEA
Technical Report No 6/2006: Annual European Community greenhouse gas inventory 1990–2004 and inventory report 2006.
13 Default import needs are based on the PRIMES efficiency case (-13.5% demand), assuming no addi-tional deployment of RES between 2005 and 2020 and a constant import share.

RES 2020 - Least Cost 11
Table 5 Effect of the RES2020 reference scenario on security of supply in 2020 (impact of new RES installations)
These figures are very sensitive to energy prices. Higher energy prices would increase the a-mount of avoided fossil fuel expenses over the period 2005-20 by 40% compared to the RES2020 reference scenario. In case of an 18% target instead of the 20% target in the RES2020 reference scenario 12.2% less fossil fuel cost would be avoided, while a 22% target would lead to an increase of 12% in avoided cost. The amount of avoided oil import is highly correlated with the use of biofuels, which in turn is also very sensitive to biomass import restric-tions and lower RES-targets (see technology-specific results at the end of this section).
Effect on investments and costs The increased RES-deployment in the RES2020 reference scenario will lead to investments of 627 billion € almost evenly spread over the period 2005-20. Of the total amount 331 billion € will be invested in pure RES-E (53%), 183 billion € in pure RES-H (29%), 83 billion € in RES-CHP (13%) and 30 billion € in RES-T (5%). In the RES2020 reference scenario generation cost exceed the generation cost that would re-sult from conventional supply options in accordance with the PRIMES efficiency scenario. Aver-age specific additional generation cost related to energy output over the period 2005-20 are 15.6 €/MWh for RES-E, 2.0 €/MWh for RES-H and 20.8 €/MWh for biofuels. Table 6 provides additional generation costs for 5year-periods and for 2005, the first year of the model runs. The costs are also expressed as a share of GDP. Specific results for the electricity prices can be found on page 12.
Table 6 Average annual additional generation costs in the RES2020 reference scenario (2005 to 2020)
2005 2006-10 2011-15 2016-20 2005-2020 Additional generation cost - in billion€/yr
- as share of GDP (%) 0.5
0.00% 2.8 0.03%
13.7 0.12%
25.5 0.19%
13.2 0.11%
Note that data for the year 2005 are modelling results which do not necessarily match with actual data.
RES2020 reference scenario in 2020
Coal Oil Gas Total in 2020 as share of GDP
Avoided fuels 143 MtSKE/yr 75.4 Mtoe/yr 165 Bill.m3/yr 301 Mtoe/yr - Avoided fuels as share of default net import needs
67% 11% 29% - -
Avoided fuels as share of gross fuel demand
39% 11% 25% - -
Avoided expenses on fossil fuels
8.3 billion€/yr 21.4 billion€/yr 27.3 billion€/yr 57.0 billion€/yr 0.42%
RES 2020 - Least Cost
12
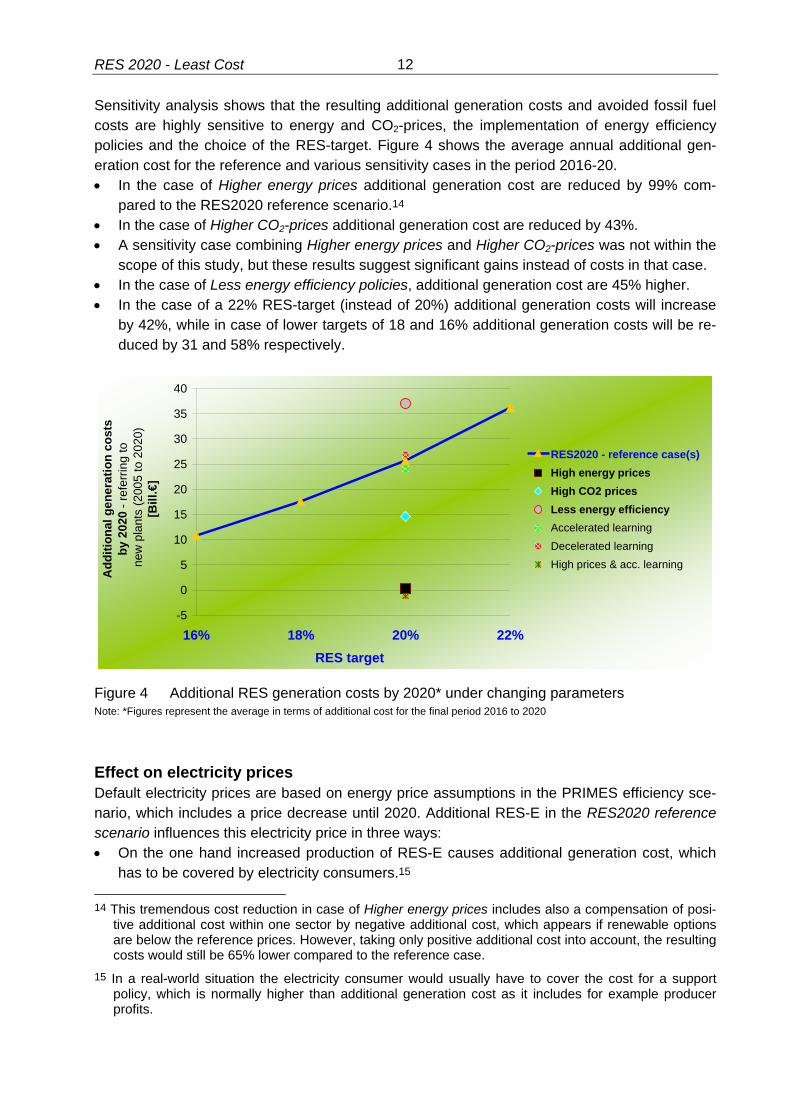
Sensitivity analysis shows that the resulting additional generation costs and avoided fossil fuel costs are highly sensitive to energy and CO2-prices, the implementation of energy efficiency policies and the choice of the RES-target. Figure 4 shows the average annual additional gen-eration cost for the reference and various sensitivity cases in the period 2016-20. • In the case of Higher energy prices additional generation cost are reduced by 99% com-
pared to the RES2020 reference scenario.14 • In the case of Higher CO2-prices additional generation cost are reduced by 43%. • A sensitivity case combining Higher energy prices and Higher CO2-prices was not within the
scope of this study, but these results suggest significant gains instead of costs in that case. • In the case of Less energy efficiency policies, additional generation cost are 45% higher. • In the case of a 22% RES-target (instead of 20%) additional generation costs will increase
by 42%, while in case of lower targets of 18 and 16% additional generation costs will be re-duced by 31 and 58% respectively.
-5
0
5
10
15
20
25
30
35
40
16% 18% 20% 22%RES target
Add
ition
al g
ener
atio
n co
sts
by 2
020
- ref
errin
g to
new
pla
nts
(200
5 to
202
0)
[Bill
.€]
RES2020 - reference case(s)High energy pricesHigh CO2 pricesLess energy efficiencyAccelerated learningDecelerated learningHigh prices & acc. learning
Figure 4 Additional RES generation costs by 2020* under changing parameters Note: *Figures represent the average in terms of additional cost for the final period 2016 to 2020
Effect on electricity prices Default electricity prices are based on energy price assumptions in the PRIMES efficiency sce-nario, which includes a price decrease until 2020. Additional RES-E in the RES2020 reference scenario influences this electricity price in three ways: • On the one hand increased production of RES-E causes additional generation cost, which
has to be covered by electricity consumers.15 14 This tremendous cost reduction in case of Higher energy prices includes also a compensation of posi-
tive additional cost within one sector by negative additional cost, which appears if renewable options are below the reference prices. However, taking only positive additional cost into account, the resulting costs would still be 65% lower compared to the reference case.
15 In a real-world situation the electricity consumer would usually have to cover the cost for a support policy, which is normally higher than additional generation cost as it includes for example producer profits.

RES 2020 - Least Cost 13
• On the other hand increased production of RES-E reduces the demand for conventionally generated power, thus decreasing the wholesale price for electricity.
• Some RES-E cause additional cost for grid extension and system operations (such as bal-ancing, capacity reserve). On the other hand RES-E can save transmission costs due to more distributed generation. While the first are considered in the RES2020 reference sce-nario, the latter are not, which underlines the conservative approach of this study.
Table 7 provides an overview of the impact of additional RES-E deployment on the European electricity prices. It indicates that the overall electricity price increase of RES-E deployment, including grid extension, balancing and capacity effects) would be 7.3% of the default reference electricity price in 2016-2020.
Table 7 Impact of additional RES-E in the RES2020 reference scenario on electricity prices (2005-2020)
(Prices in €/MWh of gross energy demand) 2005 2006-10 2011-15 2016-20Default reference electricity price 56.3 54.4 49.2 49.2Reference price reduction (due to increased RES-E deployment) -1.9 -1.1 -2.1 -3.0Average Additional generation cost (for new RES-E plant) 0.2 0.8 3.3 5.5Additional cost for grid extension & system operation (for wind energy) 0.1 0.2 0.5 1.1Resulting electricity price 54.6 54.3 50.9 52.8% deviation to default reference price -3.0% -0.2% 3.5% 7.3%
Note: Reference electricity prices represent prices on the wholesale electricity market, which do not include transmission, distribu-tion and taxes. They are taken from the Green-X model where the European electricity market is modelled and country-specific electricity prices are derived. The calculations are done in line with PRIMES demand and primary energy price assumptions. Thereby as default a carbon price of 20 €/ton of CO2 is passed through to the wholesale market.
Effect on sector-specific RES-deployment
0%
2%
4%
6%
8%
10%
12%
14%
16%
18%
20%
2005
2006
2007
2008
2009
2010
2011
2012
2013
2014
2015
2016
2017
2018
2019
2020
RES
dep
loym
ent
- in
term
s of
prim
ary
ener
gy[%
- on
prim
ary
cons
umpt
ion] RES-T - imports
RES-T - 2nd generation
RES-T - 1st generation
RES-H - non grid
RES-H - district heat
RES-E&H - CHP
RES-E - pure power
RES - stock
New
pla
nt
(200
5 to
202
0)
… Existing plant (up to 2004)
Figure 5 Deployment of RES-technologies in terms of primary energy until 2020

RES 2020 - Least Cost
14
The sector-specific deployment of RES in the RES2020 reference scenario is shown in Figure 5. To meet the 20% target, large increases are required in all three sectors. The results show that the least-cost approach requires the fastest growth in CHP based on renewables and in pure RES-E. The share of RES-E in total primary energy consumption will more than triple from about 4% in 2005 to 13% in 2020, while RES-H doubles from 2 to 4%. Although growth rates for RES-T are impressive, the share of RES-T in primary energy consumption will only start to be-come significant after 2010, with an increase to about 3% in 2020. Results of the sensitivity analysis for the division among sectors are depicted in Figure 6 (see next page). It shows the energy output for the RES2020 reference scenario for RES-E, RES-H and RES-T (bar charts; sectors from top to bottom). Next, it shows for each of the sensitivity cases the deviation to the value under the RES2020 reference scenario. Note that the scales differ between sectors. So comparisons across sectors should be carefully made. The division of RES among the three sectors is very sensitive to energy and CO2 prices, the exis-tence of strong energy efficiency policies, the variation of the RES-target, and to biomass imports. • Higher energy prices (especially oil prices) make biofuels more competitive – more biofuels
and less RES-E would be produced. • Higher CO2-prices have the reverse effect as RES-E becomes more competitive due to
higher electricity prices - more RES-E and less biofuels would be produced. • In case of Less energy efficiency policies more RES is needed - especially the RES-H pro-
duction would increase. • No biomass imports would reduce the competitiveness of biofuels - resulting in a signifi-
cantly lower share of biofuels and a higher share of RES-H. However, the split between sec-tors is rather insensitive to minor changes of the biomass parameters (price and potential).
• Target variations impact especially the share of biofuels and RES-H - with lower targets the share of biofuels rapidly reduces as it clearly is the marginal option for meeting the 20% tar-get in a least-cost scenario. When higher shares of RES are imposed the use of RES-H in-creases rapidly.
RES-E production would: • decrease by 7.1% in case of Higher energy prices; • increase by 4.2% in case of Higher CO2-prices. RES-H production would: • increase by 34.9% in case of Less energy efficiency policies; • increase by 24.8% when the RES-target is raised to 22%; • increase by 14.4% when import of biomass to the EU market is waived. Biofuel production would: • decrease by 40.3% when import of biomass to the EU market is waived; • decrease by 32.9% when the RES-target is lowered to 18%; • increase by 26.2% in case of Higher energy prices.

RES 2020 - Least Cost 15
RES-Electricity
75
85
95
Ener
gy o
utpu
t by
2020
[Mto
e/yr
]
RES-Heat
60
80
100
120
Ener
gy o
utpu
t by
2020
[Mto
e/yr
]
RES-biofuels
0
10
20
30
40
50
RES2020 Lessenergy
efficiency
Highenergyprices
HigherCO2
prices
Acc.learning
Dec.learning
Highenergy
prices &Acc
learning
Target22%
Target18%
Target16%
Nobiomass
import
Ener
gy o
utpu
t by
2020
[Mto
e/yr
]
Figure 6 Overview of results for the sensitivity cases (compared to the RES2020 scenario): RES energy output by 2020 referring to new plants (installed 2005 to 2020).
Effect on technology-specific RES-deployment Table 8 shows the technology details for the projected RES penetration in the RES2020 refer-ence scenario.

RES 2020 - Least Cost
16
Table 8 RES penetration at detailed technology level in the RES2020 reference scenario (2005-2020)
New plant (2005 to 2020) All plant (RES in total) 2005 2010 2015 2020 2020
Energy output – technology-specific breakdown TWh TWh TWh TWh % % TWh % %
of
sectoral RES-total
of RES-total
of sectoral RES-total
of RES-total
RES-Electricity Biogas 2.1 21.8 59.3 88.0 8.5% 3.7% 100.5 6.9% 3.3% Solid biomass 25.4 179.8 245.5 284.9 27.7% 11.9% 307.5 21.2% 10.2% Biowaste 3.5 12.5 15.4 18.9 1.8% 0.8% 30.2 2.1% 1.0% Geothermal electricity 0.5 1.7 2.1 2.4 0.2% 0.1% 8.0 0.6% 0.3% Hydro large-scale 7.2 33.6 42.4 45.1 4.4% 1.9% 332.7 22.9% 11.1% Hydro small-scale 0.8 15.6 21.3 23.1 2.2% 1.0% 62.7 4.3% 2.1% Photovoltaics 0.0 0.0 0.0 0.0 0.0% 0.0% 0.7 0.0% 0.0% Solar thermal electricity 0.0 0.1 4.8 13.2 1.3% 0.6% 13.2 0.9% 0.4% Tide & wave 0.0 4.7 17.2 49.3 4.8% 2.1% 49.3 3.4% 1.6% Wind onshore 14.5 117.6 208.1 254.7 24.7% 10.6% 295.2 20.3% 9.8% Wind offshore 1.5 28.4 145.8 249.7 24.3% 10.4% 251.3 17.3% 8.4%RES-E total 55.5 415.7 762.1 1.029.4 42.9% 1.451.5 48.4% of which RES-CHP 16.7 139.9 194.8 226.9 22.0% 9.5% 254.9 17.6% 8.5%RES-Heat Biogas (grid) 0.1 1.2 3.3 5.3 0.6% 0.2% 5.3 0.5% 0.2% Solid biomass (grid) 17.8 198.4 279.0 304.6 32.9% 12.7% 362.7 32.8% 12.1% Biowaste (grid) 6.1 20.0 24.6 29.8 3.2% 1.2% 61.9 5.6% 2.1% Geothermal heat (grid) 0.2 1.9 3.6 6.6 0.7% 0.3% 12.5 1.1% 0.4% Solid biomass (non-grid) 6.2 184.7 350.8 458.1 49.5% 19.1% 533.3 48.3% 17.8% Solar thermal heating and Hot water 2.5 17.7 30.9 56.6 6.1% 2.4% 63.2 5.7% 2.1%
Heat pumps 0.0 0.0 12.0 63.7 6.9% 2.7% 66.4 6.0% 2.2%RES-H total 33.0 423.9 704.2 924.7 38.6% 1.105.2 36.8% of which RES-H CHP 20.6 174.3 227.2 256.9 27.8% 10.7% 339.8 30.7% 11.3% of which RES-H distr. heat. 3.6 47.1 83.3 89.4 9.7% 3.7% 102.5 9.3% 3.4% of which RES-H non-grid 8.7 202.4 393.7 578.4 62.6% 24.1% 662.9 60.0% 22.1%RES-Transport Traditional biofuels 0.6 23.5 58.6 46.5 10.5% 1.9% 46.5 10.5% 1.5% Advanced biofuels 0.0 0.0 62.0 202.9 45.6% 8.5% 202.9 45.6% 6.8% Biofuel import 0.0 4.6 84.0 195.1 43.9% 8.1% 195.1 43.9% 6.5%RES-T total 0.6 28.1 204.6 444.5 18.5% 444.6 14.8%
Some of the most prominent conclusions drawn from this table include: • The bulk of RES-E in 2020 will be produced by technologies that are currently already close
to the market: Large-scale hydro (333 TWh/yr), solid biomass (307 TWh/yr), onshore wind (295 TWh/yr), offshore wind (251 TWh/yr), biogas (100 TWh/yr), small hydro (63 TWh/yr) and biowaste (30 TWh/yr) will contribute about 95% to RES-E production.
• The more expensive technologies, such as PV (0.7 TWh/yr) and geothermal electricity (8 TWh/yr) will not be able to develop significantly under a least-cost approach.
• Technologies such as tidal & wave, solar thermal electricity and offshore wind show the most impressive growth rates. However, out of these three only offshore windpower is able to obtain a significant market share.
• Biomass plays a crucial role in meeting RES targets. In the RES2020 reference scenario cofiring of biomass reaches 72 TWh/yr in CHP generation and an additional 66 TWh/yr in pure electricity production. Biomass will become even more important for the development

RES 2020 - Least Cost 17
of RES-H. In 2020 over 80% of total RES-H generation comes from solid biomass. The least-cost approach favours especially the use of biomass in small scale heat, district heat-ing, cofiring and CHP.
• Under a least-cost approach RES-T only takes off after 2010, when the cheaper RES op-tions are exploited and when the more efficient RES-T production technologies become available on the market. A large part of this increase uses 2nd generation biofuel technolo-gies such as BTL.
• In the RES 2020 scenario 86% of domestic potential of solid biomass (188 Mtoe) is used and another 26.4 Mtoe is imported. Imports consist of 9.6 Mtoe forest products and residues and 16.8 Mtoe of biofuels.
Effect on country-specific RES-deployment Current RES-deployment and potentials vary largely among EU Member States. This obviously affects the additional country-specific RES-deployment shown in the modelling results. Table 9 provides the development of the RES-share for all Member States until 2020 in the RES2020 reference scenario. The figures provided should only be considered as model results to show the division across countries in case of least-cost optimisation, not to predict any specific coun-try targets. The model results show that in order to reach a 20% share of RES in Europe strong efforts are needed in every Member State. However, the distribution of the target across Mem-ber States is not necessarily even, as the costs of an increase in RES largely vary as well.
Table 9 Share of RES-production in primary energy consumption in the RES2020 reference scenario
2004 2010 2020 2004 2010 2020
Austria 21% 26% 34% Cyprus 4% 5% 12%Belgium 1% 3% 8% Czech Republic 3% 7% 14%Denmark 14% 18% 40% Estonia 11% 22% 50%Finland 24% 29% 46% Hungary 4% 11% 21%France 6% 10% 19% Latvia 25% 27% 58%Germany 4% 7% 17% Lithuania 10% 20% 44%Greece 5% 11% 21% Malta 0% 6% 10%Ireland 2% 10% 25% Poland 5% 13% 21%Italy 6% 12% 18% Slovakia 4% 10% 15%Luxembourg 1% 3% 8% Slovenia 12% 21% 34%Netherlands 2% 4% 9% EU 25 6.1% 10.7% 20.0%Portugal 15% 25% 36% Spain 6% 13% 21% Sweden 26% 28% 48% United Kingdom 1% 5% 14%

RES 2020 - Least Cost
18
5 Conclusions 1) RES policies should be supported by a strong energy efficiency policy In the absence of strong energy efficiency policies energy demand is higher and more RES is required in order to achieve the targeted share of 20%. In that case more expensive RES tech-nologies have to be utilised and the average additional generation cost increase from yearly 26 billion € to 37 billion € in the years 2016-20. This calls for energy efficiency policy and RES policy to work as complementary tools for creating a more sustainable energy system in an economically efficient way. 2) RES as an important contribution to meeting EU GHG reduction targets A strong expansion of renewable energy can be an important element in European GHG reduc-tion policies. The deployment of new RES installations in the period 2005 to 2020 as projected in the RES2020 reference scenario results in a total reduction of CO2-emissions by 892 Mt/yr in 2020, which corresponds to 17% of EU-25 GHG emissions in 1990. The future framework for support of RES should take into account this important benefit of RES. 3) Increased RES deployment brings large benefits to EU security of supply The increased RES-deployment due to new RES installations in the RES2020 reference sce-nario leads to a reduction in fossil fuel demand of annually 301 Mtoe in 2020. Oil imports can be reduced by 12%, gas imports by 30% and coal imports even by 67%. This will significantly in-crease the EU’s security of supply. In 2020 57 billion € can be saved on fossil fuels, which cor-responds to 0.42% of GDP. In the sensitivity case with Higher energy prices saved expenses for fossil fuel in the period 2005-20 would increase by another 40%. In that situation the 20% target could be achieved almost cost-neutral, which illustrates the ability of RES to protect the EU economy against rising fossil fuel prices. The financial support provided to increase the support of RES in the coming years should reflect these benefits to EU security of supply. 4) Increased penetration of RES does have a price... The RES2020 reference scenario requires additional generation cost of yearly 26 billion € in 2016-20. The costs are strongly influenced by energy price assumptions. Whereas assumptions in the RES2020 reference scenario are much below current prices (e.g. an oil price of 48 $/boe in 2020), a sensitivity analysis that reflects current prices (Higher energy prices with oil price of 78 $/boe in 2020) reduces additional generation cost to annually 0.2 billion € in 2016-20.16 In contrast to primary energy prices, less sensitivity can be observed with regard to technology progress. However, if additionally Accelerated technological learning is assumed yearly about 1 billion € can be gained in future years, i.e. in the period 2016-20.
16 This should not be misinterpreted in a way that under high energy prices no further support is required
to achieve the 20% RES-target. Expressed additional costs refer to the period 2016-20. Therefore, they represent a likely future, if intensive support incentives are set by now. For more details please see sections 2 and 5.

RES 2020 - Least Cost 19
5) … but the resulting electricity price in 2020 stays below current price levels A significant part of additional generation costs and costs for grid extension and system opera-tions are recovered by the reduction of wholesale electricity prices obtained from increased RES-E generation. The net electricity price increase including price effects of grid extension and system operation would be limited to 3.6 €/MWh in the years 2016-20. 6) Strong growth is needed in all three sectors A 20% share of renewable energy supply in the year 2020 cannot be reached without strong increases in all three sectors: renewable electricity, heat and biofuels. Strong growth has to con-tinue in RES-E but also the share of RES-H should rapidly increase in the short term. Increase in transport fuels from renewables in the least-cost scenario will require strong growth only after 2010. The future policy framework should address this need for growth in all sectors. The cur-rent policy framework does include an extensive set of supporting mechanisms for RES-E and to some extent for biofuels, but the current limited and dispersed support for RES-H needs to be addressed if renewable heating is to play its essential role as part of the renewable mix. 7) A wide range of technologies has to be supported A policy approach based on cost minimisation would still need to support a wide range of tech-nologies: large-scale hydropower, solid biomass (for generation of both heat and power) and onshore wind power will be complemented by large amounts of offshore wind power, biogas and small hydropower. Associated costs vary largely between technologies and over time and a support policy aiming at cost minimisation would need to reflect this. A least-cost approach does not support the more expensive technologies, which is less desir-able from a perspective of creating economies of scale for technologies as well as increasing technological learning that are considered necessary for meeting longer-term policy objectives. A policy framework that aims at securing such longer-term options should therefore pay specific attention to including these dynamic effects. 8) Efforts are needed in all Member States The model results show that important contributions from all Member States are required to meet a 20%-target at least cost. Thus, if some Member States fail to exploit their potentials, meeting the target will become increasingly difficult and expensive. But a least-cost approach does not lead to nor requires an even distribution of RES over Europe, as it assumes RES penetration there where it is cheapest. The design of any future policy framework that aims at combining meeting ambitious targets with cost-effectiveness across Europe should take this into account. 9) The RES policy framework needs an integrated perspective on the use of biomass Biomass is a crucial element of RES policy, used in all three sectors (RES-E, RES-H and RES-T). In the RES2020 reference scenario the larger part (86%) of domestic biomass potential is used. Additional biomass imports contribute to keeping costs low. In the least-cost approach the biofuel market is developing less compared to the RES-E and RES-H markets. This is however strongly influenced by primary energy prices and the level of the target. Biofuels would in any case take off after 2010.

RES 2020 - Least Cost
20
The least-cost approach analysed in this study shows that a policy framework that aims at com-bining meeting ambitious targets with cost-effectiveness across Europe must include the cheaper options such as small scale heat, CHP, district heating, and co-firing, ensure overall consistency of RES policy across sectors, and take into account the actual energy and GHG benefits in the supporting framework. Otherwise meeting ambitious targets will become either increasingly difficult or increasingly expensive.