economic analysis of an organosolv process for bioethanol
TRANSCRIPT

PEER-REVIEWED ARTICLE bioresources.com
Kautto et al. (2014). “Organosolv & bioethanol costs,” BioResources 9(4), 6041-6072. 6041
Economic Analysis of an Organosolv Process for Bioethanol Production
Jesse Kautto,a,b,* Matthew J. Realff,c Arthur J. Ragauskas,d and Tuomo Kässi b
In a previous paper, conceptual process design, simulation, and mass and energy balances were presented for an organosolv process with a hardwood feed of 2350 metric tons (MT) per day and ethanol, lignin, furfural, and acetic acid production rates of 459, 310, 6.6, and 30.3 MT/day, respectively. In this paper, the investment and operating costs of the process and the minimum ethanol selling price (MESP) to make the process economically feasible were estimated. The total capital investment of the plant was approximately 720 million USD. Lignin price was found to affect the MESP considerably. With a base case lignin price of 450 USD/MT, the MESP was approximately 3.1 USD per gallon (gal). Higher lignin price of 1000 USD/MT was required to equal the MESP with the December 2013 ethanol market price (2.0 USD/gal). In addition to lignin price, the MESP was found to be strongly affected by feedstock, enzyme, and investment costs. Variations in feedstock and investment costs affected the MESP by approximately 0.2 and 0.5 USD/gal, respectively. Changing the enzyme dosage and price from base case estimate of 5270 USD/MT and 0.02 g/g cellulose to more conservative 3700 USD/MT and 0.06 g/g cellulose, respectively, increased the MESP by 0.59 USD/gal.
Keywords: Organosolv; Economic assessment; Pretreatment; Bioethanol; Lignin; Simulation
Contact information: a: Institute of Paper Science and Technology, Georgia Institute of Technology, 500
10th Street N.W., Atlanta, Georgia 30332, USA; b: School of Industrial Engineering and Management,
Department of Innovation Management, Lappeenranta University of Technology, Skinnarilankatu 34,
Lappeenranta 53850, Finland; c: School of Chemical and Biomolecular Engineering, Georgia Institute of
Technology, 311 Ferst Drive N.W., Atlanta, Georgia 30332, USA; d: School of Chemistry and
Biochemistry, Institute of Paper Science and Technology, Georgia Institute of Technology, 500 10th Street
N.W., Atlanta, Georgia 30332, USA; *Corresponding author: [email protected]
INTRODUCTION
The production of bioethanol from lignocellulosic material has been seen as a
potential way to reduce carbon dioxide emissions and dependence on fossil fuels
(Hamelinck et al. 2005). In the production of this second-generation bioethanol, the
natural recalcitrance of lignocellulosic material (Himmel et al. 2007) is overcome in a
pretreatment step by disrupting the cell structure of the material, enabling the hydrolysis
of cellulose to monomer glucose. The monomeric sugars are then fermented to ethanol,
and the fermentation beer is dehydrated to a pure ethanol product. For the pretreatment
step, several different methods, such as dilute acid, hot water, and steam explosion have
been proposed (Hamelinck et al. 2005; Mosier et al. 2005). Since it has also been
considered one of the most expensive processing steps (Mosier et al. 2005), the choice
and development of a pretreatment method could have a considerable effect on the
economics of bioethanol production.

PEER-REVIEWED ARTICLE bioresources.com
Kautto et al. (2014). “Organosolv & bioethanol costs,” BioResources 9(4), 6041-6072. 6042
One possible pretreatment method is organosolv pulping in which lignin is
dissolved in an organic solvent. The process was originally considered as a pulping
method for the production of paper pulp (Hergert 1998; Aziz and Sarkanen 1989), but it
has recently gained interest as a potential pretreatment method in bioethanol production
(Pan et al. 2005; 2006). Although it has generally been considered as an expensive
pretreatment method (Zhao et al. 2009), the use of organic solvents enables the recovery
of a pure lignin product and potentially other co-products (Pan et al. 2005; 2006). The
production of co-products could possibly offset the perceived high cost of organosolv
pulping. The operation of pilot or demonstration scale organosolv biorefineries by
companies such as Chempolis, CIMV, and Lignol Innovations (Chempolis 2009; Lignol
2009; CIMV 2013a) can be considered as indications of the interest in organosolv
technology.
Several techno-economic studies have been carried out to analyze the technical
and economic feasibility of different second-generation bioethanol production processes
and to compare different pretreatment methods (Eggeman and Elander 2005; Kazi et al.
2010; Humbird et al. 2011; Tao et al. 2011). These studies are typically based on
simulation models, with their key parameters derived from laboratory or pilot scale
experiments. The economic feasibility of bioethanol production is often characterized in
these studies by the minimum ethanol selling price (MESP) (Humbird et al. 2011)
covering the operating and capital costs of production and making a certain return on the
invested capital.
A recent National Renewable Energy Laboratory (NREL) technical report
(Humbird et al. 2011) presented a detailed techno-economic study on the production of
bioethanol from corn stover based on dilute acid pretreatment and enzymatic hydrolysis.
With a corn stover feed of 2000 dry metric tons (MT) per day and a price of 64.5
USD/dry MT, and an in-house enzyme production cost of 0.34 USD per gallon (gal) of
ethanol produced, they arrived at an MESP of 2.15 USD/gal. Other techno-economic
studies include the studies of Eggeman and Elander (2005), Kazi et al. (2010), and Tao et
al. (2011), which compared the economics of different pretreatment technologies. All of
these studies assumed a feedstock feed of 2000 MT/day. Depending on the pretreatment
technology, the capital costs were in the range of 164 to 212 million US dollars (MUSD)
(Eggeman and Elander 2005), 327 to 391 MUSD (in 2007 dollars) (Kazi et al. 2010), and
325 to 385 MUSD (in 2007 dollars) (Tao et al. 2011). The MESPs were in the range of
1.3 to 1.7 (Eggeman and Elander 2005), 3.4 to 4.5 (Kazi et al. 2010), and 2.7 to 4.1
USD/gal (Tao et al. 2011). A more extensive review of recent techno-economic studies
was presented in the NREL study (Humbird et al. 2011). In this review, the MESPs were
found to vary between different studies in the range of approximately 0.6 to 4.6 USD/gal
of ethanol produced, with the variations being largely explained by differences in
assumed feedstock prices, process yields, and co-product credits. In sensitivity analyses
presented by Kazi et al. (2010) and Humbird et al. (2011), MESPs were found to be very
sensitive to variations in capital costs (Humbird et al. 2011), enzyme cost, and cellulose
to glucose conversion in enzymatic hydrolysis (Kazi et al. 2010; Humbird et al. 2011),
and feedstock cost (Kazi et al. 2010).
A few economic assessments on organosolv processes have also been published.
For example, van der Linden et al. (2012) reported in a conference presentation the
income distributions, capital costs, operating costs, and payback times for an ethanol-
organosolv biorefinery producing cellulose pulp, lignin, and furfural at assumed prices of
350 EUR/MT (455 USD/MT, using an EUR-USD exchange rate of 1.3 both here and
PEER-REVIEWED ARTICLE bioresources.com
Kautto et al. (2014). “Organosolv & bioethanol costs,” BioResources 9(4), 6041-6072. 6043
elsewhere in this work), 750 EUR/MT (975 USD/MT), and 625 EUR/MT (813
USD/MT), respectively, from various feedstocks. At a feedstock feed of 150,000
MT/year, the total fixed capital was estimated to be 80 to 87 million EUR (104 to 113
MUSD) with the organosolv reactor section being the single most expensive section in
the process. The payback time was found to be in the approximate range of 6 to 7 years.
Dias et al. (2011) compared a first generation sugarcane juice bioethanol process to
different integrated first and second-generation bioethanol processes (both sugarcane
juice, bagasse, and trash). The second-generation process was based on different
pretreatment methods. An organosolv-based process was found to result in investment
and production costs and internal rates of return that were relatively similar to those of a
steam explosion-based process. Lignin from the organosolv pulping process was assumed
to be combusted. González Alriols et al. (2010) presented an organosolv biorefinery
process where an ultrafiltration separation system was used to produce lignin fractions
with different molecular weights. Capital and operating costs were calculated for the
ultrafiltration system, resulting in a production cost of 52 EUR/MT (68 USD/MT) of
lignin. Mabee et al. (2006) estimated the mass and energy balances and investment and
operating costs for bioethanol production processes based on acid-catalyzed ethanol
organosolv and sulfur dioxide-catalyzed steam explosion pretreatments of Douglas fir.
They compared the processes and found the total production costs of the organosolv
process to be lower. They further found the co-product lignin sales price to significantly
affect the production costs. Only relative costs were, however, presented in these
analyses. Absolute figures enabling the economic assessment of the organosolv process
were not provided. Parajó and Santos (1995) presented a techno-economic study on the
acid-catalyzed acetic acid pulping of Eucalyptus globulus wood for the production of
paper pulp and co-products. Based on a proposed flowsheet and mass and energy
balances, they calculated the investment and operating costs of the process and further
assessed its profitability. They varied the lignin price and found the process to be clearly
unprofitable and non-competitive with other paper pulp production processes if the lignin
was sold at its fuel value. The process was closer to profitability if the lignin was sold at a
price corresponding to its use as an asphalt extender and profitable at higher prices,
corresponding to its use as a dispersing agent, intermediate in polymer manufacture or as
a phenol extender in phenol-formaldehyde resins.
Although economic assessments of organosolv processes have been published
(Parajó and Santos 1995; Mabee et al. 2006; González Alriols et al. 2010; Dias et al.
2011; van der Linden et al. 2012), no comprehensive studies analyzing the economic
feasibility of ethanol production as well as the effect of co-products on the economics
based on detailed flowsheets and balances are known. This paper is a continuation of a
previous paper (Kautto et al. 2013) in which the technical and simulation aspects of an
acid-catalyzed ethanol organosolv process for the production of bioethanol and co-
products, lignin, acetic acid, and furfural, from lignocellulosic material were examined.
Based on the detailed process flowsheets and mass and energy balances presented in the
previous paper, the economics of the organosolv biorefinery will be analyzed in this
paper. The estimated capital costs including the sizing and costing of the main equipment
and the operating costs of the process will first be presented. The MESP for a base case
scenario will then be calculated and the effect of variations in main technical and
economic attributes on the MESP will be analyzed in sensitivity analyses. The effect of
the recovery of co-products on the feasibility of the process will also be discussed.
Whenever applicable, the technical analysis of the organosolv process presented earlier

PEER-REVIEWED ARTICLE bioresources.com
Kautto et al. (2014). “Organosolv & bioethanol costs,” BioResources 9(4), 6041-6072. 6044
(Kautto et al. 2013) followed closely the NREL dilute acid pretreatment study (Humbird
et al. 2011). Assumptions adopted in this economic analysis will also be similar to those
of the NREL study (Humbird et al. 2011), making the two processes comparable. The
economic feasibility of the organosolv process will therefore be compared to the dilute
acid process. Their relative differences will be discussed, and the conditions under which
the organosolv process could be competitive will be analyzed.
MATERIALS AND METHODS
Overview of the Studied Organosolv Biorefinery Concept As discussed in the Introduction, the economic analysis carried out in this paper
was based on a technical analysis presented previously (Kautto et al. 2013). The detailed
flowsheets and mass and energy balances of the previous paper were used to estimate the
operating and capital costs and revenues of the process.
Organosolv cooking
Sugars
Enzymes15.5 MT/day
FermentationMicro-
organisms
CO2
Pulp
99.9 % EtOH459.1 MT/day
Recycled EtOH
Lignin310.5 MT/day
Furfural6.6 MT/day
LMW lignin to boiler
Sugars
H2SO4
20.2 MT/day
Bark andlosses toboiler353 MT/day
Steam to the process6723 MT/day
Hardwood logs2353 MT/day
Pulp
Make-up EtOH
Ammonia12.4 MT/day
Washfiltrates
Aqueous sugar stream
Residues
Bark & otherorganic residues
EtOH distillation and dehydration
Solvent recovery
distillation
Flash tanks & post-
hydrolysis
Conditioning
Debarking &
chipping
Acetic acid30.3 MT/day
Washfiltrates
Water
Water
Wood chips2000 MT/day
Enzymatic hydrolysis
Nutrients
Sugar stream
Spent cooking liquor
EtOH
EtOH
Natural gas10.9 MT/day
Lignin precipitation
& drying
Sugars Evaporation, LMW lignin
separation & AA recoveryNatural gas
45.1 MT/day
Boiler & turbine Electricity
Own use671 MWh/day
To grid87 MWh/day
Washers
Fig. 1. Simplified block diagram of the modeled ethanol organosolv process with the main process steps and input and output flows
PEER-REVIEWED ARTICLE bioresources.com
Kautto et al. (2014). “Organosolv & bioethanol costs,” BioResources 9(4), 6041-6072. 6045
With an intake of 2350 dry MT/day of undebarked hardwood, resulting in 2000
MT/day of debarked chips fed to cooking, the production rates of ethanol, lignin, furfural,
and acetic acid were 459.1, 310.5, 6.6, and 30.3 MT/day, respectively. A small amount of
natural gas was needed to cover the steam balance of the process. The hardwood was
assumed to be hybrid poplar. A simplified block diagram of the modeled process with the
main process steps and input and output flows is presented in Fig. 1. More detailed
process and balance information can be found in the previous study (Kautto et al. 2013).
For the purposes of the economic assessment, the plant was assumed to be located in the
USA.
Investment Costs Due to the relatively high level of detail of the NREL study (Humbird et al. 2011)
and significant similarities between that and our study in several process areas, most
investment costs were assessed based on data of that study. The organosolv process plant
was divided into process areas for investment cost analysis. The costs of areas assumed
similar to the NREL study (Humbird et al. 2011) were estimated by directly scaling the
costs from that study on a process area basis. These areas were wastewater treatment,
storage, utilities, and boiler and turbine. The costs of all the other process areas were
estimated on an individual equipment basis, using the equipment costs, installation
factors, and scaling exponents of the NREL study (Humbird et al. 2011) as well as the
Aspen Process Economic Analyzer software (AspenTech 2011), industry estimates, and a
previous NREL study from 2002 (Aden et al. 2002). Where Aspen Process Economic
Analyzer was used in estimating the equipment costs, the installed costs of these pieces
of equipment were calculated using installation factors of the NREL study (Humbird et
al. 2011).
Material of construction in most areas was either SS304 or SS316, depending on
the process conditions. All prices were indexed to the year of 2013 using Chemical
Engineering Plant Cost Index (CEPCI). A preliminary value of April 2013 was used as
the value for 2013 (Chemical Engineering 2013). Table 1 reports the process areas, their
descriptions, and the costing bases.
After assessing the installed equipment costs of different process areas, the costs
of warehouse, site development, additional piping, different indirect costs, and other costs
as well as the amount of working capital were calculated following the data and
methodology presented in the NREL study (Humbird et al. 2011). The costs of
warehouse, site development, and additional piping were calculated in the NREL study
(Humbird et al. 2011) as a percentage of the inside battery limits (ISBL) investment cost.
In this study the ISBL was set to consist of process areas of feed handling, pretreatment
and lignin recovery, solvent and furfural recovery, conditioning of the hemicellulosic
sugar stream, acetic acid recovery, enzymatic hydrolysis and fermentation, and ethanol
product and solids recovery.
The indirect costs were calculated in the NREL study (Humbird et al. 2011) as a
percentage of the total direct costs. The working capital was calculated as a percentage of
the fixed capital investment (the sum of direct and indirect costs). All the percentages
used in this study are presented in Table 4 in the subsection Base case economic
assessment.
PEER-REVIEWED ARTICLE bioresources.com
Kautto et al. (2014). “Organosolv & bioethanol costs,” BioResources 9(4), 6041-6072. 6046
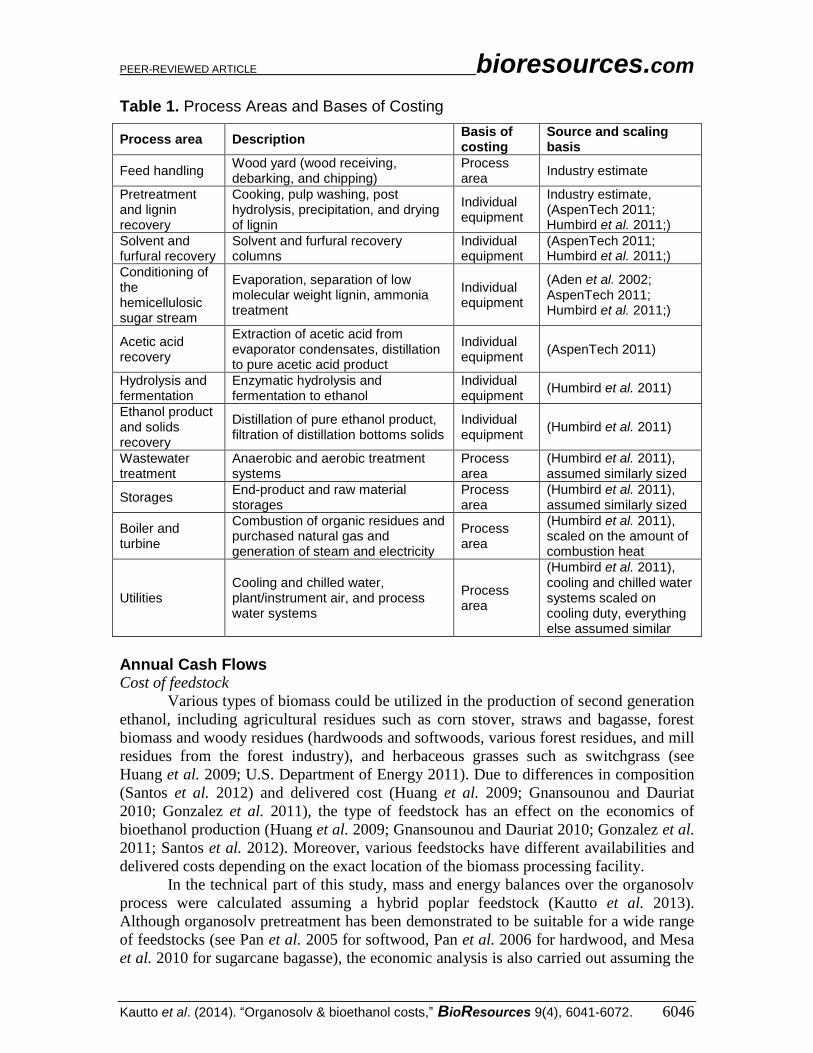
Table 1. Process Areas and Bases of Costing
Process area Description Basis of costing
Source and scaling basis
Feed handling Wood yard (wood receiving, debarking, and chipping)
Process area
Industry estimate
Pretreatment and lignin recovery
Cooking, pulp washing, post hydrolysis, precipitation, and drying of lignin
Individual equipment
Industry estimate, (AspenTech 2011; Humbird et al. 2011;)
Solvent and furfural recovery
Solvent and furfural recovery columns
Individual equipment
(AspenTech 2011; Humbird et al. 2011;)
Conditioning of the hemicellulosic sugar stream
Evaporation, separation of low molecular weight lignin, ammonia treatment
Individual equipment
(Aden et al. 2002; AspenTech 2011; Humbird et al. 2011;)
Acetic acid recovery
Extraction of acetic acid from evaporator condensates, distillation to pure acetic acid product
Individual equipment
(AspenTech 2011)
Hydrolysis and fermentation
Enzymatic hydrolysis and fermentation to ethanol
Individual equipment
(Humbird et al. 2011)
Ethanol product and solids recovery
Distillation of pure ethanol product, filtration of distillation bottoms solids
Individual equipment
(Humbird et al. 2011)
Wastewater treatment
Anaerobic and aerobic treatment systems
Process area
(Humbird et al. 2011), assumed similarly sized
Storages End-product and raw material storages
Process area
(Humbird et al. 2011), assumed similarly sized
Boiler and turbine
Combustion of organic residues and purchased natural gas and generation of steam and electricity
Process area
(Humbird et al. 2011), scaled on the amount of combustion heat
Utilities Cooling and chilled water, plant/instrument air, and process water systems
Process area
(Humbird et al. 2011), cooling and chilled water systems scaled on cooling duty, everything else assumed similar
Annual Cash Flows Cost of feedstock
Various types of biomass could be utilized in the production of second generation
ethanol, including agricultural residues such as corn stover, straws and bagasse, forest
biomass and woody residues (hardwoods and softwoods, various forest residues, and mill
residues from the forest industry), and herbaceous grasses such as switchgrass (see
Huang et al. 2009; U.S. Department of Energy 2011). Due to differences in composition
(Santos et al. 2012) and delivered cost (Huang et al. 2009; Gnansounou and Dauriat
2010; Gonzalez et al. 2011), the type of feedstock has an effect on the economics of
bioethanol production (Huang et al. 2009; Gnansounou and Dauriat 2010; Gonzalez et al.
2011; Santos et al. 2012). Moreover, various feedstocks have different availabilities and
delivered costs depending on the exact location of the biomass processing facility.
In the technical part of this study, mass and energy balances over the organosolv
process were calculated assuming a hybrid poplar feedstock (Kautto et al. 2013).
Although organosolv pretreatment has been demonstrated to be suitable for a wide range
of feedstocks (see Pan et al. 2005 for softwood, Pan et al. 2006 for hardwood, and Mesa
et al. 2010 for sugarcane bagasse), the economic analysis is also carried out assuming the

PEER-REVIEWED ARTICLE bioresources.com
Kautto et al. (2014). “Organosolv & bioethanol costs,” BioResources 9(4), 6041-6072. 6047
same feedstock. For bioenergy and biofuel production, various poplar prices have been
reported in the literature. Table 2 lists some reported price estimates.
Table 2. Reported Poplar Prices
Reference Poplar price/cost Location and plant capacity
Phillips et al. 2007
Delivered cost target of 35 USD/dry short ton of wood chips (in 2005 dollars, approximately 39 USD/dry MT)
2000 dry MT/day
Huang et al. 2009
Delivered cost of cropland grown hybrid poplar chips estimated at 104.65 USD/dry MT (in 2005 dollars), with the cost consisting of land, production, harvest, chipping, fixed (independent of distance) transportation, and variable (dependent of distance) transportation costs of 20.50, 38.64, 16.0, 14.0, 4.55, and 10.96 (with a collection radius slightly below 60 km) USD/dry MT, respectively
Minnesota, 2000 dry MT/day
Jones et al. 2009
Hybrid poplar wood chip delivered price of 50.7 USD/dry short ton (in 2007 dollars, 55.9 USD/dry MT)
2000 dry MT/day
Gnansounou and Dauriat 2010
Delivered cost of poplar estimated at 140.4 USD/dry ton (in 2007 dollars), with the non-transport costs being 123.3 and transport costs 17.1 USD/dry ton (average collection radius 40 km)
1636 dry ton/day,
Khanna and Huang 2010
Of the studied three states, farm-gate break-even price of poplar chips was found to be the lowest in Michigan, being in the range 88 – 95 USD/dry MT (in 2007 dollars) when grown on marginal land and 106 – 115 USD/dry MT when grown on cropland. The break-even prices were found to be sensitive to changes in biomass yield and harvest cost both on marginal and cropland and to changes in the prices of corn and soybean on cropland (corn-soybean rotation was assumed to be the most profitable use of land and therefore determined the opportunity cost of cropland).
Michigan, Illinois, Oklahoma
Berguson et al. 2010
Delivered costs of hybrid poplar chips estimated to be in the range of 70 – 100 USD/dry short ton (approx. 77 – 110 USD/dry MT) in Pacific Northwest, with the exact value depending on the assumed land costs and discount rates. The costs consisted of 27% land, 9% establishment, 28% crop care and management, 24% harvest, and 12% transport costs. The prices were estimated to be in the same range also in Minnesota.
Pacific Northwest, Minnesota, average one-way hauls 30-65 miles
The study of Berguson et al. (2010) was followed in setting the feedstock price.
Since hardwood feedstock was assumed to be debarked and chipped onsite in this
organosolv study (Kautto et al. 2013) and Berguson et al. (2010) reported the cost of
hybrid poplar as chipped, a minor conversion was made to the costs of Berguson et al.
(2010). The base case price of the undebarked poplar wood was assumed in this study to
be 85 USD/dry MT delivered to the plant gate, and the feedstock price was assumed to
vary in the range of 70 to 100 USD/dry MT in sensitivity analyses. The effect of these
changes on the MESP is discussed in more detail in subsection Sensitivity analyses.
Cost of enzymes
The cost contribution of enzymes in techno-economic second generation ethanol
studies has typically been reported either on a very aggregated level as a cost contribution
per gallon of ethanol produced or calculated based on assumed price (or production cost)

PEER-REVIEWED ARTICLE bioresources.com
Kautto et al. (2014). “Organosolv & bioethanol costs,” BioResources 9(4), 6041-6072. 6048
and loading of enzymes. A wide range of enzyme cost contributions have been assumed
in these studies, including a cost goal of 0.1 USD/gal (approximately 1.5 USD/kg
cellulase at a loading of 0.02 g cellulase/g cellulose) in the 2002 NREL study (Aden et al.
2002), future price projection of 0.15 USD/gal in (Eggeman and Elander 2005), 0.25
USD/gal (Tao et al. 2011), and costs of 0.71, 0.35, and 2.09 USD/gal reflecting a loading
of 0.0313 g protein/g cellulose in untreated biomass and a base case enzyme price of
approximately 5.1 USD/kg derived from an enzyme production model and lower and
higher price scenarios of 2.6, and 14.6 USD/kg, respectively (Kazi et al. 2010).
Some studies have presented more detailed analysis on the economics of enzyme
production. Klein-Marcuschamer et al. (2011) carried out a techno-economic analysis of
cellulase production from steam-exploded poplar wood by fungus Trichoderma reesei. At
a cellulase production capacity enough to supply a cellulosic ethanol plant processing
1700 dry MT of corn stover per day (Klein-Marcuschamer et al. 2010), a poplar cost of
60 USD/MT, residence time of 192 h in aerobic fermentation, and a final enzyme
concentration after filtration of 150 g/L, they arrived at a baseline cost of enzymes of
10.14 USD/kg (in 2010 dollars). This corresponded to a cost contribution of 1.47
USD/gal ethanol at a loading of 0.02 g enzyme/g cellulose. The enzyme production cost
was found to be largely governed by capital (48% of total) and feedstock costs (28%). An
on-site enzyme production process was also modeled in the NREL study (Humbird et al.
2011). Using glucose as the sugar source in fermentation, they arrived at a somewhat
lower enzyme cost of 4.24 USD/kg (in 2007 dollars), which resulted in a cost
contribution of 0.34 USD/gal ethanol at a loading of 0.02 g enzyme protein/g cellulose.
The key cost contributors were found to be the sugar (57% of total) and capital costs
(21%). The differences in enzyme production costs and cost structures between the
NREL study (Humbird et al. 2011) and Klein-Marcuschamer et al. (2011) reflect at least
partially different feedstocks (sugar sources) used in enzyme production.
Although the NREL enzyme cost could be considered rather optimistic, it was
here used as a basis to calculate the base case enzyme cost to align this study with the
NREL study. Based on the enzyme production cost breakdown presented in the NREL
study (glucose, other nutrients, electricity, and fixed and capital costs), the cost was in
this study indexed to the year 2013 using the plant cost index, the 2013 glucose price
(USDA 2013), producer price index for industrial chemicals, and the 2013 electricity
price. This resulted in an enzyme cost of 5270 USD/MT. Also, the enzyme loading (0.02
g enzyme/g cellulose) was assumed to be the same as in the NREL study. The enzyme
was assumed to be supplied by a separate operator at the indexed enzyme production
cost. Price estimates (3700 USD/MT) and dosing suggestions (0.06 g enzyme/g cellulose)
from an enzyme provider from 2011 (Novozymes 2011) were used as a more
conservative scenario in sensitivity analyses.
Other assumptions related to variable and fixed costs and revenues
There is no commercial production and therefore no existing market for the
quantities of organosolv lignin that would be generated through such large scale
production as studied in this paper. Furthermore, there is a wide range of products that
could be assumed to be produced from organosolv lignin. Estimating the market price for
the lignin is therefore difficult. The price of lignin was assumed to be 450 USD/MT in
the base case scenario. This is in line with Gosselink (2011) who reported kraft (lignin
separated from kraft pulp cooking liquor), soda (lignin from soda pulp cooking liquor),
and organosolv lignin values in the range of 350 to 500 EUR/MT (455 to 650 USD/MT).

PEER-REVIEWED ARTICLE bioresources.com
Kautto et al. (2014). “Organosolv & bioethanol costs,” BioResources 9(4), 6041-6072. 6049
Higher price assumptions were reported by Baker (2010) in a presentation on the use of
organosolv and kraft lignins in the production of carbon fibers (lignin price below 1100
USD/MT), by van der Linden et al. (2012) (975 USD/MT), and by Rushton (2012) in a
presentation on Lignol’s biorefining revenue scenarios (1900 USD/MT). Indication of a
higher lignin price can also be drawn from the earlier activities of a company called
Repap. The company operated a 30 MT/day organosolv pulping demonstration plant (so
called Alcell process) intermittently from 1989 to 1996, producing more than 3700 MT of
lignin and selling most of it for its use for example in phenolic resins (Pye 2010a). Repap
further planned a larger, 450 MT/day organosolv pulping plant, and undertook studies to
evaluate markets for the larger lignin output. According to Pye (2010a), the studies
suggested that larger quantities of organosolv lignin could have been sold at an average
price close to the price of phenolic resin (see subsection Sensitivity analyses for the
current market price). Although some of the literature and earlier experience seem to
suggest that relatively high prices could be obtained for organosolv lignin, the more
conservative price assumption of 450 USD/MT, representing the lower end of the price
range presented in the literature, was seen as justifiable in this paper due to lack of price
data of current, larger scale sales of organosolv lignin. The pricing of lignin as well as the
effect of changes to the assumed lignin price are discussed in more detail in subsection
Sensitivity analyses.
The prices of chemicals were estimated mainly based on the NREL study
(Humbird et al. 2011). Other sources were used for acetic acid (Kelley 2013), furfural
(Arato et al. 2005), and kerosene (Dennis et al. 2013). The chemical prices were indexed
to the year 2013 using CEPCI producer price index for industrial chemicals (Chemical
Engineering 2013). The prices of natural gas and electricity represented price level in
December 2013 and were based on data of U.S. Energy Information Administration
(2013a,b). Other cost items, including salaries, labor burden, maintenance, and property
insurance were estimated based on the NREL study (Humbird et al. 2011). The amount
of personnel was assumed similar to that in the NREL study (Humbird et al. 2011), and
the labor cost was indexed to 2013 using labor cost index for the chemical industry
(Bureau of Labor Statistics 2013).
MESP Analysis
Following assumptions made in the NREL study (Humbird et al. 2011), plant on-
line time of approximately 350 days per year was assumed in this study. The plant was
assumed to be in full operation for 30 years. Table 3 presents the assumed time-table and
cash flows for planning and engineering, construction, and start-up.
Table 3. Plant Planning and Engineering, Construction, and Start-up Times
Phase Time, months Cash flow
Planning and engineering
0 – 12 8% of project investment
Construction 12 – 24 24 – 36
60% of project investment 32% of project investment +working capital
Start-up 36 – 39 50% of production 75% of variable costs 100% of fixed costs
Full production 39 →

PEER-REVIEWED ARTICLE bioresources.com
Kautto et al. (2014). “Organosolv & bioethanol costs,” BioResources 9(4), 6041-6072. 6050
Based on the estimated investment costs and annual cash flows, the economic
feasibility of the organosolv plant was assessed using the MESP, which is widely used in
the literature studying different bioethanol production concepts. The MESP is the selling
price of ethanol that makes the net present value of the ethanol process equal to zero
(Humbird et al. 2011) so that the ethanol sales revenue fully compensates for both the
operating and capital costs of the project with a given discount rate. The MESP
calculation was done following the recent and earlier NREL studies (Aden et al. 2002;
Humbird et al. 2011). The discount rate was set to 10%, capital investment was assumed
to be 40% equity financed, the interest on loan was 8% and it was paid back in 10 years,
corporate tax rate was 35%, and a 150% declining base depreciation method with a 20-
year recovery period was adopted for the steam and power production plant and a 200%
declining base with a 7-year recovery for the rest of the equipment.
As either price information from 2013 or prices indexed to 2013 price level using
CEPCI index values were used throughout this study, the dollars used in this study can be
considered as 2013 dollars.
Technical Parameters Varied in Sensitivity Analyses The economic assumptions described above and the technical assumptions
described in the companion paper (Kautto et al. 2013) outline the base case scenario of
the modeled organosolv process. Due to uncertainties inherent in a conceptual process
simulation study like this, sensitivity analyses were run to estimate the effect of changes
in some main parameters on the MESP of the studied organosolv concept. Both technical
(internal) and exogenous (external, market-related) parameters were analyzed. The lignin
sales price and feedstock, enzyme, and investment costs were selected as exogenous
parameters, and parameters related to enzymatic hydrolysis, fermentation, and energy
consumption were selected as technical parameters. Regarding the market-related
parameters, variations in feedstock and enzyme costs were discussed in subsections Cost
of feedstock and Cost of enzymes, investment costs were assumed to vary by 30%, and the
sales price of lignin will be discussed separately in subsection Sensitivity analyses. The
rationale for the selection of the technical parameters and their variation is discussed
below.
Ethanol organosolv pulps have generally been found to exhibit good response to
enzymatic hydrolysis (Pan et al. 2005; 2006). Pan et al. (2006) presented how low lignin
content organosolv pulps exhibit significantly better response to enzymatic hydrolysis
than higher lignin content steam-exploded wood. With approximately the same enzyme
loading (20.9 mg cellulase and 5.7 mg β-glucosidase per g cellulose) and same hydrolysis
time of 36 h (but with a significantly lower solids content), Pan et al. (2006) reported
hybrid poplar pulp prepared at the same conditions adopted in this study to exhibit a
conversion efficiency of cellulose to glucose of approximately 96%. The enzymatic
conversion of organosolv-cooked hybrid poplar might therefore be higher than that of
dilute acid-pretreated corn stover of the NREL study (Humbird et al. 2011) (cellulose to
glucose conversion of 90%). The effect of improved enzymatic hydrolysis on the
economics of the organosolv process was studied by setting sugar conversion yield 6
percentage points higher for all carbohydrates. On the other hand, due to enzyme
inhibition and deactivation caused by soluble sugars, furfural, hydroxymethyl furfural,
organic acids, and phenolics at higher solids contents (see Kim et al. 2011), the
conversion rates in industrial scale enzymatic hydrolysis could be significantly lower
than those reported by Pan et al. (2006). Therefore, a conversion of both cellulose and

PEER-REVIEWED ARTICLE bioresources.com
Kautto et al. (2014). “Organosolv & bioethanol costs,” BioResources 9(4), 6041-6072. 6051
hemicelluloses to sugars of 80% was adopted as a more conservative scenario for the
enzymatic hydrolysis.
In addition to assuming an improved enzymatic hydrolysis as described above, a
higher overall sugar recovery could have also been achieved by assuming a higher
carbohydrate recovery in the cooking section. As discussed in the previous paper (Kautto
et al. 2013), the carbohydrate recovery was assumed to be 84% based on Pan et al.
(2006), being considerably lower than that in the NREL study (Humbird et al. 2011)
(approximately 98%). Mabee et al. (2006) reported a higher recovery in the organosolv
cooking of softwood (90% for both glucose and hemicelluloses), suggesting that a higher
carbohydrate recovery could be achievable. Improved carbohydrate recovery was,
however, not specifically studied in the sensitivity analyses since the effect of such a
change would be similar to that of the improved enzymatic hydrolysis.
Mannose and galactose were not assumed to be fermented by the fermenting
organism Zymomonas mobilis, as outlined in the NREL study (Humbird et al. 2011). The
fermentation of these sugars has, however, been assumed in several studies (see Aden et
al. 2002). On the other hand, the fermentation of xylose and other hemicellulosic sugars
has generally proven to be challenging (see Aden et al. 2002). In addition, due partially to
relatively high temperature and long residence time in organosolv cooking (assumed to
be 180 °C and 60 minutes (Kautto et al. 2013), based on Pan et al. (2006)), and the need
to close the cooking mass balance, the aqueous stream from cooking was assumed to
contain initially relatively high amounts of sugar degradation products (see discussion in
the companion paper (Kautto et al. 2013)). Although the amount of these and other
inhibitory compounds were assumed to be decreased to a level low enough for
fermentation (Kautto et al. 2013), residual inhibitory compounds might affect the
fermentation, and no experimental data were available on the fermentability of such a
stream. The processing of the hemicellulosic sugar stream could also result in greater
sugar losses than assumed; therefore, both the effect of fermentation of mannose and
galactose and of a lower fermentation yield of hemicellulosic sugars on the economics of
the organosolv process were considered.
Due to the preliminary nature of this study, several assumptions had to be made
that would have a considerable effect on the steam and electricity consumption of the
process. For example, the liquor-to-wood ratio (LTW) was assumed to be 5. With a
higher or lower LTW, the amount of solvent and water recycled, and therefore the steam
consumption in distillation, would be changed significantly. Also the extent of, and
assumptions made in, heat integration would affect the steam consumption. Due to this
inherent uncertainty, the effects of changes in the energy consumption of the process
were studied. The steam and electricity consumption of the process were changed by
30%. The effects of these changes on the excess electricity production and/or the natural
gas demand, and further on the MESP of the process were then analyzed.
RESULTS AND DISCUSSION
Base Case Economic Assessment In the economic assessment of the organosolv process, the capital investment and
variable and fixed costs as well as the co-product credits were assessed first. Based on
these, the MESP was calculated to analyze the economic feasibility of the organosolv
process. Table 4 presents the investment costs of installed equipment as well as the other

PEER-REVIEWED ARTICLE bioresources.com
Kautto et al. (2014). “Organosolv & bioethanol costs,” BioResources 9(4), 6041-6072. 6052
direct costs, indirect costs, the cost of land, and working capital. The sizing and costing
of individual pieces of equipment and process areas as well as the bases of costing are
presented in more detail in the supplementary material (Supplementary Table 1).
Table 4. Investment Cost Analysis
Investment cost MUSD Investment cost MUSD
Installed equipment cost Process areas
Feed handling Pretreatment and lignin recovery Solvent and furfural recovery Conditioning of the hemicellulosic stream Acetic acid recovery Enzymatic hydrolysis and fermentation Ethanol product and solids fermentation Wastewater treatment Storages Boiler and turbine Utilities
Total installed equipment cost Other direct costs
Warehouse (4% of ISBL) Site development (9% of ISBL) Additional piping (4.5% of ISBL)
Total direct costs (TDC)
42 88 31 19 12 28 18 54 5 82 7 386 10 21 11 428
Indirect costs Prorateable expenses (10% of TDC) Field expenses (10% of TDC) Home office and construction (20% of TDC) Project contingency (10% of TDC) Other costs (10% of TDC)
Total indirect costs Fixed capital investment (FCI)
Land Working capital (5% of FCI)
Total capital investment
43 43 86 43 43 257 685 3 34 722
As can be seen in Table 4, the estimated total capital investment was calculated to
be 722 MUSD, resulting in a total capital investment per annual ethanol production of
13.4 USD/gal (4490 USD/MT). The organosolv process presented by van der Linden et
al. (2012) apparently included size reduction, organosolv cooking, solvent, furfural, and
lignin recovery as well as pulp washing but no major auxiliary processes. Scaling their
capital cost (see Introduction) by a scaling exponent of 0.6 to the feedstock flow used in
this study resulted in a total capital investment that is well in line with the direct and
indirect capital costs (using the percentages for other direct costs and indirect costs
presented in Table 4) of the sections feed handling, pretreatment and lignin recovery, and
solvent and furfural recovery of this study (both approximately 300 MUSD).
The NREL dilute acid process (Humbird et al. 2011) was used in this work as a
reference point for the studied organosolv process. The total capital investment of the
NREL process indexed to 2013 from their cost year of 2007 would be approximately 458
MUSD. Not unexpectedly, a more complicated flowsheet of the organosolv process with
the recovery of solvent and co-products would therefore make the investment costs of
this process higher.
The annual variable and fixed costs, co-product revenues as well as the minimum
ethanol sales revenue and the according MESP are presented in Table 5 (see
Supplementary Tables 2 and 3 for more detailed breakdowns of the variable operating
costs and revenues from by-products as well as of the MESP calculation). The minimum
annual ethanol sales revenue was 166 MUSD/year. With an ethanol production of 459
MT/day (Kautto et al. 2013), this converted to an MESP of 3.07 USD/gal (approximately
1030 USD/MT).
PEER-REVIEWED ARTICLE bioresources.com
Kautto et al. (2014). “Organosolv & bioethanol costs,” BioResources 9(4), 6041-6072. 6053
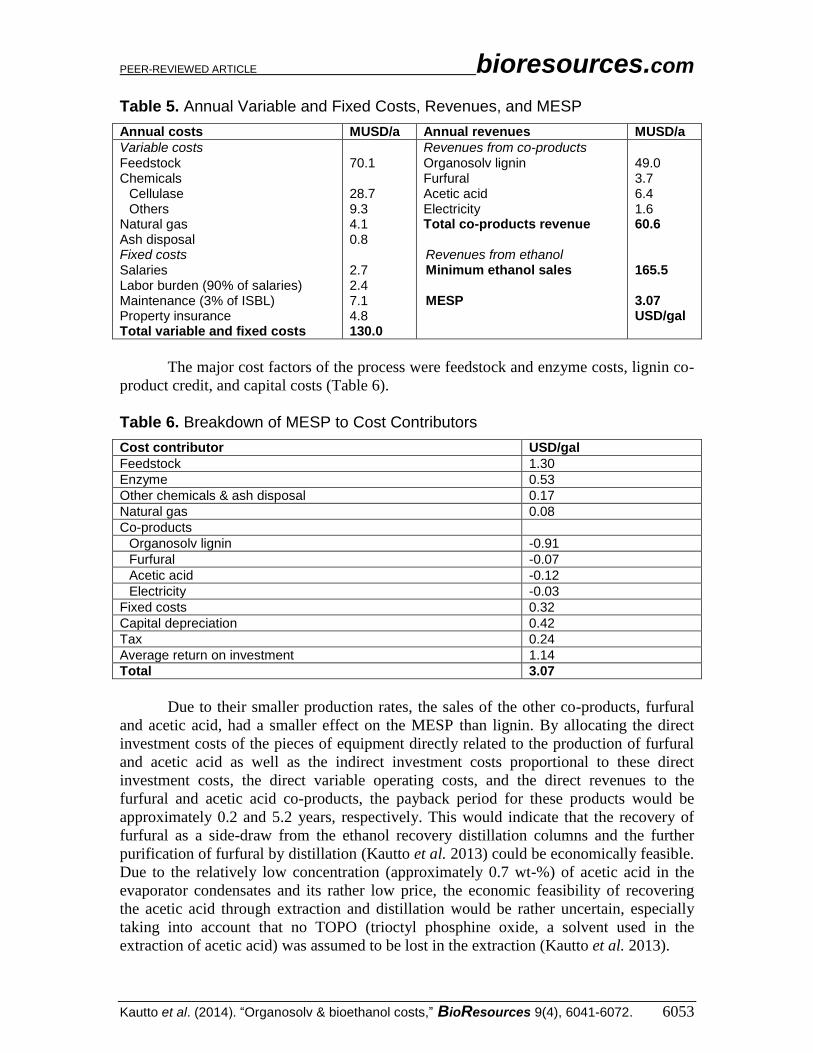
Table 5. Annual Variable and Fixed Costs, Revenues, and MESP
Annual costs MUSD/a Annual revenues MUSD/a
Variable costs Feedstock Chemicals
Cellulase Others
Natural gas Ash disposal Fixed costs Salaries Labor burden (90% of salaries) Maintenance (3% of ISBL) Property insurance Total variable and fixed costs
70.1 28.7 9.3 4.1 0.8 2.7 2.4 7.1 4.8 130.0
Revenues from co-products Organosolv lignin Furfural Acetic acid Electricity Total co-products revenue Revenues from ethanol Minimum ethanol sales MESP
49.0 3.7 6.4 1.6 60.6 165.5 3.07 USD/gal
The major cost factors of the process were feedstock and enzyme costs, lignin co-
product credit, and capital costs (Table 6).
Table 6. Breakdown of MESP to Cost Contributors
Cost contributor USD/gal
Feedstock 1.30
Enzyme 0.53
Other chemicals & ash disposal 0.17
Natural gas 0.08
Co-products
Organosolv lignin -0.91
Furfural -0.07
Acetic acid -0.12
Electricity -0.03
Fixed costs 0.32
Capital depreciation 0.42
Tax 0.24
Average return on investment 1.14
Total 3.07
Due to their smaller production rates, the sales of the other co-products, furfural
and acetic acid, had a smaller effect on the MESP than lignin. By allocating the direct
investment costs of the pieces of equipment directly related to the production of furfural
and acetic acid as well as the indirect investment costs proportional to these direct
investment costs, the direct variable operating costs, and the direct revenues to the
furfural and acetic acid co-products, the payback period for these products would be
approximately 0.2 and 5.2 years, respectively. This would indicate that the recovery of
furfural as a side-draw from the ethanol recovery distillation columns and the further
purification of furfural by distillation (Kautto et al. 2013) could be economically feasible.
Due to the relatively low concentration (approximately 0.7 wt-%) of acetic acid in the
evaporator condensates and its rather low price, the economic feasibility of recovering
the acetic acid through extraction and distillation would be rather uncertain, especially
taking into account that no TOPO (trioctyl phosphine oxide, a solvent used in the
extraction of acetic acid) was assumed to be lost in the extraction (Kautto et al. 2013).

PEER-REVIEWED ARTICLE bioresources.com
Kautto et al. (2014). “Organosolv & bioethanol costs,” BioResources 9(4), 6041-6072. 6054
Aligning feedstock costs of the NREL dilute acid study (Humbird et al. 2011)
with the current organosolv study and indexing other operating costs and investment
costs to the year 2013 resulted in an MESP of the NREL process (approximately 2.6
USD/gal) that is relatively close to the base case MESP of the organosolv process
(approximately 3.1 USD/gal). This demonstrates that the organosolv pulping process for
the production of bioethanol could be competitive, with either a slightly higher price of
lignin or lower investment or operating costs. The US market price of ethanol in
December 2013 was approximately 2.0 USD/gal (Chicago Mercantile Exchange 2013),
indicating that the MESP of the base case organosolv process would need to be somewhat
lower or the market price of ethanol higher to make the process economically attractive
(not taking into account any policy instruments to support lignocellulosic ethanol). The
economic viability of the organosolv process will be further analyzed in the next section.
Sensitivity Analyses Parameters used in the sensitivity analyses covered both technical and market-
related aspects of the studied organosolv process. The technical parameters (steam and
electricity consumption of the process, conversion rates in the enzymatic hydrolysis
stage, and conversion rates of hemicellulosic sugars in the fermentation stage) and their
expected variations are discussed in section Technical parameters varied in sensitivity
analyses. The sensitivity of changes of these factors on the MESP is presented in Table 7.
C5 sugars in the table refer to hemicellulosic pentoses (xylose and arabinose) and C6
sugars to hexoses (mannose and galactose). Also the effect of changes in the total capital
investment and in the discount rate used in MESP calculation are presented in the table.
The effects of lignin price and feedstock and enzyme costs are shown separately in Fig. 2.
Table 7. Sensitivity of MESP to Technical Assumptions
Design parameter Base case Value in sensitivity analysis MESP, USD/gal
Steam and power consumption
6720 MT/day (steam), 670 MWh/day (power)
8740 MT/day, 870 MWh/day (+30%) 4710 MT/day, 470 MWh/day (-30%)
3.25 (+0.18) 2.91 (-0.17)
Conversion rate in the enzymatic hydrolysis
90% for cellulose, 82% for hemicelluloses
96% for cellulose, 88% for hemicelluloses (high) 80% for cellulose and hemicelluloses (low)
2.92 (-0.15) 3.38 (0.30)
Conversion rate of hemicellulosic sugars in the fermentation
85% for C5 sugars, 0% for C6 sugars
85% for C5 and C6 sugars (high) 50% for C5 sugars, 0% for C6 sugars (low)
2.88 (-0.19) 3.23 (0.16)
Total capital investment
722 MUSD 939 MUSD (+30%) 505 MUSD (-30%)
3.60 (+0.53) 2.54 (-0.53)
Discount rate used in MESP calculation
10 % 20 % 4.30 (+1.23)
As can be seen in Table 7, the MESP was very sensitive to changes in investment
costs. Decreasing the total capital investment by 30% decreased the MESP by 0.53
PEER-REVIEWED ARTICLE bioresources.com
Kautto et al. (2014). “Organosolv & bioethanol costs,” BioResources 9(4), 6041-6072. 6055
USD/gal, illustrating that decreases in capital costs could improve the economics of the
process considerably. In the base case scenario the plant was assumed to be a greenfield
project with no existing infrastructure or utility systems. Integrating the plant into an
existing industrial facility could be a way to decrease the investment costs considerably,
for example by making investments in the boiler and turbine units and wastewater
treatment unnecessary. Smaller capital savings could be gained by omitting the
investment in acetic acid recovery, which was found to have a relatively long payback
period.
Similarly to the absolute level of investment, also the required rate of return on
the invested capital (discount rate) had a considerable effect on the MESP. Doubling the
discount rate from 10% to 20% increased the MESP by 1.23 USD/gal. Taking into
account the risk associated with novel technology and a novel product (organosolv lignin)
that have not been demonstrated in large scale, the discount rate might need to be higher
than 10%.
Also, changes in the studied technical parameters had an effect on the MESP,
with changes in the MESP being in the range of -0.19 to 0.30 USD/gal. The conversion
rate both in hydrolysis and fermentation had a relatively considerable effect on the
MESP, demonstrating the importance of the overall conversion rate from carbohydrates
to ethanol on the economics of the process.
As discussed in the Introduction, one of the main arguments for an organosolv
pretreatment of lignocellulosic biomass prior to enzymatic hydrolysis is that a relatively
pure lignin fraction can be produced. As seen in Tables 5 and 6, with an assumed base
case lignin price of 450 USD/MT, the lignin sales are a significant source of revenue and,
consequently, a major contributor in the MESP.
The effect of lignin sales on the overall economics of the organosolv process
depends considerably on the assumed lignin price. Some price estimates have been
presented in the literature (Baker 2010; Pye 2010a; Gosselink 2011; Rushton 2012; van
der Linden et al. 2012). As there is however no existing commercial, larger scale
production of organosolv lignin, the estimates presented in the literature have to be
considered as only indicative. The base case lignin price was set in this study at the lower
end of the price range presented in the literature. In addition to literature estimates, some
indication of the price level could be found from the possible end-products produced
from the lignin.
A wide scale of potential application areas have been identified for lignins in
general. Holladay et al. (2007) classified the various uses into three categories: power-
fuel-gasification (utilizing lignin as a carbon source in energy applications such as heat
and power and synthesis gas derived fuels), macromolecules (utilizing lignin’s
macromolecular nature for example in carbon fibers, adhesives, and resins), and aromatic
chemicals (breaking up lignin’s macromolecular structure to aromatic monomers,
including BTX chemicals, (benzene, toluene, xylene) and phenol). Ragauskas et al.
(2014) reviewed challenges and recent advancements in the processing and use of lignin
in materials (carbon fibers, plastics, and composites) and fuels and chemicals. Gosselink
(2011) ranked lignin applications based on their value and market volume, from very
high-volume, low-value applications (such as energy and fuels) to medium-scale, higher-
valued applications (such as aromatic chemicals and phenolic resin) and further to very
low-volume, very high-value applications (carbon fibers, fine chemicals). End-product
prices ranging from a few hundred dollars per ton and below for energy applications to

PEER-REVIEWED ARTICLE bioresources.com
Kautto et al. (2014). “Organosolv & bioethanol costs,” BioResources 9(4), 6041-6072. 6056
several thousands for vanillin and phenol derivatives (Gosselink 2011) illustrate the wide
price range that could be adopted also for the organosolv lignin.
For organosolv lignins, uses especially in various resin systems such as phenolic
and epoxy resins and polyurethanes have been suggested (Pye 2010b; CIMV 2013b).
Within these resin systems, applications demonstrated either in pilot or larger scale
include the partial replacement of phenol-formaldehyde resin as well as methylene
diphenyl diisocyanate (used in polyurethane manufacture) by organosolv lignin in wood
products (oriented strand board and medium-density fiberboard), partial replacement of
phenol-formaldehyde resin in friction binders and rigid foam insulation, and the partial
replacement of epoxy resins in coatings (Rushton 2012). These resins are relatively high-
valued products, with the July 2014 prices being approximately 1800 USD/MT for
phenolic, 2300 USD/MT for epoxy, and 2500 USD/MT for polyurethane resins (Plastics
News 2014). The market volumes of phenolic and polyurethane resins in turn are large
with above 10 million MT (MarketsandMarkets 2011; Research and Markets 2012),
while the epoxy resin markets is somewhat smaller at approximately 2 million MT
(Research and Markets 2013). The larger phenolic and polyurethane markets specifically,
both of which are expected to grow in the near term future (MarketsandMarkets 2011;
Research and Markets 2012), could be assumed large enough to absorb the amounts of
lignin produced in the studied organosolv process (109,000 MT/year) with no major
negative effect on the resin prices.
To study the effect of lignin price on the MESP further, the lignin price was
varied within a price range. The minimum price of lignin can be considered to be its
value as a fuel. As a very conservative fuel pricing scenario, the price of lignin can be
calculated from the price of coal. Taking into account differences in the heating values
(approximately 25 MJ/kg for lignin and 29 MJ/kg for coal), a coal price of 62.0 USD/MT
(U.S. Energy Information Administration 2013c) converts to a lignin fuel value of
approximately 53 USD/MT. More favorable fuel price references for lignin would be
pellets and forest residues. The maximum price of lignin in the sensitivity analysis was
set based on its use in phenolic resins. This use was highlighted by Stewart (2008), who
argued that the application of lignin as a substitute for phenol in phenolic resins is a
credible option due to the large and growing size of the phenol market and legislative
reasons. In phenolic resins lignin can act both as a direct replacement of the resin itself
(when lignin is blended with the resin) or as a replacement of the phenol chemical (when
lignin is used as a phenolic component in the manufacture of the resin) (Pye 2010a). In
this sensitivity analysis the reference product was assumed to be the phenol chemical.
Although using organosolv lignin as a substitute for phenol would not directly mean that
lignin would be sold for the same price as phenol, not least because modification may be
required to enhance the reactivity of the lignin (Stewart 2008; Gosselink 2011), the price
of phenol was used here as the optimistic, upper end of the price range used in the
sensitivity analysis. In February 2013 phenol sold for approximately 1500 USD/MT
(Dietrich 2013). Although higher-value uses than phenolic resins could be found, the
average sales price of larger scale lignin production as outlined in this study was assumed
to fall within the price range presented above.
Figure 2 shows the results of this analysis. The lignin prices corresponding to the
indexed and feedstock cost adjusted MESP of the NREL process (Humbird et al. 2011)
and the December 2013 market price (Chicago Mercantile Exchange 2013) are presented
in the figure. In addition to the effect of lignin price on the base case MESP, also the
effects of feedstock and enzyme costs are presented in the figure.

PEER-REVIEWED ARTICLE bioresources.com
Kautto et al. (2014). “Organosolv & bioethanol costs,” BioResources 9(4), 6041-6072. 6057
Fig. 2. The effect of lignin selling price on the MESP. Market price in the figure refers to the December 2013 market price of ethanol (Chicago Mercantile Exchange 2013) and NREL to the MESP of the NREL study (Humbird et al. 2011), indexed to 2013 and feedstock cost adjusted. The figure also presents the effect of enzyme and feedstock costs on the MESP.
It is apparent from Fig. 2 that under a very optimistic scenario with lignin sold at
the 2013 phenol price, the MESP would be slightly below 1.0 USD/gal, making the
process very attractive. Under the most pessimistic scenario, with lignin priced at its fuel
value (with coal as the very conservative price reference), the MESP would be
approximately 3.9 USD/gal, considerably higher than the MESP of the NREL dilute acid
process (Humbird et al. 2011), with feedstock cost aligned with the current study and
other costs indexed to 2013 as well as the December 2013 market price of ethanol
(Chicago Mercantile Exchange 2013). This result, unsurprisingly, indicates that unless
higher-valued applications than combustion can be found for lignin, the organosolv
process is not competitive with the NREL dilute acid pretreatment process (Humbird et
al. 2011) nor could it be used to produce ethanol profitably at the market price (not taking
into account any policy instruments to support lignocellulosic ethanol). The lignin prices
corresponding to the MESP of the NREL dilute acid process and December 2013 market
price are 690 USD/MT and 1000 USD/MT, respectively. The lignin price of 1000
USD/MT is close to the prices assumed by Baker (2010) (below 1100 USD/MT) and van
der Linden et al. (2012) (975 USD/MT). These higher prices could be realizable if, for
example, part of the produced lignin could be sold as a phenol substitute.
In addition to presenting the effect lignin price on the base case MESP, Fig. 2 also
presents the effect of variations in feedstock and enzyme costs on the base case MESP.
Feedstock and enzyme made a major contribution to the MESP (Table 6). This also
resulted in a relatively high sensitivity of the MESP to variations in these cost items.
Changing the feedstock price from the base case value of 85 USD/dry MT by 15

PEER-REVIEWED ARTICLE bioresources.com
Kautto et al. (2014). “Organosolv & bioethanol costs,” BioResources 9(4), 6041-6072. 6058
USD/dry MT (70 or 100 USD/dry MT) changed the MESP by 0.23 USD/gal. Changing
the enzyme loading and price from the base case values of 0.02 g enzyme/g cellulose and
5270 USD/MT to a more conservative 0.06 g enzyme/g cellulose and 3700 USD/MT
(Novozymes 2011) increased the MESP by 0.59 USD/gal.
In commercializing the organosolv process, the sensitivity of the MESP to
changes in the lignin price presented in Fig. 2 makes a strong case for market creation for
the lignin product. The figure also demonstrates the importance of enzyme development
and securing of a low-cost feedstock on the viability of this or any other enzymatic
bioethanol production process.
CONCLUSIONS
1. In the previous study (Kautto et al. 2013), the organosolv process was found to have
higher energy consumption and lower ethanol yield than the dilute acid process due to
the recovery of solvent and lower carbohydrate recovery in pretreatment. In the
current study, the increased number of processing steps was further found to increase
the investment cost.
2. A major advantage of the organosolv process is that it enables the production of a
relatively pure organosolv lignin fraction. Also other co-products, namely furfural
and acetic acid can be produced. A larger fraction of the incoming raw material is
therefore converted to products than in the dilute acid process.
3. The price of lignin defines to a considerable degree whether the revenue from the
recovery of the co-products offsets the decreased ethanol yield, poorer energy
economy, and higher investment cost. As there is no commercial scale production of
organosolv lignin, estimating its possible market price is difficult.
4. A wide range of possible lignin prices was therefore studied in sensitivity analyses.
At a base case lignin price of 450 USD/MT, the MESP of the organosolv process was
found to be 3.1 USD/gal, being higher than that of the dilute acid process, which was
used as a reference.
5. A lignin price of 690 USD/MT was required to make the ethanol production of the
organosolv process cost competitive with that of the dilute acid process, illustrating
the importance of finding higher value markets for lignin to make the organosolv
process competitive.
ACKNOWLEDGMENTS
The Finnish Cultural Foundation and Walter Ahlström Foundation are
acknowledged for allocating funding to the first author (Kautto). The second author
(Realff) gratefully acknowledges partial financial support from NSF grant and GOALI
program, CBET 0933392. Mr. Garth Russell and his co-workers at Metso Paper USA,
Mr. Vesa Pylkkänen at American Process Inc., and Mr. Heikki Rinta-Koski at Larson
Engineering are greatly acknowledged for their assistance.

PEER-REVIEWED ARTICLE bioresources.com
Kautto et al. (2014). “Organosolv & bioethanol costs,” BioResources 9(4), 6041-6072. 6059
REFERENCES CITED
Aden, A., Ruth, M., Ibsen, K., Jechura, J., Neeves, K., Sheehan, J., Wallace, B.,
Montague, L., Slayton, A., and Lukas, J. (2002). “Lignocellulosic biomass to ethanol
process design and economics utilizing co-current dilute acid prehydrolysis and
enzymatic hydrolysis for corn stover,” Technical report NREL/TP-510-32438,
National Renewable Energy Laboratory, Golden, Colorado,
(http://www.nrel.gov/docs/fy02osti/32438.pdf).
Arato, C., Pye, E. K., and Gjennestad, G. (2005). “The lignol approach to biorefining of
woody biomass to produce ethanol and chemicals,” Applied Biochemistry and
Biotechnology 123(1-3), 871-882.
AspenTech (2011). Aspen Process Economic Analyzer 7.1. software, Aspen Technology,
Inc., Massachusetts.
Aziz, S., and Sarkanen, K. (1989). “Organosolv pulping – A review,” TAPPI Journal
72(3), 169-175.
Baker, F. S. (2010). “Low cost carbon fiber from renewable resources,” June 7-11,
Washington, DC,
(https://www1.eere.energy.gov/...materials/lm005_baker_2010_o.pdf).
Berguson, B., Eaton, J., and Stanton, B. (2010). “Development of hybrid poplar for
commercial production in the United States: the Pacific Northwest and Minnesota
experience,” Proceedings of the Sustainable Feedstocks for Advanced Fuels,
Sustainable Alternative Fuel Feedstock Opportunities, Challenges and Roadmaps for
Six U.S. Regions, Chapter 17, Soil and Water Conservation Society,
(http://www.swcs.org/documents/resources/Chapter_17__Berguson__Hybrid_Poplar
_24FD5356D6103.pdf).
Bureau of Labor Statistics (2013). “Consumer price index for all urban consumers,”
Series ID CUUR0000SA0, (http://data.bls.gov/cgi-bin/surveymost?bls).
Chemical Engineering July issue (2013). “Economic indicators,” Chemical Engineering
120(7), 60.
Chempolis (2009). “Chempolis biorefinery commissioned,” Chempolis news, February
10 (http://www.chempolis.com/all-news/page/6/).
Chicago Mercantile Exchange (2013). “CBOT Denatured Fuel Ethanol Futures,”
December 27 2013, (http://www.cmegroup.com/trading/energy/ethanol/cbot-
ethanol.html).
CIMV (2013a). CIMV website - Research & Development, (http://www.cimv.fr/research-
development/cimv-research-development.html).
CIMV (2013b). CIMV website – Lignin product page, (http://www.cimv.fr/products/11-
.html).
Dennis, J., Wilcock, K., Matherne, A., and Clark, B. (2013). “ICIS Pricing sample report
– jet kerosene,” 11 August,
(http://www.icispricing.com/il_shared/Samples/SubPage253.asp).
Dias, M.O.S., Pereira da Cunha, M., Maciel Filho, R., Bonomi, A., Jesus, C.D.F., and
Rossell, C.E.V. (2011). “Simulation of integrated first and second generation
bioethanol production from sugarcane: comparison between different biomass
pretreatment methods,” Journal of Industrial Microbiology & Biotechnology 38(8),
955-966.
Dietrich, J. (2013). “ICIS Pricing sample report – phenol (US Gulf),” 8 February,
(http://www.icispricing.com/il_shared/Samples/SubPage131.asp).

PEER-REVIEWED ARTICLE bioresources.com
Kautto et al. (2014). “Organosolv & bioethanol costs,” BioResources 9(4), 6041-6072. 6060
Eggeman, T., and Elander, R. T. (2005). “Process and economic analysis of pretreatment
technologies,” Bioresource Technology 96(18), 2019-2025.
Gnansounou, E., and Dauriat, A. (2010). “Techno-economic analysis of lignocellulosic
ethanol: A review,” Bioresource Technology 101(13), 4980-4991.
González Alriols, M., García, A., Llano-Ponte, R., and Labidi, J. (2010). “Combined
organosolv and ultrafiltration lignocellulosic biorefinery process,” Chemical
Engineering Journal 157(1), 113-120.
Gonzalez, R., Phillips, R., Saloni, D., Jameel, H., Abt, R., Pirraglia, A., and Wright, J.
(2011). "Biomass to energy in the southern United States: Supply chain and delivered
cost," BioResources 6(3), 2954-2976.
Gosselink, R. J. A. (2011). “Lignin as a renewable aromatic resource for the chemical
industry,” PhD Thesis, Wageningen University, Wageningen, Netherlands.
Hamelinck, C. N., van Hooijdonk, G., and Faaij, A. P. C. (2005). “Ethanol from
lignocellulosic biomass: Techno-economic performance in short-, middle- and long
term,” Biomass and Bioenergy 28(4), 384-410.
Hergert, H. L. (1998). “Developments in organosolv pulping – An overview,”
Environmentally Friendly Technologies for the Pulp and Paper Industry, R. A.
Young, and M. Akhtar (eds.),Wiley, New York, pp. 5-67.
Himmel, M. E., Ding, S.-H., Johnson, D. K., Adney, W. S., Nimlos, M. R., Brady, J. W.,
and Foust, T. D. (2007). “Biomass recalcitrance: Engineering plants and enzymes for
biofuels production,” Science 315(5813), 804-807.
Holladay, J. E., Bozell, J. J., White, J. F., and Johnson, D. (2007). “Top value-added
chemicals from biomass, Volume II: Results of screening for potential candidates
from biorefinery lignin,” Report PNNL-16983, Pacific Northwest National
Laboratory and National Renewable Energy Laboratory,
(http://www1.eere.energy.gov/biomass/pdfs/pnnl-16983.pdf).
Huang, H.-J., Ramaswamy, S., Al-Dajani, W., Tschirner, U., and Cairncross, R. A
(2009). “Effect of biomass species and plant size on cellulosic ethanol: A
comparative process and economic analysis,” Biomass and Bioenergy 33(2), 234-246.
Humbird, D., Davis, R., Tao, L., Kinchin, C., Hsu, D., Aden, A., Schoen, P., Lukas, J.,
Olthof, B., Worley, M., Sexton, D., and Dudgeon, D. (2011). “Process design and
economics for biochemical conversion of lignocellulosic biomass to ethanol,”
Technical report NREL/TP-5100-47764, National Renewable Energy Laboratory,
Golden, Colorado, (http://www.nrel.gov/docs/fy11osti/47764.pdf).
Jones, S. B., Valkenburg, C., Walton, C. W., Elliot, D. C., Holladay, J. E., Stevens, D. J.,
Kinchin, C., and Czernik, S. (2009). “Production of gasoline and diesel from biomass
via fast pyrolysis, hydrotreating and hydrocracking: a design case,” PNNL-18284,
Pacific Northwest National Laboratory, Richland, Washington,
(http://www.pnl.gov/main/publications/external/technical_reports/pnnl-18284.pdf).
Kautto, J., Realff, M. J., and Ragauskas, A. J. (2013). “Design and simulation of an
organosolv process for bioethanol production,” Biomass Conversion and Biorefinery
3(3), 199-212.
Kazi, F. K., Fortman, J. A., Anex, R. P., Hsu, D. D., Aden, A., Dutta, A., and
Kothandaraman, G. (2010). “Techno-economic comparison of process technologies
for biochemical ethanol production from corn stover,” Fuel 89(Supplement 1, 1
November), S20-S28.
Kelley, L. (2013). “ICIS Pricing sample report – acetic acid (US Gulf),” 2 February,
(http://www.icispricing.com/il_shared/Samples/SubPage167.asp).

PEER-REVIEWED ARTICLE bioresources.com
Kautto et al. (2014). “Organosolv & bioethanol costs,” BioResources 9(4), 6041-6072. 6061
Khanna, M., and Huang, H. (2010). “The breakeven costs of producing alternative
feedstocks for cellulosic biofuels,” Energy Biosciences Institute, University of
Illinois, (http://miscanthus.ebi.berkeley.edu/biofuel/documents/Feedstock Production
Cost.pdf).
Kim, Y., Ximenes, E., Mosier, N. S., and Ladisch, M. R. (2011). “Soluble
inhibitors/deactivators of cellulase enzymes from lignocellulosic biomass,” Enzyme
and Microbial Technology 48(4-5), 408-415.
Klein-Marcuschamer, D., Oleskowicz-Popiel, P., Simmons, B. A., and Blanch, H. W
(2010). “Technoeconomic analysis of biofuels: A wiki-based platform for
lignocellulosic biorefineries,” Biomass and Bioenergy 34(12), 1914-1921.
Klein-Marcuschamer, D., Oleskowicz-Popiel, P., Simmons, B. A., and Blanch, H. W
(2011). “The challenge of enzyme cost in the production of lignocellulosic biofuels,”
Biotechnology and Bioengineering 109(4), 1083-1087.
Lignol (2009). “Lignol announces production of cellulosic ethanol from new birorefinery
pilot plant,” Lignol Innovations press release, June 8,
(http://www.lignol.ca/news/2009-jun08.html).
Mabee, W. E., Gregg, D. J., Arato, C., Berlin, A., Bura, R., Gilkes, N., Mirochnik, O.,
Pan, X., Pye, E. K., and Saddler J. N. (2006). “Updates on softwood-to-ethanol
process development,” Applied Biochemistry and Biotechnology 129-132(1-3), 55-70.
MarketsandMarkets (2011). “Methylene diphenyl diisocyanate (MDI), Toluene
diisocyanate (TDI) and polyurethane market (2011 – 2016),” Polyurethane market
study, (http://www.marketsandmarkets.com/Market-Reports/mdi-tdi-polyurethane-
market-381.html).
Mesa, L., González, E., Cara, C., Ruiz, E., Castro, E., and Mussatto, S. I. (2010). “An
approach to optimization of enzymatic hydrolysis from sugarcane bagasse based on
organosolv pretreatment,” Journal of Chemical Technology and Biotechnology 85(8),
1092-1098.
Mosier, N., Wyman, C., Dale, B., Elander, R., Lee, Y. Y., Holtzapple, M., and Ladisch,
M. (2005). “Features of promising technologies for pretreatment of lignocellulosic
biomass,” Bioresource Technology 96(6), 673-686.
Novozymes (2011). Personal communication and a Novozymes enzyme application sheet
(Cellic® CTec2 and HTec2) – Enzymes for hydrolysis of lignocellulosic materials.
Pan, X., Arato, C., Gilkes, N., Gregg, D., Mabee, W., Pye, K., Xiao, Z., Zhang, X., and
Saddler, J. (2005). “Biorefining of softwoods using ethanol organosolv pulping:
Preliminary evaluation of process streams for manufacture of fuel-grade ethanol and
co-products,” Biotechnology and Bioengineering 90(4), 473-481.
Pan, X., Gilkes, N., Kadla, J., Pye, K., Saka, S., Gregg, D., Ehara, K., Xie, D., Lam, D.,
and Saddler, J. (2006). “Bioconversion of hybrid poplar to ethanol and co-products
using an organosolv fractionation process: Optimization of process yields,”
Biotechnology and Bioengineering 94(5), 851-861.
Parajó, J. C., and Santos, V. (1995). “Preliminary evaluation of acetic acid-based
processes for wood utilization,” Holz als Roh- und Werkstoff 53(5), 347-353.
Phillips, S., Aden, A., Jechura, J., Dayton, D., and Eggeman, T. (2007).
“Thermochemical ethanol via indirect gasification and mixed alcohol synthesis of
lignocellulosic biomass,” Technical report NREL/TP-510-41168, National Renewable
Energy Laboratory, Golden, Colorado,
(http://www.nrel.gov/biomass/pdfs/41168.pdf).

PEER-REVIEWED ARTICLE bioresources.com
Kautto et al. (2014). “Organosolv & bioethanol costs,” BioResources 9(4), 6041-6072. 6062
Plastics News (2014). “Current resin pricing, thermosets,”
(http://www.plasticsnews.com/resin/thermosets/current-pricing).
Pye, E. K. (2010a). “Industrial lignin production and applications,” Biorefineries –
Industrial Processes and Products: Status Quo and Future Directions, B. Kamm, P.
R. Gruber, and M. Kamm, Wiley, Weinheim, Volume 2, pp. 165-200.
Pye, E. K. (2010b). “Commercializing advanced (second and third generation) biofuels
technologies,” Agricultural Biotechnology International Conference, September 12-
15, Saskatoon, Saskatchewan, Canada,
(http://www.abic.ca/abic2010/html/speakers/PDF%20Web%20Presentations/Energy_
Monday_Pye_E_400_430.pdf).
Ragauskas, A. J., Beckham, G. T, Biddy, M. J., Chandra, R., Chen, F., Davis, M. F.,
Davison, B. H., Dixon, R. A., Gilna, P., Keller, M., Langan, P., Naskar, A. K.,
Saddler, J. N., Tschaplinski, T. J., Tuskan, G. A., and Wyman, C. E. (2014). “Lignin
valorization: improving lignin processing in the biorefinery,” Science 344(6185),
1246843.
Research and Markets (2012). “Phenol-formaldehyde (PF) - A global market watch, 2011
– 2016,” Phenol-formaldehyde resin market study,
(http://www.researchandmarkets.com/reports/2364728/phenolformaldehyde_pf_a_glo
glo_market_watch).
Research and Markets (2013). “Global and China epoxy resin industry report, 2013-
2016,” Epoxy resin market study,
(http://www.researchandmarkets.com/research/w44sgm/global_and_china).
Rushton, M. (2012). “Bio-chemicals and bio-products – the new focus of biorefining,”
CanBio Annual Conference & Trade Show, November 27-28, Vancouver, British
Columbia, Canada, (http://www.canbio.ca/upload/documents/van-12-
presentations/rushton-mike.pdf).
Santos, R. B., Treasure, T., Gonzalez, R., Phillips, R., Myoung Lee, J., Jameel, H., and
Chang, H.-M. (2012). “Impact of hardwood species on production cost of second
generation ethanol,” Bioresource Technology 117, 193-200.
Stewart, D. (2008) “Lignin as a base material for materials applications: Chemistry,
application and economics,” Industrial Crops and Products 27(2), 202-207.
Tao, L., Aden, A., Elander, R. T., Ramesh Pallapolu, V., Lee, Y. Y., Garlock, R. J.,
Balan, V., Dale, B. E., Kim, Y., Mosier, N. S., Ladisch, M. R., Falls, M., Holtzapple,
M. T., Sierra, R., Shi, J., Ebrik, M. A., Redmond, T., Yang, B., Wyman, C. E.,
Hames, B., Thomas, S., and Warner, R. E. (2011). “Process and technoeconomic
analysis of leading pretreatment technologies for lignocellulosic ethanol production
using switchgrass,” Bioresource Technology 102(24), 11105-11114.
U.S. Department of Energy (2011). “U.S. billion-ton update: biomass supply for a
bioenergy and bioproducts industry,” Perlack, R. D., and Stokes, B. J. (Leads)
ORNL/TM-2011/224, Oak Ridge National Laboratory, Oak Ridge, Tennessee,
(http://www1.eere.energy.gov/bioenergy/pdfs/billion_ton_update.pdf).
U.S. Energy Information Administration (2013a). “Natural gas weekly update,” Release
date December 19, 2013, (http://www.eia.gov/naturalgas/weekly/#tabs-prices-2).
U.S. Energy Information Administration (2013b). “Electricity wholesale market data,”
Release date December 12, 2013,
(http://www.eia.gov/electricity/wholesale/index.cfm).

PEER-REVIEWED ARTICLE bioresources.com
Kautto et al. (2014). “Organosolv & bioethanol costs,” BioResources 9(4), 6041-6072. 6063
U.S. Energy Information Administration (2013c). “NYMEX coal futures near-month
contract final settlement price 2013,” Release date December 16, 2013,
(http://www.eia.gov/coal/nymex/).
van der Linden, R., Huijgen, W. J. J., and Reith, J. H. (2012). “Ethanol-based organosolv
biorefineries: feedstock-flexibility & economic evaluation,” Nordic Wood Biorefinery
Conference, October 23-25, Helsinki, Finland.
Zhao, X., Cheng, K., and Liu, D. (2009). “Organosolv pretreatment of lignocellulosic
biomass for enzymatic hydrolysis,” Applied Microbiology and Biotechnology 82(5),
815-827.
Article submitted: March 24, 2014; Peer review completed: May 16, 2014; Revised
version received and accepted: August 12, 2014; Published: August 19, 2014.

PEER-REVIEWED ARTICLE bioresources.com
Kautto et al. (2014). “Organosolv & bioethanol costs,” BioResources 9(4), 6041-6072. 6064
APPENDIX: SUPPLEMENTARY MATERIAL
Supplementary Table 1. Equipment Sizing and Costs (EC Refers to Equipment Cost, IF to Installation Factor, IC to Installed Cost, CB to Costing Basis, SE to Scaling Exponent, [1] to Industry Estimate, [2] to Aspen Process Economic Analyzer (AspenTech 2011), [3] to Humbird et al. (2011), [4] to Aden et al. (2002)). All Costs in MUSD. The Names of the Pieces of Equipment Refer to the Names Used in the Process Flowsheets Presented in the Technical Analysis of the Process (Kautto et al. 2013)
Name Material Qty Size EC IF IC CB SE Remarks
Feed handling 41.7 [1]
Pretreatment and lignin recovery
Digester & washing 73.8 [1]
Flash tank I SS316 1 D 2.6 m, h 2.6 m, V 41.0 m3 0.4 2.0 0.9 [2] 5 min liquid hold-up
Flash tank II SS316 1 D 2.4 m, h 7.5 m, V 34.9 m3 0.1 2.0 0.3 [2] 5 min liquid hold-up
Flash tank III SS316 1 D 2.4 m, h 7.2 m, V 33.5 m3 0.1 2.0 0.2 [2] 5 min liquid hold-up
Post-hydrolysis reactor SS316 1 D 5.5 m, h 16.6 m, V 393 m3 1.2 2.0 2.4 [2] Costed as a vertical tank,
residence time 60 min Agitator SS316 1 0.1 1.5 0.1 [3] 0.5
Dilution & mixing tank SS316 1 D 4.0 m, h 13.7 m, V 169 m3 0.6 2.0 1.2 [2] Costed as an agitated tank,
residence time 10 min
Lignin filter SS316 1 2.2 1.7 3.8 [3] 0.8 Pressure filter, scaled based on solids flow
Filtration auxiliary equipment
0.6 1.5-3.1
1.3 [3] 0.5-0.8
Pumps, tanks, compressors, agitator, cake screw & conveyor
Lignin spray dryer CS 2 1.3 1.7 2.3 [2]
Screen SS 1 0.7 1.7 1.2 [2] Costed as a screen and dewatering unit
Heat exchanger I SS316;SS 1 Area 170 m2 0.1 2.2 0.1 [2] Shell and tube (S&T), overdesign factor (OF) 1.15
Heat exchanger II SS316;SS 1 Area 80 m2 0.0 2.2 0.1 [2] S&T, OF 1.15
Heat exchanger III SS304;SS316 1 Area 530 m2 0.2 2.2 0.4 [2] S&T, OF 1.15
Pumps 7 0.4 OF 1.10
Total process area 88.5

PEER-REVIEWED ARTICLE bioresources.com
Kautto et al. (2014). “Organosolv & bioethanol costs,” BioResources 9(4), 6041-6072. 6065
Name Material Qty Size EC IF IC CB SE Remarks
Solvent and furfural recovery
Recovery column I
Tower SS316 1 D 5.5 m, h 25.0 m, actual number of trays 35
2.2 2.4 5.3 [2] Tray efficiency 70%
Condenser SS316; SS316
1 Area 3900 m2 1.8 2.4 4.4 [2]
Reboiler SS316; SS316
1 Area 1910 m2 1.3 2.4 3.2 [2]
Recovery column II
Tower SS316 1 D 8.2 m, h 25.0 m, actual number of trays 35
3.8 2.4 9.1 [2] Tray efficiency 70%
Condenser SS316;CS 1 Area 10100 m2 2.5 2.4 6.1 [2]
Reboiler SS316; SS316
1 [2] Condenser of Recovery column I
Furfural distillation
Tower SS316 1 D 0.3 m, h 13.4 m, actual number of trays 16
0.1 2.4 0.2 [2] Tray efficiency 70%
Reboiler & condenser
SS316;CS 1 Condenser 1.5 m2, reboiler 6.1 m2
0.1 2.4 0.2 [2]
Decanter I SS304 D 0.9 m, h 2.7 m, V 1.8 m3 0.0 2.0 0.05 [2] Costed as a vertical tank, residence time 5 min
Heat exchanger IV SS304;SS316 1 Area 1250 m2 0.5 2.2 1.1 [2] S&T, OF 1.15
Heat exchanger V SS316;CS 1 Area 10 m2* 0.0 2.2 0.05 [2] S&T, OF 1.15
Heat exchanger VI SS304;CS 1 Area 5 m2* 0.0 2.2 0.05 [2] S&T, OF 1.15
Heat exchanger VII SS304;SS316 1 Area 10 m2* 0.0 2.2 0.05 [2] S&T, OF 1.15
Heat exchanger VIII SS316;SS 1 Area 850 m2 0.3 2.2 0.6 [2] S&T, OF 1.15
Pumps 5 0.2 [2] OF 1.1
Total process area 30.7
Conditioning of the hemicellulosic sugar stream
Evaporation Effects SS304 4 Total area 15600 m2 4.3 2.1 9.1 [4] 0.7 Scaled based on area Auxiliaries SS304 0.8 1.9 [4] Pumps, condenser

PEER-REVIEWED ARTICLE bioresources.com
Kautto et al. (2014). “Organosolv & bioethanol costs,” BioResources 9(4), 6041-6072. 6066
Name Material Qty Size EC IF IC CB SE Remarks
Separation of tarry lignin
SS304 1 Decanter 1.5 m, L 6.2 m, V 23.5 m3
0.1 0.2 [2], [3]
0.8
Decanter (costed as a horizontal vessel), screw, conveyor
LMW lignin separation Mixers SS304 4 D 1.7 m, h 1.7 h, V 3.8 m3 0.2 1.7 0.4 [2] Agitated vessel (5 min) Settlers SS304 4 D 1.0 m, L 3.9 m, V 2.8 m3 0.1 1.7 0.2 [2] Horizontal vessel (5 min)
Furfural vacuum distillation
Tower SS316 1 D 3.4 m, h 6.7 m, actual number of trays 6
0.4 2.4 1.1 [2] Tray efficiency 70%
Condenser SS316;CS 1 Area 870 m2 0.5 2.4 1.2 [2] Reboiler SS316;CS 1 Area 1240 m2 0.6 2.4 1.3 [2]
Steam stripping SS316 1 D 2.9 m, h 9.1 m, actual number of trays 9
0.4 2.4 0.9 [2] Tray efficiency 70%
Neutralization SS304;SS 1 0.1 0.2 [3] 0.5-0.7
Tank, agitator, mixer, scaled on mass flow
Decanter II SS304 1 D 1.5 m, h 4.4 m, V 8.1 m3 0.0 2.0 0.1 [2] Costed as a vertical tank, residence time 5 min
Heat exchanger IX SS304;CS 1 Area 30 m2 0.0 2.2 0.1 [2] S&T, OF 1.15
Heat exchanger X SS316;SS316 1 Area 1020 m2 0.5 2.2 1.0 [2] S&T, OF 1.15
Heat exchanger XI SS304;CS 1 Area 70 m2 0.0 2.2 0.1 [2] S&T, OF 1.15
Heat exchanger XII SS316;SS304 1 Area 980 m2 0.4 2.2 0.9 [2] S&T, OF 1.15
Pumps 4 0.1 [2] OF 1.1
Total process area 18.7
Acetic acid recovery
AA extraction column Mixers SS316 4 D 3.6 m, h 3,6 m, V 37.1 m3 1.0 1.7 1.7 [2] Agitated vessel (5 min) Settlers SS316 4 D 3.0 m, L 12.1 m, V 86.2 m3 0.5 1.7 0.9 [2] Horizontal vessel (5 min)
AA distillation column I
Tower SS316L 1 D 1.4 m, h 6.7 m, actual number of trays 5
0.1 2.4 0.3 [2] Tray efficiency 70%
Reboiler & condenser
SS316L;CS 1 Condenser 6 m2, reboiler 180 m2
0.1 2.4 0.1 [2] Includes a decanter

PEER-REVIEWED ARTICLE bioresources.com
Kautto et al. (2014). “Organosolv & bioethanol costs,” BioResources 9(4), 6041-6072. 6067
Name Material Qty Size EC IF IC CB SE Remarks
AA distillation column II
Tower SS316L 1 D 6.6 m, h 11.6 m, actual number of trays 13
1.5 2.4 3.5 [2] Tray efficiency 70%
Reboiler & condenser
SS316L;CS 1 Condenser 610 m2, reboiler 180 m2
0.4 2.4 0.9 [2] Includes a decanter
AA distillation column III
Tower SS316L 1 D 1.2 m, h 46.3 m, actual number of trays 70
1.2 2.4 3.0 [2] Tray efficiency 70%
Reboiler & condenser
SS316L;CS 1 Condenser 33 m2, reboiler 56 m2
0.1 2.4 0.2 [2]
Decanter III SS304 1 D 0.8 m, h 2.4 m, V 2.4 m3 0.0 2.0 0.1 [2] Costed as a vertical tank (5 min)
Heat exchanger XIII SS316;SS316 1 Area 780 m2 0.4 2.2 0.9 [2] S&T, OF 1.15
Heat exchanger XIV SS316;SS316 1 Area 10 m2* 0.0 2.2 0.1 [2] S&T, OF 1.15
Heat exchanger XV SS316;SS316 1 Area 20 m2* 0.0 2.2 0.1 [2] S&T, OF 1.15
Pumps 3 0.2 [2] OF 1.1
Total process area 11.9
Enzymatic hydrolysis and fermentation
Enzyme-hydrolyzate mixer
SS316 1 0.2 [3] 0.5 Scaled on the hydrolyzate mass flow
Hydrolysis tanks SS304 6.4 [3] 0.7 Same scaling basis as above
Ethanol fermentation tanks
15.1 [3] 0.7 Scaled on beer flow leaving fermentation, includes coolers and agitators
Beer storage tank SS316 1 1.2 [3] 0.5-0.7
Scaled on beer leaving beer tank, includes an agitator
Seed fermentation tanks
SS304 3.5 [3] 0.5-0.7
Scaled on inoculum flow, includes coils and agitators.
Seed hold tank SS316 1 0.8 [3] 0.5-0.7
Scaled on inoculum flow, includes an agitator.
Heat exchanger XVI SS;CS 1 Area 230 m2 0.1 2.2 0.1 [2] S&T, OF 1.15
Pumps 5 0.3 [3] 0.8 OF 1.1
Total process area 27.7

PEER-REVIEWED ARTICLE bioresources.com
Kautto et al. (2014). “Organosolv & bioethanol costs,” BioResources 9(4), 6041-6072. 6068
Name Material Qty Size EC IF IC CB SE Remarks
Ethanol product and solids recovery
Beer & rectification columns
SS316;CS 1 8.2 [3] 0.6
Includes reboilers, beer column condenser, and feed heat exchanger, scaled on EtOH flow to molecular sieves
Water scrubber SS304;PP 1 0.5 [3] 0.6-0.8
Scaled on the total vents flow, includes a pump
Molecular sieve package
SS 1 4.7 [3] 0.6 Scaled on the EtOH product stream
Insolubles filter SS316 1 3.7 [3] 0.8 Scaled on the insolubles stream
Auxiliary equipment 1.3 [3] 0.6-0.8
Auxiliaries include pumps, tanks, compressors, agitator, cake screw, and conveyor, scaled on the insolubles stream
Total process area 18.4
Wastewater treatment 53.5 [3] Not scaled, assumed similar to [3]
Storage 5.4 [3] Not scaled, similar to [3]
Boiler and turbine 82.3 [3] 0.6 Scaled on heat load
Utilities
Cooling tower system 3.4 [3] 0.6 Scaled on cooling duty
Chilled water package 1.8 [3] 0.6 Scaled on cooling duty
Plant/instrument air 0.1 [3] Not scaled, similar to [3]
Process water system 0.6 [3] Not scaled, similar to [3]
Sterile water & CIP/CS systems
1.4 [3] Not scaled, similar to [3]
Total process area 7.3
Total installed equipment cost
386
*Small heat exchangers that could possibly be omitted

PEER-REVIEWED ARTICLE bioresources.com
Kautto et al. (2014). “Organosolv & bioethanol costs,” BioResources 9(4), 6041-6072. 6069
Supplementary Table 2. Variable Operating Costs and Revenues from By-products
MT/hr Price, USD/MT
Source of the price Cash flow, MUSD/a
Remarks
Variable costs
Feedstock (as dry) 98.0 85 Berguson et al. 2010
70.1 Debarked hardwood 83.3 MT/hr, bark and losses 14.7 MT/hr
Chemicals Cellulase 0.6 5270 Novozymes 2011 28.7 Sulfuric acid 0.8 130 Humbird et al. 2011 0.9 Ammonia 0.5 590 Humbird et al. 2011 2.6 Corn steep liquor 1.1 75 Humbird et al. 2011 0.7 Diammonium phosphate
0.1 1300 Humbird et al. 2011 1.5
Sorbitol 0.03 1490 Humbird et al. 2011 0.4 Scaled based on flow to the seed train (Humbird et al. 2011) Caustic 1.1 200 Humbird et al. 2011 1.9 Scaled based on ammonia usage (Humbird et al. 2011) Flue gas desulfurization lime
0.4 270 Humbird et al. 2011 0.9 Scaled based on sulfuric acid usage (Humbird et al. 2011)
Cooling tower chemicals
0.002 4040 Humbird et al. 2011 0.1 Usage assumed similar to Humbird et al. (2011)
Make-up water 147.1 0.22 Humbird et al. 2011 0.3 Kerosene 0.005 1090 Dennis et al. 2013 0.05
Total chemicals 37.9
Ash disposal 2.6 36 Humbird et al. 2011 0.8
Natural gas 2.3 4.17 (USD/GJ)
4.1 Source U.S. Energy Information Administration 2013a
Total variable costs 112.9
Revenues from by-products
Organosolv lignin 12.9 450 Estimate 49.0
Furfural 0.3 1600 Arato et al. 2005 3.7 Net furfural production, taking the make-up furfural required in the furfural extraction into account
Acetic acid 1.3 600 Kelley 2013 6.4
Electricity 3.6 (MW)
52.2 (USD/MWh)
1.6 Source U.S. Energy Information Administration 2013b
Total by-product revenues
60.6

PEER-REVIEWED ARTICLE bioresources.com
Kautto et al. (2014). “Organosolv & bioethanol costs,” BioResources 9(4), 6041-6072. 6070
Supplementary Table 3. Minimum Ethanol Selling Price (MESP) Calculation (in MUSD)
Year 1 2 3 4 5 6 7 8 9 10 11 12 13 14 15 16 17
Fixed capital investment
21.9 164.3 87.6
Land 3.1
Working capital 34.2
Loan payment 61.2 61.2 61.2 61.2 61.2 61.2 61.2 61.2 61.2 61.2
Loan interest payment
2.6 22.3 32.9 32.9 30.6 28.1 25.5 22.6 19.6 16.2 12.6 8.7 4.5
Loan principal 32.9 279.3 410.8 382.4 351.8 318.7 283.0 244.4 202.8 157.8 109.2 56.7 0.0
Ethanol sales 144.8 165.5 165.5 165.5 165.5 165.5 165.5 165.5 165.5 165.5 165.5 165.5 165.5 165.5
Lignin sales 42.8 49.0 49.0 49.0 49.0 49.0 49.0 49.0 49.0 49.0 49.0 49.0 49.0 49.0
Other sales 10.2 11.7 11.7 11.7 11.7 11.7 11.7 11.7 11.7 11.7 11.7 11.7 11.7 11.7
Total sales 197.9 226.1 226.1 226.1 226.1 226.1 226.1 226.1 226.1 226.1 226.1 226.1 226.1 226.1
Annual manufacturing costs
Feedstock 61.3 70.1 70.1 70.1 70.1 70.1 70.1 70.1 70.1 70.1 70.1 70.1 70.1 70.1
Cellulase 26.9 28.7 28.7 28.7 28.7 28.7 28.7 28.7 28.7 28.7 28.7 28.7 28.7 28.7
Natural gas 3.8 4.1 4.1 4.1 4.1 4.1 4.1 4.1 4.1 4.1 4.1 4.1 4.1 4.1
Baghouse bags 0.7 0.7 0.7
Other variable costs 9.4 10.0 10.0 10.0 10.0 10.0 10.0 10.0 10.0 10.0 10.0 10.0 10.0 10.0
Fixed costs 17.1 17.1 17.1 17.1 17.1 17.1 17.1 17.1 17.1 17.1 17.1 17.1 17.1 17.1
Total product costs 119.2 130.0 130.0 130.0 130.0 130.6 130.0 130.0 130.0 130.0 130.6 130.0 130.0 130.0
Annual depreciation
General plant
DDB 172.1 122.9 87.8 62.7 44.8 29.9 14.9
SL 86.0 71.7 61.5 54.9 52.3 52.3 52.3
Remaining value 602.3 430.2 307.3 219.5 156.8 104.5 52.3
Actual 172.1 122.9 87.8 62.7 52.3 52.3 52.3
Steam plant
DDB 6.2 5.7 5.3 4.9 4.5 4.2 3.9 3.6 3.3 3.0 2.8 2.5 2.2 1.9
SL 4.1 4.0 3.9 3.8 3.8 3.7 3.7 3.7 3.7 3.7 3.7 3.7 3.7 3.7

PEER-REVIEWED ARTICLE bioresources.com
Kautto et al. (2014). “Organosolv & bioethanol costs,” BioResources 9(4), 6041-6072. 6071
Remaining value 82.3 76.2 70.5 65.2 60.3 55.8 51.6 47.7 44.0 40.4 36.7 33.0 29.4 25.7
Actual 6.2 5.7 5.3 4.9 4.5 4.2 3.9 3.7 3.7 3.7 3.7 3.7 3.7 3.7
Net revenue -132.5
-63.1 -25.1 3.1 16.7 19.5 23.8 79.9 83.8 87.9 91.8 92.5 92.5 92.5
Losses forward -132.5
-195.5
-220.6
-217.5
-200.8
-181.3
-157.5
-77.6 0.0 0.0 0.0 0.0 0.0
Taxable income -132.5
-195.5
-220.6
-217.5
-200.8
-181.3
-157.5
-77.6 6.1 87.9 91.8 92.5 92.5 92.5
Income tax 0.0 0.0 0.0 0.0 0.0 0.0 0.0 0.0 2.1 30.8 32.1 32.4 32.4 32.4
Annual cash income 17.4 34.9 34.9 34.9 34.9 34.3 34.9 34.9 32.8 4.2 63.4 63.8 63.8 63.8
PV of annual CF 13.1 23.9 21.7 19.7 17.9 16.0 14.8 13.5 11.5 1.3 18.4 16.8 15.3 13.9
Total capital investment + interest
27.6 169.7 127.9
Year 18 19 20 21 22 23 24 25 26 27 28 29 30 31 32 33
Fixed capital investment
Land -3.1
Working capital -34.2
Loan payment
Loan interest payment
Loan principal
Ethanol sales 165.5 165.5 165.5 165.5 165.5 165.5 165.5 165.5 165.5 165.5 165.5 165.5 165.5 165.5 165.5 165.5
Lignin sales 49.0 49.0 49.0 49.0 49.0 49.0 49.0 49.0 49.0 49.0 49.0 49.0 49.0 49.0 49.0 49.0
Other sales 11.7 11.7 11.7 11.7 11.7 11.7 11.7 11.7 11.7 11.7 11.7 11.7 11.7 11.7 11.7 11.7
Total sales 226.1 226.1 226.1 226.1 226.1 226.1 226.1 226.1 226.1 226.1 226.1 226.1 226.1 226.1 226.1 226.1
Annual manufacturing costs
Feedstock 70.1 70.1 70.1 70.1 70.1 70.1 70.1 70.1 70.1 70.1 70.1 70.1 70.1 70.1 70.1 70.1
Cellulase 28.7 28.7 28.7 28.7 28.7 28.7 28.7 28.7 28.7 28.7 28.7 28.7 28.7 28.7 28.7 28.7
Natural gas 4.1 4.1 4.1 4.1 4.1 4.1 4.1 4.1 4.1 4.1 4.1 4.1 4.1 4.1 4.1 4.1
Baghouse bags 0.7 0.7 0.7

PEER-REVIEWED ARTICLE bioresources.com
Kautto et al. (2014). “Organosolv & bioethanol costs,” BioResources 9(4), 6041-6072. 6072
Other variable costs 10.0 10.0 10.0 10.0 10.0 10.0 10.0 10.0 10.0 10.0 10.0 10.0 10.0 10.0 10.0 10.0
Fixed costs 17.1 17.1 17.1 17.1 17.1 17.1 17.1 17.1 17.1 17.1 17.1 17.1 17.1 17.1 17.1 17.1
Total product costs 130.0 130.6 130.0 130.0 130.0 130.0 130.6 130.0 130.0 130.0 130.0 130.6 130.0 130.0 130.0 130.0
Annual depreciation
General plant
DDB
SL
Remaining value
Actual
Steam plant
DDB 1.7 1.4 1.1 0.8 0.6 0.3
SL 3.7 3.7 3.7 3.7 3.7 3.7
Remaining value 22.0 18.4 14.7 11.0 7.3 3.7
Actual 3.7 3.7 3.7 3.7 3.7 3.7
Net revenue 92.5 91.8 92.5 92.5 92.5 92.5 95.5 96.2 96.2 96.2 96.2 95.5 96.2 96.2 96.2 96.2
Losses forward 0.0 0.0 0.0 0.0 0.0 0.0 0.0 0.0 0.0 0.0 0.0 0.0 0.0 0.0 0.0 0.0
Taxable income 92.5 91.8 92.5 92.5 92.5 92.5 95.5 96.2 96.2 96.2 96.2 95.5 96.2 96.2 96.2 96.2
Income tax 32.4 32.1 32.4 32.4 32.4 32.4 33.4 33.7 33.7 33.7 33.7 33.4 33.7 33.7 33.7 33.7
Annual cash income 63.8 63.4 63.8 63.8 63.8 63.8 62.1 62.5 62.5 62.5 62.5 62.1 62.5 62.5 62.5 62.5
PV of annual CF 12.6 11.4 10.4 9.5 8.6 7.8 6.9 6.3 5.8 5.2 4.8 4.3 3.9 3.6 3.3 3.0
Total capital investment + interest
Discount rate 10%, interest on loan 8%, payback period for loan 10 years, income tax 35%, net present value (of annual CF) 0.0, MESP 3.07 USD/ga