econ 219b psychology and economics: applications ... auctions • proxy bidding – bidders submit...
TRANSCRIPT

Econ 219B
Psychology and Economics: Applications
(Lecture 12 and last)
Stefano DellaVigna
May 1, 2013
Outline
1. Methodology: Markets and Non-Standard Behavior
2. Market Reaction to Biases: Corporate Decisions
3. Market Reaction to Biases: Employers
4. Market Reaction to Biases: Behavioral Finance
5. Market Reaction to Biases: Political Economy
6. Welfare Response to Biases
7. Concluding Remarks

1 Methodology: Markets and Non-Standard Be-
havior
• Why don’t market forces eliminate non-standard behavior?
• Common Chicago-type objection
• Argument 1. Experience reduces non-standard behavior.— Experience appears to mitigate the endowment effect (List, 2003 and2004).
— Experience improves ability to perform backward induction (Palacios-Huerta and Volji, 2007 and 2008)
— BUT: Maybe experience does not really help (Levitt, List, and Reiley,2008)
— What does experience imply in general?
∗ Feedback is often infrequent (such as in house purchases) or noisy(such as in financial investments) —not enough room for experience
∗ Experience can exacerbate a bias if individuals are not Bayesian learn-ers (Haigh and List 2004)
∗ Not all non-standard features should be mitigated by experience.Example: social preferences
∗ Debiasing by experienced agents can be a substitute for direct expe-rience. However, as Gabaix and Laibson (2006) show, experiencedagents such as firms typically have little or no incentive to debiasindividuals

• Curse of Debiasing (Gabaix-Laibson 2006)— Credit Card A teaser fees on $1000 balance:
∗ $0 for six months∗ $100 fee for next six months
— Cost of borrowing to company $100 — Firm makes 0 profit in PerfectlyCompetitive market
— Naive consumer:
∗ Believes no borrowing after 6 months∗ Instead keeps borrowing∗ Expects cost of card to be $0, instead pays $100
• Can Credit Card B debias consumers and profit from it?— Advertisement to consumers: ‘You will borrow after 6 months!’
— Offer rate of
∗ $50 for six months∗ $50 for next six months
• What do consumers (now sophisticated) do?— Stay with Card A
∗ Borrow for 6 months at $0∗ Then switch to another company
• No debiasing in equilibrium

• System of transfers:— Firms take advantage of naive consumers
— Sophisticated consumers benefit from naive consumers
• Related: Suppose Credit Card B can identify naive consumer— What should it do?
— If debias, then lose consumer
— Rather, take advantage of consumer

• Argument 2. Even if experience or debiasing do not eliminate the biases,the biases will not affect aggregate market outcomes
— Arbitrage — Rational investors set prices
— However, limits to arbitrage (DeLong et al., 1991) — individuals withnon-standard features affect stock prices
— In addition, in most settings, there is no arbitrage!
∗ Example: Procrastination of savings for retirement∗ (Keep in mind SMRT plan though)
— Behavioral IO: Non-standard features can have a disproportionate im-pact on market outcomes
∗ Firms focus pricing on the biases∗ Lee and Malmendier (2011) on overbidding in eBay auctions

eBay Auctions
• Proxy bidding– Bidders submit “maximum willingness to pay”– Quasi-second price auction: price outstanding increased
to prior leading maximum willingness to pay + increment (see Table 1).
• Fixed prices (“Buy-it-now”)– Immediate purchase.– Listing on same webpage, same list, same formatting.– About 1/3 of eBay listings
Key ingredient for analysis.Persistent presence of buy-it-now price as a
(conservative) upper limit of bids
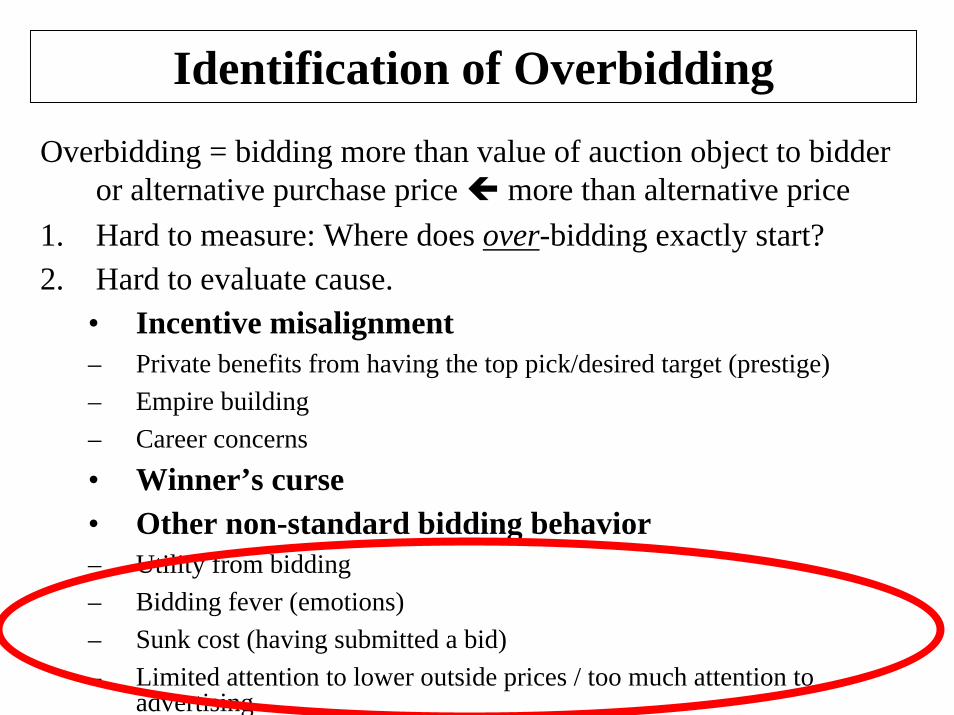
Identification of OverbiddingOverbidding = bidding more than value of auction object to bidder
or alternative purchase price more than alternative price1. Hard to measure: Where does over-bidding exactly start?2. Hard to evaluate cause.
• Incentive misalignment– Private benefits from having the top pick/desired target (prestige)– Empire building– Career concerns• Winner’s curse• Other non-standard bidding behavior– Utility from bidding– Bidding fever (emotions)– Sunk cost (having submitted a bid)– Limited attention to lower outside prices / too much attention to
advertising

The Object

The Data
• Hand-collected data of all auctions and Buy-it-now transactions of Cashflow 101 on eBay from 2/19/2004 to 9/6/2004.
• Cashflow 101: board game with the purpose of finance/accounting education.
• Retail price : $195 plus shipping cost ($10.75) from manufacturer (www.richdad.com).
• Two ways to purchase Cashflow 101 on eBay– Auction (quasi-second price proxy bidding)– Buy-it-now

Sample• Listings (excluding non-US$, bundled offers)
– 287 by individuals (187 auctions only, 19 auctions with buy-it-now option)
– 401 by two retailers (only buy-it-now)
• Remove terminated, unsold items, hybrid offers that ended early (buy-it-now) and items without simultaneous professional buy-it-now listing. 2,353 bids, 806 bidders, 166 auctions
• Buy-it-now offers of the two retailers– Continuously present for all but six days. (Often individual buy-it-
now offers present as well; they are often lower.)– 100% and 99.9% positive feedback scores.– Same prices $129.95 until 07/31/2004; $139.95 since 08/01/2004.– Shipping cost $9.95; other retailer $10.95.– New items (with bonus tapes/video).

Listing Example (02/12/2004)

Listing Example – Magnified
Pricing:
[Buy Now] $129.95
Pricing:$140.00

Overbidding
Given the information on the listing website:• (H0) An auction should never end at a price
above the concurrently available purchase price.

Figure 1. Starting Price (startprice)46% below $20; mean=$46.14; SD=43.81only 3 auctions above buy-it-now
0
10
20
30
40
50
60
70
80
10 20 30 40 50 60 70 80 90 100 110 120 130 140 150
Starting Price
Freq
uenc
y

Figure 2. Final Price (finalprice)43% are above “buy-it-now” (mean $132.55; SD 17.03)
0
10
20
30
40
50
60
90 100 110 120 130 140 150 160 170 180Final Price
Freq
uenc
y
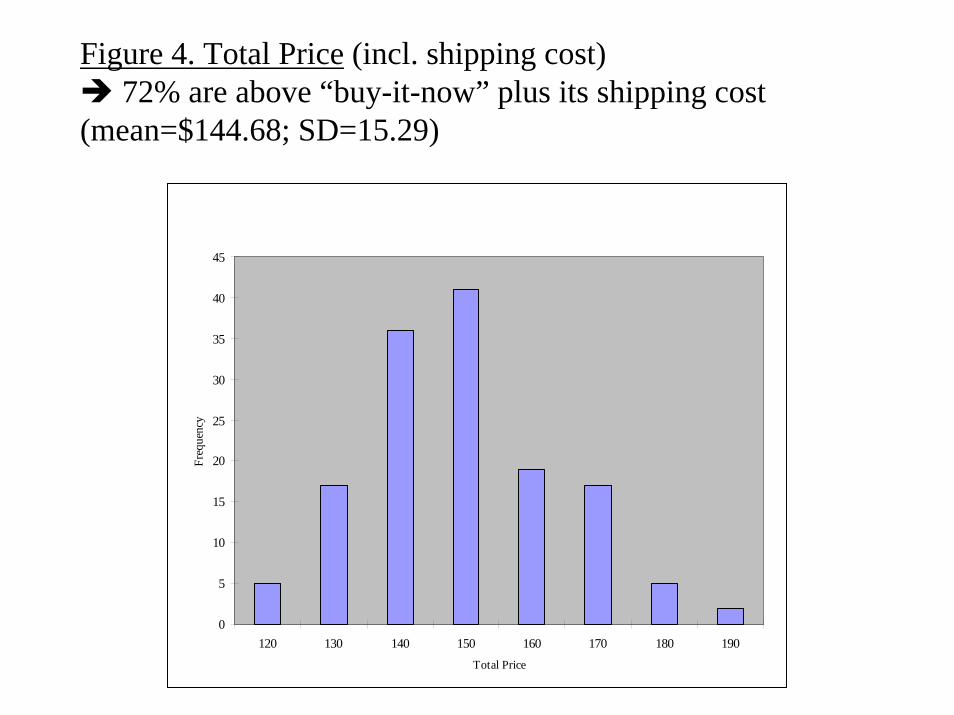
Figure 4. Total Price (incl. shipping cost)72% are above “buy-it-now” plus its shipping cost
(mean=$144.68; SD=15.29)
0
5
10
15
20
25
30
35
40
45
120 130 140 150 160 170 180 190Total Price
Freq
uenc
y
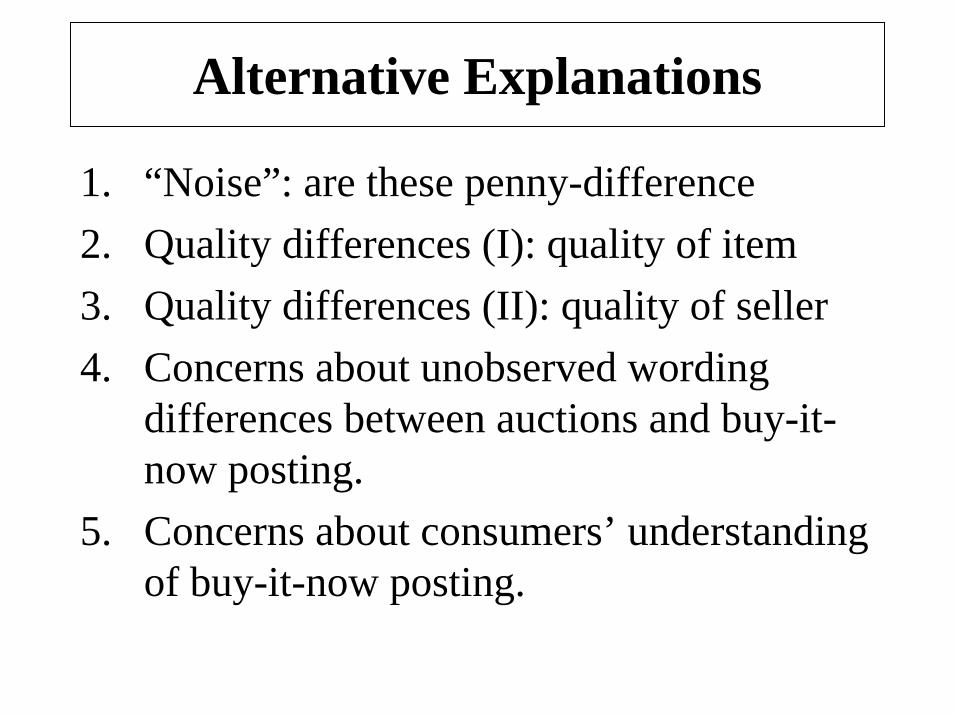
Alternative Explanations
1. “Noise”: are these penny-difference2. Quality differences (I): quality of item3. Quality differences (II): quality of seller4. Concerns about unobserved wording
differences between auctions and buy-it-now posting.
5. Concerns about consumers’ understanding of buy-it-now posting.

• Bidders with bias have disproportionate impact
• Opposite of Chicago intuition

2 Market Reaction to Biases: Corporate Deci-sions
• Baker, Ruback, and Wurgler (2005)
• Behavioral corporate finance:— biased investors (overvalue or undervalue company)
— smart managers
— (Converse: biased (overconfident) managers and rational investors)
• Firm has to decide how to finance investment project:1. internal funds (cash flow/retained earnings)
2. bonds
3. stocks

• Fluctuation of equity prices due to noise traders
• Managers believe that the market is inefficient— Issue equity when stock price exceeds perceived fundamental value
— Delay equity issue when stock price below perceived fundamental value
• Consistent with— Survey Evidence of 392 CFO’s (Graham and Harvey 2001): 67% sayunder/overvaluation is a factor in issuance decision
— Insider trading
• Go over quickly two examples

• Long-run performance of equity issuers— Market Timing prediction: Companies issuing equity underperformlater
— Loughran-Ritter (1995): Compare matching samples of
∗ companies doing IPOs∗ companies not doing IPOs but have similar market cap.

• Similar finding with SEOs

3 Market Reaction to Biases: Employers
• Kahneman, Knetsch and Thaler (1986): Telephone surveys in Canadain 1984 and 1985 — Ask questions on fairness
• — A real and nominal wage cut is not fair (Question 4A)
— A real (but not nominal) wage cut is fair (Question 4B)

• If this is true, expect employers to minimize cases of −−1 0
• Card and Hyslop, 1997: Examine discontinuity around 0 of nominal wagechanges
• Prediction of theory:

• Data sources:— 1979-1993 CPS.∗ Rolling 2-year panel∗ Restrict to paid by the hour and to same 2-digit industry in the twoyears
∗ Restrict to non-minimum wage workers— PSID 4-year panels 1976-79 and 1985-88
• Use Log Wage changes: log − log−1
• Issue with measurement error and heaping at log − log−1 = 0
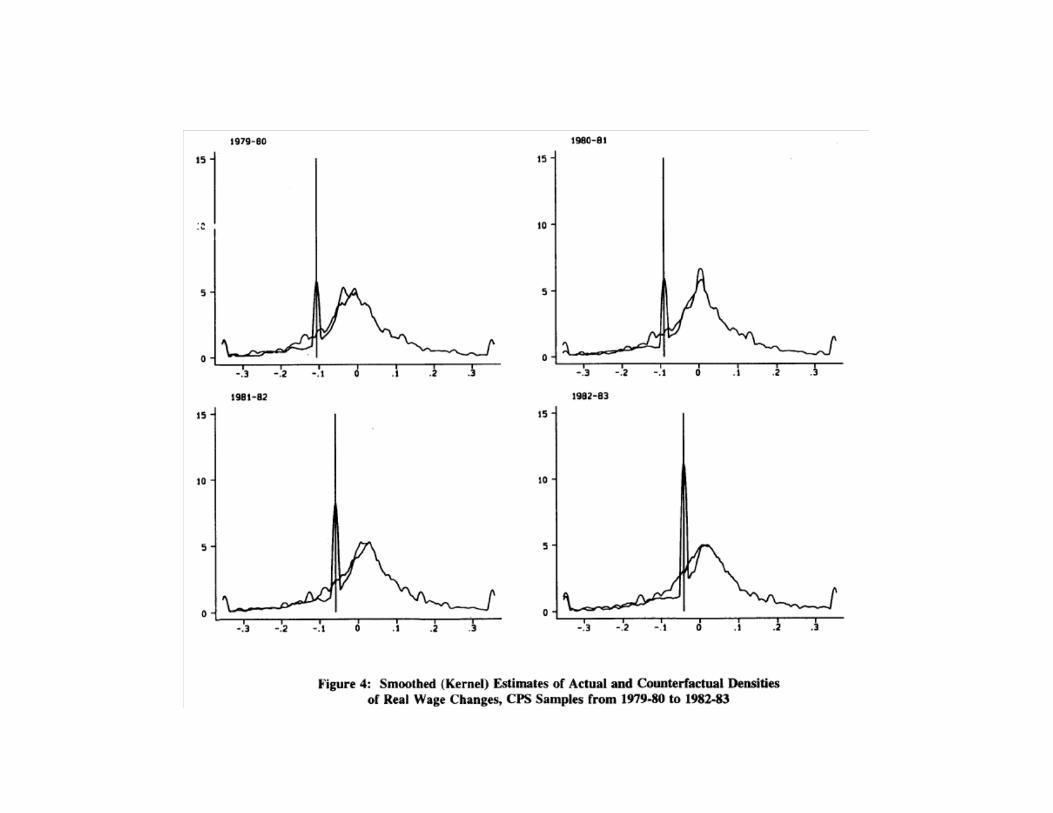
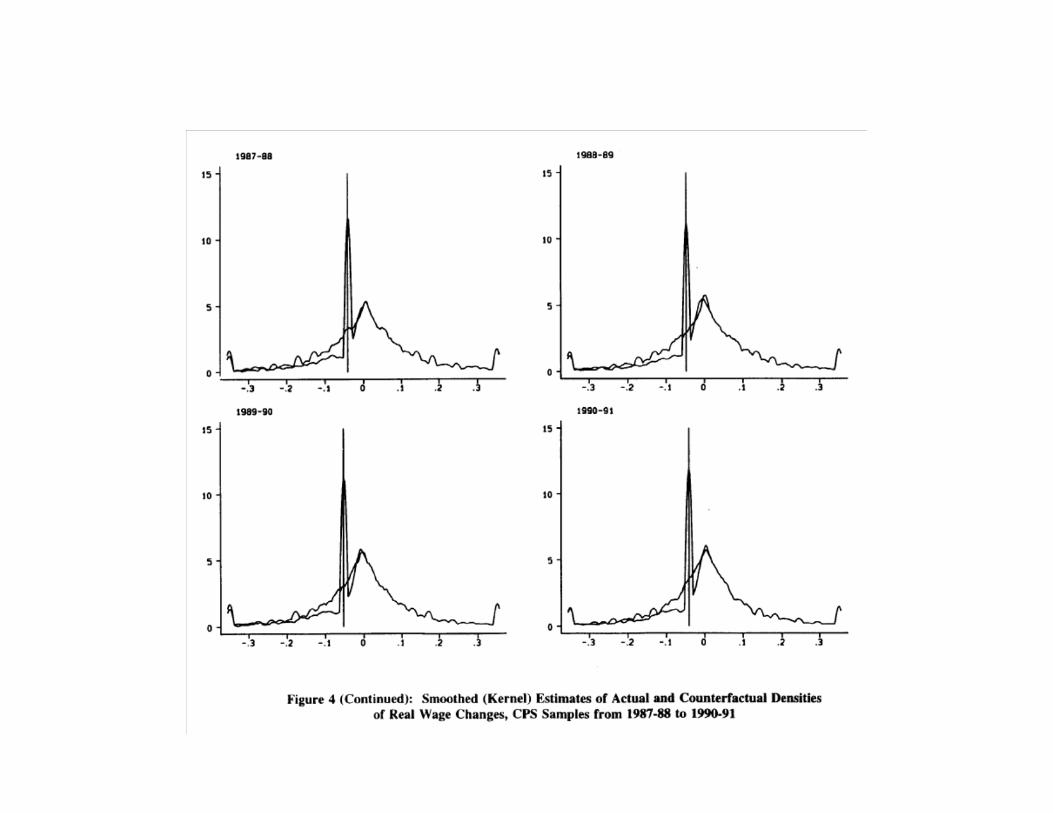
• Construct counterfactual density of LogWage changes— Assume symmetry— Positive log wage changes would not be affected

• Plots using kernel estimates of density (local smoother)
• Compare the actual distribution and the predicted one
• Evidence from the CPS year-by-year
• Problem more severe in years with lower inflation
• Large effect of nominal rigidities
• Effect on firings?


4 Market Reaction to Biases: Behavioral Finance
• Who do ‘smart’ investors respond to investors with biases?
• First, brief overview of anomalies in Asset Pricing (from Barberis andThaler, 2004)
1. Underdiversification.
(a) Too few companies.
— Investors hold an average of 4-6 stocks in portfolio.
— Improvement with mutual funds
(b) Too few countries.
— Investors heavily invested in own country.
— Own country equity: 94% (US), 98% (Japan), 82% (UK)
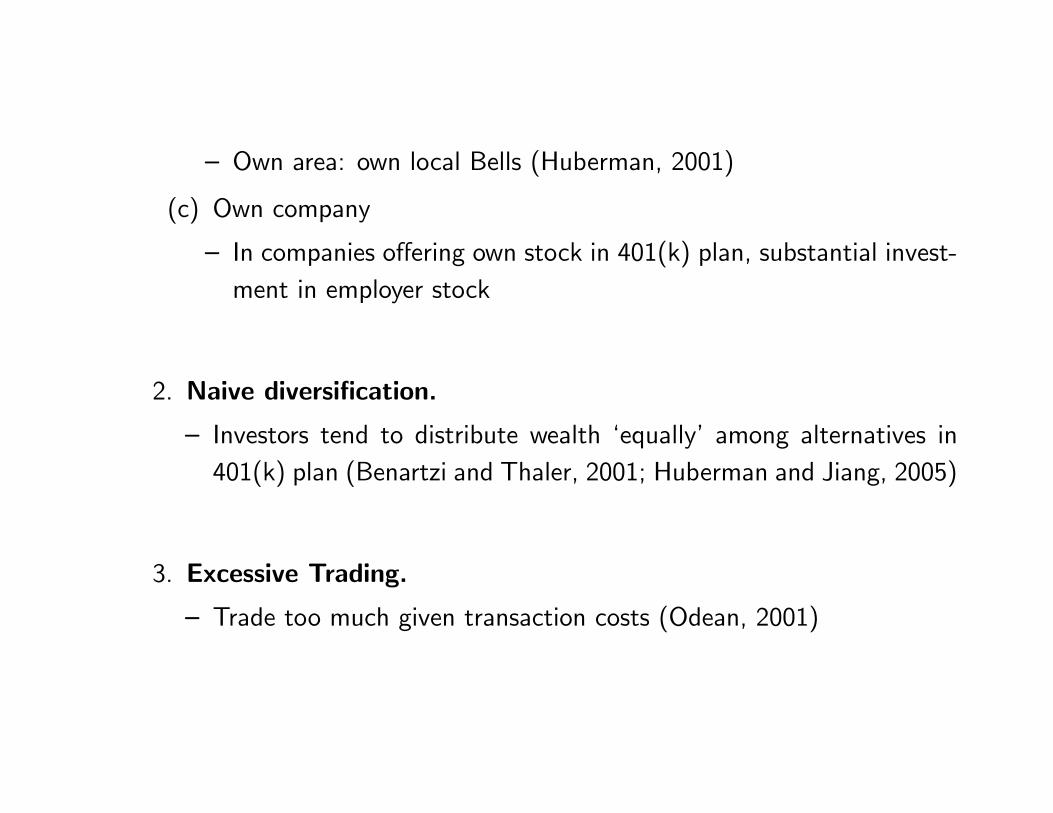
— Own area: own local Bells (Huberman, 2001)
(c) Own company
— In companies offering own stock in 401(k) plan, substantial invest-ment in employer stock
2. Naive diversification.
— Investors tend to distribute wealth ‘equally’ among alternatives in401(k) plan (Benartzi and Thaler, 2001; Huberman and Jiang, 2005)
3. Excessive Trading.
— Trade too much given transaction costs (Odean, 2001)

4. Disposition Effect in selling
— Investors more likely to sell winners than losers
5. Attention Effects in buying
— Stocks with extreme price or volume movements attract attention(Odean, 2003)
• Should market forces and arbitrage eliminate these phenomena?

• Arbitrage:— Individuals attempt to maximize individual wealth
— They take advantage of opportunities for free lunches
• Implications of arbitrage: ‘Strange’ preferences do not affect pricing
• Implication: For prices of assets, no need to worry about behavioral stories
• Is it true?
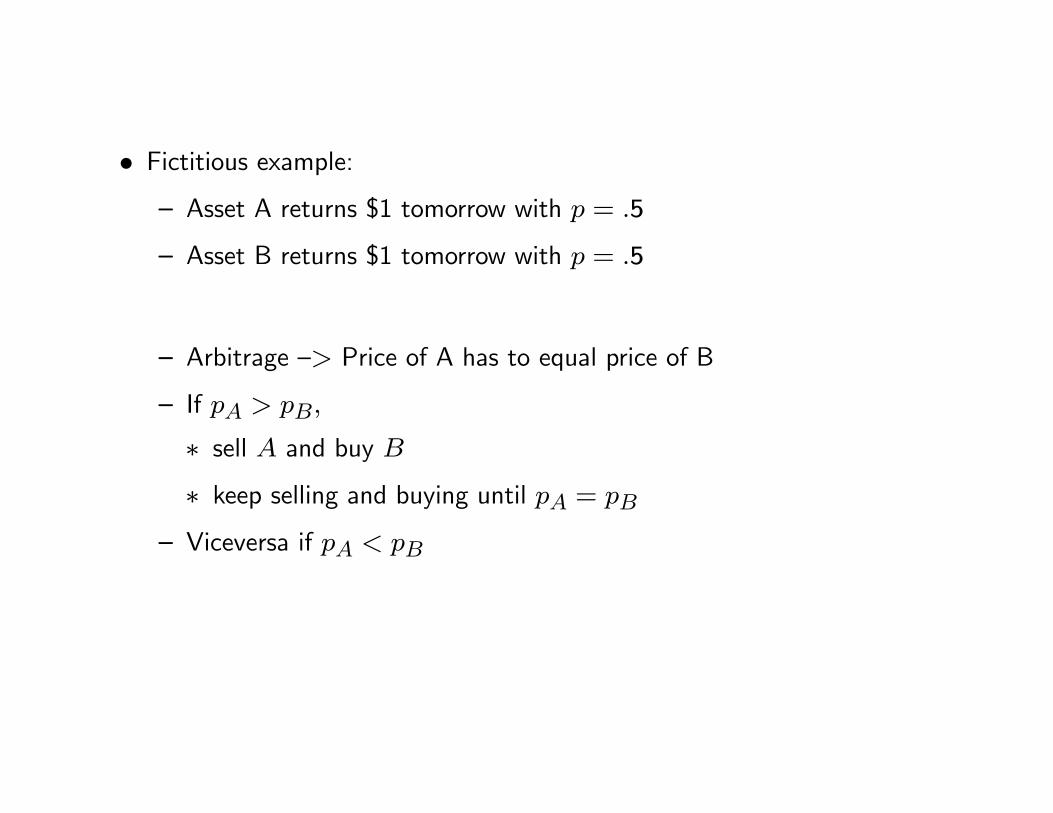
• Fictitious example:— Asset A returns $1 tomorrow with = 5
— Asset B returns $1 tomorrow with = 5
— Arbitrage — Price of A has to equal price of B
— If
∗ sell and buy
∗ keep selling and buying until =
— Viceversa if

• Problem: Arbitrage is limited (de Long et al., 1991; Shleifer, 2001)
• In Example: can buy/sell A or B and tomorrow get fundamental value
• In Real world: prices can diverge from fundamental value
• Real world example. Royal Dutch and Shell— Companies merged financially in 1907
— Royal Dutch shares: claim to 60% of total cash flow
— Shell shares: claim to 40% of total cash flow
— Shares are nothing but claims to cash flow
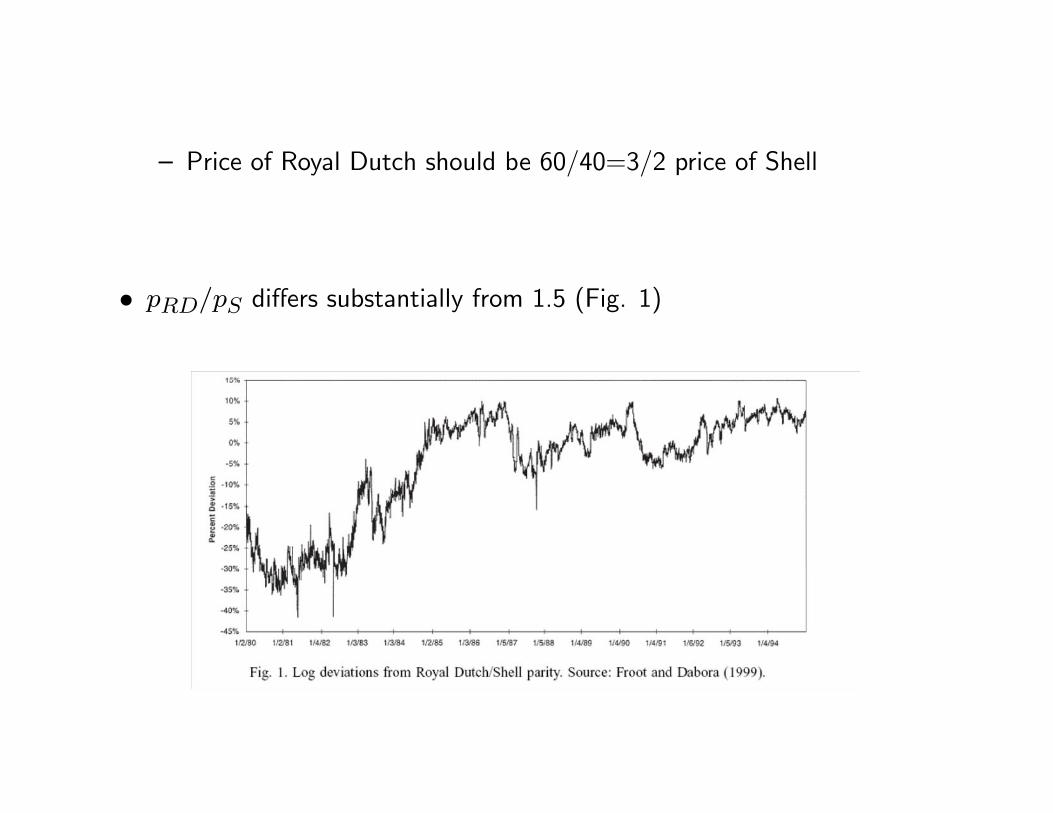
— Price of Royal Dutch should be 60/40=3/2 price of Shell
• differs substantially from 1.5 (Fig. 1)

• Plenty of other example (Palm/3Com)
• What is the problem?
— Noise trader risk, investors with correlated valuations that diverge fromfundamental value
— (Example: Naive Investors keep persistently bidding down price ofShell)
— In the long run, convergence to cash-flow value
— In the short-run, divergence can even increase
— (Example: Price of Shell may be bid down even more)

• Noise Traders
• DeLong, Shleifer, Summers, Waldman (JPE 1990)
• Shleifer, Inefficient Markets, 2000
• Fundamental question: What happens to prices if:— (Limited) arbitrage
— Some irrational investors with correlated (wrong) beliefs
• First paper on Market Reaction to Biases
• The key paper in Behavioral Finance

The model assumptions
A1: arbitrageurs risk averse and short horizon
−→ Justification?
* Short-selling constraints
(per-period fee if borrowing cash/securities)
* Evaluation of Fund managers.
* Principal-Agent problem for fund managers.

A2: noise traders (Kyle 1985; Black 1986)
misperceive future expected price at by
∼ N (∗ 2)
misperception correlated across noise traders (∗ 6= 0)
−→ Justification?
* fads and bubbles (Internet stocks, biotechs)
* pseudo-signals (advice broker, financial guru)
* behavioral biases / misperception riskiness
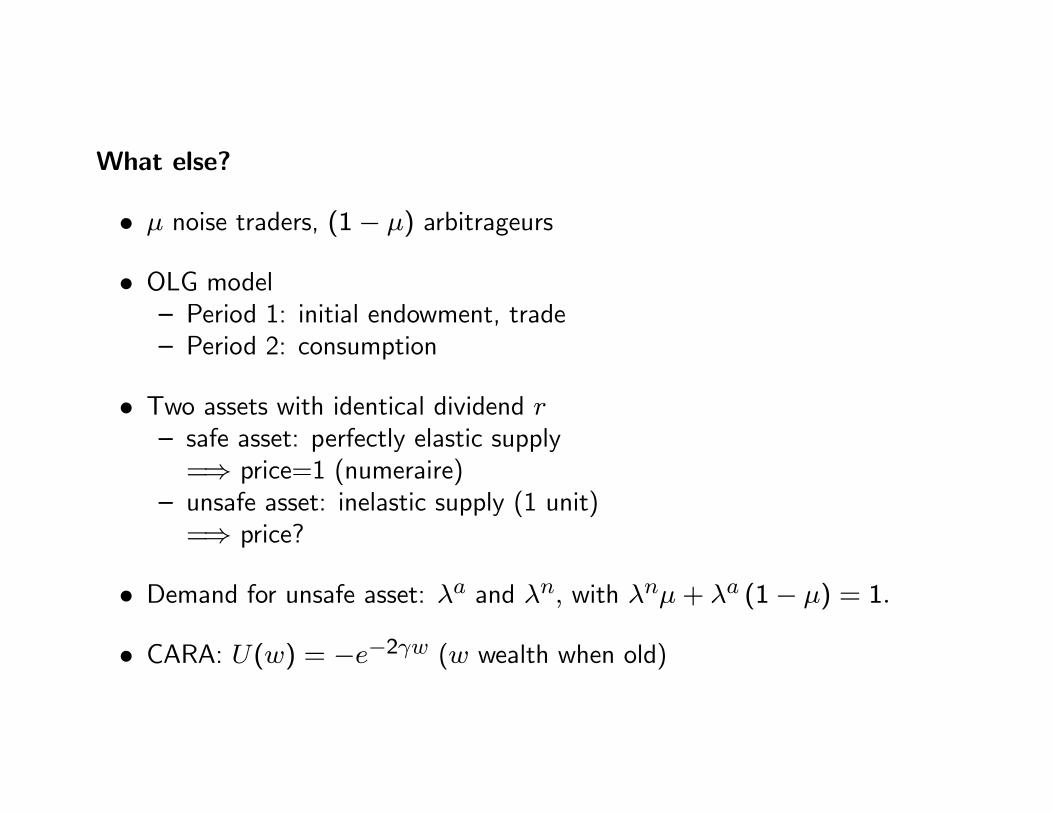
What else?
• noise traders, (1− ) arbitrageurs
• OLG model— Period 1: initial endowment, trade— Period 2: consumption
• Two assets with identical dividend — safe asset: perfectly elastic supply=⇒ price=1 (numeraire)
— unsafe asset: inelastic supply (1 unit)=⇒ price?
• Demand for unsafe asset: and with + (1− ) = 1
• CARA: () = −−2 ( wealth when old)

[()] =Z ∞∞− −2 · 1q
22· −
122
(−)2
= −Z ∞∞
1q22
· −42+
2+2−222
= −Z ∞∞
1q22
· −(−[22+])2+2−424−2−22
22
= −424+2
2
22
Z ∞∞
1q22
· −(−[22+])2
22
= −422+2 = −2(−2)
¸max [()] y
pos. mon. transf.max − 2

Arbitrageurs:
max( − )(1 + )
+ ([+1] + )
− ( )2 (+1)
Noise traders:
max( − )(1 + )
+ ([+1] + + )
− ( )2 (+1)
(Note: Noise traders know how to factor the effect of future price volatility intotheir calculations of values.)

f.o.c.
Arbitrageurs: [ ]
!= 0
= +[+1]− (1 + )
2 · (+1)
Noise traders: [ ]
!= 0
= +[+1]− (1 + )
2 · (+1)
+
2 · (+1)

Interpretation
• Demand for unsafe asset function of:— (+) expected return ( +[+1]− (1 + ))— (-) risk aversion ()— (-) variance of return ( (+1))
— (+) overestimation of return (noise traders)
• Notice: noise traders hold more risky asset than arb. if 0 (andviceversa)
• Notice: Variance of prices come from noise trader risk. “Price when old”depends on uncertain belief of next periods’ noise traders.

• Impose general equilibrium: + (1− ) = 1 to obtain
1 = +[+1]− (1 + )
2 · (+1)+
2 · (+1)
or
=1
1 + [ +[+1]− 2 · (+1) + ]
• To solve for we need to solve for [+1] = [] and (+1)
[] =1
1 + [ +[]− 2 · (+1) + []]
[] = 1 +−2 · (+1) + ∗

— Rewrite plugging in
= 1− 2 · (+1)
+∗
(1 + )+
1 +
[] = ∙1 +
¸=
2
(1 + )2 () =
2
(1 + )22
— Rewrite
= 1 +∗+ ( − ∗)1 +
− 2 22
(1 + )2
— Noise traders affect prices!
— Term 1: Variation in noise trader (mis-)perception
— Term 2: Average misperception of noise traders
— Term 3: Compensation for noise trader risk

• Relative returns of noise traders— Compare returns to noise traders to returns for arbitrageurs :
∆ = − = ( − ) [ + +1 − (1 + )]
(∆|) = −(1 + )2 222
(∆) = ∗ − (1 + )2 (∗)2 + (1 + )2 2
22
— Noise traders hold more risky asset if ∗ 0
— Return of noise traders can be higher if ∗ 0 (and not too positive)
— Noise traders therefore may outperform arbitrageurs if optimistic!
— (Reason is that they are taking more risk)

Welfare
• Sophisticated investors have higher utility
• Noise traders have lower utility than they expect
• Noise traders may have higher returns (if ∗ 0)
• Noise traders do not necessarily disappear over time

• Three fundamental assumptions1. OLG: no last period; short horizon
2. Fixed supply unsafe asset ( cannot convert safe into unsafe)
3. Noise trader risk systematic
• Noise trader models imply that biases affect asset prices:— Reference Dependence
— Attention
— Persuasion

• Here:— Biased investors
— Non-biased investors
• Behavioral corporate finance:— Investors (biased)
— CEOs (smart)
• Behavioral Industrial Organization:— Consumers (biased)
— Firms (smart)

5 Market Reaction to Biases: Political Economy
• Interaction between:— (Smart) Politicians:
∗ Personal beliefs and party affiliation∗ May pursue voters/consumers welfare maximization∗ BUT also: strong incentives to be reelected
— Voters (with biases):
∗ Low (zero) incentives to vote∗ Limited information through media∗ Likely to display biases
• Behavioral political economy

• Examples of voter biases:
— Effect of candidate order (Ho and Imai)
— Imperfect signal extraction (Wolfers, 2004) — Voters more likely tovote an incumbent if the local economy does well even if... it’s justdue to changes in oil prices
— Susceptible to persuasion (DellaVigna and Kaplan, 2007)
— More? Short memory about past performance?
• Eisensee and Stromberg (2007): Limited attention of voters
• Setting:
— Natural Disasters occurring throughout the World
— US Ambassadors in country can decide to give Aid
— Decision to give Aid affected by
∗ Gravity of disaster
∗ Political returns to Aid decision
• Idea: Returns to aid are lower when American public is distracted by amajor news event

• Main Measure of Major News: median amount of Minutes in Evening TVNews captured by top-3 news items (Vanderbilt Data Set)

• — Dates with largest news pressure

• 5,000 natural Disasters in 143 countries between 1968 and 2002 (CRED)— 20 percent receive USAID from Office of Foreign Disaster Assistance(first agency to provide relief)
— 10 percent covered in major broadcast news— OFDA relief given if (and only if) Ambassador (or chief of Mission) incountry does Disaster Declaration
— Ambassador can allocate up to $50,000 immediately
• EstimateRe = + +
• Below: about the Disaster is instrumented with:— Average News Pressure over 40 days after disaster— Olympics

• — 1st Stage: 2 s.d increase in News Pressure (2.4 extra minutes) decrease
∗ probability of coverage in news by 4 ptg. points (40 percent)
∗ probability of relief by 3 ptg. points (15 percent)

• Is there a spurious correlation between instruments and type of disaster?
• No correlation with severity of disaster

• OLS and IV Regressions of Reliefs on presence in the News
• (Instrumented) availability in the news at the margin has huge effect: Al-most one-on-one effect of being in the news on aid

6 Welfare Response to Biases
• Need for government/social planner intervention?— No if:∗ Sophistication about biases∗ Markets to correct biases exist
— Potentially yes if:∗ Naivete’ of agents∗ Missing markets∗ Example: sin taxes on goods
• Government intervention does not need to be heavy-handed:— Require active decision
— Change default

• Benartzi-Thaler, 2004 (First Behavioral paper in JPE since 1991!)
• Setting:— Midsize manufacturing company
— 1998 onward
— Company constrained by anti-discrimination rules – Interested inincreasing savings
• Features of SMT 401(k) plan:— No current increase in contribution rate
— Increase in contribution rate by 3% per future pay increase
— Can quit plan at any time

• Biases targeted:1. Self-control
— Desire to Save more
— Demand for commitment
2. Partial naivete’
— Partial Sophistication — Demand of commitment
— Partial Naiveté — Procrastination in quitting plan
3. Loss Aversion with respect to nominal wage cuts
— Hate real wage cuts
— Accept nominal wage cuts
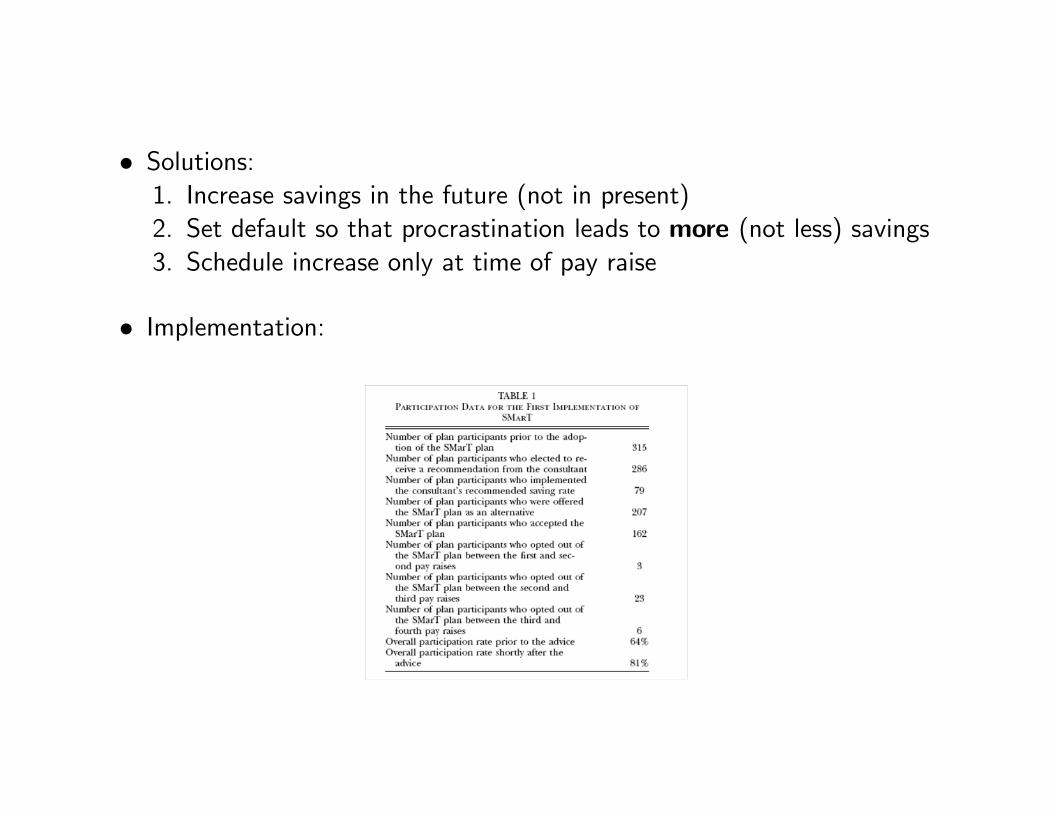
• Solutions:1. Increase savings in the future (not in present)2. Set default so that procrastination leads to more (not less) savings3. Schedule increase only at time of pay raise
• Implementation:

• Result 1: High demand for commitment device
• Result 2: Phenomenal effects on savings rates
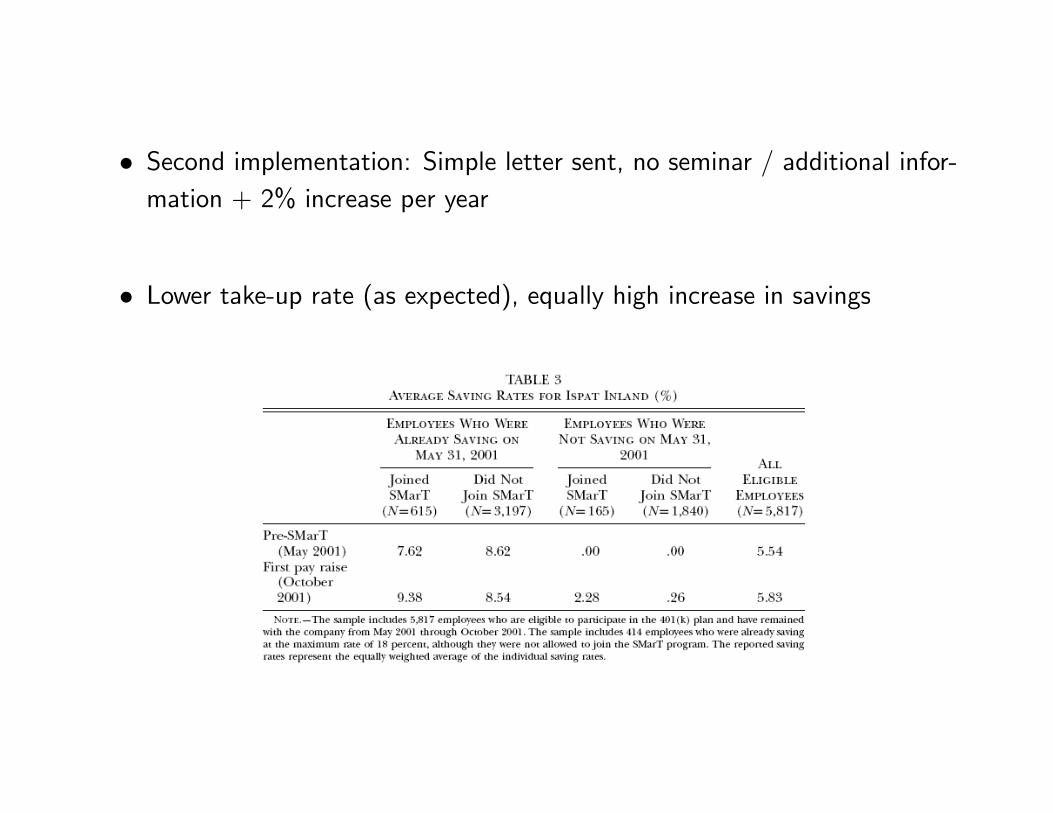
• Second implementation: Simple letter sent, no seminar / additional infor-mation + 2% increase per year
• Lower take-up rate (as expected), equally high increase in savings

• Third Implementation with Randomization:— Division A: Invitation to attend an informational seminar (40% do)
— Division O: ‘Required’ to attend information seminar (60% do)
— 2 Control Divisions
• Two differences in design:— Increase in Savings take place on April 1 whether pay increase or not(April 1 is usual date for pay increase)
— Choice of increase in contr. rate (1%, 2%, or 3%) (Default is 2%)
— Increases capped at 10%
• Results: Sizeable demand for commitment, and large effects on savings +Some spill-over effects

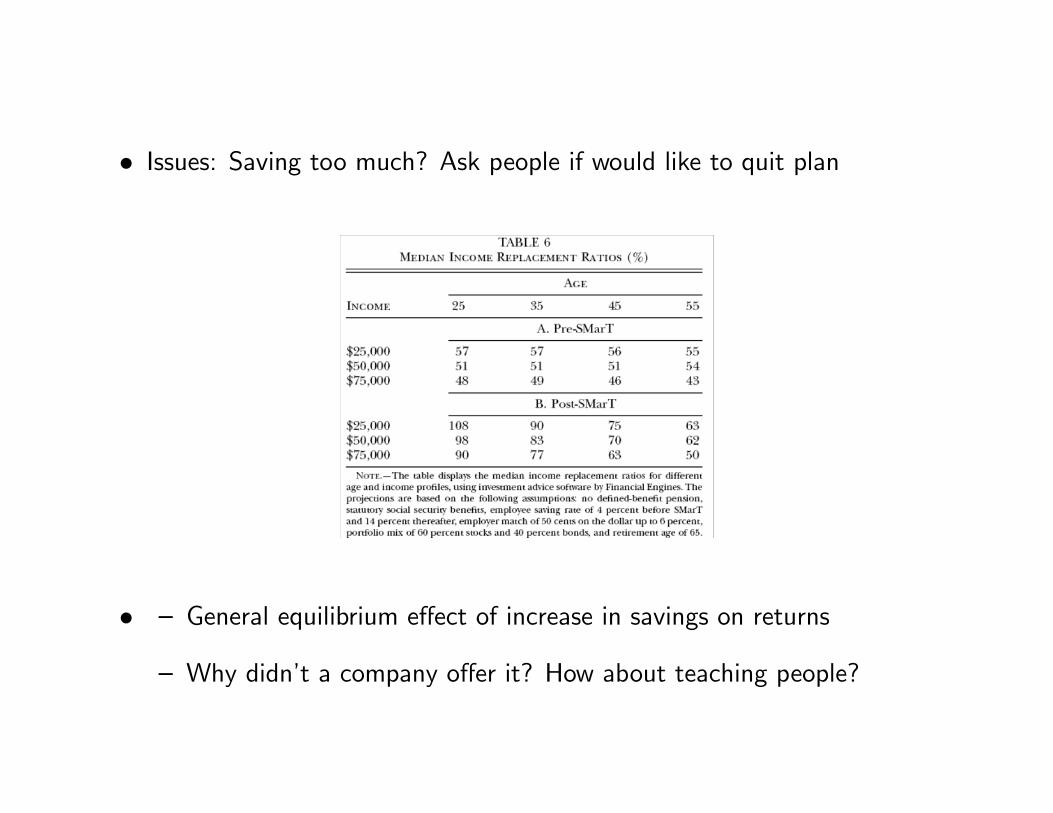
• Issues: Saving too much? Ask people if would like to quit plan
• — General equilibrium effect of increase in savings on returns
— Why didn’t a company offer it? How about teaching people?

• Psychology & Economics & Public Policy:
— Leverage biases to help biased agents
— Do not hurt unbiased agents (cautious paternalism)
• SMartT Plan is great example:
— From Design of an economist...
— ...to Research Implementation with Natural Experiment and Field Ex-periment
— ...to Policy Implementation into Law passed in Congress: AutomaticSavings and Pension Protection Act

• However: SMRT may be a unique example for several reasons
— Defaults are hard to leverage in many situations
∗ How to get people to exercise more?
∗ Eat less?
∗ Pay more attention to hidden information?
— Saving more is desireable for almost all
∗ Nudges on other fronts are more open to criticism
— Company was open to SMRT: Firm happy to increase savings of em-ployees
∗ Often firm would often rather exploit biases than counter-act them

∗ Example 1: Neglect of mutual fund fees
∗ Example 2: Overconfidence in trading

• Despite these difficulties, there are now numerous attempts in this direction
• Two more recent examples:
• Loewenstein and Volpp’s work on health outcomes
— Series of Randomized Trial
— Leverage incentives with lotteries (probability weighting)
— Use team incentives...
— Outcomes: Weight loss, exercise, remembering to take pill,...
• Bhargava and Manoli (2012)

MOTIVATION & BACKGROUND
• EITC is largest means-tested cash transfer program. It disburses $58 billion per year to 26 million recipients through income supplement that encourages work
• Fully refundable, supplements earned income by average of 17% which amounts to $2,100. Must file your taxes to claim
• 25% of eligible do not take-up (~6.7m). Of 25%, 16% do not file taxes, and 9% files taxes (~2.3 m) (Plueger 2010). 9% is focus of this study
• (Many) filing non-claimants receive a reminder notice / claiming worksheet (CP 09 or CP 27) from IRS
• Policy consequences profound. Foregone benefits amount to average of 31 days of income, up to ~115 days for some (est. $1,096 benefit, $8,900 income). Health, education, consumption benefits linked to EITC (Hoynes 2011; Dahl and Lochner 2011; Smeeding and Phillips and O‘Connor 2001)
• Despite considerable research, incomplete take-up in benefit programs regarded as puzzle to economists (Currie 2006)
2

3
EITC BENEFIT SCHEDULE FOR TAX YEAR 2009

RESEARCH STRATEGYField experiment to test leading causes of low take-up
• Modify tax documents (notice + worksheet + envelope) and distribute to eligible filing non-claimants
• Simultaneously test three hypotheses regarding role of information (benefits, costs, program rules), Informational complexity, and program stigma on response
• Randomize three components independently and distribute in blocks defined by zip code and dependent status
Tax-return data plus micro-data on demographics, EIC claiming history
Survey of perceived incentives. Surveys of ~1200 low to moderate income taxpayers toassess perception of EITC cost/benefit parameters
Psychometric scoring of interventions. Second survey with ~2800 subjects illuminatespsychological mechanisms underlying experimental response
4

AWARENESS AND CONSTRUAL OF INCENTIVES
• 1200 surveys administered across volunteer tax centers in Chicago (1050) and SF (150) in early 2011
• Administered during period when people wait for tax assistance
• Survey elicits (1) tax anddemographic information (permits calculation of benefits/eligibility), (2) perceptions of cost and benefit parameters
• Perceived incentives matter (Liebmanand Luttman 2011; Chetty and Saez2009)
• Limits to survey (second survey of 2,800 on Amazon MechTurk)
8
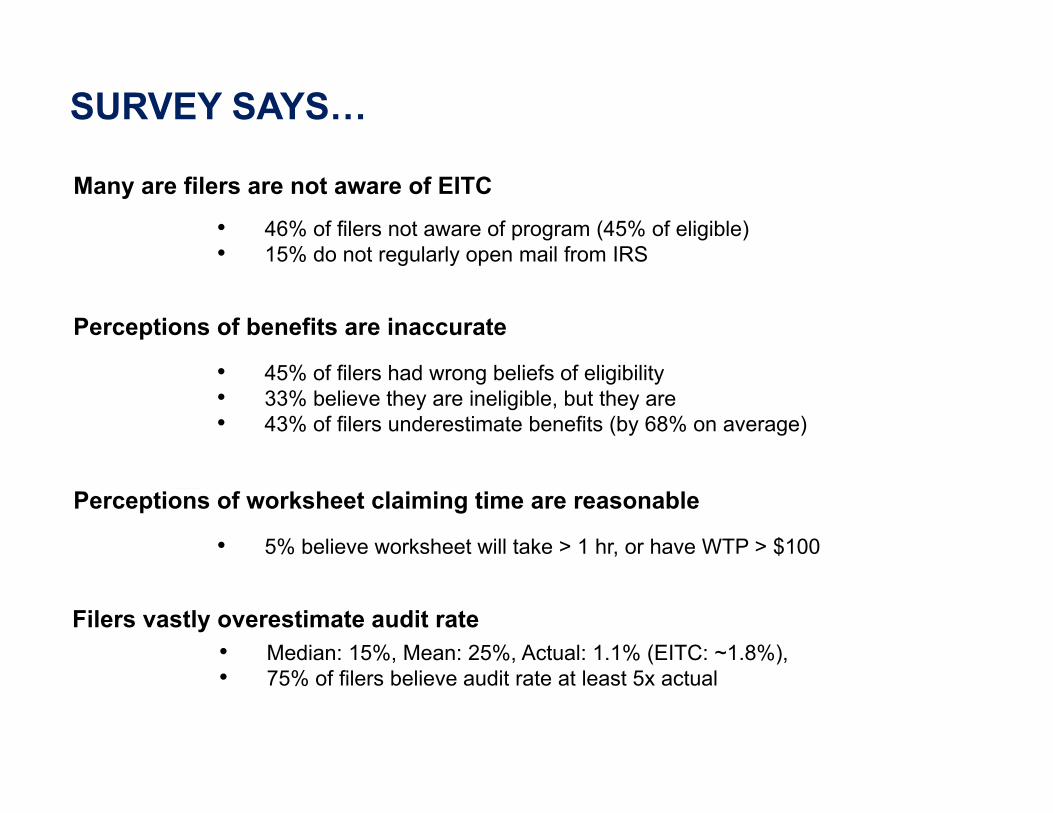
SURVEY SAYS…
Perceptions of benefits are inaccurate
• 45% of filers had wrong beliefs of eligibility• 33% believe they are ineligible, but they are• 43% of filers underestimate benefits (by 68% on average)
9
Perceptions of worksheet claiming time are reasonable
• 5% believe worksheet will take > 1 hr, or have WTP > $100
Filers vastly overestimate audit rate• Median: 15%, Mean: 25%, Actual: 1.1% (EITC: ~1.8%), • 75% of filers believe audit rate at least 5x actual
Many are filers are not aware of EITC
• 46% of filers not aware of program (45% of eligible)• 15% do not regularly open mail from IRS
12
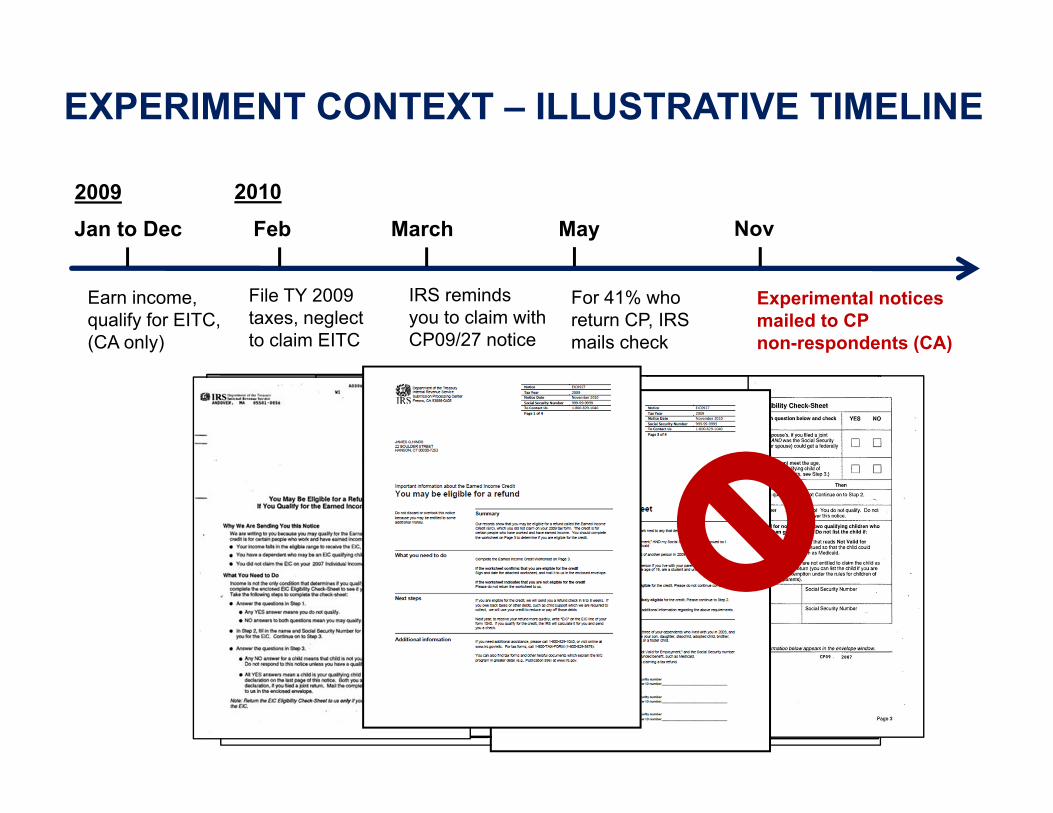
EXPERIMENT CONTEXT – ILLUSTRATIVE TIMELINE
2009
Earn income, qualify for EITC,(CA only)
Feb March May
File TY 2009taxes, neglect to claim EITC
IRS reminds you to claim with CP09/27 notice
2010
For 41% who return CP, IRS mails check
Jan to Dec Nov
Experimental notices mailed to CP non-respondents (CA)

15
ORGANIZATION OF TREATMENTS I

17
(A) INFORMATIONAL COMPLEXITY
THEORY
● Poor financial choices due to lack of experience and familiarity with complex documents or low “financial literacy”
(1) Complex Notice: Tests “design complexity”. Features textually dense design, is two pages, and repeats eligibility information from worksheet. Resembles originalCP Notice.
(2) Complex Worksheet: Tests “length complexity”. Features additional, “nondiscriminatory” questions.
INTERVENTIONS
● Transfer programs are complicated. EITC has 24 pages of instruction in tax book, 56 pages in separate Publication 596; average length of state FSP application is 12 pages (Bertrand and Mullainathan and Shafir 2006)
● Simplification appears to “improve” choice in many contexts (e.g., Bettinger et al. 2009)
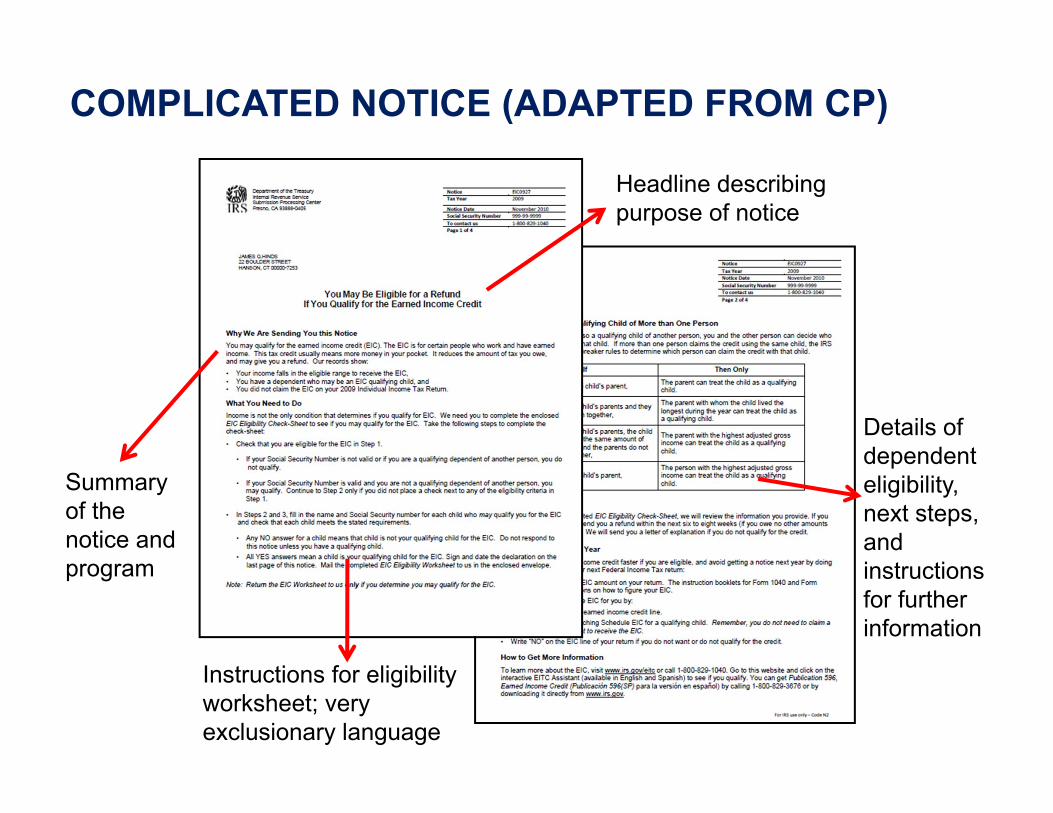
Details of dependent eligibility, next steps, and instructionsfor further information
Summary of the notice and program
18
Headline describing purpose of notice
Instructions for eligibility worksheet; very exclusionary language
COMPLICATED NOTICE (ADAPTED FROM CP)

“BASELINE” NOTICE
• Headline communicates program eligibility.
• Summary explains purpose of letter and program. Tax Year is specified.
• Recipients instructed to complete worksheet to determine eligibility; eligibility criteria not repeated on notice
• Information on Notice + Worksheet held constant
19

20
SIMPLE WORKSHEET
• Guides reader through determination of eligibility (distinct version for dependent and non-dependents)
• Worksheet checks valid SSN, elicits names of eligible dependents, and instructs recipient to sign and return if eligible
• Original CP worksheet, with alternative formatting and organization, not tested
21
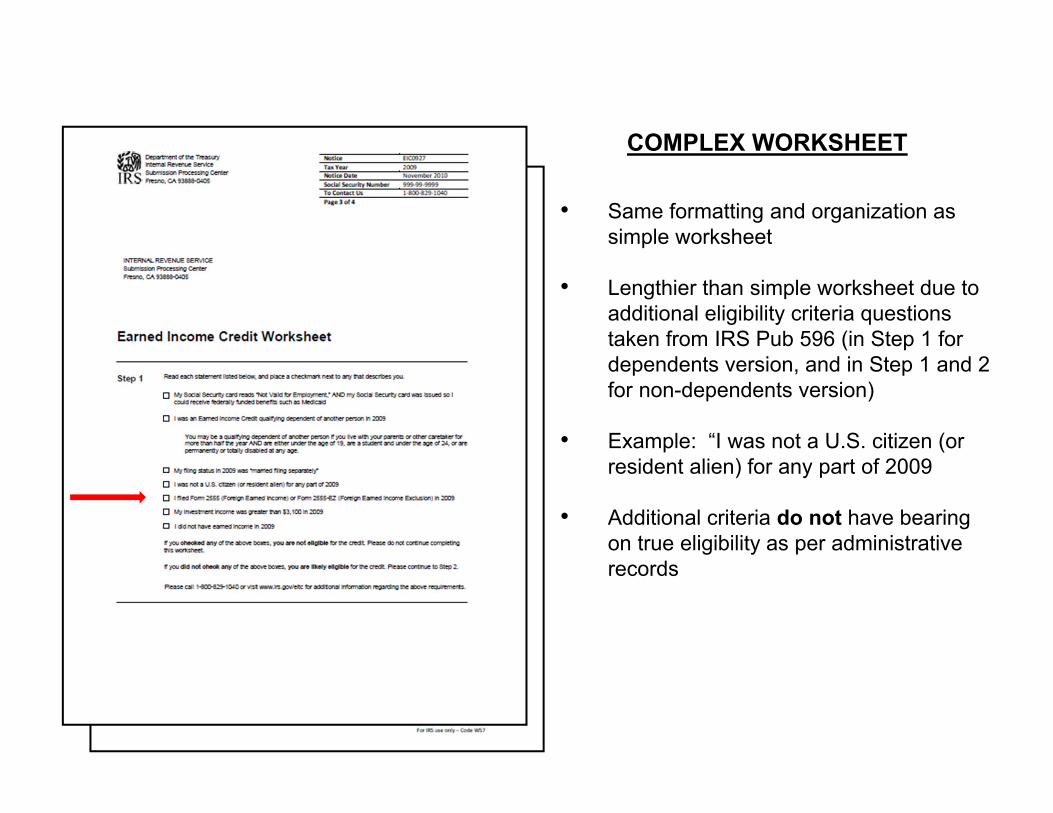
COMPLEX WORKSHEET
• Same formatting and organization as simple worksheet
• Lengthier than simple worksheet due to additional eligibility criteria questions taken from IRS Pub 596 (in Step 1 for dependents version, and in Step 1 and 2 for non-dependents version)
• Example: “I was not a U.S. citizen (or resident alien) for any part of 2009
• Additional criteria do not have bearing on true eligibility as per administrative records

22
(B) INFORMATION ON BENEFITS, COSTS, RULES
Individuals have limited attention, may only respond to perceived or known incentives (Kahneman 1986; Taylor and Fiske 1975)
THEORY
Individuals optimize with respect to incentives
●
●
22
INTERVENTIONS
1. Benefit Notice: Generic benefit information (high and low)
2. Cost Notice: Information on worksheet claiming time (high and low)
3. Penalty Worksheet: “Indemnification” message on claiming worksheet
4. Informational Flyer: Information on benefits and program on 1 page flyer
5. Messaged Envelope: Persuasion message on envelope
Basic information regarding incentives helps optimize behavior (e.g., Liebman and Luttmer 2011)
●

BENEFIT DISPLAY
• Identical to baseline notice in design and content except…
• Headline communicates refund may be up to specific amount determined by number of dependents [IRS did not allow exact benefit amounts]
• Indicated range is $457 for those with no dependents, $5,657 for those with 3 or more dependents, and randomized to be either dependent specific, or overall, maximum for 1 dependent ($3,043), and 2 dependents ($5,028)
• Summary reiterates benefit information
23

COST DISPLAY
• Identical to baseline notice in design and content except…
• Headline communicates that completing worksheet should take less than 60 (or 10) minutes
24
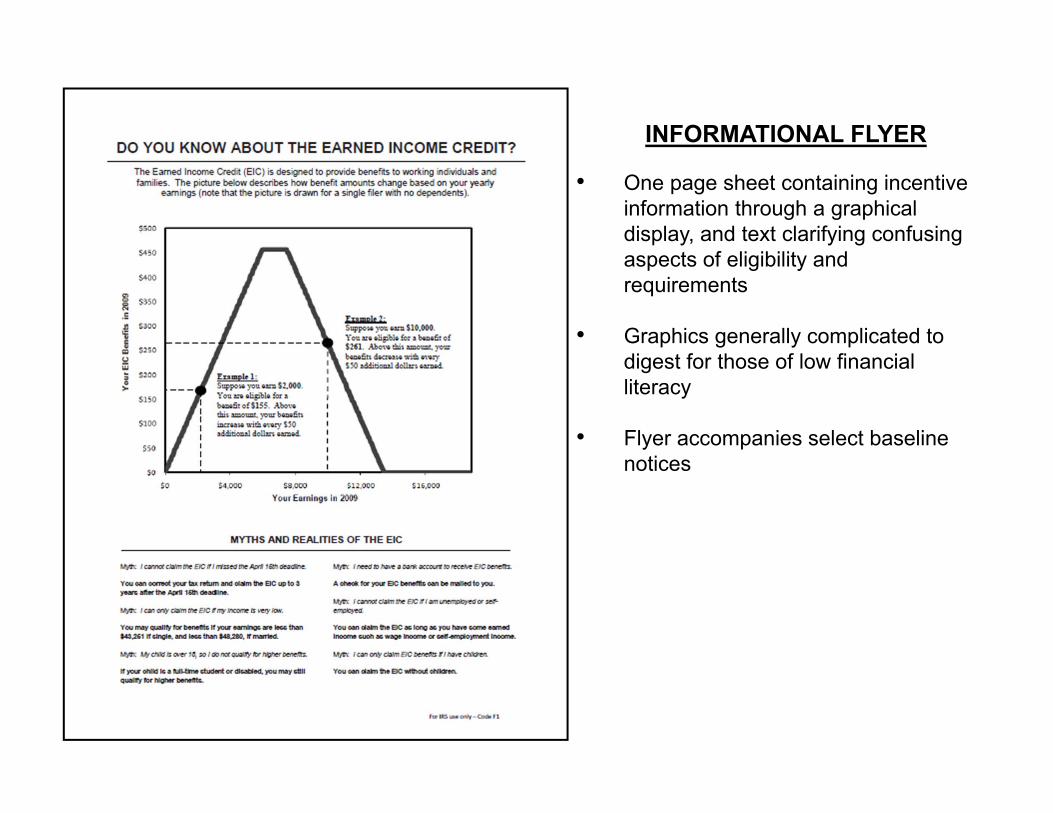
INFORMATIONAL FLYER
• One page sheet containing incentive information through a graphical display, and text clarifying confusing aspects of eligibility and requirements
• Graphics generally complicated to digest for those of low financial literacy
• Flyer accompanies select baseline notices
26
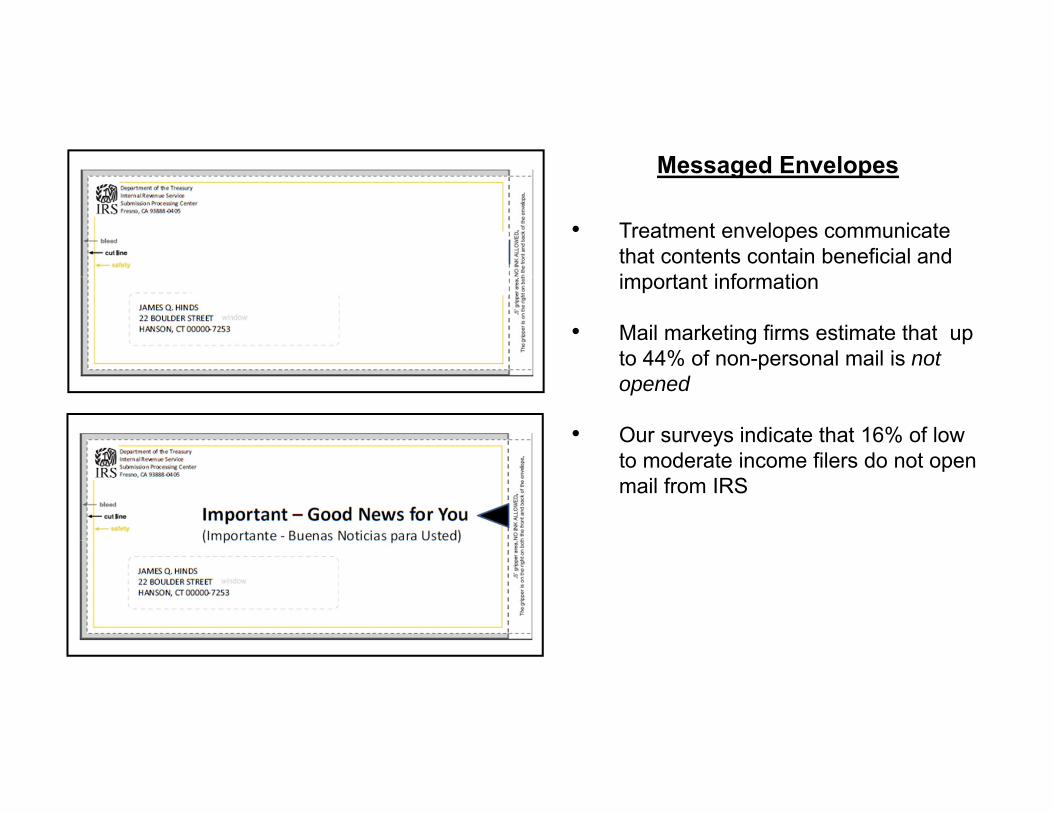
Messaged Envelopes
• Treatment envelopes communicate that contents contain beneficial and important information
• Mail marketing firms estimate that up to 44% of non-personal mail is not opened
• Our surveys indicate that 16% of low to moderate income filers do not open mail from IRS
27
28
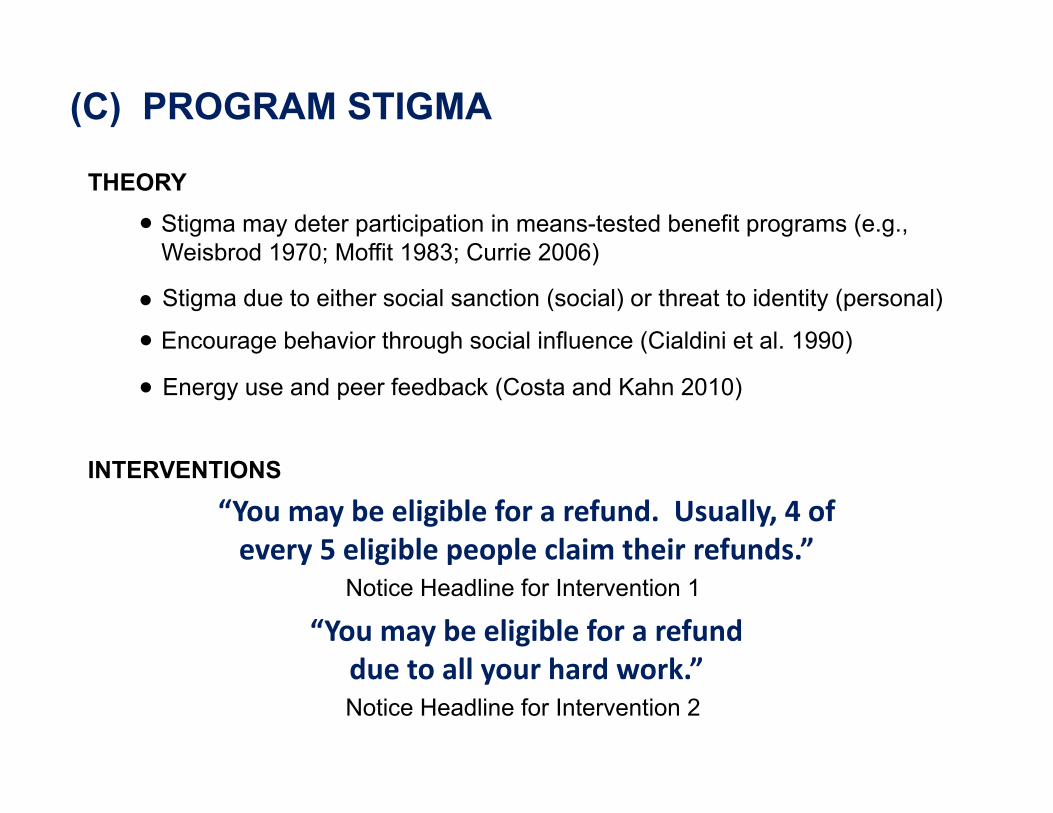
(C) PROGRAM STIGMA
THEORYStigma may deter participation in means-tested benefit programs (e.g., Weisbrod 1970; Moffit 1983; Currie 2006)
Energy use and peer feedback (Costa and Kahn 2010)
●
●
●
INTERVENTIONS
“You may be eligible for a refund. Usually, 4 of every 5 eligible people claim their refunds.”
Notice Headline for Intervention 1
“You may be eligible for a refund due to all your hard work.”Notice Headline for Intervention 2
Encourage behavior through social influence (Cialdini et al. 1990)
● Stigma due to either social sanction (social) or threat to identity (personal)
30
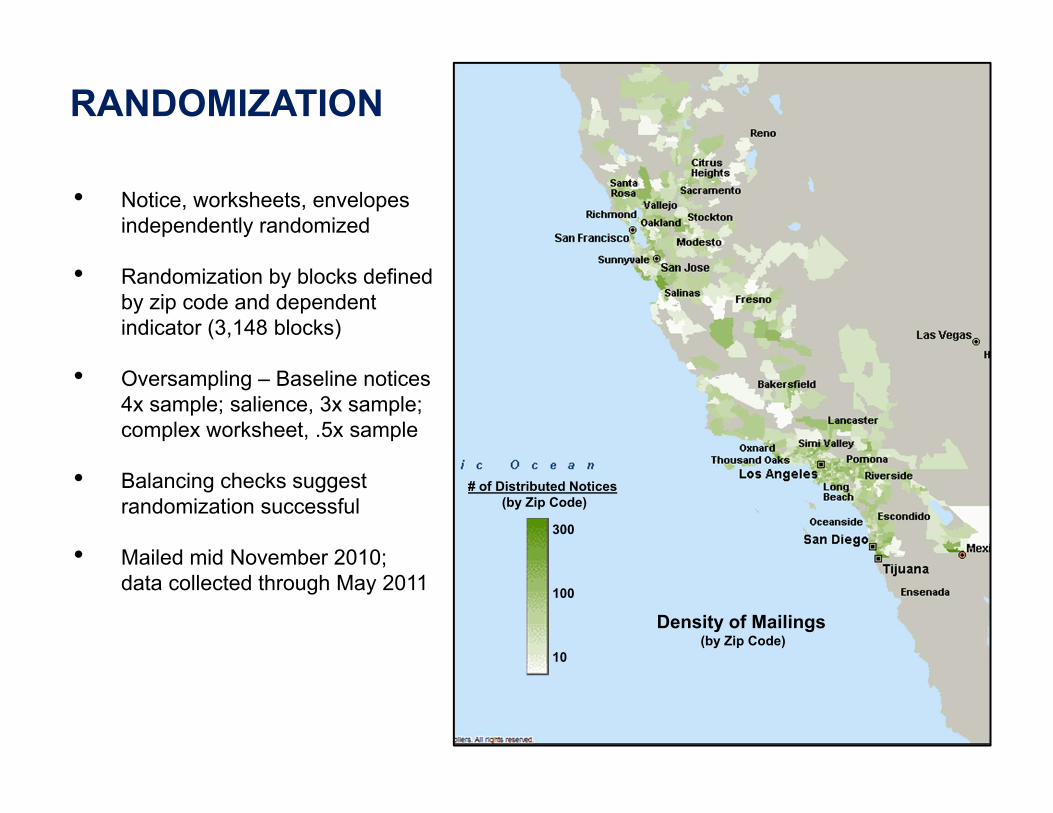
RANDOMIZATION
300
100
10
Density of Mailings(by Zip Code)
• Notice, worksheets, envelopes independently randomized
• Randomization by blocks defined by zip code and dependent indicator (3,148 blocks)
• Oversampling – Baseline notices 4x sample; salience, 3x sample; complex worksheet, .5x sample
• Balancing checks suggest randomization successful
• Mailed mid November 2010;data collected through May 2011
# of Distributed Notices(by Zip Code)
33
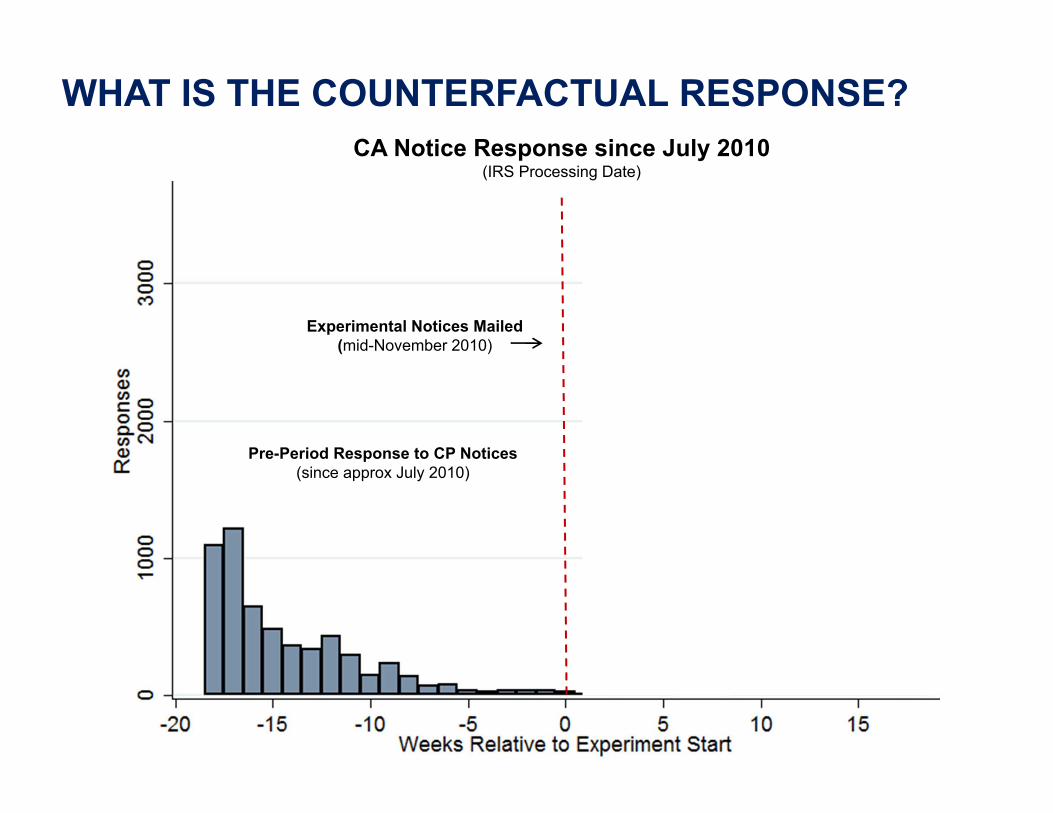
WHAT IS THE COUNTERFACTUAL RESPONSE?CA Notice Response since July 2010
(IRS Processing Date)
Pre-Period Response to CP Notices(since approx July 2010)
Experimental Notices Mailed(mid-November 2010)
Experimental PeriodResponse
36
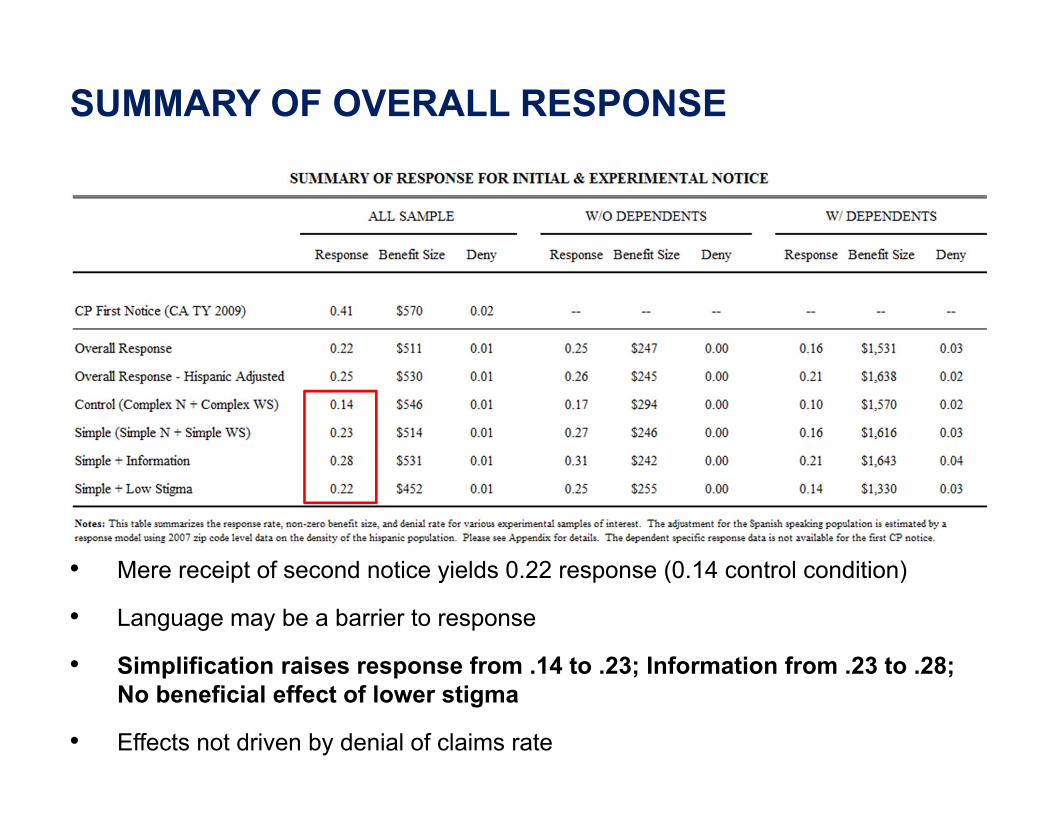
SUMMARY OF OVERALL RESPONSE
• Mere receipt of second notice yields 0.22 response (0.14 control condition)
• Language may be a barrier to response
• Simplification raises response from .14 to .23; Information from .23 to .28; No beneficial effect of lower stigma
• Effects not driven by denial of claims rate

38
Response and Denial by
Experimental Treatments

7 Concluding Remarks
• How to complete a dissertation and be (approximately) happy
1. Know yourself, and put yourself to work
— Do you procrastinate?
— Are you afraid of undirected research?
— Not enough intuition?
— Not enough technicality?
— Work in team with a classmate!

2. Economics is about techniques, AND about ideas
— Rule 1. Study the techniques
— Everyone needs a knowledge of:
∗ Modelling skills (decisions, game theory, contracts)
∗ Econometrics (asymptotics, applied metrics)
∗ (At least) one field (methodology, questions, previous research)

— Rule 2. Think of interesting ideas
— Start from new idea, not from previous papers. Ex.: Mas-Moretti onSafeway data
— Think of an idea that can fix a broken literature (Levitt). Ex.: Fehr-Goette on cab drivers
— Connect two literatures which were unconnected. Ex.: Eisensee-Stromberg on political economy + behavioral
— Rule 3. Explore technique you need for idea
∗ Ideas often come first
∗ It will be much easier to learn technique once you have an inter-esting problem at hand

3. What are good ideas?
— 1% of (Glaeser)
— New questions (better) or unknown answers
— Questions you care about (comparative advantage: List)
— Socially important topics (Akerlof)
— Good research is always useful, even if not policy-relevant

4. Look for occasions to learn:
— Attend seminars (including student lunch talks)
— Attend job market talks
— Do not read too much literature
— Discuss ideas with peers, over lunch, with yourself
— Get started on some data set
— Be curious

5. Above all, do not get discouraged...
— Unproductive periods are a fact of life
— Ideas keep getting better (and economics more fun) with exercise
— Work hard
— Keep up the exercise!