ecology lab – wolf conservation predators and …rlee/biol103/ecology.pdf · ecology lab – wolf...
TRANSCRIPT
Ecology lab – Wolf conservation
Predators and Prey on Isle Royale Introduction Isle Royale is an island about 15 miles from the northern shore of Lake Superior, which
is one of the Great Lakes on the border of Canada and the U.S. Lake Superior is the
largest freshwater lake in the world, stretching 160 miles from north to south and well
over 300 miles from east to west. Not many large animals have made it from the shores
of Lake Superior to Isle Royale. About 100 years ago, however, a few moose found their
way across from mainland Canada to the island, probably walking most of the way across
surface ice during an especially cold winter. The moose found a veritable paradise, with
lots of grass, bushes, and low-lying trees to eat and no predators. The moose population
exploded, reaching several thousand individuals at its peak.
In 1949, the area around Lake Superior had another cold winter and large parts of the
lake's surface froze solid. A small pack of wolves found a stretch of ice that extended all
the way to Isle Royale. There they found a huge population of moose that had eaten most
of the available food, and many of whom were severely undernourished. These starving
moose were easy prey for the wolves.
The wolves and moose on Isle Royale became a kind of natural experiment for studying
population ecology, and in particular, predator-prey dynamics. There are four key factors
that affect population size: birth, death, immigration, and emigration. Immigration and
emigration are usually very difficult to quantify in most natural populations, but because
Isle Royale is isolated, these factors can basically be ignored, making this an especially
practical place to study population ecology. In fact, several biologists have spent their
careers studying the wolf and moose populations on Isle Royale, tracking individuals and
recording how many of each species are born each year and how many die, causes of
death, food availability, and so on. Using these data, they try to understand what factors
cause the moose and wolf populations to fluctuate over time.
The Isle Royale Model in EcoBeaker
In this lab, you will explore populations of predators and prey using a simplified
simulation model of the Isle Royale system. The Isle Royale model involves three
species: plants, moose, and wolves. The "plants" in the model represent moose food. You
can change the rate at which the plant population grows, simulating, for example,
particularly wet or dry years which would result in larger or smaller plant populations.
Although real-world moose eat a variety of plants, in this simulation, all plant individuals
are identical. The animals in the Isle Royale model are somewhat more complex than the
plants. However, like the plants, the actions of each individual are determined by the

same set of rules. For example, there are rules that dictate the maximum number of
squares a moose or wolf can move at a time (i.e., in one time-step) or what to do if
another species is encountered. Rules dictate how much energy an individual gains if
they encounter and eat their prey species, and how much energy is used up in each time-
step while searching for prey. Death occurs when an individual's energy level drops
below a set point. To keep things simple, there are no babies, no elderly, and no sick
individuals – only middle-aged adults. You'll also see the wolves hunting alone, whereas
real wolves tend to hunt in packs. These simplifications help your experiments, but still
retain the basic nature of the interactions between the species.
Some Important Terms and Concepts
Population Ecology The study of changes in the size and composition of populations and the factors that
cause those changes.
Population Growth and Carrying Capacity Models of population growth can provide a helpful framework for understanding that
complexity, and also, if the models are accurate, for predicting how population size will
change in the future. The simplest model of population growth considers the "ideal
world" case in which there are no limitations on a population's growth (i.e., all of the
necessary resources to survive and reproduce are in excess). If this is the case, the larger
the population becomes, the faster it will grow because in each generation, more
individuals will reproduce.
This type of population growth is modeled with the exponential growth model. This
model assumes that the population is increasing at its maximum per capita rate of growth
(also referred to as the intrinsic rate of increase), which is denoted "rmax". Using the
"dN/dt" notation of differential calculus to represent the change in population size per
unit time (in this case, the change in population size N over time t), if population size is
N, and time is t, then:
dN/dt = rmax N
The following graph depicts an example of exponential population growth (notice how it
starts out shallow and then becomes sharply steeper):
Exponential
Population
Growth POPULATION
SIZE (N)
TIME
In the real world, conditions are typically not quite so ideal, so population growth is often
limited by the availability of important resources such as nutrients or space. Carrying
capacity (symbolized as K) is the maximum number of individuals of a species that the
local environment can support at a particular time. When a population is small, for
example during the early stages of colonization, it may grow exponentially (or nearly so),
but as resources start to run out, population growth typically slows down and eventually
the population size stabilizes at the level of carrying capacity.
To incorporate the influence of carrying capacity in projections of population growth
rate, ecologists use the logistic growth model. In this model, the per capita growth rate
(r) decreases as the population density increases. When the population is at its carrying
capacity (N=K) the population will no longer grow.
dN/dt = rmax N((K-N)/K)
Try plugging a few numbers into this equation. For example, if N=K, then K-N in the
right hand side part of the equation equals zero. Zero divided by any number equals zero.
Thus, the whole right side of the equation equals zero when N=K. This helps to explain
why your population does not grow when N=K, because dN/dt = 0, or the rate of change
is zero. This makes sense biologically because the population size it at the limit the
environment can support.
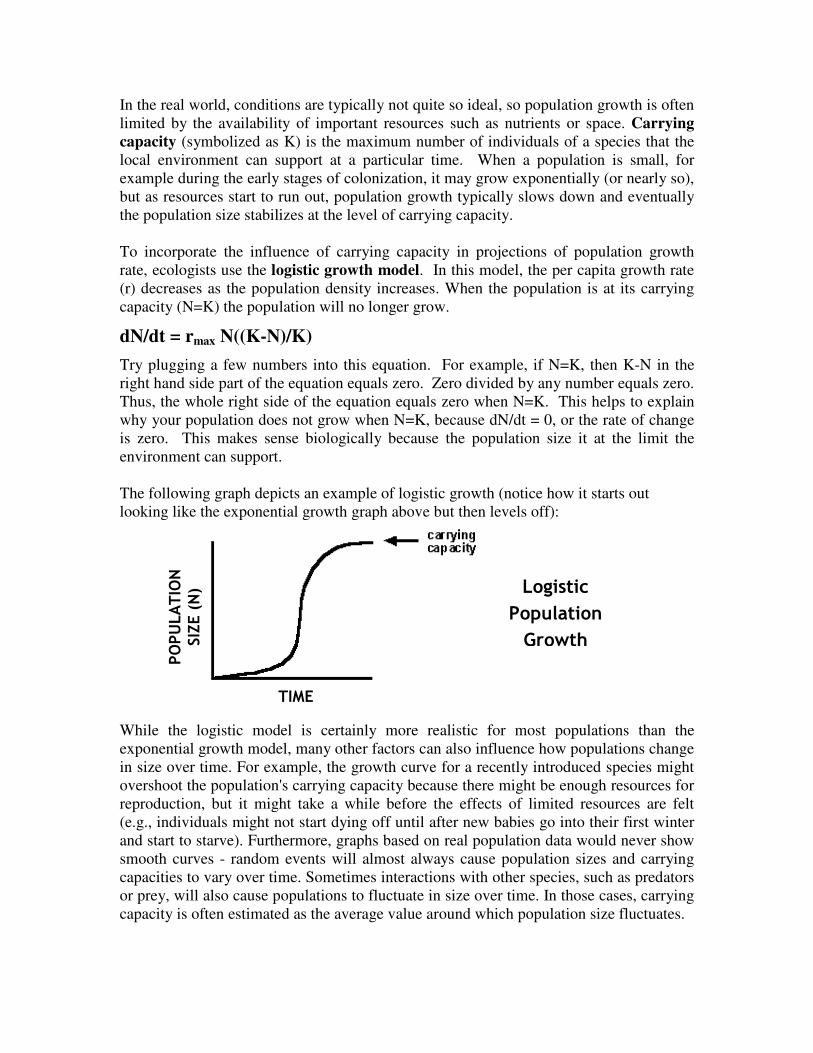
The following graph depicts an example of logistic growth (notice how it starts out
looking like the exponential growth graph above but then levels off):
While the logistic model is certainly more realistic for most populations than the
exponential growth model, many other factors can also influence how populations change
in size over time. For example, the growth curve for a recently introduced species might
overshoot the population's carrying capacity because there might be enough resources for
reproduction, but it might take a while before the effects of limited resources are felt
(e.g., individuals might not start dying off until after new babies go into their first winter
and start to starve). Furthermore, graphs based on real population data would never show
smooth curves - random events will almost always cause population sizes and carrying
capacities to vary over time. Sometimes interactions with other species, such as predators
or prey, will also cause populations to fluctuate in size over time. In those cases, carrying
capacity is often estimated as the average value around which population size fluctuates.
TIME
POPULATION
SIZE (N) Logistic
Population
Growth
Exercise 1: Starting Up
1. If your machine is not running, turn it on (button is front right on Macs; front center
on Gateways). Enter the Password numbers - these are taped on top of the
machines.
2. From the desktop on Macs, click the Apple menu (upper left) and select
“Applications” and then “Ecobeaker 101”. On Gateways, click “Start” (lower left)
and select “Programs”, then “Ecobeaker 101”.
3. Click on the scrolling yellow portion of the screen. Double click on the exercise,
“Isle Royale”, in the box at lower left. Follow the onscreen instructions to shrink
the instruction window and begin running the model.
Exercise 2: Population Growth and Carrying Capacity of Moose
NOTE: you may need to read over the introductions to complete some of the following
exercises.
1. Copy the Populations graph that shows the moose population size changing over
time. Label one axis POPULATION SIZE (N) and the other one YEARS. Also
take note of the values on each axes.
2. During what time period does it appear that the moose population experienced
exponential growth (described in the Introduction)? Circle that part of your graph.
3. Based on your graph, what is the carrying capacity of moose on the island?
Draw an arrow on your graph that indicates carrying capacity and label it “K”.
What is the approximate population size at carrying capacity?
4. The following equation should look familiar. It is the logistic growth model from
the introduction:
dN/dt = rmax N((K-N)/K)
a. What does “dN/dt” mean, in words?
b. Look at the equation and try and figure out what would happen to dN/dt when
the population size (N) approaches the carrying capacity (K). The simplest case to
think about is when the two numbers are the same (N=K). First try plugging in
numbers for N and K where K is much larger than N. Then try this twice more,
where N keeps getting closer to K. (Note that a typical rmax for animals such as
moose is around 1.2. What happens as N gets closer to K?
c. Based on the above equation (4b), complete the following sentence:
When the population size is the same as the carrying capacity, the population
will ….
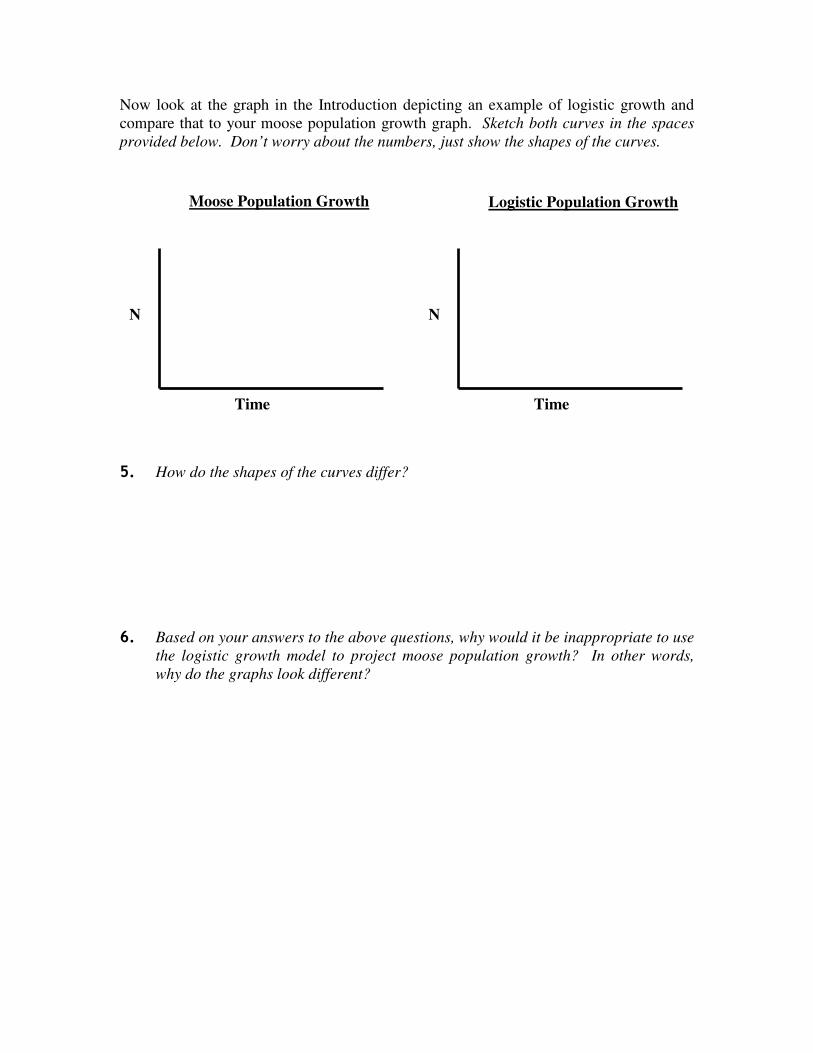
Now look at the graph in the Introduction depicting an example of logistic growth and
compare that to your moose population growth graph. Sketch both curves in the spaces
provided below. Don’t worry about the numbers, just show the shapes of the curves.
5. How do the shapes of the curves differ?
6. Based on your answers to the above questions, why would it be inappropriate to use
the logistic growth model to project moose population growth? In other words,
why do the graphs look different?
N
Time
Logistic Population Growth Moose Population Growth
N
Time

7. A conservation organization hears about the good moose habitat on Isle Royale.
They are looking for a new home for 100 moose that live in a park that is going to
be turned into a huge shopping mall. If 100 more moose are brought to Isle Royale
and allowed to join the current population, how would this change the population
graph you drew? In the space provided, draw a quick sketch of what you think your
new graph with the added time steps would look like. Be sure to label the axes.
9. Now you get to test your intuition by adding 100 more moose to the island. First
find the Species Panel, which lists all the different species in the model. Click on
Moose so that it is highlighted.
10. Then click on the Paint button (the paint brush button) in the Control Panel. Move
your mouse to an empty spot on the island, hold down the mouse button, and
highlight some squares, keeping track of how many you have highlighted. When
you let go of the mouse button, the rectangle will be filled with new moose. Repeat
this until you have painted in 100 new moose (plus or minus a few is OK).
11. After you have added 100 or so moose, click on the Get Info button in the Control
Panel to deactivate the paint button (so that you don't accidentally paint in more).
12. Run the model for 20-30 more years (years are tracked to the right of the control
panel) and watch what happens to the population size of the moose. Copy the
population graph from your computer monitor
Did you make the correct prediction in step 8? What is the new carrying capacity
of moose on Isle Royale?
Exercise 3: The Predators Arrive
One cold winter several decades after the moose arrived, a small pack of wolves
walked across the ice from Canada to reach Isle Royale. In the next steps, you'll add
wolves to the island and see how that changes the moose population.
1. To add a few wolves to Isle Royale, first click once on Wolves in the Species panel.
Wolves should now be highlighted in the list of species.
2. Click on the Paint button in the Control Panel.
3. Click on two or three single squares in Isle Royale. Each click will add a wolf.
Remember to switch back to the Get Info button after you are done adding wolves.
4. Start the model running again.
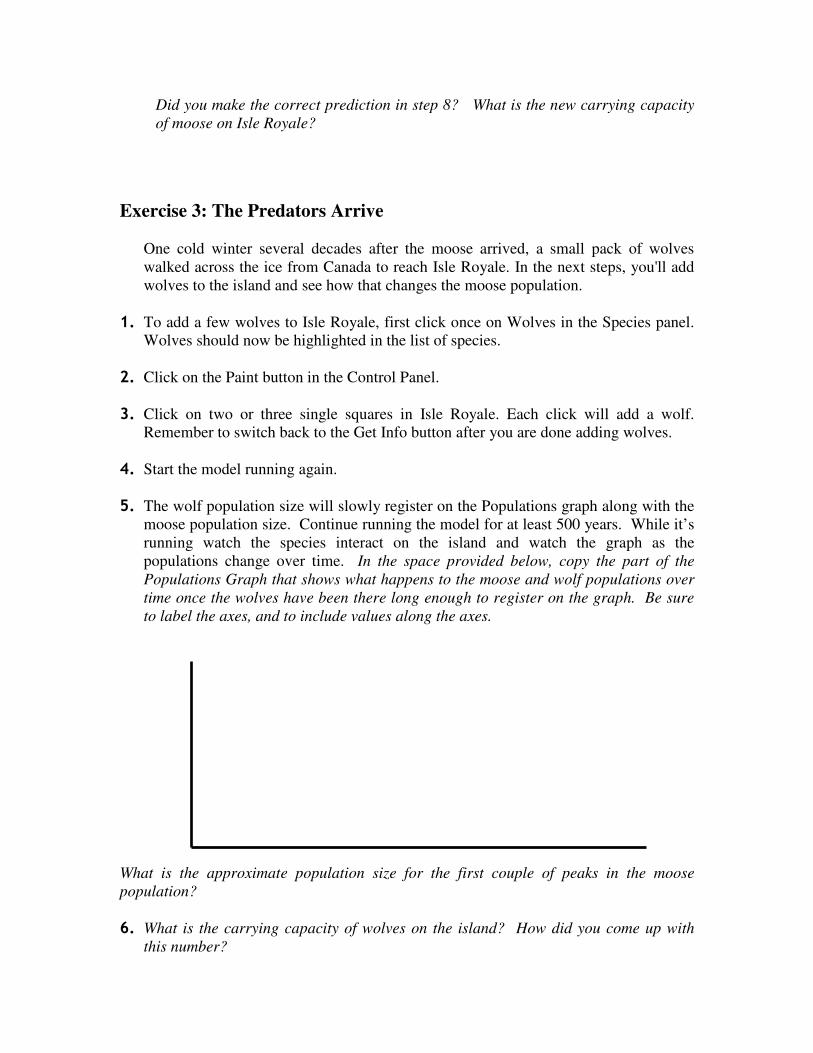
5. The wolf population size will slowly register on the Populations graph along with the
moose population size. Continue running the model for at least 500 years. While it’s
running watch the species interact on the island and watch the graph as the
populations change over time. In the space provided below, copy the part of the
Populations Graph that shows what happens to the moose and wolf populations over
time once the wolves have been there long enough to register on the graph. Be sure
to label the axes, and to include values along the axes.
What is the approximate population size for the first couple of peaks in the moose
population?
6. What is the carrying capacity of wolves on the island? How did you come up with
this number?
7. How much did the wolves reduce the size of the moose population?
8. You should have noticed that the populations of moose and wolves go through cycles.
Does the moose or the wolf population climb first in each cycle? Which population
drops first in each cycle? Provide a biological explanation for the pattern you see.
Exercise 4: Producers and Consumers
So far in this lab, you have not been asked to pay much attention to the plants. But the
moose and the plants interact as predator and prey, much like the wolves and the moose
(just without all the blood and gore). >From the perspective of one of the plants, the
moose are vicious predators. The second predator-prey relationship, between the moose
and the plants, can influence the first one, between the moose and the wolves. In the next
few steps, you will try changing how quickly the plants grow back after being preyed
upon to see what effect that has on the community.
1. Find the "Rate of plant growth" at the bottom of the screen. Double this rate of
growth from its current value of 100 to 200 by clicking on the "100" and typing in
"200." Then click the Set button.
2. Reset and run the model again.
3. Describe how the moose population changes (in terms of population size and
carrying capacity) when the growth rate of the plants doubles. It might help you to
sketch the graph.
4. Add in wolves, and then describe how the wolf population and the dynamics of the
wolf and moose populations change with higher growth rate of food.
5. Write down a prediction for what will happen to the moose and wolf populations if
you triple the growth rate of the plants over what they were originally (i.e. to 300).
6. Repeat step 1 to triple the plants growth rate. Reset and Run the simulation.
Describe and then try to explain what happened.
7. Write down a prediction for what will happen to the moose and wolf populations if
you make the plants grow at half of their original growth rate.
8. Do the experiment and then describe and try to come up with a biological
explanation for what happened.
Wrap-up
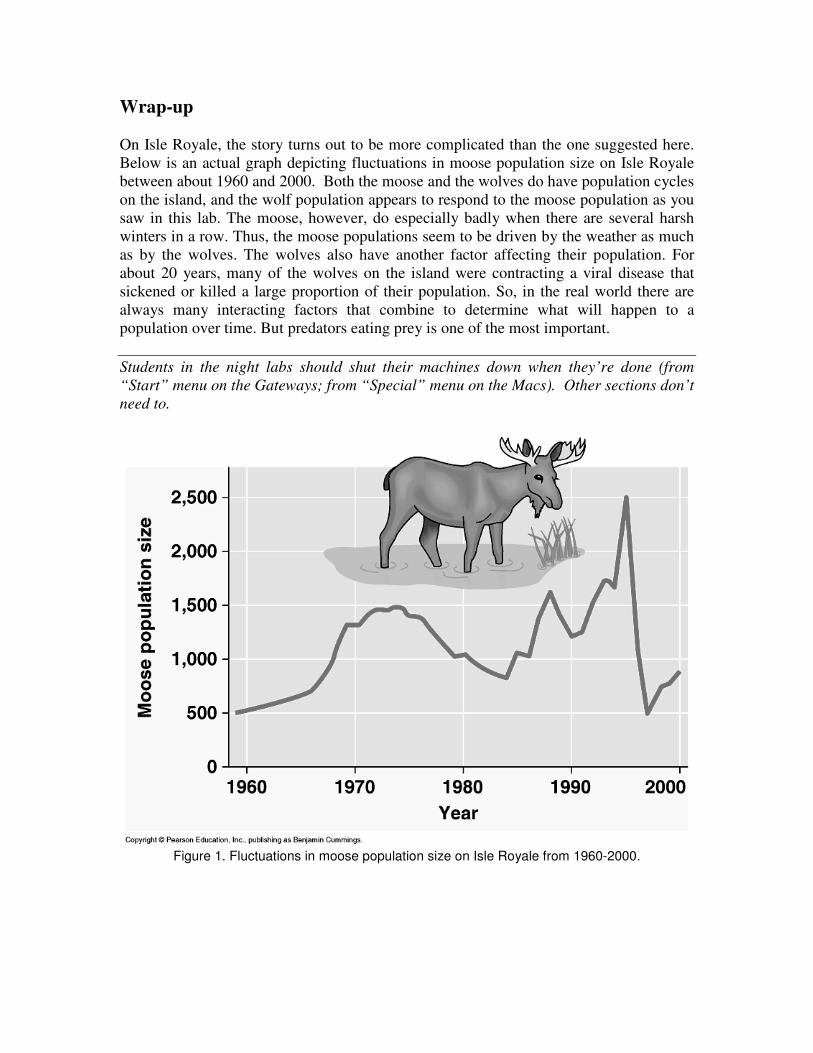
On Isle Royale, the story turns out to be more complicated than the one suggested here.
Below is an actual graph depicting fluctuations in moose population size on Isle Royale
between about 1960 and 2000. Both the moose and the wolves do have population cycles
on the island, and the wolf population appears to respond to the moose population as you
saw in this lab. The moose, however, do especially badly when there are several harsh
winters in a row. Thus, the moose populations seem to be driven by the weather as much
as by the wolves. The wolves also have another factor affecting their population. For
about 20 years, many of the wolves on the island were contracting a viral disease that
sickened or killed a large proportion of their population. So, in the real world there are
always many interacting factors that combine to determine what will happen to a
population over time. But predators eating prey is one of the most important.
Students in the night labs should shut their machines down when they’re done (from
“Start” menu on the Gateways; from “Special” menu on the Macs). Other sections don’t
need to.
Figure 1. Fluctuations in moose population size on Isle Royale from 1960-2000.
Wolf conservation laboratory exercise – Biology 106
Introduction – Recently, the federal government has removed (delisted) gray wolves from
the Endangered Species listing, allowing states to regulate wolf populations and allow
hunting. Populations in Idaho will be reduced under the management of the Idaho
Department of Fish and Game. Management in Idaho has included issuing hunting
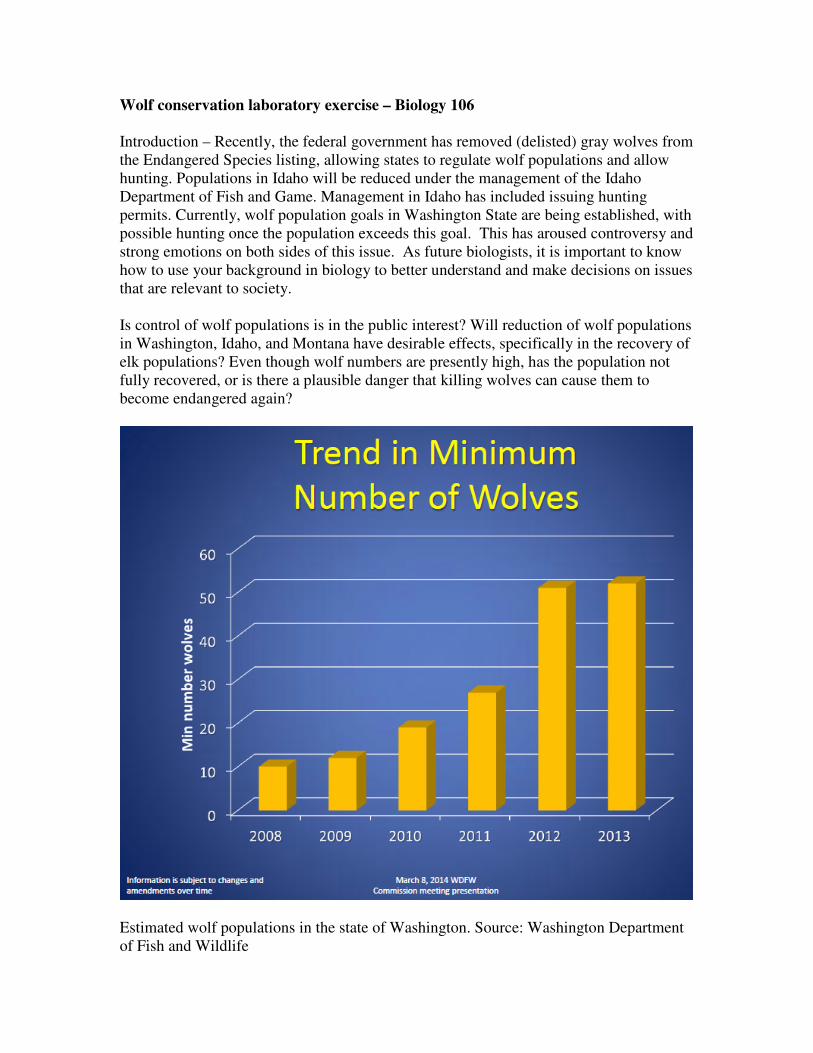
permits. Currently, wolf population goals in Washington State are being established, with
possible hunting once the population exceeds this goal. This has aroused controversy and
strong emotions on both sides of this issue. As future biologists, it is important to know
how to use your background in biology to better understand and make decisions on issues
that are relevant to society.
Is control of wolf populations is in the public interest? Will reduction of wolf populations
in Washington, Idaho, and Montana have desirable effects, specifically in the recovery of
elk populations? Even though wolf numbers are presently high, has the population not
fully recovered, or is there a plausible danger that killing wolves can cause them to
become endangered again?
Estimated wolf populations in the state of Washington. Source: Washington Department
of Fish and Wildlife
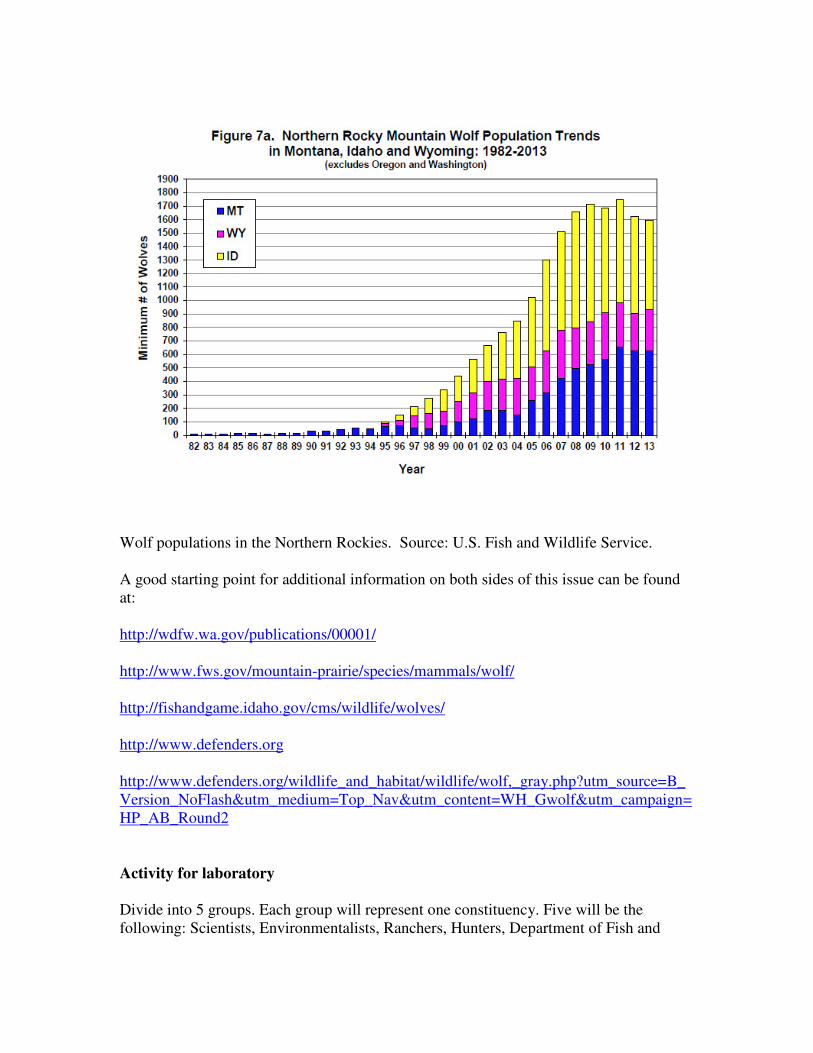
Wolf populations in the Northern Rockies. Source: U.S. Fish and Wildlife Service.
A good starting point for additional information on both sides of this issue can be found
at:
http://wdfw.wa.gov/publications/00001/
http://www.fws.gov/mountain-prairie/species/mammals/wolf/
http://fishandgame.idaho.gov/cms/wildlife/wolves/
http://www.defenders.org
http://www.defenders.org/wildlife_and_habitat/wildlife/wolf,_gray.php?utm_source=B_
Version_NoFlash&utm_medium=Top_Nav&utm_content=WH_Gwolf&utm_campaign=
HP_AB_Round2
Activity for laboratory
Divide into 5 groups. Each group will represent one constituency. Five will be the
following: Scientists, Environmentalists, Ranchers, Hunters, Department of Fish and
Game. Each group will answer the questions below. TAs will then find areas of
agreement and disagreement between groups, followed by discussion.
Session questions
1. What is an “endangered” species?
2. Do wolves significantly affect livestock (e.g., cattle) and pets? How do you define
significantly?
3. What are major factors affecting deer and elk populations, what is their primary
cause of death?
4. Does sport hunting control wolf populations in Alaska and Canada?
5. Is poisoning and aerial hunting needed to effectively manage wolf populations?
6. Does killing one member of a wolf pack significantly decrease effects on prey
species or is it necessary to eliminate the entire pack? Why or why not?
What is your group’s position?
a. Should wolves remain listed under the Endangered Species Act. This
means that there is no hunting or killing of wolves in Washington, Idaho
and Montana.
b. If in favor of delisting which of the following do you support or partially
support:
i. Regulated sport and subsistence hunting of wolves
ii. Wolf killing (management) by the fish and game agencies
iii. Hunting and management in all public and private lands in these
states

c. Should affected citizens be compensated for damages that result from the
regulations. If so, what compensation will be possible, what sources will
be used for revenue (taxes, fees, cutting federal or state programs)