ecology, biology 216
DESCRIPTION
Ecology, Biology 216. Todd Livdahl. Requirements. Essays (3) 20% Lab exercises 20% Quizzes (3)30% Final Exam (comp)20%. Essays. Practical ecological problem Population study Species interaction (2 spp or more). Lab Exercises. Interpret ecological data - PowerPoint PPT PresentationTRANSCRIPT
Ecology, Biology 216
Todd Livdahl
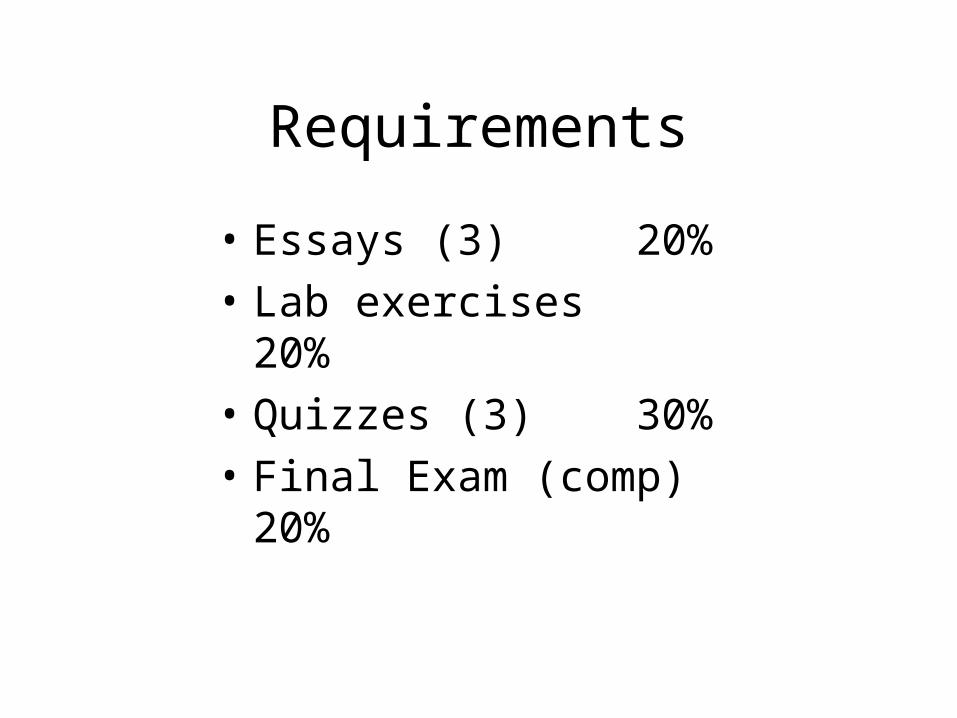
Requirements
• Essays (3) 20%
• Lab exercises 20%
• Quizzes (3) 30%
• Final Exam (comp) 20%
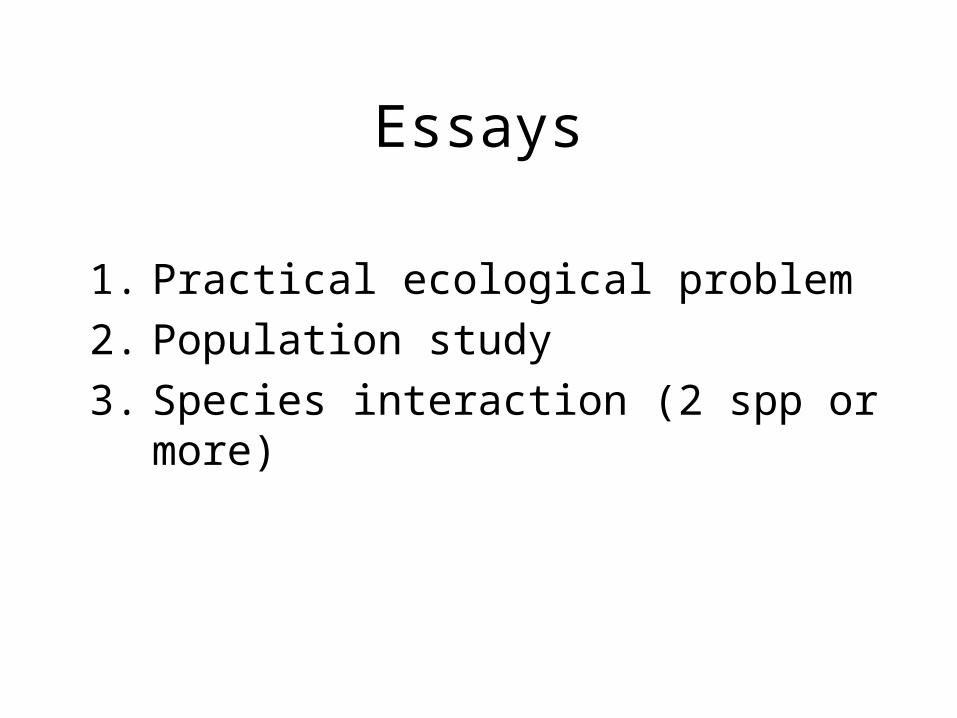
Essays
1. Practical ecological problem
2. Population study
3. Species interaction (2 spp or more)
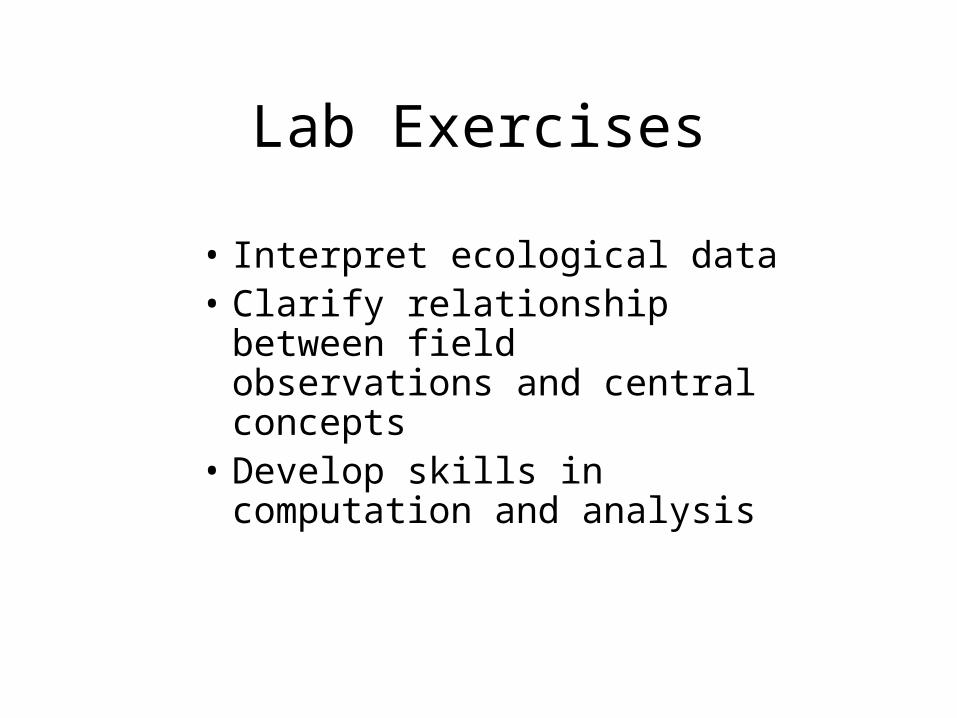
Lab Exercises
• Interpret ecological data• Clarify relationship between
field observations and central concepts
• Develop skills in computation and analysis
Quizzes and Final
• 3 Quizzes, equal weight
• Full class in length
• Concept-driven
• Qualitative
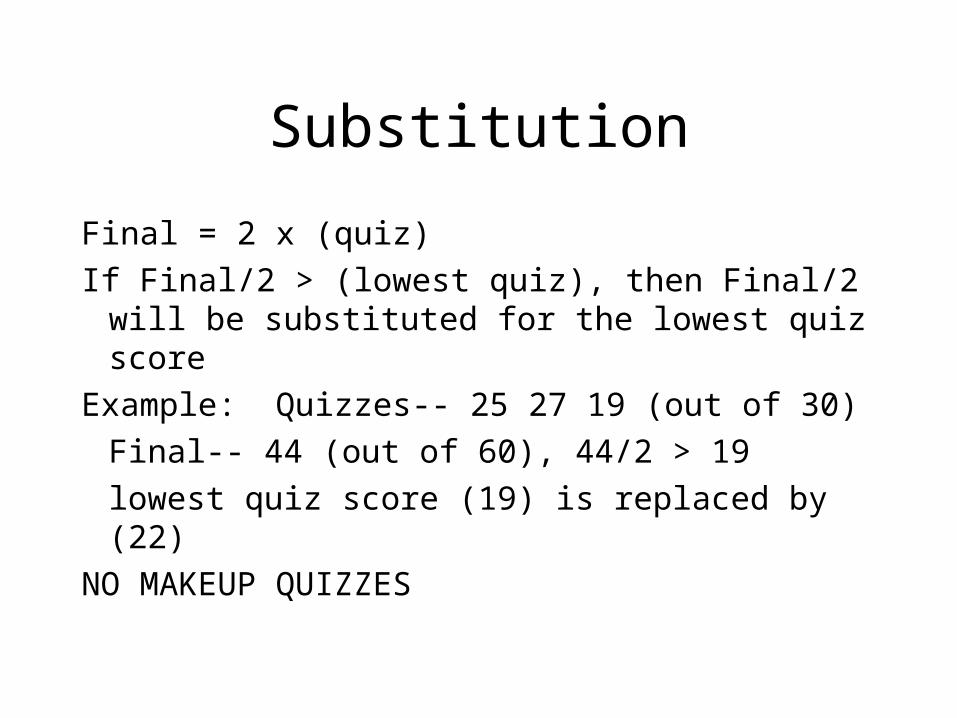
Substitution
Final = 2 x (quiz)
If Final/2 > (lowest quiz), then Final/2 will be substituted for the lowest quiz score
Example: Quizzes-- 25 27 19 (out of 30)
Final-- 44 (out of 60), 44/2 > 19
lowest quiz score (19) is replaced by (22)
NO MAKEUP QUIZZES
First Essay
Due Jan. 28
Description of problem
Justification as a problem
Solution strategies possible or solution strategies attempted
Problems arising from solutions
3-4 pages should suffice
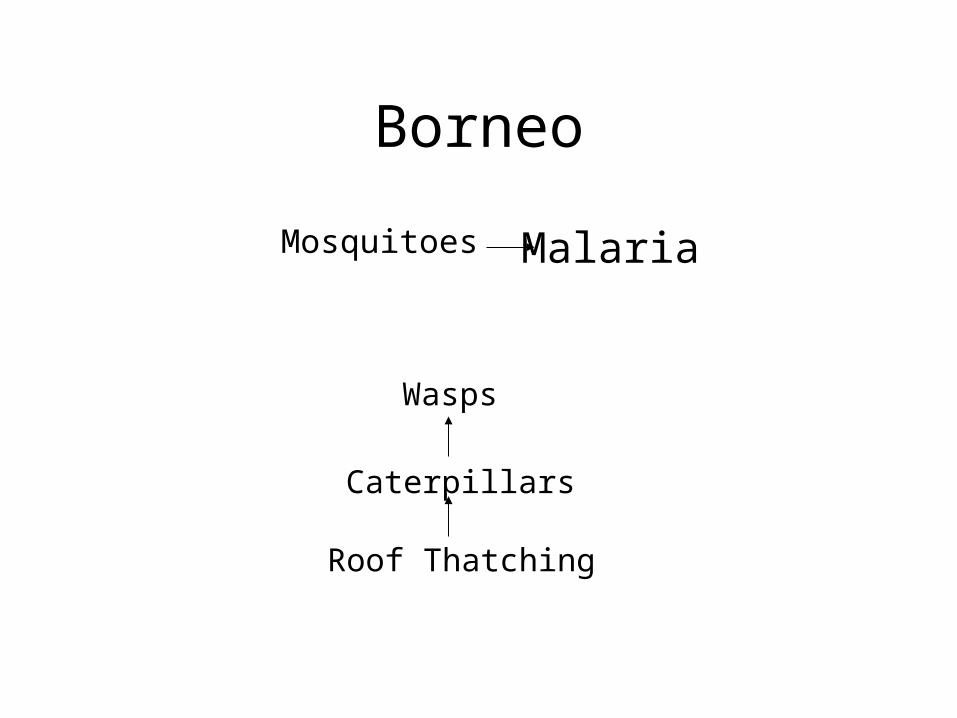
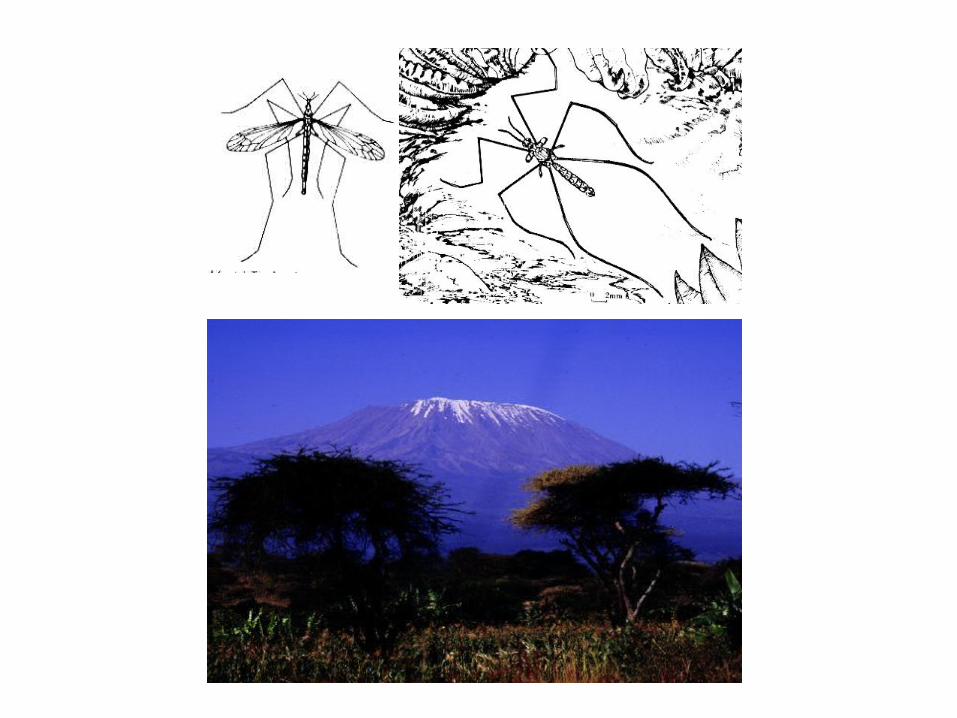
Borneo
Mosquitoes Malaria
Caterpillars
Roof Thatching
Wasps
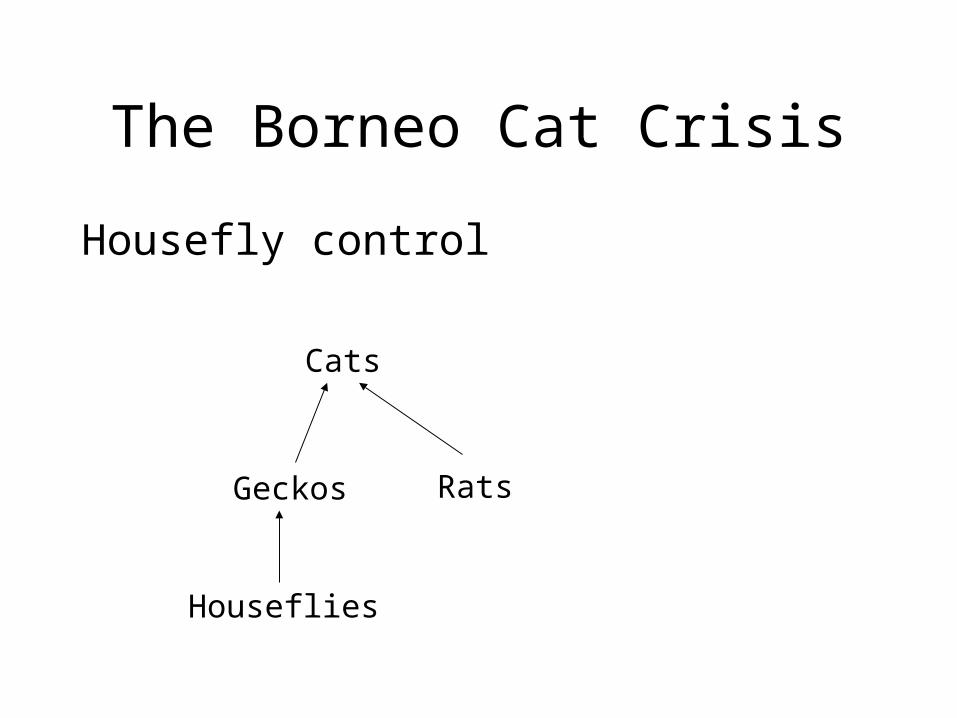
The Borneo Cat Crisis
Housefly control
Houseflies
Geckos
Cats
Rats
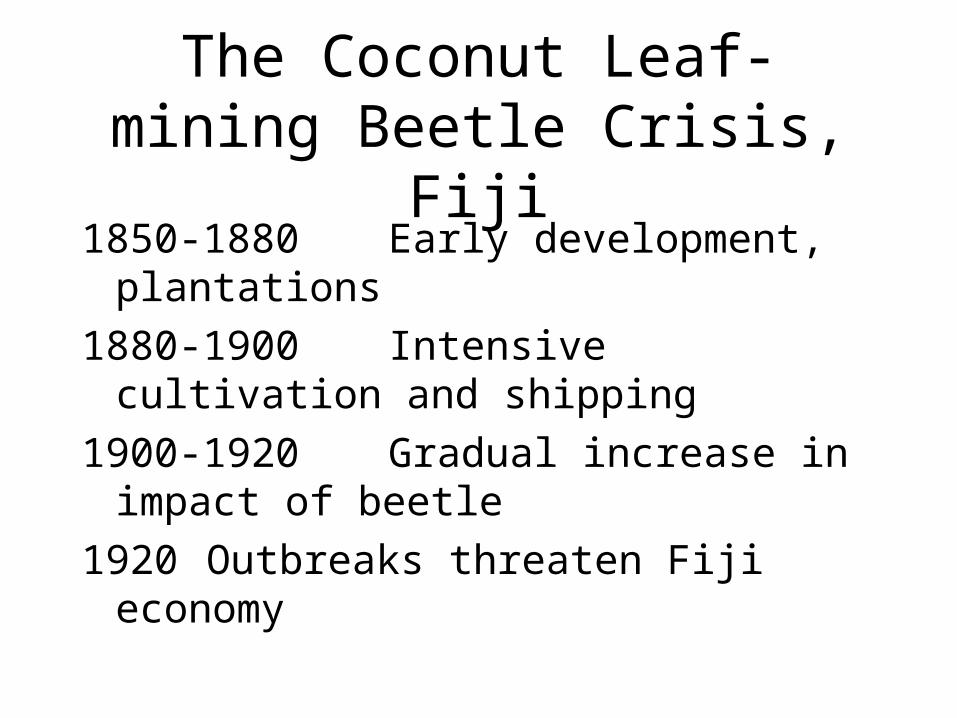
The Coconut Leaf-mining Beetle Crisis, Fiji
1850-1880 Early development, plantations
1880-1900 Intensive cultivation and shipping
1900-1920 Gradual increase in impact of beetle
1920 Outbreaks threaten Fiji economy
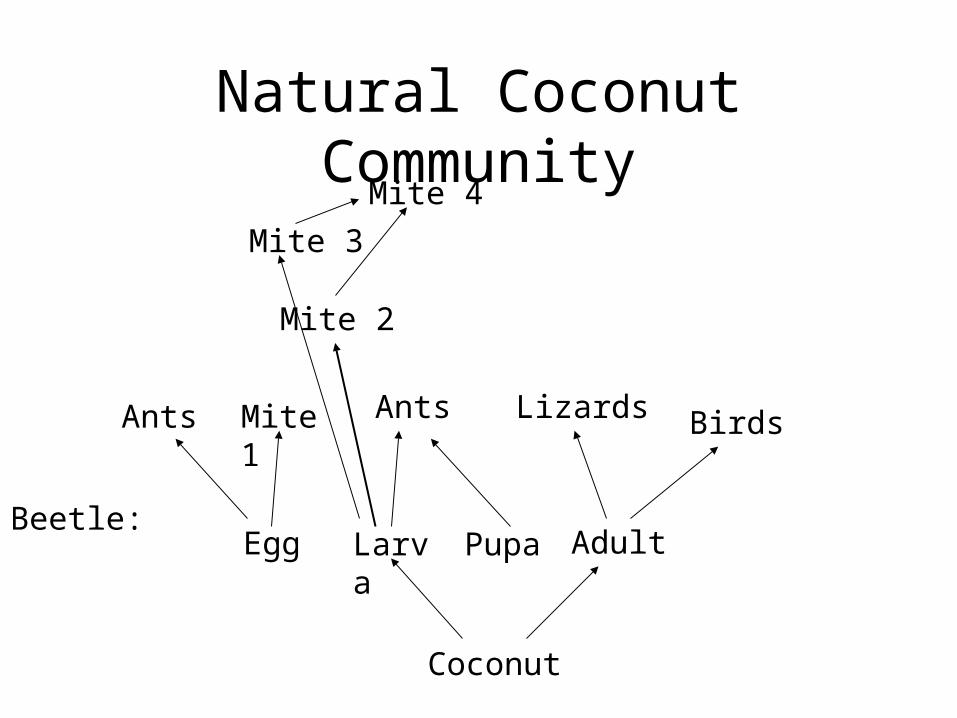
Natural Coconut Community
Coconut
Beetle:Egg Larva Pupa Adult
Ants Mite 1 Ants Lizards Birds
Mite 2
Mite 3
Mite 4
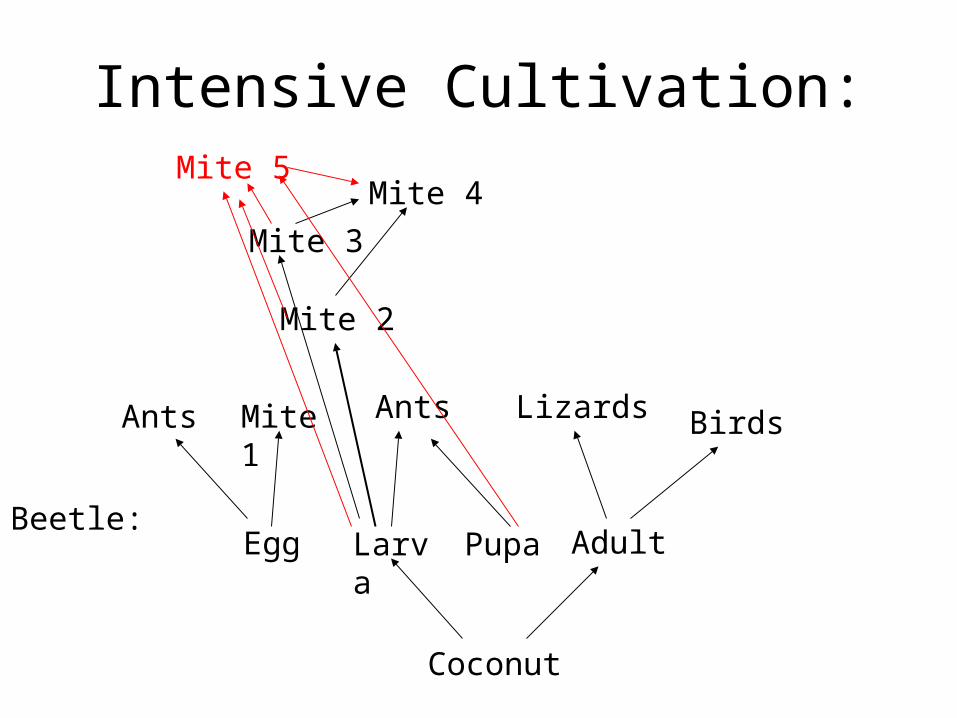
Intensive Cultivation:
Coconut
Beetle:Egg Larva Pupa Adult
Ants Mite 1 Ants Lizards Birds
Mite 2
Mite 3
Mite 4Mite 5

Container-breeding Mosquitoes
Adults
Eggs
Larvae
Pupae
Container habitat
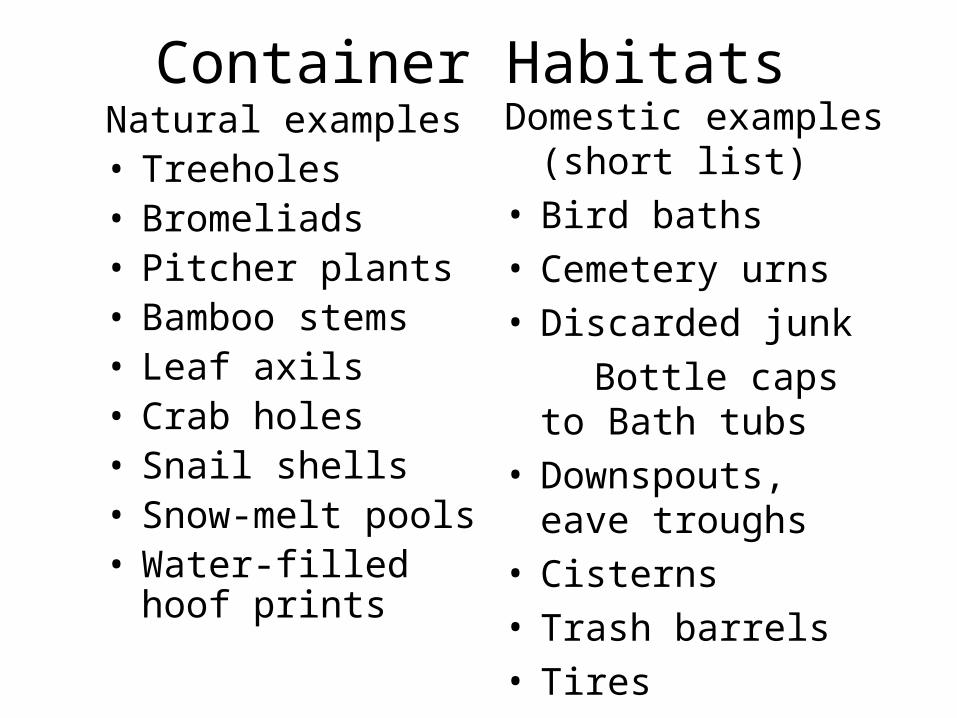
Container HabitatsNatural examples• Treeholes• Bromeliads• Pitcher plants• Bamboo stems• Leaf axils• Crab holes• Snail shells• Snow-melt pools• Water-filled hoof
prints
Domestic examples (short list)
• Bird baths• Cemetery urns• Discarded junk
Bottle caps to Bath tubs
• Downspouts, eave troughs
• Cisterns• Trash barrels• Tires
Meetings of interest (from AMCA Newsletter):

Aedes albopictus and the New Globalism
Distribution: 1983: tropical and temperate Asia, Pacific Islands1984, 1985: Memphis, TennesseeHouston, Texas-- the most abundant mosquito in a pile of used tires
First discovery of Aedes albopictus in Western Hemisphere
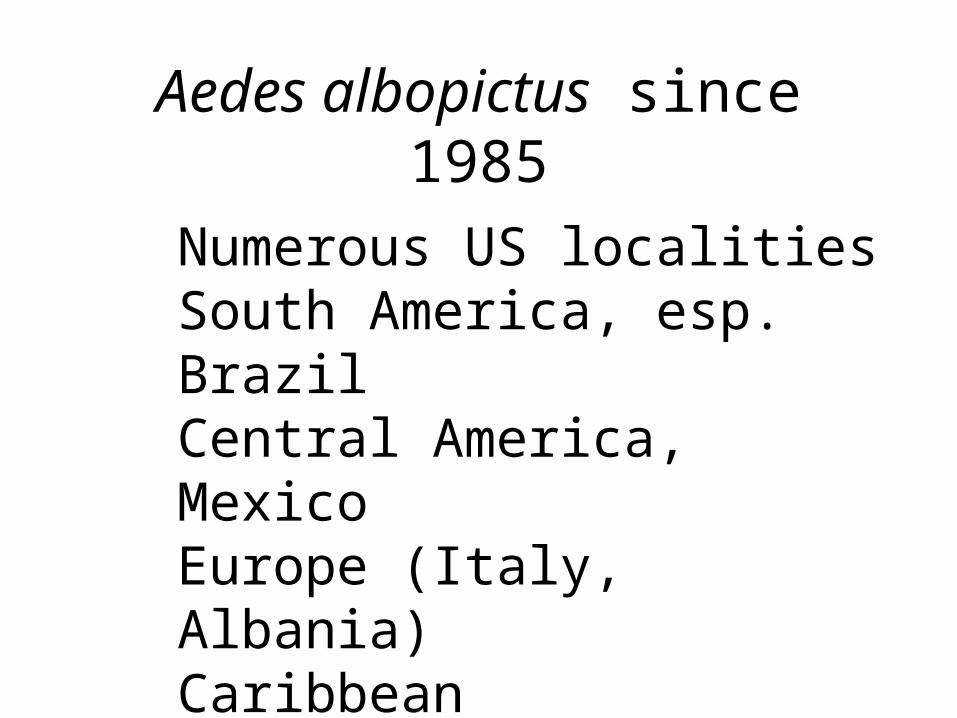
Aedes albopictus since 1985
Numerous US localitiesSouth America, esp. BrazilCentral America, MexicoEurope (Italy, Albania)CaribbeanBermuda
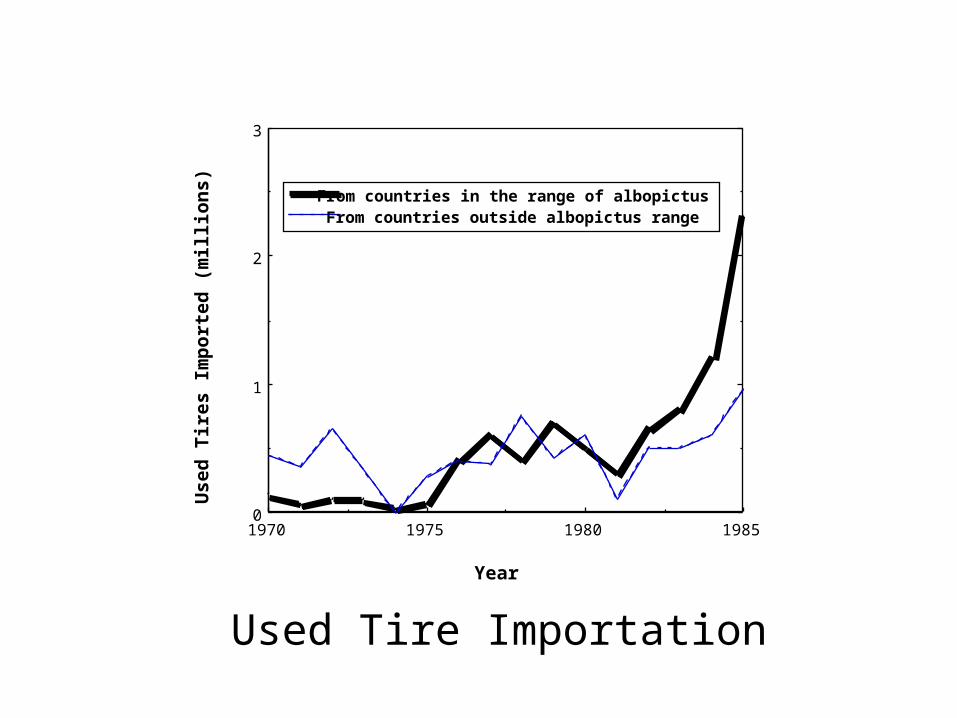
Used Tire Importation
19851980197519700
1
2
3
From countries in the range of albopictus From countries outside albopictus range
Year
Use
d T
ires
Im
po
rted
(m
illi
on
s)
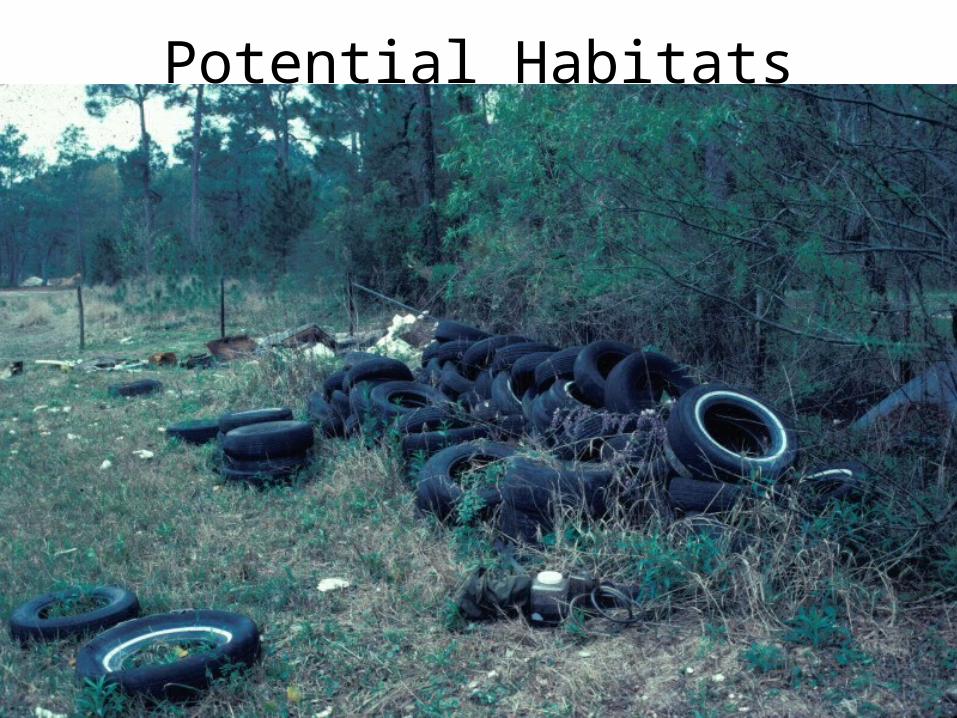
Potential Habitats
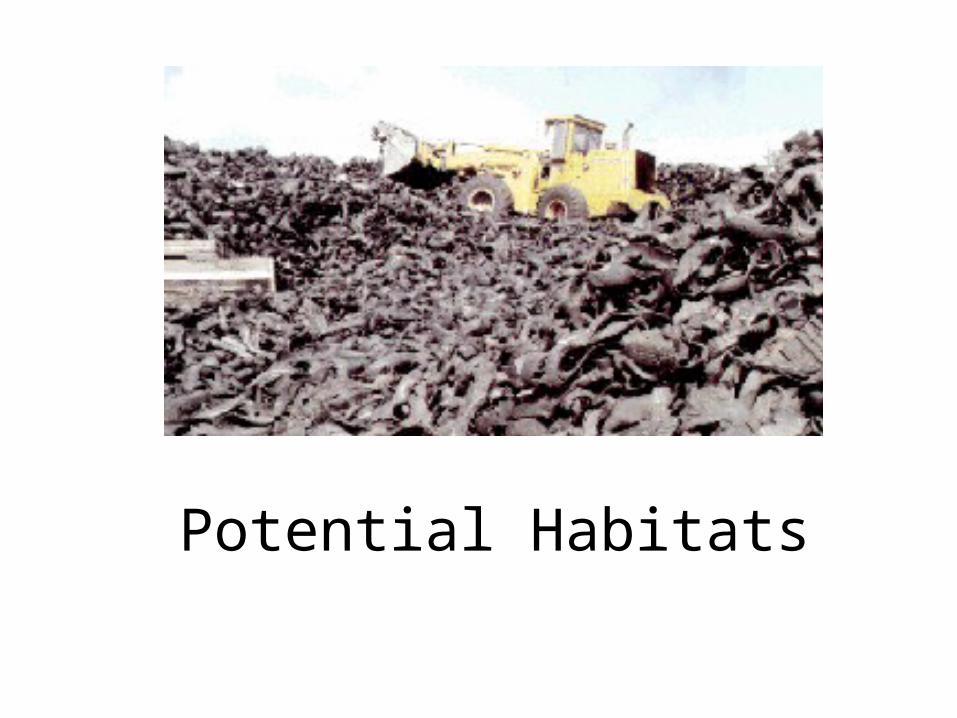
Potential Habitats

Treehole
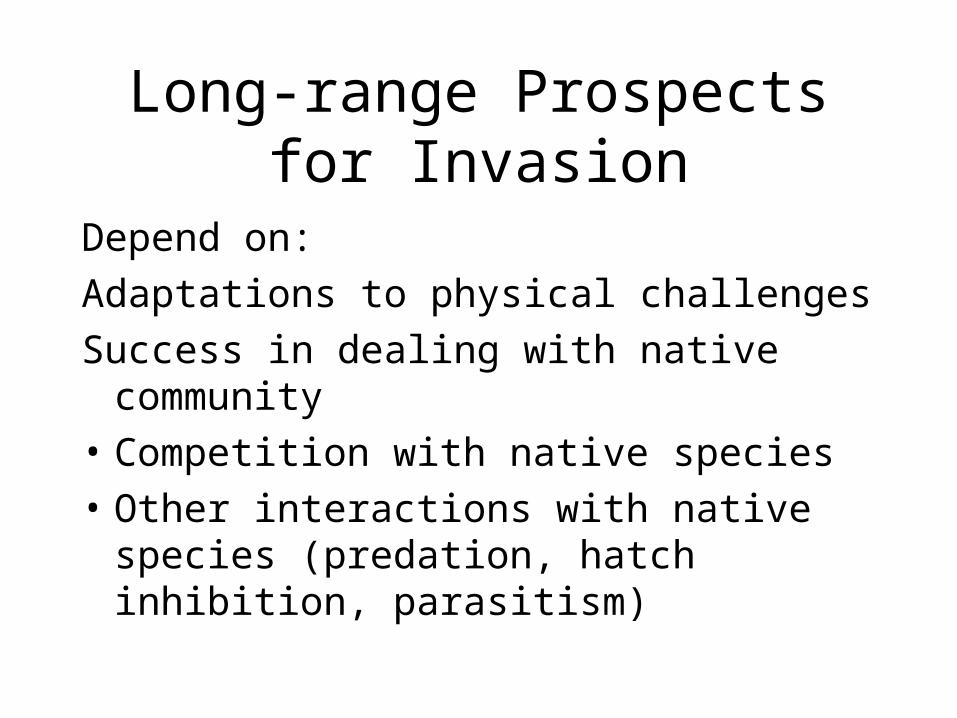
Long-range Prospects for Invasion
Depend on:
Adaptations to physical challenges
Success in dealing with native community
• Competition with native species
• Other interactions with native species (predation, hatch inhibition, parasitism)
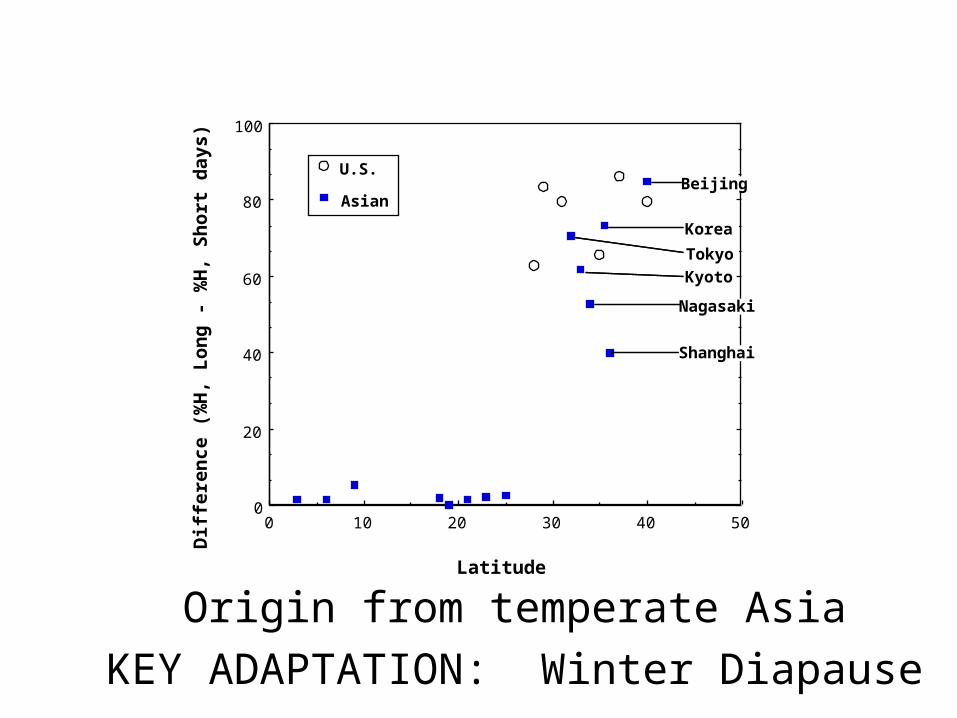
Origin from temperate Asia
KEY ADAPTATION: Winter Diapause
504030201000
20
40
60
80
100
U.S.
Asian
Latitude
Dif
fere
nce
(%
H,
Lo
ng
- %
H,
Sh
ort
day
s)
Beijing
Korea
Tokyo
Kyoto
Nagasaki
Shanghai
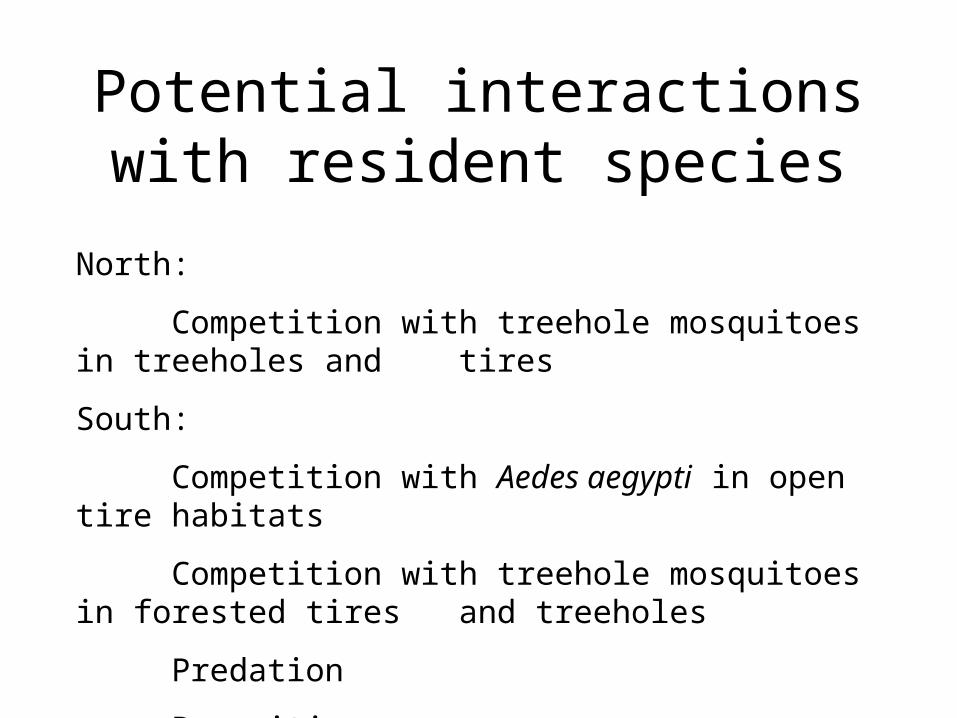
Potential interactions with resident species
North:
Competition with treehole mosquitoes in treeholes and tires
South:
Competition with Aedes aegypti in open tire habitats
Competition with treehole mosquitoes in forested tires and treeholes
Predation
Parasitism
Topics, 2nd & 3rd Lecture
2nd Lecture
Origins of Ecology
Influence of Evolution
Determining Inheritance
3rd Lecture
Reasons to study Evolution
Criteria for Natural Selection
Forms of Selection
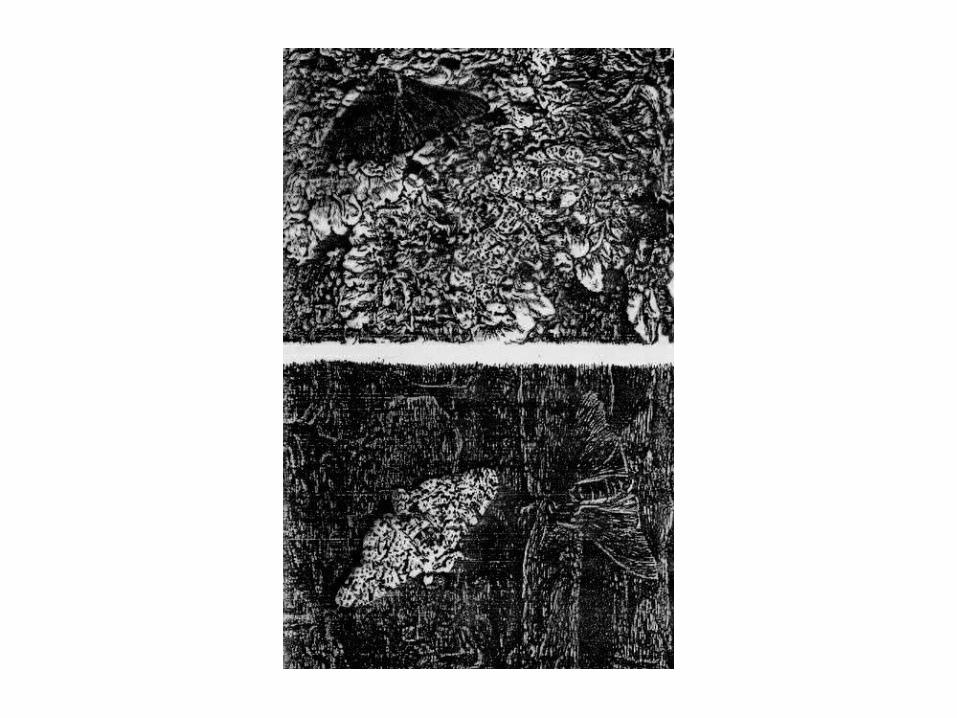
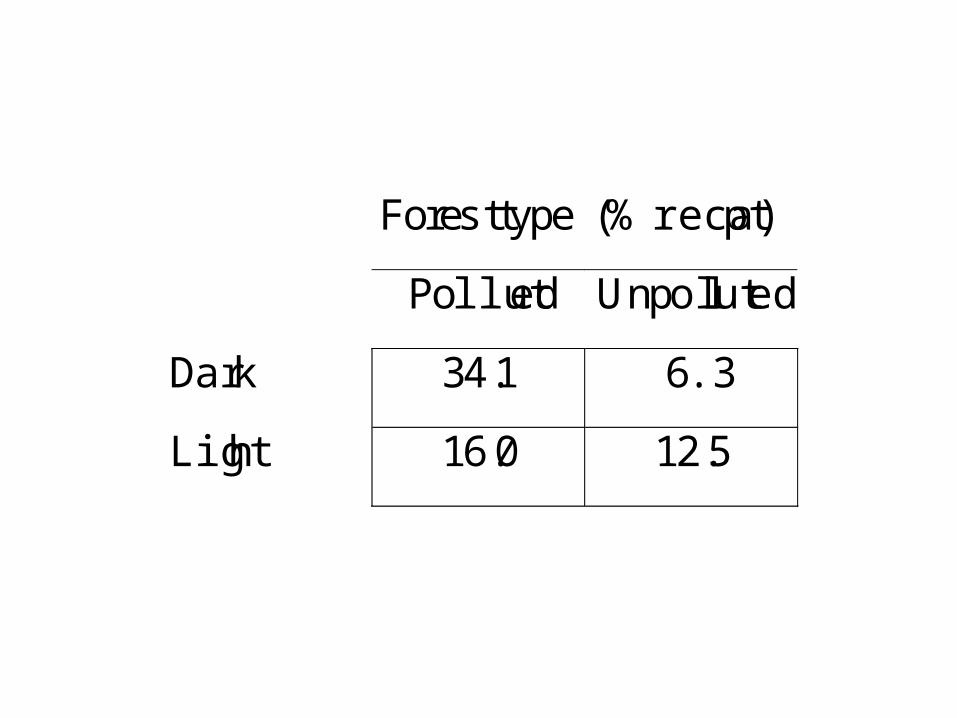
Forest type (% recapt)
Polluted Unpolluted
Dark 34.1 6.3
Light 16.0 12.5
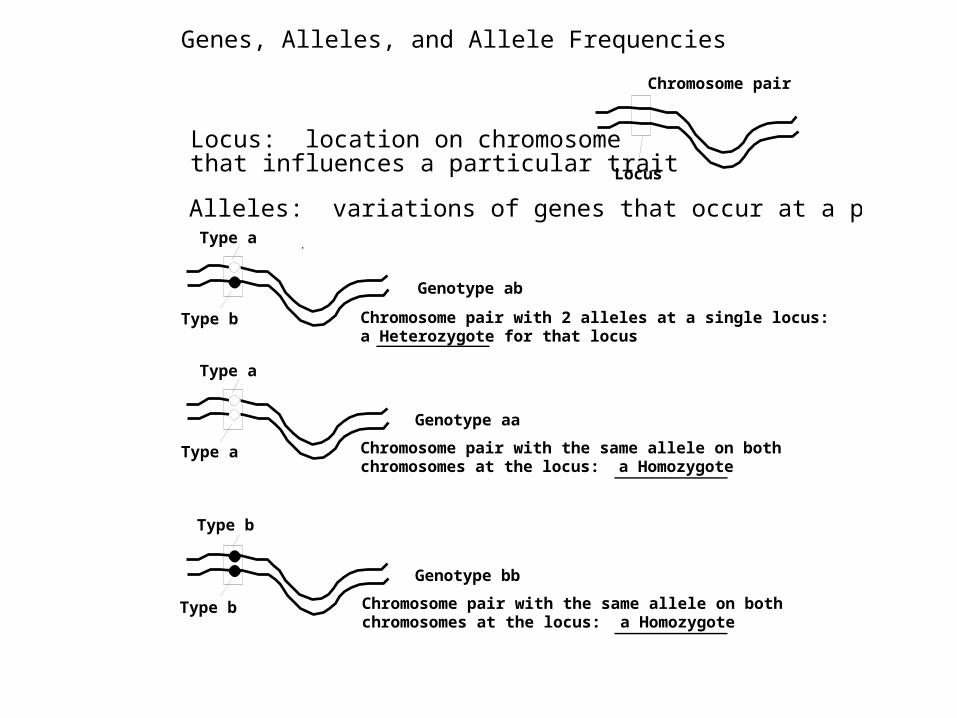
Genes, Alleles, and Allele Frequencies
Locus: location on chromosome that influences a particular trait
Alleles: variations of genes that occur at a particular locus
Chromosome pair
Locus
Type a
Type b Chromosome pair with 2 alleles at a single locus: a Heterozygote for that locus
Type a
Chromosome pair with the same allele on both chromosomes at the locus: a Homozygote
Genotype ab
Type a
Genotype aa
Type b
Genotype bb
Type b
Chromosome pair with the same allele on both chromosomes at the locus: a Homozygote
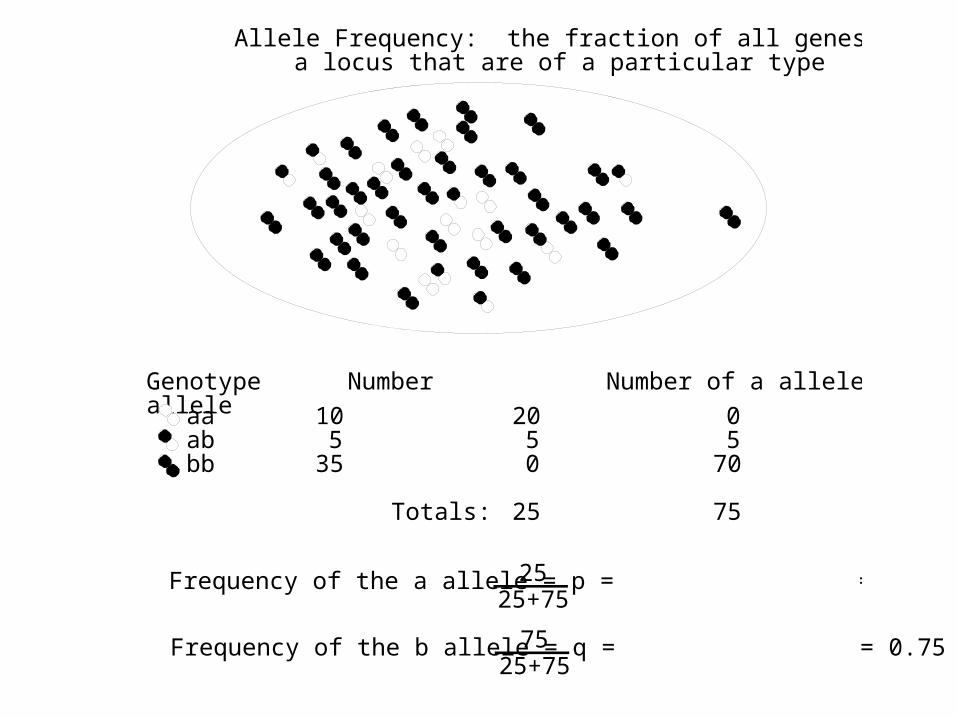
Allele Frequency: the fraction of all genes at a locus that are of a particular type
Genotype Number Number of a allele Number of b alleleaa
abbb
105
35
2050
25
05
70
75Totals:
Frequency of the a allele = p = = 0.252525+75
Frequency of the b allele = q = = 0.75 = 1-p7525+75
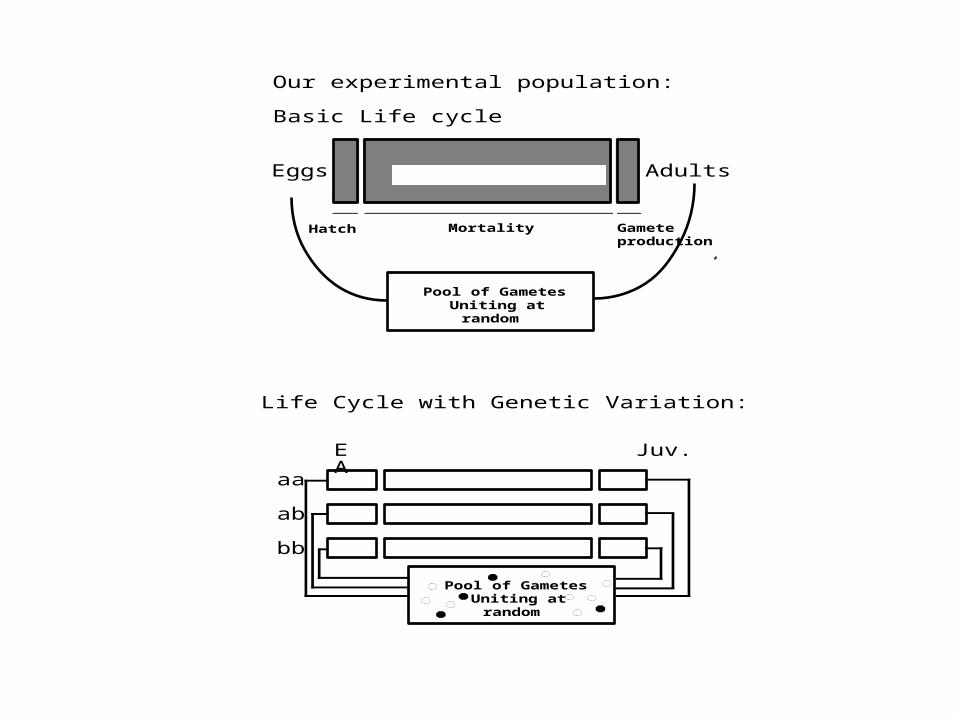
Our experimental population:
Basic Life cycle
JuvenilesEggs Adults
Mortality Gamete production
Hatch
Pool of GametesUniting at
random
Life Cycle with Genetic Variation:
E Juv. A
aa
ab
bb
Pool of GametesUniting at
random
E Juv. A
aa
ab
bb
Pool of GametesUniting at
random
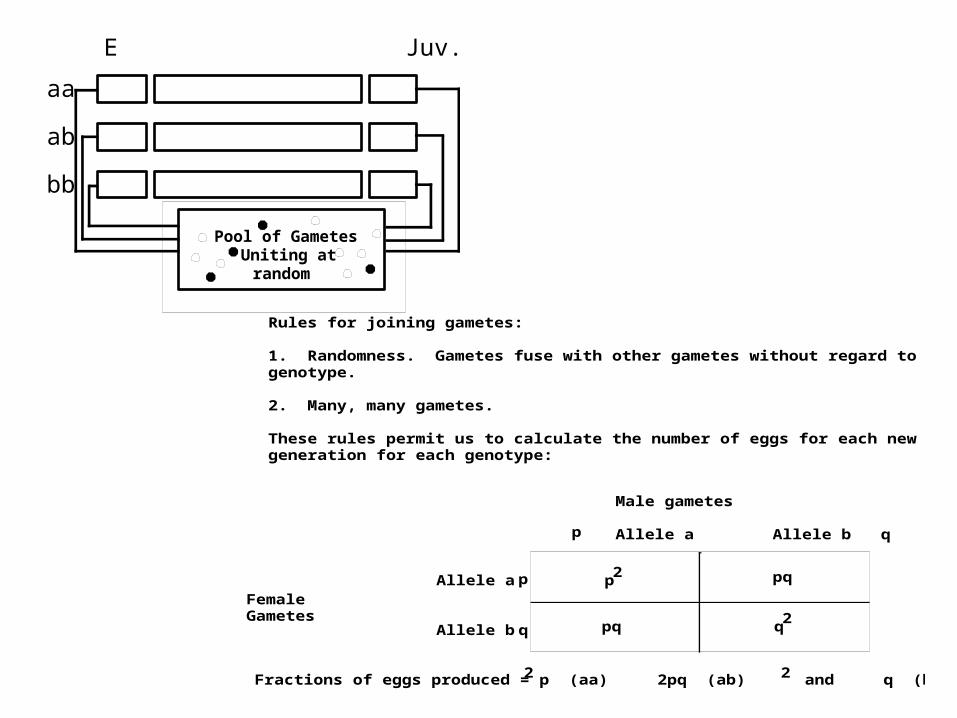
Rules for joining gametes:
1. Randomness. Gametes fuse with other gametes without regard to genotype.
2. Many, many gametes.
These rules permit us to calculate the number of eggs for each new generation for each genotype:
Male gametes
Allele a Allele b q
FemaleGametes
Allele a
Allele b
p
p
q
p pq2
pq q2
Fractions of eggs produced = p (aa) 2pq (ab) and q (bb)2 2
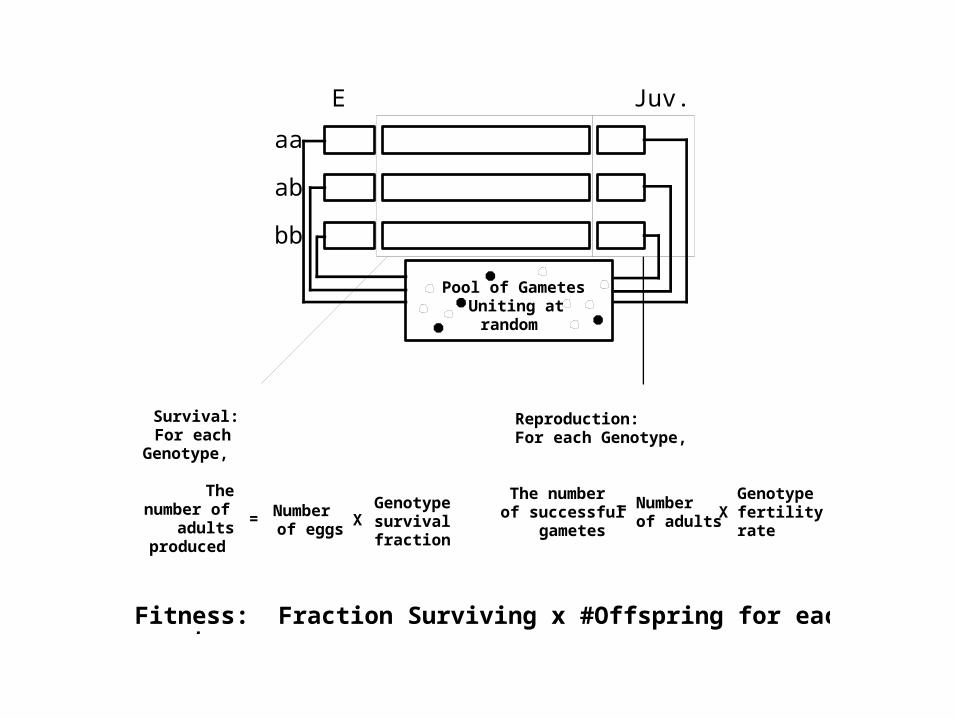
E Juv. A
aa
ab
bb
Pool of GametesUniting at
random
Survival: For each
Genotype,
The number of
adults produced
= Number of eggs
XGenotype survival fraction
Reproduction:For each Genotype,
The number of successful
gametes= Number
of adultsX
Genotype fertility rate
Fitness: Fraction Surviving x #Offspring for each genotype
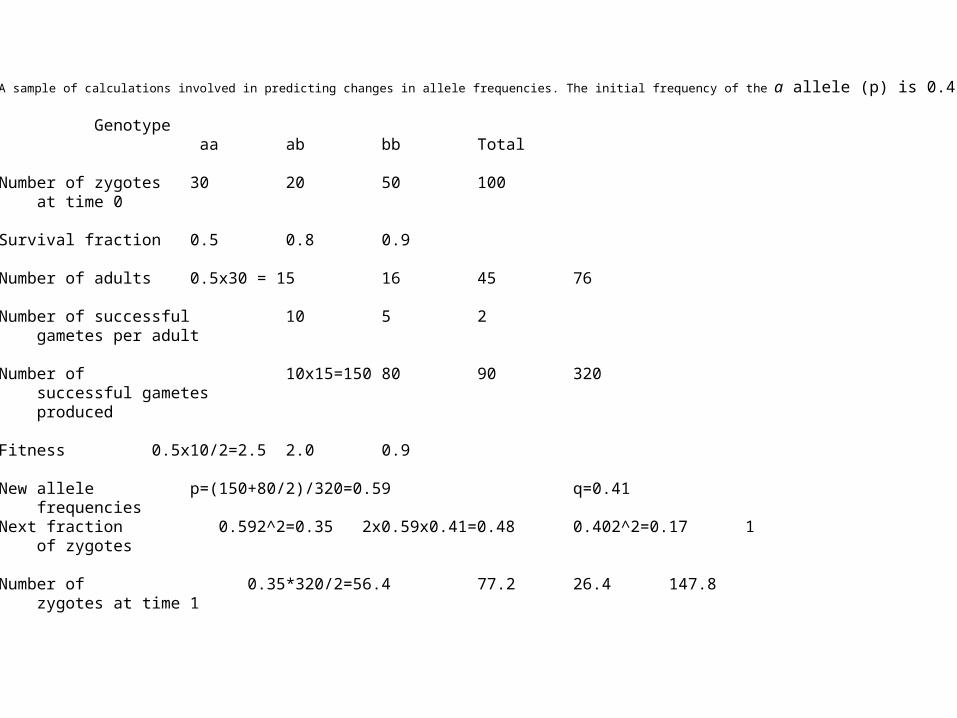
A sample of calculations involved in predicting changes in allele frequencies. The initial frequency of the a allele (p) is 0.4.
Genotype aa ab bb Total
Number of zygotes 30 20 50 100 at time 0
Survival fraction 0.5 0.8 0.9
Number of adults 0.5x30 = 15 16 45 76
Number of successful 10 5 2 gametes per adult
Number of 10x15=150 80 90 320 successful gametes produced
Fitness 0.5x10/2=2.5 2.0 0.9
New allele p=(150+80/2)/320=0.59 q=0.41 frequenciesNext fraction 0.592^2=0.35 2x0.59x0.41=0.48 0.402^2=0.17 1 of zygotes
Number of 0.35*320/2=56.4 77.2 26.4 147.8 zygotes at time 1
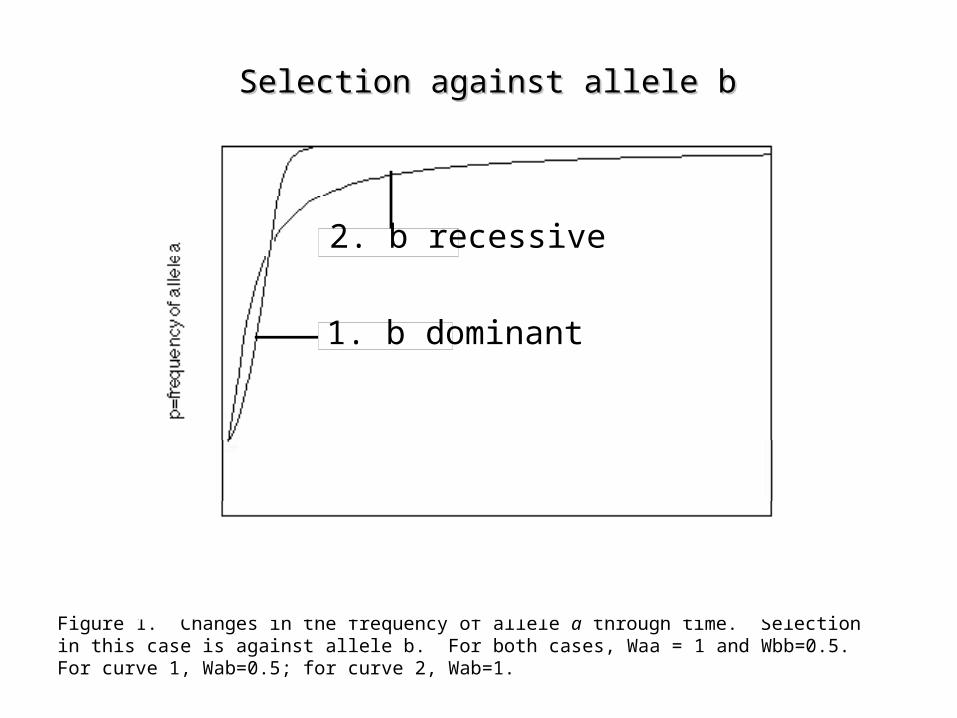
Figure 1. Changes in the frequency of allele a through time. Selection in this case is against allele b. For both cases, Waa = 1 and Wbb=0.5. For curve 1, Wab=0.5; for curve 2, Wab=1.
1.0
00
0.5
100Time (generations)
1. b dominant
2. b recessive
Selection against allele bSelection against allele b
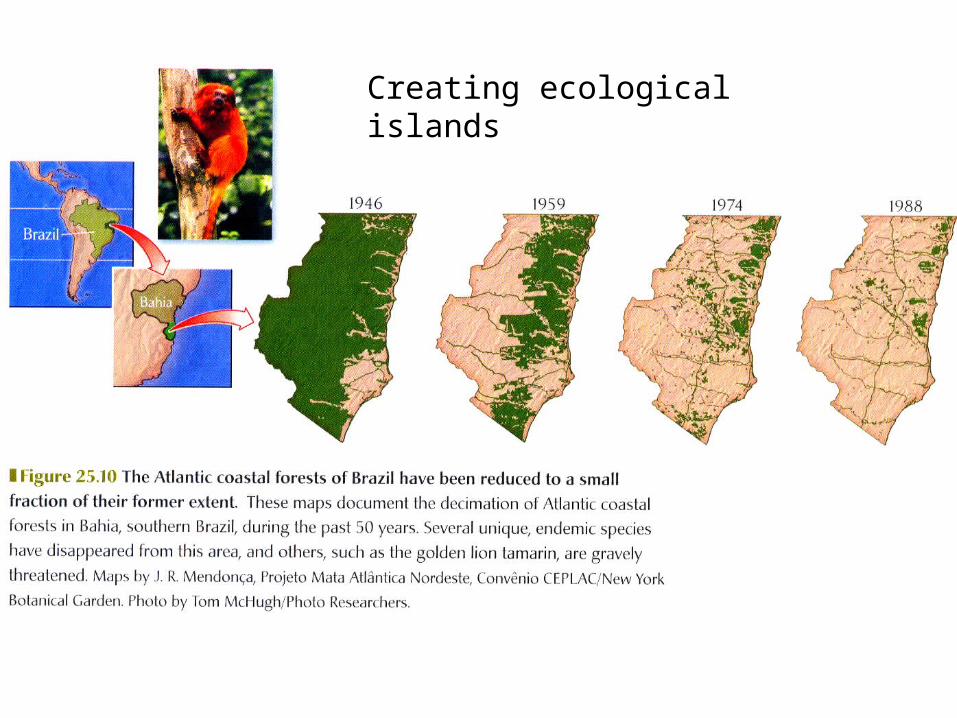
Creating ecological islands
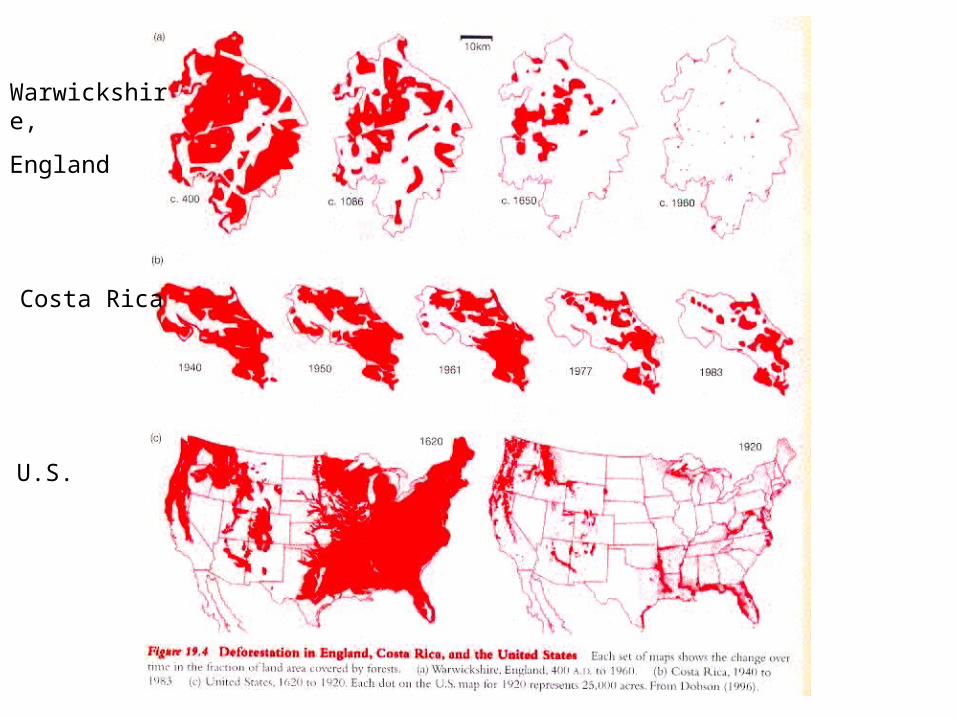
Warwickshire,
England
Costa Rica
U.S.
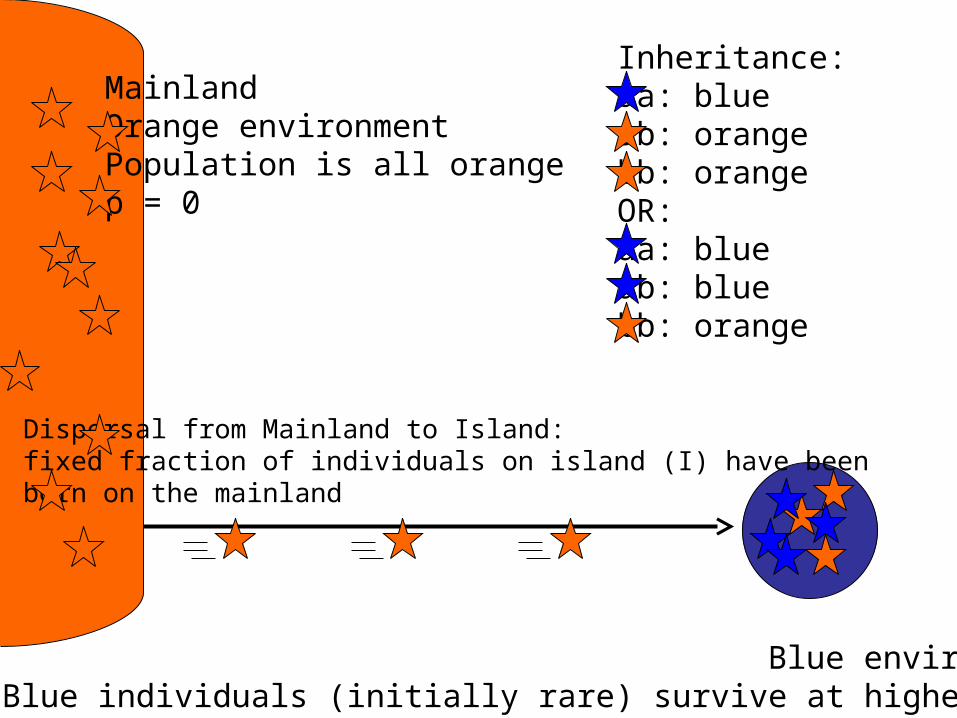
MainlandOrange environmentPopulation is all orangep = 0
IslandBlue environment
Blue individuals (initially rare) survive at higher rate
Inheritance:aa: blueab: orangebb: orangeOR:aa: blueab: bluebb: orange
Dispersal from Mainland to Island:fixed fraction of individuals on island (I) have been born on the mainland

I=0I=0.05
I=0.10
I=0.15
I=0.2
0.5
1.0
0
0 100
Time (generations)
Changes in the frequency of allele a through time for different fractions of immigrants to an island population. Selection in this case is against a dominant allele (b). I denotes the fraction of immigrant individuals arriving into the population with each generation. The initial frequency of the a allele in the island population is 0.2; mainland frequency=0. Fitness values are: Waa=1, Wab=0.5, Wbb=0.5.
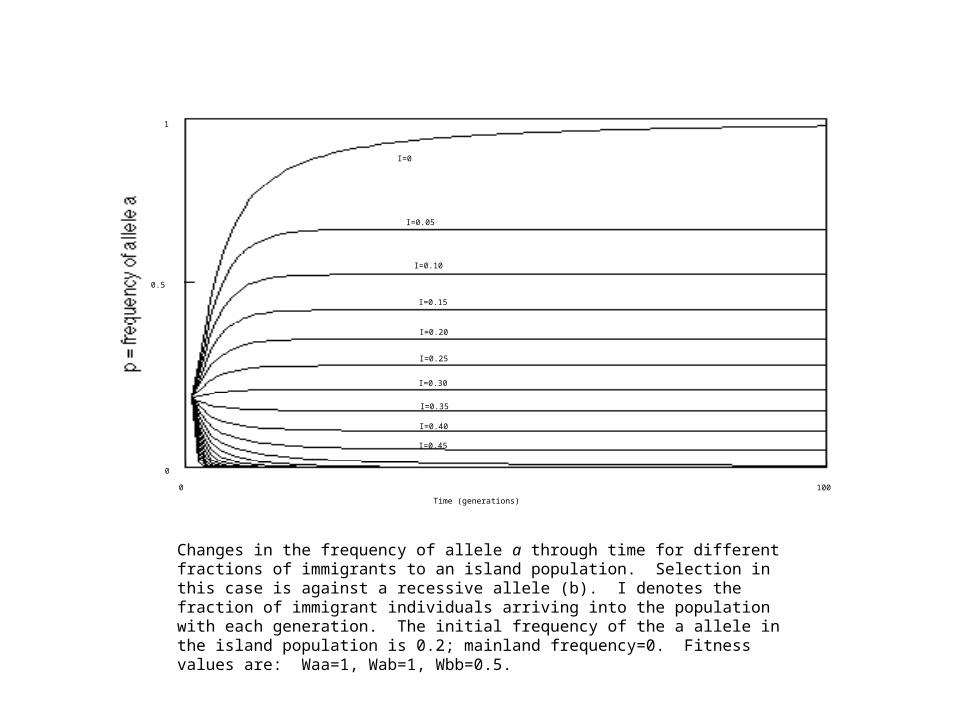
I=0
I=0.05
I=0.10
I=0.15
I=0.20
I=0.25
I=0.30
I=0.35
I=0.40
I=0.45
0
1
0.5
0 100
Time (generations)
Changes in the frequency of allele a through time for different fractions of immigrants to an island population. Selection in this case is against a recessive allele (b). I denotes the fraction of immigrant individuals arriving into the population with each generation. The initial frequency of the a allele in the island population is 0.2; mainland frequency=0. Fitness values are: Waa=1, Wab=1, Wbb=0.5.
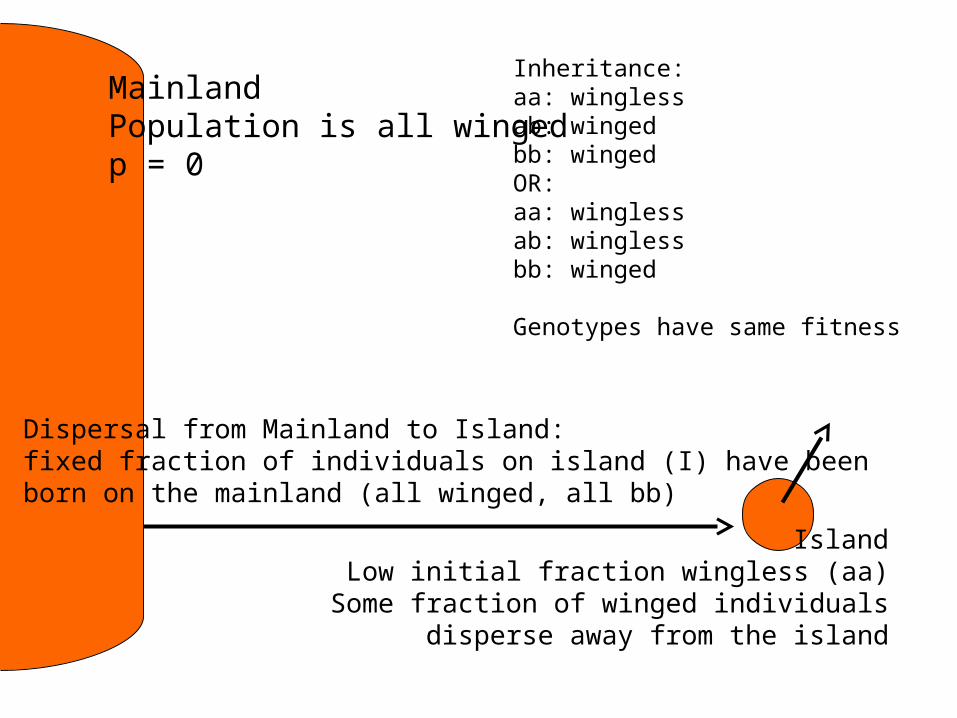
MainlandPopulation is all wingedp = 0
IslandLow initial fraction wingless (aa)
Some fraction of winged individuals disperse away from the island
Inheritance:aa: winglessab: wingedbb: wingedOR:aa: winglessab: winglessbb: winged
Genotypes have same fitness
Dispersal from Mainland to Island:fixed fraction of individuals on island (I) have been born on the mainland (all winged, all bb)
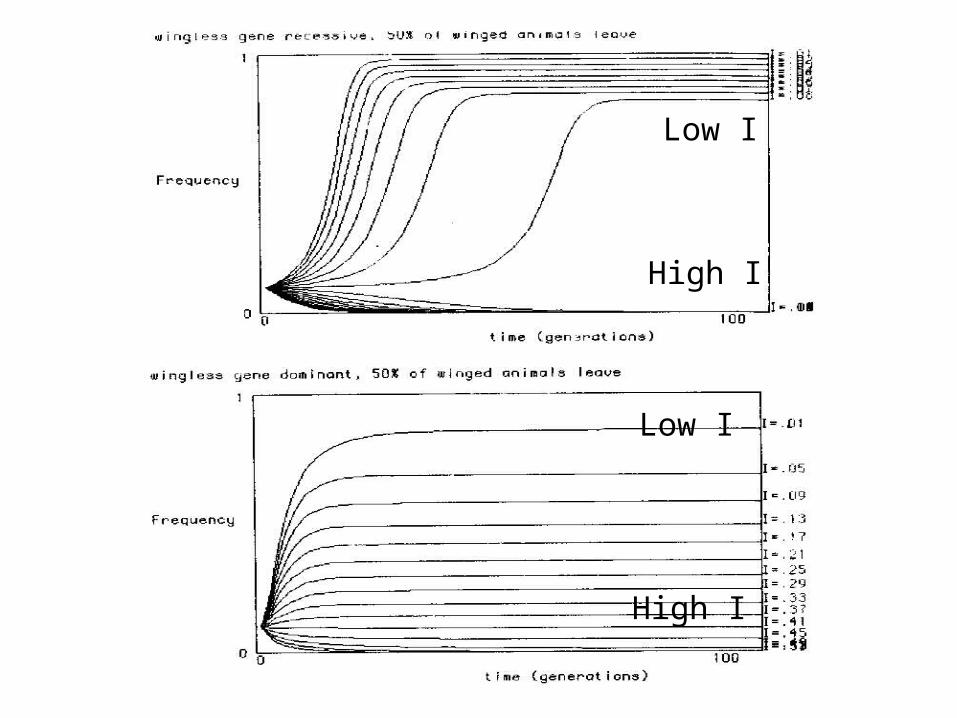
Low I
High I
Low I
High I

Genetic Drift
N=10
N=20
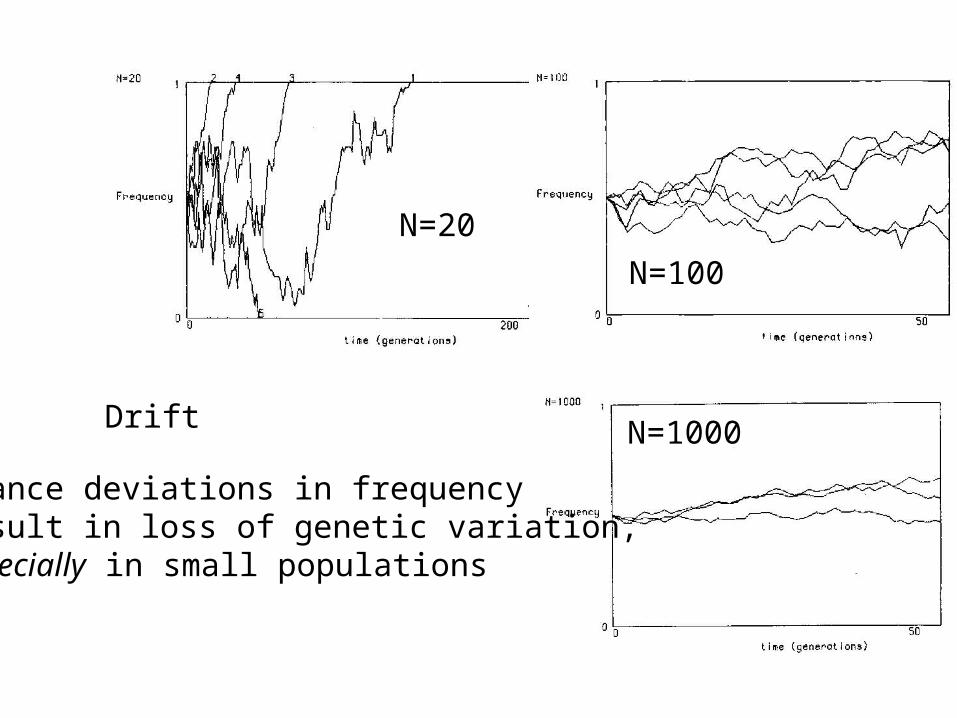
Drift
N=20
N=100
N=1000
Chance deviations in frequencyresult in loss of genetic variation,especially in small populations
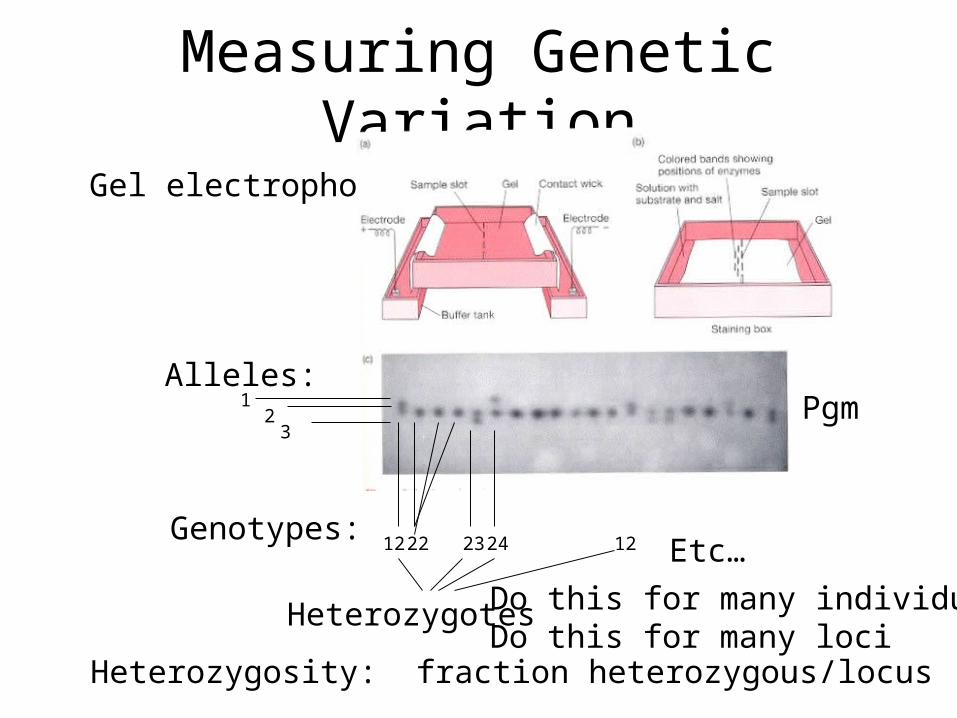
Measuring Genetic Variation
Gel electrophoresis
Alleles:1
23
Genotypes:12 22 23
Heterozygotes
24 12 Etc…
Do this for many individualsDo this for many loci
Pgm
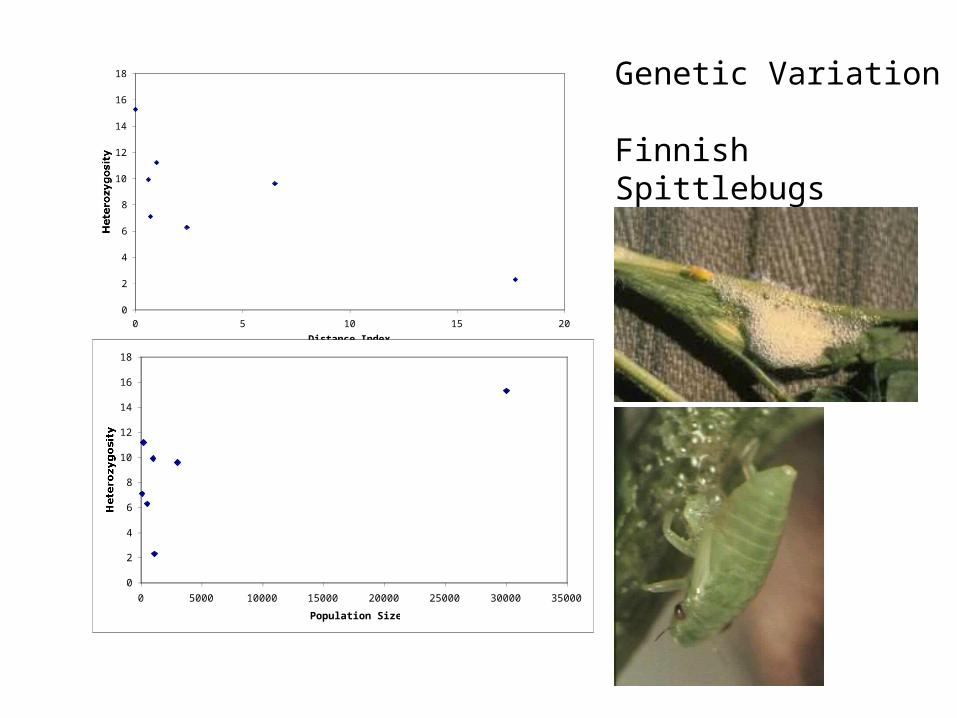
Heterozygosity: fraction heterozygous/locus
0
2
4
6
8
10
12
14
16
18
0 5 10 15 20
Distance Index
Heterozygosity
0
2
4
6
8
10
12
14
16
18
0 5000 10000 15000 20000 25000 30000 35000
Population Size
Heterozygosity
Genetic Variation
FinnishSpittlebugs
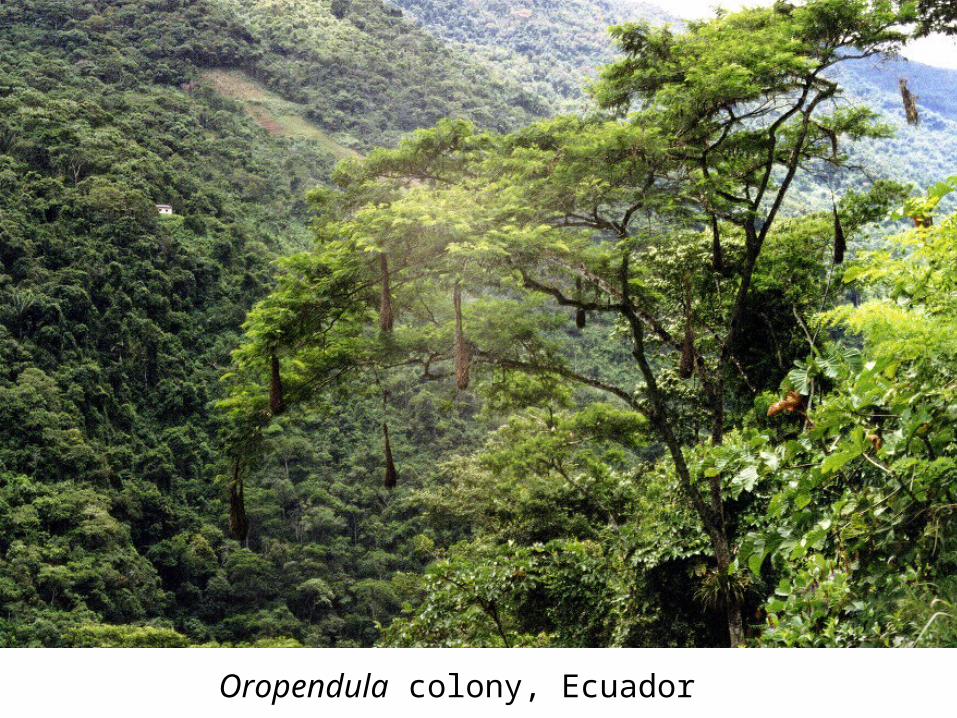
Oropendula colony, Ecuador
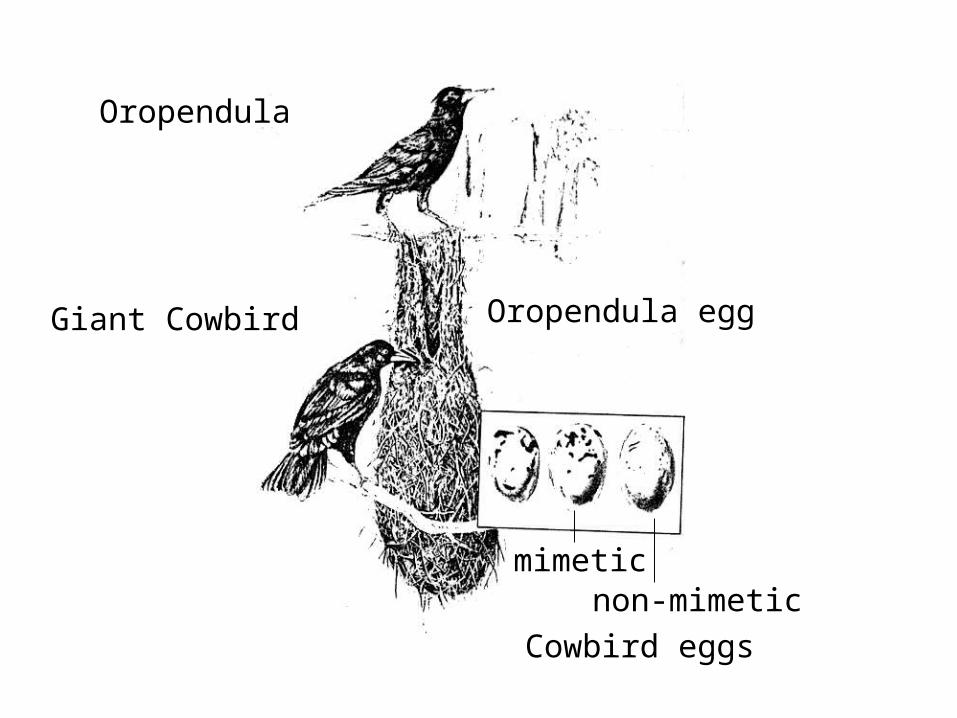
Giant Cowbird
Oropendula
Oropendula egg
Cowbird eggs
mimeticnon-mimetic
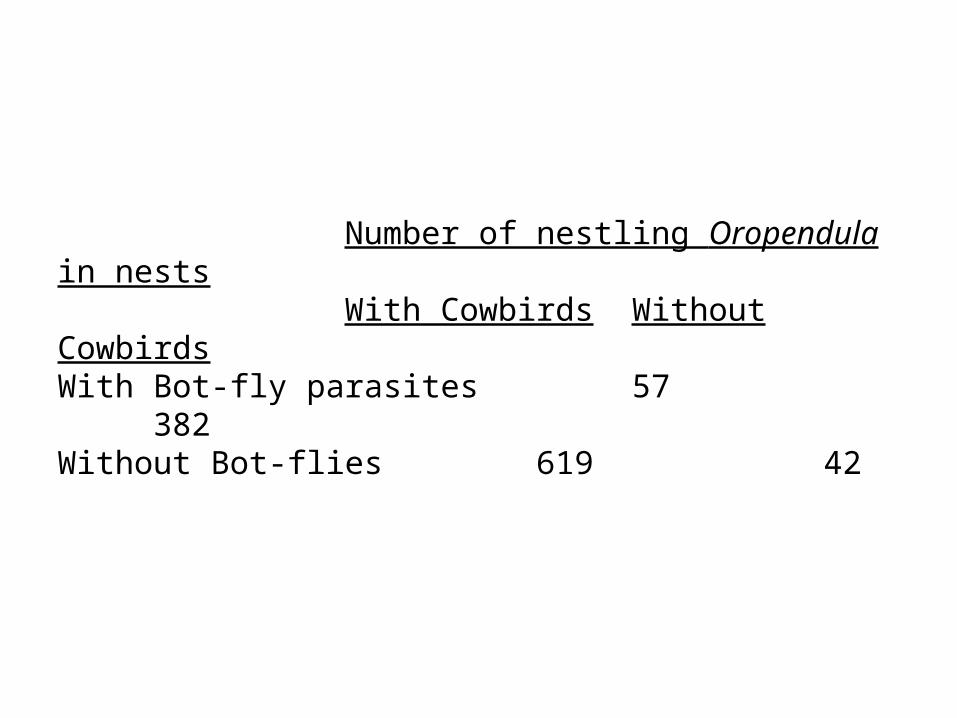
Number of nestling Oropendula in nestsWith Cowbirds Without Cowbirds
With Bot-fly parasites 57 382Without Bot-flies 619 42
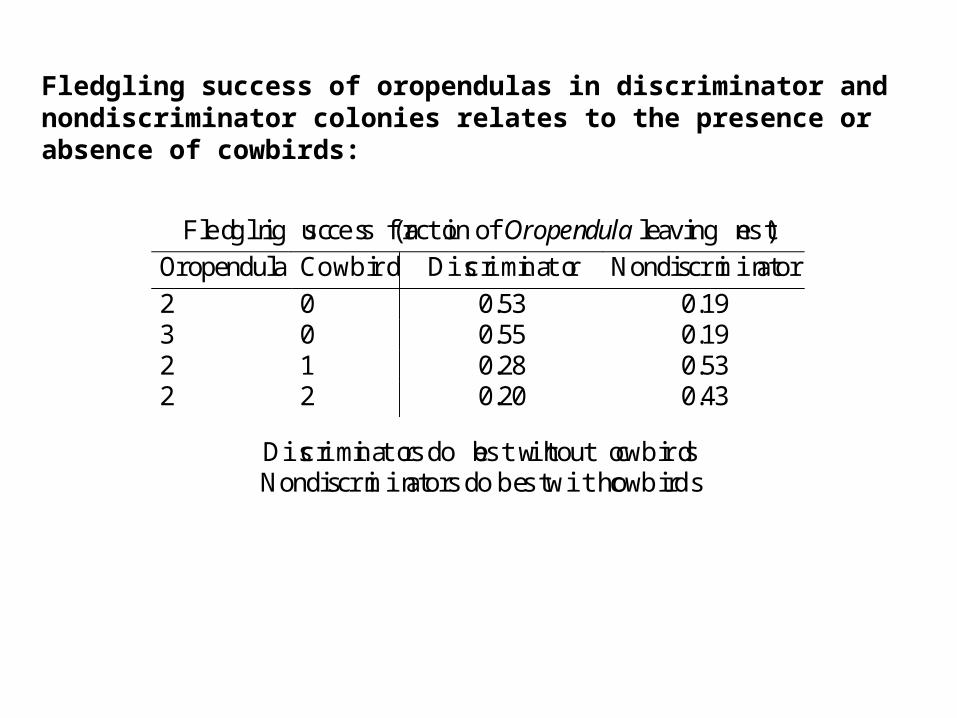
Fledgling success of oropendulas in discriminator and nondiscriminator colonies relates to the presence or absence of cowbirds:
Fledgling success (fraction of Oropendula leaving nest)
Oropendula Cowbird Discriminator Nondiscriminator
2 0 0.53 0.193 0 0.55 0.192 1 0.28 0.532 2 0.20 0.43
Discriminators do best without cowbirdsNondiscriminators do best with cowbirds
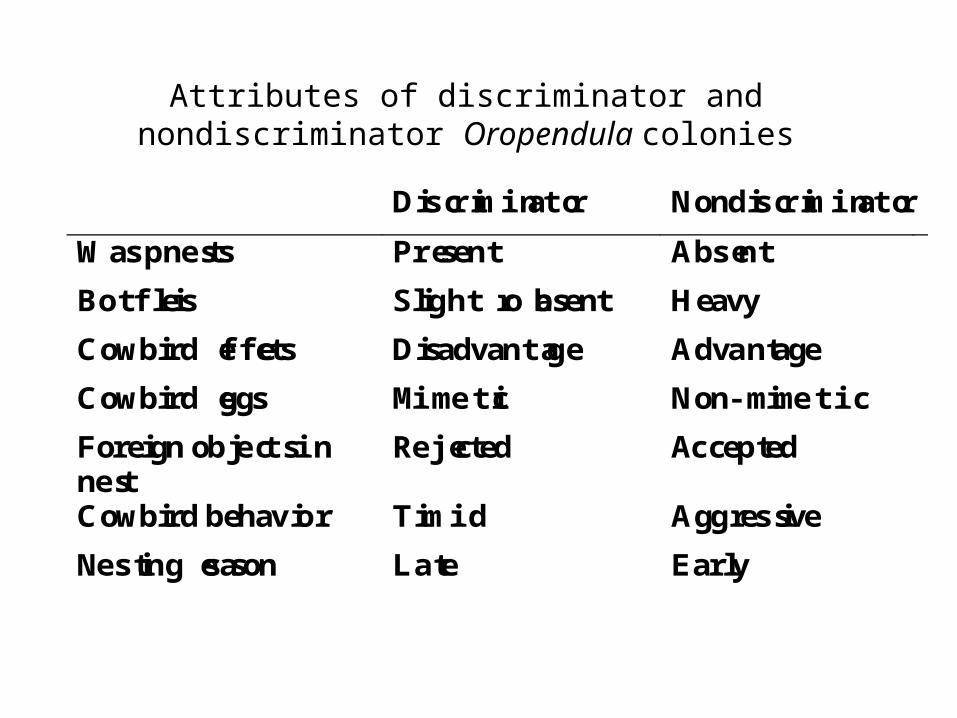
Attributes of discriminator and nondiscriminator Oropendula colonies
Discriminator Nondiscriminator
Wasp nests Present Absent
Bot flies Slight or absent Heavy
Cowbird effects Disadvantage Advantage
Cowbird eggs Mimetic Non-mimetic
Foreign objects innest
Rejected Accepted
Cowbird behavior Timid Aggressive
Nesting season Late Early
Nonevolutionary Responses to Environmental Change
Organisms can change to perform better in different conditions, without
a change in population genetic makeup
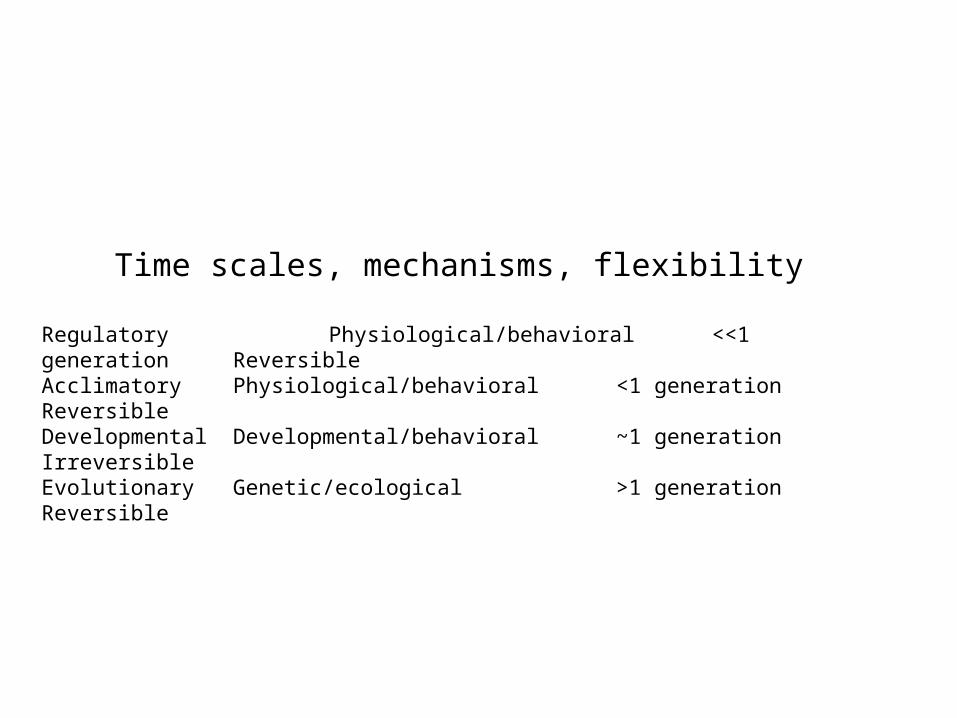
Time scales, mechanisms, flexibility
Regulatory Physiological/behavioral <<1 generation ReversibleAcclimatory Physiological/behavioral <1 generation ReversibleDevelopmental Developmental/behavioral ~1 generation IrreversibleEvolutionary Genetic/ecological >1 generation Reversible
Regulatory Responses
No morphological change required, involves physiology or behavior
Modified activity to maintain favorable body conditions
Examples:
Sweating, panting, shivering, altered kidney filtration, altered heart rate, drinking, basking
Objective: homeostasis-- buffer the internal environment of an individual, or to modify the immediate external environment.
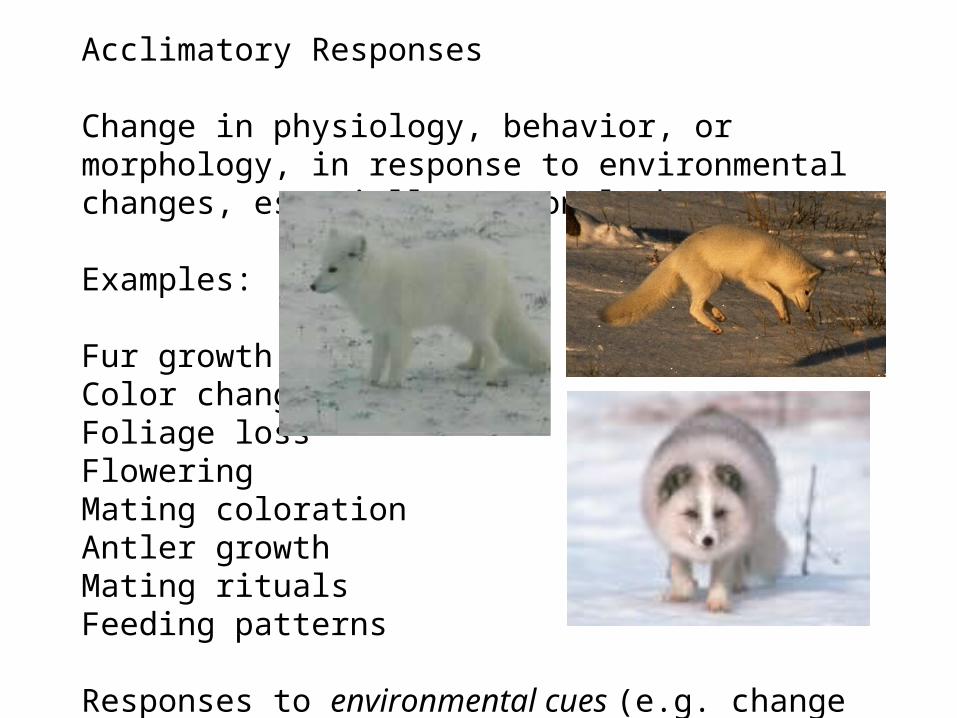
Acclimatory Responses
Change in physiology, behavior, or morphology, in response to environmental changes, especially seasonal changes
Examples:
Fur growthColor changeFoliage lossFloweringMating colorationAntler growthMating ritualsFeeding patterns
Responses to environmental cues (e.g. change in day length)
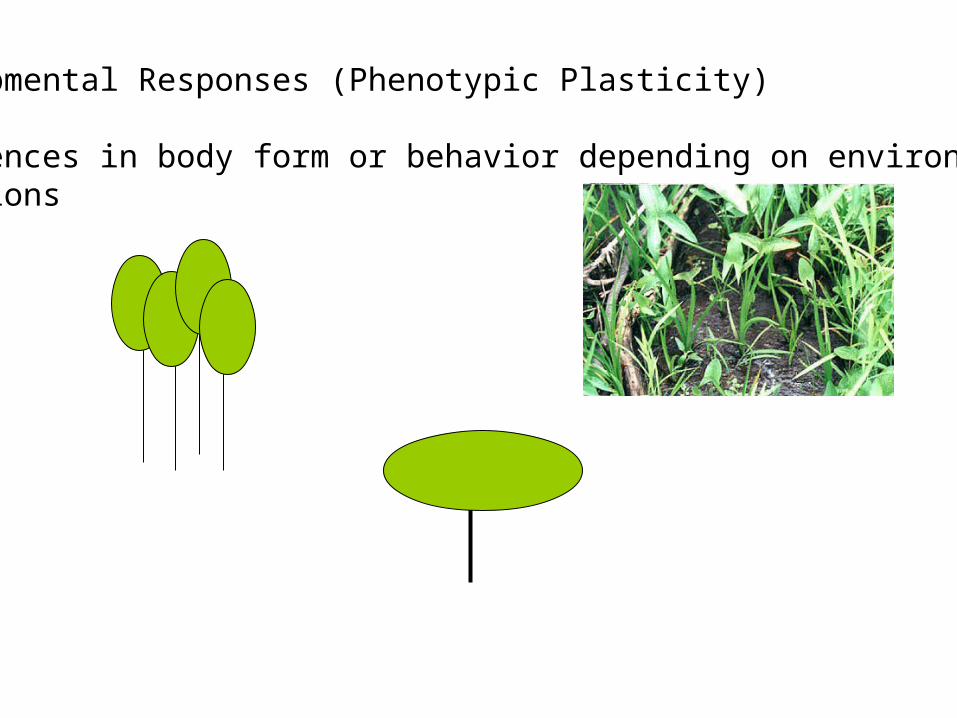
Developmental Responses (Phenotypic Plasticity)
Differences in body form or behavior depending on environmentalconditions
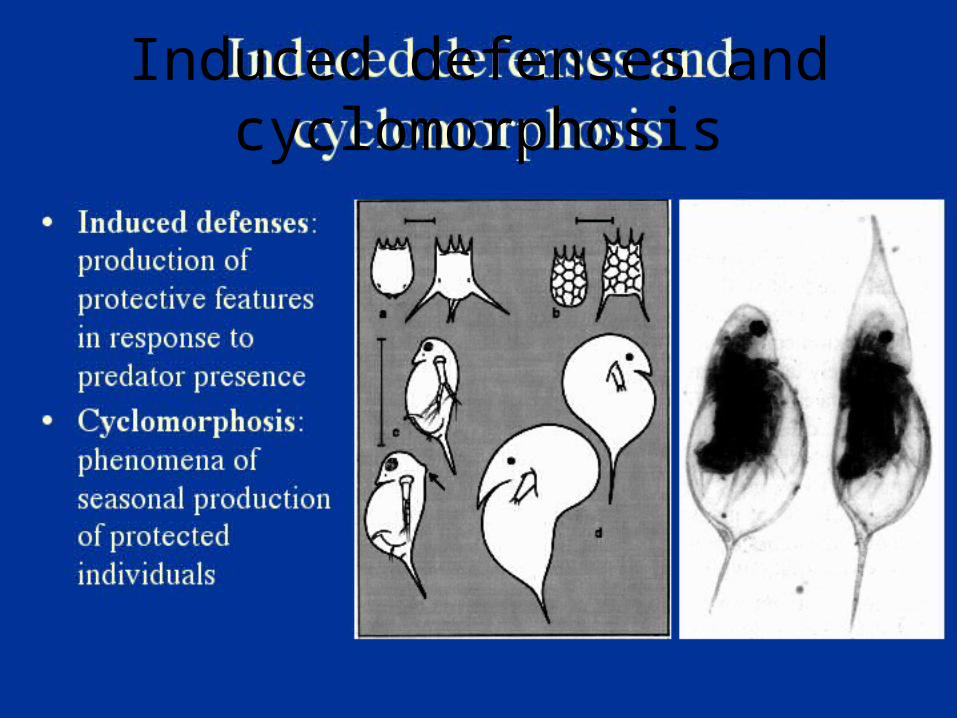
Induced defenses and cyclomorphosis
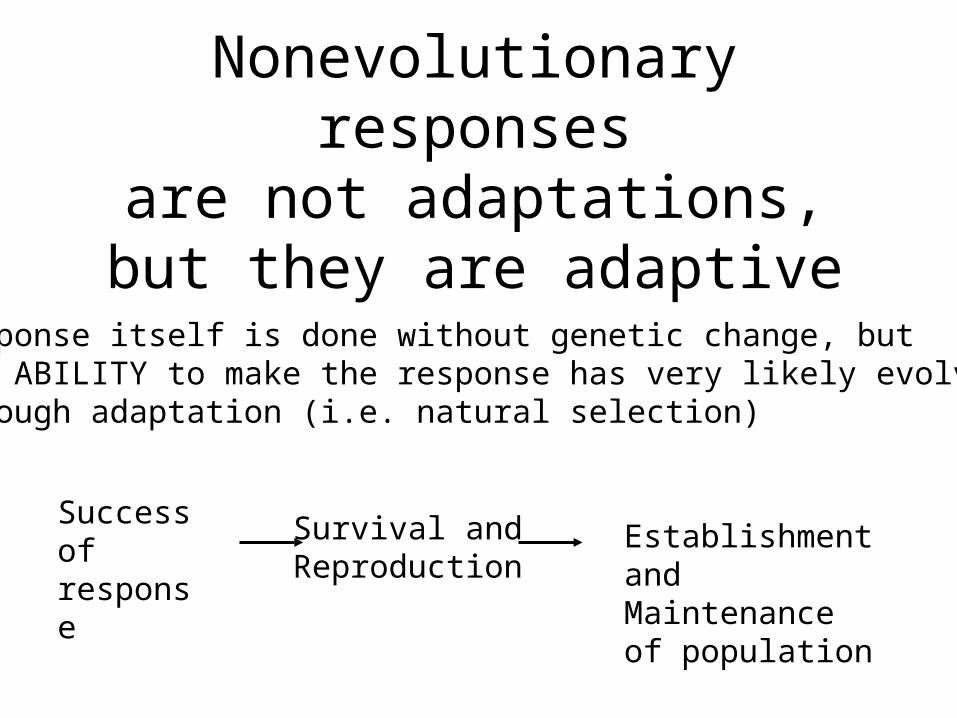
Nonevolutionary responsesare not adaptations, but they are
adaptive
Response itself is done without genetic change, butthe ABILITY to make the response has very likely evolvedthrough adaptation (i.e. natural selection)
Success of response
Survival andReproduction
Establishment andMaintenance of population
DistributionsSummarize the locations where a species has been successful
Do not tell us about locations where they could be successful
Do not tell us about places where a species has failed
Understanding distributions relies on knowing what factors prevent species from occupying a particular location or region
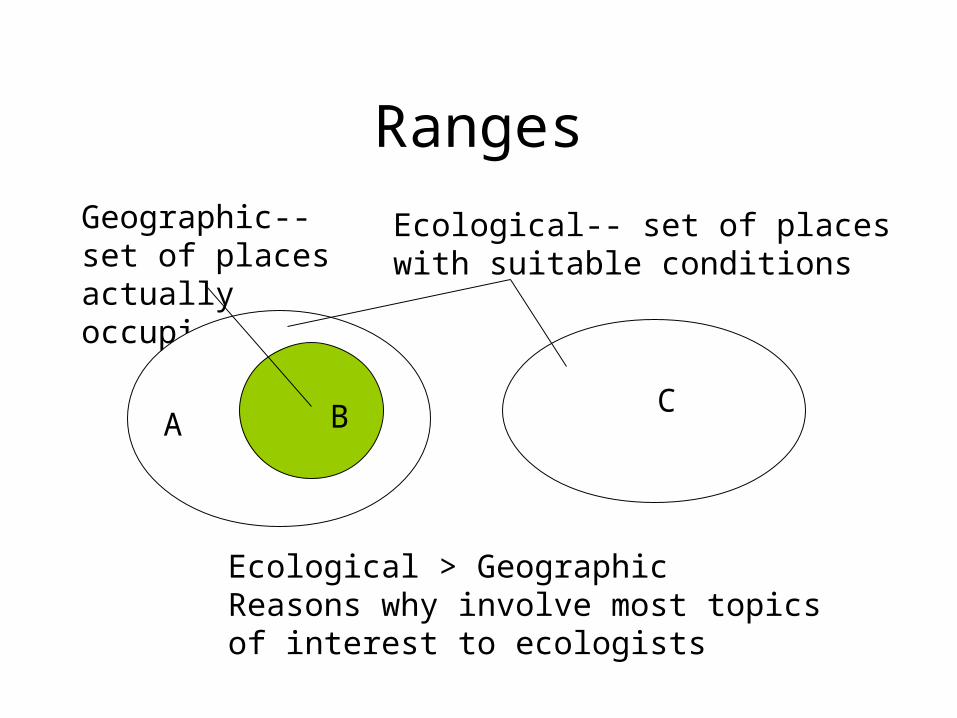
Ranges
Geographic-- set of places actually occupied
Ecological-- set of placeswith suitable conditions
Ecological > GeographicReasons why involve most topicsof interest to ecologists
A B C
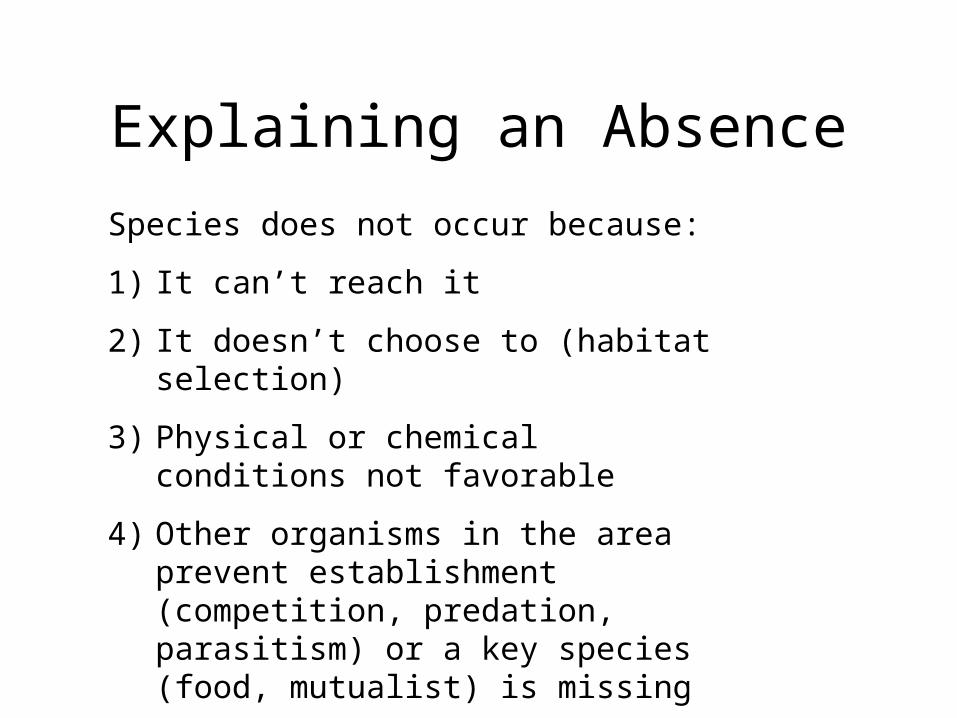
Explaining an Absence
Species does not occur because:
1) It can’t reach it
2) It doesn’t choose to (habitat selection)
3) Physical or chemical conditions not favorable
4) Other organisms in the area prevent establishment (competition, predation, parasitism) or a key species (food, mutualist) is missing
5) Chance
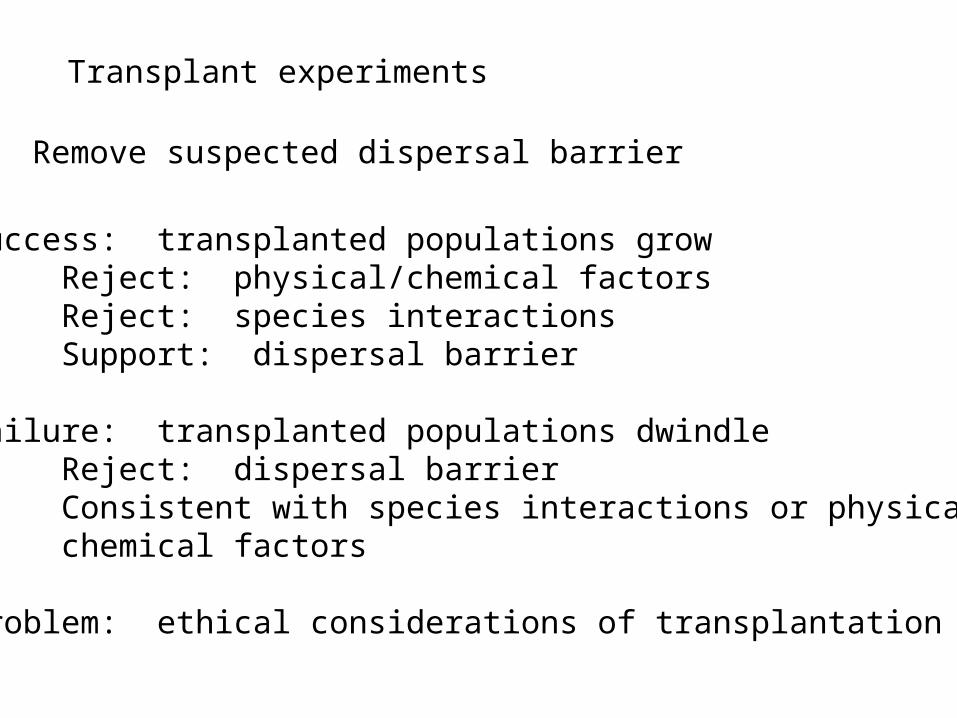
Transplant experiments
Remove suspected dispersal barrier
Success: transplanted populations growReject: physical/chemical factorsReject: species interactionsSupport: dispersal barrier
Failure: transplanted populations dwindleReject: dispersal barrierConsistent with species interactions or physical/chemical factors
Problem: ethical considerations of transplantation
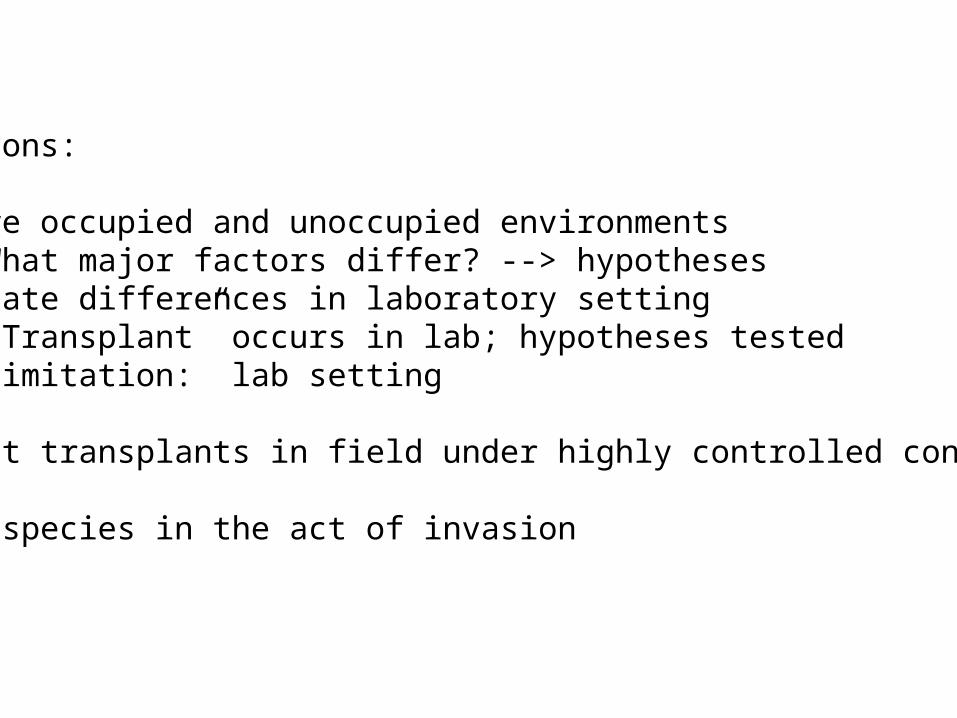
Solutions:
Compare occupied and unoccupied environmentsWhat major factors differ? --> hypotheses
Duplicate differences in laboratory setting“Transplant” occurs in lab; hypotheses testedlimitation: lab setting
Conduct transplants in field under highly controlled conditions
Catch species in the act of invasion
Lessons from Invasions and Introductions
Starling
Gypsy moth
A albopictus
Rabbits to Australia
Failed introductions:Fish stockingSeeds in wool
Norway mapleHessian FlyDutch Elm Disease
Chestnut Blight