ecology and production - cifri.res.incifri.res.in/bulletins/bulletin no.97.pdf · last 480 km the...
TRANSCRIPT


R.I'
. ,
Ecology and ProductionDynamics of River Brahmaputra
with Special Emphasis on its Tributaries
Bull. No. 97 May 2000Central Inland Capture Fisheries Research Institute
(Indian Council of Agricultural Research)Barrackpore-743 101 West Bengal

Ecology and Production Dynamics. of River Brahmaputra withSpecial Emphasis on its Tributaries
ISSN 0970-616 X
©2000
Composed at The Project Monitoring &Documentation Section
. CIFRI, Barrackpore
Material contained in this Bulletin may not be reproduced, in any form,without the permission of the publisher
AssistanceCover design
Sefali BiswasP. Dasgupta
Published by The Director, CIFRI, BarrackporePrinted at MIS. Toparts Private Ltd.
8/2, Dr. Biresh Guha StreetCa1cutta-7000 17

FOREWORD
River Brahmaputra the might river of the North East, with its 42 tributaries andthree forerunners Siang, Dibang and Lohit, have diverse ecological features withtremendous fishery potential. Informations regarding the ecological status and fishery ofthese systems were lacking and practically nothing was known about its tributaries. To fillthis gap of knowlege the Institute took up an exploratory survey of the entire stretch ofriver Brahmaputra including all its major tributaries to have an indepth knowledge of theirecology and fishery potential as well as, the impact of these tributaries on environmentand fishery of main river Brahmaputra. I am sure that the pioneering informationscollected and documented here will give an opportunity to have an indepth knowledgeabout the entire system hitherto unknown.
I'"
M. SinhaDirector

Dr. V. Pathak, Sr. ScientistDr. M. Chaudhury, Sr. Scientist
Dr. A.K. lal, Sr. ScientistShri H. Hhattacharjee, Scientist
Shri Alok Sarkar, T-5_ Shri L.R. Mahavar, T-5
, '

IntroductionThe river systemStudy areaGeneral climatic conditions of the regionAbiotic variablesBiotic variablesTributariesEnergy transformation through primaryproduction and production potentialFish productionFisheries of important tributaries of River BrahmaputraNorth bank tributariesSouth bank tributariesBrahmaputra "Past & Present"Anthropogenic impact on environment and fisheriesConclusionReferencesExecutive summary
11355
1920
Contents
28323738394146474748

Introduction
The mighty Brahmaputra "a fresh water moving ocean of North East" rises fromthe snout of Chemayungdung mountains near Tachhong (Tomchok) Khambab chhorten,about 100 km South East of Lake Mansarovar at an altitude of 5150 m (latitude 30 ° 31 'Nand longitude 82°10'E). It runs about 1250 km in a shallow valley through Tibet as riverTsangpo, almost parallel to 'the main Himalayan range, before taking a sharp turn Southwards to enter India near Tuting in Siang district of Arunachal Pradesh. Running about160 km in Arunachal Pradesh as river Dihang or Siang, it enters Assam on the North westof Saidiya where it meets two equally important trans-Himalayan tributaries Sikong orDibang and Lohit. After joining with these tributaries the river assumes the nameBrahmaputra. Fortified by many tributaries the river flows through the heart of the State(Assam) for about 740 km before entering Bangaladesh as river Jamuna. Flowing for itslast 480 km the river joins Ganga at Goalando. Besides providing navigation facilitiesriver Brahmaputra plays vital role in sustaining vegetated life, flora and fauna of thevalley and its surroundings.
The informations regarding the ecology of River Brahmaputra are very limited.Studies made so far are localised to few stretches only and practically nothing is knownabout the system as a whole, including its important tributaries. (Anon 1974-79, Anon1986-87 to 1995-96, Yadav and Sugunan 1992, Pathak and Sarkar 1997). Thus, anurgent need was felt to have a detailed knowledge of the ecology and productiondynamics of the entire system and its tributaries in order to understand many unknownfacts. The ecology and fishereis potential of the entire Brahmaputra system including itsthree fore runners Siang, Dibang and Lohit as well as all its important tributaries on boththe banks were studied during the present investigation during the period 1996-98.
The river system
The Brahmaputra valley sandwitched between Eastern Himalayan and Shillongplateau covers an area of 56,339 krn'. The total length ofthe river is 2900 km of whichabout 900 km falls in India. An along its course in Assam the river is joined by manytributaries on both the banks. The major tributaries are Depi, Dekari, Simen, Gainadi,Jiadahal, Subansiri, Ranganoi, Dikrong, Buroi, Burgang, Jiabharali, Belsiri, Pasnoi,Jiadhansiri, Puthimari, Pagladia, Beki, Manas, Aie, Champamati, Gaurang, Tipkai,Gadadhar and Sankosh on the North bank and Noadihing, Dibru, Burhidihing, Disang,Diknow, Dhansiri, Kopili, Kalong, Kulsi, Singra, Dudhnoi and Krishnoi on South bank.The combined length of the river along with its 47 major tributaries is about 4000 kmwith a catchment area of 5,80,000 km2 and average water discharge of 5,10,450 mrn'.
I!

The annual water discharge from the three components Siang, Dibang and Lohitare 1,85, 102 mrrr', 37,818 mrn', and 46,946 mnr', respectively. Theannual discharge insome important tributaries are 52,705 mm3 in Subansiri, 28,844 mm'' in Jiabharali,11,906 mm3 in Burhidihinz. 9023 mm3 in Kopili-Kalong and 6785 mnr' in Dhansiri.
••
The catchment area of this river system in India is 1,95,000 Ian2of which 81,424 Ian2isin Arunachal Pradesh, 70,634 Ian2 in Assam, 10,803 mk2 in Nagaland; 11,667 Ian2 inMeghalaya, 7,300 mk2 in Sikkim and 12,585 Ian2 in West Bengal. The length uptoconfluence and catchment area of some important tributaries are given in Table L
Brahmaputra and its tributaries maintain most unstable courses in the plains withchanging channels. These tributaries contribute substantially to the silt content inthemain drainage. Characteristically the Northern tributaries aremostly hilly with verysteep slope, shallow braided channels carrying high silt discharge where as Southerntributaries are deeper with meandering channels, low gradient and have comparatively
. less silt lead. It has been estimated that the Northern tributaries have the average siltyield in the order of 666.7 m3 km-2 and .the silt discharge from southern part rangesbetween 66.7 and 95.7 m3 Ian-2. During the period of 50 years from 1937-87 the riverbed of Brahmaputra has risen 4.5 m due to accumulation of silt. Maximum silt lead in theriver has been observed during July and August months. The maximum suspended siltload at pandu (near Guwahati) is 36.600 halm and minimum 1487 halm with a generalcomposition of 5.27% coarse, 26.05% medium and 68.68% fine.
•The valley gently slopes from North-East to south west from Saidiya (134 m
above mean sea level) to Guwahati (50 m above mean sea level) and then slope becomeseast to west direction upto Dhubri (36 m above mean sea level). The gradient of the riverbed is steep in Arunachal Pradesh and it decreases' as the river flows downwards inAssam. Between different stretches the gradient is :
Kobo and Dibrugarh 1 in 3700 (i.e., 0.27 m km")Dibrugarh and Jorhat 1 in 5595 (i.e., 0.178 m km")Jorhat and Tezpur 1 in 6425 (i.e., 0.155 m km")Tezpur and Guwahati 1 in 6750 (i.e., 0.148 m km")Guwahati and Goalpara 1 in 8875 (i.e., 0.113m km")Goalpara and Dhubri 1 in 14,650 (i,e., 0.068 m km")
2

Interspreading of' numerous abandoned riverine' water areas and their annualinundations are the salient topographical features of Brahmaputra valley. Frequentinundtions and changes in the river courses have resulted in the formation of largenumber of floodplain lakes, locally known as beels. There are about 1392 numbers ofbeels in the State covering 0.1 million hactares 'of water: spread area. These floodplain ,lakes form an integral component of the main river system and over the years have actedas a 'sink' for P,:>odand form ideal breeding ground for the riverine fishes.
Large amount of fine silt brought during flood gives the valley its fertility. Theriver becomes sluggish in the lower reaches due to low gradient and many islands areformed owing to the deposition of enormous silt load carried' and discharged by thetributaries into the main drainage. The approximate average' width of the river in Assamis 5.46 km (5.06 kmbetween Jorhat to Tezpur, 6.1 km between Teszpur to Guwahati,3.78 Ion between Guwahati to Manas and 7.1 Ion between Manas to Dhubri), Depth inthe upper reaches of the liver (Dibrug •.u:h) varies between 3.6 m to 5.0 m during dryseason and is doubled during monsoon months. Near Guwahati where the river channelis hugged by hills on either sides the depth during dry season 'is about 18 m whichincreases to 27.4 m during high floods.
Study area
"Ecological status, production potential and fisheries resources of three fore
runners Siang, Dibang and Lohit of River Brahmaputtra, 8 different strtches betweenSaidiya to Dhubri, 25 tributaries on the North bank and 16 on the South bank were takenfor study in order to get clear picture of the entire system and the impact of tributaries onthe hydrodynamics of the main river. The abiotic and biotic variables, their role in theproduction process, fisheries structure and yield and changes over the years were alsocritically evaluated in the entire river system covering both the states of ArunachalPradesh and Assam. River Brahmaputra and its various tributaries are shown in Figure 1.
Studies were made on seasonal basis (summer, monsoon and winter) during theperiod 1996-98. Sampling centres were Yembung, Pansighat and Oiramghat in Siangriver, Roing in Dibang; Parsuram kund and Alubarighat in Lohit river all in ArunachalPradesh and Saidiya, Dibrugarh, Jorhat, Biswanath ghat, Tezpur, Guwahati, Goal- Paraand Dhubri in main Brahmaputra in Assam and one each in different tributaries both inArunachal and Assam. List of tributaries both on the North and south bank are given inFig. 1.
3

N
•
North Bank South Bank• SAMPLING CENTRES
1. Depi2. Dekari
) 3. Simen/ 4. Gainadi
( 5 Jiadahal\ 6. SubonsiriJ 7. Ranganoi
/ 8. Dikrong/ 9. Buroi
I 10. Burgang/ 11. JiabharaliI 12. Gabharu
r- - __J 13. BelsiriI 14. Pasnoi
" '"', /' 15. Jiadhfnsiri\ 16. Puthimari
I \ 17. PagladiaI ,...) 18. Bhalukdobato I 19. Beki\ \ 20. Manas\ . ~ 21. Aie
,') 22. Champamati\ . / 23. GaurangJ' J 24. Tipkai
25. Gadadhar
26. Krishnoi27. Dudhnoi
·28. Singra2Q. Kulsi30. Bharalu31. Kalong32. Kopili33. Dhansiri34. Dikhow35. Disang36. Burhidihing37. Dibru38. Noadihing39. Kondil40. Tenga41. Digharu
FIG. 1. BRAHMAPUTRA RIVER SYSTEM
I;

River Brahmaputra at Saikhowaghat
River Brahmaputra at Tezpur

A view of river Diang
River Diang shoreline

River Lohit at Alubarighat
. "".
River Lohit near Digharu confluence

River Siang on way to Yembung
A view of river Siang
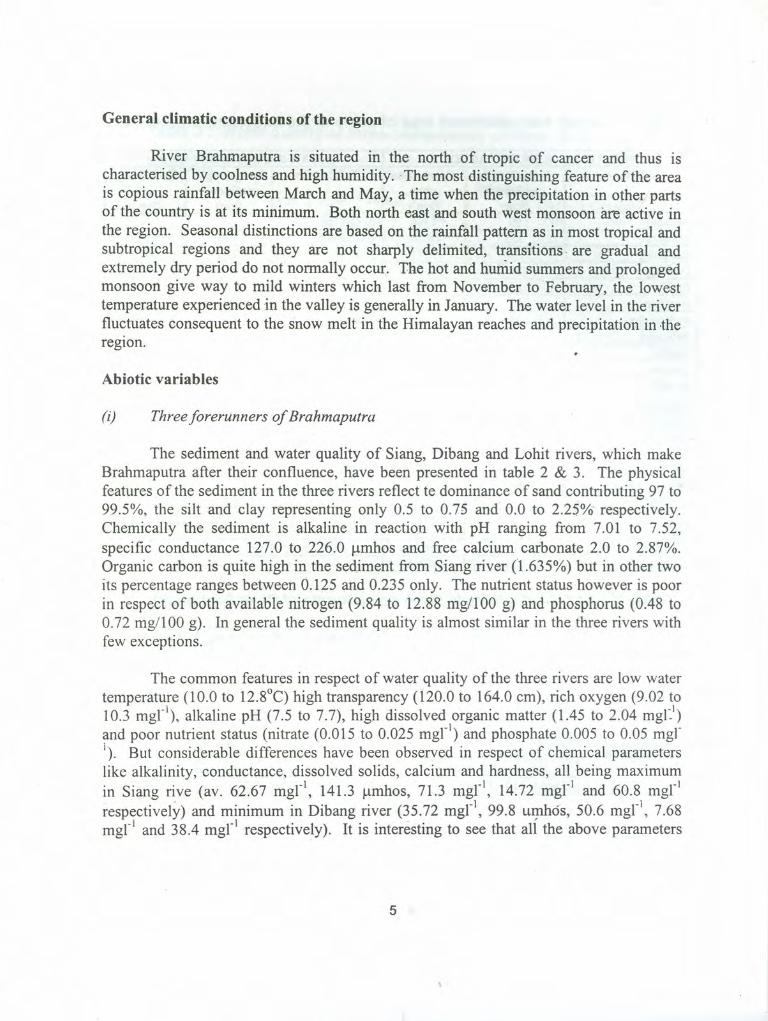
General climatic conditions of the region
,.River Brahmaputra is situated in the north of tropic of cancer and thus is
characterised by coolness and high humidity. -The most distinguishing feature of the areais copious rainfall between March and May, a time when the precipitation in other: partsof the country is at its minimum. Both north east and south west monsoon are active inthe region. Seasonal distinctions are based on the rainfall pattern as in most tropical andsubtropical regions and they are not sharply delimited, transitions - are gradual andextremely dry period do not normally occur. The hot and humid summers and prolongedmonsoon give way to mild winters which last from November to February, the lowesttemperature experienced in the valley is generally in January. The water level in the riverfluctuates consequent to the snow melt in the Himalayan reaches and precipitation in theregion.
Abiotic variables
(i) Three forerunners of Brahmaputra
The sediment and water quality of Siang, Dibang and Lohit rivers, which makeBrahmaputra after their confluence, have been presented in table 2 & 3. The physicalfeatures of the sediment in the three rivers reflect te dominance of sand contributing 97 to99.5%, the silt and clay representing only 0.5 to 0.75 and 0.0 to 2.25% respectively.Chemically the sediment is alkaline in reaction with pH ranging from 7.01 to 7.52,specific conductance 127.0 to 226.0 umbos and free calcium carbonate 2.0 to 2.87%.Organic carbon is quite high in the sediment from Siang river (l.635%) but in other twoits percentage ranges between 0.125 and 0.235 only. The nutrient status however is poorin respect of both available nitrogen (9.84 to 12.88 mg/100 g) and phosphorus (0.48 to0.72 mg/1 00 g). In general the sediment quality is almost similar in the three rivers withfew exceptions.
G
The common features in respect of water quality of the three rivers are low watertemperature (10.0 to 12.8°C) high transparency (120.0 to 164.0 em), rich oxygen (9.02 to10.3 mgl"), alkaline pH (7.5 to 7.7), high dissolved organic matter (1.45 to 2.04 mgl.')and poor nutrient status (nitrate (0.015 to 0.025 mgl") and phosphate 0.005 to 0.05 mgl'), But considerable differences have been observed in respect of chemical parameterslike alkalinity, conductance, dissolved solids, calcium and hardness, all being maximumin Siang rive (av. 62.67 mgl", 14l.3 umhos, 7l.3 mgl", 14.72 mgl" and 60.8 mgl'respectively) and minimum in Dibang river (35.72 mgl", 99.8 umbos, 50.6 mgl', 7.68mgl' and 38.4 mgl" respectively). It is interesting to see that all the above parameters
5

-'
Table 1 : Length and catchment area of some of the important tributaries
NORTH BANK TRIBUTARIES SOUTH BANK TRIBUTARIES
i Tributaries Length upto Catchment Tributaries Length upto Catchmentconfluence . area confluence area
(km) (km') (km) (km')Jiadahal 99 1346 Noadihing - -Subansiri 375 28200 Burhidihing 360 8730Ranganoi 150 2941 Disanz 230 3950Dikrang 145 1528 Dikhow 236 4022Buroi 63 ' 791 Jangi 108 1349Burgang 42 550 Bhagdoi 160 920Brahmaaon 28 92 Kopili 261 20068Jiabharali - 14738 KalonaDipota - 296 Bharalu 40 469Gabharu - 296 Kulsi 220 3770Belsiri - 751 DeosilaJiadhansiri 76 956 Dudhanoi 103 1615Puthimari 112 1787 KrishnoiPagladia 197 1674 Jinari 60 594Aie 30 Jingra - 3467Manas 114 41350. Dhansiri 352 10305Beki 84Champamati - 1038Gaurang - 1023Tiokai 1744 .-Gadadhar - 610Sankosh 321 10345
Table 2: Sediment quality in three components of River Brahmaputra
Parameters River Slana River Dibane: River LohitPhysical features Sand (%) 97.0 99.5 98.0
Silt (%) 0.75 0.5 0.75Clay (%) 2.25 0.0 1.25pH 7.01 7.28 7.52Sp, Conductance (urnhos) - 148 127 226Free CaCOJ (%) 2.87 2.0 2.25
Chemical features Av. Phosphorus (mg/100 g) 0.72 0.48 0;58Av. Nitrogen (mg!l 00 g) 12.88 9.84 10.12Organic carbon (%)
-1.635 0.125 0.235--
6

Table 3: Water quality of three components of River Brahmaputra
Parameters River Siang . River River LohitDibang
Yem- Pansi Oiram Av. Parsu- Central Av.buny -ghat -ghat for ram Lohit
stretch kundWater temp. (oC) 10.0 11.0 11.0 10.7 12.5 11.5 12.8 12.15Transparency (cm) 125.0 140.0 120.0 128.0 164.0 162.4 130.0 146.2DO (rngl") 10.3 9.75 9.94 10.0 9.02 10.2 9.27 9.73pH . 7.6 7.5 7.6 7.57 7.6 7.6 7.7 7.65Free CO, (,mgr') 0.96 0.96 0.96 0.96 1.92 0.96 1.42 1.19Total alkalinity (rngl") 62.98 61.10 63.92 62.67 35.72 38.4 57.35 47.87Sp. Conductance 145.6 142.2 136.2 141.3 99.8 102.4 132.5 117.45(umhos)Total dissolved solids 73.6 71.6 68.8 71.3 50.6 50.8 66.85 58.82(mgr')Calcium CaH (mal") 15.36 13.44 15.36 14.72 7.68 7.68 18.24 12.96Magnesium Mg++(mgl") 7.30 7.03 3.51 5.95 4.68 4.68 5.22 4.95Total hardness (mgl") 61.2 62.4 52.8 60.8 38.4 38.4 62.2 50.3Chloride (rngl") 29.4 29.4 24.8 27.77 24.5 29.4 29.5 29.45Silicate (rngl") 3.4 4.0 3.2 3.5 3.6 5.0 5.0 5.0Iron Fe +++ (mzl') 0.14 0.08 0.08 0.10 0.12 0.62 0.265 0.442Dissolved organic matter 2.04 1.496 1.45 1.662 1.904 1.712 1.49 1.601(rnzl")Nitrate (mgl") 0.025 0.025 0.025 0.025 0.015 0.02 0.022 0.021Phosphate (rngl") 0.005 0.05 0.016 0.024 0.005 0.005 -'0.006 0.055
/
7

"
have been found to be almost similar in the entire stretch of Siang river betweenYembung and Oiramghat but in Lohit river their values are much lower at Parsuramkund(38.4 mgl", 102.4 urnhos, 50.8 mgl", 7.68 mgl" and 3~.4 mgl' respectively) and haveshown remarkabie increase at Central Lohit near Alubarighat (57.35 mgl', 132.5 umbos,66.85 mgl', 18.24 mgl", and 62.2 mgl' respectively). The increase in the values of abovechemical parameters may be attributed to the impact of highly alkaline waters of Digharuriver which join Lohit near Alubarighat. The impact has been experienced even uptoSaidiya.
(ii) Important tributaries of Brahmaputra
a) Sediment'qualitV:
The sediment quality of both north and south bank tributaries have been presentedin tables 4 & 5. Physical composition of sediments of tributaries on the north bank showscomplete dominance of sand (81.75 to 99.5%) with silt and clay representing only 0.0 to10.75% and 0.0 to 12.25% respectively. Higher precentage of silt has been observed inChampamati and Gaurang while clay has been comparatively higher in Manas andPagladiya.. Sediment is neutral to slightly alkaline in reaction in the downstretchtributaries from Pasnoi to Gadadhar (pH 7.06 to 7.43), the only exception beingChampamati (pH 6.66) while in the upper stretch tributaries it is acidic in reaction withpH ranging from 5.66 to 6.94, except Depi (pH 7.28) and Gainadi (pH 7.13). specificconductance has been found to be minimum in Burgang (47.5 umhos) and maximum inGainadi (295 umhos). The values of free calcium carbonate are low to medium in mostof the tributaries (0.88 to 3.12%) ecept Manas and to some extent Aie where the valueshave been comparatively much higher (7.5% and 6.25% respectively). This clearlyshown the impact of catchment quality and is a clear example that the tributaries must beflowing through rich calcium belt (Lime stone). Organic carbon is in general poor inalmost all the tributaries (0.091 to 0.628%). the nutrient status of the sediment in respectof both nitrogen and phosphorus is also poor in all the tributaries except slightly highervalues in Champamati and Gaurang (Table 4).
•
The sediment quality of south bank tributaries is also dominated by sand (78.5 to.98.5%) with silt and clay ranging from 0.5 to 16.5% and 1.0 to 18.5% respectively.Comparatively higher percentage of silt has been found in Bharalu and Kalong while clayis higher in Disang. Except Noadihing (pH 7.2) and Burhidihing (pH 7.0). the sedimentfrom all the tributaries is slightly acidic in reaction with pH ranging from 5.97 to 6.97.specific conductance and free calcium carbonate are in the range of 50 to 290 umhos and
8

(b) Water quality :
0.75 to 2.0% respectively. Organjic carbon (0.12 to 0.557%), available nitrogen (6.04 to22.84 mgllOO g) and phosphorus (0.28 to 1~97 mgllOO g) all are generally poor in thesediment.
The water quality parameters of both north and south bank tributaries have beenpresented in Table 6 & 7. The north bank tributaries have shown consideable variationsin respect of chemical parameters 'like alkalinity, conductance; dissolved salts, calcium,magnesium and hardness all being exceptionally high in Manas river 2.07.67 mgl', 345.5mmhos, 173.84 mgl', 25.7 mgl", 22.02mgr1 and 155.8 mgl' respectively) andextremely low in Ranganoi (23.5 mgl", 52.6 umhos, 26.6 mgl", 6.4 mgl', 3.0 mgl", and'32.1 mgl", respectively), the values of these parameters in all the other tributaries rangedbetween the two extremes. The south bank tributaries also have shown .considerablevariations in respect of the alkalinity. Conductance, dissolved salts and hardness allbeing maximum in Digharu (131.6 mgl", 299.0 umhos, 150 mgl", and 86.4 rngl",respectively) and minimum in Bharalu, head waters (22.0 mgl", 46.0 umhos, 23.2 mgl',and 25.8 mgl"). It is interesting to see that none of the two tributaries are similar inrespect of the above chemical parameters specially those in the north bank and thequalitative difference in the water clearly reflect the impact of their catchment. Thecommon features of the tributaries on both the banks are rich oxygen, high values ofdissolved organic matter, neutral to alkaline pH and low nutrient status (Table 6 & 7).Among the physical parameters water temperature is comparatively lower in some 0 fthetributaries like Subansiri (14.2°C) Ranganoi (14.1 °C), Dikrong (16.3 °C), and Jiabharali(16.5 °C) in the north bank and Digharu (14.0 °C), Tenga (15.0 °C), and Kondil (16.0 °C).on the south bank. Subansin and Jiabharali, (north bank tributaries) have shjown highdegree of light penetration while in many tributaries water is transparent upto bottomspecially those having low depth.
The diverse hydrological set up of various tributaries have great bearing on thewater quality of the main river specially those in the north bank.
(iti) River Brahmaputra
The sediment and water quality of river Brahmaputra between Saidiya and Dhubrihave been presented in Table 8· & 9. The physical composition of the sediment isdominated by sand (83.75 to 98.5%) with silt and clay ranging from 0.5 to 10.25% and1.0 to 6.5% respectively. Higher percentage of silt is found in Jorhat and Biswanathghatwhile clay is comparatively more in Biswanathghat. Sediment is slightly alkaline in
9
<:

reaction. with pH ranging between 7.33 to 7.67 throughout the stretch with specificconductance ranging from 95.0 umbos (Dhubri) to 249.5 umhos (Biswanathghat). Freecalcium carbonate is medium to low in the sediment from Saidiya to Dhubri, the valuesranging from 1.0 to 2.12%. organic carbon is slightly better in Guwahati (0.567%),Jorhat (0.453%) and Biswanathghat (0.339%) while in other places its value rangesbetween 0.105 to 0.259%. Both the available nutrients jritrogen (10.04 to 21.44 mg/100g) and phosphorus (0.53 to 1.90 mg/loo g) are of low order. The sediment quality of theriver between Jorhat and Biswanathghat is slightly different from other stretches,specially in respect of its physical composition.
In respect of water quality river Brahmaputra is found to be quite rich in oxygen(7.0 to 8.45 mgl"), alkaline in reaction with pH ranging from 7.5 to 7.9, rich in dissolvedorganic matter (1.39 to 1.84 mgl") and poor in nutrients (Nitrate 0.018"to 0.038 mgl" andphosphate 0.003 to 0.016 mgl") throughout the stretch. But considerable interstretchvariations have been observed in respect of chemical parameters like alkalinity,conductance, dissolved solids, and hardness, all being maximum at Goalpara ( 76.23mgl", 174.6 umhos, 88.06 mgl" and minimum in Tezpur below the bridge (56.9 mgl"134.0 mmhos, 67.3 mgl' and 64.8 mgl"). Comparatively higher values of the abovechemical parameters at Saidiya, the confluence point of the three rivers, is due to theimpact of Digharu and Kondil rivers which join Lohit before confluence and the waterquality of Saidiya (Saikhowaghat) being more influenced by Lohit than the other tworivers Siang and Dibang while at Dibrugarh the considerable drop in their values ismainly due to the combined impact of both Dibang and Siang rivers. Among the physicalparameters water temperature ranged between 17.8 to 21.2°C throughout the stretch beingslightly higher at Dhubri while transparency of water is maximum at Saidiya (87.2 em)and varied between 35.4 to 43.5 cm between Dibrugarh and Dhubri. Comparativelylower values of transparency below Saidiya down upto Dhubri is mainly due to high siltload brought by the tributaries, joining between these stretches.
(iv) Impact of tributaries an the water quality of the main river
Considerable interstretch variations in the water quality of river Brahmaputraclearly reflect the impact of various tributaries joining between these stretches. Theimpact of some of the major tributaries on the water quality of the main river have beenshown in table 10. The clear examples are the impact of Jiabharali at Tezpur, Manas at.Goalpara (Jogighopa) and Gaurang, Tipkai and Gadadhar at Dhubri. As shown in tablethe low alkaline waters of Jiabharali have resulted in sharp decline in the values ofalkalinity, conductance, dissolved solids, calcium and hardness of river Brahmaputra atTezpur (near the bridge) and the impact can be seen even upto forest ghat. In fact the
10

Table 4: Sediment quality of North Bank Tributaries
Physical Features Chemical FeaturesTributaries Sand Silt Clay pH Sp.con- Free Organic Av. Phos- Av.
(%) (%) %) ductance CaCO] Carbon' phorus nitrogen(umhos) (%) (mgl/OO g) (mgl/OO g)
Depi 98.5 0.5 1.0 7.28 111.0 1.25 0.091 0.82 16.12Dekari 99.5 0.5 0.0 5.66 250.0 1.0 0.191 0.68 12.42Simen 97.5 2.5 0.0 6.24 242.0 1.0 0.091 0.72 13.12Gainadi 99.0 1.0 0.0 7.13 295.0 1.75 0.104 0.84 16.88Jiadahal 99.0 1.0 0.0 6.94 164.0 1.5 0.09 0.52 9.84Subansiri 98.0 1.0 1.0 6.64 224.0 2.37 0.257 0.51 10.15Ranganoi 96.5 1.75 1.75 6.76 135.5 1.38 0.184 0.51 9.38Dikrong 98.5 0.5 1.0 6.84 Ino 0.88 0.104 0.44 8.7Buroi 98.25 0.75 1.0 6.41 67.0 1.0 0.117 0.55 11.51Burzanz 98.0 0.75 1.25 6.52 47.5 1.37 0.230 1.78 19.27liabharali 98.5 0.0 1.5 6.96 128.0 1.12 0.119 0.61 11.49Gabharu 94.0 2.0 4.0 6.65 94.0 2.0 0.278 0.89 14.32Belsiri 92.0 5.75 2.25 6.47 75.0 1.5 0.391 1.42 18.6Pasnoi 98.5 0.25 1.25 7.3 53.5 1.87 0.136 0.53 10.89Jiadhansiri 97.75 0.5 1.75 7.45 90.5 1.13 0.188 0.49 9.73Bhalukdoba 94.0 3.5 2.5 7.23 128.5 2.0 0.382 0.69 10.85Puthimari 93.75 4.5 1.75 7.19 176.0 2.5 0.38' 0.51 11.27Pagladia 81.75 6.0 12.75 7.06 148.0 2.12 0.39 1.21 17.47Beki 96.75 1.5 1.75 7.33 209.5 3.12 0.166 1.31 17.57Manas 87.5 2.25 10.25 7.25 282.0 7.5 0.457 0.33 6.21Aie 97.0 0.5 2.5 7.40 172.0 6.25 0.628 0.30 6.84Chamoamati 87.25 10.75 2.0 6.66 107.0 1.38 0.186 2.61 30.49Gauranz 86.75 10.0 3.25 7.1 109.0 1.13 0.131 2.54 30.79.Tiokai 93.75 4.0 2.25 7.43 155.0 2.88 0.380 0.38b '. 7.2Gadadhar 97.5 0.5 2.0 7.38 94.0 1.75 0.429 0.26 4.12
Table 5: Sediment quality of South bank tributaries
Physical Features Chemical FeaturesTributaries Sand Silt 'Clay pH Sp.con- Free Organic Av. Av.
(%) (%) %) . ductance CaC03 Carbon nitrogen Phosphorus(umhos) (%) (mgl/OO g) (mglIOO g)
Noadihinz 98.0 0.75 1.25 7.2 108.5 1.75 0.12 21.02 1.95
Dibru 95.75 2.0 2.25 6.75 73.0 1.13 0.217 6.39 0.37Burhidihing 95.25 2.0 2.75 7.0 122.5 1.87 0.163 6.48 0.4
Disang 78.5 3.0 18.5 6.32 290.0 1.0 0.50 6.84 0.36Dikhow 96.5 2.0 1.5 6.64 210.0 2.0 L,26 7.12 0.44
Dhansiri 86.75 5.5 7.75 5.97 172.0 1.5 0.475 6.52 0.48
Kooili 90.5 6.0 3.5 6.73 76.5 1.37 0.223 6.04 0.28Kalona 79.25 10.5 10.25 6.77 169.5 2.0 0.557 22.84 1.12
Bharalu 81.0 16.0 3.0 6.57 179.5 0.87 0.434 9.12 0.48
Kulsi 96.0 1.5 2.5 6.63 83.5 1.375 0.247 21.12 1.12
Sinzra 96.5 1.0 2.5 6.77 50.0 0.75 0.169 17.42 1.12
Dudhnoi 94.75 3.25 2.0 6.65 59.0 1.0 0.277 9.84 0.48
Krisnoi 98.5 0.5 1.0 6.97 78.0 1.75 0.188 9.84 0.52
11
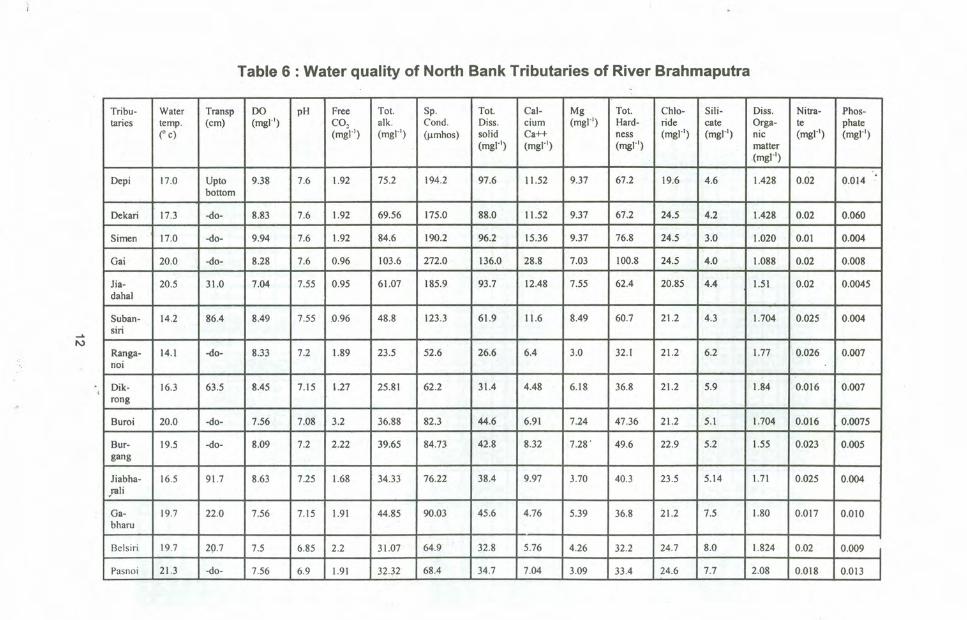
Table 6 : Water quality of North Bank Tributaries of River Brahmaputra
..•.I\)
Tribu- Water Trans" DO pH Free Tot. Sp. Tot. co- Mg Tot. Chlo- Sili- Diss. Nitra- Phos-taries temp. (em) (mgl') CO, alk. Condo Diss. cium (mgl") Hard- ride eate Orga- te phate
(0 c) (mil") (mgl") (umhos) solid Ca++ ness (mgl") (mgl") nie (rngl") (rngl")(rngl") (mgl") (mgl') matter
(rngl")
Depi 17,0 Upto 9.38 7,6 1.92 75.2 194.2 97.6 11.52 9.37 67.2 19.6 4.6 1.428 0.02 0.014bottom
Dekari 17.3 -do- 8.83 7.6 1.92 69.56 175.0 88.0 11.52 9.37 67.2 24.5 4.2 1.428 0.02 0.060
Simen 17.0 -do- 9.94 7.6 1.92 84.6 190.2 96.2 15.36 9.37 76.8 24.5 3.0 1.020 0,0) 0.004
Gai 20.0 -do- 8.28 7.6 0.96 103.6 272.0 136.0 28.8 7.03 100.8 24.5 4.0 1.088 0 ..02 0.008
Jia- 20.5 31.0 7.04 7.55 0.95 61.07 185.9 93.7 12.48 7.55 62.4 20.85 4.4 1.51 0.02 0.0045dahal
Suban- 14.2 86.4 8.49 7.55 .0.96 48.8 123.3 61.9 11.6 8.49 60.7 21.2 4.3 1.704 0 ..025 0.004siri
Ranga- 14.1 -do- 8.33 7.2 1.89 23.5 52.6 26.6 6.4 3.0 32.1 21.2 6.2 1.77 .0..026 .0.007noi
Dik- 16.3 63.5 8.45 7.15 127 25.81 62.2 31.4 4.48 6.18 36.8 21.2 5.9 1.84 0 ..016 .0.007rong
Buroi 20.0 -do- 7.56 7.08 3.2 36.88 82.3 44.6 6.91 7.24 47.36 21.2 5.1 1.704 .0.016 0.0075
Bur- 19.5 -do- 8.09 7.2 2.22 39.65 84.73 42.8 8.32 7.28' 49.6 22.9 5.2 1.55 0.023 0.005gang
Jiabha- 16.5 91.7 8.63 7.25 1.68 34.33 76.22 38.4 9.97 3.70 40.3 23.5 5.14 1.71 .0.025 0.004jali
Ga- 19.7 22.0 7.56 7.15 1.91 44.85 90 ..03 45.6 4.76 5.39 36.8 21.2 7.5 1.80 0 ..017 0.010bharu
Belsiri 19.7 20·7 7.5 6.85 2.2 31.07 64.9 32.8 5.76 4.26 32.2 24.7 8.0 1.824 0.02 0.009 IPasnoi 21.3 -do- 7.56 6.9 1.91 32.32 68.4 34.7 7.04 3.09 33.4 24.6 7.7 2.08 0,0)8 0.013
~ •

....•.c.u
Tribu- Water Transp DO pH Free Tot. Sp. Tot. Cal- Mg Tot. Chlo- Sili- Diss. Nitra- Phos-taries temp. (em) (rngl") CO, alk. Condo Diss. cium (rngl") Hard- tide eate Orga- te phate
r e) (rngl') (rngl") (umhos) solid Ca++ ness (rngl") (mgl") nic (mgl") (rngl")(rngl") (rngl") (rngl") matter
(mgl")
Jia- 19,0 17.4 7.58 7.2 1.60 44.27 106.1 53.8 10.25 5.22 47.5 26.2 7.13 1.97 0.Q\5 0.010dhan-siri "
-.-Bha- 20.3 35.4 802 7.45 2.22 67.68 143.4 72.3 16.31 10.04 82.2 21.23 6,0 1.738 0.Q\5 0.007luk-doba
Puthi- 21.04 234 8.12 7.65 1.42 93.15 181.0 91.3 17.89 15.48 109.4 25.5 5.7 1.61 0.016 0.007mati
Pagla- 21.45 27.8 8.04 7.7 1.43 95.67 186.2 93.1 20.03 12.13 100.35 21.5 6.5 1.80 0.021 0.022dia
Beki 17.0 49.0 8.80 7.52 1.87 50.58 120.68 60.7 13.53 9.83 74.8 23.1 5.28 1.67 0.014 0.004
Manas 2\.5 29.6 7.69 7.87 \.67 207.67 345.5 17.3.84 25.7 22.02 155.8 27.18 5.96 1.727 0.016 0.010
Aie 21.6 44.2 8.0 7.6 \.50 \37.2 249.52 125.2 23.60 17.42 \32.08 26.7 6.0 \.545 0·923 0.0046
Cham- 20.7 28.2 7.38 7.4 \.66 48.4 101.3 51.12 8.4 7.64 52.8 23.8 6.45 \.95 0.022 0.008pamati
Gau- 20.7 43.0 7.37 7.35 2.26 36.03 78.34 39.50 6.54 6.22 41.72 25.14 6.4 1.904 0.Q\8 0.0034rang
Tipkai 2\.7 35.1 7.14 7.2 2.06 46.54 91.32 46.12 7.10 7.04 47.16 21.56 6.52 2.112 0.02 0.021
Gada- 20.5 23.35 6.96 7.3 2.36 37.05 72.63 36.85 4.31 7.27 41.35 22.55 9.2 2.42 0.032 0.015dhar

.•.•..•..-
/
Table 7 : Water quality of South Bank Tributaries
..4.
~
Tribu- Water 1 ransp DO pH Free Tot. Sp. Tot. Cal- Mg Tot. Chlo- Sili- Diss, Nitra- Phos-taries temp. (em) (mgl") CO, alk. Condo Diss. cium (rngl") Hard- ride cate Orga- te phate
(" c) (rngl') (mgl') (umhos) solid Ca++ ness (mgl") (mgl") nic (mgl") (mgl")(mgl') (mgl') (mgl") matter
.. (mgl")
Digha- 14.0 Upto 8.10 8.10 Nil 131.6 299.0 150.0 30.72 2.34 86.4 19.6 5.2 1.360 0.015 0.002ru bottom
Kondil 16.0 Upto 7.91 7.8 0.96 98.7 192.4 98.1 9.6 14.05 81.6 24.5 4.0 1.425 0.015 0.014bottom
Tenga 15.0 Upto 8.24 8,2 nil 58.24 166.1 85.0 17.28 10.37 86.4 24.5 8.0 0.98 0.012 0.002bottom
Noadi- 19.7 33.0 7.58 7.5 1.27 43.5 117.9 59.6 8.32 7.03 52.8 22.86 4.5 1.611 0.03 0.003hing
Dibru 19.7 38.0 6.94 7.1 3.87 50.19 111.3 56.3 7.68 9.66 55.86 22.7 8.3 1.886 0.038 0.006
Burhi- 22.3 38.3 8.59 7.9 nil 70.42 159.3 80.7 8.96 11.2 68.8 27.8 5.87 1.059 0.029 0.005dihing
Disang 2\.3 Upto 6.73 7.23 2.22 53.62 153.9 77.4 8.32 9.27 59.2 26.13 6.5 1.93 0.066 0.005bottom
Dik- 21.3 Upto 5.61 7.15 2.85 54.83 154.9 77.3 13.44 6.42 57.6 24.5 3.7 1.776 0.03 0.006how bottom
Dhan- 21.7 32.0 7.44 7.45 2.13 67.08 158.3 79.7 10.08 8.67 61.2 23.3 6.2 1.97 0.020 0.011sin
Kopili 22.7 29.0 6.95 7.07 2.22 36.82 87.1 43.9 7.68 4.26 36.8 16.33 6.1 1.97 0.023 0.005
Kalong 18.5 290 7.3 7.3 2.36 45.1 88.9 44.5 7.68 6.64 46.8 25.72 4.95 1.822 0.046 0.025
Bharalu 16.5 Upto 8.52 7.25 2.10 22.0 46.0 23.2 5.28 3.86 25.18 26.96 7.45 1.63 0.019 0.003bottom
Kulsi 19.0 36.0 6.99 6.95 1.89 24.35 49.35 24.9 4.8 3.18 25.35 22.05 6.8 I. 78 0.023 0.007
~

"'~~, ••.•...
•
Tribu- Water Transp 00 pH Free Tot. Sp. Tot. Cal- Mg Tot. Chlo- Sili- Diss. Nitra- Phos-taries temp. (em) (mgl') CO, alk. Condo Diss. eium (mgl") Hard- ride eate Orga- te phate
ee) (mgl") (rngl") (umhos) solid Ca++ ness (mgl') (mgl") nie (rngl") (mgl')(mgl') (mgl") (mgl') matter
(mgl")
Singra 19.5 28.0 7.37 7.05 2.36 28.76 52.2 26.1 4.8 4.04 28_8 24.5 7.15 1.97 0.019 0.013
Dudh- 19.9 27.5 7.92 7.2 1.66 28.6 55.4 28.0 5.28 4.92 33.5 23.3 6.05 1.608 0.023 0.006noi
Krish- 19.25 41.9 7.8 7.0 2.33 29.76 53.9 27.2 4.8 4.04 28.8 24.5 6.8 1.63 0.023 0.007noi
...•.()I
"-
'-.

Table 8 : Sediment quality in different stretches of Brahmaputra
0>
Stretches Physical features CheJllfcal features.'
~,:< Sand Silt Clay pH Sp.cond. Free Organic Av. Av.(%) (%) (%) (umhos) CaCOJ C(%) Phosphorus Nitrogen
(%) (mg/IOO g) (mg/IOO g)
Saidiya 98.0 0.75 1.25 7.76 130.6 1.87 0.105 0.53 10.04
Dibrugarh 92.75 6.25 1.0 7.52 207.0 1.37 0.170 0.55 10.81
Jorhat 87.75 10.25 2.0 7.63 170.5 1.0 0.453 1.84 21.64
Biswanathghat 83.75 9.75 6.5 7.43 249.5 2.12 0.339 1.49 17.32
Tezpur 98.5 ,0.5 1.0 7.42 107.0 1.45 0.123 1.90 21.44
Guwahati 92.0 5.0 3.0 7.33 164.5 1.25 0.567 1.18 13.44
Goalpara 97.75 1.0 1.25 7.67 130.0 1.25 0.172 1.20 15.34
Dhubri 98.0 0.75 1.25 7.38 95.0 1.62 0.143 1.62 19.7
Av. for the stretch 93.5 4.3 2.2 7.52 156.75 1.49 0.259 1.29 16.22
'.
•

"
• -,
Table 9 : Water quality of River Brahmaputra in different stretches
-..j
Stre- Water Transp DO pH Free Tot. Sp. Tot. Cal- Mg Tot. Chlo- Sili- Diss. Nitra- Phos-tches temp. (ern) (mgl") CO, alk. Condo Diss. cium (mgl") Hard- ride cate Orga- te phate
(" c) (mgl') (rngl") (umhos) solid Ca++ ness (rngl") (rngl") nic (mgl") (mgl")(rngl") (rngl") (rngl") matter
(mgl")
Saidiya 17.8 87.2 7.32 7.5 2.22 68.02 149.0 75.3 13.61 12.36 78.0 19.6 6.0 1.59 0.022 0.016
Dibru- 18.7 43.5 7.00 7.63 1.58 57.51 137.1 69.5 14.72 6.96 65.6 19.6 4.7 1.41 0.038 0.005garh
Jorhat 18.0 36.9 7.92 7.62 1.14 71.0 155.3 78.5 19.95 5.61 72.8 29.4 4.84 1.682 O.oI8 0.004
Biswa- 18.0 43.0 8.45 7.63 1.27 64.6 156.7 79 ..0 15.44 8.48 73.6 19.6 5.3 1.84 0.03 0.004nath-ghat ,
Tezpur 19.4 35.4 7.72 7.53 1.73 56.9 134.6 67.3 12.48 10.17 64.8 22.3 4.8 1.743 0.022 0.004(belowbridge)
Tezpur 18.7 39.5 7.77 7.7 1.65 61.56 145.22 74.7 \3.44 8.97 70.82 19.6 4.9 1.752 0.025 0.003(forestghat)
Guwa- 19.~ 38.0 7.73 7.5 1.52 71.2 150.78 76.1 17.66 8.57 79.68 22.54 5.24 \.39 0;036 0.0072hati
Goal- 19.6 43.2 8.12 7.9 1.20 76.23 174.6 88.06 18.05 9.40 84.34 27.3 5.7 1.54 0.024 0.005para
Dhubri 21.2 40.1 7.7 7.7 0.93 60.75 136.0 68.5 12.67 6.72 60.24 26.46 5.8 1.494 0.019 0.0052
, :1

Table 10 : Impact of tributaries on water quality of river Brahmaputra
co
Stretches Water pH DO Free Carbo- Bicarbo- Sp. Condo Tot. Diss. Calcium Mg Tot.temp. (rngl') CO, nate nate (umbos) solid Ca++ (rngl") Hard-(" c) (mgl") (mgl") (mgl') (rngl') (mgl') ness
(rngl")
Brahmaputra 18.0 7.6 8.2 1.89 nil 70.44 160.4 80.8 18.62 11.52 88.4
Impact of Jia Jiabharali 14.0 7.1 8.02 1.89 nil 38.29 82.4 41.5 11.52 5.76 52.8Bharali onBrahmaputra at At confluence (OF) 15.0 7.2 8.12 1.89 nil 40.4 84.8 42.4 12.82 5.6 58.8Tezpur
Below confluence 16.0 7.4 8.08 ~.89 nil 52.12 98.4 4.9.8 14.12 7.26 60.4(BOF-I)
Below confluence 18.0 7.5 8.12 1.89 nil 64.61 147.2 74.4 15.36 10.8 80.8(BOF-II)
Brahmaputra 18.0 7.8 9.8 1.89 nil 76.44 176.3 88.0 24.96 11.52 110.4
Impact of Manas Manas 21.0 8.1 7.6 Nil 1.85 218.7 381.0 192.0 33.04 20.80 177.6on Brahmaputra atGoalpara At confluence (OF) 20.0 8.1 7.4 nil 0.95 172.90 338.0 171.0 32.56 20.34 172.0
Below confluence 19.2 8.0 8.0 0.95 nil 12280 282.0 144.0 26.12 14.28 136.8(BOF-I)
Below confluence 18.0 7.8 8.6 0.95 nil 101.92 207.0 104.0 26.25 12.67 114.6(BOF-II)
-r
• • "

(i) Plankton
water quality of Brahmaputra in the stretch at Tezpur reflect more of the tributary than itsown. Similarly at Goalpara (Jogghopa) the highly alkaline Manas water results in sharpincrease in the values of alkalinity, conductance, dissolved solids, calcium and hardnessat the confluence point and the impact has been seen much below the confluence. In factvast sheet of Brahmaputra water at Goalpara reflects characteristics of Manas river thanits own. A sudden decline in the values of above chemical parameters at Dhubri fromcomparatively much higher values at Goalpara again reflects the influence of low alkalinewaters of Gaurang, Tipkai and Gadadhar which join Brahmaputra between Goalpara andDhubri. Even some of the south bank tributaries have considerable impact on the waterquality of main river although with lesser magnitude. It can thus be concluded that inmaintenance of annual water quality cycle of river Brahmaputra tributaries play key role.
Biotic variables
The numerical abundance of plankton and percentage composition of differentgroups in Siang, Dibang and Lohit, the three forerunners of Brahmaputra and R differentstretches of the river have been presented in Table 11. In the three rivers the abundanceof plankton is generally poor ranging from 22 to 51 or', the higher concentration being inLohit. The qualitative picture has shown complete dominance of phytoplankton, themain representation being of Bacillariophyceae (80 to 90%) and Chlorophyceae (10 to20%) with complete absence of Myxophyceae. Hormidium and Mougeotia amongchlorophyceae and Navicula and Tabelaria among Bacillariophyceae were the mainspecies encountered in these rivers.
In the main river Brahmaputra the plankton density and qualitative compositionhave shown consideable zonal variations with maximum concentration in Saidiya(300 url) and minimum in Biswanathghat (48 ul"). Zooplankton represent onlynegligible fraction of the total population (0 to 5.4%) being almost absent in manystretches. Among the various groups of phytoplankton Bacillariophyceae has showndominance over others (43.5 to 95.8%) followed by Chlorophyceae (3.9 to 50.9%) andMyxophyceae (0 to 23%) the last one showing appearance only in Saidiya, Dibrugarh andBiswanathghat. Higher concentration of plankton and presence of group Myxophyceae atSaidiya (the meeting point of three components) and large expansion of water massreflect some what stagnant conditions of the river in this stretch. Considerable qualitativeshift has been observed between Saidiya to Dibrugarh with group Chlorophyceaeincreasing upto 37.1 % resulting in consideable decline inDiatom population. The stretchbetween Jorhat and Tezpur is again completely dominated by diatoms (88.5 to 95.8%).
19

The downstretch between Guwahati to Dhubri however, has shown shift towardsChlorophyceae (38.2 to 50.9%). The qualitative shift in the planktonic structure invarious stretches have shown direct reflection of the changes in the water quality oftheriver. In general the population has shown a declining trend between Saidiya toBiswanathghat and improvement between Tezpur to Dhubri. The group Myxophyceaewas mainly represented by a single species Oscillatoria while chlorophyceae wasrepresented by Spirogyra, Hydrodictiyon, Zygnema, Microspora and Oedogonium andBacillariophyceae by Fragilaria, Navicula, Tabellaria and Cyclotella.
\
Tributaries
The numerical abundance and qualitative composition of plankton in 25 northbank tributaries are shown in Table 12. Among the various tributaries maximumconcentration of plankton is observed in Burgang (753 u") and minimum in Dekari(48 url). The qualitative picture has shown considerable variations between thetributaries. Some of them like Subansiri, Manas, Aie, Burgang, Gainadi and pagladia hadcomparatively higher percentage of Chlorophyceae (25.4 to 78.2%) while Ranganoi,Belsiri, Pasnoi and Beki had only representation of Bacillariophyceae (100%). In genealBacillariophyceae was the dominant component among phytoplankton followed byChlorophyceae while Myxophyceae was present only in Depi and Simen. It may bementioned that the tributaries differ considerably in respect of their water quality andqualitative variations in the planktonic composition may be the reflections of the same.Zooplankton had negligible contribution in the total plankton population.
The plankton abundance and qualitative composition in the south bank tributarieshasbeen shown in Table 13. Among the l3 tributaries maximum population is observedin Dibru (370 url) while minimum in Singra 20 url). Except Dibru and Burhidihing,which have shown zooplankton representation upto 6.2 to 7.4%, phytoplankton remainedthe dominant component. The qualitative picture showed considerable variations. Thetributaries Burhidihing, Disang, Singra and Krishnoi showing comparatively higherprecentage of Chlorophyceae (25 to 66.2%), Dhansiri having higher concentration ofMyxophyceae (32.1%) while others showing complete dominance of Bacillariophyceae(Table 13). Like north bank tributaries the south bank tributaries have also shownconsideable variations in water quality and the qualitative shift in the planktonpopulations may be attributed to the hydrological differences.
Various species encounteredc in the tributaries on both the banks are Oscillatoria(a single species) among Myxophyceae Spirogyra, Microspora among Chlorophyceae andFragillaria, Synedra and Surirella among diatoms.
20

(ii) Benthos
Qualitative and quantitative abundance of benthos in the three forerunners, 8stretches and tributaries on both the banks has been presented in Table 14. In the threerivers Siang, Dibang and Lohit the numerical abundance of benthos ranged between 162to 290 nos m-2 mainly represented by chironomids (68 to 78%) and insect (22 to 32%).The rich abundance of chironomids in these rivers clearly reflect rich detritus load in thesystem. As the rivers are flowing through dense forest falling of plant leaves contributerichness of the detritus pool. However, the same was not reflected in organic carboncontent of the sediment of Dibang and Lohit. It may be mentioned that the sedimentcontained 98 to 99% of sand and although the sediment was being constantly loaded byorganic detritus the same was not retained due to very high sand content. However, thebenthic organisms do get enough organic detritus for their growth .
•
...
In the river Brahmaputra considerable qualitative variations have been observed inthe stretches between Saidiya to Dhubri, the population being maximum in Dibrugarh(365 nos m") and minimum at Biswanathghat (32 nos m"). The down stretch of the riverbetween Guwahati and Dhubri represented higher population of Gastropods (46.4 to65.9%), in upper stretch Saidiya and Dibrugarh both Gastropods and bivalves were mainbenthos (32.8% and 58.4% and 47.3% and 44.9% respectively) while chironomidsdominate over others in Biswanathghat (75.0%) and and Tezpur (71.7%). the stretch atlorhat represent maximum concentration of oligochaetes (57.2%) followed by Gastropods(39.4%) .
The north bank tributaries also differ considerably in respect of numericalabundance of benthic communities, the population being maximum in Jiabharali (1412nos m") and minimum in liadahal (37 nos m"). The qualitative picture shows thedominance of molluscan population in Dekari (71.2%), Ranganoi (68.2%), Dikrong(72%), Belsiri (95.1%), Bhalukdoba (64.2%), Beki (59.4%), Manas (81.7%) and Aie(100%). Oligochaetes are higher in Simen (72.8%), Buroi (49%) and Burgang (48%)while Jiadahal (90.8%), Subansiri (60.0%), liabharali (58.6%), Pasnoi (66.7%).Jiadhansiri (47%), Pagladia (75%) and Tipkai (49.7%) are comparatively rich inchironomids. Insects are comparatively higher in Champamati (69.1 %) and Gadadhar(89.6%). High concentration of benthos in liabharali and Subansiri are mainly due torich population of chironomids.
21

Table 11 : Qualitative and quantitative abundance of plankton in River Brahmaputra
'"'"
Rivers/ Total Phytoplankton Others Zooplanktonstretch plankton
(ul·') Total abundance % composition Total % composition(ut') abun-
Myxo- Chloro- Bacillario- dance Rotifers Copepods Clado- ProtozoansCompo- (ul·')nents of
phyceae phyceae phyceae cerans
Brahma- Siang 22 22 - 20.0 80.2 - - - -putra - -
Dibang 34 34 - 15.8 84.2 - - - - - -Lohit 51 51 - 10.0 90.0 - - - - - -Saidiya 300 297 23.1 17.0 58.9 - 3 1.0 - - -Dibrugarh 72 68 13.9 37.1 43.5 - 4 2.3 3.2 - -Jorhat 80 80 - 9.9 90.1 - - - - - -Biswanath- 48 48 4.0 7.5 88.5 - - - - - -ghat
Stretches of Tezpur 84 84 0.3 3.9 95.8 - - - - - -Brahma-putra Guwahati 100 91 - 50.9 46.1 - 3 1.9 - - -
Goalpara 91 86 - 38.2 56.3 - 5 3.2 1.2 1.1 -Dhubri 105 101 - 45.2 44.7 6.3 4 1.6 1.2 1.0 -
•"

Table 12 : Qualitative and quantitative abundance of plankton in North bank tributaries
Nc..>
Tributaries Total Phytoplankton Others Zooplanktonplankton
(ul·') Total abundance % composition Total abun- % composition(ul"') dance
Myxo- Chloro- Bacillario- (ul·') Rotifers Copepods Clado- Protozoansphyceae phyceae phyceae cerans
Oepi 54 50 5.8 22.4 64.4 4 4.4 1.0 2.0 -
Dekari 48 48 - 24.2 75.8 - - - - - -
Simen 75 68 7.6 19.8 63.3 - 7 - 3.9 5.4 -Gainadi 115 106 - 26.7 65.5 - 9 1.0 2.0 4.8 -Jiadahal 32 32 - 21.8 78.2 - - - - - -Subansiri 65 61 - 78.2 15.7 - 4 4.0 2.1 - -Ranganoi 34 34 - - 100.0 - - - - - -.
Oikrong 109 106 - 18.0 79.2 - 3 2.8 - - -Buroi 184 180 - 20.1 77.7 - 4 2.2 - - -Burgang 753 733 - 34.7 62.6 - 20 - 2.7 - -
Jiabharali 140 140 - 4.3 95.7 - - - - - -Gabharu 114 114 - 10.2 89.8 - - - - - -Belsiri 50 50 - - 100.0 - - - - - -Pasnoi 45 45 - - 100.0 - - - - - -Jiadhansiri 115 109 - 5.0 89.8 6 - 2.0 3.2 -
Bhalukdoba 108 102 - 22.4 n.1 6 3.3 - 2.2 -
Puthimari 213 213 - 10.8 89.2 - - - - - -

Tributaries Total Phytoplankton Others Zooplanktonplankton
(ul") Total abundance % composition Total abun- % composition(ul") .:» dance
Myxo- Chloro- Bacillario- (ul") Rotifers Copepods Clado- Protozoansphyceae phyceae phyceae cerans
r
Manas 177 166 - 41.8 52.0 - II - 4.2 - -Aie 182 182 - 35.4 61.3 3.3 - 2.0- - - -Champamati 232 220 - 18.2 76.7 - 12 1.9 - 3.2 -Gaurang 530 530 - 15.3 84.7 - - - - - -Tipkai 124 118 - 3.6 91.6 - 6 3.8 1.0 - -Gadadhar 73 73 - 10.96 89.03 - - - - - -
N.j:>.

-"~"'''-
,..,
Table 13 : Qualitative and quantitative abundance of plankton in South bank tributaries
N01
Tributaries Total Phytoplankton Others Zooplanktonplankton
(ul") Total abundance % composition Total abun- % composition(ul') dance
Myxo- Chloro- Bacillario- (ul") Rotifers Copepods Clado- Protozoansphyceae phyceae phyceae cerans
Noadihing 55 55 - 12.5 87.5 - - - - - -Dibru 370 347 7.1 16.7 70.0 - 23 1.4 3.0 1.8 -Burhidihing 148 137 2.4 43.5 46.7 - II 3.2 - 4.2 -Disang 98 98 - 30.8 69.2 - - - - . -Dikhow 100 100 - ~0.4 89.6 - - - - - -Dhansiri 144 141 32.1 6.9 59.0 - 3 2.0 - - -Kopili 93 93 - 4.0 96.0 - - - - - -Kalong 65 65 - 5.5 94.5 - - - - - -Bharalu 33 33 2.6 1l.9 85.5 - - - - -Kulsi 49 49 1.7 10.0 88.3 - - - - - -Singra 20 20 - 25.0 75.0 - - - - - -Dudhnoi 35 35 0.4 3.6 96.0 - - - - - -Krishnoi 51, 51 - 66.2 38.8 - - - - - -
..

Table 14 : Qualitative and quantitative abundance of benthic communities
Rivers/ Total Percentage compositionStretches/ abundance
Tributaries (nos.m")Molluscs
Gastropods Bivalves Oligochaetes Chlronomids Insect OthersComoonent o BrahmanutraSiang 290 - - - 78.0 22.0 -Dibanz 162 - - - 68.0 32.0 -Lohit 223 - - - 73.0 2~.0 -Stretches of BrahmaputraSaidia 159 32.8 58.4 - - 8.8 -Dibruzarh 365 47.3 44.9 7.8 - - -Jorhat 79 39.4 3.4 57.2 - - -Biswanath- 32 - - 25.0 75.0 - -ghatTeznur 76 12.3 16.0 - 71.7 - -Guwahati 254 46.5 - 18.3 35.2 - -Goalpra 177 46.4 - 12.7 35.2 - -Dhubri 157 65.9 - 25.8 - 8.3 -North bank tributariesDeni 32 - - 100.0 - - -Dekari 222 71.3 14.4 - 14.4 - -Simen 127 - - 72.8 17.2 - -Gainadi 82 28.2 - 38.8 - 33.0 -Jiadahal 37 9.2 - - 90.8 - -Subansiri 590 11.2 - 30.8 60.0 - -Ranzanoi 182 68.2 20.2 11.6 - - -Dikronz 174 72.0 10.8 - 17.2 - -Buroi 48 20.6 - 49.0 30.4 - -Burgang 342 32.4 - 48.0 - 19.6 -Jiabharali 1412 - - 20.7 58.6 20.7 -Gabharu 184 42.8 - 20.4 36.8 - -North Bank TributariesBelsiri 115 95.1 - - - 4.9 -Pasnoi 96 33.3 - - 66.7 - -Jiadhansiri 172 42.8 10.2 - 47.0 - -Bha1ukdoba 287 64.2 18.4 17.4 - - -Puthimari 155 3.7 33.3 33.3 29.7 - -Pazladia 54 - - - 75.0 25.0 -Beki 50 59.4 - - 40.6 - -Manas 365 81.7 - - - 19.3 -Aie 1t,l 100.0 - - - - -
26
I;

..
Rivers/ Total Percentage compositionStretches/ abundance
Tributaries (nos.m")Molluscs
Gastropods Bivalves Oligochaetes Chironomids Insect OthersChampamati 54.0 30.9 - - - 69.1 -Gaurang 151 100.0 - - - - -Tipkai 926 17.0 ' "
'. 33.5 49.7- - -Gadadhar 108 lOA - ; .' - - 89.6 -Noadihing 32 - - - 100.0 - -Dibru 108 10.4 - - - 60.9 -South bank tributariesBurhidihing 706 - 9.5 - - 90.5Disang 175 39.1 - - - - -Dikhow 274 70.0 - - 30.0 50.0 -Dhansiri 45 33.3 - 66.7 - - -Kopili 110 8.4 33.4 8.2 - 39.2 -Kalona 98 61.1 38.9 - - - -Bharalu 364 60.8 - - - - -Kulsi 160 49.8 50.2 - - - -Sinzra 128 49.8 50.2 - - - -Dudhnoi 86 97.4 - 2.6 - -Krishnoi 95.0 94.1 5.9 - - -
.;
27

The benthic population in south bank tributaries is maximum in Burhidihing (706nos m") and minimum in Noadihing (32 nos m-2). The qualitatuive picture has showndominance of Gastropods in Dikhow (70%), Kalong (61.1%), Bharalu (60.8%), Singra(100%), Dudhnoi (97.4%) and Krishnoi (94.1%)~ both Gastropods and bivalves in Kulsi,while oligochaetes are dominant in Dhansiri (66.7%). Chironomids dominate inNoadihing and insects in Dibru (89.6%), Burhidihing (90.5%), Disang (60.9%) andKopili (50%).
The qualitative difference in the benthic communities in various tributaries anddifferent stretches of the main river clearly reflect differences in their bottom deposites.
Energy transformation through primary production and production potential
The range and average rate of carbon production energy transformation byproducers, photosynthetic efficiencies and fish production potential in three forerunnersof Brahmaputra, Siang, Dibang and Lohit. 8 different stretches of Brahmaputra betweenSaidiya and Dhubri and some important tributaries are presented in Table 15.
(i) Siang, Dibang and Lohit
The net carbon production (mg Cm-2 •day") and rate of energy transformationfrom light to chemical (Cal m-2 day") are on average 148.67 and 1460 in Siang, 174.37and 1712 in Dibang and 197.5 and 1939 in Lohit respectively. The rates arecomparatively higher in Lohit among the three rivers. The incident. light energypenetrating the water surface range between 17,85,000 Cal m-2 day" in. Siang and17,98,000 Cal m-2 day" in Lohit and thus only 0.082% of solar energy available on thewater surface is transformed into chemical energy and stored by producers in Siang,0.096% in Dibang and 0.108% in Lohit rivers. Based on the rate of energytransformation and taking 0.5% of net energy fixed by produces as energy at fish level theproduction potential of Siang, Dibang and Lohit rivers have been estimated as 50.5 kgha' yr'. 59.3 kg ha-' yr" and 67.3 kg ha-' yr" respectively (Fig. 2).
(ii) Brahmaputra
The rate of carbon production (mg cm-' day") and energy transformation byproducers (Cal m-2 day") in 8 different stretches of Brahmaputra are on average 227.32 &2232 in Saidiya; 271.37 & 2665 in Dibrugarh, 233.2 & 2290 in Jorhat, 212.56 & 2087 inBiswanathghat, 213.80 & 2099 in Tezpur, 323.0 & 3172 in Guwahati, 331.73 & 3258 inGoalpara and 359.32 & 3528 in Dhubri. The production rates show a gradual increasing
28

•
trend in the down stretch from Biswanathghat (where it is minimum) to Dhubri. Incidentlight energy penetrating the water surface is in the range of 18,05,000 cal m" day" inSaidiya to 18,54,200 cal m-2 day" in Dhubri and thus 0.113 to 0.190% of solar energy istransformed to chemical energy and stored by producers in the entire stretch. BetweenSaidiya to Dhubri the average rate of energy transformation comes to 2666 cal m-2 day--Iwhile average rate of solar energy available on the water surface is 18,36,825 cal m-2
day". Thus on average 0.145% of available light energy is fixed by producers in theentire stretch of Brahmaputra. Although the rate of energy fixation and photosyntheticefficiency in Brahmaputra appears to be comparatively lower than many stagnent andflowing waters but considering the highly fluavitile conditions of the system a netproduction efficiency of 0.145% is sufficient to sustain the whole trophic chaing of thesystem. Based on the energy flow studies the fish production potential of the river rangedbetween 72.3 to 122.2 kg ha" yr" being maximum in Dhubri and minimum in Biswanathghat. The average potential of the entire stretch of the river comes to 92.32 kg ha-I yr"(Fig. 2).
(iii) Tributaries
The rate of carbon production (mgCm-2dail) and rate of energy transformation(cal :m-2dail) has also been studied in some of the important tributaries. The averagerates are 193.5 & 1900 in Subansiri, 178.4 & 1752 in Jiabharali, 314.4 & 3087 inManas,392.1 & 3850 in Burhidihing and 197.6 & 1940 in Kalong. The photosyntheticefficiency is maximum in Burhidihing (0.212%) and minimum in Kalong (0.105%)._~llefish production potential of these tributaries estimated from energy flow studies are 65.79 _kg ha-l in Subansiri, 60.66 kg ha-l in Jiabharali, 106.9 kg ha-l in Manas, 133.21 kg ha:1in Burhidihing and 67.18 kg ha-1 in Kalong. Studies made in the above tributaries'clearly show that they have tremendous fisheries potential, some of them even have.>potential more than the main river.
If the production potential of the tributaries and the main river are taken togetherthe system has very high potential energy resource as fish. The average fish productionpotential for the three forerunners main Brahmaputra and five studied tributaries wereestimated at 59, 92.3 and 86.8 kg ha-l yr" respectively. Thus if managed and exploitedscientifically, it will be a real boon for both Assam and Arunachal Pradesh so far as fishproduction is concerned.
29
I,

,.
•... ,,, •....-.•..
Table 15 : Energy transformation through primary production in Brahmaputra and some of its tributaries
wo
Rivers/stretches Latitulle Incident visible solar Net production Photosynthetic Fish productionradiation efficiency (%) potential
(Cal m day") (MgC m' day") (Cal m' day") (kg ha" yr"')
Stretches of Brahmaputra component of Brahmap.tra
Siang .28"42' 17,85,000 i48.67 1460 0.082 50.5
Dibang 28"30' 17,90,000 174.37 1712 0.096 59.3
Lohit 28°12' 17,98,000 197.5 1939 0.108 67.3
Saidiya 27°56' 18,05,000 227.32 2232 0.124 77.3
Dibrugarh 27°32' 18,18,000 271.37 2665 0.147 92.2
Jorhat 26°50' 18,52,500 233.20 2290 0.125 79.3
Biswanathghat 26°40' 18,40,800 212.56 2087 0.113 72.3
Tezpur 26~34' 18,40,800 213.80 2099 0.114 72.7
Guwahati 26°14' 18,49,100 323.0 3172 0.172 1p9.8
Goa1para 26°5' 18,54,200 331.73 3258 0.176 112.8
Dhubri 26°0' 18,54,200 359.32 3528 0.190 122.2
Av. Brahmaputra stretch - - 271.54 2666 0.145 92.32
Tributaries
Subansiri 27°40' 18,10,00 193.5 1900 0.105 65.79
Jiabhara1i 27°34' 18,40,000 178.4 1752 0.095 60.66
Manas 27°5' 18,54,200 314.4 3087 0.166 106.90
Burhidihing 27°32' 18,18,000 392.1 3850 0.212 133.31
Kalong 26°14' 18,49,100 197.6 1940 0.105 67.18
~
.. •

l40iI
!
I,
12°1100
IIiI
W 80--j-4
I
i60-1
IiI
Ii
40i:
i
20 -:
.. •
Production potential, River Brahmaputra (kgha'lyr")
o : --·--------,-----=--r----=,---· -- - -,-- ----------T------I------- ,-----,-------- --r------,------i
Siang Dibang Lohit Sadiya Dibrugarh Jorhat Biswanath Tezpur Guwahati Goalpara Dhubri

Fish production
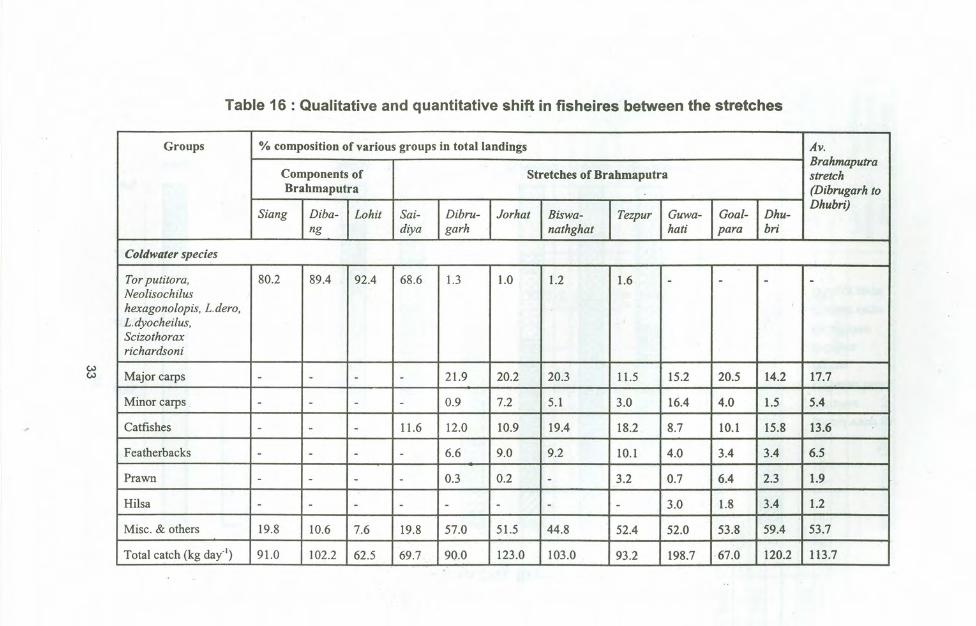
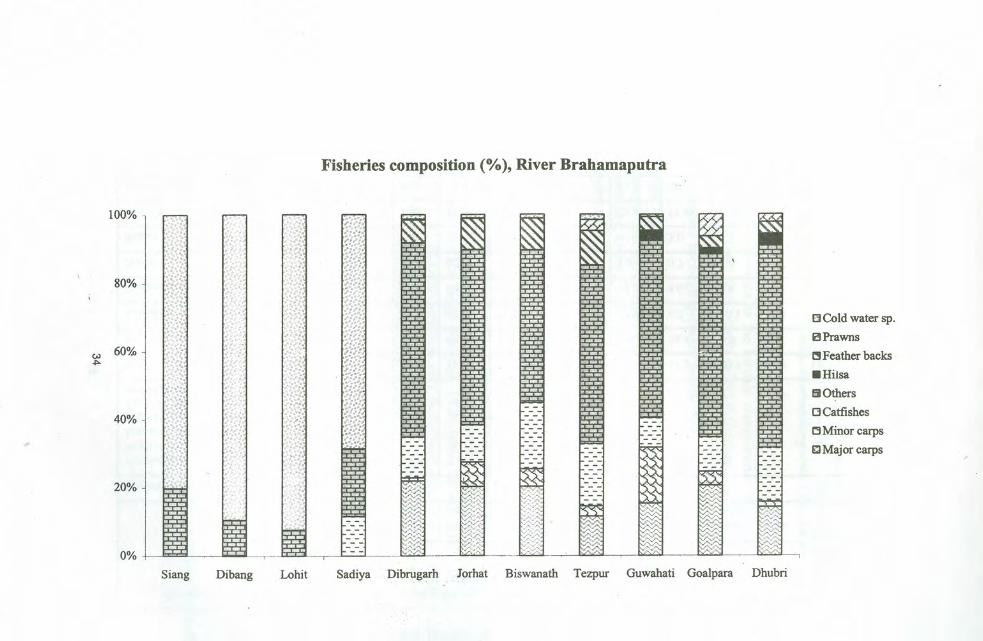
Estimated fish catch recorded during brief sampling periods in three differentseasons (kg day") from three components and 8 different stretches between Saidiya andDhubri and their qualitative composition has been shown in Table 16 (Fig. 3).
(i) Rivers Siang, Dibang and Lohit
The average daily fish landing recorded from various landing centres eg.Pansighat, Yembung and Oiramghat in Siang, Roing and Shantipur market in Dibang andAlubariphat and some local marketsin Lohit are 91.0 kg day", 102.2 kg day" and 62.5kg day" respectively. Fishery in the three rivers is almost similar mainly represented byTor putitora, Neolisocheilus hexagonolepis among Mahseer, Scizothorax richardsoniamong snowtrout and L.dero and L.dyocheilus among cold water species contributing80.2 to 92.4% of the total landings. Miscellaneous and trace fishes also contributesignificantly in the total catch (7.6 to 19.8%) while major carps, minor carps and catfishesare completely absent.
(ii) Stretches of Brahmaputra
(a) Saidiya
The fishery of river Brahmaputra at Saidiya, the meeting point of three rivers,Siang, Dibang and Lohit is also dominated by Mahseer species Tor putitora andNeiolissocheilus hexagonolepis and cold water species L.dero and L.dyocheilus the mainfishery of the three rivers. Out of an average daily landing of 69.7 kg day-I. the abovementioned species contribute 68.6% of the total catch followed by miscellaneous species19.8%. the large catfishes, which are absent in the three rivers contributed almost 11.6%of the total landing of Saidiya while major carps and minor carps are also absent in thisstretch.
(b) Dibrugarh
The average daily fishlanding in Dibrugarh market recorded during samplingperiod is 90.0 kg day"I mainly dominated by miscellaneous and trace fishes (57.0%),followed by major carps (21.9%) catfishes (12.0%) and feather backs (6.6%). thepercentage contribution of minor carps (0.9%) and prawn (0.3%) are very low while hilsais completely absent. The above mentioned mahseer and coldwater species have alsobeen recorded in the market but their contribution is only 1.3% of the total catch. It is
32
•.
iI
"""~ •...•...
II
Table 16 : Qualitative and quantitative shift in fisheires between the stretches
ww
Groups % composition of various groups in total landings Av.Brahmaputra
Components of Stretches of Brahmaputra stretchBrahmaputra (Dibrugarh to
Siang Diba- Lohit Sai- Dibru- Jorhat Biswa- Tezpur Guwa- Goal- Dhu-Dhubri)
ng diya garh nathghat hati para bri
Coldwater species
Tor putitora, 80.2 89.4 92.4 68.6 1.3 1.0 1.2 1.6 - - - -Neolisochilushexagonolopis, Lidero,Lidyocheilus,Scizothoraxrichardsoni
Major carps - - - - 21.9 20.2 20.3 11.5 15.2 20.5 14.2 17.7
Minor carps - - - - 0.9 7.2 5.1 3.0 16.4 4.0 1.5 5.4
Catfishes - - - 11.6 12.0 10.9 19.4 18.2 8.7 10.1 15.8 13.6
Featherbacks - - - - 6.6 9.0 9.2 10.1 4.0 3.4 3.4 6.5
Prawn - - - - 0.3 0.2 - 3.2 0.7 6.4 2.3 1.9
Hilsa - - - - - - - - 3.0 1.8 3.4 1.2
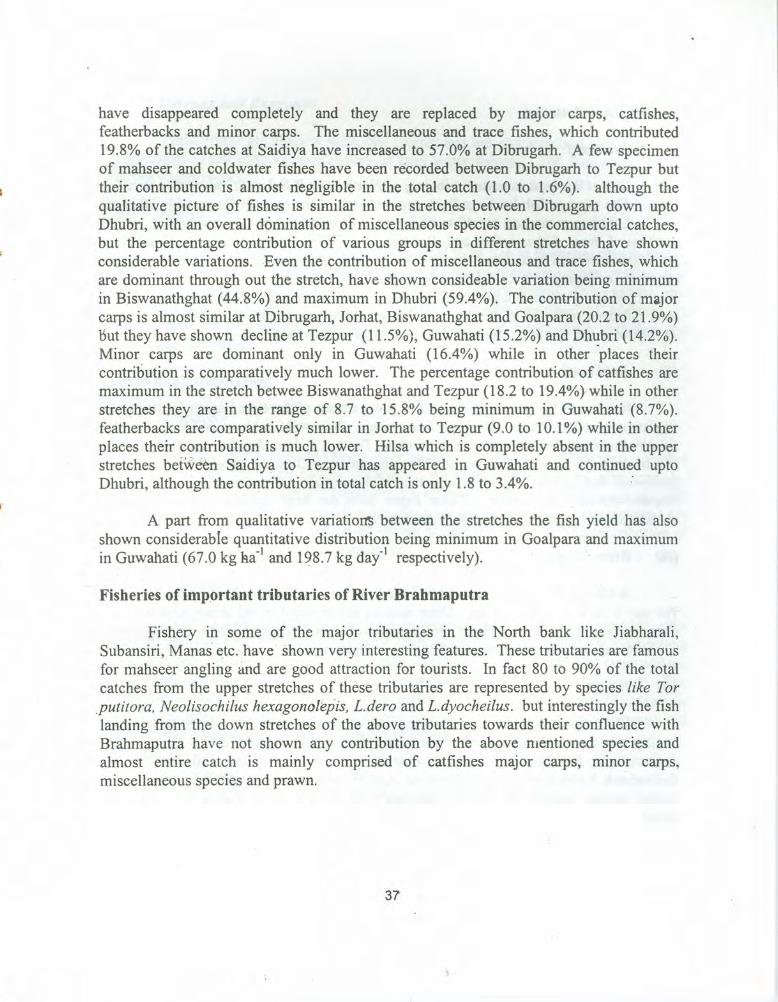
Misc. & others 19.8 10.6 7.6 19.8 57.0 51.5 44.8 52.4 52.0 53.8 59.4 53.7
Total catch (kg day") 91.0 102.2 62.5 69.7 90.0 123.0 103.0 93.2 198.7 67.0 120.2 113.7
Fisheries composition (0/0), River Brahamaputra
100%
80%
I~ g ~ ~ ~ ~ ~ ~CICold water sp.BPrawns
w 60% ~ ~::~~~~ ~~~~~~ ~ Ii$;i ~ ~ ~ ~.. FSa...·.. " l'!Featherbacks~ I t:{::~~~,~ t~:~{~:~ ~ ~ ~ ~ ~ ti:Sa ~• HilsaBOthers
40% ~ t~~~~~ IE!a (vll:A ~=-=-l ~ f.:":'i II,:,J IP:TJ C3Catfishes1:3 Minor carpsClMajor carps
I l:\...•.~ f!i W ~ ~ t=:=:~ ~ ~ ~~~l20%
0%.1 b±r'?' Fr r-p
Siang Lohit Sadiya Dibrugarh Jorhat Biswanath Tezpur Guwahati Goa1para DhubriDibang
•
..
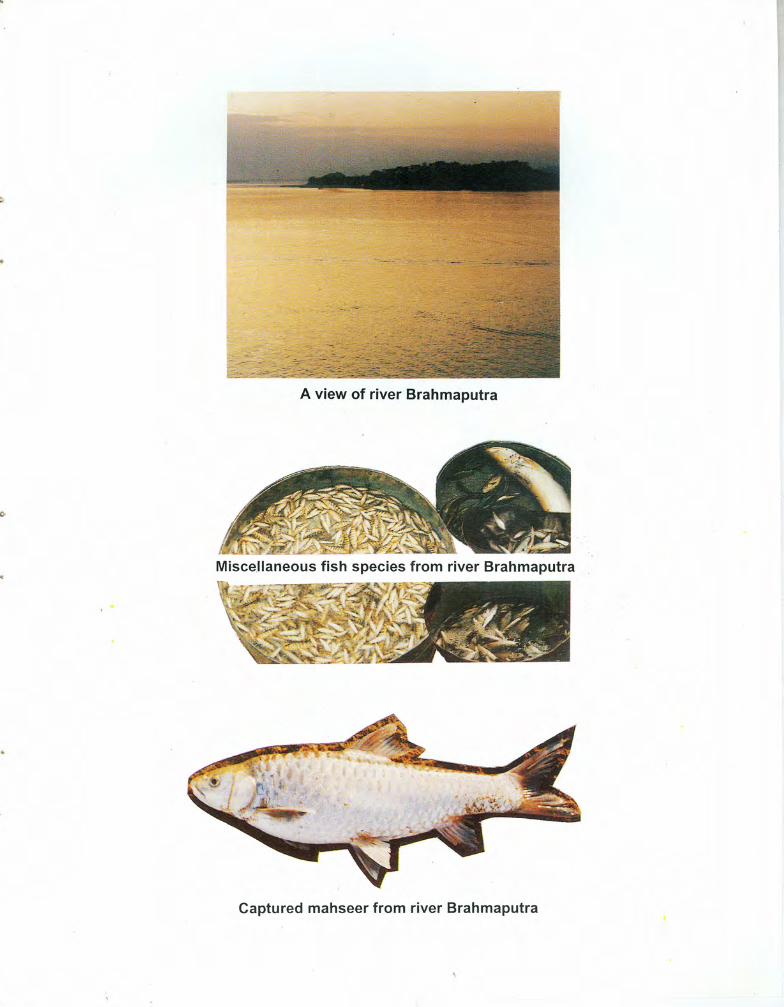
A view of river Brahmaputra
Captured mahseer from river Brahmaputra

(c) Jorhat
surprising that the catch structure of Brahmaputra at Saidiya which is dominated by thespecies like Tor putitotra, Neolisocheilus hexagonolepis and L.dero has shown acomplete qualitative shift in the stretch at Dibrugarh where these species disappeared andin the stretch at Dibrugarh where these species disappeared and replaced by normalfishery of major carps, minor carps, catfishes and feather backs. The fish landings atDibrugarh market also include substantial contribution from river Burhidihing, one of themost productive tributary of south bank L.rohita is the dominant species among majorcarps in this stretch while the catfish is dominated by M.seenghala and W.attu.
The average daily landing at Jorhat centre (including both Neematighat andmarket) is 123 kg day" mainly represented by miscellaneous species (51.5%) followedby major carps (20.2%) catfishes (10.9%), featherbacks (9.0%). a few mahseer specieshave also been recorded on some occasions but their contribution in the total catch is only1%. Catla catla is the dominant major carp species in this stretch while catfish isdominated by M aor.
(d) Biswanathghat
f
The fish landing from river at Biswanath-Chariali market is on average 103.7 kgday" represented 'mainly by miscellaneous species (44.8%) followed by major carps(20.3%), catfishes (19.4%), featherbacks (9.2%) and minor carps (5.1 %). C.catla andL.rohita are the dominant major carps species while catfish is' represented byMseenghala and M.aor. a few species of cold water have also been recorded from themarket (1.2% in the total catch) may be from the nearby tributary Jiabharali.
(e) Tezpur
The average daily fish landing from Brahmaputra at Tezpur is 93.2 kg day"mainly dominated by miscellaneous species (52.4%) followed by catfishes (18.2%),major carps (11.5%), featherbacks (10.1 %). prawn (3.2%) and minor carps (3%), M.aorand Wattu are the dominant catfishes in this stretch ,while major carps is mainlyrepresented by L.calbasu and C.catla. Some cold water and mahseer species have alsobeen recorded in the market probably from R.liabharali but their contribution in .the totalcatch is only 1.6%.
35

(f) Guwahati
The fish landing from Uzain Bazar landing centre at Guwahati is on average 198.7kg day" mainly represented by miscellaneous sp.·(52%) followed by minor carps (16.4%)major carps (15.2%), catfishes (8)%), featherbacks (4%) and prawn (0.7%). hilsa whichis completely absent between Saidiya upto Tezpur has shown its presence in this stretchof the river with a contribution of 3% in the total catch. The dominant species present inthis centre are L.rohita, C.catla, L.calbasu, C.reba and Wxutu.
. . . ~ - .......•. . ..•...-. .
(g) Goalpgra
The average fish landing in the Goalpara market is 53.8 kg day" mainlycomprised of miscellaneous species (53.8%) followed by major carps (2-0.5%) catfishes(10.1%) prawn (6.4%), minor carps (4%), featherbacks (3.4%) and hilsa (1.8%). L.rohitaand C.catla are the dominant carps in this stretch while catfishes are represented byM.aor and W.attu.
(h) Dhubri
The average daily fish landings recorded in this landing centre, the lowest stretchof the river, is 120.2 kg day" which is mainly contributed by miscellaneous species(59.4%) followed by catfishes (15.8%), major carps (14.2%), featherbacks (3.4%), hilsa(3.4%), prawn (2.3%) and minor carps (1.5%), catfishes are mainly dominated by M.aorand M.seenghala while major carps by L.rohita and C.catla.
It is apparent from the fish landing patterns at various landing centres that riverBrahmaputra shows considerable interstretch variations both in respect of quality andquantity. The main river Siang and its other two components Dibang and Lohitthroughout their stretch in Arunachal Pradesh are dominated by Mahseer species Torputitora and Neolisocheilus hexagonolepis trout Schizothorax richardsoni and other coldwater species L.dero and L.dyocheilus and the average catch of these species is around57.7 to 91.4 kg day" from the three rivers. At the confluence point of the three riversnear Saidiya although the percentage contribution of these species has gone down to68.6% they still represent the main fishery of the stretch. Miscellaneous species formed19.8% ofthe catches while catfish which ar completely absent in the three rivers, havebeen recorded in this region with a contribution of 11.6% in the total catch. BelowSaidiya in the stretch at Dibrugarh the above mentioned cold water and Mahseer species
(i) Qualitative variations in the fisheries
36
have disappeared completely and they are replaced by major carps, catfishes,featherbacks and minor carps. The miscellaneous and trace fishes, which contributed19.8% of the catches at Saidiya have increased to 57.0% at Dibrugarh. A few specimenof mahseer and coldwater fishes have been recorded between Dibrugarh to Tezpur buttheir contribution is almost negligible in the total catch (1.0 to 1.6%). although thequalitative picture of fishes is similar in the stretches between Dibrugarh down uptoDhubri, with an overall domination of miscellaneous species in the commercial catches,but the percentage contribution of various groups in different stretches have shownconsiderable variations. Even the contribution of miscellaneous and trace fishes, whichare dominant through out the stretch, have shown consideable variation being minimumin Biswanathghat (44.8%) and maximum in Dhubri (59.4%). The contribution of majorcarps is almost similar at Dibrugarh, Jorhat, Biswanathghat and Goalpara (20.2 to 21.9%)but they have shown decline at Tezpur (11.5%), Guwahati (15.2%) and Dhubri (14.2%).Minor carps are dominant only in Guwahati (16.4%) while in other 'places theircontribution is comparatively much lower. The percentage contribution of catfishes aremaximum in the stretch betwee Biswanathghat and Tezpur (18.2 to 19.4%}while in other
" "
stretches they are in the range of 8.7 to 15.8% being minimum in Guwahati (8.7%).featherbacks are comparatively similar in Jorhat to Tezpur (9.0 to 10.1%) while in otherplaces their contribution is much lower. Hilsa which is completely absent in the upperstretches between Saidiya to Tezpur has appeared in Guwahati and continued uptoDhubri, although the contribution in total catch is only 1.8 to 3.4%.
A part from qualitative variations between the stretches the fish yield has alsoshown considerable quantitative distribution being minimum in Goalpara and maximumin Guwahati (67.0 kg ka-I and 198.7 kg day" respectively). .
Fisheries of important tributaries of River Brahmaputra
Fishery in some of the major tributaries in the North bank like Jiabharali,Subansiri, Manas etc. have shown very interesting features. These tributaries are famousfor mahseer angling and are good attraction for tourists. In fact 80 to 90% of the totalcatches from the upper stretches of these tributaries are represented by species like Tor.putitora, Neolisochilus hexagonolepis, L.dero and L.dyocheilus. but interestingly the fishlanding from the down stretches of the above tributaries towards their confluence withBrahmaputra have not shown any contribution by the above mentioned species andalmost entire catch is mainly comprised of catfishes major carps, minor carps,miscellaneous species and prawn.
37'

North bank tributaries
(i) Subansiri
One of the most important tributary of North bank R.Subansiri supports a rich fishfauna. The average fish landings from upper stretch of the river in Gogamukh, Dhemajiand N. Lakhimpur markets are 40 to 60 kg day". Fishes are mainly represented by Torputitora, Ldero, L.dyocheilus and Barilius sp. Peak fishing season is October toDecember extended even upto February. The fish landing from the down stretch at Jorhatcentre is on average 50 to 200 kg day'! mainly comprised of Lcalbasu, M.seenghala,Wiattu, M.aor, Pisarana. L.gonius and prawn. The fishes dominant in the upper stretchhave not been recorded in the down stretch good amount of miscellaneous species likeAspidoparia sp., Botia sp. have also been recorded in the total catch.
(ii) Jiabharali
It is one of the most important cold water stream of the state known for its annualangling competition in the Balipara forest range. Important cold water fishes recordedare Neolisochilus hexagonolepis, Tor putitora, Tor tor, L.dero, Barilius sp. The average
. fish landing at Tezpur and Biswanath Chariali markets is 30 to 50 kg day". The catch ismaximum during winter when cold water fishes migrate down stream from ArunachalPradesh (October-December), These fishes have not been encountered in the downstretch towards meeting point ofR.Brahmaputra.
(iii} River Burgang
A tributary with swift current and sandy belt is a good source of coldwater fishesTor tor, L.dero and Barilius sp. Other species encountered in the down stretch of theriver towards meeting point are Wxutu, L.bata and Aspidoparia sp. Peak fishing seasonis post monsoon and earlier winter (September-November).
(iv) Buroi
It is large and deeper than Burgang and supports rich fishery. Important speciesavailable in the commercial catches are Labeo dero (av.catch size 1-3 kg). Tor tor, Torputitora and Barilius sp. A good quantity of catfishes Wiattu and M.seenghalafeatherback N.chitala and miscellaneou sp. Aspidoparia are also caught fish yield is moreduring winter months (November-February) when cold water fishes migrate downstream.
38

(vi) Manas
(v) Dikrong and Ranganoi
These rivers are shallow with fast current and are characterised with low waterI
temperature. They support poor fishery of cold water species. The fish catch is moreduring winter months.
The fishery of river Manas has been reported to be rich in the upper stretch havingmain representation of Mahseer species. Earlier records show that when angling wasdone in the upper stretches almost 100 kg of mahseer mainly Tor putitora andNeolisochilus hexagonolepis were caught. Although a few big' specimen of Mahseer areoften caught but the main fishery in the lower stretch are major carps, catfishes andmiscellaneous species.
South bank tributaries
(i) Noadihing
It is the larger portion of Dihing river, shallow wide having fast current. Octoberto December are the peak fishing seasons in the river and the main nets used areincircling dip nets etc. Important commercial species available in the total catch are coldwater fishes Lidyocheilus, L.dero, Tor tor, Barilius sp. Other species encountered areLgonius. L.rohita, Cmrigala and small catfish Micavasius although the contribution ofthese species in the total catch is of less order.
(ii) Burhidihing
The river was once deep with large volume of water and fast current but afterdivision into two parts old (Burhi) and new (Noa) a few years back the river has becomecomparatively shallower with lesser flow rate. It supports good fishery and large portionof the fish landing in Dibrugarh market is contributed by fishes from this river. Thedominant species in the catches are L.rohita and Cmrigala among carps, M.seenghalaand Wattu among catfishes, N.chitala among feather backs and some miscellaneous andtrace fishes. October to December is the peak fishing months.
39

t
(iii) Dikhow (near Dikhowmukh)
The main fishery of the river are Wiattu, Mseenghala, B.bagarius, Rita rita (thelast two being available near the confluence pointwith Brahmaputra),' Ccatla, L.rohita,Cmrigala among carps, L.bata among minor carp, N.chitala among featherbacks andAspidoparia sp., A.mola etc. among miscellaneous species. During peak fishing seasonupto 150 to 200 kg day" are caught using large encircling nets, small hand operated pushnets, etc.
(iv) River Disang
This river is comparatively less .productive than Dikhow. The fish landing fromthe river mainly comprised of small miscellaneous species Puntius and Aspidoparia sp.The major carps L.rohita and Cmrigala and catfishes Mseenghala and M.aor andfeatherback N. chitala are also caught but their contribution is not much in the totalcatches.
(v) River Kulsi
Fish production from this river is of low order peak fishing seasons are fromOctober to December and nets in operation are largely castnets, chinese dipnets and smallmesh size gill nets all in the marginal areas. The fishes caught are mainly minor carpsand miscellaneous species Creba, Puntius ticto, Colisafaciatus, A.mola etc.
(vi) Singra
It may be considered to be a tributary of R.Kulsi as the two rivers join few kmdownstretch from Singra Bazar. Nets in operation are similar to that of Kulsi and thefishes generally caught are Puntius ticto, P.sophor, Channa punctatus, A.mola, Anabastestudineus, Creba etc. Biger fishes like Wiattu, Channa striatus (snake head) are alsocaught during September to November when wate rlevel and flow receeds.
(vii) Dudhnoi
The river joins R.Krishnoi some 15 km down stretch from Dudhnoi market. Thefish production from Dudhnoi is very poor mainly comprised of miscellaneous tracefishes.
40
ii

(viii) Krishnoi
The river is comparatively rich in fisheries and the atch is mainly represented byPuntius sp. Channa punctatus, Wiattu, L.rohita and some miscellaneous species.
Two types of fishery 'in some tributaries
Fisheries in some of the tributaries specially in the North bank ego SubansiriJiabharali, Manas, etc. have shown very interesting pattern, the upper stretch beingrepresented by Mahseer species Tor putitora and Neolisocheilus hexagonolepis and coldwater species L.dero and L.dyocheilus where as the down stretch towards the confluenceof Brahmaputra is represented by major carps, minor carps, catfishes" prawn andmiscellaneous species: The existence of two type of fishery in the same ecosystemclearly indicate the presence of some kind of natural barrier which is preventing one setof fishes in migrating from one stretch to other. There are probably two type ofpossibilities (i) the water tempeature of these tributaries are comparatively much lower inthe upper stretches than the down stretch as well as the main river. The difference in thewater temperature may be working as a thermal barrier and not allowing the cold waterfishes to enter the higher temperature zone (ii) the water quality parameters of tributarieslike alkalinity, conductance dissolved solids, hardness etc. are totally different from riverBrahmaputra e.g. Jiabharali has comparatively much lower values of the aboveparameters than the main river similarly Manas has much higher values thanBrahmaputra. The drastic difference in the water quality parameters in the two systemsmay be aeting as a density barrier in preventing one set of fishes to migrate and cross thenatural barrier.
Brahmaputra "Past & Present"
(i) Waterquality
The water quality parameters in respect of pH, dissolved oxygen, total alkalinity,sp.conductance, dissolved solids, calcium, hardness and nutrients have not shown anysignificant variation over the years. However, a declining trend has been observed inrespect of clarity of water over the years the. water transparency which was as high as 150ern during 1974-77 (Anon 1974 to 1979) has been reduced to 30-40 ern during 1997-98.The reduction in transparency is a clear example of increasing silt load in the system. Itneeds to be mentioned that tributaries play key role in maintaining the annual waterquality cycle of the main river and increase in turbidity over the gears is obvious as hugequantity of silt is discharged into Brahmaputra by these tributaries year after year. No
41

Table 17 : Qualitative shift in the fisheries of river Brahmaputra over the years
~F\.)
Groups Tezpur Guwahati Dhubri Av. For the stretch Trends of(Tezpur-Dhubri) variation
1974-77 1996-98 1973-79 1996-98 1~74-77 1996-98 1973-79 1996-98
Major carps (%) 21.03 11.5 18.66 15.2 18.41 14.2 19.4 13.6 Decline by 30%
Minor carps (%) 15.65 3.0 14.56 16.4 12.2J 1.5 14.1 7.0 Decline by 50%
Catfishes (%) 26.08 18.2 21.09 8.7 24.11 15.8 23.76 14.2 Decline by 40%
Featherbacks (%) 4.18 10.1 4.2 4.0 2.32 3.4 3.6 5.8 Increase by 61%
HiIsa (%) 4.42 0.0 13.74 3.0 15.51 3.4 11.2 2.1 Decline by 81%
Prawn (%) 3.86 3.2 3.74 0.7 7.4 2.3 5.0 2.1 Decline by 58%
Misc. & others 24.87 52.4 23.01 52.0 20.02 59.4 22.9 55.2 Increase by 141%
Av. Catch (kg day") 137.45 93.2 302.85,- 198.7 150.48 120.2 196.93 137.34 Decline by 30%
,., .•

100%
90%
80%
70%
60%.j>.w
50%
40%
30%
20%
10%
0% c
" -; " "~~
1974-77Tezpur
..
;, ;. ;. ;.~~~..;
1:3:~~{~::,./..2'./v""
"~,:i:i:~:,/,.t'./'''!-"
3:),::3.:3::"/'/"././"
i:~:~~~i..2...)"/'/,
:~':3:'i:~:.:z3'x.....
-t--
1996-98
•
Fisheries (%) of river Brahmaputra
1973-79Guwahati
'',0'0'0'~
1996-98 1974-77Dhubri
1996-98
••
IIPrawns '
CJFeather backs
r:JHilsa
COthers
oCatfishes
15Minor carps
•• Major carps

(ii) Qualitative shift in the fisheries structure
signifiant variation in wate quality parameters over the years clearly indicate that therehas been practically no qualitative degradation in the tributaries or the river as a whole sofar as water quality is concerned. The role of tributaries on the water quality ofBrahmaputra can be seen by the inter-stretch variations. The impact of Digharu andKondil on Lohit upto Saidiya, Dibang and Siang in Dibrugarh, Jiabharali in Tezpur,Manas in Goalpara, Gaurang Tipkai and Gadadhar in Dhubri are clear examples. Thetrend of variation in the water quality parameters in the above stretches are repeated everyyear. As the water quality of the tributaries joining various stretches of Brahmaputrahave maintained a constant annual cycle the water quality of the main river has not shownmuch variations.
The qualitative variations in the fisheries of river Brahmaputra over the years inthe stretch at Tezpur, Guwahati and Dhubri have been shown in Table 17 (Fig. 4). AtTezpur during 1974-77 the fishery was mainly represented by major carps (21.03%)catfishes (26.08%) and minor carps (15.65%), the three together contributing almost62.7% of the total population. Featherbacks and prawn Were 4.18 and 3.86%respectively. Hilsa, which was absent in the upper stretches contributed 4.42% of thetotal fishery. The contribution of miscellaneous species was only 24.87 of the total catchof 137.45 kg day" (average of 4 years). But with the passes of time the complexion haschanged and after nearly two decades during ·1996-98 the major carps have declined to11.5%, minor carps to 3.0% and catfishes 18.2%, the three together contribution only32.7% against 62.7% during 1974-77. Although there has been some improvement infeatherback (l 0.01 %) but Hilsa has disappeared completely. On the other handmiscellaneous and trace fishes have shown a dramatic increase to 52.4% against 24.78%observed during 1974-77. There has been considerable decline in the fish yield andaverage yield observed during three seasons is 93.2 kg day" against 137.45 kg day 1
during) 974- 77.
In Guwahati during 1973-79 major carps contributed 18.660/0 minor carps14.56%, catfishes 21.09% and thus the three groups put together were 54.3% of the totalcatch. The contribution of hilsa was substantial almost 13.74% of the catch whilemiscellaneous and trace fishes were 24.01% of the total landing of 302.85 kg day"(average of seven years in the two landing centres) observations during 1996-98 hasshown considerable change in the catch structure with catfishes going down to 8.7% andmajor carps 15.2% against 18.66% and 14.56% observed during 1973-79. Hilsa fishery
44

which represented 13.74% has gone down to 3.0% but miscellaneous and trace fisheshave shown a dramatic increase to 52.0% of the total catch. The total fish lanidng hasalso show considerable decline over the years and the averge landing recorded during1996-98 is 198.7 kg day" against 302.87 observed during 1973-79.
The stretch Dhubri has shown more or less similar trend to that of Tezpur. During1974-77 the catches at Dhubri were dominated by catfishes (24.11 %) major carps(18.41%) and minor carps (12.23%), the three groups put together contributing almost54.75% of the total catch. Hilsa fishery was also of high order contributing 15.51% whilethe. contribution of miscellaneous species was only 20.02%. The average catch during theyears was 150.48 kg day". But during 1996-98 the catch structure has shownconsiderable change with minor carps going down to 1.5%, hilsa 3.4%, major carps14.2% and catfishes 15.8%. major carps, minor carps and catfishes put togethercontributed 3l.5% of the total against 54.75% observed two decades back. Like in otherstretches the miscellaneous and trace fishes have shown a dramatic increase forming59.4% of the total. The average yield in the stretch has also shown a declining trend overthe years 150.48 during 1974-77 to 120.2 kg day" during 1996-98.
A comparison of the entire stretch between Tezpur and Dhubri has shown some'interesting pattern. During 1973-79 the contribution of major carps, minor carps andcatfishes in the total catch were 19.4%, 14.1% and 23.70% respectively, the three puttogether contributing 57.26%. The average yield of hilsa was 11.2% and miscellaneousspecies 22.9%. With passes of time their percentage contribution has shown drasticchange, the major carps going down to 13.6% minor carps 7%, catfishes 14.2% and hilsa2.1% on the contrary the miscellaneous and trace fishes have increased to 55.2%. thusmajor carps have shown a decline 30%, minor carps by 50%, catfishes by 40% and hilsaby 81%. Surprisingly miscellaneous and trace fishes have shown an over all increase by141%. The average fish-yield has also shown a decline from 196.93 kg day-I during1973-79 to 137.34 kg day" during 1996-98, an overall reduction by 30%. Observationsin other stretches have also shown considerable increase in the percentage contribution ofmiscellaneous and trace fishes which contributed almost 57% of the total catch atDibrugarh, 51.5% at Jorhat 44.8% at Biswanathghat and 53.8% at Goalpara. It can thusbe concluded that there is a dramatic shift in the fisheries towards miscellaneous speciesand trace fishes throughout the stretch of river Brahmaputra over the years.
The qualitative shift in the fisheries is bound to have great bearing on the fishproduction of the river as most of the available potential energy is utili sed bymiscellaneous and trace fishes.
45
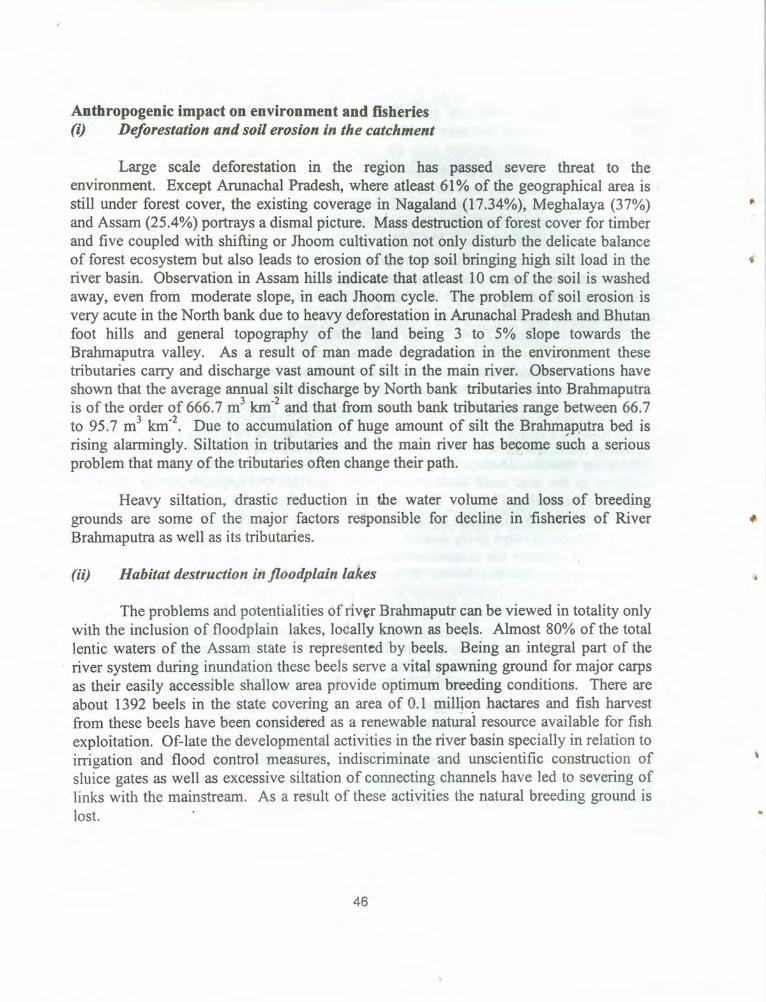
,
Anthropogenic impact on environment and fisheries(i) Deforestation and soil erosion in the catchment
Large scale deforestation in the region has passed severe threat to theenvironment. Except Arunachal Pradesh, where atleast 61% of the geographical area isstill under forest cover, the existing coverage in Nagaland (17.34%), Meghalaya (37%)and Assam (25.4%) portrays a dismal picture. Mass destruction of forest cover for timberand five coupled with shifting or Jhoom cultivation not only disturb the delicate balanceof forest ecosystem but also leads to erosion of the top soil bringing high silt load in theriver basin. Observation in Assam hills indicate that atleast 10 em of the soil is washedaway, even from moderate slope, in each Jhoom cycle. The problem of soil erosion isvery acute in the North bank due to heavy deforestation in Arunachal Pradesh and Bhutanfoot hills and general topography of the land being 3 to 5% slope towards theBrahmaputra valley. As a result of man made degradation in the environment thesetributaries carry and discharge vast amount of silt in the main river. Observations haveshown that the average annual silt discharge by North bank tributaries into Brahmaputrais of the order of 666.7 m3km-2 and that from south bank tributaries range between 66.7to 95.7 m3 km-2• Due to accumulation of huge amount of silt the Brahmaputra bed isrising alarmingly. Siltation in tributaries and the main river has become such a seriousproblem that many of the tributaries often change their path.
(ii) Habitat destruction in floodplain lakes
Heavy siltation, drastic reduction in the water volume and loss of breedinggrounds are some of the major factors responsible for decline in fisheries of RiverBrahmaputra as well as its tributaries.
The problems and potentialities of river Brahmaputr can be viewed in totality onlywith the inclusion of floodplain lakes, locally known as beels. Almost 80% of the totallentic waters of the Assam state is represented by .beels. Being an integral part of the
. river system during inundation these beels serve a vital spawning ground for major carpsas their easily accessible shallow area provide optimum breeding conditions. There areabout 1392 beels in the state covering an area of 0.1 million hactares and fish harvestfrom these beels have been considered as a renewable natural resource available for fishexploitation. Of-late the developmental activities in the river basin specially in relation toirrigation and flood control measures, indiscriminate and unscientific construction ofsluice gates as well as excessive siltation of connecting channels have led to severing oflinks with the mainstream. As a result of these activities the natural breeding ground islost.
46

Oii) Mass destructionofjuveniles
Heavy exploitation of spawners (Ujaimara fishing) during breeding season andsubsequent fishing of juveniles does the maximum damage to the natural recruitmentprocess. The landing pattern have shown maximum fish catch from the river duringSeptember-October (almost 60% of the annual catch). Maximum catch recorded duringthese months is due to large scale fishing of carp juveniles (70 to 80%). Mass destructionof juveniles results in failure of natural recruitment of the quality fishes which ultimatelyleads to decline in the overall fishery of the river.
Conclusion
Tributaries of River Brahmaputra posses distinct ecological status and play keyrole in maintaining the annual water quality and production potential of the main river.Practically no change in water quality parameters ove rthe years, clearly reflected thehealthy condition of the tributaries and the system as a whole. Brahmaputra along withits tributaries has a very high production potential but man made environmentalmodifications, like destruction of forest cover in the catchment and subsequent influx ofsilt .load, large scale killing of fishes in using explosive materials, mass destruction ofjuveniles and habitat destruction in floodplains etc have done great damage to the fisheryof the system. There is thus an urgent need to protect the environment before it goesbeyond repair. .
References
Anon 1974 to 1979. Annual Report. Central Inland Fisheires Research InstituteBarrackpore.
Anon, 1986-87 to 1995-96. Annual Report. Central Inland Fisheires Research InstituteBarrackpore.
Yadav, Y.S. and V.V. Sugunan,1992. Factors relating to decline of fisheries in the RiverBrahmaputra. Bulletin No. 60. Annual Report. Central Inland Fisheires ResearchInstitute Barrackpore. (19 p.)
Pathak, V. and A. Sarkar, 1997. Impact of trans-Himalayan tributaries on the waterquality of River Brahmaputra. In Changing prospectives of Inland Fisheries Proc.National Seminar March 16-17, Inland Fisheries Society ofIndia, 71-76.
47

EXECUTIVE SUMMARY
1. Ecological status, production potential and fishery resources of forerunners. Siang, Dibangand Lohit of Brahmaputra, 8 different stretches of main river Brahmaputra between Saidiyaand Dhubri, 25 tributaries on the North bank and 16 on the South bank were studied.
2. Sediment from the entire system was dominated by sand (78.5 to 99.5%) having poororganic carbon and available nutrient and near neutral to slightly acidic pH with fewexceptions.
3. Remarkable variation was observed in respect of water quality parameters viz., alkalinity,conductance, dissolved solids, calcium, magnesium and hardness among the tributaries ofthe North bank, all being exceptionaly low in Ranganoi (23.5 rnql" 52.6 mmhos, 26.6 rnql',6.4 mgr1 and 3.0 mgr1 respectively) and exceptionaly high in Manas (207.77 rnq!", 345.5urnhos, 173.8 rnql-", 25.7 rnql", 22.01 mgr' and 155.8 rnql", respectively).
4. The South bank tributaries as well as the three forerunners of Brahmaputra also showedconsiderable variations in alkalinity conductance, dissolved solids and hardness.
5. The diverse hydrological set-up of various tributaries have great bearing on the waterquality of the main Brahmaputra, which also showed considerable variations between thestretches. The impact was more evidenced at Tezpur and Goalpara (Jogighopa) wherethe tributaries JiaBharali and Manas have completely changed the water quality ofBrahmaputra and the impact could be seen upto a long distance.
6. Though the water quality of Brahmaputra has not shown much variations due to healthyconditions of its tributaries, the clarity of water has reduced sharply over the years.Thereby showing constant increase of silt load in the river.
7. The biotic set-up of the system showed considerable variations both in respect of qualityand quantity. While many of the tributaries have shown dominance of diatoms amongphytoplankters, some of them showed higher concentration of chlorphyceae. Even in themain Branmaputra, the upper stretches including the forerunners Siang, Dibang and Lohitwere dominated by diatoms, the down stretch showed dominance of chlorophyceae. Inrespect of benthic organisms, mollusc remained the dominant component ub nabttributaries as well as the main Brahmaputra, while Siang, Dibang, Lohit, Subansiri and JiaBharali showed dominance of chironomids. Insect dominated in Noadihing, Dibru andBurhidihing.
8. The efficiency of energy transformation by producers wason average 0.095% of light inSiang, Dibang and Lohit, 0.145% in the main Brahmaputra and 0.137% in the five.tributaries where the studies could be made.
9. The fish production potential of the three forerunners, river Brahmaputra and five tributarieswere estimated at 59.0,92.32 and 86.8 kg na', respectively. Showing high potentialenergy resource of the system as a whole.
48

10. The fishery of Siang, Dibang and Lohit as well as some of the tributaries like Subansiri, JiaBharali etc. were dominated by Mahseer species Tor putitora, Neolisocheilushexagonolepis, snow trout Schizothorax richardsoni and coldwater species L.dero andL.dyocheilus, while these species were completely absent in the main Brahmaputra except
.at Saidiya the confluence point of the forerunners.
11. The fishery of the main river was dominated by miscellaneous species (53.1%) followed bymajor carps (17.7%) catfishes (13.6%), featherbacks (6.9%) and minor carps (5.4%). Theaverage catch in the entire stretch being 113.7 kg day".
12. There has been considercble variations in the catch composition over the years: Majorcarps, minor carps and catfishes showed considerable decline with marked increase inmiscellaneous species. The change in the fishery structure has also affected the fish yieldfrom the river.
13. There has been considerable decline in the actual fish yield from the river during last twodecades.
14. The probable reasons for the decline in fish production may be attributed to heavy siltation,loss of breeding and nursery grounds due to changing course of tributaries, failure ofrecruitment, habitat destruction in floodplains, mass destruction of juveniles besidesnatural change in catch structure.
********
49