ecology and bioindicator potential of benthic...
TRANSCRIPT

Ecology and bioindicator potential of benthic macroinvertebrates in a Mediterranean salt
wedge estuary: the Ebro River case
Alfonso Nebra Costas
Aquesta tesi doctoral està subjecta a la llicència Reconeixement- NoComercial – SenseObraDerivada 3.0. Espanya de Creative Commons. Esta tesis doctoral está sujeta a la licencia Reconocimiento - NoComercial – SinObraDerivada 3.0. España de Creative Commons. This doctoral thesis is licensed under the Creative Commons Attribution-NonCommercial-NoDerivs 3.0. Spain License.


Universidad de Barcelona
Departamento de Ecología
Instituto de Investigación y Tecnología Agroalimentarias
Programa de Ecosistemas Acuáticos
Centro Sant Carles de la Ràpita
Ecology and bioindicator potential of benthic
macroinvertebrates in a Mediterranean salt wedge
estuary: the Ebro River case
Ecología de los macroinvertebrados bentónicos y su potencial como
bioindicador en un estuario meditarráneo de cuña salina: el caso del río Ebro
TESIS DOCTORAL
Alfonso Nebra Costas

TESIS DOCTORAL
Facultad de Biología
Departamento de Ecología Programa de doctorado: Ecología Fundamental y Aplicada
Ecology and bioindicator potential of benthic macroinvertebrates in a Mediterranean salt wedge
estuary: the Ebro River case
Ecología de los macroinvertebrados bentónicos y su potencial como bioindicador en un estuario meditarráneo de cuña salina: el caso del río Ebro
Memoria presentada por
Alfonso Nebra Costas Para optar al grado de
Doctor por la Universidad de Barcelona
Barcelona, Noviembre de 2015
Visto bueno de los directores
Dr. Carles Ibáñez i Martí Coordinador del Programa de Ecosistemas Acuáticos-IRTA
Dr. Nuno Caiola Investigador del Programa de Ecosistemas Acuáticos-IRTA
Visto bueno del tutor de tesis
Dr. Narcís Prat i Fornells
Catedrático del Departamento de Ecología Universitat de Barcelona


A mi abuela


i
AGRADECIMIENTOS
Esta parte de la tesis puede parecer la que menos importancia tiene, aunque sea la
que todo el mundo se va a leer sobre todo los que no les gustan los ‘bichos’ ;-);
pero al redactarla me he dado cuenta de que sin vuestra ayuda esta tesis no se hubiese
realizado nunca y por ello os estaré siempre agradecido. Son muchas las personas
que a lo largo de los últimos años me han apoyado, han estado a mi lado
incondicionalmente, que han compartido sus conocimientos conmigo y en definitiva
han puesto su grano de arena para que esta tesis llegue a buen término.
A mis directores, Carles y Nuno, aún recuerdo la llamada para incorporarme al
equipo de la UEA, esa llamada supuso poder seguir trabajando y hacer la tesis en lo
que más me gusta, los macroinvertebrados y la Limnología, gracias.
Gracias a mi director en la sombra, Carles Alcaraz, gracias por sus consejos, por
compartir sus conocimientos, por las clases avanzadas de estadística, por su amistad
y por los viernes ‘gastronómicos’.
Gracias a Isabel Muñoz por su asesoramiento y por estar siempre pendiente de
resolver cada una de las dudas que le planteaba; gracias también a Dani Boix y
Narcís Prat que con sus comentarios y sugerencias han contribuido a mejorar el
manuscrito final de esta tesis y con total seguridad la defensa de la misma.
A las dos personas responsables de mi primer contacto con los macroinvertebrados y
la Limnología, Isabel Pardo y Maruxa Álvarez. Gracias Isabel por confiar en mi
durante el período en que trabajamos juntos, por compartir tu experiencia y tu rigor
taxonómico; gracias Maruxa por los primeros Agapetus y por enseñarme a procesar
las muestras de la forma más rigurosa que me he encontrado nunca.

ii
Al resto de integrantes (de aquella época) del laboratorio de Limnoloxía de la
UVIGO, Cris, Lili, Mar y Sofía por hacerme sentir por primera vez parte de un
equipo, un equipo que se atrevía y podía con todo; quedan muy lejos los tiempos en
los que crecíamos juntos como biólogos pero no por ello estoy menos agradecido por
cada uno de los momentos vividos a su lado.
Al IRTA de Sant Carles de la Ràpita, en primer lugar por poner a mi disposición
todos los medios necesarios para la realización de esta tesis y en segundo lugar a
todos los trabajadores que forman parte de este centro. Gracias a todo el personal de
administración, de mantenimiento…(Lydia, David, Maite, Romina, Maripau, Rafel,
Xavi, Iván, David). A todas y cada una de las personas con las que compartí el día a
día durante estos años, becarios, técnicos, investigadores y demás personal del IRTA.
A David Mateu, Rosa Valmaña y Lluis Jornet, por compartir conmigo cada una de
las jornadas de campo de esta tesis, por la confianza y tranquilidad que sentía al salir
con ellos a campo y por la paciencia hasta que la draga hacía bien su trabajo!
A Carmen Reverté por conseguir cada una de las publicaciones que necesité para esta
tesis; aún alucino cuando recuerdo los sitios de donde me traía los libros.
A Marcos González-Porto por su ayuda con los poliquetos, un mundo nuevo para mí
por aquel entonces, hubiese sido imposible identificar ni un solo ejemplar sin tus
consejos y recomendaciones.
A Christelle Macaigne y Cristina Buendía por el tedioso trabajo de laboratorio y por
el triado de los macroinvertebrados de alguna de las muestras de esta tesis.
A Rafa Sánchez por cada una de las charlas que mantuvimos cuando compartíamos
despacho, un auténtico placer hablar con una persona que transmite sus
conocimientos de una manera tan humilde, sin pretensiones de ningún tipo.
A Cinta y Pili por las bromas de cada día, los chistes ingeniosos y por demostrarme
montones de veces que la juventud está en la mente.

iii
A todos los compañeros y amigos que han pasado en estos años por el Programa de
Ecosistemas Acuáticos del IRTA con lo que compartí despacho, campo, laboratorio,
fiestas… Andrea, Laia, Nuria, Rosa Andreu, Jon, Peter, Berta, Pep, Carmen, María
Ginesta, María Gil, Marta Coca, Esther Clavero, Albert Rovira, Albert Bertolero,
Rosa Trobajo, Patricia y Margarita.
A Gloria por ayudarme incondicionalmente siempre que lo he necesitado, por ser uno
de los mayores apoyos de mi vida, por su amistad y por todos los momentos vividos
a su lado.
A Turro, por TODO, por sus cenas, por su casa, por ayudarme siempre que estaba en
su mano, por saber que puedo contar con el para lo que quiera. A Silvia, por todos los
‘barras de bar vertederos de amor…’ por ser una compañera increíble, currante y
siempre con una sonrisa en la boca. A Nacho por todos sus consejos meditados, creo
que sin su opinión alguna decisión tomada no me habría salido tan bien. Gracias a
todos (Gloria, Turro, Silvia, Nacho, Carmen Reverté, Rosa Valmaña, Carles, María,
Mireia) por las juergas, las paellas, las calçotadas, la Foradada y todos los momentos
vividos fuera del curro, me lo he pasado teta, gracias por vuestra amistad!
A los cimerianos, que me han acompañado en los últimos tiempos, Cris C, Cris P,
Esther, Ethel, Juan, Mikel y Chema, ha sido la leche currar con ellos, gracias a su
apoyo ha sido todo más fácil. Espero que algún día la Limnología nos vuelve a juntar
por ahí, quién sabe? y si no, siempre nos quedará Madrid.
A Esther, por estar a mi lado incluso en los peores momentos, por meterse conmigo y
hacerme llorar de la risa, por tener una paciencia infinita, por animarme, por
corregirme el inglés y por dejarme formar parte de su vida.
Gracias a mi familia, en especial a mi madre que es la persona que más ha luchado
para que nunca me faltase de nada y para que yo pudiese llegar hasta aquí. A mis
hermanas Geles, So y Vane, por ayudarme siempre que lo he necesitado, por crecer a
vuestro lado y por darme a los mejores sobrinos del mundo, mis pichoquiños:

iv
Dieguito, Sarita, Xianiña, Emmita, Samu y Adri, me hacéis reír todos los días! A
Jose, Gayoso y Lester a pesar de ser ‘cuñados’ sois buena gente!; a tía Lola por
cuidarme de peque y porque siempre tiene un detalle conmigo. Gracias a todos, os
quiero.
A la educación pública, sin la cual me hubiese sido imposible llegar hasta aquí y a
cada una de las personas que lucharon, luchan y lucharán por la educación para
todos.
Redactando esta parte del manuscrito he sido realmente consciente de cuanta gente
ha participado y colaborado en esta tesis, por lo tanto esta tesis es tanto mía como
vuestra. Una vez más gracias a todos.
Este estudio ha sido financiado por la Agencia Catalana del Agua.
Bouzas, noviembre de 2015

v
CONTENTS
1 Director’s report ................................................................................................ 1
2 General introduction ......................................................................................... 5
2.1 Estuaries: Definition and Classification ................................................... 5
2.2 Estuaries: relevance, benefits and anthropogenic pressures concern ..... 15
2.3 Aquatic macroinvertebrates: definition, ecology and indicator potential 19
2.4. Study context: the Ebro Delta-Estuary complex ................................... 22
2.5. Thesis justification ................................................................................. 25
2.6. References ............................................................................................. 27
3 Objectives ......................................................................................................... 41
4 Chapters ........................................................................................................... 45
Chapter I ............................................................................................................. 47
Community structure of benthic macroinvertebrates inhabiting a highly
stratified Mediterranean estuary.
Nebra A, Caiola N, Ibáñez C. Scientia Marina (2011) 75(3): 577-584.
Chapter II ........................................................................................................... 81
Benthic macrofaunal dynamics and environmental stress, across a riverine-
marine boundary, in a salt wedge Mediterranean estuary.
Nebra A, Caiola N, Alcaraz C, Muñoz-Camarillo G, Ibáñez C. (Submitted to
Marine Environmental Research).
vi
Chapter III ........................................................................................................ 117
Towards a suitable ecological status assessment of highly stratified
Mediterranean estuaries: A comparison of benthic invertebrate fauna indices.
Nebra A, Caiola N, Muñoz-Camarillo G, Rodríguez-Climent S, Ibáñez C.
Ecological Indicators (2014) 46:177-187.
5 General discussion ......................................................................................... 157
5.1 Recent changes on estuary environmental condition and its influence on the benthic macroinvertebrate community ................................................. 157
5.2 Estuarine macrofaunal trends across a stressful riverine-marine boundary .................................................................................................................... 161
5.3 Assessing the anthropogenic pressures on the Ebro Estuary and the potential of macroinvertebrates as bioindicators in estuarine environments. .................................................................................................................... 165
5.4. References ........................................................................................... 172
6 Conclusions .................................................................................................... 181
7 Appendix (original publications) ................................................................. 185

vii
LIST OF TABLES
2 General introduction ......................................................................................... 5
Table 2.1. Summary of estuaries classifications. .......................................... 14
Chapter I ............................................................................................................. 47
Table 1. Sediment characteristics and water physicochemical parameters (seasonal mean±standard deviation, n=4) in the two different stretches. TOM, total organic matter in sediment; Transp., transparency; DO, dissolved oxygen; Cond., conductivity; Sal., salinity; TDS, total dissolved salts; TSS, total suspended solids; OSS, organic suspended solids. ............................... 56
Table 2. Community descriptive parameters for each sampling station and season. N, total abundance per 0.14 m2; D, density (ind m-2); S, richness; H’(log2), Shannon-Wiener diversity index; d, Margalef index; 1-λ’, Simpson’s index; J’, Pielou’s evenness; DF (%), deposit feeders; G (%), grazers; O (%), omnivores; Pa (%), parasites; Pr (%), predators; SF (%), suspension feeders. See Figure 1 for sampling station codes. ...................... 59
Table 3. One-way ANOSIM test to compare the macroinvertebrate communities at different sampling stations. The test results are shown in the lower diagonal of the table. Significant differences between stations (P<0.05) are indicated (*). The R values are shown in bold letters in the upper diagonal of the table. See Figure 1 for sampling station codes. .................................. 60
APPENDIX 1. List of the identified taxa that were found at all the stations over the entire study period. The stations where each taxon was found are also listed. See Figure 1 for sampling station codes; FG, feeding guild (see Table 2 for feeding guild codes); CI, Constancy index; Ct, constant; VC, very common; C, common; UC, uncommon; R, rare. .................................. 72
viii
Chapter II ............................................................................................................ 81
APPENDIX 1. Water physic-chemical parameters (annual mean and standard deviation) and sediment characteristics of the 9 sampling stations. Cond., conductivity; TDS, total dissolved salts; DO, dissolved oxygen; TSS, total suspended solids; OSS, organic suspended solids TOM, total organic matter in sediment....................................................................................... 115
Chapter III ........................................................................................................ 117
Table 1. Biotic indices value ranges and ES boundaries used in this paper to estimate the sampling stations ES categories. ............................................ 127
Table 2. Water physic-chemical parameters (annual mean and standard deviation) and sediment characteristics of the 9 sampling stations. ........... 131
Table 3. Significant Spearman correlation coefficients among the BI scores, hydrological pressure expressed as the deviation of wedge occurrence probability and as deviation of permanence time from natural flow regime conditions, pollution pressure, environmental parameters and the community descriptive parameters (UE stretch n = 16; LE stretch n = 20). .................. 134
Table 4. Significant Spearman correlation coefficients among the UE Hydrological Pressure expressed as the deviation of wedge occurrence probability from probability in natural flow regime conditions, UE Pollution Pressure, community descriptive parameters and the individual metrics (n = 16). .............................................................................................................. 138
Table 5. Significant Spearman correlation coefficients among the LE Hydrological Pressure expressed as the deviation of wedge occurrence probability and as deviation of permanence time from natural flow regime conditions, LE Pollution Pressure and the individual metrics (n = 20). ..... 139
ix
LIST OF FIGURES
2 General introduction ......................................................................................... 5
Figure 2.1. Classification of estuaries based on geomorphological features (A-A’: cross-section area). ............................................................................. 8
Figure 2.2. Classification of estuaries based on the vertical structure of salinity (Cameron and Pritchard, 1963). ....................................................... 10
Figure 2.3. Estuarine classification diagram (redrawn from Hansen and Rattray, 1966) according to non-dimensional stratification and circulation parameters. Black dots represent examples of estuaries (label names omitted). ....................................................................................................... 12
Figure 2.4. Classification of estuaries based on water balance (redrawn from Valle-Levinson, 2010). ................................................................................. 13
Figure 2.5. Map showing the location of the study area, the Ebro estuary, in the context of the Iberian Peninsula and the Ebro River basin. .................... 23
Chapter I ............................................................................................................. 47
Figure 1. Location of the Ebro estuary and its deltaic plain showing the nine sampling stations. UE, upper estuary stations; LE, lower estuary stations; SW, position of the salt wedge tip. ............................................................... 52
Figure 2. Two dimensional MDS plots based on Bray-Curtis similarities of fourth-root transformed macroinvertebrate abundance data: (a) ordination using inter-species resemblance matrix of nine stations; (b) ordination of the nine stations sampled in the Ebro estuary. The dashed line and the solid line encircle the freshwater and marine communities respectively. See Figure 1 for sampling station codes. ........................................................................... 63

x
Chapter II ............................................................................................................ 81
Figure 1. Map showing the Ebro Estuary, its deltaic plain and the location of the nine sampling stations. UE, upper estuary stations; LE, lower estuary stations; SW, salt wedge tip’s position. ........................................................ 88
Figure 2. Principal component analysis of environmental variables for the nine sampling stations studied. Factor loadings of the variables (a), and sampling stations scores (b) for the first two principal components are shown. ........................................................................................................... 93
Figure 3. Richness and Density values for UE and LE stations recorded at each sampling occasion. ............................................................................... 94
Figure 4. Detrended correspondence analysis of the macrofauna abundance data for the nine stations studied. ................................................................. 95
Figure 5. Canonical correspondence analysis triplot of macrofauna abundance data and environmental variables assessed in the nine sampling stations studied. Environmental variables are represented by arrows, which length is proportional to variable importance and orientation represents their correlation with the axes. .............................................................................. 97
Figure 6. Canonical correspondence analysis of macroinvertebrate abundance data and environmental variables assessed for the riverine stations. a, CCA triplot; b, CCA biplot of environmental variables and macrofauna taxa data. ...................................................................................................................... 99
Figure 7. Canonical correspondence analysis of macroinvertebrate abundance data and environmental variables assessed for the marine stations. a, CCA triplot; b, CCA biplot of environmental variables and macrofauna taxa data .................................................................................................................... 100
Figure 8. Response curve of salinity with distance to river mouth. The curve is the generalized additive models (GAM) selected by the Akaike information criterion (AIC). SW, salt wedge tip. ....................................... 101
Figure 9. Response curves of UE taxa with distance to river mouth (the eight most representative taxa are shown). The curves are the generalized additive models selected by the Akaike information criterion (AIC). SW, salt wedge tip. ............................................................................................................... 102

xi
Figure 10. Response curves of LE taxa with distance to river mouth (the eight most representative taxa are shown). The curves are the generalized additive models selected by the Akaike information criterion (AIC). SW, salt wedge tip .................................................................................................... 103
Chapter III ........................................................................................................ 117
Figure 1. Map of the Ebro River basin and its delta showing the studied estuary with the position of the nine sampling stations. UE, upper estuary stations; LE, lower estuary stations; SW, null point position. .................... 125
Figure. 2. Community descriptive parameters (annual mean ± standard deviation bars, n = 4) recorded at each station. See Fig. 1 for sampling stations' codification. .................................................................................. 132
Figure. 3. Ecological status classification of UE and LE stations recorded at each sampling occasion after applying the four different BIs: IBMWP, M-AMBI, BENTIX and BOPA. See Fig. 1 for sampling stations' codification. .................................................................................................................... 137
5 General discussion ......................................................................................... 157
Figure 5.1. Ecological conceptual model for the assessment of the main pressures impairing the Ebro Delta-Estuary complex (modified from Vasconcelos et al., 2007) ............................................................................ 167
Figure 5.2. Almost any biological attribute can be measured, but only certain ones provide reliable information about biological condition and therefore for a suitable biological assessment (adapted from Karr and Chu, 1999). . 170

xiii
ABREVIATIONS and ACRONYMS
ACA Catalan Water Agency
AENOR Standardization and Certification Spanish Association
AIC Akaike Information Criterion
AMBI AZTI's Marine Biotic Index
ANOSIM Analysis of Similarities
ANOVA Analysis of Variance
BI Biotic Index
BOPA Benthic Opportunistic Polychaetes Amphipods Index
BQE Biological Quality Element
ca. circa (around)
CCA Canonical Correspondence Analysis
CHE Ebro River Basin Authority
CTZ Critical Transition Zone
CWA Clean Water Act (33 U.S.C. §1251 et seq. 1972)
d Margalef Index
D Density
DCA Detrended Correspondence Analysis
DF Deposit Feeders
DO Dissolved Oxygen
e.g exempli gratia (for example)
Eh Oxidation/Reduction Potential
EMAP Environmental Monitoring and Assessment Program
EMAP-E Environmental Monitoring and Assessment Program -Estuaries
EN European Norm

xiv
EP Ephemeroptera and Plecoptera
EPA United States Environmental Protection Agency
EPT Ephemeroptera, Plecoptera and Trichoptera
EPTCBO Ephemeroptera, Plecoptera, Trichoptera, Coleoptera, Bivalvia and
Odonata
EQR Ecological Quality Ratio
ES Ecological Status
et al. et alii (and others)
EUMS European Union Member States
FA Field of Application
GAM Generalized Additive Models
G Grazers
H’ Shannon-Wiener’s diversity Index
IBMWP Iberian Monitoring Working Party
i.e id est (that is)
IF Impact Factor
IRTA Research, Technology, Food and Agriculture Institute
ISI Institute for Scientific Information
JCR Journal Citation Report
J’ Pielou’s Evenness Index
KMO Kaiser-Meyer-Olkin Test
LE Lower Estuary
LSD Least Significant Difference
MDS Non-Metric Multi-Dimensional Scaling
MEDDOC Mediterranean Occidental index
MSFD Marine Strategy Framework Directive-2008/56/EC
MSP Methodology and Sample Processing
M-AMBI Multivariate AZTI's Marine Biotic Index
N Total Abundance
NEP National Estuary Program
xv
O Omnivores
OSS Organic Suspended Solids
PCA Principal Components Analysis
pH Pondus Hydrogenii (power of hydrogen)
PRIP Predicted Response to Increasing Perturbation
RC Reference Condition
S Richness
SCI Science Citation Index
S0 Cross-section Averaged Salinity (see Hansen and Rattray, 1966)
SF Suspension Feeders
SIMPER Similarity Percentage Analysis
SW Salt Wedge’s Tip or Null point
TOM Total Organic Matter
TR Taxonomic Resolution
TSS Total Suspended Solids
TW Transitional Water
UE Upper Estuary
UN United Nations
UNE Spanish Norm
UNESCO United Nations Educational, Scientific and Cultural Organization
Uf Sectional averaged flow (see Hansen and Rattray (1966)
us Surface flow-speed (see Hansen and Rattray (1966) diagram)
WB Water Body
WFD Water Framework Directive-2000/60/EC
WOS Web of Science
1-λ’ Simpson dominance Index
δS Top to bottom salinity difference (see Hansen and Rattray, 1966)


1
1 DIRECTOR’S REPORT
Report of the directors of the Ph.D. thesis in reference to its derived publications and the student’s contribution to them
Dr. Nuno Caiola, researcher of the Aquatic Ecosystems program, Institute of Agrifood Research and Technology (IRTA), as supervisor
and,
Dr. Carles Ibáñez i Martí, Director of the Aquatic Ecosystems program, IRTA, as co-supervisor
of the Ph.D. thesis authored by Alfonso Nebra Costas and entitled: ‘Ecology and bioindicator potential of benthic macroinvertebrates in a Mediterranean salt wedge estuary: the Ebro River case’
INFORM
That the results and conclusions achieved in the research developed by Alfonso Nebra Costas as part of his Ph.D. thesis have been organized in 3 chapters which correspond to 3 scientific papers (2 already published in SCI journals and 1 manuscript currently submitted).
The list of publications and manuscripts is shown, indicating the journal Impact Factor (IF) (according to SCI of ISI Web of Science, Journal Citation Report-2014) as well as the median IF of the main subject categories and the position of the journal within the corresponding category.

2
I) Nebra A., Caiola N., Ibáñez C. Community structure of benthicmacroinvertebrates inhabiting a highly stratified Mediterranean estuary. Scientia Marina, 75(3): 577-584 (2011).
Impact factor: 1.144
This journal is reported in Quartile 3 of “Marine and Freshwater Biology” subject category, being in the 63th position of the 102 journals included, which have a median IF value of 1.448
II) Nebra A., Alcaraz C., Caiola N., Muñoz-Camarillo G., Ibáñez C. Benthicmacrofaunal dynamics and environmental stress, across a riverine-marine boundary, in a salt wedge Mediterranean estuary. Marine Environmental Research (submitted and currently under review).
Impact factor: 2.762
This journal is reported in the Quartile 1 of “Marine and Freshwater Biology” subject category being the 12th out of 102 journals; and in the Quartile 2 of the “Environmental Sciences” and “Toxicology” categories, being in the 56th and 34th position of the 221 and 87 journals included in both categories, respectively. “Marine and Freshwater Biology” category has a median IF of 1.448; whereas, the IF for “Environmental Sciences” and “Toxicology” categories is 1.641 and 2.377, respectively.
III) Nebra A., Caiola N.A., Muñoz-Camarillo G., Rodríguez-Climent S., Ibáñez C.Towards a suitable ecological status assessment of salt wedge Mediterranean estuaries: a comparison of benthic invertebrate fauna indices. Ecological Indicators, 46 (2014) 177-187
Impact factor: 3.444
This journal is reported in Quartile 1 of “Environmental Sciences” subject category, being in the 34th position of the 221 journals included in this category, which have a median IF value of 1.641.

3
and CERTIFY
that Alfonso Nebra Costas contribution has been very active, as it is demonstrated by his first coauthoring of all the manuscripts that conform this Ph.D. thesis. In particular, his participation included the following tasks:
- Sampling design and field work, including water, macroinvertebrate samples collection, and in situ physico-chemical measurements.
- Sediment grain size and organic matter content analysis.
- Sorting, counting and identification of macroinvertebrate and microcrustaceans species.
- Data analysis and interpretation of results.
- Tables and Figures design and preparation.
- Definition of the objectives and focus of the research and its derived manuscripts.
- Main writing of the manuscripts, and contact person for the reviewing and editing process.
- Writing of this PH.D Thesis manuscript
Barcelona, Novenber 23th 2015
Dr. Nuno Caiola Dr. Carles Ibáñez i Martí


5
2 GENERAL INTRODUCTION
2.1 Estuaries: Definition and Classification
The term estuary is derived from the Latin word ‘aestus’ meaning tide or billowing
movement, more specifically the word ‘aestuarium’ means marsh or channel
(McLusky and Elliot, 2004). The most widely accepted definition of an estuary was
proposed by Cameron and Pritchard (1963). According to his definition, an estuary is
“A coastal semienclosed body of water, with free connection to the open sea, and
within which sea water comes diluted by fresh water derived from land drainage”.
Although, this classical definition does not mention tide as the main mixing driver in
estuaries, seawater dilution implies the action of this mixing agent. At the same time,
this definition implies fresh water input entering into a semienclosed basin.
The above definition of an estuary deals with temperate tidal estuaries but is
unspecific for arid and semiarid basins (scarce freshwater input in dry periods)
(Potter et al., 2010) and for non-tidal or microtidal seas (no mixing effect due to low
tide power) (Valle-Levinson, 2010; Day et al., 2012), which is the case of salt wedge
estuaries (Muñoz, 1990; Ibáñez, 1993; Ibáñez et al., 1997). In order to address with
limitations of Cameron and Pritchard’s definition some attempts to redefine estuaries
have been done. Fairbridge (1980) coined the next definition: “An estuary is an inlet
of the sea reaching into a river valley as far as the upper limit of tidal rise, usually
being divisible into three sectors: (i) a marine or lower estuary, in free connection
with the open sea; (ii) a middle estuary subject to strong salt and fresh water mixing;
and (iii) an upper or fluvial estuary, characterized by fresh water but subject to daily
tidal action”. Fairbridge’s definition still excludes some estuarine systems, e.g. non-

GENERAL INTRODUCTION
6
tidal estuaries or bar-built estuaries that become separated from sea during bar
formation periods. Day (1981) adapted Cameron and Pritchard’s definition to
accommodate South African estuaries to the following: “An estuary is a partially
enclosed coastal body of water which is either permanently or periodically open to
the sea and within which there is a measurable variation of salinity due to the
mixture of sea water with fresh water derived from land drainage”. However, this
definition is also incomplete, excluding estuaries from important microtidal regions
of the world such as Mediterranean Sea or Gulf of Mexico.
In recent years, the controversy about estuaries’ definition continues (e.g. Elliott and
McLusky, 2002; Tagliapietra et al., 2009; Potter et al., 2010) and nowadays, no
consensus has been found. One of the most ‘broad range’ definition of an estuary
was proposed by Potter et al. (2010): “An estuary is a partially enclosed coastal body
of water that is either permanently or periodically open to the sea and which receives
at least periodic discharge from a river(s); and thus, while its salinity is typically less
than that of natural sea water and varies temporally and along its length, it can
become hypersaline in regions when evaporative water loss is high and freshwater
and tidal inputs are negligible”. This definition was proposed with the aim to
incorporate hypersaline estuaries found in arid climate from south-western Australia
and southern Africa coasts. The basis of this new definition falls on the shared
characteristics (biological, functional and structural) with typical temperate estuaries
(Potter et al., 2010). However, this definition seems to exclude microtidal estuaries
which receive important annual mean freshwater inputs.
Tidal estuaries are widespread and abundant in most of oceanic coasts. On the
contrary, microtidal systems are restricted to semienclosed seas, such as the
Mediterranean, the Black and the Baltic seas, and the Gulf of Mexico. Rivers flowing
into microtidal seas form a special estuary type, the salt wedge estuaries. In spite of
being more frequent than other estuary types (e.g. tectonic type estuaries) and sharing
characteristics (biological, functional and structural) with other estuaries, they are
still not contemplated in most accepted estuary definitions (classical or current). Salt
GENERAL INTRODUCTION
7
wedge estuaries are well-represented along microtidal coasts worldwide e.g. Ebro
River (Spain), southwest Pass of Mississippi River (USA), Columbia River (USA),
Río de la Plata (Argentina), Vellar River (India), Pánuco River (Mexico) and Itajaí-
Açu River (Brazil), among others. All the above definitions were developed under
the scope of a wide variety of disciplines such as, hydrology or physical
oceanography. Different definitions have been termed in each of the many disciplines
studying estuaries, and sometimes the contradictions between them are evident
(Perillo, 1995). An accurate estuary definition should include different components,
geomorphological, hydrological, ecological, biological and chemical components
(Perillo, 1995). Nevertheless, current available definitions do not reflect all these
criteria and none of them consider ecological functioning premises. Consequently,
the difficulties of including particular estuarine systems such as hypersaline or
microtidal in those definitions are evident. The lack of a suitable definition including
this unique estuary types, e.g. microtidal estuaries, is a good starting point to
introduce the different classification systems for estuaries. In contrast with previous
definitions, several widely accepted classification systems include microtidal
estuaries. To better understand this special kind of estuaries, a relation of
classification systems based in different approaches is present below.
The classifications of estuaries, likewise definition attempts, were addressed in
different ways based on the discipline of each author. At the beginning, estuaries
were mostly classified by geologists and physical oceanographers who centered their
classifications in geomorphological features and salinity stratification (Perillo, 1995;
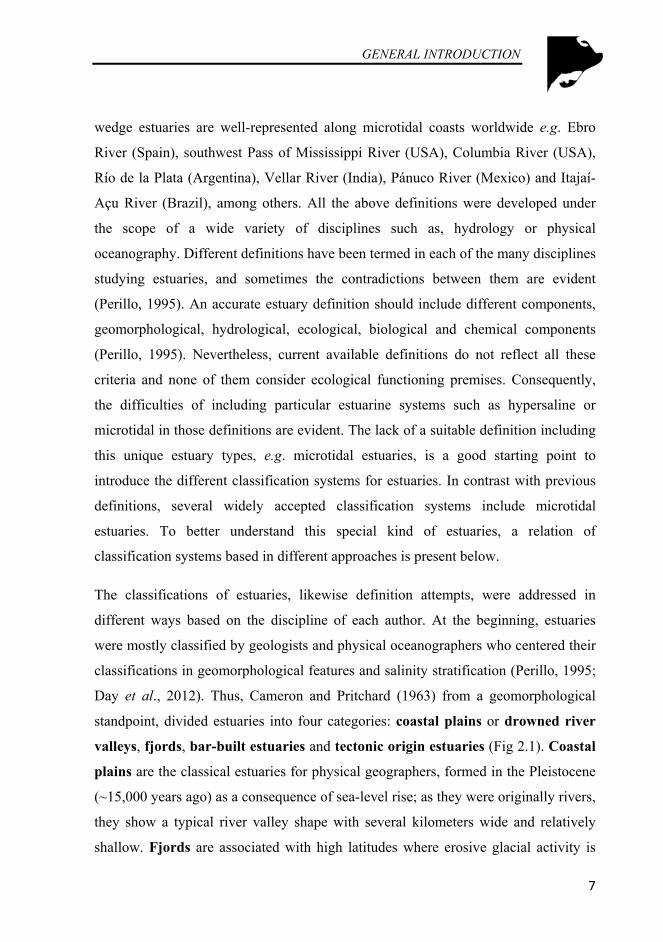
Day et al., 2012). Thus, Cameron and Pritchard (1963) from a geomorphological
standpoint, divided estuaries into four categories: coastal plains or drowned river
valleys, fjords, bar-built estuaries and tectonic origin estuaries (Fig 2.1). Coastal
plains are the classical estuaries for physical geographers, formed in the Pleistocene
(~15,000 years ago) as a consequence of sea-level rise; as they were originally rivers,
they show a typical river valley shape with several kilometers wide and relatively
shallow. Fjords are associated with high latitudes where erosive glacial activity is
GENERAL INTRODUCTION
8
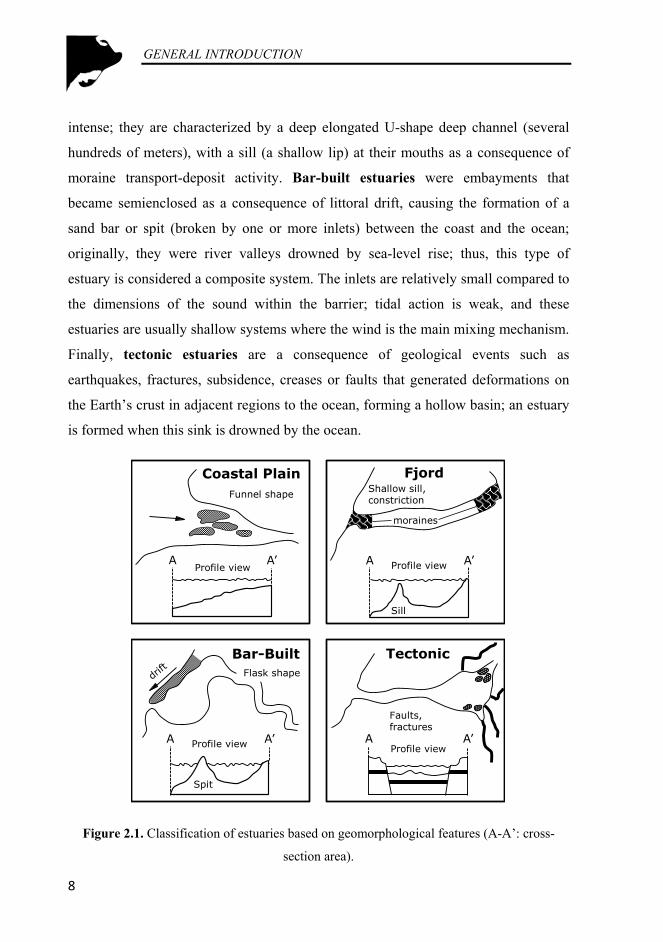
intense; they are characterized by a deep elongated U-shape deep channel (several
hundreds of meters), with a sill (a shallow lip) at their mouths as a consequence of
moraine transport-deposit activity. Bar-built estuaries were embayments that
became semienclosed as a consequence of littoral drift, causing the formation of a
sand bar or spit (broken by one or more inlets) between the coast and the ocean;
originally, they were river valleys drowned by sea-level rise; thus, this type of
estuary is considered a composite system. The inlets are relatively small compared to
the dimensions of the sound within the barrier; tidal action is weak, and these
estuaries are usually shallow systems where the wind is the main mixing mechanism.
Finally, tectonic estuaries are a consequence of geological events such as
earthquakes, fractures, subsidence, creases or faults that generated deformations on
the Earth’s crust in adjacent regions to the ocean, forming a hollow basin; an estuary
is formed when this sink is drowned by the ocean.
Figure 2.1. Classification of estuaries based on geomorphological features (A-A’: cross-
section area).
Coastal PlainFunnel shape
Profile viewA A’
Bar-BuiltFlask shape
A A’
Spit
Profile view
Tectonic
A A’Profile view
Faults,fractures
FjordShallow sill,constriction
moraines
A A’Profile view
Sill

GENERAL INTRODUCTION
9
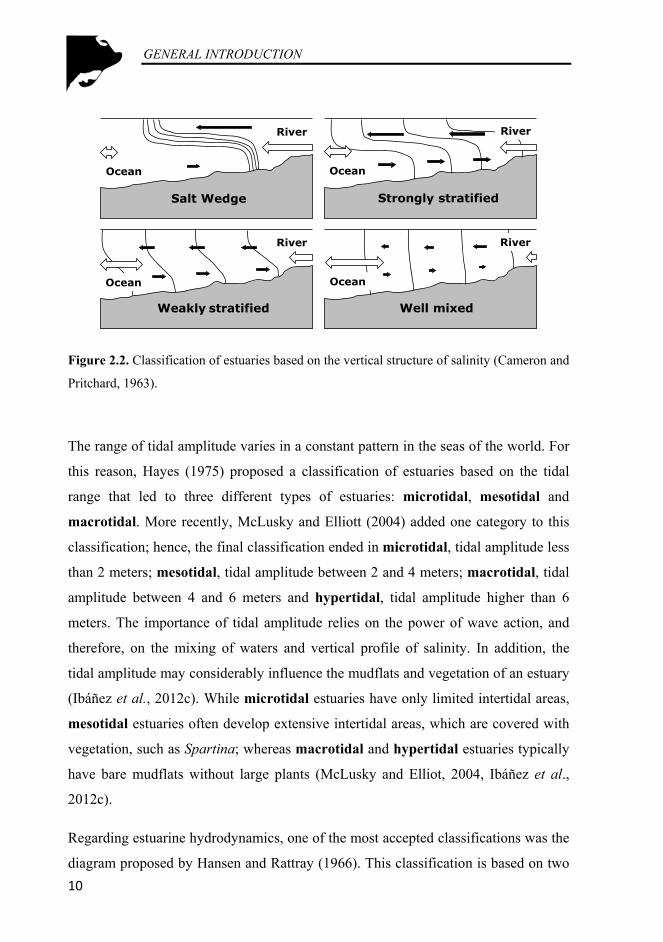
Pritchard (1955) and Cameron and Pritchard (1963) presented another approach to
the classification of estuaries, considering the vertical structure of salinity or
estuarine circulation. According to water column stratification estuaries can be
classified as salt wedge, strongly stratified, weakly stratified or vertically mixed
(Fig. 2.2). There are three basic processes that produce motion and mixing in an
estuary: the wind, the tide and the inflow of fresh water (Pritchard, 1967). In a wind-
dominated estuary (such as bar-built estuaries), the wind provides all the energy for
motion and mixing of the water. On the other hand, in a tide-dominated estuary the
main driver for sea and freshwater mixing is the turbulence associated to tidal
currents. In a river-dominated estuary (those from microtidal seas) the mixing is
mostly produced by the breaking of unstable interfacial waves at the upper boundary
of the salt wedge (halocline). This classification mainly considers competition
between river discharge and tidal action. Salt wedge estuaries are the result of weak
tidal force and large river discharge. In such systems, the water column is stratified
due to the density difference between fresh and sea water layers (Fig. 2.2). Strongly
stratified estuaries are the result of moderate to large river discharge and weak to
moderate tidal force; these estuaries have a similar stratification profile to salt wedge
estuaries, but the stratification remains stable during the whole tidal cycle; fjords and
other deep estuaries are included in this category. Weakly stratified estuaries result
from moderate to strong tidal action and weak to moderate river discharge; their
mean salinity and density profile show a weak cline or continuous stratification from
surface to bottom except for a near bottom mixed layer. Strong tidal forcing and
weak river discharge result in vertically mixed estuaries (minimal vertical
stratification); salinity profiles in mixed estuaries are practically uniform and mean
flows are unidirectional with depth; in wide (and shallow) estuaries, inflows may
develop on one side across the estuary and outflow on the other side, especially
during the dry season.
GENERAL INTRODUCTION
10
Figure 2.2. Classification of estuaries based on the vertical structure of salinity (Cameron and
Pritchard, 1963).
The range of tidal amplitude varies in a constant pattern in the seas of the world. For
this reason, Hayes (1975) proposed a classification of estuaries based on the tidal
range that led to three different types of estuaries: microtidal, mesotidal and
macrotidal. More recently, McLusky and Elliott (2004) added one category to this
classification; hence, the final classification ended in microtidal, tidal amplitude less
than 2 meters; mesotidal, tidal amplitude between 2 and 4 meters; macrotidal, tidal
amplitude between 4 and 6 meters and hypertidal, tidal amplitude higher than 6
meters. The importance of tidal amplitude relies on the power of wave action, and
therefore, on the mixing of waters and vertical profile of salinity. In addition, the
tidal amplitude may considerably influence the mudflats and vegetation of an estuary
(Ibáñez et al., 2012c). While microtidal estuaries have only limited intertidal areas,
mesotidal estuaries often develop extensive intertidal areas, which are covered with
vegetation, such as Spartina; whereas macrotidal and hypertidal estuaries typically
have bare mudflats without large plants (McLusky and Elliot, 2004, Ibáñez et al.,
2012c).
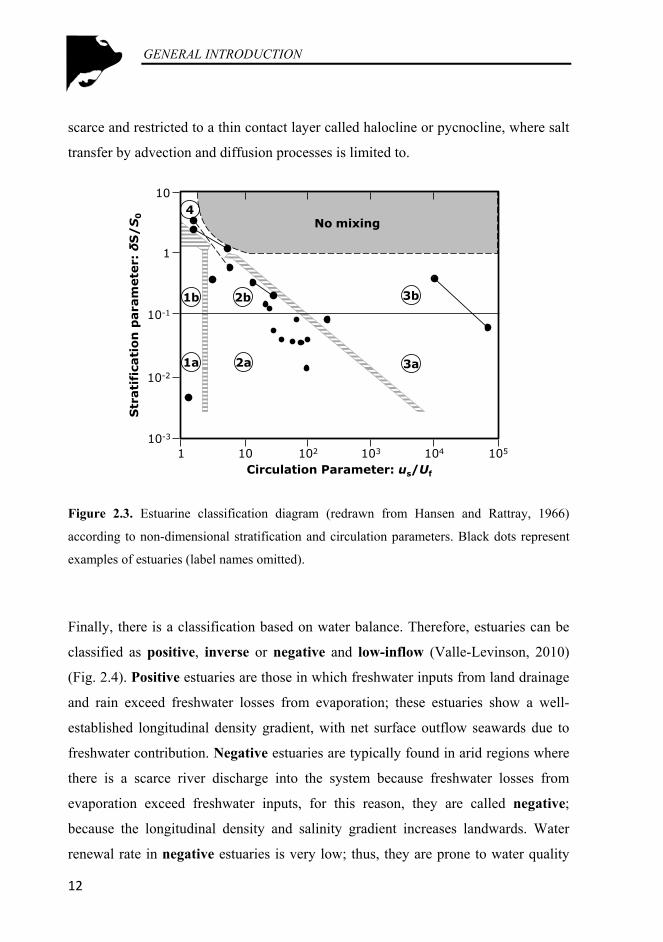
Regarding estuarine hydrodynamics, one of the most accepted classifications was the
diagram proposed by Hansen and Rattray (1966). This classification is based on two
Weakly stratified
Ocean
River
Well mixed
Ocean
River
Salt Wedge
Ocean
River
Strongly stratified
Ocean
River

GENERAL INTRODUCTION
11
hydrodynamic parameters (stratification and circulation); in particular, by plotting
the stratification versus the estuarine circulation (Fig. 2.3). These two parameters
refer to tidal averaged (salinities are first averaged over one or more complete tidal
cycle) and flow cross-sectional averaged (to smooth lateral circulation). In this way,
the stratification parameter is the ratio of the salinity difference between surface and
bottom (δS) and the cross-section averaged salinity (S0). The circulation is simply the
ratio between net surface flow-speed (us) and freshwater sectional averaged flow
(Uf). Hansen and Rattray (1966) found that most estuaries could be grouped into four
main regions on their diagram (Fig. 2.3). Type 1 estuaries are lagoons or bar-built
estuaries; subtype 1a estuaries are vertically mixed or slightly-stratified, whereas
subtype 1b estuaries show ‘appreciable’ vertical stratification. Both subtypes (1a and
1b) have scarce gravitational circulation and they are mainly dominated by diffusive
processes. In general terms, type 1 estuaries describe well-mixed estuaries with net
seawards flows (outflows) and no vertical structure. Type 2 includes most temperate
estuaries; these systems are characterized by a reasonable well-developed
gravitational and longitudinal circulation, with contribution of adventive and
diffusive processes to landwards salt transfer. Again this type is subdivided in
analogous subtypes like Type 1, well-mixed or weakly-stratified (Subtype 2a) and
stratified estuaries (Subtype 2b). Subtype 2a are well mixed or weakly-stratified
estuaries; whereas, Subtype 2b estuaries are strongly stratified. Type 3 is
distinguished from Type 2, primarily by the dominance of advection (well-developed
gravitational circulation) accounting for over 99% of the upstream salt transfer. This
type of estuaries corresponds to fjords (deep basins with strong surface outflow and
very small depth-averaged flows). Subtype 3a estuaries are moderately stratified and
Subtype 3b estuaries are highly stratified. In Type 4 (salt wedge or highly stratified)
the stratification is still greater than that for Type 3 estuaries; as the freshwater flow
grades from a thick layer (upstream) to a narrow surface layer (close to the river
mouth), the salt water flows under the freshwater layer and change from a thin
upstream layer to a deep lower layer (at river mouth). Vertical mixing is limited and
the gravitational circulation is weak or nonexistent. The influence between layers is
GENERAL INTRODUCTION
12
scarce and restricted to a thin contact layer called halocline or pycnocline, where salt
transfer by advection and diffusion processes is limited to.
Figure 2.3. Estuarine classification diagram (redrawn from Hansen and Rattray, 1966)
according to non-dimensional stratification and circulation parameters. Black dots represent
examples of estuaries (label names omitted).
Finally, there is a classification based on water balance. Therefore, estuaries can be
classified as positive, inverse or negative and low-inflow (Valle-Levinson, 2010)
(Fig. 2.4). Positive estuaries are those in which freshwater inputs from land drainage
and rain exceed freshwater losses from evaporation; these estuaries show a well-
established longitudinal density gradient, with net surface outflow seawards due to
freshwater contribution. Negative estuaries are typically found in arid regions where
there is a scarce river discharge into the system because freshwater losses from
evaporation exceed freshwater inputs, for this reason, they are called negative;
because the longitudinal density and salinity gradient increases landwards. Water
renewal rate in negative estuaries is very low; thus, they are prone to water quality
No mixing
3b
4
1a 2a 3a
2b1b
Circulation Parameter: us/Uf
Str
ati
fica
tio
n p
ara
mete
r: δ
S/
S0
1 10 102 103 104 105
10
1
10-1
10-2
10-3

GENERAL INTRODUCTION
13
problems. Low-inflow estuaries also occur in arid regions, but show a small
influence from river discharge (in the order of a few m3s-1). During dry periods,
evaporation processes may cause a salinity maximum zone or ‘salt plug’ within the
estuary. Seawards of the salt plug, the salinity decreases, as in negative estuaries;
whereas, upstream the plug the salinity decreases as in positive estuaries. The salt
plug (maximum density zone) acts as a barrier avoiding marine intrusion landwards
and river discharge seawards; because of this, low-inflow estuaries are also prone to
water quality problems.
Figure 2.4. Classification of estuaries based on water balance (redrawn from Valle-Levinson,
2010).
The above definitions and classifications confirm the great variety of estuarine types
and the challenging task to define and classify estuaries (Table 2.1).
Ocean
Positive
River
p2 >p4> p3 > p1
p1p2p4 p3
Ocean
Negative
Land
p2 <p4< p3 < p1
p1p2p4 p3
Evaporation
Ocean
Low inflow
River
p2 >p4> p3 > p1
Evaporation
p4 p1p2 p2p3
GENERAL INTRODUCTION
14
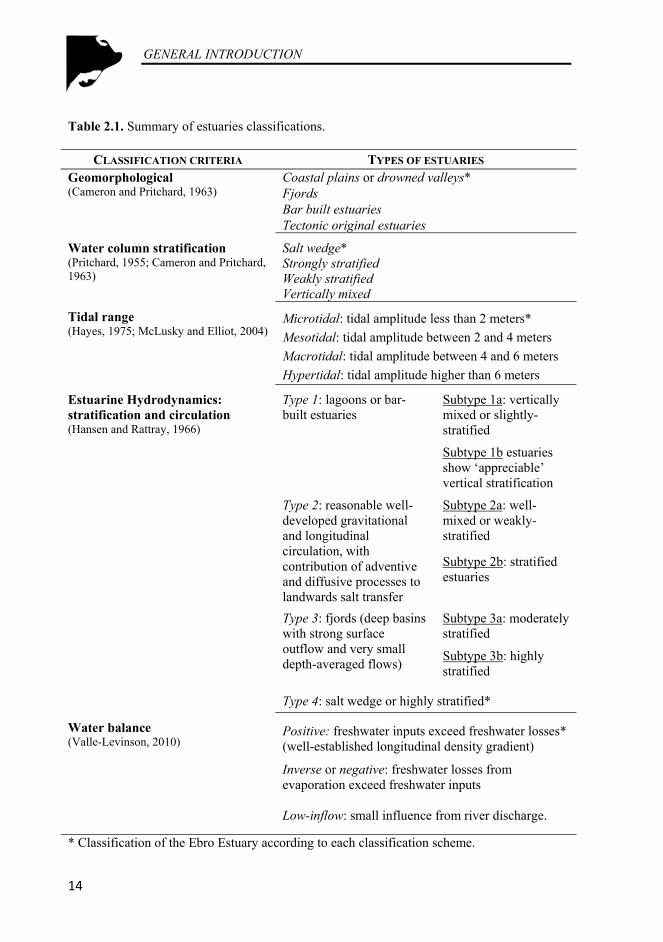
Table 2.1. Summary of estuaries classifications.
CLASSIFICATION CRITERIA TYPES OF ESTUARIES Geomorphological (Cameron and Pritchard, 1963)
Coastal plains or drowned valleys* Fjords Bar built estuaries Tectonic original estuaries
Water column stratification (Pritchard, 1955; Cameron and Pritchard, 1963)
Salt wedge* Strongly stratified Weakly stratified Vertically mixed
Tidal range (Hayes, 1975; McLusky and Elliot, 2004)
Microtidal: tidal amplitude less than 2 meters*
Mesotidal: tidal amplitude between 2 and 4 meters
Macrotidal: tidal amplitude between 4 and 6 meters
Hypertidal: tidal amplitude higher than 6 meters
Estuarine Hydrodynamics: stratification and circulation (Hansen and Rattray, 1966)
Type 1: lagoons or bar-built estuaries
Subtype 1a: vertically mixed or slightly-stratified
Subtype 1b estuaries show ‘appreciable’ vertical stratification
Type 2: reasonable well-developed gravitational and longitudinal circulation, with contribution of adventive and diffusive processes to landwards salt transfer
Subtype 2a: well-mixed or weakly-stratified
Subtype 2b: stratified estuaries
Type 3: fjords (deep basins with strong surface outflow and very small depth-averaged flows)
Subtype 3a: moderately stratified
Subtype 3b: highly stratified
Type 4: salt wedge or highly stratified*
Water balance (Valle-Levinson, 2010)
Positive: freshwater inputs exceed freshwater losses* (well-established longitudinal density gradient)
Inverse or negative: freshwater losses from evaporation exceed freshwater inputs
Low-inflow: small influence from river discharge.
* Classification of the Ebro Estuary according to each classification scheme.

GENERAL INTRODUCTION
15
2.2 Estuaries: relevance, benefits and anthropogenic pressures concern
Estuaries are complex ecosystems, largely recognized for their high productivity and
their interest from social, economic and conservational perspectives (Ysebaert et al.,
1998; Pierson et al., 2002; Russell et al., 2006; Bianchi, 2006; Vasconcelos et al.,
2007). From an ecological point of view, estuaries are source of food, shelter and
spawning-nursery areas for many organisms, e.g. macroinvertebrates and fish
(including commercial species), or waders and waterfowls especially dependent on
estuaries for breeding, feeding or sheltering in winter time. Furthermore, estuarine
related habitats such as mudflats, coastal lagoons, barrier beaches, deltaic and flood
plains, salt marshes or seagrass beds and meadows, are also valuable ecosystems that
host unique biological communities.
Historically, the amount of services and resources provided by estuaries, served as an
incentive to immigration and settlement for many human populations; since,
thousands of years ago important human civilizations thrived around estuaries such
as Tigris-Euphrates, Nile, Indus, Usumacinta, and Yellow rivers (Day et al., 2012);
firstly because of food resources but later also for commerce purposes. Recent
studies indicate that 61% of the world population lives along the coastal areas
(Bianchi, 2006), and likewise in the past, several World’s largest cities are located
around estuarine systems, e.g. London, New York, Sao Paulo, Buenos Aires or
Shanghai. As a result of coastal colonization, there is a plethora of negative effects
over the natural environment (Newman et al., 2002; McLusky and Elliot, 2004;
Amiard-Triquet and Rainbow, 2009). This fact gets especially worse during the last
centuries because of industrial revolution and rapid human population growth
(demographic revolution) (Kapitza, 2009; Slaus and Jacobs, 2011). Assorted human
activities, such as industry, agriculture, livestock farming, fishing or land claim, take
place around coastal areas threatening their ecological integrity, their economic value
and even affecting public health (Schlacher and Woolbridge, 1996; Edgar et al.,
2000; McLusky, 1999; McLusky and Elliot, 2004; Dauer et al., 2000; Bianchi, 2006;
Dauvin, 2007; Elliot and Quintino, 2007; Gray and Elliot, 2009; Day et al., 2012).

GENERAL INTRODUCTION
16
The main anthropogenic pressures associated to those activities can be grouped
depending on the impacts caused in the ecosystem. Physical or hydrological
pressures, such as channelization, dredging, drainage and harbor construction,
produce habitat loss and alteration impacts. Enrichment pressures, including
industrial wastewater and urban sewage effluents, agriculture and farmland runoffs
or fish farming wastes (Justic et al., 1995; McLusky and Elliot, 2004; Zaldívar et al.,
2008; Gray and Elliot, 2009), are promoting the accumulation of pollutants i.e. heavy
metals, toxic compounds, hydrocarbon substances (Cantillo, 1998; Navarro-Ortega et
al., 2010) and provoking high nutrient concentrations in water and organic matter
excess in rivers, estuaries and bays (Boynton et al., 1995; Day et al., 1997; Nedwell
et al., 1999; Navarro-Ortega et al., 2010). High nutrient loads produce direct
ecological impacts over biological communities (Karlson et al., 2002), mostly
associated with eutrophication process (Bock et al., 1999; Wang et al., 1999;
Hänninen et al., 2000). Besides, organic matter enrichment causes episodes of
hypoxia and low redox potential values. These facts disturb biological communities’
composition, trophic structure and biomass (Pearson and Rosenberg, 1978;
Grebmeier et al., 1988; Díaz, 2001). The impacts associated to enrichment
pressures are magnified in estuaries due to their sheltered nature; they act as traps of
sediments and contaminants (McLusky and Elliot, 2004); furthermore, in
Mediterranean climate basins where water scarcity occurs during the summer period,
the concentration of these toxic compounds increases producing a serious
environmental risk (Navarro-Ortega et al., 2010). There is another group of pressures
that produce changes in community composition, some examples are: overfishing,
promoting species replacement; commercial activity, enhance alien species
introduction (Day et al., 2012); and, harbors and marinas, that cause habitat loss,
change the hydrographic patterns and the sedimentary regime and disrupting
consequently the biota (McLusky and Elliot, 2004). Finally, not long ago, a global
effect pressure is altering aquatic ecosystem environmental balance, the climate
change produces severe, and in some cases, irreversible impacts at landscape level,
such as global warming and sea level rise for coastal areas (Crooks and Turner, 1999;

GENERAL INTRODUCTION
17
Cloern, 2001; Bianchi, 2006, Slaus and Jacobs, 2011; Kernan, 2015); thus, the
climate change is considered the most important pressure impacting coastal
ecosystems (Day et al., 2012; Ibáñez et al., 2014). Climate change intrinsic
temperature changes (mainly warming) favors the expansion and establishment of
invasive alien species to the detriment of autochthonous ones (Dukes and Mooney,
1999; Stachowicz et al., 2002; Ricciardi, 2007; Rahel and Olden, 2008, Rahel et al.,
2008; Kernan, 2015). Besides, permanent drowned areas by sea level rise allow to
invasive species to reach new habitats such as flood plains, salt marshes, gorges and
ravines that frequently act as sanctuaries for native species.
During the last decades, the concern about environmental issues has largely increased
among scientists, managers and general society. Detecting the environmental health
and functioning of ecosystems has become one of the main themes of modern
ecology (Karr and Chu, 1999; Bortone, 2004). In order to deal with the
anthropogenic pressures-impacts, and to reverse the severe ecological decline of
aquatic ecosystems, statements, monitoring programs and environmental laws have
been enacted in many countries. Relevant examples are the Clean Water Act (CWA,
1972), the Environmental Monitoring and Assessment Program (EMAP) and the
National Estuary Program (NEP) all developed by the United States Environmental
Protection Agency (EPA); the Water Framework Directive-2000/60/EC (WFD)
(European Parliament, 2000), the Marine Strategy Framework Directive-2008/56/EC
(MSFD) (European Parliament, 2008), and in recent times the Division for Oceans
Affairs and the Law of the Sea of the United Nations (UN), announced the Oceans
Compact. Estuaries are directly taken into account by the EMAP-Estuaries (EMAP-
E), the NEP and by the WFD. In the last case, the ecological status (ES) assessment
of European water bodies (WB), including estuaries, is based in the status of
biological communities.
The WFD, enacted in 2000, provides a basis for the conservation, protection and
improvement the ecological integrity of all WB, including groundwater, inland
surface, coastal and transitional waters (TW), in which estuaries are included. The

GENERAL INTRODUCTION
18
objectives defined in the WFD may be summarized into an overall goal: to ensure
that all WB achieving the ‘good’ ES by 2015 through different key actions that have
to be undertaken by European Union Member States (EUMS) to support the
implementation of the WFD. This process implies the identification of WB
typologies, the description of reference condition (RC) for each WB type defined
(undisturbed condition; for detailed information see WFD, 2000/60/EC-Annex II and
V), and the development of classification schemes based on ecological assessment of
biological indicators (biological quality elements (BQEs) in accordance with WFD
definitions). These classification schemes must be endorsed by hydromorphological
and physic-chemical quality elements. According to the WFD, estuaries are included
in the TW category, defined as: ‘bodies of surface water in the vicinity of river
mouths which are partly saline in character as a result of their proximity to coastal
waters but which are substantially influenced by freshwater flows’. For TW, the
BQEs to be considered are phytoplankton, aquatic flora, fish and benthic
invertebrates (European Parliament, 2000). Before determining the ES of a
monitored WB, it is necessary to develop assessment tools or biotic indices (BIs),
and then compare this BI data with type-specific RC BI data; thus, deriving an
ecological quality ratio (EQR) expressed as a numerical value ranging between 0 and
1 (result of dividing biological value observed by RC biological value). This range is
divided into five categories (e.g. using percentile or equidistant partition), each one
corresponding to one of the following ES classes: ‘High’ status corresponds to the
values closest to 1 and ‘Bad’ status is represented by lowest values, the intermediate
classes are ‘Good’, ‘Moderate’ and ‘Poor’ status. The boundaries among classes are
different within European eco-region, depending on EUMS types and the
classification tools developed. ‘High/Good’ and ‘Good/Moderate’ boundaries should
be established through intercalibration exercises in order to ensure their agreement
with WFD normative definitions, and also to validate that the different
methodologies used are comparable among EUMS (Borja et al., 2009).
GENERAL INTRODUCTION
19
2.3 Aquatic macroinvertebrates: definition, ecology and indicator potential
The term ‘macroinvertebrates’ refers to organisms that are large enough to be seen
with a naked eye (usually greater than 500 microns) and lacking a backbone
(invertebrate) (McDonald et al., 1991). Macroinvertebrates inhabit all types of
aquatic ecosystems from high to low latitudes, such as a mountain streams, large
rivers, wetlands or lakes and even really harsh environments such as phytotelmata,
hot springs, saltpans or the Mediterranean temporary ponds and streams. Examples
of aquatic macroinvertebrates include insects at larval (holometabolous), nymph
(heterometabolous) or adult forms (this differentiation takes relevance since different
stages of the same species can perform different ecological roles), crustaceans
(mainly isopods, amphipods and decapods), mollusks (bivalves, gastropods) and
annelids (oligochaetes, polychaetes and hirudinids); among others. Their ecological
significance relies in the fact that they play important functional roles on ecosystem
ecology. For example, they are major components of food web, as primary
consumers, as consumers at intermediate trophic levels or being main food source for
higher trophic levels. They also mediate in nutrient, carbon and detritus cycling
(Wallace and Webster, 1996; Bianchi, 2006); and they act as ‘ecosystem engineers’,
causing physical structuring of ecosystems, mainly by bioturbation, biodeposition,
burrowing or substrate accretion (Jones et al., 1987; and references therein). Besides,
macroinvertebrates are a suitable biological indicator for environmental monitoring
and assessment programs because they are permanently in water and therefore
constantly affected by its physical, chemical and biological condition. In addition,
macroinvertebrates show many relevant characteristics such as sensitiveness to
human influences (Pearson and Rosenberg, 1978; Dauer, 1993; Grall and Glemarec,
1997; Dauer et al., 2000; Simboura and Zenetos, 2002; Bustos-Baez and Frid, 2003;
Rakocinski and Zapfe, 2005; Perus et al., 2007; and many others), relative long life
cycles (they may show the cumulative impacts of pollution), they are relatively
sedentary and have limited dispersal abilities ( so they are unable to avoid
deteriorating of water and sediment quality), great species richness and abundance

GENERAL INTRODUCTION
20
(comprising a wide range of tolerances to stress and pollution), well-known
taxonomy, ability to colonize a great variety of microhabitats and relatively easy and
inexpensive to sample.
For all these reasons, macroinvertebrates are extensively studied in aquatic
ecosystems including estuaries, where there is a long tradition in benthic
macroinvertebrates research: classical community description studies and ecological
response of biota to estuarine gradients (e.g. Remane, 1934; Remane and Schlieper,
1958, 1971; Carriker, 1967; Barnes, 1974; Morrisey et al., 1992) or research on the
effects of pollution or other anthropic pressures (e.g. Pearson and Rosenberg, 1978,
Warwick, 1986; Dauer, 1993; Grall and Glémarec, 1997). This knowledge
established the keystone for current estuarine macroinvertebrate ecology and for the
ecological assessment and monitoring programs. In this sense, during the last decade,
estuarine ecology publications have increased rapidly (Duarte et al., 2015); in the
case of Europe, a great number of studies were performed under the WFD
implementation representing an important backing.
Regarding the indicator potential of macroinvertebrates, and their use in biological
assessment and management programs, it takes special relevance due to the
idiosyncrasy of estuaries as transitional environments. In ecological terms, estuaries
are interface systems between rivers and sea, characterized by variable hydrological,
morphological and chemical conditions. The close connection between riverine and
marine habitats implies that a broad range of physicochemical factors are occurring
in a relatively small area producing strong environmental gradients, this leads to a
patchy distribution of organisms along estuaries (Morrisey et al., 1992). As a
consequence, estuaries are stressful systems where biological communities must cope
with a wide variety of constrains (Morrisey et al., 1992; Bortone, 2004; Gray and
Elliott, 2009). The interplay between ecological processes (biotic and abiotic)
determines biological communities’ variation across spatial and temporal scales
(Borcard et al., 1992; Constable, 1999; Benedetti-Cecchi et al., 2000). Identifying
how biological communities are structured in response to environmental gradients is

GENERAL INTRODUCTION
21
a major goal in ecology. However, research on estuaries is mainly focused on the
abiotic influence sidestepping biological interactions, such as species competition.
This is because the importance of abiotic factors downplays the role of biotic ones;
and, probably this is the main reason for considering estuaries as physically
controlled environments (Schaffner, 1990; Ysebaert et al., 1998, 2003; Josefson and
Hansen, 2004; Giberto et al., 2007). The species ability to colonize estuarine
environments is limited by their physiological tolerance to severe changes in the
abiotic factors e.g. hydrodynamic processes, depth, water temperature, oxygen,
nutrient levels or food availability (Remane and Schlieper, 1971; Brusca and Brusca,
1990; Attrill and Thomas, 1996; Wu and Shin, 1997; Constable, 1999; Ysebaert et
al., 2003; Dauvin, 2007; Elliot and Quintino, 2007). However, salinity, sediment
grain-size and organic matter content are considered the key abiotic factors
determining the composition of benthic communities along estuaries (Day et al.,
1989; Mannino and Montagna, 1997). The restrictive conditions of estuarine
environments entail that only a few well-adapted species are able to survive; for this
reason, estuaries are areas which have inherent low species richness and high
abundances of stress-tolerant (well-adapted) organisms compared with adjacent
marine or riverine areas (Biggs and Cronin, 1981; Dauvin, 2007; Day et al., 2012).
At the same time, estuaries are ecosystems under the pressure of a great number of
human activities causing many kinds of impacts (as shown in the previous section);
accordingly, natural and anthropogenic stress co-occurs in estuaries. This confluence,
of opposed origin factors, makes difficult the comprehension of macroinvertebrates’
distribution along estuaries and also makes challenging to isolate the origin of drivers
(natural or anthropic) that cause those variations. The knowledge of an ecosystem,
both its ecological functioning and its community dynamics, is essential for
bioindicators based assessment. This fact is even more important in estuaries,
considering the difficulty of establishing a stressor-response relationship using Biotic
Indices (BIs) (Rakocinski and Zapfe, 2005); this is because they are naturally
stressed ecosystems, hosting specialized communities, which can be very similar in

GENERAL INTRODUCTION
22
both impacted and non-disturbed estuarine systems. This difficulty was coined as the
term ‘Estuarine Quality Paradox’ (Dauvin, 2007; Elliott and Quintino, 2007). Being
aware of estuaries’ peculiarities, and with the aim of evaluate ecosystem health,
several authors developed assessment tools based on benthic invertebrates as BQE,
such as AZTI's Marine Biotic Index (AMBI) (Borja et al., 2000), Multivariate AMBI
(M-AMBI) (Muxika et al., 2007), BENTIX (Simboura and Zenetos, 2002), or
Benthic Opportunistic Polychaetes Amphipods index (BOPA) (Dauvin and Ruellet,
2007), Mediterranean Occidental index (MEDDOC) (Pinedo et al., 2015), among
others. These BIs were mainly developed under the guidance of WFD for assessing
of transitional and coastal waters. Nevertheless, all of them are widely applied not
only in Europe, but also worldwide; this is an indicative of macroinvertebrates
indicator relevance.
2.4. Study context: the Ebro Delta-Estuary complex
This thesis was conducted in the Ebro estuary (40º43’10’’N, 0º40’30’’E) located in
the NE of the Iberian Peninsula (Spain) (Fig. 2.5). The Ebro River is 910 km long
and has a drainage basin approximately of 85,362 km2. It is the Spanish river with
the highest mean annual flow and one of the most important tributaries to the
Mediterranean Sea (ca. 12,000 hm3/year); data obtained at the Ebro Water Authority
(CHE) web site (http://www.chebro.es/). Intensive agriculture is the main land-use in
the Ebro basin with more than 10,000 km2 devoted to irrigation, this accounts for the
90% of the water usage in the basin (Ibáñez et al., 2008). The entire basin is strongly
regulated by ca. 190 dams (Batalla et al., 2004), managing water for hydropower
purposes, irrigation and human consumption. Large reservoirs have altered the
annual flow, not only by modifying the natural seasonal flow pattern, but also by
preventing flood frequency and intensity (Ibáñez et al., 2012a, b; Rovira et al.,
2012a). Besides, the annual mean flow has decreased since the beginning of the
century (Muñoz and Prat, 1989; Muñoz, 1990; Ibáñez et al., 1996, 2008). In

GENERAL INTRODUCTION
23
particular, Mequinenza and Ribarroja reservoirs, located on the main river about 100
km upstream from the river mouth, have a significant regulatory effect over flows in
the lower Ebro River (Ibáñez et al., 2012a, b; Rovira et al., 2012a), and therefore,
they are considered as the final responsible of the salt wedge dynamics and
macrofaunal trends along Ebro Estuary. Current regulation schedule assures the
presence of the salt wedge in the same position for long periods (Ibáñez et al., 1995;
Sierra et al., 2004; Falcó et al., 2010; Nebra et al., 2014).
Figure 2.5. Map showing the location of the study area, the Ebro estuary, in the context of the
Iberian Peninsula and the Ebro River basin.
The Ebro Delta is one of the largest wetland areas (ca. 320 km2) in the western
Mediterranean, and it is considered one of the most important estuarine zones in
Europe (Colomé et al., 1997; Day et al., 2006). In 2013, the United Nations
Educational, Scientific and Cultural Organization (UNESCO) declared the Ebro
deltaic plain World Biosphere Reserve. Moreover, a total of 7.736 ha are protected
under the Spanish Natural Park figure (including coastal lagoons, freshwater springs,
bays and adjacent coastline). The Ebro Delta shows a great diversity of habitats and
stands out by its faunal (ornithological and ichthyological) and halophilic floral
Ebro River Delta-Estuary
Alfacs Bay
Fangar Bay
Mediterranean Sea
N
2 Km
Urban areas
Marshes and Wetlands
Saltpans
SPAIN
FRANCE

GENERAL INTRODUCTION
24
composition; since many of those species are endemic (Ibáñez et al., 1999). Different
human activities occur in this area e.g. tourism, shooting, recreational and
commercial fishing; but the most important, likewise the whole basin, is agriculture
with ca. 21.000 ha of Delta dedicated to rice fields. As a consequence the entire
Delta-Estuary complex is under permanent anthropogenic pressures. Therefore, its
conservation should be a priority task.
The Ebro River flows into the Mediterranean Sea and forms a Type 4-highly
stratified or salt wedge estuary (Hansen and Rattray, 1966; Muñoz and Prat, 1989;
Muñoz, 1990; Ibáñez, 1993; Ibáñez et al., 1997). The specific characteristics of salt
wedge estuaries are: (i) river discharge controls marine intrusion due to the low tidal
range (usually tidal amplitude is less than 2 m); (ii) weak mixing forces enhance
strong water column stratification and promote the formation of a salt wedge
landwards; (iii) vertical profile of density and salinity shows an abrupt change from
surface to bottom, friction between fresh and saltwater layers forms a narrow
interface called halocline; (iv) isohalines are arranged horizontally and (v) if
sediment load is high, a Delta may be formed. The Ebro Estuary is about 32 km long,
with a mean width of 240 m and a mean water depth of 7 m. The tidal range in this
area is low, ca. 20 cm (Cacchione et al., 1990), and the low tidal amplitude promotes
the formation of the salt wedge, which is controlled by river discharge (advance,
retreat and permanence). Summarizing, salt wedge dynamics in the Ebro Estuary,
when river flow exceeds 350-400 m3 s-1, the salt wedge is pushed seawards and the
estuary works as a river, this event was denominated ‘fluvial estuarine stretch’ by
Ibáñez, 1993; on the contrary, the salt wedge reaches its maximum landwards (ca.
30-32 km from the river mouth) with flows lower than 100 m3 s-1 (Ibáñez, 1993;
Ibáñez et al., 1997). Regarding anthropogenic activities causing environmental stress
on the lower Ebro river and its estuary, the most remarkable impacts are on one hand
nutrient enrichment, not only in river water because of input of agricultural and urban
sewage effluents on whole basin (Terrado et al., 2006; Falcó et al., 2010), but also in
the marine plume (Sierra et al., 2002; Falcó et al., 2010); on the other hand,
GENERAL INTRODUCTION
25
damming and water regulation cause the worst negative effects on estuarine ecology
such as sediment loss (Ibáñez et al., 1997), that led to changes in bottom
granulometry in addition to habitat loss and Delta regression. Water regulation
buffers seasonality of river discharges that are homogenized throughout the year
(Muñoz and Prat, 1989). Thus, the only variations occurring in the flow are directly
related to hydroelectric power generation or agricultural usage (Muñoz and Prat,
1989; Ibáñez et al., 1996, 2008; Sierra et al., 2004; Falcó et al., 2010). These
artificial flows assure the presence of the salt wedge practically in the same position
for long periods (Ibáñez et al., 1995; Sierra et al., 2002; Falcó et al., 2010).
Additionally, water quality below the halocline gets worse due to different factors:
low water renewal rate, the chemical reactions at the sediment surface releasing
nutrients, and the deposition of materials; accentuating eutrophication and oxygen
depletion through microbial consumption of the DO (Largier 1993; Pierson et al.,
2002).
2.5. Thesis justification
This PhD thesis is the result of a three years study focused on the ecology of benthic
macroinvertebrate community inhabiting the Ebro Estuary, a Mediterranean salt
wedge estuary. Research on macroinvertebrate communities is interesting because
they integrate information about the functioning of the whole ecosystem as they play
essential ecological roles at different ecological scales. Moreover, research focused
on estuaries, and more concretely on salt wedge type, needs to be investigated due to
the scarce information available.
As already mentioned, regardless of the ecological and socio-economic relevance of
estuaries, they have received less attention from limnologist and oceanographers who
usually center their research in freshwater or fully marine ecosystems, respectively.
Probably, this is because estuaries are transitional ecosystems between rivers and
seas and this ‘transitional’ condition implies certain indolence from purist

GENERAL INTRODUCTION
26
researchers. Regarding estuarine research, the majority of studies focused on
macroinvertebrate or other biological communities are conducted on well-mixed
temperate estuaries, where longitudinal gradients are well established. Despite the
singularities of salt wedge estuaries, research on their biological communities is still
neglected, although this type of estuaries is well-represented along microtidal coasts
worldwide (as it is shown in the ‘2.1 Estuaries: Definition and Classification’
section).
During the whole research period (mainly, scientific articles and thesis manuscript
writing) that led to this PhD, bibliographic searches performed on this topic produced
only a few results. In fact, most of scientific papers related to salt wedge estuaries
have been focused primarily on hydrological research paying no attention to
biological communities. In the case of the Ebro Estuary, in spite of constituting the
perfect frame for that purpose, due to its heterogeneity and ecological relevance, it
showed the same tendency, being extensively studied in relation to its hydrology and
salt wedge dynamics (e.g. Ibáñez, 1993; Ibáñez et al., 1997, 1999; Sierra et al., 2002,
2004; Falcó et al., 2010, among others). Regarding biological communities, only a
few studies performed in the Delta-Estuary complex, provide some ‘outdated’
information about biological communities (fishes and macroinvertebrates) (e.g. De
Sostoa, 1983; Muñoz, 1990; Capaccioni-Azzati and Martín, 1992; Muñoz and Prat,
1994; Ibáñez et al., 1995; Martín et al., 2000). In recent years, the increased interest
of studying the ecology of the lower Ebro River and its Delta-Estuary complex
increased, together with the WFD impulse, and the increasing environmental
concerning, has resulted in several scientific papers and PhD thesis published e.g.
Rovira et al., 2009, 2012b; Cid, 2010; Nebra et al., 2011, 2014; Rovira, 2013;
Rodríguez-Climent et al., 2013; Rodríguez-Climent, 2014.
Finally, recent changes in environmental condition of the Ebro River (mainly,
nutrients loads in the whole basin and water regulation) have implied important
changes on the estuarine environmental condition, its ecological dynamics and
therefore on biological communities. This fact implied that 90’s decade studies

GENERAL INTRODUCTION
27
become obsolete with regards species composition and ecological dynamics. As a
consequence, the study of the current macroinvertebrate community of the Ebro
Estuary, is an imperative requirement to suggest assessment measures (in
combination with other BQEs) to prevent or reduce the environmental decline of the
Ebro Estuary.
2.6. References
Amiard-Triquet, C., Rainbow, P.S., 2009. Environmental assessment of estuarine
ecosystems: a case study. CRC press.
Attrill, M.J., Thomas, R.M., 1996. Long-term distribution patterns of mobile
estuarine invertebrates (Ctenophora, Cnidaria, Crustacea: Decapoda) in
relation to hydrological parameters. Marine Ecology Progress Series 143, 25-
36.
Barnes, R.S.K., 1974. Estuarine biology. Edward Arnold London.
Batalla, R.J., Gómez, C.M., Kondolf, G.M., 2004. Reservoir-induced hydrological
changes in the Ebro River basin (NE Spain). Journal of Hydrology 290, 117-
136.
Benedetti-Cecchi, L., Bulleri, F., Cinelli, F., 2000. The interplay of physical and
biological factors in maintaining mid-shore and low-shore assemblages on
rocky coasts in the north-west Mediterranean. Oecologia 123, 406-417.
Bianchi, T.S., 2006. Biogeochemistry of estuaries. Oxford University Press.
Biggs, R.B., Cronin, L.E., 1981. Special characteristics of estuaries, Estuaries and
Nutrients. Springer, pp. 3-23.
Bock, M.T., Miller, B.S., Bowman, A.W., 1999. Assessment of eutrophication in the
Firth of Clyde: Analysis of coastal water data from 1982 to 1996. Marine
Pollution Bulletin 38, 222-231.

GENERAL INTRODUCTION
28
Borcard, D., Legendre, P., Drapeau, P., 1992. Partialling out the spatial component of
ecological variation. Ecology 73, 1045-1055.
Borja, A., Franco, J., Perez, V., 2000. A marine Biotic Index to establish the
ecological quality of soft-bottom benthos within European estuarine and
coastal environments. Marine Pollution Bulletin 40, 1100-1114.
Borja, A., Miles, A., Occhipinti-Ambrogi, A., Berg, T., 2009. Current status of
macroinvertebrate methods used for assessing the quality of European
marine waters: implementing the Water Framework Directive. Hydrobiologia
633, 181-196.
Bortone, S.A., 2004. Estuarine indicators. CRC press.
Boynton, W.R., Garber, J.H., Summers, R., Kemp, W.M., 1995. Inputs,
Transformations, and Transport of Nitrogen and Phosphorus in Chesapeake
Bay and Selected Tributaries. Estuaries 18, 285-314.
Brusca, R.C., Brusca, G.J., Haver, N.J., 1990. Invertebrates. Sinauer Associates
Sunderland, Massachusetts.
Bustos-Baez, S., Frid, C., 2003. Using indicator species to assess the state of
macrobenthic communities. Hydrobiologia 496, 299-309.
Cacchione, D.A., Drake, D.E., Losada, M.A., Medina, R., 1990. Bottom-boundary
layer measurements on the continental shelf off the Ebro River, Spain.
Marine Geology 95, 179-192.
Cameron, W.M., Pritchard, D.W., 1963. Estuaries, 306-324, The Sea. New York:
Wiley
Cantillo, A.Y., 1998. Comparison of results of mussel watch programs of the United
States and France with worldwide mussel watch studies. Marine Pollution
Bulletin 36, 712-717.

GENERAL INTRODUCTION
29
Capaccioni-Azzati, R., Martín, D., 1992. Pseudomastus deltaicus, gen. et sp. n.
(Polychaeta: Capitellidae) from a shallow-water bay in the North-Western
Mediterranean Sea. Zoologica scripta 21, 247-250.
Carriker, M.R., 1967. Ecology of estuarine benthic invertebrates: a perspective,
Estuaries. American Association for the Advancement of Science
Washington DC, pp. 442-487.
Cid, N., 2010. Ecology of the Benthic Macroinvertebrates in the lower Ebro River,
Community Characterization, Population Dynamics and Bioaccumulation of
Pollutants in Response to Environmental Factors). PhD Thesis. University of
Barcelona, Catalonia.
Clean Water Act, 1972. Clean Water Act of 1972, Public Law, p. 500.
Cloern, J.E., 2001. Our evolving conceptual model of the coastal eutrophication
problem. Marine Ecology-Progress Series 210, 223-253.
Colomé, J.V.F., Sancho, J.C., Comín, F.A., 1997. Los medios acuáticos del delta del
Ebro y su capacidad de producción.
Constable, A.J., 1999. Ecology of benthic macro-invertebrates in soft-sediment
environments: A review of progress towards quantitative models and
predictions. Australian Journal of Ecology 24, 452-476.
Crooks, S., Turner, R.K., 1999. Integrated coastal management: sustaining estuarine
natural resources. Advances in ecological research 29, 241-289.
Dauer, D.M., 1993. Biological criteria, environmental-health and estuarine
macrobenthic community structure. Marine Pollution Bulletin 26, 249-257.
Dauer, D.M., Ranasinghe, J.A., Weisberg, S.B., 2000. Relationships between benthic
community condition, water quality, sediment quality, nutrient loads, and
land use patterns in Chesapeake Bay. Estuaries 23, 80-96.
Dauvin, J.C., 2007. Paradox of estuarine quality: benthic indicators and indices,
consensus or debate for the future. Marine Pollution Bulletin 55, 271-281.

GENERAL INTRODUCTION
30
Dauvin, J.C., Ruellet, T., 2007. Polychaete/amphipod ratio revisited. Marine
Pollution Bulletin 55, 215-224.
Day, J.H., 1981. The nature, origin and classification of estuaries. Pp: 1-6. Estuarine
Ecology with Particular Reference to Southern Africa, AA Blakema, Cape
Town.
Day Jr, J.W., Kemp, W.M., Alejandro, Y., Crump, B.C., 2012. Estuarine ecology.
John Wiley & Sons, New York.
Day, J.W., Maltby, E., Ibáñez, C., 2006. River basin management and delta
sustainability: A commentary on the Ebro Delta and the Spanish National
Hydrological Plan. Ecological Engineering 26, 85-99.
Day, J.W., Martin, J.F., Cardoch, L., Templet, P.H., 1997. System functioning as a
basis for sustainable management of deltaic ecosystems. Coastal
Management 25, 115-153.
De Sostoa, A., 1983. Las comunidades de peces del Delta del Ebro. Tesis doctoral.
Universidad de Barcelona. Barcelona.
Díaz, R.J., 2001. Overview of hypoxia around the world. Journal of Environmental
Quality 30, 275-281.
Duarte, C.M., Borja, A., Carstensen, J., Elliott, M., Krause-Jensen, D., Marba, N.,
2015. Paradigms in the recovery of estuarine and coastal ecosystems.
Estuaries and Coasts, 1-11.
Dukes, J.S., Mooney, H.A., 1999. Does global change increase the success of
biological invaders? Trends in Ecology & Evolution 14, 135-139.
Edgar, G.J., Barrett, N.S., Last, P.R., 1999. The distribution of macroinvertebrates
and fishes in Tasmanian estuaries. Journal of Biogeography 26, 1169-1189.
Elliott, M., McLusky, D.S., 2002. The need for definitions in understanding
estuaries. Estuarine, Coastal and Shelf Science 55, 815-827.

GENERAL INTRODUCTION
31
Elliott, M., Quintino, V., 2007. The estuarine quality paradox, environmental
homeostasis and the difficulty of detecting anthropogenic stress in naturally
stressed areas. Marine Pollution Bulletin 54, 640-645.
European Parliament, 2000. Directive-2000/60/EC of the European Parliament and
of the council establishing a framework for the community action in the field
of water policy. Off. J. Eur. Union 327, 1-73.
European Parliament, 2008. Directive-2008/56/EC of the European Parliament and
of the council establishing a framework for the community action in the field
in the field of marine environmental policy. Off. J. Eur. Union 164,19-40
Fairbridge, R.W., 1980. The estuary: its definition and geodynamic cycle. Chemistry
and biogeochemistry of estuaries 1136.
Falcó, S., Niencheski, L.F., Rodilla, M., Romero, I., del Rio, J.G., Sierra, J.P.,
Mosso, C., 2010. Nutrient flux and budget in the Ebro estuary. Estuarine
Coastal and Shelf Science 87, 92-102.
Giberto, D.A., Bremec, C.S., Cortelezzi, A., Capitulo, A.R., Brazeiro, A., 2007.
Ecological boundaries in estuaries: macrobenthic beta-diversity in the Rio de
la Plata system (34-36 degrees S). Journal of the Marine Biological
Association of the United Kingdom 87, 377-381.
Grall, J., Glemarec, M., 1997. Using biotic indices to estimate macrobenthic
community perturbations in the Bay of Brest. Estuarine Coastal and Shelf
Science 44, 43-53.
Gray, J.S., M. Elliott, 2009. The ecology of marine sediments, Second edition ed.
Cambridge University Press, Cambridge
Grebmeier, J.M., McRoy, C.P., Feder, H.M., 1988. Pelagic-benthic coupling on the
shelf of the northern Bering and Chukchi seas. I. Food-supply source and
benthic biomass. Marine Ecology Progress Series 48, 57-67.

GENERAL INTRODUCTION
32
Hanninen, J., Vuorinen, I., Helminen, H., Kirkkala, T., Lehtila, K., 2000. Trends and
gradients in nutrient concentrations and loading in the Archipelago Sea,
northern Baltic, in 1970-1997. Estuarine Coastal and Shelf Science 50, 153-
171.
Hansen, D.V., Rattray, M., 1966. New dimensions in estuary classification.
Limnology and Oceanography 11, 319-326.
Hayes, M.O., 1975. Morphology and sand accumulations in estuaries, ed. LE Cronin,
Estuarine Research. Academic Press, New York 2, 3-22.
Ibáñez, C., 1993. Dinamica hidrologica i funcionament ecologic del tram estuari del
Ebre. Tesi doctoral. Universitat de Barcelona. Barcelona.
Ibáñez, C., Alcaraz, C., Caiola, N., Rovira, A., Trobajo, R., Alonso, M., Durán, C.,
Jiménez, P.J., Munné, A., Prat, N., 2012a. Regime shift from phytoplankton
to macrophyte dominance in a large river: Top-down versus bottom-up
effects. Science of the Total Environment 416, 314-322.
Ibáñez, C., Caiola, N., Rovira, A., Real, M., 2012b. Monitoring the effects of floods
on submerged macrophytes in a large river. Science of the Total
Environment 440, 132-139.
Ibáñez, C., Day, J.W., Reyes, E., 2014. The response of deltas to sea-level rise:
natural mechanisms and management options to adapt to high-end scenarios.
Ecological Engineering 65, 122-130.
Ibáñez, C., Morris, J.T., Mendelssohn, I.A., Day, J.W., 2012c. Coastal marshes,
Estuarine Ecology, Second Edition, pp. 129-163.
Ibáñez, C., Pont, D., Prat, N., 1997. Characterization of the Ebre and Rhone
estuaries: A basis for defining and classifying salt-wedge estuaries.
Limnology and Oceanography 42, 89-101.

GENERAL INTRODUCTION
33
Ibáñez, C., Prat, N., Canicio, A., 1996. Changes in the hydrology and sediment
transport produced by large dams on the lower Ebro river and its estuary.
Regulated Rivers-Research & Management 12, 51-62.
Ibáñez, C., Prat, N., Canicio, A., Curcó, A., 1999. El delta del Ebro: un sistema
amenazado. Bakeaz.
Ibáñez, C., Prat, N., Durán, C., Pardos, M., Munné, A., Andreu, R., Caiola, N., Cid,
N., Hampel, H., Sánchez, R., Trobajo, R., 2008. Changes in dissolved
nutrients in the lower Ebro River: Causes and consequences. Limnetica 27,
131-142.
Ibáñez, C., Rodrigues-Capitulo, A., Prat, N., 1995. The combined impacts of river
regulation and eutrophication on the dynamics of the salt wedge and the
ecology of the lower Ebro River (north-east Spain), Ecological Basis for
River Management, pp. 105-113.
Jones, C.G., Lawton, J.H., Shachak, M., 1996. Organisms as ecosystem engineers,
Ecosystem management. Springer, pp. 130-147.
Josefson, A.B., Hansen, J.L.S., 2004. Species richness of benthic macrofauna in
Danish estuaries and coastal areas. Global Ecology and Biogeography 13,
273-288.
Justic, D., Rabalais, N.N., Turner, R.E., Dortch, Q., 1995. Changes in Nutrient
Structure of River-Dominated Coastal Waters - Stoichiometric Nutrient
Balance and Its Consequences. Estuarine Coastal and Shelf Science 40, 339-
356.
Kapitza, S.P., 2009. Global Population Blow-up and After: The Demographic
Revolution and Sustainable Development. Bull. Georg. Natl. Acad. Sci 3, 5-
12.
Karlson, K., Rosenberg, R., Bonsdorff, E., 2002. Temporal and spatial large-scale
effects of eutrophication and oxygen deficiency on benthic fauna in

GENERAL INTRODUCTION
34
Scandinavian and Baltic waters - A review, Oceanography and Marine
Biology, Vol 40, pp. 427-489.
Karr, J.R., Chu, E.W., 1999. Restoring life in running waters: better biological
monitoring. Island Press.
Kernan, M., 2015. Climate change and the impact of invasive species on aquatic
ecosystems. Aquatic Ecosystem Health & Management, 00-00.
Largier, J.L., 1993. Estuarine fronts - how important are they. Estuaries 16, 1-11.
Mannino, A., Montagna, P.A., 1997. Small-scale spatial variation of macrobenthic
community structure. Estuaries 20, 159-173.
Martin, D., Pinedo, S., Sardá, R., 2000. Distribution patterns and trophic structure of
soft-bottom polychaete assemblages in a north-western Mediterranean
shallow-water bay. Ophelia 53, 1-17.
McDonald, B.S., Mullins, G.W., Lewis, S., 1991. Macroinvertebrates as indicators of
stream health. The American Biology Teacher, 462-466.
McLusky, D.S., 1999. Estuarine benthic ecology: A European perspective.
Australian Journal of Ecology 24, 302-311.
McLusky, D.S., Elliott, M., 2004. The estuarine ecosystem: ecology, threats and
management. Third edition. The estuarine ecosystem: ecology, threats and
management. Third edition., pp. i-viii, 1-214.
Morrisey, D.J., Howitt, L., Underwood, A.J., Stark, J.S., 1992. Spatial variation in
soft-sediment benthos. Marine Ecology-Progress Series 81, 197-204.
Muñoz, I., 1990. Limnologia de la part baixa del riu Ebre i els canals de reg: els
factors fisico-quimics, el fitoplancton i els macroinvertebrats bentonics. Tesi
doctoral. Universitat de Barcelona. Barcelona.
Muñoz, I., Prat, N., 1989. Effects of river regulation on the lower Ebro river (NE
Spain). Regulated rivers: research & management 3, 345-354.

GENERAL INTRODUCTION
35
Muñoz, I., Prat, N., 1994. Macroinvertebrate community in the lower Ebro river (NE
Spain). Hydrobiologia 286, 65-78.
Muxika, I., Borja, A., Bald, J., 2007. Using historical data, expert judgement and
multivariate analysis in assessing reference conditions and benthic ecological
status, according to the European Water Framework Directive. Marine
Pollution Bulletin 55, 16-29.
Navarro-Ortega, A., Tauler, R., Lacorte, S., Barcelo, D., 2010. Occurrence and
transport of PAHs, pesticides and alkylphenols in sediment samples along
the Ebro River Basin. Journal of Hydrology 383, 5-17.
Nebra, A., Caiola, N., Ibanez, C., 2011. Community structure of benthic
macroinvertebrates inhabiting a highly stratified Mediterranean estuary.
Scientia Marina 75, 577-584.
Nebra, A., Caiola, N., Muñoz-Camarillo, G., Rodríguez-Climent, S., Ibáñez, C.,
2014. Towards a suitable ecological status assessment of highly stratified
Mediterranean estuaries: A comparison of benthic invertebrate fauna indices.
Ecological Indicators 46, 177-187.
Nedwell, D.B., Jickells, T.D., Trimmer, M., Sanders, R., 1999. Nutrients in estuaries,
Advances in Ecological Research, Vol 29: Estuaries, pp. 43-92.
Newman, M.C., Roberts, M.H., Hale, R.C., 2002. Coastal and estuarine risk
assessment. Lewis Publishers.
Pearson, T.H., Rosenberg, R., 1978. Macrobenthic succession in relation to organic
enrichment and pollution of the marine environment. Oceanography and
Marine Biology an Annual Review 16, 229-311.
Perillo, G.M.E., 1995. Definitions and geomorphologic classifications of estuaries.
Geomorphology and sedimentology of estuaries. Developments in
Sedimentology 53, 17-47.

GENERAL INTRODUCTION
36
Perus, J., Bonsdorff, E., Back, S., Lax, H.G., Villnas, A., Westberg, V., 2007.
Zoobenthos as indicators of ecological status in coastal brackish waters: A
comparative study from the Baltic Sea. Ambio 36, 250-256.
Pierson WL, B.K., Van Senden D, Horton PR, Adamantilis CA 2002. Environmental
water requirements to maintain estuarine processes, Environmental Flows
Initiative Technical Report Number 3.
Pinedo, S., Jordana, E., Ballesteros, E., 2015. A critical analysis on the response of
macroinvertebrate communities along disturbance gradients: description of
MEDOCC (MEDiterranean OCCidental) index. Marine Ecology 36, 141-
154.
Potter, I.C., Chuwen, B.M., Hoeksema, S.D., Elliott, M., 2010. The concept of an
estuary: a definition that incorporates systems which can become closed to
the ocean and hypersaline. Estuarine, Coastal and Shelf Science 87, 497-500.
Pritchard, D.W., 1955. Estuarine circulation patterns. Johns Hopkins University,
Chesapeake Bay Institute.
Pritchard, D.W., 1967. Observations of circulation in coastal plain estuaries.
Rahel, F.J., Bierwagen, B., Taniguchi, Y., 2008. Managing aquatic species of
conservation concern in the face of climate change and invasive species.
Conservation Biology 22, 551-561.
Rahel, F.J., Olden, J.D., 2008. Assessing the effects of climate change on aquatic
invasive species. Conservation Biology 22, 521-533.
Rakocinski, C.F., Zapfe, G.A., 2005. Macrobenthic process indicators of estuarine
condition. Estuarine indicators. CRC Press, Boca Raton, FL, 315-331.
Remane, A., 1934. Die brackwasserfauna. Verhandlungen der Deutschen
Zoologischen Gesellschaft 36, 34-74.
Remane, A., Schlieper, C., 1958. Die biologie des brackwassers. E. Schweizerbart.

GENERAL INTRODUCTION
37
Remane, A., Schlieper, C., 1971. Biology of brackish water. Wiley (Interscience),
New York.
Ricciardi, A., 2007. Are modern biological invasions an unprecedented form of
global change? Conservation Biology 21, 329-336.
Rodríguez Climent, S., 2014. Assessing the impacts of human activities on the fish
assemblages from the Ebro Delta coastal lagoons: towards a sustainable
management model. PhD Thesis. University of Barcelona. Barcelona.
Rodríguez-Climent, S., Caiola, N., Ibáñez, C., 2013. Salinity as the main factor
structuring small-bodied fish assemblages in hydrologically altered
Mediterranean coastal lagoons. Scientia Marina 77, 37-45.
Rovira, A., Alcaraz, C., Ibáñez, C., 2012a. Spatial and temporal dynamics of
suspended load at-a-cross-section: The lowermost Ebro River (Catalonia,
Spain). Water research 46, 3671-3681.
Rovira, L., Trobajo, R., Ibanez, C., 2009. Periphytic diatom community in a
Mediterranean salt wedge estuary: the Ebro Estuary (NE Iberian Peninsula).
Acta Botanica Croatica 68, 285-300.
Rovira, L., Trobajo, R., Leira, M., Ibáñez, C., 2012b. The effects of hydrological
dynamics on benthic diatom community structure in a highly stratified
estuary: the case of the Ebro Estuary (Catalonia, Spain). Estuarine, Coastal
and Shelf Science 101, 1-14.
Rovira Torres, L., 2014. The ecology and taxonomy of estuarine benthic diatoms and
their use as bioindicators in a highly stratified estuary (Ebro Estuary, NE
lberian Peninsula): a multidisciplinary approach. PhD Thesis. University of
Barcelona. Barcelona.
Russell, M.J., Montagna, P.A., Kalke, R.D., 2006. The effect of freshwater inflow on
net ecosystem metabolism in Lavaca Bay, Texas. Estuarine Coastal and Shelf
Science 68, 231-244.

GENERAL INTRODUCTION
38
Schaffner, L.C., 1990. Small-scale organism distributions and patterns of species-
diversity - evidence for positive interactions in an estuarine benthic
community. Marine Ecology-Progress Series 61, 107-117.
Schlacher, T.A., Wooldridge, T.H., 1996. Axial zonation patterns of subtidal
macrozoobenthos in the Gamtoos estuary, South Africa. Estuaries 19, 680-
696.
Sierra, J.P., Sanchez-Arcilla, A., Del Río, J.G., Flos, J., Movellán, E., Mosso, C.,
Martínez, R., Rodilla, M., Falcó, S., Romero, I., 2002. Spatial distribution of
nutrients in the Ebro estuary and plume. Continental Shelf Research 22, 361-
378.
Sierra, J.P., Sanchez-Arcilla, A., Figueras, P.A., Del Río, J.G., Rassmussen, E.K.,
Mosso, C., 2004. Effects of discharge reductions on salt wedge dynamics of
the Ebro River. River Research and Applications 20, 61-77.
Simboura, N., Zenetos, A., 2002. Benthic indicators to use in ecological quality
classification of Mediterranean soft bottom marine ecosystems, including a
new biotic index. Mediterranean Marine Science 3, 77-111.
Slaus, I., Jacobs, G., 2011. Human capital and sustainability. Sustainability 3, 97-
154.
Stachowicz, J.J., Terwin, J.R., Whitlatch, R.B., Osman, R.W., 2002. Linking climate
change and biological invasions: ocean warming facilitates nonindigenous
species invasions. Proceedings of the National Academy of Sciences 99,
15497-15500.
Tagliapietra, D., Sigovini, M., Ghirardini, A.V., 2009. A review of terms and
definitions to categorise estuaries, lagoons and associated environments.
Marine and Freshwater Research 60, 497-509.

GENERAL INTRODUCTION
39
Terrado, M., Barcelo, D., Tauler, R., 2006. Identification and distribution of
contamination sources in the Ebro river basin by chemometrics modelling
coupled to geographical information systems. Talanta 70, 691-704.
Valle-Levinson, A., 2010. Contemporary issues in estuarine physics. Cambridge
University Press.
Vasconcelos, R.P., Reis-Santos, P., Fonseca, V., Maia, A., Ruano, M., França, S.,
Vinagre, C., Costa, M.J., Cabral, H., 2007. Assessing anthropogenic
pressures on estuarine fish nurseries along the Portuguese coast: a multi-
metric index and conceptual approach. Science of the Total Environment
374, 199-215.
Wallace, J.B., Webster, J.R., 1996. The role of macroinvertebrates in stream
ecosystem function. Annual review of entomology 41, 115-139.
Wang PF, M.J., Morrison G, 1999. Water quality and eutrophication on Tampa Bay,
Florida. Estuarine, Coastal and Shelf Science 49, 1-20.
Warwick, R.M., 1986. A New Method for Detecting Pollution Effects on Marine
Macrobenthic Communities. Marine Biology 92, 557-562.
Wu, R.S.S., Shin, P.K.S., 1997. Sediment characteristics and colonization of soft-
bottom benthos: A field manipulation experiment. Marine Biology 128, 475-
487.
Ysebaert, T., Herman, P.M.J., Meire, P., Craeymeersch, J., Verbeek, H., Heip,
C.H.R., 2003. Large-scale spatial patterns in estuaries: estuarine
macrobenthic communities in the Schelde estuary, NW Europe. Estuarine
Coastal and Shelf Science 57, 335-355.
Ysebaert, T., Meire, P., Coosen, J., Essink, K., 1998. Zonation of intertidal
macrobenthos in the estuaries of Schelde and Ems. Aquatic Ecology 32, 53-
71.

GENERAL INTRODUCTION
40
Zaldívar JM, C.A., Viaroli P, Newton A, de Wit R, Ibáñez C, Reizopoulou S,
Somma F, Razinkovas A, Basset A, Holmer M, Murray N, 2008.
Eutrophication in transitional waters: an overview. Transitional Waters
Monograph 1(2008), 1-78.

41
3 OBJECTIVES
The main objective of the present PhD thesis was to analyze the ecology of the
benthic macroinvertebrate community from the Ebro Estuary in order to evaluate its
potential use as biological indicator of highly stratified Mediterranean estuaries. To
achieve this goal the study of the macroinvertebrate community was carried out at a
high level of taxonomic resolution and its spatiotemporal dynamics in relation with
the estuarine environmental gradients was assessed. An exhaustive environmental
description of benthic condition of the Ebro Estuary was done, including water
physico-chemistry, grain size characterization and total organic estimation in
sediments. Furthermore, due to the relevance of river discharge on salt wedge
dynamics and therefore on estuarine benthic ecology, a comparison between current
salt wedge dynamics and past near natural conditions was done using historical data
available at the Ebro basin authority database. Finally, the bioindicator potential of
macroinvertebrates to assess the ES according to the WFD criteria was examined
throughout the analysis of the response of macrozoobenthos based metrics to the
main human pressures in the Ebro estuary, nutrient enrichment and altered flow
regime.
This thesis is structured in three chapters, each one corresponding to a scientific
paper either published or submitted for its publication in peer reviewed journals. The
outcomes of each paper allow the achievement of specific objectives (see below the
specific objectives of each chapter), wheras the thre papers altogether allow reaching
the main goal. Two chapters are already published and one is currently under review
(submitted to Marine Environmental Research). Although the second paper is not yet
published, the chapter ordination was chosen for a better comprehension and to

OBJECTIVES
42
follow the conclusions presented in this thesis. More concretely, each chapter aimed
to respond the following issues:
Chapter I
This chapter covers the detailed description of benthic macroinvertebrate community
of the Ebro Estuary at a high level of taxonomic resolution, together with the
environmental characterization of the benthic condition of the estuary. Thus, this
chapter provides essential information about the Ebro Estuary; more specifically, this
chapter pursued the following specific objectives:
- Description and characterization of the benthic macroinvertebrates
community from the Ebro Estuary with regard to species composition,
abundance and community structure (diversity, equitability and trophic
structure).
- Description and characterization of the benthic conditions of the Ebro
estuary regarding hydromorphological and physico-chemical parameters.
- Identification of spatial and temporal patterns in the macroinvertebrate
community.
- Identify the main environmental drivers explaining the observed patterns.
- Identify the most representative species-complex inhabiting the Ebro Estuary
and their comparison with other temperate estuaries.
Chapter II
The second chapter is focused on the analysis of macrofauna response to
environmental constraints. Concretely, this chapter analyzes how environmental
factors are determining the distribution of the Ebro Estuary macroinvertebrate
assemblages identified in the first chapter; more specifically, this chapter pursued the
following specific objectives:
OBJECTIVES
43
- Analyze the degree of association of each species with the environmental
parameters and describe the main abiotic factors affecting benthic
communities in this type of estuary.
- Study the relationship between the species-environment associations and the
observed spatial patterns.
- Describe the distribution pattern, along spatial and temporal scales, that best
fits with the Ebro Estuary macroinvertebrate community.
- Based on the observed gradients and patterns of the benthic
macroinvertebrates, discuss on the adequacy of consider the Ebro estuary as
an ecotone, from an ecological boundary perspective.
Chapter III
Finally, the third chapter purpose is to set a baseline for a suitable ES assessment of
Ebro Estuary and, by extension, for Mediterranean salt wedge estuaries, dealing with
the main anthropogenic pressures affecting Mediterranean basins such as organic
enrichment and water regulation issues. This chapter pursued the following specific
objectives:
- Development of synthetic indices describing the most important human
pressures in the Ebro estuary influencing the ES, organic and nutrient
enrichment and salt wedge dynamics alteration.
- Evaluate the performance of existing BIs developed under WFD criteria
throughout the analysis of their responses to the developed pressure indices.
- Evaluate the performance of macroinvertebrates based metrics (individual
metrics from the existing BIs and other common metrics used to assess the
ES of surface waters) throughout the analysis of their responses to the
developed pressure indices.
- Definition of potential macroinvertebrates based metrics to be used in a
future BI to assess the ES of Mediterranean highly stratified estuaries.


45
4 CHAPTERS

47
CHAPTER I
Community structure of benthic macroinvertebrates
inhabiting a highly stratified Mediterranean estuary
Nebra A, Caiola N, Ibáñez C.
Scientia Marina (2011) 75(3): 577-584


CHAPTER I: Benthic macroinvertebrates of the Ebro estuary
49
Community structure of benthic macroinvertebrates
inhabiting a highly stratified Mediterranean estuary
Alfonso Nebra, Nuno Caiola* and Carles Ibáñez
IRTA Aquatic Ecosystems, Ctra. de Poble Nou, km 5.5, E-43540, Sant Carles
de la Ràpita, Tarragona, Spain. E-mail: [email protected]*
ABSTRACT
The community composition and spatial distribution of benthic macroinvertebrates
were studied along the Ebro estuary, a highly stratified estuary located in the NE
Iberian Peninsula. During the last decade the oligotrophication process occurring in
the lower Ebro River and its estuary has allowed a complex benthic
macroinvertebrate community to become established; these results contrast with the
poor community found there in the early nineties. A total of 214 taxa were identified,
and polychaetes dominated the community both in abundance and species richness.
The results showed spatial differences in the structure and composition of
macroinvertebrates, which suggests that there are two distinct communities along the
estuary. Each community was found in a specific stretch (upper and lower estuary)
in function of the presence of the salt wedge. The macrobenthos of the upper estuary
was dominated by freshwater taxa, but some euryhaline species were also found. The
lower estuary showed a marine community typical of shallow Mediterranean
environments. The transition between these two communities fits an ecotone model.
The highest abundances, richness and diversities were recorded at the lower
estuarine stations, especially those closer to the river mouth, whereas the lowest
values corresponded to the stations adjacent to the tip of the salt wedge.

A. Nebra, N. Caiola & C. Ibáñez
50
Keywords: benthic macroinvertebrates, community structure, distribution patterns,
salt wedge, highly stratified estuary, Ebro estuary.
1. INTRODUCTION
The Ebro estuary (NE, Iberian Peninsula) is a salt wedge or highly stratified estuary
(Hansen and Rattray, 1966; Ibáñez et al., 1997). The specific characteristics of salt
wedge estuaries are: (i) the river discharge controls the marine intrusion mainly due
to the low tidal range (usually with an amplitude less than 2 meters); (ii) weak
mixing effects cause the water column to be strongly stratified; (iii) the vertical
profile of density and salinity shows a marked change with a narrow interface
between layers called haloclines; and (iv) the isohalines are arranged horizontally.
Although this kind of estuary is well represented along microtidal coasts worldwide
(e.g. the Mediterranean Sea and the Gulf of Mexico), there is little research on the
macroinvertebrate communities that inhabit them. The Ebro estuary has been
extensively studied in relation to its hydrology and salt wedge dynamics (e.g. Ibáñez
et al., 1997, 1999; Sierra et al., 2002, 2004), and some benthic communities of
adjacent areas have also been studied (Capaccioni-Azzati and Martín, 1992; Martín
et al., 2000). A few studies have focused on the biota of the estuary (e.g. Rovira et
al., 2009), but only one includes a brief description of its macroinvertebrate
community (Ibáñez et al., 1995). Furthermore, this study was performed when the
lower Ebro River and its estuary were under severe eutrophic conditions, very
different from the present situation. Highly fluctuating estuarine systems produce
strong environmental gradients, which leads to a patchy distribution of organisms
that must cope with a wide variety of stresses (Morrisey et al., 1992; Gray and
Elliott, 2009) due to both natural and anthropogenic factors (McLusky, 1999; Dauer
et al., 2000; Dauvin, 2007; Elliott and Quintino, 2007). Therefore, the benthic
invertebrate communities, often used as indicators of the health of an ecosystem, can
be very similar in both impacted and non-disturbed estuarine systems. This therefore
increases the difficulty of distinguishing natural from anthropogenic stresses. The
CHAPTER I: Benthic macroinvertebrates of the Ebro estuary
51
Estuarine Quality Paradox concept (Dauvin, 2007; Elliott and Quintino, 2007) refers
to the challenge of detecting anthropogenic impacts in naturally stressed systems
using biological assessment methods. In Mediterranean regions and particularly in
the Iberian Peninsula, besides the spatial fluctuation there is strong temporal
environmental variability in the aquatic systems due to limited water availability
during part of the year (Caiola et al., 2001; Ferreira et al., 2007a). This variability is
exacerbated by a long history of human-induced pressures that have led to serious
changes in the natural ecological cycles of estuarine systems from this region
(Ferreira et al., 2007b). Therefore, identifying the factors that structure the benthic
macroinvertebrate community of the Ebro estuary will provide a clearer
understanding of the ecological functioning of the system both at the spatial and
temporal scales. Moreover, it will help to interpret the recent changes in the estuarine
system observed during the last two decades (Ibáñez et al., 2008). Therefore, this
study establishes a robust basis so that macroinvertebrates can be used as indicators
of the ecological status of the Ebro estuary.
The purpose of this study was to examine the macroinvertebrate community of the
Ebro estuary with regard to species composition, community structure and
distribution patterns along spatial and temporal scales and to describe the main
abiotic factors affecting benthic communities in this type of estuary.
2. MATERIALS AND METHODS
2.1 Study area
The study was conducted in the Ebro estuary (40º43’10’’N, 0º40’30’’E) located in
the NE of the Iberian Peninsula (Catalonia, Spain) (Fig.1). The Ebro is 910 km long
and has a drainage area of 85,362 km2; it is the Spanish river with the highest mean
annual flow and one of the most important tributaries to the Mediterranean Sea. The
main land use in the basin is agriculture with more than 10,000 km2 of irrigation,
corresponding to approximately 90% of the water usage in the basin (Ibáñez et al.,

A. Nebra, N. Caiola & C. Ibáñez
52
2008). The whole basin is strongly regulated by nearly 190 dams (Batalla et al.,
2004). These affect the mean annual flow, which has decreased greatly since the
beginning of the century to the present (Ibáñez et al., 1996). The Ebro estuary is
highly stratified (30 km long, 240 m mean width and 6-8 m mean depth) and the
microtidal amplitude of the Mediterranean Sea, about 20 cm (Cacchione et al., 1990),
promotes the formation of a salt wedge. The river discharge controls the salt wedge
dynamic (advance, retreat and permanence): when the flow exceeds 350-400 m3 s-1
the salt wedge is pushed from the river channel, and the salt wedge reaches its
maximum distance upstream (30-32 km from the river mouth) with flows lower than
100 m3 s-1 (Ibáñez et al., 1997).
Figure 1. Location of the Ebro estuary and its deltaic plain showing the nine sampling
stations. UE, upper estuary stations; LE, lower estuary stations; SW, position of the salt
wedge tip.

CHAPTER I: Benthic macroinvertebrates of the Ebro estuary
53
2.2 Sampling design and laboratory procedures
Nine sampling stations were established in order to cover the whole estuarine stretch
of the Ebro River (Fig. 1). Each station was sampled seasonally (summer 2007 to
spring 2008). On each sampling occasion, three sediment samples were collected
using a Ponar grab (0.046 m2). The samples were washed in situ through a 0.5-mm
mesh sieve to separate macroinvertebrates from sediment, and the organisms retained
were immediately fixed with buffered 10% formalin. Later in the laboratory, all
macroinvertebrates were sorted, counted and identified under a stereomicroscope to
the lowest possible taxonomic level. Two sediment aliquots of 30 g and 200 g were
taken from each grab and stored at -20ºC to estimate the total organic matter (TOM)
with the loss on ignition method following Kristensen and Andersen (1987), and
grain-size characterization according to Holme and McIntyre (1984). Bottom water
samples were collected at each station with a water pump, preserved on ice in the
absence of light, transported to the laboratory and stored at -20ºC until analysis.
Posterior processing included estimating the total chlorophyll and pheophytin
concentration using the colorimetric method (Jeffrey and Humphrey, 1975), the
dissolved and total nutrient concentration (PO4, PT, NH4, NO2, NO3, NT and SiO4)
following Koroleff (1977) and the suspended solid concentration (Total suspended
solids (TSS, mg l-1) and organic suspended solids (OSS, mg l-1)) in compliance with
the UNE-EN 872 norm (AENOR, 1996). In addition, physicochemical and
hydromorphological characteristics were recorded on each sampling occasion. An
YSI 556 multi-parameter probe was used to measure water temperature (°C),
dissolved oxygen (mg l-1), oxygen saturation (%), pH, salinity and conductivity (mS
cm-1). Water depth (m) was measured using a Speedtech SM-5 depth-meter sounder.
Water flow velocity (m s-1) was recorded with a Valeport m.001 current-meter, and
water transparency was estimated using a Secchi disc. The accumulated permanence
time (in days) of the salt wedge was calculated using daily mean flow values
measured 40 km upstream from the river mouth (Tortosa) by counting the
accumulated days before each sampling occasion with mean flow values lower than
A. Nebra, N. Caiola & C. Ibáñez
54
350 m3 s-1. This data is available at the Ebro Water Authority (CHE) web site
(http://www.chebro.es/).
2.3 Data analysis
The following community descriptive parameters were calculated for each station
and season (n=36): total abundance (N), density (D, ind m-2), richness (S), Shannon-
Wiener’s diversity index (H’, as log2), Margalef index (d), Simpson dominance index
(1-λ’) and Pielou’s evenness index (J’). In addition, species were classified with the
constancy index (Dajoz, 1971) into five categories according to the number of
stations in which any given taxa was found in relation to the total number of stations:
constant (>76%), very common (51-75%), common (26-50%), uncommon (13-25%)
and rare (<12%). Each species was classified into feeding guilds based on the
available literature. The feeding guilds included deposit feeders (DF), grazers (G),
omnivores (O), parasites (Pa), predators (Pr) and suspension feeders (SF). Appendix
1 provides a list of the taxa, together with their feeding guild, that are mentioned in
the text. Non-parametric multivariate techniques were used as described by Field et
al. (1982) to identify the possible macroinvertebrate communities. A similarity
matrix was computed using the Bray-Curtis coefficient (Legendre and Legendre,
1998) after the four root transformation was applied to the abundance data to
downweight the contribution of the most abundant taxa to the similarity (Clarke and
Warwick, 2001). All the other statistical analyses were performed using the different
routines available in the Multivariate Ecological Research software package
PRIMER V6 (Clarke and Gorley, 2006). The stations and taxa were ordered using
non-metrical multidimensional scaling (MDS) (Clarke and Warwick, 2001). A
similarity percentage analysis (SIMPER) that examines the contribution of each
variable to the average resemblances between sample groups was performed. This
analysis was also used to identify taxa that contributed to dissimilarity among
stations and estuary domains that were pre-determined by ordination analysis.
Differences in the community composition were identified using the 1-way analysis

CHAPTER I: Benthic macroinvertebrates of the Ebro estuary
55
of similarities test (ANOSIM) that hypothesizes for differences between groups of
samples (defined a priori) through randomization methods on a resemblance matrix.
Finally, the relationship between the community structure and environmental
variables was investigated with the BIOENV routine, which maximizes a rank
correlation (Spearman’s coefficient) between resemblance matrices derived from
biotic and environmental data, iterating for all possible combinations of
environmental variables (Clarke and Warwick, 2001). A Spearman’s coefficient
value close to 0 indicates a weak relation between the community and environmental
variables, whereas a value close to 1 indicates that the environmental variables
selected explain the community structure.
3. RESULTS
3.1 Water and sediment features
The Ebro estuary has a sand dominated bottom and a relatively low TOM percentage
in both the upper (UE) and lower (LE) parts and throughout the entire year (Table 1).
During the study period the salt wedge was only found in the lower estuary stations.
At these stations, the accumulated permanence time was different in each season: 55,
143, 257 and 344 days respectively for summer, autumn, winter and spring. The null
point (the tip of the salt wedge) was located between UE4 and LE5 in all sampling
periods. Nutrient concentrations were higher in the upper estuary stretch (Table 1)
except for the ammonia, nitrite, phosphate and silicate concentrations in spring and
total phosphorous in summer. The chlorophyll concentrations showed marked
differences between the upper and lower estuary; the UE stretch had the highest
values during winter and spring, whereas the maximum values in the LE stretch were
in summer/autumn. Levels of total pheophytin were lower in the UE stretch except
for during the two last seasons. The UE stretch always had seasonal mean water flow
velocities higher than the LE stretch. The values of TSS and OSS were higher in the
LE stretch in summer, autumn and winter, whereas in spring the UE stretch showed
the maximum values.

A. Nebra, N. Caiola & C. Ibáñez
56
Tab
le 1. Sedim
ent characteristics and water physicochem
ical parameters (seasonal m
ean±standard deviation, n=4) in the tw
o different
stretches. TO
M, total organic m
atter in sediment; T
ransp., transparency; DO
, dissolved oxygen; Cond., conductivity; S
al., salinity;
TD
S, total dissolved salts; T
SS
, total suspended solids; OS
S, organic suspended solids.
Upper E
stuaryL
ower E
stuary
Sum
mer
Autum
nW
interS
pringS
umm
erA
utumn
Winter
Spring
Mud
(%)
11.31±
14.5911.31
±14.59
21.08±
28.431.53
±2.08
15.89±
10.9015.89
±10.90
25.27±
20.786.51
±5.75
Sand
(%)
73.35±
23.4173.35
±23.41
57.93±
33.3088.78
±16.81
79.84±
13.0179.84
±13.01
74.32±
21.0685.36
±18.10
Gravel
(%)
15.34±
27.2215.34
±27.22
20.99±
36.799.69
±17.68
4.27±
6.264.27
±6.26
0.41±
0.298.13
±12.52
TO
M(%
)2.67
±1.03
2.67±
1.032.89
±1.11
2.45±
1.884.03
±1.22
4.03±
1.224.36
±1.59
3.70±
2.21D
epth(m
)3.50
±1.73
4.25±
1.893.75
±2.22
4.25±
2.066.00
±1.41
6.80±
1.486.00
±1.58
6.00±
1.58V
elocity(m
s-1
)0.13
±0.06
0.17±
0.050.14
±0.05
0.42±
0.100.06
±0.04
0.10±
0.090.05
±0.05
0.25±
0.21T
ransp.(m)
2.40±
0.712.68
±0.78
1.98±
0.732.21
±0.22
2.37±
0.271.89
±0.23
1.88±
0.131.60
±0.22
T(ºC
)24.26
±0.40
22.80±
0.0711.12
±0.36
16.32±
0.1422.07
±0.19
22.30±
0.8313.27
±0.04
15.30±
0.51D
O(m
gl -1)
7.85±
0.477.89
±1.22
13.82±
0.697.94
±0.69
5.25±
1.226.00
±2.4
10.32±
0.836.72
±2.11
DO
(%)
94.00±
6.2692.00
±14.25
126.28±
7.0281.30
±7.24
74.10±
17.6484.78
±33.61
123.90±
10.1174.36
±16.52
Cond.(m
Scm
-1)0.95
±0.01
1.37±
0.001.12
±0.03
1.04±
0.0051.27
±0.53
51.51±
0.7143.21
±0.50
25.00±
19.78
Sal.
0.47±
0.010.72
±0.00
0.77±
0.020.62
±0.00
35.97±
0.3135.98
±0.40
36.89±
0.4520.02
±16.27
TD
S(g
l -1)0.62
±0.01
0.93±
0.000.99
±0.02
0.81±
0.0035.30
±0.27
35.30±
0.3436.19
±0.39
20.09±
15.95C
hlorophyll(µ
gl -1)
0.09±
0.061.16
±0.24
1.07±
0.912.83
±2.82
1.01±
0.802.83
±1.06
0.79±
0.230.69
±0.41
Pheophytin
(µg
l -1)0.05
±0.02
1.06±
0.101.00
±0.55
3.43±
2.280.31
±0.18
1.38±
0.320.66
±0.26
0.87±
0.50pH
8.20±
0.068.25
±0.05
7.89±
0.098.00
±0.02
7.98±
0.068.28
±0.15
7.94±
0.057.83
±0.11
PO
4(m
gl -1)
0.02±
0.000.03
±0.00
0.03±
0.010.03
±0.01
0.01±
0.010.01
±0.02
0.01±
0.010.03
±0.01
PT
(mg
l -1)0.08
±0.01
0.06±
0.010.05
±0.01
0.05±
0.000.11
±0.02
0.05±
0.020.02
±0.02
0.04±
0.02N
H4
(mg
l -1)0.02
±0.02
0.04±
0.030.02
±0.02
0.19±
0.140.05
±0.02
0.09±
0.120.05
±0.02
0.20±
0.30N
O2
(mg
l -1)0.01
±0.00
0.01±
0.000.02
±0.00
0.04±
0.010.00
±0.01
0.00±
0.010.01
±0.00
0.04±
0.01N
O3 (m
gl -1)
2.08±
0.161.85
±0.34
3.52±
0.054.45
±0.15
0.04±
0.030.04
±0.02
0.10±
0.023.26
±0.89
NT
(mg
l -1)2.42
±0.08
2.43±
0.043.52
±0.05
5.37±
0.080.28
±0.07
0.20±
0.120.10
±0.02
4.39±
1.13S
iO4
(mg
l -1)1.89
±0.06
0.85±
0.171.01
±0.15
1.21±
0.130.42
±0.48
0.47±
0.330.17
±0.16
1.28±
0.31T
SS
(mg
l -1)3.05
±0.98
3.56±
2.682.91
±1.66
14.69±
11.2520.60
±2.17
24.99±
3.7816.91
±32.53
5.84±
3.51O
SS
(mg
l -1)1.94
±0.52
1.47±
0.810.99
±0.21
3.20±
2.314.75
±1.11
4.71±
1.021.76
±2.27
1.52±
0.75O
SS
(%)
66.49±
18.1446.07
±8.76
43.07±
21.7823.19
±2.59
22.92±
3.7018.72
±1.53
27.34±
12.3927.04
±2.95

CHAPTER I: Benthic macroinvertebrates of the Ebro estuary
57
3.2 Macroinvertebrate abundance, taxa richness and diversity
During one year of seasonal sampling in the Ebro estuary a total of 21,805
individuals were collected belonging to 214 different taxa that comprised 151
species, 115 families, 57 orders, 20 classes and 9 phyla (Supplementary material
Appendix 1). Annelida was the dominant phylum and accounted for 71.07% of the
total abundance. Polychaeta and Oligochaeta contributed with 49.64% and 21.42%
respectively. Spionidae was the most abundant family (28.56%) due to the
contribution of the most dominant species Streblospio benedicti (24.10% of the total
abundance). Another dominant phylum was Arthropoda, which contributed 15.56%
of the total abundance, with Malacostraca accounting for 10.37% of the total
abundance. Mollusca was the third most abundant phylum with 12.09% of the total
abundance, and Bivalvia contributed 10.61% of the total abundance. In terms of
species richness, Polychaeta contributed with 49 different taxa (40 species) and
Bivalvia with 37 taxa (32 sp), followed by Gastropoda with 29 taxa (18 sp) and
Insecta with 24 taxa (14 sp). Applying Dajoz’s constancy index (considering the 9
stations), 1% of the taxa were found constant, 8% very common, 27% common, 20%
uncommon and 44% were rare. Applying the constancy index to UE stations
revealed that 9% of the taxa were constant, 14% very common, 19% common, 58%
were uncommon and no taxa were rare; whereas in the LE stretch 22% of the taxa
were constant, 16% very common, 20% common and 42% were uncommon.
Total density values throughout seasons ranged from 216 to 20,022 ind m-2 (Table 2).
The highest densities were found at the mouth (station LE9) due to the high
abundance of the polychaete S. benedicti. Intermediate densities were found in the
uppermost stations UE1 and UE2 with a large contribution of Tubificidae and the
introduced bivalve Corbicula fluminea. The lowest densities corresponded to stations
UE3, UE4 and LE5 in the middle part of the estuary. Station LE9 had the highest
richness values with a maximum of 69 taxa and an annual mean value of 48 taxa;
other stations located near the river mouth (LE8 and LE7) also reached high values
of richness, whereas stations UE3, UE4 and LE5 showed the lowest richness values

A. Nebra, N. Caiola & C. Ibáñez
58
(Table 2). Diversity indices showed the same tendency as density and richness, with
low values at stations located near the limit of the salt wedge (Table 2). In terms of
the trophic structure, the deposit feeders (32%), suspension feeders (29%) and
predators (17%) were the dominant feeding guilds in the entire estuary. The
contribution of the different feeding guilds in the UE stretch was: deposit feeders
(38%), predators (22%), grazers (19%), suspension feeders (14%), omnivores (5%)
and parasites (3%). The trophic structure of the LE stretch was dominated by
suspension feeders (35%) and deposit feeders (30%).
3.3 Analysis of benthic macroinvertebrate communities
Two different communities were determined according to the ordination of stations
and taxa of the MDS analysis based on macroinvertebrate abundance. The ordination
showed two definite groups of sampling stations: those corresponding to the upper
estuary (UE) and lower estuary (LE) respectively (Fig. 2). The UE group (UE1-UE4)
included stations located in the upper estuary stretch and corresponded to a
freshwater community, whereas the second group comprised the lower estuary
stations (LE5-LE9) and had a community with a large marine influence. In addition,
we also applied the MDS analysis considering lower taxonomic categories e.g. genus
and family; the results obtained showed the same grouping of stations regardless of
the taxonomic level employed in the ordinations. Significant differences in
community composition were found between these two groups (ANOSIM r: 0.891,
p<0.001). Significant differences were also found among stations (ANOSIM global
r: 0.694, p<0.001) except for the following pairs: UE1-UE3, UE3-UE4, UE4-LE5,
LE5-LE6, LE6-LE7, LE6-LE8, LE7-LE8, LE7-LE9 and LE8-LE9, p>0.05 (Table 3).

CHAPTER I: Benthic macroinvertebrates of the Ebro estuary
59
Table 2. Community descriptive parameters for each sampling station and season. N, total
abundance per 0.14 m2; D, density (ind m-2); S, richness; H’(log2), Shannon-Wiener diversity
index; d, Margalef index; 1-λ’, Simpson’s index; J’, Pielou’s evenness; DF (%), deposit
feeders; G (%), grazers; O (%), omnivores; Pa (%), parasites; Pr (%), predators; SF (%),
suspension feeders. See Figure 1 for sampling station codes.
Community indices Trophic structure
Station Season Density S H'(log2) d 1-λ' J' DF G O Pa Pr SF UE1 Summer 2792 11 1.96 1.68 0.67 0.57 54.55 0.00 9.09 9.09 9.09 18.18 UE2 Summer 4820 25 2.16 3.69 0.59 0.47 44.00 16.00 4.00 8.00 12.00 16.00 UE3 Summer 830 6 2.02 1.05 0.72 0.78 33.33 0.00 16.67 16.67 0.00 33.33 UE4 Summer 491 3 1.45 0.47 0.61 0.91 0.00 0.00 33.33 0.00 0.00 66.67 LE5 Summer 216 4 0.63 0.88 0.19 0.31 50.00 25.00 25.00 0.00 0.00 0.00 LE6 Summer 1457 7 1.03 1.13 0.32 0.37 57.14 0.00 14.29 0.00 0.00 28.57 LE7 Summer 2670 23 2.52 3.72 0.67 0.56 47.83 4.35 8.70 0.00 4.35 34.78 LE8 Summer 2583 23 3.18 3.74 0.82 0.70 56.52 0.00 8.70 0.00 8.70 26.09 LE9 Summer 11212 32 0.48 4.22 0.09 0.10 25.00 3.13 15.63 0.00 18.75 37.50 UE1 Autumn 491 13 2.79 2.84 0.80 0.75 30.77 23.08 7.69 0.00 23.08 15.38 UE2 Autumn 2403 23 3.15 3.79 0.80 0.70 34.78 13.04 4.35 0.00 34.78 13.04 UE3 Autumn 1335 8 1.29 1.34 0.42 0.43 62.50 0.00 0.00 0.00 25.00 12.50 UE4 Autumn 505 12 2.57 2.59 0.78 0.72 58.33 0.00 16.67 0.00 16.67 8.33 LE5 Autumn 2020 11 2.00 1.77 0.60 0.58 54.55 0.00 0.00 0.00 0.00 45.45 LE6 Autumn 599 21 3.94 4.53 0.93 0.90 52.38 0.00 4.76 4.76 23.81 14.29 LE7 Autumn 2316 31 3.19 5.20 0.75 0.64 35.48 0.00 6.45 3.23 16.13 38.71 LE8 Autumn 2648 36 2.84 5.93 0.66 0.55 30.56 5.56 5.56 2.78 8.33 47.22 LE9 Autumn 13485 69 2.84 9.03 0.68 0.47 31.88 1.45 7.25 7.25 17.39 34.78 UE1 Winter 9632 21 0.79 2.78 0.18 0.18 33.33 19.05 0.00 4.76 23.81 19.05 UE2 Winter 4906 17 1.57 2.45 0.41 0.38 47.06 17.65 11.76 5.88 5.88 11.76 UE3 Winter 981 4 1.05 0.61 0.48 0.53 50.00 0.00 0.00 0.00 25.00 25.00 UE4 Winter 1522 6 0.99 0.93 0.34 0.38 66.67 0.00 0.00 0.00 16.67 16.67 LE5 Winter 2756 19 2.64 3.03 0.78 0.62 47.37 5.26 0.00 5.26 5.26 36.84 LE6 Winter 4278 27 3.30 4.07 0.86 0.69 51.85 3.70 7.41 3.70 14.81 18.52 LE7 Winter 6934 62 3.81 8.88 0.83 0.64 46.77 3.23 4.84 3.23 16.13 25.81 LE8 Winter 3413 48 4.04 7.63 0.87 0.72 50.00 0.00 8.33 2.08 14.58 25.00 LE9 Winter 20022 58 1.66 7.19 0.35 0.28 37.93 1.72 6.90 5.17 18.97 29.31 UE1 Spring 18319 21 0.98 2.55 0.27 0.22 44.44 22.22 0.00 5.56 11.11 16.67 UE2 Spring 5368 24 1.74 3.48 0.46 0.38 41.67 20.83 8.33 0.00 16.67 12.50 UE3 Spring 1198 9 2.42 1.56 0.78 0.76 55.56 0.00 0.00 0.00 22.22 22.22 UE4 Spring 3802 8 0.34 1.12 0.08 0.11 50.00 12.50 12.50 0.00 12.50 12.50 LE5 Spring 3629 7 0.91 0.96 0.33 0.32 42.86 0.00 14.29 14.29 0.00 28.57 LE6 Spring 1941 28 3.14 4.83 0.80 0.65 46.43 0.00 10.71 0.00 21.43 21.43 LE7 Spring 6486 59 4.15 8.53 0.88 0.71 47.46 1.69 11.86 3.39 15.25 20.34 LE8 Spring 7417 63 4.62 8.94 0.93 0.77 41.27 1.59 12.70 3.17 17.46 23.81 LE9 Spring 1876 33 3.30 5.75 0.81 0.65 48.48 0.00 6.06 3.03 21.21 21.21

A. Nebra, N. Caiola & C. Ibáñez
60
Table 3. One-way ANOSIM test to compare the macroinvertebrate communities at different
sampling stations. The test results are shown in the lower diagonal of the table. Significant
differences between stations (P<0.05) are indicated (*). The R values are shown in bold
letters in the upper diagonal of the table. See Figure 1 for sampling station codes.
UE1 UE2 UE3 UE4 LE5 LE6 LE7 LE8 LE9 UE1 0.708 0.458 0.552 1.000 1.000 1.000 1.000 1.000 UE2 0.029* 0.719 0.635 1.000 1.000 1.000 1.000 1.000 UE3 0.057 0.029* 0.219 0.917 0.990 1.000 1.000 1.000 UE4 0.029* 0.029* 0.143 0.302 0.688 0.849 0.885 0.880 LE5 0.029* 0.029* 0.029* 0.114 0.219 0.542 0.667 0.604 LE6 0.029* 0.029* 0.029* 0.029* 0.143 0.167 0.115 0.448 LE7 0.029* 0.029* 0.029* 0.029* 0.029* 0.171 0.000 0.240 LE8 0.029* 0.029* 0.029* 0.029* 0.029* 0.200 1.000 0.083 LE9 0.029* 0.029* 0.029* 0.029* 0.029* 0.029* 0.086 0.229
The BIOENV analysis showed that the combination of salinity, dissolved phosphate,
total phosphorous, ammonia and the distance from the mouth have a large influence
on the structure of the macroinvertebrate communities (r=0.741). The combination of
salinity, dissolved phosphate, ammonia and nitrate explained the differences in taxa
abundance in the upper estuary (r=0.308). However, within the community of the
lower estuary, the combination of ammonia, total chlorophyll, sand percentage, the
highest correlation and explained the main differences in the macroinvertebrate
abundance data (r=0.681).
4. DISCUSSION
The whole Ebro estuary is dominated by sand; however, the percentage of fine
deposits such as clay or mud was higher in the lower stretch due to flocculation and
settling processes and low velocities recorded at the salt wedge (Sierra et. al., 2002).
During the study period the bottom water layer of the estuary showed important dif-
ferences in physicochemical features between the lower and upper estuary stretches.
We found freshwater stations (UE1-UE4) that were not exposed to marine intrusions,
and saltwater stations (LE5-LE9) that were permanently exposed to marine intrusions

CHAPTER I: Benthic macroinvertebrates of the Ebro estuary
61
and had a well stratified water column. At LE stations, salinity in the salt wedge
decreased upstream with small fluctuations but with values always higher than 30,
which evidences the weak mixing between water layers. In highly stratified estuaries
the salt wedge dynamics are complex and can be explained by a combination of
hydromorphological factors, such as the tide amplitude, river channel cross section
and flow, and the freshwater runoff is one of the main factors determining the salt
wedge regime (Ibáñez et al., 1997). Nevertheless, in the lower estuary the salt wedge
was present on all sampling occasions and the permanence time almost reached a
complete year. Although other long periods of marine intrusion in the Ebro estuary
have been recorded before (Ibáñez et al., 1995), under natural conditions this period
should be approximately 6 months per year (Ibáñez et al., 1997). These conditions of
the quasi permanent presence of the salt wedge in the lower estuary stretch are
exacerbated by the strong flow regulation and the almost total absence of peak flows,
which leads to reduced turbulence and therefore to highly stable density-thermal
stratification (Ibáñez et al., 1995, 1996).
The present conditions of nutrient loading of the Ebro estuary are quite different
from the past situation of eutrophication (Ibáñez et al., 1995). Under eutrophic
conditions, and with long periods of permanence of the salt wedge in the lower
estuary at the same time, the water quality was worse below the wedge than above it
due to organic matter deposition and low water renewal. This organic enrichment
caused oxygen depletion through microbial consumption (Ibáñez et al., 1995;
Casamayor et al., 2001). Recent changes in the nutrient content of the river,
especially the reduction of phosphates, have reduced the primary production in the
upper layer, whereas in the lower layer it has increased due to higher light
penetration (Falco et al., 2010); thus, the hypoxic conditions in the lower layer have
decreased (Casamayor et al., 2001; Ibáñez et al., 2008).
Under the present oligotrophication process, the long periods of salt wedge
permanence ensure the stability of the water column, which allows the complexity of
the benthic communities to increase, as suggested by Sousa et al. (2006a). The
A. Nebra, N. Caiola & C. Ibáñez
62
present situation is very different to that of the early nineties, when a survey
conducted in October 1992 showed an impoverished macroinvertebrate community
(only seven different taxa were found) due to eutrophication, which caused severe
anoxic episodes below the halocline (Ibáñez et al., 1995).
The benthic macroinvertebrate community in the Ebro estuary shows considerable
spatial and temporal differences, with a complex structure and composition. The
multivariate analysis defined two different communities: one from the lower and one
from the upper estuary stretch. In contrast, the pattern described in more mixed
estuaries (Rundle et al., 1998; Ysebaert et al., 1998; Sousa et al., 2008) supports the
idea that these systems work as a continuum of overlapping communities along the
salinity gradient, which fits with the ecocline boundary model suggested by Attrill
and Rundle (2002). However, the weak longitudinal salinity gradient and the narrow
transition zone between fresh and marine water suggest that the Ebro estuary fits
much better into an ecotone model, when ecotone is defined as an area of relatively
rapid change that produces a narrow ecological zone between two different and
homogeneous community types (Van der Maarel, 1990).

CHAPTER I: Benthic macroinvertebrates of the Ebro estuary
63
Figure 2. Two dimensional MDS plots based on Bray-Curtis similarities of fourth-root
transformed macroinvertebrate abundance data: (a) ordination using inter-species
resemblance matrix of nine stations; (b) ordination of the nine stations sampled in the Ebro
estuary. The dashed line and the solid line encircle the freshwater and marine communities
respectively. See Figure 1 for sampling station codes.
A. Nebra, N. Caiola & C. Ibáñez
64
The upper stretch of the Ebro estuary was characterized by an impoverished
macroinvertebrate community dominated by the non-indigenous bivalve C. fluminea,
which tends to acquire an invasive pattern (Sousa et al., 2006b), together with
tolerant taxa such as Tubificidae, Naididae (Oligochaeta) and abundant Chiromidae.
The amphipod C. orientale was well-represented in number of individuals but its
presence was restricted to stations UE3 and UE4 located close to the salt wedge tip
due to its euryhaline nature. The salt wedge community was dominated in terms of
abundance by the Polychaeta and Malacostraca classes, followed by the phylum
Mollusca. Nevertheless, in terms of richness it was dominated by molluscs,
polychaetes and crustaceans in this order. This pattern was slightly different from
those found in other temperate intertidal areas, where polychaetes are the most
diverse group, followed by molluscs and crustaceans (Ysebaert et al., 1998;
Rodrigues et al., 2006). Comparing our results with those from other European
estuarine ecosystems we found that the Ebro estuary was colonized in its mouth area
by typical marine species associated with the Abra alba-Lagis koreni community
(colonizing fine sediments rich in organic matter) and with the Nephtys spp.
community (colonizing sandy sediments). These two communities are widely
distributed throughout European estuarine and coastal areas (Dauvin, 2000, 2007;
Martín et al., 2000; Van Hoey et al., 2004; Puente et al., 2008). In addition to these
communities, we also found tolerant groups dominated by Capitellidae and
Spionidae (Polychaeta), together with Corbula gibba, which usually colonizes
disturbed areas; whereas in the upper stations close to the null point the community
was dominated by eurybiontic taxa like Hediste diversicolor, Perinereis cultrifera,
Heteromastus filiformis, C. orientale and Cyathura carinata. These species are also
very common in other European estuaries and coastal areas (Marques et al., 1993;
Ysebaert et al., 1998, 2003; Martín et al., 2000; Chainho et al., 2006; Rodrigues et
al., 2006; Sousa et al., 2006a, 2008).
Currently, the Ebro estuary shows high levels of richness compared with other
European estuaries (Rodrigues et al., 2006). The trophic structure is well represented
CHAPTER I: Benthic macroinvertebrates of the Ebro estuary
65
with six different trophic guilds. Deposit feeders, suspension feeders and predators
are dominant, which suggests that different resources are available (Brown et al.,
2000). In the upper stretch the diversity and richness decreased seawards, with
minimum values found close to the null point because the salinity fluctuation is a
physiological barrier for stenohaline freshwater and marine taxa (Mannino and
Montagna, 1997). However, diversity and richness at the salt wedge stations declined
with increasing distance from the sea, which is a recurring tendency in mixed
estuaries (Remane and Schleiper, 1971; Schlacher and Woolbridge, 1996). In the
Ebro estuary this impoverishment tendency could be explained by the increase in
organic matter, ammonia and total phosphorous towards the tip of the salt wedge in
combination with the salinity fluctuations in the same area.
The present study provides baseline data that can be used in future ecological studies
on this important Mediterranean estuarine ecosystem, as well as in comparisons with
other highly stratified estuaries. Complementary studies are necessary to improve our
understanding of the spatial and temporal variability of the macrozoobenthic
estuarine community. This knowledge could be an important tool for conserving the
biodiversity in the Ebro estuary and could be used to develop biological indices for
assessing its ecological status according to the Water Framework Directive of the
European Union.
ACKNOWLEDGEMENTS
This research was supported by the Government of Catalonia (Catalan Water
Agency, ACA). We are very grateful to C. Buendía, Ll. Jornet, C. Macaigne, D.
Mateu, M. San Lorenzo and R. Valmaña for field assistance and laboratory work.
Many thanks to M. González-Porto for helping us with Polychaeta identification and
to C. Reverté for the bibliographic search.
A. Nebra, N. Caiola & C. Ibáñez
66
REFERENCES
AENOR. - 1996. Norma UNE-EN 872. Water quality. Determination of total
suspended solids. AENOR, Madrid, Spain.
Attrill, M.J. and S.D. Rundle. - 2002. Ecotone or ecocline: Ecological boundaries in
estuaries. Est. Coast. and Shelf Sci., 55: 929-936.
Batalla, R.J., C.M. Gómez and G.M. Kondolf. - 2004. Reservoir-induced
hydrological changes in the Ebro River basin (NE Spain). J. Hydrol., 290:
117-136.
Brown, S.S., G.R. Gaston, C.F. Rakocinski and R.W. Heard. - 2000. Effects of
sediment contaminants and environmental gradients on macrobenthic
community trophic structure in Gulf of Mexico estuaries. Estuaries, 23: 411-
424.
Cacchione, D.A., D.E. Drake, M.A. Losada and R. Medina. - 1990. Bottom-
boundary layer measurements on the continental shelf off the Ebro River,
Spain. Mar. Geol., 95: 179-192.
Caiola, N., M.J. Vargas and A. Sostoa. - 2001. Feeding ecology of the endangered
Valencia toothcarp, Valencia hispanica (Actinopterygii: Valenciidae).
Hydrobiologia, 448: 97-105.
Capaccioni-Azzati, R. and D. Martín. - 1992. Pseudomastus deltaicus gen. et sp. n.
(Polychaeta: Capitellidae) from a shallow water bay in the North-western
Mediterranean Sea. Zool. Scr., 21: 247-250.
Casamayor, E.O., J. Garcia-Cantizano, J. Mas and C. Pedros-Alio. - 2001. Primary
production in estuarine oxic/anoxic interfaces: contribution of microbial dark
CO2 fixation in the Ebro River Salt Wedge Estuary. Mar. Ecol. Prog. Ser.,
215: 49-56.
Chainho, P., J.L. Costa, M.L. Chaves, M.F. Lane, D.M. Dauer and M.J. Costa. -
2006. Seasonal and spatial patterns of distribution of subtidal benthic

CHAPTER I: Benthic macroinvertebrates of the Ebro estuary
67
invertebrate communities in the Mondego River, Portugal - a poikilohaline
estuary. Hydrobiologia, 555: 59-74.
Clarke, K.R. and R.N. Gorley. - 2006. PRIMER v6: User Manual/Tutorial. PRIMER-
E, Plymouth, UK.
Clarke, K.R. and R.M. Warwick. - 2001. Change in Marine Communities: An
Approach to Statistical Analysis and Interpretation, second ed. PRIMER-E,
Plymouth, UK, 00-165.
Dajoz, R. - 1971. Précis d’Ecologie. Dunod, París, France.
Dauer, D.M., J.A. Ranasinghe and S.B. Weisberg. - 2000. Relationships between
benthic community condition, water quality, sediment quality, nutrient loads,
and land use patterns in Chesapeake Bay. Estuaries, 23: 80-96.
Dauvin, J.C. - 2000. The muddy fine sand Abra alba-Melinna palmata community of
the Bay of Morlaix twenty years after the Amoco Cadiz oil spill. Mar. Pollut.
Bul., 40: 528-536.
Dauvin, J.C. - 2007. Paradox of estuarine quality: benthic indicators and indices,
consensus or debate for the future. Mar. Pollut. Bul., 55: 271-281.
Elliott, M. and V. Quintino. - 2007. The estuarine quality paradox, environmental
homeostasis and the difficulty of detecting anthropogenic stress in naturally
stressed areas. Mar. Pollut. Bul., 54: 640-645.
Falco, S., L.F. Niencheski, M. Rodilla, I. Romero, J. González del Río, J.P. Sierra
and C. Mosso. - 2010. Nutrient flux and budget in the Ebro estuary. Est.
Coast. and Shelf Sci., 87: 92-102.
Ferreira, T., N. Caiola, F. Casals, J.M. Oliveira and A. Sostoa. - 2007a. Assessing
perturbation of river fish communities in the Iberian Ecoregion. Fisheries
Manag. Ecol., 14: 519-530.
Ferreira, T., J.M. Oliveira, N. Caiola, A. Sostoa, F. Casals, R. Cortes, A. Economou,
S., Zogaris, D. Garcia-Jalón, M. Ilhéu, F. Martínez-Capel, D. Pont, C. Rogers

A. Nebra, N. Caiola & C. Ibáñez
68
and J. Prenda. - 2007b. Ecological traits of fish assemblages from
Mediterranean Europe and their responses to human disturbance. Fisheries
Manag. Ecol., 14: 473-481.
Field, J.G., K.R. Clarke and R.M. Warwick. - 1982. A practical strategy for
analyzing multispecies distribution patterns. Mar. Ecol. Prog. Ser., 8: 7-52.
Gray, J.S., M. Elliott. - 2009. The ecology of marine sediments. Second edition
Cambridge University Press, Cambridge, UK.
Hansen, D.V. and M. Rattray. - 1966. New dimensions in estuary classification.
Limnol. Oceanogr., 11: 319-326.
Holme, N.A. and A.D. McIntyre. - 1984. Methods for the study of marine benthos.
Blackwell Scientific Publications. London, UK.
Ibáñez, C., A. Rodrigues-Capítulo and N. Prat. - 1995. The combined impacts of
river regulation and eutrophication on the dynamics of the salt wedge and the
ecology of the lower Ebro River. In The ecological basis for river
management, ed. D. Harper and A. Ferguson, 105-114. John Wiley and Sons,
Chichester, UK.
Ibáñez, C., N. Prat and A. Canicio. - 1996. Changes in the hydrology and sediment
transport produced by large dams on the lower Ebro River and its estuary.
Regul. Rivers: Res. Manage., 12: 51-62.
Ibáñez, C., D. Pont and N. Prat. - 1997. Characterization of the Ebre and Rhone
estuaries: A basis for defining and classifying salt-wedge estuaries. Limnol.
Oceanogr., 42: 89-101.
Ibáñez, C., J. Saldaña and N. Prat. - 1999. A model to determine the advective
circulation in a three layer, salt wedge estuary: application the Ebre River
estuary. Est. Coast. Shelf Sci., 48: 271-279.
Ibáñez, C., N. Prat, C. Durán, M. Prados, A. Munné, R. Andreu, N. Caiola, N. Cid,
H. Hampel, R. Sánchez and R. Trobajo. - 2008. Changes in dissolved
CHAPTER I: Benthic macroinvertebrates of the Ebro estuary
69
nutrients in the lower Ebro river: Causes and consequences. Limnética, 27:
131-142.
Jeffrey, S.W. and G.F. Humphrey. - 1975. New spectrophotometric equations for
determining chlorophylls a, b, c1 and c2 in higher plants, algae and natural
phytoplankton. Biochem. Physiol. Pflanzen, 167: 191-194.
Koroleff, F. - 1977. Simultaneous persulphate oxidation of phosphorus and nitrogen
compounds in water. In report of the Baltic Intercalibration Worshop, 52-53.
Kristensen, E. and F.O. Andersen. - 1987. Determination of organic-carbon in
marine-sediments - a comparison of 2 chn-analyzer methods. J. Exp. Mar.
Biol. Ecol., 109: 15-23.
Legendre, P and L. Legendre. - 1998. Numerical ecology. Elsevier, Amsterdam,
Netherlands.
Mannino, A. and P.A. Montagna. - 1997. Small-scale spatial variation of
macrobenthic community structure. Estuaries, 20: 159-173.
Marques, J.C., P. Maranhao and M.A. Pardal. - 1993. Human impact assessment on
the subtidal macrobenthic community structure in the Mondego estuary
(western Portugal). Est. Coast. and Shelf Sci., 37: 403-419.
Martín, D., S. Pinedo and R. Sardá. - 2000. Distribution patterns and trophic structure
of soft-bottom Polychaete assemblages in a north-western Mediterranean
shallow-water Bay. Ophelia, 53: 1-17.
McLusky, D.S. - 1999. Estuarine benthic ecology: A European perspective. Aust. J.
Ecol., 24: 302-311.
Morrisey, D.J., L. Howitt, A.J. Underwood and J.S. Stark. - 1992. Spatial variation in
soft-sediment benthos. Mar. Ecol. Prog. Ser., 81: 197-204.
Puente, A., J.A. Juanes, A. García, C. Álvarez, J.A. Revilla and I. Carranza. - 2008.
Ecological assessment of soft bottom benthic communities in northern
Spanish estuaries. Ecol. Indic., 8: 373-388.

A. Nebra, N. Caiola & C. Ibáñez
70
Remane, A. and C. Schlieper. - 1971. Biology of brackish water. Wiley Interscience,
New York, USA.
Rodrigues, A.M., S. Meireles, T. Pereira, A. Gama and V. Quintino. - 2006. Spatial
patterns of benthic macroinvertebrates in intertidal areas of a Southern
european estuary: the Tagus, Portugal. Hydrobiologia, 555: 99-113.
Rovira, L., R. Trobajo and C. Ibáñez. - 2009. Periphytic diatom community in a
Mediterranean salt wedge estuary: the Ebro Estuary (NE Iberian Peninsula).
Acta Bot. Croat., 68: 285-300.
Rundle, S.D., M.J. Attrill and A. Arshad. - 1998. Seasonality in macroinvertebrate
community composition across a neglected ecological boundary, the
freshwater-estuarine transition zone. Aquat.Ecol., 32: 211-216.
Schlacher, T.A. and T.H. Wooldridge. - 1996. Axial zonation patterns of subtidal
macrozoobenthos in the Gamtoos estuary, South Africa. Estuaries, 19: 680-
696.
Sierra, J.P., A. Sánchez-Arcilla, J.G. Del Río, J. Flos, E. Movellán, C. Mosso, R.
Martínez, M. Rodilla, S. Falco and I. Romero. - 2002. Spatial distribution of
nutrients in the Ebro estuary and plume. Cont. Shelf Res., 22: 361-378.
Sierra, J.P., A. Sánchez-Arcilla, P.A. Figueras, J.G. Del Río, E.K. Rassmussen and
C. Mosso. - 2004. Effects of discharge reductions on salt wedge dynamics of
the Ebro River. River Res. Appl., 20: 61-77.
Sousa, R., S. Dias and J.C. Antunes. - 2006a. Spatial subtidal macrobenthic
distribution in relation to abiotic conditions in the Lima estuary, NW of
Portugal. Hydrobiologia, 559: 135-148.
Sousa, R., C. Antunes and L. Guilhermino. - 2006b. Factors influencing the
occurrence and distribution of Corbicula fluminea (Müller, 1774) in the
River Lima estuary. Ann. Limnol., 42: 165-171.

CHAPTER I: Benthic macroinvertebrates of the Ebro estuary
71
Sousa, R., S. Dias, V. Freitas and C. Antunes. - 2008. Subtidal macrozoobenthic
assemblages along the River Minho estuarine gradient (north-west Iberian
Peninsula). Aquatic Conserv: Mar. Freshw. Ecosyst., 18: 1063-1077.
Van der Maarel, E. - 1990. Ecotones and ecoclines are different. J. Veg. Sci., 1: 135-
138.
Van Hoey, G., S. Degraer, M. Vincx. - 2004. Macrobenthic community structure of
soft-bottom sediments at the Belgian Continental Shelf. Est. Coast. and Shelf
Sci., 59: 599-613.
Ysebaert, T., P. Meire, J. Coosen and K. Essink. - 1998. Zonation of intertidal
macrobenthos in the estuaries of Schelde and Ems. Aquat.Ecol., 32: 53-71.
Ysebaert, T., P.M.J. Herman, P. Meire, J. Craeymeersch, H. Verbeek and C.H.R.
Heip. - 2003. Large-scale spatial patterns in estuaries: estuarine
macrobenthic communities in the Schelde estuary, NW Europe. Est. Coast.
and Shelf Sci., 57: 335-355.
SUPPLEMENTARY MATERIAL
The following Appendix is available through the web page
http://www.icm.csic.es/scimar/supplm/sm75n3577sm.pdf

72
APPENDIX 1. List of the identified taxa that were found at all the stations over the entire study period. The stations where each taxon was found are
also listed. See Figure 1 for sampling station codes; FG, feeding guild (see Table 2 for feeding guild codes); CI, Constancy index; Ct, constant; VC,
very common; C, common; UC, uncommon; R, rare.
Taxa Summer Autumn Winter Spring FG CI CI CI UE LE
PHYLUM CNIDARIA Class Anthozoa Diadumene sp. LE9 Pr R UCPHYLUM PLATYHELMINTHES Class Turbellaria Dugesia sp. UE2 UE2 UE2 Pr R UC Turbellaria indet. UE2 UE1 Pr UC C PHYLUM NEMERTINA Class Enopla Nemertina indet. LE6,7,9 LE5,6,7,8,9 LE6,7,8,9 Pr VC Ct Prostoma graecense (Böhmig, 1892) UE2 UE1,2,4 UE2 Pr C VC PHYLUM NEMATODA Nematoda indet. UE1,2,3 LE9 UE1,2; LE9 UE1 Pa C VC UCPHYLUM MOLLUSCA Class Gastropoda Aplysiidae indet. LE9 LE8 G UC C Bittium reticulatum (da Costa, 1778) LE8,9 LE7,8,9 LE7,8,9 DF C VC Buccinum sp. LE9 O R UC Chrysallida sp. LE6,7,8,9 LE5,6,7,8,9 LE5,7,8,9 Pa VC Ct Eulimella polita (Verrill, 1872) LE9 Pa R UC Ferrissia clessiniana (Jickeli, 1882) UE2 UE2 UE2 G R UC Gyraulus albus (Müller, 1774) UE1,2,4 G C VC Haminoea navicula (da Costa, 1778) LE6,7 G UC C Hinia limata (Chemnitz, 1795) LE9 LE9 LE9 Pr R UC Hydrobia sp. LE7 LE5 LE7 G UC C Hydrobia ulvae (Pennant, 1777) LE7 G R UC Mangelia sp. LE9 O R UC
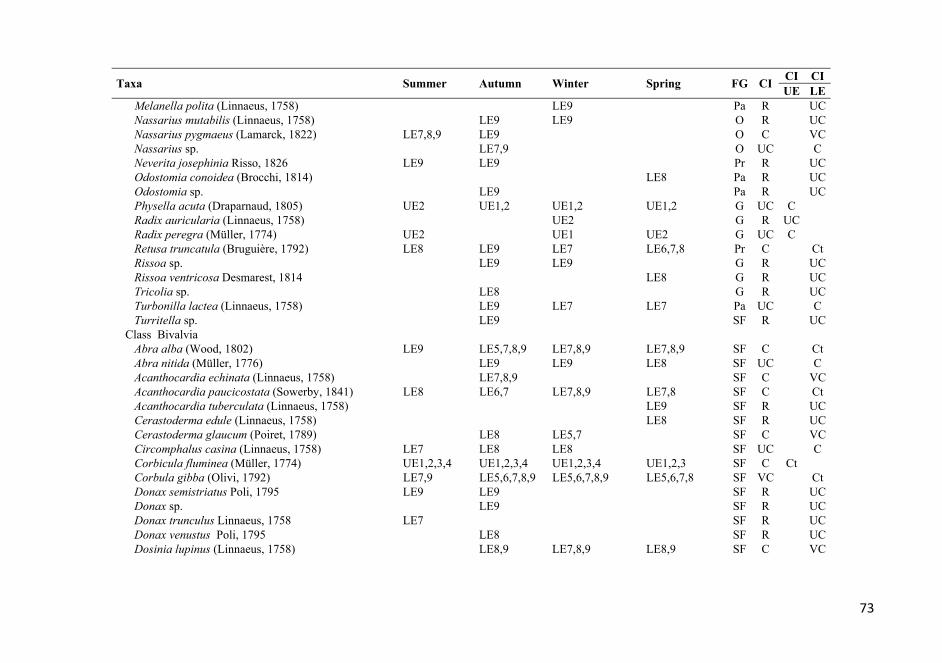
73
Taxa Summer Autumn Winter Spring FG CI CI CI UE LE
Melanella polita (Linnaeus, 1758) LE9 Pa R UC Nassarius mutabilis (Linnaeus, 1758) LE9 LE9 O R UC Nassarius pygmaeus (Lamarck, 1822) LE7,8,9 LE9 O C VC Nassarius sp. LE7,9 O UC C Neverita josephinia Risso, 1826 LE9 LE9 Pr R UC Odostomia conoidea (Brocchi, 1814) LE8 Pa R UC Odostomia sp. LE9 Pa R UC Physella acuta (Draparnaud, 1805) UE2 UE1,2 UE1,2 UE1,2 G UC C Radix auricularia (Linnaeus, 1758) UE2 G R UC Radix peregra (Müller, 1774) UE2 UE1 UE2 G UC C Retusa truncatula (Bruguière, 1792) LE8 LE9 LE7 LE6,7,8 Pr C Ct Rissoa sp. LE9 LE9 G R UC Rissoa ventricosa Desmarest, 1814 LE8 G R UC Tricolia sp. LE8 G R UC Turbonilla lactea (Linnaeus, 1758) LE9 LE7 LE7 Pa UC C Turritella sp. LE9 SF R UC Class Bivalvia Abra alba (Wood, 1802) LE9 LE5,7,8,9 LE7,8,9 LE7,8,9 SF C Ct Abra nitida (Müller, 1776) LE9 LE9 LE8 SF UC C Acanthocardia echinata (Linnaeus, 1758) LE7,8,9 SF C VC Acanthocardia paucicostata (Sowerby, 1841) LE8 LE6,7 LE7,8,9 LE7,8 SF C Ct Acanthocardia tuberculata (Linnaeus, 1758) LE9 SF R UC Cerastoderma edule (Linnaeus, 1758) LE8 SF R UC Cerastoderma glaucum (Poiret, 1789) LE8 LE5,7 SF C VC Circomphalus casina (Linnaeus, 1758) LE7 LE8 LE8 SF UC C Corbicula fluminea (Müller, 1774) UE1,2,3,4 UE1,2,3,4 UE1,2,3,4 UE1,2,3 SF C Ct Corbula gibba (Olivi, 1792) LE7,9 LE5,6,7,8,9 LE5,6,7,8,9 LE5,6,7,8 SF VC Ct Donax semistriatus Poli, 1795 LE9 LE9 SF R UC Donax sp. LE9 SF R UC Donax trunculus Linnaeus, 1758 LE7 SF R UC Donax venustus Poli, 1795 LE8 SF R UC Dosinia lupinus (Linnaeus, 1758) LE8,9 LE7,8,9 LE8,9 SF C VC

74
Taxa Summer Autumn Winter Spring FG CI CI CI UE LE
Gari fervensis (Gmelin, 1791) LE9 SF R UC Gastrana fragilis (Linnaeus, 1758) LE9 SF R UC Glycymeris glycymeris (Linnaeus, 1758) LE9 SF R UC Laevicardium crassum (Gmelin, 1791) LE8 SF R UC Lutraria lutraria (Linnaeus, 1758) LE9 SF R UC Mactra corallina (Linnaeus, 1758) LE7,9 LE7,8 SF C VC Mactra sp. LE9 LE9 SF R UC Musculus discors (Linnaeus, 1767) LE7,8 LE7,9 LE5,7 LE6,7,8 SF VC Ct Mytilus galloprovincialis Lamarck, 1819 LE8 SF R UC Pandora inaequivalvis (Linnaeus, 1758) LE7,8 LE7,8,9 LE8,9 LE7 SF C VC Pharus legumen (Linnaeus, 1758) LE9 LE9 SF R UC Pitar rudis (Poli, 1795) LE8 LE8 SF R UC Scrobicularia plana (da Costa, 1778) LE9 LE8 SF UC C Solemya togata (Poli, 1795) LE9 SF R UC Solen sp. LE9 LE5 SF UC C Spisula subtruncata (da Costa, 1778) LE8,9 LE9 LE7 LE7,8,9 SF C VC Tapes philippinarum (Adams and Reeve, 1850) LE7 LE7 SF R UC Tapes pullastra (Unspecified) LE7 LE7,8 SF UC C Tapes sp. LE8,9 LE6,7,8,9 LE7,8,9 SF C Ct Tellina albicans (Gmelin, 1791) LE8,9 LE7,9 LE7 SF C VC Tellina sp. LE8,9 LE7,9 LE6,9 SF C Ct Tellina tenuis da Costa, 1778 LE9 LE5,8,9 LE7 SF C Ct Class Scaphopoda Antalis novemcostata (Lamarck, 1818) LE8 Pr R UC Antalis sp. LE8,9 LE9 LE7,8 Pr C VCPHYLUM ANNELIDA Class Hirudinea Helobdella stagnalis (Linnaeus, 1758) UE2 Pr R UC Piscicola geometra (Linnaeus, 1758) UE2 Pa R UC Class Oligochaeta Haplotaxidae indet. UE3 DF R UC Lumbricidae indet. UE2 UE1 DF UC C

75
Taxa Summer Autumn Winter Spring FG CI CI CI UE LE
Naididae indet. UE1,2 UE1,2,3 UE1,2,4; LE5 UE1,2,3,4 DF VC Ct UC Tubificidae indet. UE1,2,3; LE5 UE1,2,3,4 UE1,2,3 UE1,2,3 DF VC Ct UC Class Polychaeta Ampharete grubei Malmgren, 1865 LE6,7,8 LE6,7,8,9 LE6,7,8,9 LE6,7,8 DF C Ct Aricidea sp. LE8,9 LE6,7,8,9 LE7,8,9 LE6,7,8,9 DF VC Ct Armandia cirrhosa Filippi, 1861 LE6,7,8 LE5,6,7,9 LE5,6,7,9 LE7,8 DF VC Ct Capitella capitata (Fabricius, 1780) LE6 LE5,6,7,8,9 LE6,8,9 DF VC Ct Capitellidae indet. LE8 LE7 DF UC C Caulleriella zetlandica (McIntosh, 1911) LE8 LE6,7,8,9 LE6,7,8,9 LE6,7,8,9 DF C Ct Cirratulus cirratus (Müller, 1776) LE7,8,9 LE7,9 DF C VC Clymenura clypeata (Saint-Joseph, 1894) LE7 LE7,8 DF UC C Diopatra neapolitana Delle Chiaje, 1841 LE8,9 LE7,9 DF C VC Eteone picta Quatrefagues, 1865 LE6,7,9 LE7,9 LE7 Pr C VC Euclymene oerstedi (Claparède, 1863) LE7,8,9 LE6,7,8 DF C Ct Eunice harassii Audouin and Edwards, 1834 LE8,9 LE7 DF C VC Ficopomatus enigmaticus (Fauvel, 1923) LE6 SF R UC Glycera sp. LE6,9 LE6,7,8,9 LE6,7,8,9 Pr C Ct Glycera tesselata Grube, 1840 LE9 Pr R UC Glycera tridactyla Schmarda, 1861 LE8,9 LE6,7 Pr C Ct Harmothoe sp. LE6,9 LE7,8,9 Pr C Ct Hediste diversicolor (Müller, 1776) LE7,8 LE6,7,8 LE7,8 LE5,6,7,8 O C Ct Heteromastus filiformis (Claparède, 1864) LE5,6 LE7,8,9 LE6,7,8,9 DF VC Ct Hydroides norvegicus Gunnerus, 1768 LE7 SF R UC Lagis koreni Malmgren, 1866 LE9 LE6,9 DF UC C Laonice cirrata (Sars, 1851) LE8,9 DF UC C Lepidonotus squamatus (Linnaeus, 1758) LE7,9 LE8 Pr C VC Lumbrineris sp. LE7,8,9 LE6,7,8 LE7,8 Pr C Ct Magelona papillicornis Müller, 1858 LE9 LE7,9 DF UC C Melinna palmata Grube, 1870 LE6,7,8,9 LE5,7,8,9 LE6,7,8 DF VC Ct Micronephthys maryae San Martín, 1982 LE7 LE7,8,9 LE7,8,9 LE6,7,8,9 Pr C Ct Neosabellides oceanica (Fauvel, 1909) LE6,7,8 LE7 DF C VC Nephtys assimilis Örsted, 1843 LE9 Pr R UC

76
Taxa Summer Autumn Winter Spring FG CI CI CI UE LE
Nephtys cirrosa (Ehlers, 1868) LE9 Pr R UC Nephtys hombergii Lamarck, 1818 LE9 Pr R UC Nephtys sp. LE6,8 Pr UC C Nereididae indet. UE4; LE6,7 UE4 DF C UC C Notomastus sp. LE9 LE7,8,9 DF C VC Oriopsis armandi (Claparède, 1864) LE7,8,9 LE5,7,9 LE5,6,9 UE4;LE5,8 SF VC UC Ct Paradoneis lyra (Southern, 1914) LE7,9 LE6,7,8,9 LE7,8,9 DF C Ct Perinereis cultrifera (Grube, 1840) LE5,6 UE4 LE6 UE4; LE8 O VC UC VC Phyllodoce mucosa Örsted, 1843 LE9 LE9 LE9 Pr R UC Phylo foetida (Claparède, 1869) LE8 LE7 DF UC C Pista cristata (Müller, 1776) LE7,8 LE6,7,8,9 LE7,8,9 LE7,8 DF C Ct Prionospio malmgreni Claparède, 1869 LE7,8,9 LE7,8,9 LE7,8,9 DF C VC Pseudopolydora antennata (Claparède, 1869) LE7,8 LE5,6,9 LE5,6,7,8,9 LE6,7,8,9 DF VC Ct Sabella pavonina Savigny, 1822 LE8 LE7,8 SF UC C Sabellidae indet. LE6 LE8,9 LE6 SF C VC Serpula vermicularis Linnaeus, 1767 LE5,6,7,8 LE7 SF C Ct Sigambra parva (Day, 1963) LE9 LE7,8,9 LE7,8 Pr C VC Spio filicornis (Müller, 1776) LE8 LE5,6,7,9 LE5,6,7,8,9 LE6,7,8,9 DF VC Ct Streblospio benedicti Webster, 1879 LE7,8,9 LE5,6,7,8,9 LE5,6,7,8,9 LE5,6,8,9 DF VC Ct Syllidia armata Quatrefages, 1866 LE6,7,8,9 LE6,7,8,9 Pr C Ct PHYLUM ARTHROPODA Class Arachnida Acaridida indet. UE1 Pr R UC Halacaridae indet. UE3 Pr R UC Hydrozetes sp. UE2 Pr R UC Lebertia sp. UE2 UE2,4 Pr UC C Sperchon sp. UE2 UE2 Pr R UC Torrenticola sp. UE2,3 UE3 Pr UC C Class Pantopoda Nymphon gracile Leach, 1814 LE7 O R UC Class Branchiopoda Daphnia longispina (Müller, 1776) LE5 G R UC

77
Taxa Summer Autumn Winter Spring FG CI CI CI UE LE
Eurycercus lamellatus (Müller, 1776) UE1 G R UC Ilyocryptus sordidus (Liévin, 1848) UE1 G R UC Simocephalus exspinosus (Koch, 1841) UE1 G R UC Simocephalus vetulus (Müller, 1776) UE1 G R UC Class Ostracoda Cyprideis torosa (Jones, 1850) LE7 LE8 DF UC C Fabaeformiscandona fabaeformis (Fischer, 1851) UE2 UE1,2 UE1,4 DF C VC Herpetocypris brevicaudata (Kaufmann, 1900) UE3 DF R UC Herpetocypris sp. UE4 DF R UC Class Copepoda Acanthocyclops latipes (Lowndes, 1927) UE1 SF R UC Canuella furcigera Sars, 1903 LE7 SF R UC Centropages chierchae Giesbrecht, 1889 LE6 SF R UC Cyclops sp. UE1,3 SF UC C Eucyclops serrulatus (Fischer, 1851) UE1 SF R UC Macrocyclops albidus (Jurine, 1820) UE1,2 UE1 UE1 SF UC C Class Malacostraca Ampelisca brevicornis (Costa, 1853) LE9 SF R UC Ampelisca sp. LE7 SF R UC Ampelisca typica (Bate, 1856) LE8,9 LE9 LE9 SF UC C Apseudes latreillii (Milne-Edwards, 1828) LE9 LE8,9 DF UC C Bathyporeia sp. LE9 DF R UC Bodotria arenosa Goodsir, 1843 LE9 DF R UC Corophium orientale Schellenberg, 1928 LE5,6,7,8,9 UE4;LE5,6,9 UE4; LE5,6 UE3,4;LE5,6 DF Ct C Ct Corophium rotundirostre Stephensen, 1915 LE7,8,9 LE7,8,9 DF C VC Cumopsis goodsir (Van Beneden, 1861) LE9 DF R UC Cyathura carinata (Krøyer, 1847) LE7 LE7,8 LE7,8 DF UC C Decapoda indet. LE9 LE7,9 O UC C Diastylis sp. LE8 LE8 LE6,7,8 DF UC C Echinogammarus longisetosus Pinkster, 1973 UE1,3,4 UE4 UE2 UE2 O C Ct Gammarus aequicauda (Martyinov, 1931) LE8 O R UC Iphinoe sp. LE9 LE9 LE7,8 DF UC UC
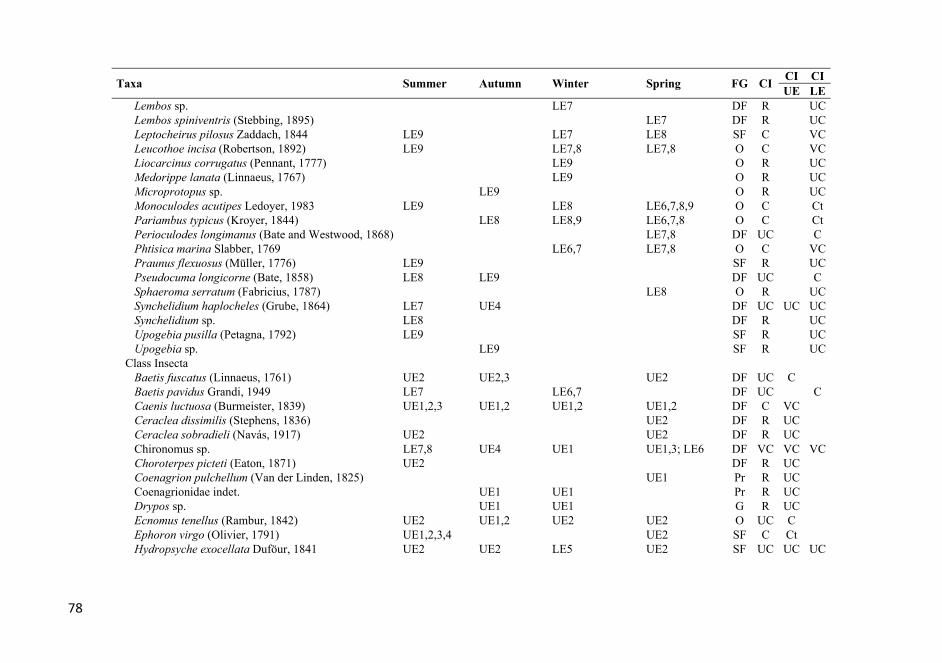
78
Taxa Summer Autumn Winter Spring FG CI CI CI UE LE
Lembos sp. LE7 DF R UC Lembos spiniventris (Stebbing, 1895) LE7 DF R UC Leptocheirus pilosus Zaddach, 1844 LE9 LE7 LE8 SF C VC Leucothoe incisa (Robertson, 1892) LE9 LE7,8 LE7,8 O C VC Liocarcinus corrugatus (Pennant, 1777) LE9 O R UC Medorippe lanata (Linnaeus, 1767) LE9 O R UC Microprotopus sp. LE9 O R UC Monoculodes acutipes Ledoyer, 1983 LE9 LE8 LE6,7,8,9 O C Ct Pariambus typicus (Kroyer, 1844) LE8 LE8,9 LE6,7,8 O C Ct Perioculodes longimanus (Bate and Westwood, 1868) LE7,8 DF UC C Phtisica marina Slabber, 1769 LE6,7 LE7,8 O C VC Praunus flexuosus (Müller, 1776) LE9 SF R UC Pseudocuma longicorne (Bate, 1858) LE8 LE9 DF UC C Sphaeroma serratum (Fabricius, 1787) LE8 O R UC Synchelidium haplocheles (Grube, 1864) LE7 UE4 DF UC UC UC Synchelidium sp. LE8 DF R UC Upogebia pusilla (Petagna, 1792) LE9 SF R UC Upogebia sp. LE9 SF R UC Class Insecta Baetis fuscatus (Linnaeus, 1761) UE2 UE2,3 UE2 DF UC C Baetis pavidus Grandi, 1949 LE7 LE6,7 DF UC C Caenis luctuosa (Burmeister, 1839) UE1,2,3 UE1,2 UE1,2 UE1,2 DF C VC Ceraclea dissimilis (Stephens, 1836) UE2 DF R UC Ceraclea sobradieli (Navás, 1917) UE2 UE2 DF R UC Chironomus sp. LE7,8 UE4 UE1 UE1,3; LE6 DF VC VC VC Choroterpes picteti (Eaton, 1871) UE2 DF R UC Coenagrion pulchellum (Van der Linden, 1825) UE1 Pr R UC Coenagrionidae indet. UE1 UE1 Pr R UC Drypos sp. UE1 UE1 G R UC Ecnomus tenellus (Rambur, 1842) UE2 UE1,2 UE2 UE2 O UC C Ephoron virgo (Olivier, 1791) UE1,2,3,4 UE2 SF C Ct Hydropsyche exocellata Duföur, 1841 UE2 UE2 LE5 UE2 SF UC UC UC
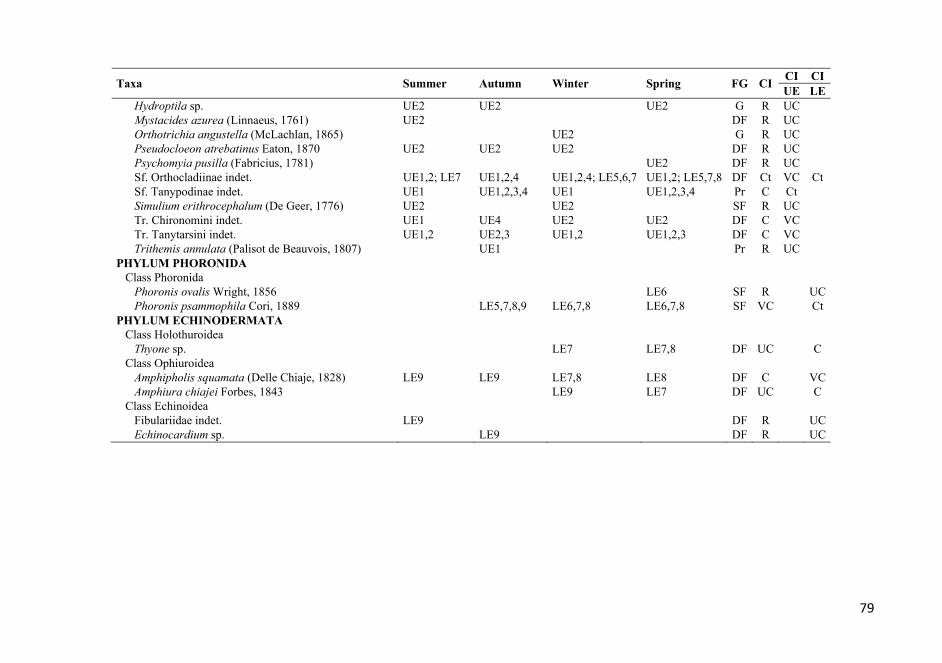
79
Taxa Summer Autumn Winter Spring FG CI CI CI UE LE
Hydroptila sp. UE2 UE2 UE2 G R UC Mystacides azurea (Linnaeus, 1761) UE2 DF R UC Orthotrichia angustella (McLachlan, 1865) UE2 G R UC Pseudocloeon atrebatinus Eaton, 1870 UE2 UE2 UE2 DF R UC Psychomyia pusilla (Fabricius, 1781) UE2 DF R UC Sf. Orthocladiinae indet. UE1,2; LE7 UE1,2,4 UE1,2,4; LE5,6,7 UE1,2; LE5,7,8 DF Ct VC Ct Sf. Tanypodinae indet. UE1 UE1,2,3,4 UE1 UE1,2,3,4 Pr C Ct Simulium erithrocephalum (De Geer, 1776) UE2 UE2 SF R UC Tr. Chironomini indet. UE1 UE4 UE2 UE2 DF C VC Tr. Tanytarsini indet. UE1,2 UE2,3 UE1,2 UE1,2,3 DF C VC Trithemis annulata (Palisot de Beauvois, 1807) UE1 Pr R UC PHYLUM PHORONIDA Class Phoronida Phoronis ovalis Wright, 1856 LE6 SF R UC Phoronis psammophila Cori, 1889 LE5,7,8,9 LE6,7,8 LE6,7,8 SF VC Ct PHYLUM ECHINODERMATA Class Holothuroidea Thyone sp. LE7 LE7,8 DF UC C Class Ophiuroidea Amphipholis squamata (Delle Chiaje, 1828) LE9 LE9 LE7,8 LE8 DF C VC Amphiura chiajei Forbes, 1843 LE9 LE7 DF UC C Class Echinoidea Fibulariidae indet. LE9 DF R UC Echinocardium sp. LE9 DF R UC

81
CHAPTER II
Benthic macrofaunal dynamics and environmental
stress, across a riverine-marine boundary, in a salt
wedge Mediterranean estuary.
Nebra A, Caiola N, Alcaraz C, Muñoz-Camarillo G, Ibáñez C
Marine Environmental Research (submitted and currently under review)

CHAPTER II: Macrofaunal trends at a riverine-marine boundary s
83
Benthic macrofaunal dynamics and environmental stress,
across a riverine-marine boundary, in a salt wedge
Mediterranean estuary.
Nebra, A; Caiola, N; Alcaraz, C; Muñoz-Camarillo, G and Ibáñez, C.
IRTA-Aquatic Ecosystems. Ctra. Poble Nou, km 5.5, E-43540, Sant Carles de la
Ràpita, Spain.
ABSTRACT
The spatial distribution of benthic macroinvertebrate community in relation to
environmental factors was studied along the Ebro Estuary (NE Iberian Peninsula), a
salt wedge Mediterranean estuary. Both ordination methods and generalized additive
models were performed to identify the different benthic assemblages and their
relationship to abiotic factors. Our results showed a strong relationship between
macrofaunal assemblages and the predominant environmental gradients (e.g.
salinity); thus revealing spatial differences in their structure and composition. Two
different stretches were also identified, namely the upper (UE) and the lower Ebro
Estuary (LE). UE showed riverine characteristics and hence a freshwater community;
whereas LE was influenced by marine intrusion and sustained a complex marine-
origin community. However, within each stretch, water and sediment characteristics
played an important role in explaining species composition differences among
sampling stations. Moreover, outcomes suggested a total species replacement pattern,
instead of the nestedness pattern usually associated with well-mixed temperate
Corresponding author: [email protected]

A. Nebra, N. Caiola, C. Alcaraz, G. Muñoz-Camarillo & C. Ibáñez
84
estuaries. Both sharp species turnover together with the estuarine stratification point
out that the Ebro Estuary is working, in terms of ecological boundaries, under an
ecotone model. Finally, despite obvious differences with well mixed estuaries (i.e.
lack of tide influence, stratification and species turnover), the Ebro Estuary shares
important ecological attributes with well-mixed temperate estuaries.
Keywords: Macroinvertebrates; highly stratified estuary; salinity; ecotone;
multivariate analysis; GAMs; large river.
INTRODUCTION
Estuaries are critical transition zones linking freshwater and marine systems, where a
broad range of physicochemical factors co-occur in a small geographical area (Levin
et al., 2001; Elliot and Whitfield, 2011). The close connection between riverine and
marine habitats assures a rapid and constant flux-exchange of energy, materials and
organisms; for this reason, estuaries are commonly described as stressful (e.g. Elliot
and Whitfield, 2011; Day et al., 2012) and biologically dynamic ecosystems (e.g.
Ahel et al., 1996; Nebra et al., 2011). Estuarine environmental gradients impose
physiological constraints on biota; only a few specialized species are capable of
withstanding them, resulting in extremely poor communities compared with those
from adjacent riverine and marine areas (McLusky and Elliott, 2004; Dauvin, 2007;
Elliot and Whitfield, 2011; Day et al., 2012). Among the different abiotic factors that
are known to affect the macrofaunal distribution and diversity within estuaries, of
both natural and anthropogenic origin, the salinity variation has been identified as the
main driver in structuring estuarine communities. Although the relationship between
salinity gradient and macrofaunal patterns has been extensively studied (e.g. Remane
1934; Attrill, 2002; Attrill and Rundle, 2002; Giberto et al., 2007; Whitfield et al.,
2012); nevertheless, the definition of estuary in relation with tidal influence and the
salinity gradient formation is still controversial (e.g. McLusky, 1999; Elliott and
McLusky, 2002; Tagliapietra et al., 2009; Potter et al., 2010; Telesh and Khlebovich,

CHAPTER II: Macrofaunal trends at a riverine-marine boundary s
85
2010). Recent studies still associate its definition with tidal influence as the main
mixing agent forming the salinity gradient (Elliott and McLusky, 2002; Tagliapietra
et al., 2009). Since the development of the Remane diagram (Remane, 1934), several
modifications and new models have been developed to explain the richness pattern of
biota along the estuarine salinity gradient (Whitfield et al., 2012); one of them
included ecological boundary concepts for estuaries like ecotone and ecocline (Attrill
and Rundle, 2002). Considering that the riverine-marine interface is the most obvious
landscape boundary in aquatic ecology and that ecological boundaries are matter of
contemporary ecology, it is clear that estuarine boundaries require more clarification
and will probably influence future studies (Rundle, 1998; Strayer et al., 2003).
All of the aforementioned is applicable to well-mixed estuaries; but what occurs in
rivers emptying into non-tidal seas that normally form stratified type estuaries?
Should these river-mouths be considered estuaries according to currently accepted
definitions of estuary? Are salt wedge estuaries colonized by different species than
those inhabiting well-mixed estuaries? Which would be the best model for describing
biota distribution patterns? Can this kind of riverine-marine boundary actually be
considered an ecotone or ecocline?
When compared to well-mixed estuaries, in salt wedge estuaries: (i) river discharge
controls marine intrusion due to the low tidal range (usually tidal amplitude is less
than 2 m); (ii) weak mixing drivers enhance water column stratification promoting
the formation of a salt wedge landwards; (iii) vertical profile of density and salinity
shows an abrupt change from surface to bottom, friction between fresh and saltwater
layers forms a narrow interface called halocline; (iv) isohalines are arranged
horizontally and (v) if sediment load is high, a Delta may be formed. As
consequence, in salt wedge estuaries environmental fluctuations are not gradual due
to the lack of mixing events; there is not salinity gradient along the estuary (Ibáñez,
1993); but in contrast with mixed estuaries the biota must be adapted to abrupt
changes rather than to gradual ones, not only in salinity terms but also in other
environmental features like temperature, Eh (redox potential) or pH. Moreover, salt

A. Nebra, N. Caiola, C. Alcaraz, G. Muñoz-Camarillo & C. Ibáñez
86
wedge estuaries become rivers if flows are high enough (mean annual river discharge
is close to the critical value determining the formation and breakup of the salt wedge)
to expel marine intrusion (Ibáñez, 1997); thus, environmental stress for biota is more
pronounced (Elliot and Whitfield, 2011). The material exchange is mainly the result
of entrainment process between layers together with the turbulence occurring at the
salt wedge tip or null point; the halocline only allows scarce transfer of materials
between layers, mainly coarse suspension particles and died organisms coming from
the upper layer and salt and nutrients from the lower layer (Dyer, 1997; Lewis,
1997).
In this study we investigate how environmental factors influence macrofaunal
community distribution in a distinctive riverine-marine boundary; therefore, the aims
of this paper are: first, to relate the distribution and abundance of the different
macroinvertebrate species to environmental variables and river disturbances by
means of ordination methods, and second, to analyze the response of the macrofaunal
populations at the community level to the variation in limnological features along the
whole estuarine stretch.
MATERIALS AND METHODS
2.1 Study site
The study was conducted in the Ebro Estuary (Fig. 1) located in the NE of the Iberian
Peninsula (40º43’10”N, 0º40’30”E). The Ebro River flows into the Mediterranean
Sea and forms a Type 4 (salt wedge or highly stratified) estuary (Hansen and Rattray,
1966; Ibáñez, 1993; Ibáñez et al., 1997 ) of about 32 km long, with a mean width of
240 m and a mean water depth of 7 m. The tidal range is low, ca. 20 cm (Cacchione
et al., 1990), and its low influence promotes the formation of a salt wedge, which is
controlled by river discharge (advance, retreat and permanence). Briefly, when river
flow exceeds 350-400 m3 s-1 the salt wedge is pushed seawards and the estuary works
as a river or ‘fluvial estuarine stretch’ (Ibáñez 1993), conversely the salt wedge

CHAPTER II: Macrofaunal trends at a riverine-marine boundary s
87
reaches its maximum landwards (ca. 30-32 km from the river mouth) at flows lower
than 100 m3 s-1 (Ibáñez, 1993; Ibáñez et al., 1997).
The basin is highly regulated by approximately 190 dams, managing water for
hydropower production, irrigation, and human consumption. Large reservoirs have
altered the annual flow not only by modifying the natural seasonal flow pattern but
also by preventing flood frequency and intensity (Ibáñez et al., 2012; Rovira et al.,
2012a). The annual mean flow decreased during the last decades (Ibáñez et al., 1996,
2008). In particular, Mequinenza and Ribarroja reservoirs (located on the main river
about 100 km upstream from the river mouth) have a significant regulatory effect
over flows in the lower Ebro River (Ibáñez et al., 2012; Rovira et al., 2012a), and
therefore are considered to be the final responsible of the salt wedge dynamics and
macrofaunal trends along Ebro Estuary. Water abstraction and regulation virtually
assures the presence of the salt wedge in the same position for long periods (Ibáñez
et al., 1995; Sierra et al., 2004; Falcó et al., 2010; Nebra et al., 2014).
2.2 Sampling design and laboratory procedures
In order to cover the whole study area, both the estuary and the potential stretch
accessible by salt wedge during low flow periods, nine sampling stations were
established from the river mouth to 37 km upstream (Fig. 1). Each station was
sampled seasonally (from summer 2007 to spring 2008) for benthic
macroinvertebrates, sediment traits, dissolved oxygen (DO), nutrient loadings (PO4,
PT, NH4, NO2, NO3, NT and SiO4) and hydromorphological characteristics (depth,
flow velocity and water transparency) (see Appendix 1). Data available at the Ebro
Basin Authority web site (http://www.chsegura.es; station 9027: Tortosa), were used
to calculate the permanence time of the salt wedge in each sampling station and
season as a function of the daily average river flows according to Ibáñez (1993). For
detailed analysis procedures and units see Nebra et al., 2014.

A. Nebra, N. Caiola, C. Alcaraz, G. Muñoz-Camarillo & C. Ibáñez
88
Figure 1. Map showing the Ebro Estuary, its deltaic plain and the location of the nine
sampling stations. UE, upper estuary stations; LE, lower estuary stations; SW, salt wedge
tip’s position.
2.3 Data analysis
The macroinvertebrate abundance and environmental variables data sets were
analyzed by means of multivariate ordination techniques, including both indirect
(Principal Component Analysis and Detrended Correspondence Analysis; PCA and
DCA, respectively) and direct (Canonical Correspondence Analysis; CCA) gradient
techniques. A PCA was carried out to explore the relationships and association
patterns among environmental variables in the sample sets. Kaiser-Meyer-Olkin’s
(KMO) measure of sampling adequacy was used to assess the usefulness of a PCA;
KMO ranges from 0 to 1 and should be > 0.5 if variables are sufficiently

CHAPTER II: Macrofaunal trends at a riverine-marine boundary s
89
interdependent for PCA to be useful. On the other hand, the structure of the
macroinvertebrate community was investigated by means of DCA (i.e. indirect
gradient technique) and CCA (i.e. direct analysis method). Indirect gradient analysis
only uses the species × sample matrix in the ordination whereas in direct techniques
the ordination results are constrained to optimize their linear relationship to the
environmental variables. Indirect and direct gradient analyses are complementary
because although direct gradient analysis provide an ordination using the two
matrices in a single analysis, indirect techniques are often more robust (McCune,
1997) and can show species gradients because of unmeasured environmental
variables. CCA analysis was appropriate as direct technique because a DCA showed
that the first axis length exceeded more than four standard deviation units and then a
unimodal response model technique was preferable to assess the relationship between
macroinvertebrate community and environmental variables (Lepš and Šmilauer
2003).
To further describe salinity and taxa variation (from Class to Family level) along the
Ebro Estuary (from mouth to upper estuary limit) Generalized Additive Models
(GAMs) (Lepš and Šmilauer, 2003) were also fitted. GAMs are an extension of the
generalized linear models that, unlike more conventional regression methods, do not
require the assumption of a particular shape for the response variable distribution
along the environmental gradient, being a flexible and powerful analytical tool when
assessing nonlinear relationships (Lepš and Šmilauer, 2003; Carol et al. 2006;
Alcaraz et al., 2011). Model complexity was selected by the stepwise selection
procedure using the Akaike information criterion (AIC). The AIC not only considers
the goodness of fit but also parsimony; penalizing very complex models (Burnham
and Anderson, 1998), thus variables without an adequate candidate model are
automatically deleted, for instance rare taxa for which there is no evidence of
response to the gradient.
Multivariate analyses were performed with Canoco 4.5 (Lepš and Šmilauer, 2003),
downweighting rare species and log-transforming species abundances and most

A. Nebra, N. Caiola, C. Alcaraz, G. Muñoz-Camarillo & C. Ibáñez
90
environmental variables, because normality and homoscedasticity were clearly
improved (Levene’s test for equality of variances). The environmental variables in
CCA were selected using the forward selection procedure of CANOCO 4.5 (Lepš
and Šmilauer 2003), which tests the significance of the variables with Monte Carlo
permutation test (499 permutations). GAMs were conducted using R software 3.2.2
through the gam 1.12 package.
RESULTS
3.1 Environmental characterization of the Ebro Estuary
The daily mean river discharges in all four sampling seasons were below 350 m3 s-1,
thus allowing the marine intrusion. However, the permanence time (expressed as
accumulated days) the marine intrusion varied among seasons, being 52, 140, 254
and 341 days in summer, autumn, winter and spring, respectively. The presence of
the salt wedge produced a sharp change in physico-chemical characteristics along the
estuary bottom, clearly differentiating two contrasting stretches, the upper and lower
estuary (UE and LE) (Figs. 1, 2, 3 and 4). The salt wedge tip or null point was
located between the stations UE4 and LE5 (Fig. 1) in all sampling occasions. The
lower estuary (LE5-LE9 stations) was stratified during the whole studied period and
had marine water, whereas the upper estuary (UE1-UE4 stations) had fresh water
(see salinity values in Appendix 1). Sediment characterization showed an estuarine
bottom predominantly sandy and sandy-mud (Appendix 1). Samples were primarily
composed of sand (> 65% at 8 stations), mud was abundant in LE stations; except for
LE5 station, and gravel was mainly restricted to UE2 station, which had the highest
current velocity (Appendix 1). Total organic matter, total suspended solids and
organic suspended solids were higher in the LE stations than in the UE, showing a
maximum of suspended solids in LE9 stations. With regards to nutrients, in general
terms their concentrations were higher in the riverine stretch of the estuary than in
the marine zone; with the exception of LE5 station for ammonium and phosphorous
compounds (Appendix 1). Dissolved oxygen was never limiting, although LE5
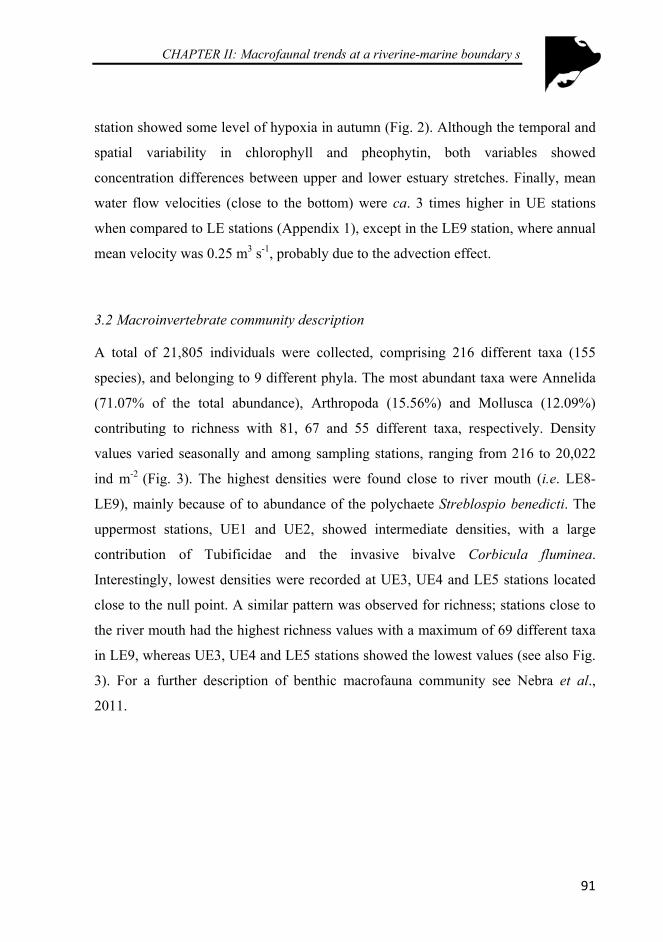
CHAPTER II: Macrofaunal trends at a riverine-marine boundary s
91
station showed some level of hypoxia in autumn (Fig. 2). Although the temporal and
spatial variability in chlorophyll and pheophytin, both variables showed
concentration differences between upper and lower estuary stretches. Finally, mean
water flow velocities (close to the bottom) were ca. 3 times higher in UE stations
when compared to LE stations (Appendix 1), except in the LE9 station, where annual
mean velocity was 0.25 m3 s-1, probably due to the advection effect.
3.2 Macroinvertebrate community description
A total of 21,805 individuals were collected, comprising 216 different taxa (155
species), and belonging to 9 different phyla. The most abundant taxa were Annelida
(71.07% of the total abundance), Arthropoda (15.56%) and Mollusca (12.09%)
contributing to richness with 81, 67 and 55 different taxa, respectively. Density
values varied seasonally and among sampling stations, ranging from 216 to 20,022
ind m-2 (Fig. 3). The highest densities were found close to river mouth (i.e. LE8-
LE9), mainly because of to abundance of the polychaete Streblospio benedicti. The
uppermost stations, UE1 and UE2, showed intermediate densities, with a large
contribution of Tubificidae and the invasive bivalve Corbicula fluminea.
Interestingly, lowest densities were recorded at UE3, UE4 and LE5 stations located
close to the null point. A similar pattern was observed for richness; stations close to
the river mouth had the highest richness values with a maximum of 69 different taxa
in LE9, whereas UE3, UE4 and LE5 stations showed the lowest values (see also Fig.
3). For a further description of benthic macrofauna community see Nebra et al.,
2011.

A. Nebra, N. Caiola, C. Alcaraz, G. Muñoz-Camarillo & C. Ibáñez
92
3.3 Benthic environmental condition and macrofauna communities’ response
Many of the environmental variables were interdependent and significantly
correlated among them, with the KMO's measure of sampling adequacy (0.56)
indicating the usefulness of the PCA. The first two axes of the PCA explained the
52.75% of the total variation, 32.96 and 19.79%, for the first and second axis
respectively (Fig. 2). The strongest correlations were observed between velocity and
SiO4, PO4, NO2, NO3 and NT (r > 0.687 in all cases); these variables were all
positively correlated and opposed to conductivity, TOM and mud content. The first
PCA axis summarized these correlations displaying an apparent upstream-
downstream gradient, and revealed the sharp change in salinity and nutrient loads
from the marine influenced LE stations, to nutrient-enriched riverine UE sites. The
exceptions were the spring samples of LE6, LE7 and LE9 stations probably as the
result of the high level of dissolved NT recorded in this season. The second PCA axis
distinguished a flow gradient, from the low-flows in summer and winter to high
flows in autumn and spring (with highest TSS, OSS, chlorophyll and pheophytin, but
opposed to organic suspended solids).
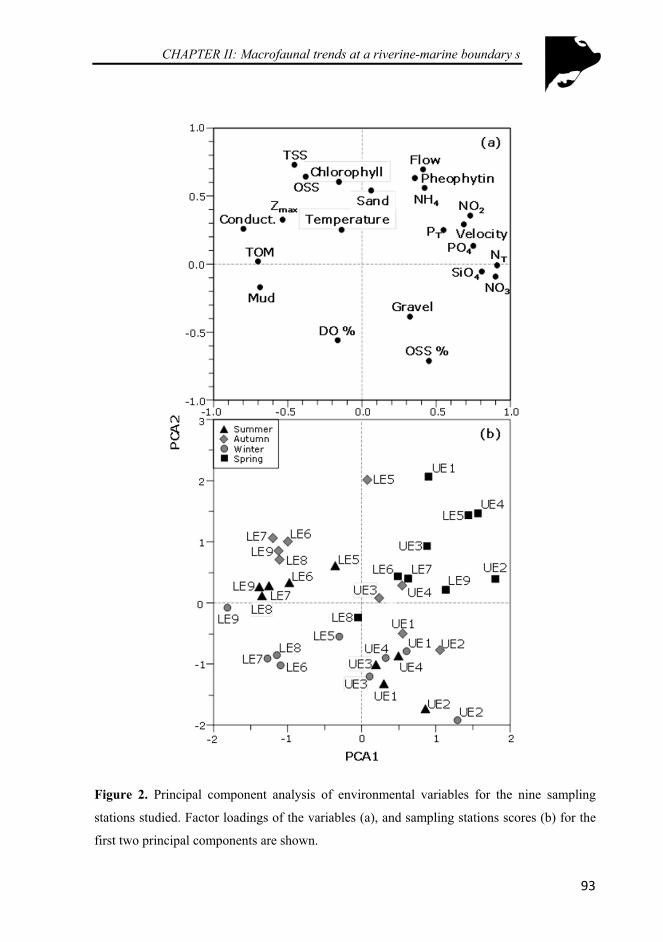
CHAPTER II: Macrofaunal trends at a riverine-marine boundary s
93
Figure 2. Principal component analysis of environmental variables for the nine sampling
stations studied. Factor loadings of the variables (a), and sampling stations scores (b) for the
first two principal components are shown.
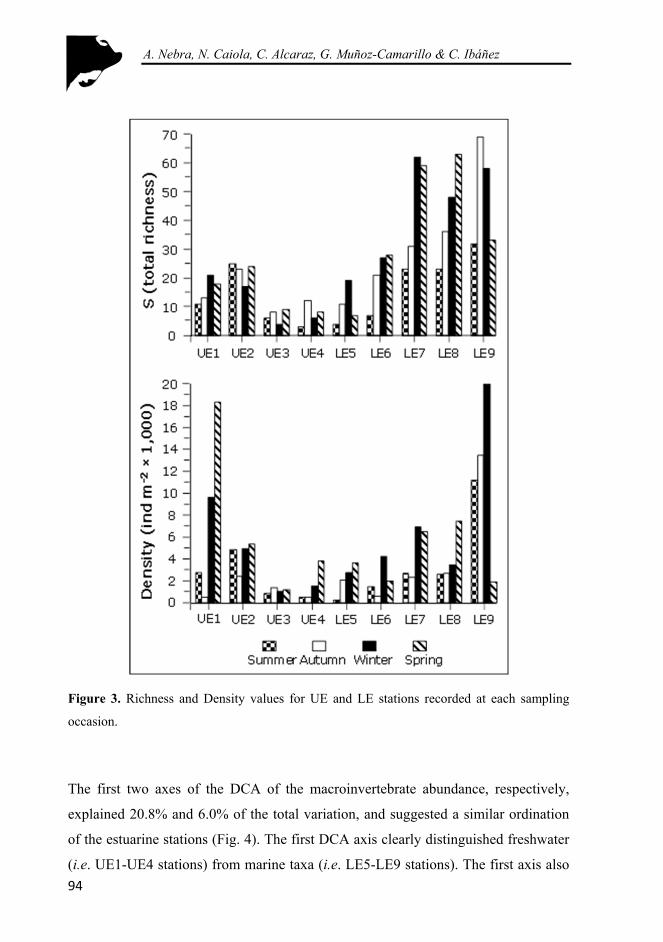
A. Nebra, N. Caiola, C. Alcaraz, G. Muñoz-Camarillo & C. Ibáñez
94
Figure 3. Richness and Density values for UE and LE stations recorded at each sampling
occasion.
The first two axes of the DCA of the macroinvertebrate abundance, respectively,
explained 20.8% and 6.0% of the total variation, and suggested a similar ordination
of the estuarine stations (Fig. 4). The first DCA axis clearly distinguished freshwater
(i.e. UE1-UE4 stations) from marine taxa (i.e. LE5-LE9 stations). The first axis also

CHAPTER II: Macrofaunal trends at a riverine-marine boundary s
95
differentiated stations dominated by euryhaline species; e.g. Corophium orientale,
Perinereis cultrifera, Ficopomatus enigmaticus, Hediste diversicolor and Cyathura
carinata, from those stations with strictly freshwater or marine community (Fig. 4).
The second DCA axis discriminated mostly in the UE stations group, in this case
separating UE1 station dominated by euryoecious taxa as the invasive bivalve C.
fluminea or the tolerant Chironomus sp., Echinogammarus longisetosus and
Tubificidae oligochaetes, from those stations (UE2-UE3) with more balanced
community.
Figure 4. Detrended correspondence analysis of the macrofauna abundance data for the nine
stations studied.

A. Nebra, N. Caiola, C. Alcaraz, G. Muñoz-Camarillo & C. Ibáñez
96
3.4 Relationship of environmental factors with the macroinvertebrate community
The CCA analysis of macrofauna abundance confirmed the previously described
pattern with two distinct station groups corroborating PCA and DCA stations
grouping (Fig. 5). The total taxa-environment variance explained by the first two
canonical axes was 52.4% (37.1 and 15.3, respectively), accounting for the 20.6% of
the total variance in taxa abundance data. Only eight variables were retained by the
forward selection procedure (Fig. 5). The first CCA axis was mainly associated with
salinity and nitrate concentration; distinguishing the saltwater LE stations with
marine community, from the UE stations characterized by elevated nitrogen
compounds concentration and a freshwater community. The second canonical axis
separated the stations with high contents of organic suspended solids but low gravel
content, for instance UE4 and LE5 stations, characterized by the presence of stress
tolerant taxa such as the amphipod Corophium orientale, Tubificids oligochaetes and
Nereid polychaetes.
Salinity was the most important factor in structuring benthic communities; therefore,
riverine and marine stations (i.e. UE and LE or pre-salt wedge and salt wedge
stations) were analyzed separately. The CCA conducted on UE (i.e. pre-salt wedge)
macroinvertebrate abundance retained only five variables of the environmental
variable initially included (Fig. 6). The first two canonical axes explained the 28.6%
of total variation in macroinvertebrate taxa abundance, accounting for the 35.7 and
23.9% of the variance in taxa-environment relation. The first axis was mainly related
to depth, separating deeper stations from shallower ones. UE4 station in spring,
coinciding with the maximum flow, was characterized by the presence of euryhaline
and stress tolerant species such as P. cultrifera, C. orientale and Nereid polychaetes
immature stages. Both UE3 and UE4 stations (displayed across the axis) were
dominated by several tolerant taxa, for instance E. longisetosus, Tubificidae,
Lumbricidae Chironomidae, Nematoda and the invasive C. fluminea. The second
CCA axis distinguished stations with highest organic matter, chlorophyll and nitrate
values and lowest gravel content. This gradient was also translated into a pattern of

CHAPTER II: Macrofaunal trends at a riverine-marine boundary s
97
taxa composition, from UE1 station, characterized by the presence of standing water
taxa like Macrocyclops albidus, Cyclops sp., Ilyocryptus sordidus and
Fabaeformiscandona fabaeformis to UE2 station dominated by the presence of
several species of caddisflies and mayflies (Fig. 6b).
Figure 5. Canonical correspondence analysis triplot of macrofauna abundance data and
environmental variables assessed in the nine sampling stations studied. Environmental
variables are represented by arrows, which length is proportional to variable importance and
orientation represents their correlation with the axes.
Regarding LE stretch (i.e. salt wedge stretch); of the environmental variables initially
included in the CCA, only 5 were retained by the forward selection procedure (Fig.
7). The first two canonical axes respectively explained 32.6 and 19.8% of the total
variation in taxa-environment relationship, accounting for the 22.6% of the total
A. Nebra, N. Caiola, C. Alcaraz, G. Muñoz-Camarillo & C. Ibáñez
98
variation in taxa abundance. The first axis separated stations influenced by the salt
wedge tip, i.e. with instable conditions and higher organic suspended solids
concentrations, from those with more stable conditions because of the proximity to
river mouth characterized by higher total organic matter and total nitrogen values.
Salt wedge influenced stations, with a poor community, were dominated by
eurybiontic and tolerant taxa such as H. diversicolor, P. cultrifera, C. orientale and
C. carinata (Fig. 7). Opposed stations, LE8 and LE9, were colonized by typical
marine species associated with the Abra alba-Lagis koreni community (colonizing
fine sediments, rich in organic matter). Finally, LE7 and LE8 were characterized by a
rich community mixed with stress-tolerant taxa, e.g. Capitella capitata,
Heteromastus filiformis and Spionidae (Polychaeta) together with Corbula gibba,
which usually colonizes disturbed areas.
Overall, in both groups (pre-salt wedge and salt wedge) warmer samplings were
separated by the second CCA axis, showing the greatest productivity and
characterized by high organic suspended solids content, benefited by the upper layer
transparency (Fig. 6 and Fig. 7).

CHAPTER II: Macrofaunal trends at a riverine-marine boundary s
99
Figure 6. Canonical correspondence analysis of macroinvertebrate abundance data and
environmental variables assessed for the riverine stations. a, CCA triplot; b, CCA biplot of
environmental variables and macrofauna taxa data.
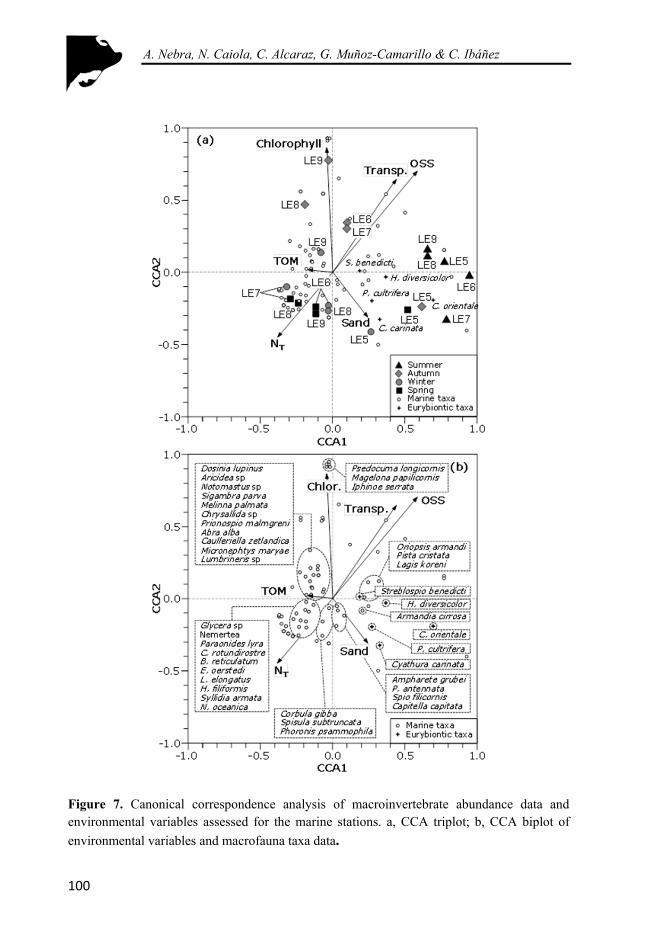
A. Nebra, N. Caiola, C. Alcaraz, G. Muñoz-Camarillo & C. Ibáñez
100
Figure 7. Canonical correspondence analysis of macroinvertebrate abundance data and environmental variables assessed for the marine stations. a, CCA triplot; b, CCA biplot of
environmental variables and macrofauna taxa data.

CHAPTER II: Macrofaunal trends at a riverine-marine boundary s
101
The salinity response curve (GAM) to distance to the river mouth (Fig. 8) confirmed
the two-stretch pattern observed in ordination methods (i.e. PCA and CCA) results.
AIC selected a polynomial response for salinity variation along the lower Ebro River
(Fig. 8), thus, differentiating the upper and the lower river sections. The response
curves (GAMs) also revealed differences in taxa abundance variation, thus
confirming and clarifying previous results (Fig. 9 & Fig.10). The response curves for
Caenidae, Chironomidae, Physidae, Ephemeroptera, Insecta, Oligochaeta,
Basommatophora and Corbiculidae showed a clear increase landwards; downstream
once passed null point (shaded area in plots) these taxa almost disappeared (Fig. 9).
Opposite, the response curves for Cirratulida, Echinodermata, Opheliida, Eunicida,
Spionida, Phyllodocida, Myoida and Veneridae (representatives of brackish and
marine waters) showed the inverse tendency with a clear decrease with distance to
river mouth; upstream of null point these taxa disappeared (the only exception was
the Phyllodocida because of the contribution of euryhaline Nereididae). In both
figures, it is noteworthy that salinity change has a clear effect over the distribution of
taxa.
Figure 8. Response curve of salinity with distance to river mouth. The curve is the
generalized additive models (GAM) selected by the Akaike information criterion (AIC). SW,
salt wedge tip.
Sali
nit
y(g
l-1
)
0 5 10 15 20 25 30 35
Distance to mouth (Km)
UE1UE2UE3UE4LE5LE6LE7LE8LE9
0
5
10
15
20
25
30
35
40Salinity
SW
F1,32 = 111.2P < 0.001

A. Nebra, N. Caiola, C. Alcaraz, G. Muñoz-Camarillo & C. Ibáñez
102
Figure 9. Response curves of UE taxa with distance to river mouth (the eight most
representative taxa are shown). The curves are the generalized additive models selected by
the Akaike information criterion (AIC). SW, salt wedge tip.
Distance to Mouth (Km)
To
tal A
bu
nd
an
ce(N
)
0
10
20
30
40
50
60
70
80
90
EphemeropteraF1,34 = 6.73P < 0.05
0
5
10
15
20
25
30
Basommatophora
0 5 10 15 20 25 30 35
F1,33 = 10.29 P < 0.01
0 5 10 15 20 25 30 35
100
200
300
400
500
600
Corbiculidae
0
F1,33 = 7.01P < 0.05
UE1UE2UE3UE4LE5LE6LE7LE8LE9SW
0
25
50
75
100
125
150
175
ChironomidaeF1,32 = 23.83 P < 0.001
0
5
10
15
20
25
30
35
40
UE1UE2UE3UE4LE5LE6LE7LE8LE9SW
CaenidaeF1,33 = 6.64P < 0.05
0
5
10
15PhysidaeF1,32 = 13.60 P < 0.001
0
25
50
75
100
125
150
175
200
InsectaF1,32 = 43.70 P < 0.001
Oligochaeta
0
500
1000
1500
2000
2500
F1,32 = 8.59 P < 0.01
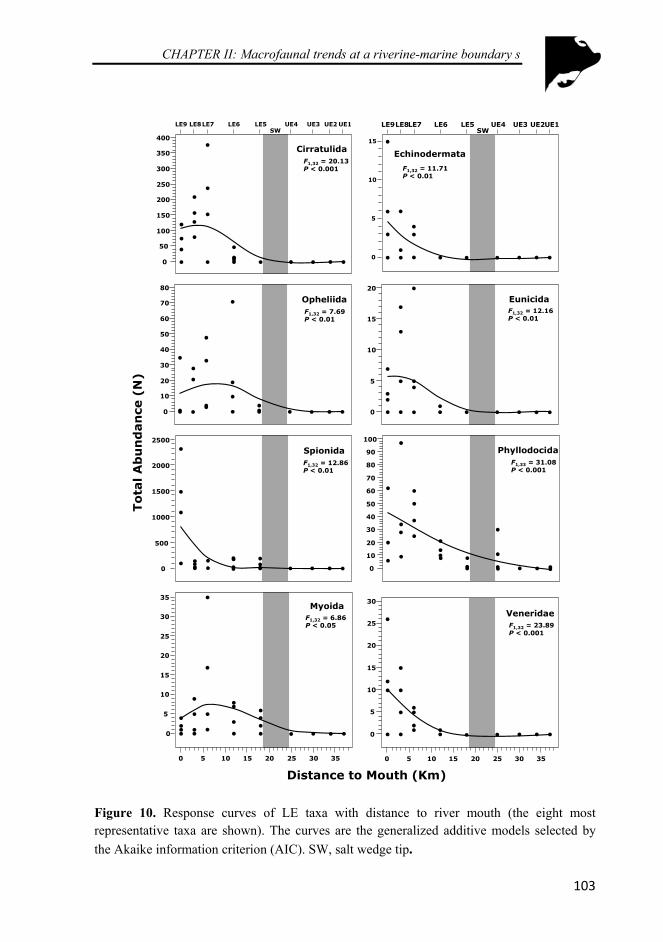
CHAPTER II: Macrofaunal trends at a riverine-marine boundary s
103
Figure 10. Response curves of LE taxa with distance to river mouth (the eight most representative taxa are shown). The curves are the generalized additive models selected by
the Akaike information criterion (AIC). SW, salt wedge tip.
Myoida
0 5 10 15 20 25 30 35
0
5
10
15
20
25
30
35
F1,32 = 6.86P < 0.05
0
5
10
15
UE1UE2UE3UE4LE5LE6LE7LE8LE9
Echinodermata
SW
F1,32 = 11.71 P < 0.01
Phyllodocida
0
10
20
30
40
50
60
70
80
90
100
F1,33 = 31.08 P < 0.001
Opheliida
0
10
20
30
40
50
60
70
80
F1,32 = 7.69 P < 0.01
Spionida
0
500
1000
1500
2000
2500
F1,32 = 12.86 P < 0.01
UE1UE2UE3UE4LE5LE6LE7LE8LE9
0
50
100
150
200
250
300
350
400
Cirratulida
SW
F1,32 = 20.13 P < 0.001
Veneridae
0
5
10
15
20
25
30
0 5 10 15 20 25 30 35
F1,32 = 23.89P < 0.001
0
5
10
15
20
EunicidaF1,32 = 12.16 P < 0.01
To
tal A
bu
nd
an
ce(N
)
Distance to Mouth (Km)
A. Nebra, N. Caiola, C. Alcaraz, G. Muñoz-Camarillo & C. Ibáñez
104
DISCUSSION
4.1 Macrofaunal trends at Ebro’s riverine-marine boundary
Community ecology research try to respond two central questions: does variability in
species composition along environmental gradients and across spatial scales follow
non-random patterns? and, consequently, 2) what mechanisms produce these
patterns? (Ulrich and Almeida-Neto, 2012). Community trends in relation with
salinity gradient are well documented for mixed estuaries (e.g. Remane, 1934; Wolff,
1973; Attrill and Thomas, 1996; Giberto et al., 2007; Day et al., 2012). Mixed
estuaries present a relatively extensive gradient zone where a heterogeneous range of
transitional assemblages thrive. A well-established salinity gradient acts as an
‘ecophysiological selector’ for species; each one, with fresh or marine origin, has a
salinity optimum and a tolerance range, and when overtaken, the species disappears.
The overlapping of populations, with different salinity tolerance range, led the
formation of an assemblage-continuum along the estuary with a nested distribution
pattern (Ulrich and Almeida-Neto, 2012). This pattern can be traduced, in terms of
ecological boundaries, as an ecocline, a gradient zone containing relatively
heterogeneous assemblages and environmentally more stable than an ecotone.
Ecoclines therefore represent boundaries of progressive change (both spatial and
ecological) between two ecosystems, in response to the gradual difference in at least
one major environmental factor (Attrill and Rundle, 2002), such as salinity in
estuaries. In salt wedge estuaries, such as the Ebro, the river flow mediates the
marine intrusion into the river channel, and therefore the community dynamics
(Ibáñez, 1993); salinity does not change gradually and the gradient zone is restricted
to a narrow and dynamic area around the null point. Because of the stress imposed on
biological communities by salinity (tolerance ranges of species are suddenly
overtaken); there is a drastic change in species composition, or in our case, a total
replacement, upstream and downstream of the null point; thus causing a turnover in
the diversity pattern (Ulrich and Almeida, 2012; Barros et al., 2014). Our results are
consistent with this pattern, two macroinvertebrate communities were clearly

CHAPTER II: Macrofaunal trends at a riverine-marine boundary s
105
differentiated along the Ebro Estuary and with respect to the estuarine null point;
without a gradual transition change, a characteristic freshwater community was
found restricted to UE stations, and a complex and rich estuarine community
downstream the null point (see also Nebra et al., 2011 for detailed communities’
description). GAMs outcomes reflected the scarce exchange of species between
community types, since only a few euryoecious marine-derived taxa were reported
inhabiting both environments (e.g. Nereid polychaeta). This narrow riverine-marine
interface is interpreted as an ecotonal boundary; a zone characterized by the rapid
change between two different homogeneous communities, where fluctuations create
a time-series of strongly different, but individually, homogeneous environments
(Gosz, 1993; Attrill and Rundle, 2002; Acha et al., 2015).
Ecosystem boundaries has been largely studied on terrestrial ecosystems (Attrill and
Rundle, 2002; Strayer et al., 2003; Acha et al., 2015), but have received less
attention in aquatic ecosystems. Only a few recent estuarine studies have been
focused (although from different approaches) partially or totally in ecological
boundaries (e.g. Attrill and Rundle, 2002; Elliot and Whitfield, 2011; Whitfield et
al., 2012; Basset et al., 2013; Conde et al., 2013). In spite of considering estuarine
boundaries as ecotones or ecoclines, all these works deal with the redefinition of
estuarine boundaries; since, different boundary types have different structural and
functional characteristics; thus it is highlighted the necessity of accounting for the
correct interpretation of ecological boundaries and the application of proper
biodiversity models, and in this way prevent misleading designs, tests of theories,
and study comparisons as suggested by Strayer et al. (2003).
4.2 Environmental stress along Ebro Estuary
Salinity was the most important stressor explaining the macroinvertebrate
community turnover along the Ebro Estuary. Our results also showed small-scale
variation in macroinvertebrate community within both upper and lower estuary. Both
richness and diversity decreased from the lower and upper estuary towards to the null
A. Nebra, N. Caiola, C. Alcaraz, G. Muñoz-Camarillo & C. Ibáñez
106
point where the environmental stress is maximum (Nebra et al., 2011); seasonal
variations were evident both in richness and abundance terms but maintaining this
pattern. Our results are consistent with estuarine models predicting richness increase
seawards (e.g. Remane, 1934; Rundle et al., 1998; Attrill, 2002; Attrill and Rundle,
2002; Whitfield et al., 2012; Barros et al., 2014); nevertheless, all these models
suggest that richness and diversity decrease landwards achieving minimum values in
the 4-8 salinity zone because this salinity range represent a ecophysiological
constraint for biota (Elliot and Whitfield, 2011). However, the Ebro Estuary is a
stratified type estuary (Ibáñez et al., 1997) consequently, both marine and freshwater
do not mix; and hence, community variation within each stretch is due to secondary
factors that generate a similar impoverishment pattern. Within each estuarine stretch,
the secondary factors affecting richness and diversity were grain size, total organic
matter, and despite of seasonal variations chlorophyll concentration, which is
mediated by nutrient concentrations (see Ibáñez et al., 2012). In accordance with
those results, several species found close to the null point were typical of the
oligohaline area of temperate estuaries (Ysebaert et al., 1998; Nebra et al., 2011;
Whitfield et al., 2012); demonstrating in part their euryoecious character more than
their euryhaline nature.
Additionally to the natural environmental stress affecting estuarine macroinvertebrate
community, we identified one artificial factor directly affecting community ecology
of Ebro estuary; river flow regulation creates an artificial environmental stability in
the Ebro Estuary by maintaining stratification for long periods, and thus enhancing
functional and structural features of the salt wedge. Environmental stability increases
the ecotone perception, because in natural regime conditions the salt wedge can be
flushed out from the river channel breaking the estuarine stratification in several
occasions all over the year, especially during wet periods (Ibáñez, 1993). Under
natural instability conditions, riverine-marine boundary (gradient zone) could be
consequently wider in both time and space, probably making difficult the
establishment of stenobiontic taxa, and thus resulting in a community dominated by

CHAPTER II: Macrofaunal trends at a riverine-marine boundary s
107
better adapted euryoecious species (Elliot et al., 2007). In these conditions,
euryhaline taxa could extend their distribution ranges along the river channel
following the marine intrusion (natural diel advance or retreat). In this situation,
species nestedness increase and differentiate between the strictly fresh from the
marine community is also more difficult; moreover, ecotone characteristics (abrupt
salinity change and species turnover) may be obscured or even misidentified as an
ecocline (see Remane diagram redrawn by Atrill and Rundle, 2002). Regardless the
natural origin of Ebro riverine-marine interface, in the current context our results are
consistent with those previously reported by Attrill and Rundle (2002) and Acha et
al. (2015); they found that sharpest ecotones are because of anthropogenic activity,
and their ecological effects are intensified with the persistence of conditions over
time, not only over the physic environment but also over communities.
Macroinvertebrate community complexity in the Ebro Estuary increased in both
richness and diversity with the permanence of the salt wedge (i.e. stratification).
Although these findings are supported by those of Elliot and Whitfield (2011), since
as they suggested in an ecotone is expected a biodiversity increase due to the
transition area between two adjacent systems. Nevertheless, the same authors pointed
out that this pattern is not found in estuarine ecotones; therefore, we should consider
the Ebro Estuary as the first documented case of an estuarine ecotone with really
complex benthic communities e.g. macroinvertebrates and diatoms since, recently
performed studies in the Ebro Estuary reported 160 different species of diatoms
(Rovira et al., 2012b).
CONCLUSIONS
Trying to respond to introduction questions: what occurs in rivers emptying into non-
tidal seas? Should these river-mouths be considered special estuaries? Are stratified
estuaries colonized by different species? Which is the most suitable distribution
model for biota? Can this kind of riverine-marine boundary be considered an ecotone
or ecocline? Despite of the lack of tide influence and a gradual salinity gradient, the

A. Nebra, N. Caiola, C. Alcaraz, G. Muñoz-Camarillo & C. Ibáñez
108
Ebro river-mouth must be considered functional and ecologically as an estuary at
least in marine intrusion condition (Ibáñez, 1993). Both structural and functional
differences with well-mixed estuaries are obvious (e.g. stratification, ecotone,
community turnover); but the Ebro Estuary founds are consistent with the estuarine
paradigms proposed by Perillo, 1995 and Elliot and Whitfield (2011). For instance,
the Ebro Estuary shares important characteristics with north temperate mixed
estuaries; it is fundamentally colonized by typical taxa from temperate estuaries such
as the Abra alba-Lagis koreni species complex (Puente et al., 2008; Nebra et al.,
2011; Reizopoulou et al., 2013). Furthermore, Nereid polychaetes and
representatives of the genus Corophium, which are usually found inhabiting the
oligohaline area (the most osmotic stressful zone) of mixed estuaries, were recorded
just in the most stressful zone and less productive zone of the estuary, around the null
point or ecotonal region. According to the most common biodiversity models (e.g.
Remane, 1934; Attrill and Rundle, 2002; Telesh and Khlebovich, 2010) the Ebro
Estuary presented an impoverishment bias from mouth to landwards, identifying its
‘Artenminimum’ (i.e. the critical zone characterized by minimal species richness) in
the null point surrounding area. The relationship of Artenminimum and salinity is still
matter of controversy (see Conde et al., 2013 for detailed discussion). But according
to our results, an ecotonal region is compatible with the concept of Artenminimum,
supporting the assertion that organisms’ distribution within estuaries (i.e. diversity
patterns) is highly influenced more by variation than by absolute salinity regimes
(Wolff, 1973; Reizopoulou et al., 2013). Therefore, we stand up for a re-definition of
estuary concept with the aim of including all estuaries flowing into non-tidal seas,
similarly as done by Potter et al., 2010, to include hypersaline estuaries.
ACKNOWLEDGEMENTS
This research was supported by the Government of Catalonia (Catalan Water
Agency, ACA). CA held a postdoctoral fellowship from the Spanish National
Institute for Agricultural and Food Research and Technology (INIA). We are very

CHAPTER II: Macrofaunal trends at a riverine-marine boundary s
109
grateful to C. Buendía, Ll. Jornet, C. Macaigne, D. Mateu, M. San Lorenzo and R.
Valmaña for laboratory and field assistance. Many thanks to M. González-Porto for
helping us with Polychaeta identification and to C. Reverté for the bibliographic
search.
REFERENCES
Acha, E.M., Piola, A., Iribarne, O., Mianzan, H., 2015. Ecological Processes at
Marine Fronts: Oases in the ocean. Springer Briefs in Environmental Science
Ahel, M., Barlow, R.G., Mantoura, R.F.C., 1996. Effect of salinity gradients on the
distribution of phytoplankton pigments in a stratified estuary. Marine
Ecology Progress Series 143, 289-295.
Alcaraz, C., Caiola, N., Ibáñez, C., 2011. Bioaccumulation of pollutants in the zebra
mussel from hazardous industrial waste and evaluation of spatial distribution
using GAMs. Science of the Total Environment 409, 898-904.
Attrill, M.J., 2002. A testable linear model for diversity trends in estuaries. Journal of
Animal Ecology 71, 262-269.
Attrill, M.J., Rundle, S.D., 2002. Ecotone or ecocline: Ecological boundaries in
estuaries. Estuarine, Coastal and Shelf Science 55, 929-936.
Attrill, M.J., Thomas, R.M., 1996. Long-term distribution patterns of mobile
estuarine invertebrates (Ctenophora, Cnidaria, Crustacea: Decapoda) in
relation to hydrological parameters. Marine Ecology Progress Series 143, 25-
36.
Barros, F., Blanchet, H., Hammerstrom, K., Sauriau, P.-G., Oliver, J., 2014. A
framework for investigating general patterns of benthic β-diversity along
estuaries. Estuarine, Coastal and Shelf Science 149, 223-231.

A. Nebra, N. Caiola, C. Alcaraz, G. Muñoz-Camarillo & C. Ibáñez
110
Basset, A., Barbone, E., Elliott, M., Li, B.-L., Jorgensen, S.E., Lucena-Moya, P.,
Pardo, I., Mouillot, D., 2013. A unifying approach to understanding
transitional waters: fundamental properties emerging from ecotone
ecosystems. Estuarine, Coastal and Shelf Science 132, 5-16.
Burnham, K.P., Anderson, D.R., 1998. Model selection and inference. New York:
Springer-Verlag.
Cacchione, D.A., Drake, D.E., Losada, M.A., Medina, R., 1990. Bottom-boundary
layer measurements on the continental shelf off the Ebro River, Spain.
Marine Geology 95, 179-192.
Conde, A., Novais, J.M., Domínguez, J., 2013. Intertidal macrofauna and
environmental stress at a riverine-marine boundary. Marine Environmental
Research 92, 1-9.
Carol, J., Benejam, L., Alcaraz, C., Moreno-Amich, R., Pou, Q., Vila-Gispert, A.,
Zamora, L., Navarro, E., Armengol, J. & Garcıa-Berthou, E., 2006. The
effects of limnological features on fish assemblages of fourteen Spanish
reservoirs. Ecology of Freshwater Fish 15, 66-77.
Dauer, D.M., 1993. Biological criteria, environmental health and estuarine
macrobenthic community structure. Marine Pollution Bulletin 26, 249-257.
Dauvin, J.C., 2007. Paradox of estuarine quality: benthic indicators and indices,
consensus or debate for the future. Marine Pollution Bulletin 55, 271-281.
Day Jr, J.W., Kemp, W.M., Alejandro, Y., Crump, B.C., 2012. Estuarine ecology.
John Wiley and Sons, New York.
Dyer, K.R., 1997. Estuaries: a physical introduction. John Wiley and Sons, London.
Elliott, M., Burdon, D., Hemingway, K.L., Apitz, S.E., 2007. Estuarine, coastal and
marine ecosystem restoration: confusing management and science-a revision
of concepts. Estuarine, Coastal and Shelf Science 74, 349-366.
CHAPTER II: Macrofaunal trends at a riverine-marine boundary s
111
Elliott, M., McLusky, D.S., 2002. The need for definitions in understanding
estuaries. Estuarine, Coastal and Shelf Science 55, 815-827.
Elliott, M., Whitfield, A.K., 2011. Challenging paradigms in estuarine ecology and
management. Estuarine, Coastal and Shelf Science 94, 306-314.
Falcó, S., Niencheski, L.F., Rodilla, M., Romero, I., del Rio, J.G., Sierra, J.P.,
Mosso, C., 2010. Nutrient flux and budget in the Ebro estuary. Estuarine,
Coastal and Shelf Science 87, 92-102.
Giberto, D.A., Bremec, C.S., Cortelezzi, A., Capitulo, A.R., Brazeiro, A., 2007.
Ecological boundaries in estuaries: macrobenthic beta-diversity in the Rio de
la Plata system (34-36 degrees S). Journal of the Marine Biological
Association of the United Kingdom 87, 377-381.
Gosz, J.R., 1993. Ecotone hierarchies. Ecological Applications, 370-376.
Hansen, D.V., Rattray, M., 1966. New dimensions in estuary classification.
Limnology and Oceanography 11, 319-326.
Ibáñez, C., 1993. Dinamica hidrologica i funcionament ecologic del tram estuari del
Ebre. Tesi doctoral. Universitat de Barcelona. Barcelona.
Ibáñez, C., Alcaraz, C., Caiola, N., Rovira, A., Trobajo, R., Alonso, M., Duran, C.,
Jiménez, P.J., Munné, A., Prat, N., 2012. Regime shift from phytoplankton to
macrophyte dominance in a large river: top-down versus bottom-up effects.
Science of the Total Environment 416, 314-322.
Ibáñez, C., Pont, D., Prat, N., 1997. Characterization of the Ebre and Rhone
estuaries: A basis for defining and classifying salt-wedge estuaries.
Limnology and Oceanography 42, 89-101.
Ibáñez, C., Prat, N., Canicio, A., 1996. Changes in the hydrology and sediment
transport produced by large dams on the lower Ebro River and its estuary.
Regulated Rivers-Research and Management 12, 51-62.

A. Nebra, N. Caiola, C. Alcaraz, G. Muñoz-Camarillo & C. Ibáñez
112
Ibáñez, C., Rodrigues-Capitulo, A., Prat, N., 1995. The combined impacts of river
regulation and eutrophication on the dynamics of the salt wedge and the
ecology of the lower Ebro River (north-east Spain), in: Harper, D.F., A.
(Ed.), Ecological Basis for River Management. John Wiley and Sons,
Chichester, pp. 105-113.
Levin, L.A., Boesch, D.F., Covich, A., Dahm, C., Erséus, C., Ewel, K.C., Kneib,
R.T., Moldenke, A., Palmer, M.A., Snelgrove, P., 2001. The function of
marine critical transition zones and the importance of sediment biodiversity.
Ecosystems 4, 430-451.
Lewis, R., 1997. Dispersion in Estuaries and Coastal Waters. John Wiley and Sons
Ltd.
Lepš, J., Šmilauer, P. 2003. Multivariate analysis of ecological data using CANOCO.
Cambridge University Press, Cambridge.
Mannino, A., Montagna, P.A., 1997. Small-scale spatial variation of macrobenthic
community structure. Estuaries 20, 159-173.
McCune, B., 1997. Influence of noisy environmental data on canonical
correspondence analysis. Ecology 78, 2617-2623.
McLusky, D.S., 1999. Estuarine benthic ecology: A European perspective.
Australian Journal of Ecology 24, 302-311.
McLusky, D.S., Elliott, M., 2004. The estuarine ecosystem: ecology, threats and
management. Third edition. Oxford University Press, New York.
Nebra, A., Caiola, N., Ibanez, C., 2011. Community structure of benthic
macroinvertebrates inhabiting a highly stratified Mediterranean estuary.
Scientia Marina 75, 577-584.
Nebra, A., Caiola, N., Muñoz-Camarillo, G., Rodríguez-Climent, S., Ibáñez, C.,
2014. Towards a suitable ecological status assessment of highly stratified
mediterranean estuaries: A comparison of benthic invertebrate fauna indices.

CHAPTER II: Macrofaunal trends at a riverine-marine boundary s
113
Ecological Indicators 46, 177-187.
Potter, I.C., Chuwen, B.M., Hoeksema, S.D., Elliott, M., 2010. The concept of an
estuary: a definition that incorporates systems which can become closed to
the ocean and hypersaline. Estuarine, Coastal and Shelf Science 87, 497-500.
Puente A, Juanes JA, Garcia A, Alvarez C, Revilla JA, Carranza I (2008) Ecological
assessment of soft bottom benthic communities in northern Spanish
estuaries. Ecological Indicators 8:373-388
Remane, A., 1934. Die brackwasserfauna. Verhandlungen der Deutschen
Zoologischen Gesellschaft 36, 34-74.
Reizopoulou S, Simboura N, Barbone E, Aleffi F, Basset A, Nicolaidou A (2013)
Biodiversity in transitional waters: steeper ecotone, lower diversity. Marine
Ecology 35:78-84
Rosenberg, R., Blomqvist, M., Nilsson, H.C., Cederwall, H., Dimming, A., 2004.
Marine quality assessment by use of benthic species-abundance distributions:
a proposed new protocol within the European Union Water Framework
Directive. Marine Pollution Bulletin 49, 728-739.
Rovira, A., Alcaraz, C., Ibañez, C. 2012a. Spatial and temporal dynamics of
suspended load at-a-cross-section: the lowermost Ebro River (Catalonia,
Spain). Water Research 46, 3671-3681.
Rovira, L., Trobajo, R., Leira, M., Ibáñez, C. 2012b. The effects of hydrological
dynamics on benthic diatom community structure in a highly stratified
estuary: the case of the Ebro Estuary (Catalonia, Spain). Estuarine, Coastal
and Shelf Science 101:1-14
Rundle, S.D., Attrill, M.J., Arshad, A., 1998. Seasonality in macroinvertebrate
community composition across a neglected ecological boundary, the
freshwater-estuarine transition zone. Aquatic Ecology 32, 211-216.
A. Nebra, N. Caiola, C. Alcaraz, G. Muñoz-Camarillo & C. Ibáñez
114
Sierra, J.P., Sanchez-Arcilla, A., Figueras, P.A., Del Rio, J.G., Rassmussen, E.K.,
Mosso, C., 2004. Effects of discharge reductions on salt wedge dynamics of
the Ebro River. River Research and Applications 20, 61-77.
Strayer, D.L., Power, M.E., Fagan, W.F., Pickett, S.T.A., Belnap, J., 2003. A
classification of ecological boundaries. BioScience 53, 723-729.
Tagliapietra, D., Sigovini, M., Ghirardini, A.V., 2009. A review of terms and
definitions to categorise estuaries, lagoons and associated environments.
Marine and Freshwater Research 60, 497-509.
Telesh, I., Schubert, H., Skarlato, S., 2013. Life in the salinity gradient: Discovering
mechanisms behind a new biodiversity pattern. Estuarine, Coastal and Shelf
Science 135, 317-327.
Telesh, I.V., Khlebovich, V.V., 2010. Principal processes within the estuarine
salinity gradient: a review. Marine Pollution Bulletin 61, 149-155.
Ulrich, W., Almeida-Neto, M., 2012. On the meanings of nestedness: back to the
basics. Ecography 35, 865-871.
Whitfield, A.K., Elliott, M., Basset, A., Blaber, S.J.M., West, R.J., 2012. Paradigms
in estuarine ecology-a review of the Remane diagram with a suggested
revised model for estuaries. Estuarine, Coastal and Shelf Science 97, 78-90.
Wolff W.J., 1973. The estuary as a habitat: an analysis of data on the soft-bottom
macrofauna of the estuarine area of the rivers Rhine, Meuse and Scheldt.
Zoologische Verhandelingen Leiden
Ysebaert, T., Meire, P., Coosen, J., Essink, K., 1998. Zonation of intertidal
macrobenthos in the estuaries of Schelde and Ems. Aquatic Ecology 32, 53-
71.

CHAPTER II: Macrofaunal trends at a riverine-marine boundary s
115
AP
PE
ND
IX 1
. W
ater
phy
sic-
chem
ical
par
amet
ers
(ann
ual
mea
n an
d st
anda
rd d
evia
tion)
and
sed
imen
t ch
arac
teri
stic
s of
the
9 s
ampl
ing
stat
ions
. C
ond.
, co
nduc
tivity
; T
DS
, to
tal
diss
olve
d sa
lts;
DO
, di
ssol
ved
oxyg
en;
TSS
, to
tal
susp
ende
d so
lids;
OS
S, o
rgan
ic s
uspe
nded
sol
ids
TO
M, t
otal
org
anic
mat
ter
in s
edim
ent. U
pper
Est
uar
y st
retc
h
L
ower
Est
uary
str
etch
U
E1
UE
2 U
E3
UE
4
LE
5 L
E6
LE
7 L
E8
LE
9 M
outh
dis
tanc
e (k
m)
37.0
0 34
.00
30.0
0 25
.00
18.0
0 12
.00
6.00
3.
00
0.00
Sa
lin
ity
(g l-1
) 0.
65 ±
0.1
3 0.
64 ±
0.1
3 0.
64 ±
0.1
3 0.
65 ±
0.1
3 26
.98
± 17
.58
34.7
9 ±
2.66
35
.34
± 2.
00
35.5
7 ±
2.20
28
.40
± 16
.35
Con
d.(m
S cm
-1)
1.11
± 0
.19
1.11
± 0
.19
1.11
± 0
.18
1.13
± 0
.18
36.6
2 ±
24.1
45
.69
± 6.
09
46.4
9 ±
5.97
46
.79
± 6
38.1
4 ±
21.8
5T
DS
(g l-1
) 0.
84 ±
0.1
6 0.
84 ±
0.1
6 0.
83 ±
0.1
6 0.
85 ±
0.1
7 26
.56
± 17
.18
34.2
8 ±
2.36
34
.77
± 1.
77
34.9
7 ±
1.95
28
.03
± 15
.64
DO
(m
g l-1
) 9.
43 ±
2.9
2 8.
90 ±
2.9
2 9.
18 ±
3.0
6 9.
99 ±
3.2
3 6.
21 ±
3.5
9 6.
36 ±
3.3
6 6.
82 ±
2.4
2 7.
55 ±
2.2
0 8.
41 ±
1.5
6 D
O (
%)
98.6
8 ±
21.5
0 93
.18
± 19
.77
96.6
3 ±
21.5
0 10
5.10
± 2
0.85
73
.50
± 34
.82
80.9
0 ±
37.5
3 88
.10
± 26
.72
98.4
8 ±
25.8
5 10
5.45
± 1
7.76
Tem
pera
ture
(ºC
) 18
.33
± 6.
10
18.5
5 ±
6.12
18
.78
± 6.
03
18.8
4 ±
6.06
18
.68
± 4.
97
17.9
4 ±
4.39
18
.10
± 4.
76
18.1
4 ±
4.74
18
.33
± 4.
41
pH
8.03
± 0
.20
8.07
± 0
.16
8.11
± 0
.15
8.14
± 0
.18
7.91
± 0
.08
7.99
± 0
.24
8.01
± 0
.24
8.05
± 0
.21
8.10
± 0
.22
PO
4 (m
g l-1
) 0.
02 ±
0.0
1 0.
03 ±
0.0
1 0.
03 ±
0.0
0 0.
02 ±
0.0
1 0.
03 ±
0.0
1 0.
01 ±
0.0
1 0.
01 ±
0.0
1 0.
01 ±
0.0
2 0.
01 ±
0.0
2 P
T (
mg
l-1)
0.05
± 0
.01
0.06
± 0
.01
0.05
± 0
.01
0.05
± 0
.01
0.06
± 0
.03
0.04
± 0
.02
0.04
± 0
.02
0.03
± 0
.01
0.03
± 0
.02
NH
4 (m
g l-1
) 0.
04 ±
0.0
5 0.
05 ±
0.0
6 0.
06 ±
0.0
3 0.
13 ±
0.1
8 0.
30 ±
0.3
0 0.
06 ±
0.0
2 0.
03 ±
0.0
1 0.
03 ±
0.0
1 0.
06 ±
0.0
7 N
O2
(mg
l-1)
0.02
± 0
.01
0.02
± 0
.01
0.02
± 0
.01
0.02
± 0
.02
0.02
± 0
.02
0.02
± 0
.03
0.01
± 0
.02
0.01
± 0
.01
0.01
± 0
.02
NO
3 (m
g l-1
) 3.
07 ±
1.1
9 2.
94 ±
1.2
6 3.
01 ±
1.3
2 2.
89 ±
1.2
0 1.
08 ±
1.9
8 0.
87 ±
1.6
3 0.
85 ±
1.6
0.
49 ±
0.8
8 1.
01 ±
1.9
3 N
T (
mg
l-1)
3.40
± 1
.36
3.43
± 1
.41
3.45
± 1
.39
3.47
± 1
.41
1.53
± 2
.57
1.38
± 2
.37
1.17
± 1
.93
0.78
± 1
.20
1.36
± 2
.44
SiO
4 (m
g l-1
) 1.
26 ±
0.3
9 1.
15 ±
0.5
2 1.
20 ±
0.5
5 1.
35 ±
0.4
0 1.
03 ±
0.4
8 0.
64 ±
0.6
4 0.
39 ±
0.5
5 0.
40 ±
0.3
8 0.
46 ±
0.5
5 C
hlor
oph
yll (
µg
l-1)
2.65
± 3
.08
0.75
± 0
.47
0.87
± 0
.70
0.88
± 0
.72
0.91
± 0
.52
0.87
± 0
.95
1.56
± 1
.51
1.94
± 1
.45
1.37
± 1
.04
Phe
oph
ytin
(µ
g l-1
) 2.
43 ±
3.0
2 0.
99 ±
0.8
6 1.
01 ±
0.8
5 1.
12 ±
1.1
3 1.
18 ±
0.7
3 0.
78 ±
0.4
7 0.
77 ±
0.5
6 0.
61 ±
0.4
3 0.
69 ±
0.3
2 V
eloc
ity
(m s
-1 )
0.
17 ±
0.1
4 0.
30 ±
0.1
7 0.
18 ±
0.0
9 0.
22 ±
0.1
6 0.
11 ±
0.1
9 0.
07 ±
0.1
1 0.
06 ±
0.0
1 0.
08 ±
0.0
5 0.
25 ±
0.1
9 T
rans
pare
ncy
(m)
2.79
± 0
.89
2.50
± 0
.42
2.21
± 0
.55
1.78
± 0
.21
1.93
± 0
.33
2.04
± 0
.28
1.8
± 0.
26
1.76
± 0
.35
2.15
± 0
.49
TSS
(m
g l-1
) 9.
21 ±
14.
52
2.83
± 2
.25
4.85
± 2
.62
7.32
± 4
.07
14.4
3 ±
9.34
13
.06
± 10
.69
12.5
2 ±
10.6
1 13
.35
± 12
.87
32.0
6 ±
30.5
3O
SS (
mg
l-1)
2.41
± 2
.75
1.40
± 0
.85
1.59
± 0
.33
2.20
± 0
.75
3.43
± 2
.30
2.92
± 2
.18
2.61
± 1
.91
2.76
± 2
.35
4.21
± 2
.29
OSS
(%
) 48
.05
± 22
.93
59.6
6 ±
26.7
1 37
.27
± 13
.08
33.8
3 ±
13.7
2 25
.87
± 6.
56
27.2
± 9
.76
23.9
4 ±
5.1
23.3
9 ±
4.13
19
.62
± 9.
70
Mud
(%
) 12
.36
± 6.
46
0.18
± 0
.11
31.5
6 ±
24.4
8 1.
13 ±
0.8
8 1.
91 ±
1.2
0 13
.22
± 6.
04
16.6
9 ±
10.3
4 15
.27
± 0.
54
32.3
6 ±
21.2
5Sa
nd (
%)
86.6
9 ±
6.56
43
.66
± 16
.41
66.5
3 ±
24.6
9 96
.55
± 2.
70
97.8
6 ±
1.11
84
.33
± 4.
24
82.4
7 ±
9.99
69
.41
± 12
.75
65.1
3 ±
19.9
3G
rave
l (%
) 0.
95 ±
0.1
1 56
.16
± 16
.31
1.91
± 0
.21
2.33
± 1
.82
0.23
± 0
.08
2.45
± 1
.80
0.85
± 0
.35
15.3
3 ±
12.2
1 2.
51 ±
1.9
1 T
OM
(%
) 3.
37 ±
0.7
6 1.
30 ±
0.2
8 3.
55 ±
0.2
4 2.
47 ±
1.4
3 2.
09 ±
0.2
4 4.
86 ±
0.5
4 3.
64 ±
1.3
0 5.
07 ±
1.7
9 4.
47 ±
1.0
4

117
CHAPTER III
Towards a suitable ecological status assessment of
highly stratified Mediterranean estuaries: A
comparison of benthic invertebrate fauna indices
Nebra A, Caiola N, Muñoz-Camarillo G, Rodríguez-Climent S and
Ibáñez C
Ecological Indicators (2014) 46:177-187

CHAPTER III: Ecological assessment of highly stratified estuaries
119
Towards a suitable ecological status assessment of highly
stratified Mediterranean estuaries: A comparison of benthic
invertebrate fauna indices
Alfonso Nebra, Nuno Caiola, Gloria Muñoz-Camarillo, Silvia Rodríguez-Climent,
Carles Ibáñez
IRTA - Aquatic Ecosystems. Ctra. Poble Nou km 5.5, E-43540, Sant Carles de la
Ràpita, Spain
ABSTRACT
Biotic indices developed to assess the ecological status of coastal waters according to
the European Water Framework Directive (WFD) often show discrepancies when
they are applied in transitional environments. Although several indices have been
widely used in transitional waters throughout Europe, there is still a lack of
knowledge about their suitability assessing ecological status. We evaluated the
performance of most common used biotic indices and community parameters (e.g.
Multivariate AZTI's Marine Biotic Index (M-AMBI), BENTIX, Benthic
Opportunistic Polychaetes Amphipods index (BOPA), diversity indices, species
richness, abundance) that have been proposed in the scope of WFD, using data of
macroinvertebrate community coming from a special case of transitional water body,
the highly stratified Ebro estuary. Additionally, we tested their ability to respond to
the main pressures affecting the Ebro estuary, the hydrological alteration due to
regulation and the pollution pressure due to nutrient enrichment. Estimation of
Corresponding author. Tel.: +34 605 449 464; fax: +34 934 674 042. E-mail address:
[email protected] (A. Nebra).
A. Nebra, N. Caiola, G. Muñoz-Camarillo, S. Rodríguez-Climent & C. Ibáñez
120
hydrological alteration was based on flow historical data (period from 1913 to 1963),
that we assumed as 'hydrological reference conditions' for Ebro estuary. Pollution
pressure was estimated by means of PCA analysis including organic and nutrient
enrichment related variables, expressed as a synthetic index by PCA factor scores
extraction. All the community parameters were able to detect changes in macrofauna
composition along the estuarine gradients and were able to differentiate between the
impoverished stations and the healthier ones. Regarding indices, the ratings were
contradictory and only M-AMBI classified the stations in the correct way. Strong
significant correlations were found between indices and metrics and the calculated
pressures; nevertheless, these correlations showed a paradoxical result, since
increasing hydrological alteration benefited the macrofauna, achieving great
complexity. Other identified limitations of biotic indices were the opposite
classifications, overestimation of ecological status and low resolution ability. We
conclude that for transitional water ecosystems, where each water body has particular
characteristics, is difficult the use of 'common biological' assessment tools as the
results of this study, among others (more details in discussion section), have
demonstrated. Nevertheless, M-AMBI seemed to work in the correct way, so further
investigation about its use for transitional waters is necessary. The development of
new strategies such as the use of historical data, the use of metrics as a complement
for the assessment could be a reliable alternative.
Keywords: Ecological status, stratified estuary, hydrological alteration, transitional
waters, biotic indices, benthic indicators, Water Framework Directive.
INTRODUCTION
Estuaries are interface systems between rivers and sea, characterized by unstable
hydrological, morphological and chemical conditions, resulting in stressful habitats
where biological communities are structured along strong environmental gradients
CHAPTER III: Ecological assessment of highly stratified estuaries
121
(Day et al., 1989; Dauvin, 2007). Nevertheless, these complex ecosystems are largely
recognized by their high productivity and their importance, from both economic and
conservation perspectives (Ysebaert et al., 1998; Edgar et al., 1999; McLusky, 1999;
Pierson et al., 2002; Russell et al., 2006).
The rapid human population growth during the last century has increased the
pressures over these areas threatening their ecological integrity, their economic value
and even affecting public health (Schlacher and Wooldridge, 1996; Edgar et al.,
1999; McLusky, 1999; Dauer et al., 2000; Dauvin, 2007; Elliott and Quintino, 2007;
Gray and Elliott, 2009). The main anthropogenic pressures affecting estuaries are
industrial wastewater, urban sewage effluents, agriculture and farmland runoff, fish
farming and harbors (Justic et al., 1995; McLusky and Elliott, 2004; Zaldívar et al.,
2008; Gray and Elliott, 2009). These activities cause an excess of nutrients in Water
Bodies (WBs), increase the organic matter loads and even promote the accumulation
of dangerous pollutants in the sediment such as heavy metals, toxic compounds and
hydrocarbon substances (Boynton et al., 1995; Day et al., 1997; Cantillo, 1998;
Nedwell et al., 1999; Navarro-Ortega et al., 2010). High nutrient loads produce
direct ecological impacts over biological communities (Karlson et al., 2002), mostly
associated with eutrophication processes (Bock et al., 1999; Wang et al., 1999;
Hänninen et al., 2000). Besides, organic enrichment causes episodes of hypoxia and
low redox potential values. These facts disturb composition, trophic structure and
biomass of the biological communities (Pearson and Rosenberg, 1978; Grebmeier et
al., 1988; Díaz, 2001).
In Mediterranean aquatic ecosystems, the impacts produced by these pressures are
magnified by the strong seasonal and interannual hydrological variability (Caiola et
al., 2001a; Ferreira et al., 2007a, b). Moreover, human responses to this hydrological
fluctuation involve flow regulation measures, such as reservoirs, that frequently
disrupt aquatic ecosystems, producing accentuated environmental changes (Caiola et
al., 2001b).
A. Nebra, N. Caiola, G. Muñoz-Camarillo, S. Rodríguez-Climent & C. Ibáñez
122
The European Union reacted to the severe ecological decline of aquatic ecosystems
by proclaiming Water Framework Directive (WFD) in 2000 (European Parliament,
2000). The WFD provides a basis for the conservation, protection and improvement
the ecological integrity of all WBs, including groundwater, inland surface water,
coastal and transitional waters. According to the WFD the estuaries are classified as
Transitional Waters (TWs); defining them as: bodies of surface water in the vicinity
of river mouths which are partly saline in character as a result of their proximity to
coastal waters but which are substantially influenced by freshwater flows.
Ecological quality assessment of a water body must be based on the status of
different biological quality elements (e.g. benthic invertebrate fauna or aquatic flora)
and endorsed by hydro- morphological and physicochemical quality elements. The
status of these elements is determined by the deviation they exhibit from the type-
specific reference conditions, at undisturbed or nearly undisturbed situations (WFD,
2000/60/EC -Annex V). Benthic invertebrates have been identified as key biological
element for Ecological Status (ES) assessment of TWs; they play important roles in
the ecology of aquatic ecosystems and respond to anthropogenic stress (Pearson and
Rosenberg, 1978; Dauer, 1993; Grall and Glemarec, 1997 Dauer et al., 2000;
Simboura and Zenetos, 2002; Bustos-Baez and Frid, 2003; Perus et al., 2007).
Nevertheless, within estuarine ecosystems it is difficult to establish a stressor-
response relationship using Biotic Indices (BIs) since they are naturally stressed
ecosystems; this difficulty was coined as the term ‘Estuarine Quality Paradox’
(Dauvin, 2007; Elliott and Quintino, 2007).
Moreover, in highly stratified estuaries, like the study case, obtaining such a response
is even more difficult because both natural and anthropic hydrological variations
(spatial and temporal) produce rapid and abrupt changes in biological communities
(Nebra et al., 2011). Therefore, establishing reference conditions for these systems
(the basis for the development of BI according to the WFD criteria) is a challenging
task.

CHAPTER III: Ecological assessment of highly stratified estuaries
123
Since the apparition of the WFD in the year 2000, some BIs based on soft-bottom
benthic invertebrate communities such as the AZTI's Marine Biotic Index (AMBI)
(Borja et al., 2000), the multivariate AMBI (M-AMBI) (Borja et al., 2004; Muxika et
al., 2007), BENTIX (Simboura and Zenetos, 2002) and Benthic Opportunistic
Polychaetes Amphipods index (BOPA) (Dauvin and Ruellet, 2007) have proved to
be very useful tools in assessing the ES of coastal and TWs, especially regarding
nutrient and organic enrichment. However, the estuarine systems where these indices
were developed correspond to ‘well-mixed’ type, which are systems with different
ecological dynamics compared with ‘highly stratified’ estuaries like the Ebro estuary.
The present study analyzes the performance of M-AMBI, BENTIX and BOPA
indices developed under the scope of the WFD, to the main anthropic pressures on
the Ebro estuary, a highly stratified Mediterranean estuary. It is expected that results
obtained could assist on the development of a suitable ES assessment approach for
salt wedge estuaries.
METHODS
2.1 Study site
The Ebro estuary (Fig. 1) is a highly stratified or salt-wedge estuary located at the
NE of the Iberian Peninsula (40º43’10’’N, 0º40’30’’E). The microtidal regime of the
Mediterranean Sea about 20 cm (Cacchione et al., 1990), promotes the formation of a
salt wedge whose dynamics (advance, retreat and permanence) is controlled by the
river discharge. Continuous river flow values exceeding 350-400 m3 s-1 pushes the
salt wedge from the river channel and the estuary becomes a river. Conversely, when
the river discharge is lower than 100 m3 s-1, the salt wedge reaches its maximum
distance upstream 30-32 km from the river mouth (Ibáñez et al., 1997); intermediate
flows together with the bathymetry of river-bed placed the salt wedge in different
positions (Ibáñez et al., 1996). The main land use in the basin (85,362 km2) is
agriculture with more than 10,000 km2 of irrigation, corresponding to approximately

A. Nebra, N. Caiola, G. Muñoz-Camarillo, S. Rodríguez-Climent & C. Ibáñez
124
90% of the water usage in the basin (Ibáñez et al., 2008). The main human impacts in
the lower Ebro river and therefore its estuary are the strong flow regulation in the
whole basin by nearly 190 dams (Batalla et al., 2004) and the nutrient enrichment of
river water due to the input of agricultural and urban sewage effluents (Sierra et al.,
2002; Terrado et al., 2006; Falcó et al., 2010). Nevertheless, during the last 15 years,
an improvement of urban sewage treatment together with the restriction in the use of
phosphate-based compounds dimmed the eutrophication process (Ibáñez et al., 2008,
2012a, b).
2.2 Sampling design and laboratory procedures
In order to cover the whole study area nine sampling stations were established from
the river mouth to 37 km upstream. This stretch included the estuarine freshwater
reach potentially accessible by salt wedge (Fig. 1). Each station was sampled
seasonally (July and October 2007; January and April 2008) for benthic
macroinvertebrates, in each sampling occasion three sediment samples were
collected using a Ponar grab (0.046 m2), sediment grain size and total organic matter
(TOM), dissolved oxygen (DO), chlorophyll a, pheophytin, total suspended solids
(TSS), organic suspended solids (OSS), nutrient loadings: phosphate (PO4), total
phosphorous (PT), ammonia (NH4), nitrite (NO2), nitrate (NO3), total nitrogen (NT)
and hydromorphological char- acteristics (depth, flow velocity and water
transparency) (see Nebra et al., 2011 for detailed sampling and analysis procedures).

CHAPTER III: Ecological assessment of highly stratified estuaries
125
Figure 1. Map of the Ebro River basin and its delta showing the studied estuary with the
position of the nine sampling stations. UE, upper estuary stations; LE, lower estuary stations;
SW, null point position.
2.3 Biotic indices computation
The benthic macroinvertebrates of the Ebro estuary were structured in two
contrasting communities associated with the upper estuary (UE) and lower estuary
(LE) stretches, fresh and saltwater respectively; regardless of the sampling season
due to maintained flows throughout the year (Nebra et al., 2011). Therefore, the
sensitivity of the BIs and metrics to human disturbance was analyzed separately,
using specific BIs and metrics for these two stretches. For the UE, the applied BI was
the Iberian Biological Monitoring Working Party (IBMWP) (Alba- Tercedor et al.,
2002) adapted for WFD requirements by Catalan Water Agency (ACA, 2006) see
A. Nebra, N. Caiola, G. Muñoz-Camarillo, S. Rodríguez-Climent & C. Ibáñez
126
Table 1 for ES Boundaries and further information. Some commonly used freshwater
macro- invertebrate metrics were also computed; these were: the percentages of
functional feeding groups (grazers, deposit feeders, parasites, predators and
suspension feeders) and the number and ratios (total and relative) of invertebrate
orders comprising sensitive taxa (Ephemeroptera, Plecoptera, Trichoptera,
Coleoptera, Bivalvia and Odonata). Regarding LE stations M-AMBI, BENTIX and
BOPA were applied (Table 1); the computation of the three marine indices (M-
AMBI, BENTIX and BOPA) is based on the frequencies of functional or ecological
groups that are considered as metrics. In these cases, besides the BI score, the
metrics' individual scores were also analyzed. The descriptions, codes and
predictable response to human pressures of the computed indices and metrics are
summarized in Tables 3, 4 and 5. Moreover, the number of taxonomic ranks (families
and genera), Shannon-Wiener diversity, Margalef diversity, Simpson dominance and
Pielou's evenness indices as well as community structure and abundance descriptors
(total abundance, density and taxa richness) were calculated.
2.4 Hydrological alteration
Prior to river regulation in the early sixties, big floods were common in the lower
Ebro (Ibáñez et al., 1996); the suppression of such floods together with minimum
flow conditions in summer and autumn led to an altered salt wedge dynamics in the
Ebro estuary. For this reason an estimation of hydrological alteration was made with
the aim of quantifying the effect over the biological communities. The Hydrological
Pressure for the Ebro estuary was expressed as the deviation of the salt wedge
dynamics from the ‘expected natural dynamics’ that it would correspond to each
sampling occasion. For this, the dynamics of the salt wedge (position, probability of
occurrence and permanence time in days) was calculated for each sampling station
and occasion as a function of the daily average river flows. The position was
estimated following Ibáñez et al. (1996), permanence time in days was estimated by
counting the accumulated days before each sampling occasion with mean flow values

CHAPTER III: Ecological assessment of highly stratified estuaries
127
lower than 350 m3 s-1 according to Ibáñez (1993), data available at Ebro Basin
Authority web site (station 9027: Tortosa). Then, the dynamics of salt wedge
(position, presence probability and permanence in days) was computed for each
month and each sampling station during the period from 1913 to 1963 using Ebro
Water Authority daily average flow values at Tortosa station. This time series
represents the natural flow period, i.e. period before the construction of the two dams
responsible for the lower Ebro regulation. The Hydrological Pressure was finally
expressed as the absolute value of the deviation of the salt wedge presence
(expressed as probability and time) from the monthly average probability and
number of days of the salt wedge during natural flows period.
Table 1. Biotic indices value ranges and ES boundaries used in this paper to estimate the
sampling stations ES categories.
Biotic index Index value ES Index requirements
IBMWP 100 < IBMWP High PRIP: Decrease TR: Family MSP: D-frame net 500 µm, qualitative. FA : Freshwater
61 ≤ IBMWP < 100 Good
35 ≤ IBMWP < 61 Moderate
15 ≤ IBMWP < 35 Poor
0 < IBMWP <15 Bad
M-AMBI 0.77 < M-AMBI ≤ 1.00 High PRIP: Decrease TR: Usually genus or species level MSP: Grab, replicates, > 1mm, quantitative. FA : Coastal and transitional waters
0.53 < M-AMBI ≤ 0.77 Good
0.39 < M-AMBI ≤ 0.53 Moderate
0.20 < M-AMBI ≤ 0.39 Poor
0.00 < M-AMBI ≤ 0.20 Bad
BENTIX 4.5 ≤ BENTIX < 6.0 High PRIP: Decrease TR: Usually genus or species level MSP: Grab, replicates, > 1mm, quantitative FA : Coastal and transitional waters
3.5 ≤ BENTIX < 4.5 Good
2.5 ≤ BENTIX < 3.5 Moderate
2.0 ≤ BENTIX < 2.5 Poor
0.0 ≤ BENTIX < 2.0 Bad
BOPA 0.00000 ≤ BOPA ≤ 0.04576 High PRIP: Increase TR: Genus and species level. MSP: Grab, replicates, > 1mm, quantitative FA : Coastal and transitional waters
0.04576 < BOPA ≤ 0.13966 Good
0.13966 < BOPA ≤ 0.19382 Moderate
0.19382 < BOPA ≤ 0.26761 Poor
0.26761 < BOPA ≤ 0.30103 Bad

A. Nebra, N. Caiola, G. Muñoz-Camarillo, S. Rodríguez-Climent & C. Ibáñez
128
2.5 Data analysis
Principal Component Analysis (PCA) was performed separately for each estuarine
stretch (UE and LE) with the organic pollution related variables (DO, nutrients,
chlorophyll a, pheophytin and organic matter in sediment and in suspension). Kaiser-
Meyer-Olkin (KMO) measure of sampling adequacy was used to assess the
usefulness of a PCA. KMO ranges from 0 to 1 and should be > 0.5 if variables are
sufficiently interdependent for PCA to be useful (Tabachnick and Fidell, 2001). Once
obtained the final PCAs, the two first factors of each PCA were merged by summing
(inverting the values if their trends were opposed) as a combined index of Pollution
Pressure. One way ANOVA followed by Post-hoc (LSD) test were carried out
among stations for testing environmental parameters differences. To test the response
of the BIs and metrics to the anthropogenic disturbance gradient, a correlation
analysis was carried out with the Pollution Pressure index and with Hydrological
Pressure index (probability and time). The measured variables were log or square
root transformed (for absolute values and percentages, respectively) because
homoscedasticity and linearity were clearly improved. Statistical analyses were per-
formed using STATISTICA 8 software.
RESULTS
3.1 Benthic environmental condition
During the study period daily mean river discharge was always below 350 m3 s-1
allowing the penetration of the salt wedge. This fact divided the estuary in two
different stretches ‘upper and lower estuary’ (UE and LE); the UE (stations UE1-
UE4) had freshwater (0.65 g l-1 ± 0.005) (Table 2); whereas the LE five stations
(LE5- LE9) had marine water ranging from (26.98 g l-1 ± 17.58) to (35.57 g l-1 ±
2.20), ANOVA revealed no significant differences for salinity within each stretch.
LE stations permanence time of salt wedge was different for each sampling occasion
52, 140, 254 and 341 days for summer, autumn, winter and spring, respectively. The

CHAPTER III: Ecological assessment of highly stratified estuaries
129
null point or salt wedge's tip was always located at the same position, between UE4-
LE5 stations (25-18 Km from river mouth). Regarding nutrient concentrations, in
general terms were higher in river water than in sea water (Table 2); especially for
phosphates, nitrates, total nitrogen and silicate. Regarding LE stretch, LE5 showed
the highest nutrient values such as PO4 (0.03 mg l-1 ± 0.01), PT (0.06 mg l-1 ± 0.03)
and NH4 whose concentration value was five times greater than values reported for
other stations (0.30 mg l-1 ± 0.30). Regarding LE stations, ANOVA (P < 0.05)
revealed significant differences among LE5 and the rest of stations for PO4 (post-hoc
test, P < 0.0307 to 0.0438), PT (post-hoc test, P < 0.0297 to 0.0448) and NH4 (post-
hoc test, P < 0.0099 to 0.0229). The other nutrients showed an increase tendency
from LE9 to LE5, from river mouth to null point. DO values were higher in UE
stretch ranging from (8.90 ± 2.92) to (9.99 ± 3.23); whereas in LE stations oxygen
concentrations decreased upstream, the lowest values were recorded at stations close
to the null point (Table 2). Chlorophyll a concentrations were slightly higher in LE
stations but without significant differences between UE and LE stations
(0.25 µg l-1 ± 0.10 to 0.47 µg l-1 ± 0.07, respectively). Pheophytin levels in the UE
stations were close to 1.00 µg l-1; except for the station UE1 in which the pheophytin
largely exceeded the 2.00 µg l-1. The LE stations presented pheophytin levels ranging
from 0.61 µg l-1 ± 0.43 to 1.18µg l-1 ± 0.73. The percentage of organic matter in
sediment was slightly higher in LE stations ranging from (2.09 ± 0.24) to (4.86 ±
0.54); ANOVA (P < 0.05) revealed significant differences in TOM content, among
stations UE1-UE2 (post-hoc test, P < 0.0041), UE2-UE3 (post-hoc test, P < 0.0024)
and LE5 and the rest of stations (except LE7) (post-hoc test, P < 0.0019 to 0.0089).
The first two axes of the PCA for the UE explained 87.17% (62.00% and 25.17%,
respectively) of the total variation. KMO (0.561) indicated the usefulness of the
PCA; NO2, NO3 and NH4 were positively correlated with the first PCA axis. In
contrast, TOM, OSS were positively correlated with second axis. The first and
second axis of PCA for the LE explained 53.4% and 23.89% respectively of the total
variation. KMO (0.692) indicated the usefulness of the PCA; NO2, NO3 and PO4

A. Nebra, N. Caiola, G. Muñoz-Camarillo, S. Rodríguez-Climent & C. Ibáñez
130
were positively correlated with the first PCA axis; the second axis was mainly related
with NH4 and OSS.
3.2 Macroinvertebrate abundance, taxa richness and diversity
A total of 21,805 individuals were collected belonging to 214 different taxa; for more
detailed community results see Nebra et al. (2011). Higher densities were found at
LE stretch (Fig. 2), especially at those stations near river mouth. LE9 station showed
an annual mean of 11,650 ind m-2. Intermediate density values were found in upper
estuary stations due to the contribution of Tubificidae and the non-indigenous taxon
Corbicula fluminea. The lowest densities corresponded to stations UE3, UE4, LE5
and LE6 located around null point. This pattern was similar in taxa richness terms
(Fig. 2); station LE9 showed the highest richness values around 50 different taxa of
annual mean. Stations located near river mouth LE8 and LE7 reached high values of
richness too; whereas stations UE3, UE4 and LE5 showed the lowest values.
Regarding diversity indices, all of them showed higher values in LE stations (Fig. 2)
with a decreasing tendency towards null point.

CHAPTER III: Ecological assessment of highly stratified estuaries
131
Upp
er E
stua
ry s
tret
ch
L
ower
Est
uary
str
etch
U
E1
UE
2 U
E3
UE
4
LE
5 L
E6
LE
7 L
E8
LE
9 M
outh
dis
tanc
e (k
m)
37.0
0 34
.00
30.0
0 25
.00
18.0
0 12
.00
6.00
3.
00
0.00
Sa
linit
y 0.
65 ±
0.1
3 0.
64 ±
0.1
3 0.
64 ±
0.1
3 0.
65 ±
0.1
3 26
.98
± 17
.58
34.7
9 ±
2.66
35
.34
± 2.
00
35.5
7 ±
2.20
28
.40
± 16
.35
DO
(mg
l-1)
9.43
± 2
.92
8.90
± 2
.92
9.18
± 3
.06
9.99
± 3
.23
6.21
± 3
.59
6.36
± 3
.36
6.82
± 2
.42
7.55
± 2
.20
8.41
± 1
.56
DO
(%)
98.6
8 ±
21.5
0 93
.18
± 19
.77
96.6
3 ±
21.5
0 10
5.10
± 2
0.85
73.5
0 ±
34.8
2 80
.90
± 37
.53
88.1
0 ±
26.7
2 98
.48
± 25
.85
105.
45 ±
17.
76
PO
4 (m
g l-1
) 0.
02 ±
0.0
1 0.
03 ±
0.0
1 0.
03 ±
0.0
0 0.
02 ±
0.0
1 0.
03 ±
0.0
1 0.
01 ±
0.0
1 0.
01 ±
0.0
1 0.
01 ±
0.0
2 0.
01 ±
0.0
2 P
T (m
g l-1
) 0.
05 ±
0.0
1 0.
06 ±
0.0
1 0.
05 ±
0.0
1 0.
05 ±
0.0
1 0.
06 ±
0.0
3 0.
04 ±
0.0
2 0.
04 ±
0.0
2 0.
03 ±
0.0
1 0.
03 ±
0.0
2 N
H4 (
mg
l-1)
0.04
± 0
.05
0.05
± 0
.06
0.06
± 0
.03
0.13
± 0
.18
0.30
± 0
.30
0.06
± 0
.02
0.03
± 0
.01
0.03
± 0
.01
0.06
± 0
.07
NO
2 (m
g l-1
) 0.
02 ±
0.0
1 0.
02 ±
0.0
1 0.
02 ±
0.0
1 0.
02 ±
0.0
2 0.
02 ±
0.0
2 0.
02 ±
0.0
3 0.
01 ±
0.0
2 0.
01 ±
0.0
1 0.
01 ±
0.0
2 N
O3 (
mg
l-1)
3.07
± 1
.19
2.94
± 1
.26
3.01
± 1
.32
2.89
± 1
.20
1.08
± 1
.98
0.87
± 1
.63
0.85
± 1
.6
0.49
± 0
.88
1.01
± 1
.93
NT (
mg
l-1)
3.40
± 1
.36
3.43
± 1
.41
3.45
± 1
.39
3.47
± 1
.41
1.53
± 2
.57
1.38
± 2
.37
1.17
± 1
.93
0.78
± 1
.20
1.36
± 2
.44
SiO
4 (m
g l-1
) 1.
26 ±
0.3
9 1.
15 ±
0.5
2 1.
20 ±
0.5
5 1.
35 ±
0.4
0 1.
03 ±
0.4
8 0.
64 ±
0.6
4 0.
39 ±
0.5
5 0.
40 ±
0.3
8 0.
46 ±
0.5
5 C
hlor
ophy
ll (µ
g l-1
) 2.
65 ±
3.0
8 0.
75 ±
0.4
7 0.
87 ±
0.7
0 0.
88 ±
0.7
2 0.
91 ±
0.5
2 0.
87 ±
0.9
5 1.
56 ±
1.5
1 1.
94 ±
1.4
5 1.
37 ±
1.0
4 P
heop
hyti
n (µ
g l-1
) 2.
43 ±
3.0
2 0.
99 ±
0.8
6 1.
01 ±
0.8
5 1.
12 ±
1.1
3 1.
18 ±
0.7
3 0.
78 ±
0.4
7 0.
77 ±
0.5
6 0.
61 ±
0.4
3 0.
69 ±
0.3
2 T
SS (
mg
l-1)
9.21
± 1
4.52
2.
83 ±
2.2
5 4.
85 ±
2.6
2 7.
32 ±
4.0
7 14
.43
± 9.
34
13.0
6 ±
10.6
9 12
.52
± 10
.61
13.3
5 ±
12.8
7 32
.06
± 30
.53
OSS
(m
g l-1
) 2.
41 ±
2.7
5 1.
40 ±
0.8
5 1.
59 ±
0.3
3 2.
20 ±
0.7
5 3.
43 ±
2.3
0 2.
92 ±
2.1
8 2.
61 ±
1.9
1 2.
76 ±
2.3
5 4.
21 ±
2.2
9 O
SS (%
) 48
.05
± 22
.93
59.6
6 ±
26.7
1 37
.27
± 13
.08
33.8
3 ±
13.7
2 25
.87
± 6.
56
27.2
± 9
.76
23.9
4 ±
5.1
23.3
9 ±
4.13
19
.62
± 9.
70
Mud
(%)
12.3
6 ±
6.46
0.
18 ±
0.1
1 31
.56
± 24
.48
1.13
± 0
.88
1.91
± 1
.20
13.2
2 ±
6.04
16
.69
± 10
.34
15.2
7 ±
0.54
32
.36
± 21
.25
Sand
(%)
86.6
9 ±
6.56
43
.66
± 16
.41
66.5
3 ±
24.6
9 96
.55
± 2.
70
97.8
6 ±
1.11
84
.33
± 4.
24
82.4
7 ±
9.99
69
.41
± 12
.75
65.1
3 ±
19.9
3 G
rave
l (%
) 0.
95 ±
0.1
1 56
.16
± 16
.31
1.91
± 0
.21
2.33
± 1
.82
0.23
± 0
.08
2.45
± 1
.80
0.85
± 0
.35
15.3
3 ±
12.2
1 2.
51 ±
1.9
1 T
OM
(%)
3.37
± 0
.76
1.30
± 0
.28
3.55
± 0
.24
2.47
± 1
.43
2.09
± 0
.24
4.86
± 0
.54
3.64
± 1
.30
5.07
± 1
.79
4.47
± 1
.04
Tab
le 2
. W
ater
phy
sic-
chem
ical
par
amet
ers
(ann
ual
mea
n an
d st
anda
rd d
evia
tion)
and
sed
imen
t ch
arac
teri
stic
s of
the
9 s
ampl
ing
stat
ions
.
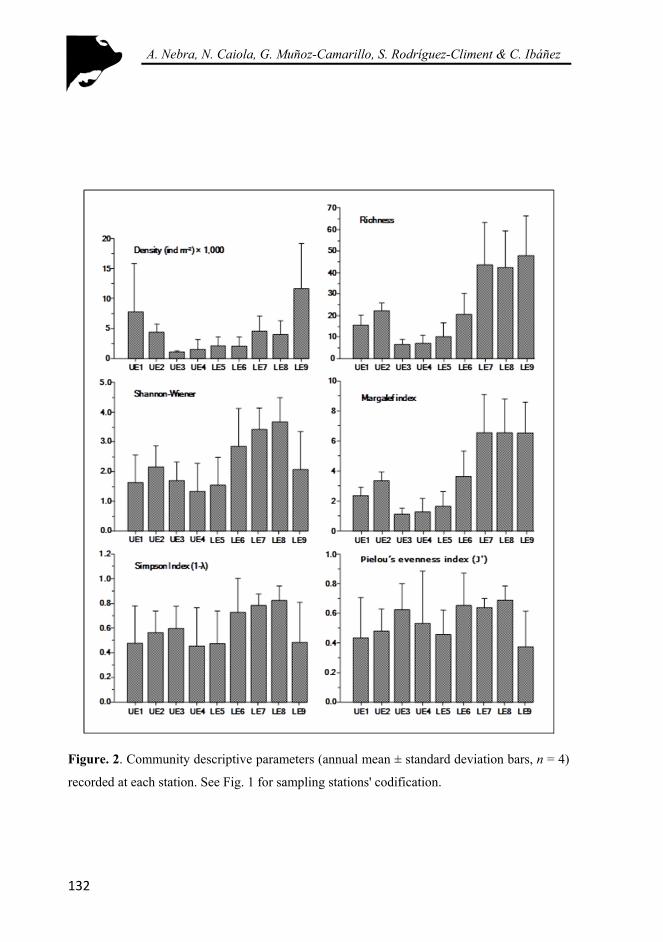
A. Nebra, N. Caiola, G. Muñoz-Camarillo, S. Rodríguez-Climent & C. Ibáñez
132
Figure. 2. Community descriptive parameters (annual mean ± standard deviation bars, n = 4)
recorded at each station. See Fig. 1 for sampling stations' codification.

CHAPTER III: Ecological assessment of highly stratified estuaries
133
3.3 Benthic biological indices and individual metrics
Due to the dynamic of the Ebro estuary specific BIs and metrics were computed for
each stretch (UE and LE).
IBMWP
All the families found in UE stations computed for IBMWP calculation. Concerning
UE stations, 12.4% were classified as ‘Good’, 18.8% as ‘Moderate’, 31.3% as ‘Poor’
and 37.5% as ‘Bad’. There wasn't any station achieving ‘High’ ES. The worst ES
ratings corresponded to stations UE3 and UE4 which ranged between ‘Bad’ and
‘Poor’ (Fig. 3); UE2 ranged between ‘Moderate’ and ‘Good’ achieving this category
in summer and spring. Station UE1ratings ranged from ‘Bad’ to ‘Moderate’.
Spearman correlation coefficient reported significant correlations among IBMWP
and 10 analyzed variables (Table 3). The Pollution Pressure showed strong negative
correlation with IBMWP. Regarding community parameters richness measures,
density and Margalef index showed significant and strong positive correlation with
IBMWP. Total organic matter in sediment showed significant negative correlation
with IBMWP.
M-AMBI
The percentage of non-scoring taxa in LE stations was very low (0.14% ± 0.30).
results showed that 25.00% of LE stations were classified as ‘High’, 45.00% as
‘Good’, 15.00% as ‘Moderate’ and 15.00% as ‘Poor’; there were no ‘Bad’ ES rating
(Fig. 3). Worst ES ratings corresponded to LE5 which ranged between ‘Poor’ and
‘Moderate’ (Fig. 3); LE6 ranged between ‘Poor’ and ‘Good’ reaching this category
in the last three sampling occasions. LE7-LE8 showed ‘Good’ and ‘High’ ratings in
the two first and two last sampling occasions respectively. The LE9 ES ranged
between ‘Moderate’ and ‘High’.

A. Nebra, N. Caiola, G. Muñoz-Camarillo, S. Rodríguez-Climent & C. Ibáñez
134
Table 3. Significant Spearman correlation coefficients among the BI scores, hydrological
pressure expressed as the deviation of wedge occurrence probability and as deviation of
permanence time from natural flow regime conditions, pollution pressure, environmental
parameters and the community descriptive parameters (UE stretch n = 16; LE stretch n = 20).
Calculated Pressures IBMWP M_AMBI BENTIX BOPA
H. Pressure (p) − 0.624b -0.570b 0.530a H. Pressure (days) − 0.660b -0.599b 0.554a P. Pressure -0.505a -0.484a 0.520a -0.474a
Environ. parameters DO (mg l-1) − − -0.489a − NH4 (mg l-1) − -0.490a 0.464a − PT (mg l-1) 0.580a − − − TSS (mg l-1) − − − -0.476a OSS (mg l-1) − -0.458a − -0.512a TOM (%) -0.648b 0.529a -0.552a 0.502a
Community parameters Richness (S) 0.940b 0.902b -0.838b 0.516a Number of Families 0.957b − − − Number of Genera 0.933b − − − Density (ind m-2) 0.523a 0.501a -0.588b − Margalef index (d) 0.942b 0.933b -0.825b 0.582b Pielou’s evenness (J’) − 0.629b − 0.663b Shannon-Wiener index (H’) − 0.863b − 0.742b Simpson index (1-λ’) − 0.758b − 0.707b Deposit feeders (%) − − 0.570b − Grazers (%) 0.816b − − − Predators (%) − 0.748b -0.887b 0.589b Suspension Feeders (%) -0.573a − − −
DO, dissolved oxygen; PT, total phosphorous; TSS, total suspended solids; OSS, organic suspended solids; TOM, total organic matter in sediment. a p < 0.05.
b p < 0.01.
Spearman correlation reported significant correlations among M-AMBI and 13
analyzed factors (Table 3). The Hydrological Pressure as probability and time
reported strong positive correlation with this index; conversely the Pollution Pressure
showed negative correlation. Regarding community parameters, all of them showed
significant and strong positive correlation with M-AMBI. Ammonium was
negatively correlated with M-AMBI.
CHAPTER III: Ecological assessment of highly stratified estuaries
135
BENTIX
Similarly to M-AMBI, BENTIX index showed similar percentages of non-scoring
taxa 0.18% ± 0.30. Within LE stretch, the 25.00% of stations were classified as
‘High’, 5.00% as ‘Good’, 55.00% as ‘Moderate’ and 15.00% as ‘Poor’; there were no
‘Bad’ ES ratings. Contrary to M-AMBI, best ES ratings corresponded to LE5 which
ranged between ‘Moderate’ and ‘High’; this rating was achieved in three of the
sampling occasions (Fig. 3). LE6 ranged between ‘Poor’ and ‘High’ achieving
‘Moderate’ rating in two sampling occasions. LE7-LE8 showed similar pattern with
‘Moderate’ category in the three last sampling occasions; station LE9 ratings ranged
between ‘Poor’ and ‘Moderate’. Spearman correlation coefficient reported significant
correlations among BENTIX and 11 analyzed variables (Table 3). Both measures of
Hydrological Pressure showed strong negative correlation with BENTIX,
nevertheless the Pollution pressure was positively correlated. Richness and Margalef
index showed significant and strong negative correlation with BENTIX. Regarding
environmental parameters, DO showed negative correlation with BENTIX.
BOPA
According to this index, the benthic estuarine condition ranged between ‘High’ and
‘Poor’ ES categories; there were no ‘Bad’ ES rating. A 45.00% of LE stations were
classified as ‘High’, 25.00% as ‘Good’, 20.00% as ‘Moderate’ and 10.00% as ‘Poor’.
Best ES ratings corresponded to station LE5 which reached ‘High’ ES in all
sampling occasions; following LE9 with ‘High’ category in three of the four
sampling occasions (Fig. 3). LE6 ranged between ‘High’ and ‘Poor’ ES and together
with LE8 were the only ones reaching ‘Poor’ rating with BOPA. LE7 ratings ranged
between ‘Moderate’ and ‘High’ and showed ‘Moderate’ category in two sampling
occasions; LE8 was the only station that did not reach ‘High’ ES rating with BOPA.
Spearman correlation analysis indicated significant correlations among BOPA and 12
analyzed variables (Table 3). BOPA was positively correlated with Hydrological
Pressure and negatively with Pollution Pressure. With regard to community

A. Nebra, N. Caiola, G. Muñoz-Camarillo, S. Rodríguez-Climent & C. Ibáñez
136
descriptive parameters, richness, Margalef index, Pielou's evenness, Shannon-
Wiener's diversity index and Simpson index showed significant strong positive
correlations with BOPA; TSS and OSS showed negative correlation with BOPA.
Individual metrics
Spearman correlation coefficients indicated strong significant negative correlations
among Pollution Pressure for UE stretch and metrics such as Shannon-Wiener index
and EPT (see Table 4 for data and abbreviations). In contrast, Hydrological pressure
for UE reach was strong and positively correlated with the percentage of EPT (%)
and EP/Total (%), despite of the predicted response to increasing perturbation (PRIP)
for these two metrics. Spearman correlation coefficients indicated strong significant
correlations among Pollution Pressure for LE stretch and six metrics in the expected
way of their PRIP. Nevertheless, four metrics e.g. BENTIX- GI (%) a sensitive
species group, showed a correlation not according with their PRIP. Hydrological
pressure for LE stretch showed strong correlations with the great part of the metrics;
nevertheless these correlations were not according with their PRIP (Table 5).

CHAPTER III: Ecological assessment of highly stratified estuaries
137
Figure. 3. Ecological status classification of UE and LE stations recorded at each sampling
occasion after applying the four different BIs: IBMWP, M-AMBI, BENTIX and BOPA. See
Fig. 1 for sampling stations' codification.

A. Nebra, N. Caiola, G. Muñoz-Camarillo, S. Rodríguez-Climent & C. Ibáñez
138
Table 4. Significant Spearman correlation coefficients among the UE Hydrological Pressure
expressed as the deviation of wedge occurrence probability from probability in natural flow
regime conditions, UE Pollution Pressure, community descriptive parameters and the
individual metrics (n = 16).
PRIP H. Pressure (p) P. Pressure Shannon-Wiener index (H’) Decrease − -0.522a EPT Decrease − -0.662b EPT (%) Decrease 0.518a -0.605a EPT/oligochaeta Decrease − -0.575a EPT/diptera Decrease − -0.698b EP Decrease − -0.666b EP/total taxa (%) Decrease 0.542a − EPTCBO Decrease − -0.599a
PRIP, predicted response to increasing perturbation; EPT, ephemeroptera, plecoptera and trichoptera; EP, ephemeroptera and plecoptera; EPTCBO, ephemeroptera, plecoptera, trichoptera, coleoptera, bivalvia and odonata. a p < 0.05. b p < 0.01.

CHAPTER III: Ecological assessment of highly stratified estuaries
139
Table 5. Significant Spearman correlation coefficients among the LE Hydrological Pressure
expressed as the deviation of wedge occurrence probability and as deviation of permanence
time from natural flow regime conditions, LE Pollution Pressure and the individual metrics (n
= 20).
PRIP H. Pressure (p) H. Pressure (days) P. Pressure Richness (S) Decrease 0.609b 0.639b -0.578b Number of Families Decrease 0.581b − − Number of Genera Decrease 0.548a − − Margalef index (d) Decrease 0.629b 0.686b -0.584b Pielou’s evenness (J’) Decrease 0.450a 0.511a − Shannon-Wiener index (H’) Decrease 0.604b 0.654b − Simpson index (1-λ’) Decrease 0.542a 0.577a − Predators (%) Decrease 0.585b 0.637b -0.559a Bentix_GI (%) Decrease -0.534a -0.558a 0.503a Bentix_GIII (%) Increase 0.597b 0.519a − Bentix_Tolerant (%) Increase 0.566b 0.596b -0.498a BOPA_Amphip. Decrease -0.496a -0.596b 0.609b BOPA_Polych. Increase 0.591a 0.651b -0.474a AMBI_GI (%) Decrease − 0.470a -0.488a AMBI_GII (%) Decrease − 0.504a − AMBI_GIII (%) Increase − -0.509a 0.487a AMBI_GIV (%) Increase 0.510a 0.583b − AMBI_GV (%) Increase 0.513a − − AMBI_Sensitive (%) Decrease − 0.495a -0.469a PRIP, predicted response to increasing perturbation. a p < 0.05. b p < 0.01.
DISCUSSION
4.1 Anthropogenic pressures and environmental condition of Ebro estuary bottom
Currently, main anthropogenic pressures affecting Ebro estuary are nutrient
enrichment and alteration of the natural flow regime. Nutrient loadings of Ebro River
are consequence of the inputs of wastewater mainly from agriculture and urban areas
on the whole Ebro basin (Lacorte et al., 2006; Terrado et al., 2006). Water analysis
revealed similar nutrient concentrations as recorded by Sierra et al. (2002) and Falcó
et al. (2010). Despite of severe eutrophication episodes occurring in the recent past
A. Nebra, N. Caiola, G. Muñoz-Camarillo, S. Rodríguez-Climent & C. Ibáñez
140
(Ibáñez et al., 1995), during the last decade the chemical status of Ebro estuary has
clearly improved. Nutrient inputs have considerably decreased in the whole basin
(Sierra et al., 2002; Ibáñez et al., 2008) limiting the primary production and therefore
the sedimentary input of organic matter throughout the halocline by entrainment
processes, alleviating the impact over estuary bottom (Ibáñez et al., 1995).
Conversely, the hydrological alteration produced by regulation could be considered
the most important anthropogenic pressure affecting lower Ebro River and therefore
its estuary. Regulation maintains a decreasing tendency of annual mean flow due
constant increment on water demand, mainly for hydroelectric power generation and
agricultural irrigation (Ibáñez et al., 1996, 2008; Sierra et al., 2004; Falcó et al.,
2010). Moreover, natural variations of river discharge are homogenized through the
year buffering the Mediterranean seasonality (Muñoz and Prat, 1989).
The worst impact caused by regulation over estuary ecology, excluding sediment
retention by damming and the associated habitat loss and delta regression (Ibáñez et
al., 1996), is the alteration of salt wedge dynamics. In natural regime flow conditions
the salt wedge could advance till its maximum on dry periods or even totally
disappear during high flow periods (for more details see Ibáñez et al., 1995, 1996;
Movellán, 2004). However, the actual homogeneity in river discharges assures the
presence of the salt wedge virtually in the same position for long periods (Ibáñez et
al., 1995; Sierra et al., 2002; Falcó et al., 2010). This fact was corroborated by
results obtained in this study (Fig.1); Ebro estuary remained divided in two
contrasting stretches (UE and LE) according with the physicochemical parameters
recorded, and supported by the results obtained after analysis of macro-invertebrate
community (Nebra et al., 2011).
Coupled to long periods of salt wedge the water quality is worsening below the
halocline due low water renewal rate; since freshwater flushing events are important
for removing the accumulated pollutants and materials (Pierson et al., 2002). The
entrainment processes between layers allows sedimentation of suspension particles
and died organisms from the upper layer to the bottom (Lewis, 1997). This input of

CHAPTER III: Ecological assessment of highly stratified estuaries
141
organic matter together with the sewage effluents discharged by two urban areas
located downstream (Fig.1) and suspension materials coming from the sea undergo a
progressive accumulation towards the null point by frontal convergent circulation
(Largier, 1993). The chemical reactions at the sediment surface releasing nutrients
and organic matter decomposition (Stanley and Nixon, 1992; Pierson et al., 2002)
could explain nutrient and oxygen concentrations found at LE5-LE6 stations (Table
2). The accumulation of diverse materials could promote eutrophication and oxygen
depletion through microbial consumption (Stanley and Nixon, 1992; Largier 1993;
Pierson et al., 2002) as occurred in the 90’s decade. Despite water anoxia was not
recorded at any station of LE stretch, certain hypoxia with a declining gradient in DO
from river mouth to null point was identified during study period; conversely,
oxygen values for UE stretch were not a limiting factor. Benthic macro-invertebrates
were more exposed to high nutrient levels and low dissolved oxygen concentrations
from mouth to null point, benthic condition improved upstream once overcome null
point. In summary, the Ebro estuary is recovering its chemical status approaching it
to ‘chemical reference conditions’, on the other hand regulation is distancing the
Ebro estuary from ‘hydrological reference conditions’, whose for this type of
estuaries means great hydrological variation, this fact is especially relevant due to
Mediterranean climate seasonality.
The novelty of this study lies in the way to quantify anthropogenic pressures;
pollution pressure was estimated by PCA analysis including organic enrichment
related variables, expressed as a synthetic index by PCA factor scores extraction.
Estimation of hydrological alteration was based in historical data (period from 1913;
to 1963), that we assume as ‘hydrological reference conditions’ for Ebro estuary.
This way, allowed us to evaluate deviation of salt wedge dynamics from natural
condition and therefore its relevance for estuarine ecology. We identify an increase
on occurrence probability and permanence time for LE stretch and just the opposite
for UE stretch.
A. Nebra, N. Caiola, G. Muñoz-Camarillo, S. Rodríguez-Climent & C. Ibáñez
142
4.2 Response of macroinvertebrate community to increasing perturbation
Differences found in macroinvertebrate community within each estuary stretch
seemed to be independent from sediment grain-size and salinity. The lack of salinity
gradient and the small variations recorded in sediment composition suggested other
factors causing changes in community, such as the accumulation of nutrients or
pollutants, the degree of exposition, organic matter, oxygen saturation or the water
renewal among others (Carvalho et al., 2006). The impoverishment tendency
followed by macroinvertebrate community in LE stretch was in accordance with
nutrient enrichment and hypoxia gradients described. The variability of the
community parameters showed a marked spatial difference among the studied
stations. In an overall view richness, density and diversity indices decreased
progressively along nutrient enrichment and oxygen depletion gradient from river
mouth to the null point; once overcome this stressed zone these parameters increased
again upwards (Fig. 2). Regarding LE stretch, those stations with degraded condition
benthos (LE5 and LE6) had fewer species, lower abundances and lower diversity
values than stations with a healthier benthos (LE7, LE8 and LE9). Thus, the
community parameters seemed to characterize the stations coherently with the
environmental gradients identified in the estuary bottom. Nevertheless, there are
other possible explanations for community impoverishment tendency land- wards;
only euryhaline taxa are able to displace simultaneously with salt wedge's tip, its
advance and retreat varied during day with discharge fluctuations depending on
electric power genera- tion demand. This fact force stenobiontic taxa to disappear.
Seawards this stress disappears increasing the stability of abiotic factors; then the
complexity of community is recovered as suggested by Sousa et al. (2006).
Moreover, stations located near mouth (LE7, LE8 and LE9) can be easily recolonized
by constant input of species from adjacent marine areas (Teske and Wooldridge,
2001). Also, Josefson and Hansen (2004) pointed out the low velocity of salt water
flux into the estuaries as a cause of low richness by regulating larval dispersal from
adjacent sea areas. Despite we found long periods of salt wedge's permanence, time

CHAPTER III: Ecological assessment of highly stratified estuaries
143
enough to assure the colonization of stations LE7 and LE8. These stations
demonstrated to be especially complex in composition, showing high richness and
density values. Thus ‘elasticity’ (rapid community recovery), that is promoted by the
presence of undisturbed communities in the vicinity of a particular site (Muxika et
al., 2005), was assured. The option of daily stress at stations close to null point
seemed to be plausible and complementary with oxygen-nutrient gradient and not
mutually exclusive.
4.3 Biotic indices and metrics suitability
Results obtained in this study evidenced that suitable ecological status assessment of
TWs is a really complex task. It is important to consider overall hindrances and
limitations concerning TWs, such as description of reference conditions or
identification of typologies, as well as the study case's particular ones. In the Ebro
estuary case we found assessment difficulties due to its particular characteristics
(stratified estuary). With respect to UE stations, the IBMWP showed no correlation
with Hydrological Pressure; probably due to IBMWP was designed to assess impact
of organic enrichment or because deviations obtained from natural flow regime were
quite small to reflect them in a clear impact to freshwater reach community.
Nevertheless, results showed that IBMWP and several metrics, e.g. Shannon-Wiener
index or EPT, responded to Pollution Pressure in the expected way (negatively
correlated), according with the PRIP. Despite of the sampling method used was not
the most suitable for IBMWP; it showed an acceptable discriminatory ability
identifying four ES categories.
Concerning LE stations, the response of community parameters and individual
metrics was the expected showing negative correlation with the Pollution Pressure,
except for those metrics being part of BENTIX and BOPA (Tables 3 and 5).
Nevertheless, this study revealed a paradoxical response to increasing Hydrological
Pressure as probability or permanence time; keeping in mind that the expected
response for a pressure is a clear negative impact over biological communities

A. Nebra, N. Caiola, G. Muñoz-Camarillo, S. Rodríguez-Climent & C. Ibáñez
144
(richness loss, enhance high abundance of few species and low diversities),
correlation analysis revealed that Richness, diversity indices and M-AMBI showed a
positive response to increasing hydrological alteration just the opposite of their PRIP.
Thus, hydrological alteration led to an artificial stability of abiotic conditions
facilitating the prompt achievement of ‘environmental homeostasis’, this promote the
substitution of macroinvertebrate community by other community best struc-tured,
integrated by typical members of coastal areas and with a great complexity
comparing with community found in other temperate estuaries (Nebra et al., 2011).
A common problem with ES assessment of estuaries is the impossibility of
distinguishing natural from anthropogenic stress, both act over biological
communities in the same way with the consequent problem of ES underestimate
possibility; this was called ‘estuarine quality paradox’. Nevertheless, the Ebro
estuary is suffering its own ‘quality paradox’, since the most important
anthropogenic pressure identified nowadays is dimming the natural stress associated
with hydrological variation of a typical salt-wedge estuary of the Mediterranean
region. This problem is causing an overestimation of all community parameters and
therefore of the ES.
Regarding BIs ratings, the discrepancies among BIs were great and evident. For the
same station and sampling occasion ratings could range between 1 and 3 ES levels
depending on the applied BI. Only a small percentage of overlap was observed (Fig.
3). The problem of disagreement among BIs have been documented in many other
studies (Reiss and Kroncke, 2005; Labrune et al., 2006; Simboura and Reizopoulou,
2008). Furthermore, for the Ebro estuary case the ES classification of the stations
was contradictory; M-AMBI ranked stations in contrary way than BENTIX and
BOPA. M-AMBI values showed a decreasing tendency towards null point where are
located the stations with worst environmental condition and an impoverished benthic
commu- nity. Conversely, BENTIX and BOPA gave to these perturbed stations the
maximum ratings (Fig. 3); however, this fact was especially surprising for BENTIX
based on the same paradigm (Pearson and Rosenberg, 1978). BENTIX showed a

CHAPTER III: Ecological assessment of highly stratified estuaries
145
clear decreasing tendency towards river mouth, demonstrating that its ratings were
opposed to the values of richness, abundance and diversity indices. The mismatch of
the BENTIX in the Ebro estuary was not surprising in the manner as Simboura and
Zenetos (2002) previously described the limitations of its use in TWs (i.e. estuaries
and coastal lagoons). Moreover, according to Simboura and Reizopoulou (2008), this
could be related to the different design of each index (in BENTIX each ecological
group weighted equally, whereas AMBI renders a different coefficient for each one).
Regarding BOPA index, it did not seem to work adequately for either of stations or
sampling occasion, it was not able to distinguish among stations and main causes of
stress for LE macroinvertebrate communities. Since, applying BOPA most of the
stations showed ‘High’ and ‘Good’ ES rating. This BI showed a similar tendency of
BENTIX giving better ES classification to those stations with highest nutrient values
and impoverished macroinvertebrate community. The problem of BOPA lied on its
low discrimination ability and bias to overestimate the ES; similar results were
reported by other authors in different TWs systems along Mediterranean coasts
(Pranovi et al., 2007; Munari and Mistri, 2007; Afli et al., 2008; Blanchet et al.,
2008; de-la-Ossa-Carretero et al., 2009). Probably the explana- tion is that this BI
was essentially developed to assess hydrocarbon spill impact over benthic
invertebrate communi- ties; in the way that amphipods, the main component of
BOPA, are recognized to be sensitive to hydrocarbons (Gesteira and Dauvin, 2000,
2005; Dauvin and Ruellet, 2007). Thus, BOPA did not carry the same bias than M-
AMBI and BENTIX for its adaptation to natural muddy bottoms (Blanchet et al.,
2008). Other, tendency observed in the BIs applied for the LE stations is that their
ratings were so high (none of them found ‘Bad’ ES and in contrast showed elevated
percentages of ‘High’ and ‘Good’ ES); BIs generally tended to show low resolving
power and to overestimate the ES when are applied under different conditions they
were develop for (Pranovi et al., 2007; Zettler et al., 2007; Bouchet and Sauriau,
2008; de-la-Ossa-Carretero et al., 2009; Tataranni and Lardicci, 2010).

A. Nebra, N. Caiola, G. Muñoz-Camarillo, S. Rodríguez-Climent & C. Ibáñez
146
CONCLUSIONS
Study outcomes suggest that a different approach for the assessment of TWs is
necessary; particular characteristics of each study case difficult the use of ‘wide-
spread’ assessment tools, even more when hydrological features are gaining
relevance on ES assessment with respect to water and sediment quality. Analysis of
community parameters (abundance, biomass, richness and diver- sity indices) and
individual metrics seems to be the correct way to a suitable environmental
assessment (they are easier to interpret and can be more broadly applicable than BIs).
Identify metrics such as Shannon-Wiener index, Richness, Margalef index or EPT
that respond to anthropogenic pressures and integrate them in a multimetric index
could be a reliable complement to BIs. Finally, this study establishes a baseline
approach to cope with the assessment difficulties not only for the Ebro estuary but
also for other Mediterranean estuaries suffering hydrological alteration.
ACKNOWLEDGEMENTS
This research was supported by the Government of Catalonia (Catalan Water
Agency, Catalonia, Spain). We are grateful to C. Buendía, Ll. Jornet, C. Macaigne,
D. Mateu, M. San Lorenzo and R. Valmaña for field assistance and laboratory work.
Many thanks to M. González-Porto for helping us with Polychaeta identification and
to C. Reverté for the bibliographic assistance.
REFERENCES
ACA, 2006. (Catalan Water Agency), BIORI. Protocol D'avaluaciò De La Qualitat
Biològica Dels Rius. Departament de Medi Ambient, Generalitat de
Catalunya, Barcelona.

CHAPTER III: Ecological assessment of highly stratified estuaries
147
Afli, A., Ayari, R., Zaabi, S., 2008. Ecological quality of some Tunisian coast and
lagoon locations, by using benthic community parameters and biotic indices.
Estuar. Coast. Shelf S. 80, 269-280.
Alba-Tercedor, J., Ja;imez-Cuellar, P., Alvarez, M., Aviles, J., Bonada, N., Casas, J.,
Mellado, A., Ortega, M., Pardo, I., Prat, N., Rieradevall, M., Robles, S., Elisa
Sainz- Cantero, C., Sanchez-Ortega, A., Suarez, M.L., Toro, M., Vidal-
Abarca, M.R., Vivas, S., Zamora-Munoz, C., 2002. Caracterizacion del
estado ecologico de rios mediterraneos ibericos mediante el ndice IBMWP
(antes BMWP'). Limnetica 21, 175-185.
Batalla, R.J., Gómez, C.M., Kondolf, G.M., 2004. Reservoir-induced hydrological
changes in the Ebro River basin (NE Spain). J. Hydrol. 290, 117-136.
Blanchet, H., Lavesque, N., Ruellet, T., Dauvin, J.C., Sauriau, P.G., Desroy, N.,
Desclaux, C., Leconte, M., Bachelet, G., Janson, A.L., Bessineton, C.,
Duhamel, S., Jourde, J., Mayot, S., Simon, S., de Montaudouin, X., 2008.
Use of biotic indices in semi-enclosed coastal ecosystems and transitional
waters habitats - implications for the implementation of the European Water
Framework Directive. Ecol. Indic. 8, 360-372.
Bock, M.T., Miller, B.S., Bowman, A.W., 1999. Assessment of eutrophication in the
Firth of Clyde: analysis of coastal water data from 1982 to 1996. Mar. Pollut.
Bull. 38, 222-231.
Borja, A., Franco, J., Muxika, I., 2004. The biotic indices and the Water Framework
Directive: the required consensus in the new benthic monitoring tools. Mar.
Pollut. Bull. 48, 405-408.
Borja, A., Franco, J., Pérez, V., 2000. A marine Biotic Index to establish the
ecological quality of soft-bottom benthos within European estuarine and
coastal environments. Mar. Pollut. Bull. 40, 1100-1114.
Bouchet, V.M.P., Sauriau, P.G., 2008. Influence of oyster culture practices and
environmental conditions on the ecological status of intertidal mudflats in the

A. Nebra, N. Caiola, G. Muñoz-Camarillo, S. Rodríguez-Climent & C. Ibáñez
148
Pertuis Charentais (SW France): a multi-index approach. Mar. Pollut. Bull.
56, 1898-1912.
Boynton, W.R., Garber, J.H., Summers, R., Kemp, W.M.,1995. Inputs,
transformations, and transport of nitrogen and phosphorus in Chesapeake
Bay and selected tributaries. Estuaries 18, 285-314.
Bustos-Baez, S., Frid, C., 2003. Using indicator species to assess the state of
macrobenthic communities. Hydrobiologia 496, 299-309.
Cacchione, D.A., Drake, D.E., Losada, M.A., Medina, R., 1990. Bottom boundary
layer measurements on the continental-shelf off the Ebro river, Spain. Mar.
Geol. 95, 179-192.
Caiola, N., Vargas, M.J., de Sostoa, A., 2001a. Feeding ecology of the endangered
Valencia toothcarp, Valencia hispanica (Actinopterygii: Valenciidae).
Hydro-biologia 448, 97-105.
Caiola, N.A., Vargas, M.J., de Sostoa, A., 2001b. Life history pattern of the
endangered Valencia toothcarp, Valencia hispanica (Actinopterygii:
Valenciidae) and its implications for conservation. Arch. Hydrobiol. 150,
473-489.
Cantillo, A.Y., 1998. Comparison of results of mussel watch programs of the United
States and France with worldwide mussel watch studies. Mar. Pollut. Bull.
36, 712-717.
Carvalho, S., Gaspar, M.B., Moura, A., Vale, C., Antunes, P., Gil, O., da Fonseca,
L.C., Falcao, M., 2006. The use of the marine biotic index AMBI in the
assessment of the ecological status of the Obidos lagoon (Portugal). Mar.
Pollut. Bull. 52, 1414-1424.
Dauer, D.M., 1993. Biological criteria, environmental health and estuarine macro-
benthic community structure. Mar. Pollut. Bull. 26, 249-257.

CHAPTER III: Ecological assessment of highly stratified estuaries
149
Dauer, D.M., Ranasinghe, J.A., Weisberg, S.B., 2000. Relationships between benthic
community condition, water quality, sediment quality, nutrient loads, and
land use patterns in Chesapeake Bay. Estuaries 23, 80-96.
Dauvin, J.C., 2007. Paradox of estuarine quality: benthic indicators and indices,
consensus or debate for the future. Mar. Pollut. Bull. 55, 271-281.
Dauvin, J.C., Ruellet, T., 2007. Polychaete/amphipod ratio revisited. Mar. Pollut.
Bull. 55, 215-224.
Day, J.W., Hall, C.A.S., Kemp, W.M., Yáñez-Arancibia, A., 1989. Estuarine
Ecology. John Wiley and Sons Ltd, New York.
Day, J.W., Martin, J.F., Cardoch, L., Templet, P.H., 1997. System functioning as a
basis for sustainable management of deltaic ecosystems. Coast. Manage. 25,
115-153.
de-la-Ossa-Carretero, J.A., del-Pilar-Ruso, Y., Gimenez-Casalduero, F., Sanchez-
Lizaso, J.L., 2009. Testing BOPA index in sewage affected soft-bottom
communities in the north-western Mediterranean. Mar. Pollut. Bull. 58, 332-
340.
Díaz, R.J., 2001. Overview of hypoxia around the world. J. Environ. Qual. 30, 275-
281.
Edgar, G.J., Barrett, N.S., Last, P.R., 1999. The distribution of macroinvertebrates
and fishes in Tasmanian estuaries. J. Biogeogr. 26, 1169-1189.
Elliott, M., Quintino, V., 2007. The estuarine quality paradox, environmental
homeostasis and the difficulty of detecting anthropogenic stress in naturally
stressed areas. Mar. Pollut. Bull. 54, 640-645.
European Parliament, 2000. Directive /60/EC of the European Parliament and of the
council establishing a framework for the community action in the field of
water policy. Off. J. Eur. Union 327, 1-73.

A. Nebra, N. Caiola, G. Muñoz-Camarillo, S. Rodríguez-Climent & C. Ibáñez
150
Falcó, S., Niencheski, L.F., Rodilla, M., Romero, I., del Rio, J.G., Sierra, J.P.,
Mosso, C., 2010. Nutrient flux and budget in the Ebro estuary. Estuar. Coast.
Shelf S. 87, 92-102.
Ferreira, T., Caiola, N., Casals, F., Oliveira, J.M., De Sostoa, A., 2007a. Assessing
perturbation of river fish communities in the Iberian Ecoregion. Fish.
Manage. Ecol. 14, 519-530.
Ferreira, T., Oliveira, J., Caiola, N., de Sostoa, A., Casals, F., Cortes, R., Economou,
A., Zogaris, S., García-Jalón, D., Ilheu, M., Martínez-Capel, F., Pont, D.,
Rogers, C., Prenda, J., 2007b. Ecological traits of fish assemblages from
Mediterranean Europe and their responses to human disturbance. Fish.
Manage. Ecol. 14, 473-481.
Gesteira, J.L.G., Dauvin, J.C., 2000. Amphipods are good bioindicators of the impact
of oil spills on soft-bottom macrobenthic communities. Mar. Pollut. Bull. 40,
1017-1027.
Gesteira, J.L.G., Dauvin, J.C., 2005. Impact of the Aegean Sea oil spill on the
subtidal fine sand macrobenthic community of the Ares-Betanzos Ría
(Northwest Spain). Mar. Environ. Res. 60, 289-316.
Grall, J., Glemarec, M., 1997. Using biotic indices to estimate macrobenthic
community perturbations in the Bay of Brest. Estuar. Coast. Shelf S. 44, 43-
53.
Gray, J.S., Elliott, M., 2009. The Ecology of Marine Sediments, second ed.
Cambridge University Press, Cambridge.
Grebmeier, J.M., McRoy, C.P., Feder, H.M., 1988. Pelagic-benthic coupling on the
shelf of the northern Bering and Chukchi seas. l. Food-supply source and
benthic biomass. Mar. Ecol. Prog. Ser. 48, 57-67.
CHAPTER III: Ecological assessment of highly stratified estuaries
151
Hänninen, J., Vuorinen, I., Helminen, H., Kirkkala, T., Lehtila, K., 2000. Trends and
gradients in nutrient concentrations and loading in the Archipelago Sea
northern Baltic, in 1970-1997. Estuar. Coast. Shelf S. 50, 153-171.
Ibáñez, C., 1993. Dinàmica Hidrològica I Funcionament Ecològic Del Tram Estuari
Del Ebre. Tesi doctoral. Universitat de Barcelona, Barcelona.
Ibáñez, C., Alcaraz, C., Caiola, N., Rovira, A., Trobajo, R., Alonso, M., Durán, C.,
Jiménez, P.J., Munné, A., Prat, N., 2012a. Regime shift from phytoplankton
to macrophyte dominance in a large river: top-down versus bottom-up
effects. Sci. Total Environ. 416, 314-322.
Ibáñez, C., Caiola, N., Rovira, A., Real, M., 2012b. Monitoring the effects of floods
on submerged macrophytes in a large river. Sci. Total Environ. 440, 132-139.
Ibáñez, C., Pont, D., Prat, N.,1997. Characterization of the Ebre and Rhone estuaries:
a basis for defining and classifying salt-wedge estuaries. Limnol. Oceanogr.
42, 89-101.
Ibáñez, C., Prat, N., Canicio, A., 1996. Changes in the hydrology and sediment
transport produced by large dams on the lower Ebro River and its estuary.
Regul. Rivers Res. Manage. 12, 51-62.
Ibáñez, C., Prat, N., Durán, C., Pardos, M., Munné, A., Andreu, R., Caiola, N., Cid,
N., Hampel, H., Sánchez, R., Trobajo, R., 2008. Changes in dissolved
nutrients in the lower Ebro River: causes and consequences. Limnetica 27,
131-142.
Ibáñez, C., Rodrigues-Capitulo, A., Prat, N., 1995. The combined impacts of river
regulation and eutrophication on the dynamicsof the salt wedge and the
ecology of the lower Ebro River. The Ecological Basis for River
Management. John Wiley and Sons, Chichester, UK, pp. 105-114.
Josefson, A.B., Hansen, J.L.S., 2004. Species richness of benthic macrofauna in
Danish estuaries and coastal areas. Global Ecol. Biogeogr. 13, 273-288.

A. Nebra, N. Caiola, G. Muñoz-Camarillo, S. Rodríguez-Climent & C. Ibáñez
152
Justic, D., Rabalais, N.N., Turner, R.E., Dortch, Q., 1995. Changes in nutrient
structure of river-dominated coastal waters stoichiometric nutrient balance
and its consequences. Estuar. Coast. Shelf S. 40, 339-356.
Karlson, K., Rosenberg, R., Bonsdorff, E., 2002. Temporal and spatial large-scale
effects of eutrophication and oxygen deficiency on benthic fauna in
Scandinavian and Baltic waters - a review. Oceanogr. Mar. Biol.: Ann. Rev.
40, 427-489.
Labrune, C., Amouroux, J.M., Sarda, R., Dutrieux, E., Thorin, S., Rosenberg, R.,
Gremare, A., 2006. Characterization of the ecological quality of the coastal
Gulf of Lions (NW Mediterranean). A comparative approach based on three
biotic indices. Mar. Pollut. Bull. 52, 34-47.
Lacorte, S., Raldua, D., Martínez, E., Navarro, A., Diez, S., Bayona, J.M., Barcelò,
D., 2006. Pilot survey of a broad range of priority pollutants in sediment and
fish from the Ebro river basin (NE Spain). Environ. Pollut. 140, 471-482.
Largier, J.L., 1993. Estuarine fronts - how important are they. Estuaries 16, 1-11.
Lewis, R., 1997. Dispersion in Estuaries and Coastal Waters. John Wiley and Sons
Ltd, Michigan.
McLusky, D.S.,1999. Estuarine benthic ecology: a European perspective. Aust. J.
Ecol. 24, 302-311.
McLusky, D.S., Elliott, M., 2004. The Estuarine Ecosystem: Ecology, Threats and
Management, third ed. Oxford University Press Inc., New York.
Movellán, E., 2004. Modelado De La Cuña Salina Y Del Flujo De Nutrientes En El
Tramo Estuarino Del Río Ebro. University of Barcelona, Barcelona.
Munari, C., Mistri, M., 2007. Evaluation of the applicability of a fuzzy index of
ecosystem integrity (FINE) to characterize the status of Tyrrhenian lagoons.
Mar. Environ. Res. 64, 629-638. Muxika, I., Borja, A., Bald, J., 2007. Using
historical data, expert judgment and multivariate analysis in assessing

CHAPTER III: Ecological assessment of highly stratified estuaries
153
reference conditions and benthic ecological status, according to the European
Water Framework Directive. Mar. Pollut. Bull. 55, 16-29.
Muxika, I., Borja, A., Bonne, W., 2005. The suitability of the marine biotic index
(AMBI) to new impact sources along European coasts. Ecol. Indic. 5, 19-31.
Navarro-Ortega, A., Tauler, R., Lacorte, S., Barcelo, D., 2010. Occurrence and
transport of PAHs, pesticides and alkylphenols in sediment samples along
the Ebro River Basin. J. Hydrol. 383, 5-17.
Nebra, A., Caiola, N., Ibáñez, C., 2011. Community structure of benthic macro-
invertebrates inhabiting a highly stratified Mediterranean estuary. Sci. Mar.
75, 577-584.
Nedwell, D.B., Jickells, T.D., Trimmer, M., Sanders, R., 1999. Nutrients in estuaries.
Estuaries. Adv. Ecol. Res. 29, 43-92.
Pearson, T.H., Rosenberg, R., 1978. Macrobenthic succession in relation to organic
enrichment and pollution of the marine environment. Oceanogr. Mar. Biol.
Ann. Rev. 16, 229-311.
Perus, J., Bonsdorff, E., Back, S., Lax, H.-G., Villnas, A., Westberg, V., 2007.
Zoobenthos as indicators of ecological status in coastal brackish waters: a
comparative study from the Baltic Sea. Ambio 36, 250-256.
Pierson, W.L., Bishop, K., Van Senden, D., Horton, P.R., Adamantilis, C.A., 2002.
Environmental Water Requirements to Maintain Estuarine Processes.
Environ- mental Flows Initiative, Technical Report Number 3, Water
Research Laboratory Technical Report /11, Environmental Flows Initiative
Technical Report, 3, National River Health Program. Report prepared for
EnvironmentAustralia.
Pranovi, F., Da Ponte, F., Torricelli, P., 2007. Application of biotic indices and
relationship with structural and functional features of macrobenthic commu-

A. Nebra, N. Caiola, G. Muñoz-Camarillo, S. Rodríguez-Climent & C. Ibáñez
154
nity in the lagoon of Venice: an example over a long time series of data. Mar.
Pollut. Bull. 54, 1607-1618.
Reiss, H., Kroncke, I., 2005. Seasonal variability of benthic indices: an approach to
test the applicability of different indices for ecosystem quality assessment.
Mar. Pollut. Bull. 50, 1490-1499.
Russell, M.J., Montagna, P.A., Kalke, R.D., 2006. The effect of freshwater inflow on
net ecosystem metabolism in Lavaca Bay Texas. Estuar. Coast. Shelf S. 68,
231-244.
Schlacher, T.A., Wooldridge, T.H., 1996. Ecological responses to reductions in
freshwater supply and quality in South Africa's estuaries: lessons for
management and conservation. J. Coast. Conserv. 2, 115-130.
Sierra, J.P., Sánchez-Arcilla, A., del Rio, J.G., Flos, J., Movellán, E., Mösso, C.,
Martínez, R., Rodilla, M., Falcó, S., Romero, I., 2002. Spatial distribution of
nutrients in the Ebro estuary and plume. Cont. Shelf Res. 22, 361-378.
Sierra, J.P., Sánchez-Arcilla, A., Figueras, P.A., del Rio, J.G., Rassmussen, E.K.,
Mösso, C., 2004. Effects of discharge reductions on salt wedge dynamics of
the Ebro River. River Res. Appl. 20, 61-77.
Simboura, N., Reizopoulou, S., 2008. An intercalibration of classification metrics of
benthic macroinvertebrates in coastal and transitional ecosystems of the
Eastern Mediterranean ecoregion (Greece). Mar. Pollut. Bull. 56, 116-126.
Simboura, N., Zenetos, A., 2002. Benthic indicators to use in ecological quality
classification of Mediterranean soft bottom marine ecosystems, including a
new biotic index. Mediterr. Mar. Sci. 3, 77-111.
Sousa, R., Dias, S., Antunes, J.C., 2006. Spatial subtidal macrobenthic distribution in
relation to abiotic conditions in the Lima estuary, NW of Portugal.
Hydrobiologia 559, 135-148.

CHAPTER III: Ecological assessment of highly stratified estuaries
155
Stanley, D.W., Nixon, S.W., 1992. Stratification and bottom-water hypoxia in the
Pamlico River estuary. Estuaries 15, 270-281.
Tabachnick, B.G., Fidell, L.S., 2001. Computer-Assisted Research Design and
Analysis. Allyn and Bacon, Boston.
Tataranni, M., Lardicci, C., 2010. Performance of some biotic indices in the real
variable world: a case study at different spatial scales in North-Western
Mediterranean Sea. Environ. Pollut. 158, 26-34.
Terrado, M., Barceló, D., Tauler, R., 2006. Identification and distribution of
contamination sources in the Ebro river basin by chemometrics modeling
coupled to geographical information systems. Talanta 70, 691-704.
Teske, P.R., Wooldridge, T., 2001. A comparison of the macrobenthic faunas of
permanently open and temporarily open/closed South African estuaries.
Hydrobiologia 464, 227-243.
Wang, P.F., Martin, J., Morrison, G., 1999. Water quality and eutrophication on
Tampa Bay Florida. Estuar. Coast. Shelf S. 49, 1-20.
Ysebaert, T., Meire, P., Coosen, J., Essink, K., 1998. Zonation of intertidal macro-
benthos in the estuaries of Schelde and Ems. Aquat. Ecol. 32, 53-71.
Zaldívar, J.M., Cardoso, A.C., Viaroli, P., Newton, A., de Wit, R., Ibáñez, C.,
Reizopoulou, S., Somma, F., Razinkovas, A., Basset, A., Holmer, M.,
Murray, N., 2008. Eutrophication in transitional waters: an overview.
Transit. Waters Monogr. 1, 1-78.
Zettler, M.L., Schiedek, D., Bobertz, B., 2007. Benthic biodiversity indices versus
salinity gradient in the southern Baltic Sea. Mar. Pollut. Bull. 55, 258-270.


157
5 GENERAL DISCUSSION
The present discussion aims to give a general perspective of the main outcomes
presented in the previous chapters and to justify the extracted conclusions of this
dissertation. Since the main characteristics of the Ebro Estuary were already
described in the general introduction section, this general discussion was mainly
focused on different issues as the current estuarine condition and, the main factors
determining estuarine benthos functioning; the effects of hydrological alterations due
to water abstraction and regulation; and the relevance of eutrophication diming of
river water. This was accomplished by using benthic macroinvertebrate community
as the unifying thread of this dissertation. In general, the present thesis demonstrated
that the Ebro Estuary ecosystem is hydrologically altered and suffers an important
anthropogenic stress, showing a high probability of stratification and salt wedge
state. Besides, the stable and optimal water and sediment characteristics influenced
the current structure and ecology of the macroinvertebrate community. Finally, the
results of the present dissertation suggested that macroinvertebrate community can be
used as a suitable bioindicator in the assessment of anthropogenic impacts on the
Ebro Estuary and, by extension, in other Mediterranean estuaries.
5.1 Recent changes on estuary environmental condition and its influence on the
benthic macroinvertebrate community
The environmental condition of the Ebro Estuary suffered important changes during
the last decades mostly as a result of two main causes, the current water regulation
and management program, and the improvement of river water trophic state (see
GENERAL DISCUSSION
158
Chapters I, II). On one hand, in river-dominated estuaries, freshwater inflow
determines water column and bottom environmental condition (mainly, causing
variation in water features and substrate), and therefore, the ecology of benthic
communities (Schroeder et al., 1990; Kurup et al., 1998; Breault et al., 1999).
Disturbances due to regulation and water abstraction on hydrology, sediment
transport and consequently, on the ecology of rivers and estuaries, are well
documented (Drinkwater and Frank 1994; Alber, 2002).
In the case of the lower Ebro River, several studies provided important ecological
and hydrological data concerning the disturbances caused by water abstraction and
regulation on the Ebro Delta-Estuary complex (Guillén et al., 1992; Guillén and
Palanques, 1992; Ibáñez et al., 1995, 1996, 2008; Sierra et al., 2004). However, none
of them was completely focused on estuary benthic condition and its influence on
biological communities. The impacts of flow regulation in the lower Ebro River (e.g.
sediment retention by damming associated to habitat loss and delta regression and
altered hydrodynamics) began in the late 60’s, when dams were built in some
important tributaries. These impacts continued increasing during the 70’s decade,
after the construction of great dams in the main channel scarcely 100 km from river
mouth. During the last years, the water management scheme in the lower Ebro River
conducted to long periods of salt wedge state in the estuary (highly altered salt wedge
hydrodynamics) with direct consequences for benthic environmental condition. The
Mediterranean seasonality was concealed since water flow pulses were eliminated;
thus the ejection of marine intrusion and the formation of ‘fluvial estuarine stretch’
(Ibáñez, 1993) was unusual and ephemeral, river and marine water mixing was
scarce and restricted to halocline, and the reduction in turbulence maintained water
column stratified in marine reach stations, moreover, quality of salt wedge water got
worsen as consequence of the low water renewal rate as suggested by Drinkwater
and Frank, 1994 and by frontal convergent circulation that tend to accumulate
suspended materials in the front of the wedge (Largier, 1993). Finally, the removal of
accumulated materials and contaminants associated to high flows was also unusual.

GENERAL DISCUSSION
159
Consequently, under these continued conditions, the benthic community could have
greater exposure to low dissolved oxygen events (Holland et al., 1987) and higher
sediment contaminant levels (Brown et al., 2000) below the halocline. However,
paradoxically, the quasi-permanent presence of salt wedge has an advantageous
effect on the estuary bottom ecology, and therefore, for the establishment of
biological communities. The environmental stability, associated to long periods of
salt wedge, reduced the natural hydrological stress (advance, retreat, stratification
breakdown, fluvial estuarine stretch formation), promoting the improvement of
environmental conditions. Stability benefits counteracted the harmful effects of salt
wedge water quality loss, mainly in null point surrounding areas. This fact, together
with a constant input of potential food resources and organisms from adjacent areas,
provided the possibility of increasing the complexity of the benthic community as
suggested by Sousa et al. (2006).
On the other hand, during the last decades, the river experienced a significant
decrease in nutrient loadings (see Casamayor et al., 2001; Ibáñez et al., 2008, 2012a,
b). Essentially, the reduction in phosphate compounds by law and the improvement
of water treatment plants, led to the oligotrophication process reducing the river
primary production, since phosphorous limits production in freshwater environments
(Correl, 1999); and therefore, the organic matter contribution to the estuary bottom
(inputs by settlement and flocculation). This oligotrophication together with the lack
of sediments retained in the big dams upstream, increased water transparency
allowing the penetration of light to marine water layer; the total oxygen depletion or
hypoxia events in the salt wedge were reduced to the minimum, not being restrictive
for benthic biota. In the 90’s decade, the primary production associated to
eutrophication in the lower Ebro River created an excess of organic matter input to
the estuary bottom due to high nutrient loadings together with high transparency of
water since the damming retention provoked low sediment transport. The oxidation
of this organic matter by microorganism, consumed the whole available oxygen
producing severe anoxic episodes in the salt wedge. Thus, oxygen deficiency was the
GENERAL DISCUSSION
160
limiting factor for the establishment of biological communities (Muñoz, 1990; Ibáñez
et al., 1995). Nowadays, oxygen condition of estuary benthos is not limiting and so,
all estuarine aerobic processes are assured; the primary production of both river and
sea water layers are within normal limits, and also river water transparency allowed
the activity of primary producers in salt wedge. All together assures the oxygenation
needed for organic matter processing and biological communities’ development,
even with organic matter accumulation towards the salt wedge tip, causing some
hypoxia events that frequently occur below the pycnocline (Holland et al., 1987).
Definitely, both oligotrophication and flow regime are the main drivers of the current
environmental condition of Ebro Estuary, the first assuring the required water quality
for biological processes, and the last one altering salt wedge dynamics which reduces
hydrological stress.
Taking into account the environmental quality and the current macroinvertebrate
communities recorded in the Ebro Estuary (Chapter I), it is noticeable the
enhancement of the health of the Ebro Estuary benthos, when comparing with data
before the 1990’s decade (Ibáñez et al., 1995). The shift on benthic condition favored
the macroinvertebrate community recovery, from a very poor community dominated
by a few tolerant species (Ibáñez et al., 1995), to a very complex macroinvertebrate
community (Chapter I); not only in richness terms but also in trophic structure,
suggesting a great amount of resources and interactions of food webs as suggested by
Brown et al. (2000). The macroinvertebrate community of the Ebro Estuary took
advantage of this environmental condition, and colonized this estuary showing
greater a complexity when compared to other temperate estuaries (Chapters I, II). In
addition, after a community disturbance, such as the formation of fluvial estuarine
stretch or marine intrusion clear out events (continuous flows over 350-400 m3s-1),
the community elasticity (rapid recovery) is assured by the presence of undisturbed
communities in the vicinity, acting as a source pool of species (Muxika et al., 2005);
that, in the case of the Ebro Estuary are the adjacent marine shallow areas, that show
similar environmental condition and host similar species complex (Sardà and Martín,
GENERAL DISCUSSION
161
1993; Cartes et al., 2007, 2008; De Juan and Cartes, 2011; Jordana et al., 2015). The
community inhabiting the Ebro Estuary was similar to communities registered in
other temperate estuaries, and typical soft-bottom species complex were found in the
Ebro Estuary too (Chapters I, II): Moreover, the euryhaline species were dominant
surrounding null point (the most stressful area of the estuary). Nevertheless, the
species richness in the Ebro Estuary increased due to the contribution of marine
species coming from those adjacent shallow areas, since the entrance of marine
origin species into the estuary (in the order of 6 kilometers upstream) was possible by
the similar environmental conditions found in the salt wedge together with
permanence time enough to arrive in spite of the limited dispersal abilities and slow
salt wedge velocity upstream.
5.2 Estuarine macrofaunal trends across a stressful riverine-marine boundary
The boundary between freshwater and marine ecosystems at the head of estuaries has
received little attention from aquatic ecologists (Rundle et al., 1998); despite that,
estuaries, because of their heterogeneity, constituted the perfect frame for research on
ecological boundaries in aquatic systems. This is the reason why chapter II is
focusing on the Ebro Estuary riverine-marine boundary. Since, estuaries provide the
potential to study benthic ecology of highly dynamic systems, in both
physicochemical and biological terms. Additionally, the transition between fresh and
marine communities, containing specialized euryoecious taxa, may be of a particular
importance in the study of patterns and ecological processes, over a community
dominated by species at the extreme of their range of tolerance. Some authors
realized about the relevance of ecological boundaries in ecosystems processes (e.g.
immigration, emigration, species replacement, edge effects) and so they focused part
of their research in estuarine boundaries (e.g. Attrill and Rundle, 2002; Elliot and
Whitfield, 2011; Whitfield et al., 2012; Basset et al., 2013; Conde et al., 2013), in
these cases the research was conducted in mixed estuaries. The present thesis studies,

GENERAL DISCUSSION
162
for the first time, benthic macroinvertebrates along the whole length of a salt wedge
Mediterranean estuary, including freshwater stretch potentially reachable by marine
intrusion in natural regime conditions (mainly in summer or drought periods). The
transition between fresh and estuarine systems in this kind of estuary represents a
unique boundary in temperate estuaries, which is another relevant reason for
promoting the Ebro Estuary conservation.
The use of univariate and multivariate statistical analyses allowed to distinguishing
different regions within the Ebro Estuary according to their macrofauna and in
concordance with environmental scenario previously discussed (see Chapters I, II).
Salinity gradient and sediment grain size are the main abiotic factors affecting
ecological, chemical and physical characteristics of estuaries, and consequently
biological communities distribution (Remane and Schlieper, 1971; Dauer, 1993;
Ysebaert et al., 1993; Attrill and Thomas, 1996; Mannino and Montagna, 1997;
Edgar et al., 1999; among others). Well mixed estuaries have a relatively extensive
boundary or gradient zone where fresh and marine water encounter, this gradient
zone allows the exchange of suspended materials, organisms and obviously salts that
creates the salinity gradient; for this reason, this boundary represents composite
ecosystems where the exchange of materials and organisms is inherent to the water
mixing. However, in highly stratified estuaries, the salt wedge represented an actual
barrier between fresh and marine environments; the lack of powerful mixing drivers
such as tides, waves, currents and winds, restricts the exchange of materials and
organisms. The friction between descending superficial freshwater layer, with
ascending deeper and denser marine layer, creates turbulence waves resulting in
water mixing; but still, the power of this friction is not enough to break down the
stratification or create a salinity gradient; but in turn, allows the formation of an
interface layer, the halocline or pycnocline, within this thin layer occur the water
mixing and the exchange (mostly by entrainment) of materials and salts.
In the case of the Ebro Estuary, the discharge regulation reduces flow velocity,
softening turbulence and so the mixing between fresh and marine water layers. Thus,
GENERAL DISCUSSION
163
the halocline in the estuary is well established (Sierra et al., 2004). The thickness and
depth of the halocline decreases landwards in the same way as the turbulence power
(Sierra et al., 2004); consequently, the gradient zone in the estuary bottom is a
narrow area located in the salt wedge tip (null point) where the halocline meet
bottom. The confined gradient area, between the two homogeneous ecosystems
identified in the Ebro Estuary (UE and LE stretches), has extreme consequences on
the ecology of benthic communities. A sharp spatial change in ecosystem features
implies stressful condition for biota, the ecological optimum of species is rapidly
exceeded. In general, organisms have two alternatives when encountering stressful
conditions: either they migrate to more favorable environments, or they remain trying
to accommodate to the changing conditions; nevertheless, only euryoecious species
are able to survive due to a remarkable range of physiological adaptations to variable
environmental conditions (Brusca and Brusca, 1990). Species inhabiting a specific
ecosystem usually have similar tolerance ranges and their ecophysiological
constraints prevent the pass from one ecosystem to another if changes are not
gradual. The exchange of species between stretches in the estuary is inexistent and
the replacement of species is almost total (only a few specialized species are able to
withstand this great variation e.g. nereid polychaetes). This community distribution is
known as turnover pattern, and usually occurs in contrasting boundary ecosystems
e.g. sea-surface microlayer, lotic-lentic systems. On the contrary, a wider gradient
area or extensive boundary (as found in well mixed estuaries) allows species to resist
to slight and gradual changes in environmental features; this helps species to colonize
a more extensive area within estuaries, and only when the tolerance range of species
is gradually exceeded, they disappear. Therefore the exchange of species is greater
comparing with salt wedge estuaries. This distribution pattern of overlapped
populations i.e. nestedness, is commonly found in well-mixed estuaries (Attrill and
Rundle, 2002) and other merging ecosystems e.g. intertidal areas, forest-meadow
transition.

GENERAL DISCUSSION
164
Regarding salt wedge estuaries, and more specifically to the Ebro Estuary, there was
a lack of functioning of riverine-marine boundary research, for this reason one of the
main outcomes of this dissertation, together with the community turnover, was the
identification of ecotonal boundary characteristics (abrupt change in environmental
conditions, community shift and narrow transition zone between two homogeneous
ecosystems) (see Chapter II). Probably the ecotonal perception within the Ebro
Estuary was exaggerated by the artificial stability in salt wedge hydrodynamics, as a
result of anthropogenic activity (mainly water abstraction and regulation) as
suggested by Acha et al. (2015). Another characteristic of the Ebro Estuary boundary
was the richness impoverishment tendency towards the null point; this bias was
observed for both fresh and estuarine communities, and it was discussed in detail in
chapters II and III. Several plausible causes were suggested in these chapters e.g.
the sharp environmental change, the nutrient enrichment, hypoxia gradients or
limited dispersal abilities; among others. As stated in the chapter III, these causes
seemed to be cumulative and not mutually exclusive; but, in ecological boundary
terms, this trend can be attributable to the edge effects concept: referred to changes in
population sizes, species richness, or other aspects of the ecology of individuals,
populations, or communities at the boundary between two adjacent habitats (Baker et
al., 2002; Levin, 2009). The edge effects at the riverine-marine boundary of the Ebro
Estuary have a negative influence over the biological communities; probably due to
the harsh conditions close to salt wedge tip: salinity change, no net water movement
(for this reason is denominated null point), sedimentation, pollutants accumulation
and water mixing turbulence, converting it in an high stressful area; the stress
increasing is a main factor causing simplification in communities (Martin et al.,
1993; Saiz-Salinas and González-Oreja, 2000; Sousa et al., 2006). Additionally,
anthropic disturbances can exacerbate the edge effects because they usually intensify
the connectivity loss among adjacent habitats (Levin, 2009). Despite the natural-
origin of this estuarine boundary and its intrinsic low connectivity (density difference
between layers prevail over mixing drivers), the altered hydrodynamics of the salt
wedge reduce the natural connectivity between fresh and marine habitats; steady and

GENERAL DISCUSSION
165
predictable river discharges reduces the water mixing, the organisms exchange, the
possibility stratification break due to flow pulses, the materials and organic matter
removal; and therefore, edge effects are more pronounced than those expected from
natural regime flows.
Regardless the lacking of a well stablished salinity gradient, the Ebro Estuary shared
relevant characteristics that are intrinsic of well mixed estuaries; the
macroinvertebrate community impoverishment tendency landwards was similar to
those described for other estuaries (Remane, 1934; Rundle et al., 1998; Attrill, 2002;
Attrill and Rundle, 2002; Whitfield et al., 2012; Barros et al., 2014); and the
community composition has typical estuarine species (as shown in the previous
section). These findings evidence that in spite of the special characteristics of the
Ebro Estuary and, not only in ecological functioning but also in its influence over
macroinvertebrate community, the community response is analogous to those
recorded for well mixed estuaries and the only difference is the way that ecological
processes occur in the Ebro Estuary e.g. sharp changes instead gradual ones or
confined instead extensive gradients.
5.3 Assessing the anthropogenic pressures on the Ebro Estuary and the potential of
macroinvertebrates as bioindicators in estuarine environments.
As shown in the general introduction section, the estuaries are aquatic ecosystems
especially susceptible of suffering many forms of anthropogenic stress. Estuaries
together with coral reefs, are considered the most threatened among the coastal
ecosystems (Millennium Ecosystem Assessment, 2005). Despite the strong
environmental legislation promulgated with the aim to preserve aquatic ecosystems
around the world e.g. CWA, WFD; they keep deteriorating as a result of human’s
actions for example dredging, damming or water withdrawal and regulation in the
Ebro Estuary. The biological resources (not only biodiversity per se) in aquatic
ecosystems are still declining, and the aquatic biota has become homogenized by

GENERAL DISCUSSION
166
local extinction events, the introduction of alien species, and genetic diversity loss
(Karr and Chu, 1999, and references therein). The explanation is simple, humans
degrade aquatic ecosystems in numerous ways; in order to illustrate the origin of
environmental degradation of Ebro Delta-Estuary complex, an adaptation of
Vasconcelos et al. (2007) conceptual model (developed for Portuguese estuaries) is
presented in the figure 5.1. This conceptual model shows the main pressure sources
(Population, Industry, Agriculture, Fishing, Dredging, Port Activities and
Regulation) impairing the Ebro Delta-Estuary complex. Together, all these pressures
are breaking its ecological balance and disrupting its biological communities
(Chapter III). As can be seen in the model, the ecological endpoints are caused by
the synergistic interaction among pressures and impacts and not only by a one single
factor. In fact, this model can be applied for elsewhere estuary in the world, because
the enumerated pressures, impacts and effects represented are a widespread issue
concerning estuarine ecosystems (Extence et al., 1999; Solis-Weiss et al., 2004;
Marín-Guirao et al., 2005; Millennium Ecosystem Assessment, 2005; Muxika et al.,
2005; Vasconcelos et al., 2007; Day et al., 2012).
Among the numerous pressures and impacts identified in the figure 5.1, river flow
regulation and organic-nutrient enrichment were recognized as the most important
disrupting the estuarine condition, and therefore, biological communities (Nebra et
al., 2011; Rovira et al., 2012b). The chapter III of this dissertation focused on the
screening of macroinvertebrate based indices and metrics that could potentially be
used to assess the ES of Mediterranean estuaries. This was done under the guidance
of the WFD, i.e. analyzing the response of indices and metrics to the main human
induced pressures by means the use of biological monitoring procedures, assessment
tools based on bioindicators or BQEs, e.g. macroinvertebrates. Human life depends
on biological systems for food, air, water, climate control, waste assimilation and
other essential goods and services (Costanza et al., 1997); this is the main reason to
assess aquatic ecosystems in terms of their biological condition (not only paying
attention to chemical condition), and the unique criteria for judging if an anthropic

GENERAL DISCUSSION
167
Fig
ure
5.1
. E
colo
gica
l co
ncep
tual
mod
el f
or t
he a
sses
smen
t of
the
mai
n pr
essu
res
impa
irin
g th
e E
bro
Del
ta-E
stua
ry c
ompl
ex
(mod
ifie
d fr
om V
asco
ncel
os e
t al.,
200
7)
Ecological endpoints
Changes
in
Ebro
Delta-
Est
uar
y eco
syst
em f
unct
ionin
g a
nd e
colo
gy
Decr
ease
in n
atura
l pro
duct
ivity
Bio
div
ersi
ty h
om
ogen
izat
ion a
nd loss
Incr
ease
in o
rgan
ism
s
mort
ality
Dim
inis
hed
fo
od
avai
labili
ty
Dec
reas
e o
f es
tuar
ine
nurs
ery
funct
ion
Loss
of es
tuar
ine
nat
ura
l pro
tect
ion
Shift
in c
om
munitie
s (e
colo
gic
al
guild
s) t
rophic
re
lationsh
ips
Incr
ease
d v
uln
erab
ility
to
opport
unis
tic
inva
der
s
Dec
reas
e in m
igra
tory
sp
ecie
s a
nd
alte
red
mig
rato
ry pat
tern
s
Impacts
Chem
ical
pol
lution
Nutr
ient
enrich
men
t
Eutr
ophic
atio
nW
ater
and s
edim
ent
qual
ity
deg
radat
ion
Conta
min
ants
bio
accu
mula
tion
Dir
ect
chan
ges
ove
r sa
lt
wed
ge
dyn
amic
s
Sea
lev
el r
ise
Tem
per
ature
rise
Spec
ies
repla
cem
ent
Pollu
ted
wat
er
run o
ff Sew
age
dis
char
ges
Was
tetr
eatm
ent
Pressures
Indust
ry
effluen
t dis
char
ges
Was
te
dis
char
ges Gen
etic
and
exot
ic
spec
ies
intr
oduct
ion S
edim
ent
rem
ova
l
Con
tam
inat
ion
resu
spen
sion
Incr
ease
d
wat
er
turb
idity
Exo
tic
spec
ies
intr
oduct
ion
Pollu
ted
wat
er r
un
off
Sed
imen
t re
tention
Fres
hw
ater
ab
stra
ctio
n
and
regula
tion
Clim
ate
chan
ge
Ove
rfis
hin
g
Bar
rier
to
mig
rato
ry
fish
esLa
nd
impoundm
ents
an
d r
ecla
mat
ion
Boa
ting
pre
ssure
Popula
tion
Indust
ryA
gri
culture
Aquacu
lture
Regula
tion
OriginPo
rt a
nd
nav
igation
Act
ivitie
s
Dre
dgin
gFi
shin
g
Ben
thic
org
anis
ms
mort
ality
Sal
tmar
sh, ee
lgra
ss a
nd
inte
rtid
al f
lats
des
truct
ion
Loss
of
hab
itat
Pest
icid
es
and
Her
bic
ides
Fert
ilize
rs
Subst
rate
des
truct
ion

GENERAL DISCUSSION
168
activity has an impact, must be explicitly biological (Karr and Chu, 1999); in
conclusion, biological monitoring is the basis for biological resources protection.
The terms bioindicator or BQE are referred for those species or groups of species that
can be used to monitor the environment or ecosystem health. Bioindicators have the
ability of reveal the qualitative status of the environment by means of measurable
attributes (e.g. richness, relative abundance or trophic structure). Macroinvertebrates
are usually employed as bioindicators due to their sensitiveness to environmental
variability (natural disturbances or human-induced impacts). The results obtained in
the chapter III confirmed the bioindicator potential of macroinvertebrates; since, the
community responses to environmental changes in the Ebro Estuary were evident
along spatial and temporal scales, demonstrating their sensitiveness. The impact
concept has an intrinsic pejorative or negative mean. However, the human-induced
environmental disturbances can cause positive or negative effects over biological
communities. According to this, and with the first section of general discussion
(Recent changes on estuary environmental condition and its influence over benthic
macroinvertebrate community), it is expected that a good and suitable bioindicator
would be able to reveal both positive and negative effects by means of measurable
responses. In the case of Ebro Estuary, an example of measurable positive response
is the community richness, abundance and complexity achieved, after long periods of
altered salt wedge hydrodynamics (hydrological pressure). On the contrary,
community impoverishment (richness and abundance) towards null point is a good
example of negative response to impacts or environmental degradation (pollution
pressure) (for detailed discussion see chapter III).
The main outcomes obtained in the chapter III were concerning ES assessment
difficulties in estuarine environments due to their particular ecological
characteristics. When trying to evaluate the effects of human-induced impacts over
macroinvertebrate community, there are numerous biological community attributes
that can be measured (quantified mainly as a metrics or BIs) to reveal that effect
(Figure 5.2). However, only certain attributes provide useful and reliable
GENERAL DISCUSSION
169
information; therefore, the selection of which ones are characterizing properly the
impact is a difficult task. For example, several metrics and BIs (e.g. richness,
abundance, IBMWP and M-AMBI) showed a significant negative correlation with
the assessed pressures e.g. pollution pressure. At the same time, there is a point
related with metrics and BIs suitability, the relevance of previous knowledge about
their PRIP in the assessment process (Karr and Chu, 1999). Sometimes, assessment
tools, i.e. metrics and BIs, can show a significant correlation with any pressure, for
example the case of BENTIX and BOPA indices in relation with pollution pressure
(see table 3 of chapter III). According to their PRIP, it is expected lower ES ratings
with increasing pressure, but the results were just the opposite. Both indices gave
higher ES ratings to those stations with impoverished macroinvertebrate community,
and vice versa. Then, a priori knowledge of their PRIP, allowed identifying the
mismatch between expected and final responses, consequently both BIs were
discarded for the assessment. For this reason, it is essential for a correct assessment
to known metrics and BIs PRIP, with the aim to understand and interpret properly the
results that are giving.
Additionally, the PRIP information allowed identifying a relevant and paradoxical
result in the case of the Ebro Estuary pressures assessment. The outcomes of chapter
III revealed that none BQE showed the same sensitiveness to the different pressures
disrupting an ecosystem.
Most assessment tools developed in recent studies (Grall and Glémarec, 1997;
Weisberg et al., 1997; Borja et al., 2000; Simboura and Zenetos, 2002; Rosenberg et
al., 2004) have been based on Pearson and Rosenberg (1978) model; this authors
state that macrofaunal communities change in diversity, abundance and species
composition according to their intolerance along a gradient of organic enrichment.
Dauvin and Ruellet (2007) developed a specific BI to assess the impact of oil spills
in marine environments; thus, the great majority of these tools are based on chemical
pollution paradigms. However, many of these BIs have been applied indiscriminately
to detect a great variety of anthropogenic disturbances; such as, dredging, dumping,
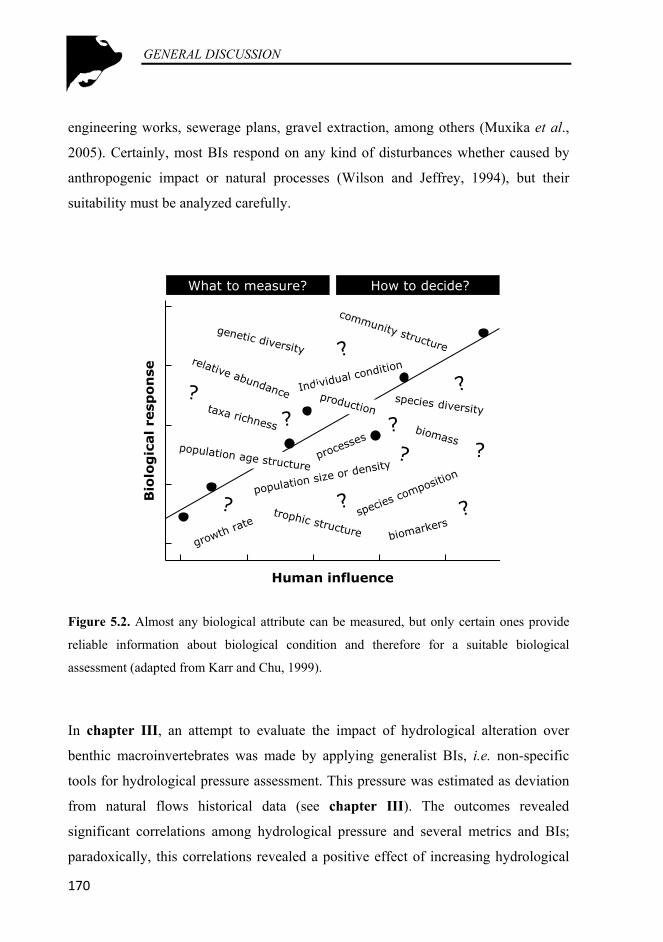
GENERAL DISCUSSION
170
engineering works, sewerage plans, gravel extraction, among others (Muxika et al.,
2005). Certainly, most BIs respond on any kind of disturbances whether caused by
anthropogenic impact or natural processes (Wilson and Jeffrey, 1994), but their
suitability must be analyzed carefully.
Figure 5.2. Almost any biological attribute can be measured, but only certain ones provide
reliable information about biological condition and therefore for a suitable biological
assessment (adapted from Karr and Chu, 1999).
In chapter III, an attempt to evaluate the impact of hydrological alteration over
benthic macroinvertebrates was made by applying generalist BIs, i.e. non-specific
tools for hydrological pressure assessment. This pressure was estimated as deviation
from natural flows historical data (see chapter III). The outcomes revealed
significant correlations among hydrological pressure and several metrics and BIs;
paradoxically, this correlations revealed a positive effect of increasing hydrological
Human influence
Bio
log
ical re
spo
nse
What to measure? How to decide?

GENERAL DISCUSSION
171
alteration over macroinvertebrate community. The increase of salt wedge
permanence promoted the substitution of the macroinvertebrate community, by other
best structured and integrated by typical members of coastal marine areas; this
caused an overestimation of all community parameters and therefore of the ES. Then,
the positive effect described was actually a negative effect; since species substitution
is a typical impact in hydrological disrupted ecosystems; for example, the river
stretch affected by the increase in velocity flow regimes due to hydroelectric power
plant activity. The new velocity regimes imply the establishment of rheophilic
species or substitution of detritivores by scrapers or filter feeders specialist.
Alterations in community structure may occur as a direct consequence of varying
flow patterns or indirectly through associated habitat change (Extence et al., 1999),
as in the hydroelectric plant or as in the Ebro Estuary examples respectively.
In the Mediterranean region, the associated impacts to hydrological pressures are
magnified by the strong seasonality. Thus, human responses to assure water
resources for industrial and domestic consumption involve strong flow regulation
measures that frequently disrupt aquatic ecosystems (Caiola et al., 2001a, b).
Hydrological issues are gaining relevance on ES assessment in relation to water and
sediment quality (chapter III), not only by the strong regulation in the basins, but
also by the global climate change. Global warming is changing weather patterns
causing alterations on hydrological regime, periods of drought are becoming more
frequent (Mawdsley et al., 1994) and declines in precipitation is resulting in
diminished or disappearing river flows (Extence et al., 1999). The lack of suitable
assessment tools to appraise hydrological alteration, adds another limitation on the
TWs assessment process. It is important to consider overall hindrances and
limitations concerning TWs for achieving a suitable ES assessment. Common issues
for TWs assessment are the reference conditions description or typologies
identification in this heterogeneous group. Additionally, the particular characteristics
of each study case may influence the assessment reliability as demonstrated chapter
III outcomes. Regarding the biological monitoring, some criticisms were related with

GENERAL DISCUSSION
172
the use of BIs, (i) they represent a static expression of ecological status; (ii) they are
not explicitly linked to changes in ecological function; (iii) they may not be specific
with respect to different kinds of stressors; (iv) they are subject to underlying
taxonomic changes across estuarine gradients; (v) they can be labor intensive (e.g.,
sorting specimens and taxonomic identification); and (vi) they are not applied
consistently across biogeographic areas (Racocinski and Zapfe, 2005). In conclusion,
the research on estuarine ecosystems, and concretely in salt wedge Mediterranean
estuaries, represents an attractive challenge in terms of biological, ecological and
preservation perspectives.
5.4. References
Acha, E.M., Piola, A., Iribarne, O., Mianzan, H., 2015. Ecological Processes at
Marine Fronts: Oases in the ocean. Springer Briefs in Environmental Science
Alber, M., 2002. A conceptual model of estuarine freshwater inflow management.
Estuaries 25, 1246-1261.
Assessment, M.E., 2005. Ecosystems and human well-being: wetlands and water.
World Resources Institute, Washington, DC.
Attrill, M.J., 2002. A testable linear model for diversity trends in estuaries. Journal of
Animal Ecology 71, 262-269.
Attrill, M.J., Rundle, S.D., 2002. Ecotone or ecocline: Ecological boundaries in
estuaries. Estuar. Coast. Shelf Sci. 55, 929-936.
Attrill, M.J., Thomas, R.M., 1996. Long-term distribution patterns of mobile
estuarine invertebrates (Ctenophora, Cnidaria, Crustacea: Decapoda) in
relation to hydrological parameters. Marine Ecology Progress Series 143, 25-
36.

GENERAL DISCUSSION
173
Baker, J., French, K., Whelan, R.J., 2002. The edge effect and ecotonal species: bird
communities across a natural edge in southeastern Australia. Ecology 83,
3048-3059.
Barros, F., Blanchet, H., Hammerstrom, K., Sauriau, P.-G., Oliver, J., 2014. A
framework for investigating general patterns of benthic β-diversity along
estuaries. Estuarine, Coastal and Shelf Science 149, 223-231.
Basset, A., Barbone, E., Elliott, M., Li, B.-L., Jorgensen, S.E., Lucena-Moya, P.,
Pardo, I., Mouillot, D., 2013. A unifying approach to understanding
transitional waters: fundamental properties emerging from ecotone
ecosystems. Estuarine, Coastal and Shelf Science 132, 5-16.
Borja, A., Franco, J., Pérez, V., 2000. A marine Biotic Index to establish the
ecological quality of soft-bottom benthos within European estuarine and
coastal environments. Marine Pollution Bulletin 40, 1100-1114.
Breault, R.F., Barlow, L.K., Reisig, K.D., Parker, G.W., 1999. Spatial distribution,
temporal variability, and chemistry of the salt wedge in the lower Charles
River. Massachusetts, June.
Brown, S.S., Gaston, G.R., Rakocinski, C.F., Heard, R.W., 2000. Effects of sediment
contaminants and environmental gradients on macrobenthic community
trophic structure in Gulf of Mexico estuaries. Estuaries 23, 411-424.
Brusca, R.C., Brusca, G.J., Haver, N.J., 1990. Invertebrates. Sinauer Associates
Sunderland, Massachusetts.
Caiola, N., Vargas, M.J., de Sostoa, A., 2001a. Feeding ecology of the endangered
Valencia toothcarp, Valencia hispanica (Actinopterygii : Valenciidae).
Hydrobiologia 448, 97-105.
Caiola, N.A., Vargas, M.J., de Sostoa, A., 2001b. Life history pattern of the
endangered Valencia toothcarp, Valencia hispanica (Actinopterygii:

GENERAL DISCUSSION
174
Valenciidae) and its implications for conservation. Archiv Fur Hydrobiologie
150, 473-489.
Cartes, J.E., Ligas, A., De Biasi, A.M., Pacciardi, L., Sartor, P., 2009. Small-spatial
scale changes in productivity of suprabenthic and infaunal crustaceans at the
continental shelf of Ebro Delta (western Mediterranean). Journal of
Experimental Marine Biology and Ecology 378, 40-49.
Cartes, J.E., Papiol, V., Palanques, A., Guillén, J., Demestre, M., 2007. Dynamics of
suprabenthos off the Ebro Delta (Catalan Sea: western Mediterranean):
Spatial 13 and temporal patterns and relationships with environmental
factors. Estuarine, Coastal and Shelf Science 75, 501-515.
Casamayor, E.O., Garcia-Cantizano, J., Mas, J., Pedros-Alio, C., 2001. Primary
production in estuarine oxic/anoxic interfaces: contribution of microbial dark
CO2 fixation in the Ebro River Salt Wedge Estuary. Marine Ecology-
Progress Series 215, 49-56.
Conde, A., Novais, J.M., Domínguez, J., 2013. Intertidal macrofauna and
environmental stress at a riverine-marine boundary. Marine Environmental
Research 92, 1-9.
Correll, D.L., 1999. Phosphorus: a rate limiting nutrient in surface waters. Poultry
Science 78, 674-682.
Costanza, R., d'Arge, R., De Groot, R., Farber, S., Grasso, M., Hannon, B., Limburg,
K., Naeem, S., O'Neill, R.V., Paruelo, J., 1997. The value of the world's
ecosystem services and natural capital. Ecological economics 1, 3-15.
Dauer, D.M., 1993. Biological criteria, environmental-health and estuarine
macrobenthic community structure. Marine Pollution Bulletin 26, 249-257.
Dauvin, J.C., Ruellet, T., 2007. Polychaete/amphipod ratio revisited. Marine
Pollution Bulletin 55, 215-224.

GENERAL DISCUSSION
175
Day Jr, J.W., Kemp, W.M., Alejandro, Y., Crump, B.C., 2012. Estuarine ecology.
John Wiley & Sons, New York.
De Juan, S., Cartes, J.E., 2011. Influence of environmental factors on the dynamics
of macrobenthic crustaceans on soft-bottoms of the Ebro Delta continental
shelf (northwestern Mediterranean). Scientia Marina 75, 691-700.
Drinkwater, K.F., Frank, K.T., 1994. Effects of river regulation and diversion on
marine fish and invertebrates. Aquatic Conservation-Marine and Freshwater
Ecosystems 4, 135-151.
Edgar, G.J., Barrett, N.S., Graddon, D.J., Last, P.R., 2000. The conservation
significance of estuaries: a classification of Tasmanian estuaries using
ecological, physical and demographic attributes as a case study. Biological
Conservation 92, 383-397.
Edgar, G.J., Barrett, N.S., Last, P.R., 1999. The distribution of macroinvertebrates
and fishes in Tasmanian estuaries. Journal of Biogeography 26, 1169-1189.
Elliott, M., Whitfield, A.K., 2011. Challenging paradigms in estuarine ecology and
management. Estuarine, Coastal and Shelf Science 94, 306-314.
Extence, C.A., Balbi, D.M., Chadd, R.P., 1999. River flow indexing using British
benthic macroinvertebrates: a framework for setting hydroecological
objectives. Regulated Rivers Research & Management, 545-574.
Grall, J., Glemarec, M., 1997. Using biotic indices to estimate macrobenthic
community perturbations in the Bay of Brest. Estuar. Coast. Shelf Sci. 44,
43-53.
Guillen, J., Palanques, A., 1992. Sediment dynamics and hydrodynamics in the lower
course of a river highly regulated by dams: the Ebro River. Sedimentology
39, 567-579.

GENERAL DISCUSSION
176
Guillen, J., Palanques, A., Diaz, J., 1992. Cuantificación y evolución durante el siglo
XX de los aportes de sedimento transportado como carga de fondo por el río
Ebro al medio marino. Rev. Soc. Geol. España 5, 1-2.
Holland, A.F., Shaughnessy, A.T., Hiegel, M.H., 1987. Long-term variation in
mesohaline Chesapeake Bay macrobenthos: spatial and temporal patterns.
Estuaries 10, 227-245.
Ibáñez, C., 1993. Dinamica hidrologica i funcionament ecologic del tram estuari del
Ebre. Tesi doctoral. Universitat de Barcelona. Barcelona.
Ibáñez, C., Alcaraz, C., Caiola, N., Rovira, A., Trobajo, R., Alonso, M., Durán, C.,
Jiménez, P.J., Munné, A., Prat, N., 2012a. Regime shift from phytoplankton
to macrophyte dominance in a large river: Top-down versus bottom-up
effects. Science of the Total Environment 416, 314-322.
Ibáñez, C., Caiola, N., Rovira, A., Real, M., 2012b. Monitoring the effects of floods
on submerged macrophytes in a large river. Science of the Total
Environment 440, 132-139.
Ibanez, C., Prat, N., Canicio, A., 1996. Changes in the hydrology and sediment
transport produced by large dams on the lower Ebro river and its estuary.
Regulated Rivers-Research & Management 12, 51-62.
Ibáñez, C., Prat, N., Durán, C., Pardos, M., Munné, A., Andreu, R., Caiola, N., Cid,
N., Hampel, H., Sánchez, R., Trobajo, R., 2008. Changes in dissolved
nutrients in the lower Ebro River: Causes and consequences. Limnetica 27,
131-142.
Ibáñez, C., Rodrigues-Capitulo, A., Prat, N., 1995. The combined impacts of river
regulation and eutrophication on the dynamics of the salt wedge and the
ecology of the lower Ebro River (north-east Spain), Ecological Basis for
River Management, pp. 105-113.

GENERAL DISCUSSION
177
Jordana, E., Pinedo, S., Ballesteros, E., 2015. Macrobenthic assemblages, sediment
characteristics and heavy metal concentrations in soft-bottom Ebre Delta
bays (NW Mediterranean). Environmental monitoring and assessment 187,
1-17.
Karr, J.R., Chu, E.W., 1999. Restoring life in running waters: better biological
monitoring. Island Press.
Kurup, G.R., Hamilton, P., Patterson, J.C., 1998. Modelling the effect of seasonal
flow variations on the position of salt wedge in a microtidal estuary. Estuar.
Coast. Shelf Sci. 47, 191-208.
Largier, J.L., 1993. Estuarine fronts - how important are they. Estuaries 16, 1-11.
Levin, S.A., Carpenter, S.R., Godfray, H.C.J., Kinzig, A.P., Loreau, M., Losos, J.B.,
Walker, B., Wilcove, D.S., 2009. The Princeton guide to ecology. Princeton
University Press.
Mannino, A., Montagna, P.A., 1997. Small-scale spatial variation of macrobenthic
community structure. Estuaries 20, 159-173.
Marin-Guirao, L., Cesar, A., Marin, A., Lloret, J., Vita, R., 2005. Establishing the
ecological quality status of soft-bottom mining-impacted coastal water
bodies in the scope of the Water Framework Directive. Marine Pollution
Bulletin 50, 374-387.
Martin, D., Ballesteros, E., Gili, J.M., Palacin, C., 1993. Small-scale structure of
infaunal polychaete communities in an estuarine environment -
methodological approach. Estuar. Coast. Shelf Sci. 36, 47-58.
Mawdsley, J., Petts, G.E., Walker, S., 1994. Assessment of drought severity. Institute
of Hydrology.
Muñoz, I., 1990. Limnologia de la part baixa del riu Ebre i els canals de reg: els
factors fisico-quimics, el fitoplancton i els macroinvertebrats bentonics. Tesi
doctoral. Universitat de Barcelona. Barcelona.
GENERAL DISCUSSION
178
Muxika, I., Borja, A., Bonne, W., 2005. The suitability of the marine biotic index
(AMBI) to new impact sources along European coasts. Ecological Indicators
5, 19-31.
Nebra, A., Caiola, N., Ibanez, C., 2011. Community structure of benthic
macroinvertebrates inhabiting a highly stratified Mediterranean estuary.
Scientia Marina 75, 577-584.
Rakocinski, C.F., Zapfe, G.A., 2005. Macrobenthic process indicators of estuarine
condition. Estuarine indicators. CRC Press, Boca Raton, FL, 315-331.
Remane, A., 1934. Die brackwasserfauna. Verhandlungen der Deutschen
Zoologischen Gesellschaft 36, 34-74.
Remane, A., Schlieper, C., 1971. Biology of brackish water. Wiley (Interscience),
New York.
Rosenberg, R., Blomqvist, M., Nilsson, H.C., Cederwall, H., Dimming, A., 2004.
Marine quality assessment by use of benthic species-abundance distributions:
a proposed new protocol within the European Union Water Framework
Directive. Marine Pollution Bulletin 49, 728-739.
Rovira, L., Trobajo, R., Leira, M., Ibáñez, C., 2012b. The effects of hydrological
dynamics on benthic diatom community structure in a highly stratified
estuary: the case of the Ebro Estuary (Catalonia, Spain). Estuarine, Coastal
and Shelf Science 101, 1-14.
Rundle, S.D., Attrill, M.J., Arshad, A., 1998. Seasonality in macroinvertebrate
community composition across a neglected ecological boundary, the
freshwater-estuarine transition zone. Aquatic Ecology 32, 211-216.
Saiz-Salinas, J.I., González-Oreja, J.A., 2000. Stress in estuarine communities:
lessons from the highly-impacted Bilbao estuary (Spain). Journal of Aquatic
Ecosystem Stress and Recovery 7, 43-55.

GENERAL DISCUSSION
179
Sardá, R., Martin, D., 1993. Populations of Streblospio (Polychaeta: Spionidae) in
temperate zones: demography and production. Journal of the Marine
Biological Association of the United Kingdom 73, 769-784.
Schroeder, W.W., Dinnel, S.P., Wiseman, W.J., 1990. Salinity stratification in a
river-dominated estuary. Estuaries 13, 145-154.
Sierra, J.P., Sanchez-Arcilla, A., Figueras, P.A., Del Rio, J.G., Rassmussen, E.K.,
Mosso, C., 2004. Effects of discharge reductions on salt wedge dynamics of
the Ebro River. River Research and Applications 20, 61-77.
Simboura, N., Zenetos, A., 2002. Benthic indicators to use in ecological quality
classification of Mediterranean soft bottom marine ecosystems, including a
new biotic index. Mediterranean Marine Science 3, 77-111.
Solis-Weiss, V., Aleffi, F., Bettoso, N., Rossin, P., Orel, G., Fonda-Umani, S., 2004.
Effects of industrial and urban pollution on the benthic macrofauna in the
Bay of Muggia (industrial port of Trieste, Italy). Science of the Total
Environment 328, 247-263.
Sousa, R., Dias, S., Antunes, J.C., 2006. Spatial subtidal macrobenthic distribution in
relation to abiotic conditions in the Lima estuary, NW of Portugal.
Hydrobiologia 559, 135-148.
Vasconcelos, R.P., Reis-Santos, P., Fonseca, V., Maia, A., Ruano, M., França, S.,
Vinagre, C., Costa, M.J., Cabral, H., 2007. Assessing anthropogenic
pressures on estuarine fish nurseries along the Portuguese coast: a multi-
metric index and conceptual approach. Science of the Total Environment
374, 199-215.
Weisberg, S.B., Ranasinghe, J.A., Dauer, D.M., Schaffner, L.C., Diaz, R.J., Frithsen,
J.B., 1997. An estuarine benthic index of biotic integrity (B-IBI) for
Chesapeake Bay. Estuaries 20, 149-158.

GENERAL DISCUSSION
180
Whitfield, A.K., Elliott, M., Basset, A., Blaber, S.J.M., West, R.J., 2012. Paradigms
in estuarine ecology-a review of the Remane diagram with a suggested
revised model for estuaries. Estuarine, Coastal and Shelf Science 97, 78-90.
Wilson, J.G., Jeffrey, D.W., 1994. Benthic biological pollution indices in estuaries.
Biomonitoring of Coastal Waters and Estuaries. CRC Press, Boca Raton,
Florida, 311-327.
Ysebaert, T., Meire, P., Maes, D., Buijs, J., 1993. The benthic macrofauna along the
estuarine gradient of the Schelde estuary. Netherland Journal of Aquatic
Ecology 27, 327-341.

181
6 CONCLUSIONS
The main conclusions of this dissertation are the following:
1. As a consequence of the altered salt wedge dynamics, the Ebro Estuary can
be divided into two separate functional units (upper and lower stretches) in terms of benthic environmental condition and macroinvertebrate community. Upwards the salt wedge, a riverine ecosystem was found without marine influence and colonized by a freshwater community. Conversely, the estuarine ecosystem was represented in the salt wedge stretch, highly influenced by marine intrusion, not only defining benthic environmental condition, but also determining macroinvertebrate community.
2. The long periods of salt wedge state were provoked due to flow regulation and water abstraction in the lower Ebro River. Regulation maintained the river discharge under the limit of marine intrusion penetration, allowing the establishment of the salt wedge and avoiding the formation of the ‘fluvial estuarine stretch’.
3. Current macroinvertebrate community composition of the Ebro Estuary differed considerably from the community found in the early 90’s, when the anoxic conditions below the halocline, caused by an excess of eutrophic origin organic matter inputs, prevented the establishment of benthic biological communities.
4. The Ebro estuary showed an exceptionally rich and complex macroinvertebrate community (comprising 213 different taxa) when compared to other temperate estuaries. Mollusks, polychaetes and crustaceans were the dominant groups in both richness and abundance.
5. In spite of the obvious ecological differences between well-mixed temperate estuaries and the Ebro Estuary, the species-complex found were similar to those found inhabiting other European estuaries. Close to the null point, the community was dominated by the eurybiontic taxa like Hediste diversicolor,

CONCLUSIONS
182
Perinereis cultrifera, Heteromastus filiformis, Corophium orientale and Cyathura carinata; these species are also very common in the oligohaline area of European estuaries.
6. The trophic structure found in the Ebro Estuary was represented by six different trophic guilds; this fact demonstrated that diverse food resources were available.
7. The increasing permanence in salt wedge was related to the increase in richness and abundance in the lower stretch of the estuary; the longer the salt wedge period, the most complex community found. Macroinvertebrates colonization was mainly linked to their dispersal abilities. In spite of being limited by the low marine intrusion ascending velocity, the long periods of salt wedge provideg enough time to assure the colonization of this stretch.
8. The lack of powerful mixing drivers maintained the water column stratified in those sampling stations occupied by marine intrusion. As a consequence, the exchange of materials, salts and organisms was scarce; the lack of a real salinity gradient implied that species must cope with a sudden salinity changes. The salinity was the main driver structuring the benthic macroinvertebrate communities in the Ebro Estuary; there are other environmental parameters causing variation in the community but at smaller scale.
9. The Ebro Estuary riverine-marine boundary fitted with an ecotone model; it showed a narrow transitional interface, characterized by the rapid change between two different homogeneous communities and environments.
10. The Ebro Estuary macroinvertebrate community showed a total replacement or turnover distribution pattern upstream and downstream the salt wedge; only a few eurybiontic species were able to colonize both fresh and marine water environments. These species were dominant in the proximities of the null point, but their presence in distant sampling stations was anecdotal.
11. The null point area of the Ebro Estuary showed the lowest richness and density values; therefore it could be considered analogous to the ‘Artenminimum zone’ described for well-mixed temperate estuaries. Whereas null point is the most stressful area within Ebro Estuary, the
CONCLUSIONS
183
‘Artenminimum zone’ is the oligohaline area in mixed estuaries and it represents the most stressful conditions within a mixed estuary.
12. The main anthropogenic pressures affecting the Ebro estuary are the nutrient enrichment and the alteration of its hydrological regime. Nutrient loadings of the Ebro River are consequence of the inputs from agriculture and urban areas on the whole basin; whereas, hydrological alteration is a consequence of the regulatory effect exerted over flows by reservoirs located in the lower Ebro River.
13. During the last decade, the chemical status of the Ebro Estuary has clearly improved, the nutrient inputs, especially phosphorus, have considerably decreased in the whole basin dimming river eutrophication, the organic matter input decrease alleviating the impacts over the estuary bottom; and nowadays, hypoxic events are unusual and so the aerobic processes are not restricted
14. The chemical condition of Ebro estuary improved since the mid 90’s decade; as a result, the macroinvertebrate community was able to recolonize the Ebro Estuary benthos. This fact evidence that when environmental condition is improved, the biological communities respond positively aiding to the ecological balance recovery.
15. The flow regulation is disrupting the ecological balance of the lower Ebro River and its estuary in numerous ways: by maintaining a decreasing tendency of annual mean flow due to constant increment on water demand, by homogenizing river discharge and buffering the Mediterranean seasonality and by altering the salt wedge hydrodynamics.
16. Long periods of salt wedge permanence suppressed the water renewal and caused the accumulation of materials and pollutants towards the null point. Consequently, the increase in permanence time provoked a water quality declined upstream, creating a pollution and hypoxia gradient from river mouth to null point.
17. The macroinvertebrates community showed its ability to respond to main stressors affecting the Ebro Estuary. The community attributes declined towards the null point, the most impaired and stressful area within the estuary. Moreover, within the estuarine reach, the community shows a

CONCLUSIONS
184
paradoxical response, as hydrological alteration increased, the community achieved a greater complexity due to contribution of marine origin species colonizing the estuarine area.
18. The salt wedge hydrodynamics alteration caused the artificial stability in the environmental conditions; especially, eliminating hydrological stress associated to flow fluctuations. As a consequence, the estuarine community is substituted by other community best structured, integrated by typical marine species with a great complexity.
19. The ecological assessment and biological monitoring of the Ebro Estuary, and by extension, other salt wedge estuaries, should include specific tools for both fresh and marine water; because depending on river discharge the estuary may show different environmental conditions, from fully salt wedge state to fluvial estuarine stretch and all the intermediate situations.
20. The use of classical community parameters (density, abundance, biomass, richness and diversity indices), as complements to BIs assessment, improved the community response interpretation and helped to appraise the suitability and reliability of the BIs.
21. The TWs intrinsic assessment limitations, the discrepancies between BIs and the classification mismatch suggested that a different ES assessment approach for this heterogeneous WB group is necessary; especially in Mediterranean basins, where hydrological issues are gaining relevance on ES assessment with respect to water and sediment quality.
22. The conclusion extracted after the use of BIs, based on pollution paradigms, for the assessment of hydrological pressures related impacts, suggested that this approach is not the most appropriate.
23. The final conclusion is that the Ebro Estuary represents a unique ecosystem
in the Mediterranean region, its ecological singularity together with its
economic and social relevance imply that its conservation must be an
ineludible priority.

185
7 APPENDIX (ORIGINAL PUBLICATIONS)


Community structure of benthic macroinvertebrates inhabiting a highly stratified Mediterranean estuary
ALFONSO NEBRA, NUNO CAIOLA and CARLES IBÁÑEZ
IRTA Aquatic Ecosystems, Ctra. de Poble Nou, km 5.5, E-43540, Sant Carles de la Ràpita, Tarragona, Spain. E-mail: [email protected]
SUMMARY: The community composition and spatial distribution of benthic macroinvertebrates were studied along the Ebro estuary, a highly stratified estuary located in the NE Iberian Peninsula. During the last decade the oligotrophication process occurring in the lower Ebro River and its estuary has allowed a complex benthic macroinvertebrate community to become established; these results contrast with the poor community found there in the early nineties. A total of 214 taxa were identified, and polychaetes dominated the community both in abundance and species richness. The results showed spatial differences in the structure and composition of macroinvertebrates, which suggests that there are two distinct communities along the estuary. Each community was found in a specific stretch (upper and lower estuary) in function of the presence of the salt wedge. The macrobenthos of the upper estuary was dominated by freshwater taxa, but some euryhaline species were also found. The lower estuary showed a marine community typical of shallow Mediterranean environments. The transition between these two communities fits an ecotone model. The highest abundances, richness and diversities were recorded at the lower estuarine stations, especially those closer to the river mouth, whereas the lowest values corresponded to the stations adjacent to the tip of the salt wedge.
Keywords: benthic macroinvertebrates, community structure, distribution patterns, salt wedge, highly stratified estuary, Ebro estuary.
RESUMEN: Estructura de la comunidad de macroinvertebrados bentónicos en un estuario mediterráneo altamente estratificado. – La composición de la comunidad y la distribución espacial de los macroinvertebrados ben-tónicos ha sido estudiada a lo largo del estuario del Río Ebro, un estuario altamente estratificado localizado al NE de la Península Ibérica. El proceso de oligotrofización ocurrido durante la última década en el tramo bajo del río Ebro y su es-tuario, ha permitido el establecimiento de una compleja comunidad de macroinvertebrados, contrastando con la comunidad encontrada a principios de los noventa. Un total de 214 taxones fueron identificados; los poliquetos constituyeron el grupo dominante en términos de riqueza y abundancia. Los resultados mostraron diferencias espaciales en la estructura y compo-sición de macroinvertebrados, sugiriendo la existencia de dos comunidades diferentes a lo largo del estuario. Cada una de estas comunidades fue encontrada en un tramo específico (alto y bajo estuario) en función de la presencia de la cuña salina. El macrobentos del tramo alto del estuario estaba integrado mayoritariamente por taxones de agua dulce y algunos taxones eurihalinos. Por el contario, el tramo bajo presentó una comunidad marina típica de ambientes mediterráneos someros. La transición entre estas dos comunidades encajó con un modelo ecotonal. Las abundancias, riquezas y diversidades más eleva-das fueron registradas en las estaciones del tramo bajo, especialmente en aquellas cercanas a la desembocadura; en cambio, los valores más bajos correspondieron a las estaciones adyacentes al extremo de la cuña salina.
Palabras clave: macroinvertebrados bentónicos, estructura de la comunidad, patrones de distribución, cuña salina, estuario altamente estratificado, estuario del Ebro.
SCIENTIA MARINA 75(3)September 2011, 577-584, Barcelona (Spain)
ISSN: 0214-8358doi: 10.3989/scimar.2011.75n3577
INTRODUCTION
The Ebro estuary (NE, Iberian Peninsula) is a salt wedge or highly stratified estuary (Hansen and Rattray, 1966; Ibáñez et al., 1997). The specific characteristics
of salt wedge estuaries are: (i) the river discharge con-trols the marine intrusion mainly due to the low tidal range (usually with an amplitude less than 2 meters); (ii) weak mixing effects cause the water column to be strongly stratified; (iii) the vertical profile of density

578 • A. NEBRA et al.
SCI. MAR., 75(3), September 2011, 577-584. ISSN 0214-8358 doi: 10.3989/scimar.2011.75n3577
and salinity shows a marked change with a narrow in-terface between layers called haloclines; and (iv) the isohalines are arranged horizontally. Although this kind of estuary is well represented along microtidal coasts worldwide (e.g. the Mediterranean Sea and the Gulf of Mexico), there is little research on the mac-roinvertebrate communities that inhabit them. The Ebro estuary has been extensively studied in relation to its hydrology and salt wedge dynamics (e.g. Ibáñez et al., 1997, 1999; Sierra et al., 2002, 2004), and some benthic communities of adjacent areas have also been studied (Capaccioni-Azzati and Martín, 1992; Martín et al., 2000). A few studies have focused on the biota of the estuary (e.g. Rovira et al., 2009), but only one includes a brief description of its macroinvertebrate community (Ibáñez et al., 1995). Furthermore, this study was performed when the lower Ebro River and its estuary were under severe eutrophic conditions, very different from the present situation. Highly fluctu-ating estuarine systems produce strong environmental gradients, which leads to a patchy distribution of or-ganisms that must cope with a wide variety of stresses (Morrisey et al., 1992; Gray and Elliott, 2009) due to both natural and anthropogenic factors (McLusky, 1999; Dauer et al., 2000; Dauvin, 2007; Elliott and Quintino, 2007). Therefore, the benthic invertebrate communities, often used as indicators of the health of an ecosystem, can be very similar in both impacted and non-disturbed estuarine systems. This therefore increases the difficulty of distinguishing natural from anthropogenic stresses. The Estuarine Quality Para-dox concept (Dauvin, 2007; Elliott and Quintino, 2007) refers to the challenge of detecting anthropogenic im-pacts in naturally stressed systems using biological assessment methods. In Mediterranean regions and particularly in the Iberian Peninsula, besides the spa-tial fluctuation there is strong temporal environmental variability in the aquatic systems due to limited water availability during part of the year (Caiola et al., 2001; Ferreira et al., 2007a). This variability is exacerbated by a long history of human-induced pressures that have led to serious changes in the natural ecological cycles of estuarine systems from this region (Ferreira et al., 2007b). Therefore, identifying the factors that structure the benthic macroinvertebrate community of the Ebro estuary will provide a clearer understanding of the eco-logical functioning of the system both at the spatial and temporal scales. Moreover, it will help to interpret the recent changes in the estuarine system observed during the last two decades (Ibáñez et al., 2008). Therefore, this study establishes a robust basis so that macroin-vertebrates can be used as indicators of the ecological status of the Ebro estuary.
The purpose of this study was to examine the mac-roinvertebrate community of the Ebro estuary with re-gard to species composition, community structure and distribution patterns along spatial and temporal scales and to describe the main abiotic factors affecting ben-thic communities in this type of estuary.
MATERIALS AND METHODS
Study area
The study was conducted in the Ebro estuary (40º43’10’’N, 0º40’30’’E) located in the NE of the Iberian Peninsula (Catalonia, Spain) (Fig.1). The Ebro is 910 km long and has a drainage area of 85362 km2; it is the Spanish river with the highest mean annual flow and one of the most important tributaries to the Mediterranean Sea. The main land use in the basin is agriculture with more than 10000 km2 of irrigation, corresponding to approximately 90% of the water us-age in the basin (Ibáñez et al., 2008). The whole basin is strongly regulated by nearly 190 dams (Batalla et al., 2004). These affect the mean annual flow, which has decreased greatly since the beginning of the century to the present (Ibáñez et al., 1996). The Ebro estuary is highly stratified (30 km long, 240 m mean width and 6-8 m mean depth) and the microtidal amplitude of the Mediterranean Sea, about 20 cm (Cacchione et al., 1990), promotes the formation of a salt wedge. The river discharge controls the salt wedge dynamic (ad-vance, retreat and permanence): when the flow exceeds 350-400 m3 s-1 the salt wedge is pushed from the river channel, and the salt wedge reaches its maximum dis-tance upstream (30-32 km from the river mouth) with flows lower than 100 m3 s-1 (Ibáñez et al., 1997).
Sampling design and laboratory procedures
Nine sampling stations were established in order to cover the whole estuarine stretch of the Ebro River (Fig. 1). Each station was sampled seasonally (summer 2007 to spring 2008). On each sampling occasion, three sediment samples were collected using a Ponar grab (0.046 m2). The samples were washed in situ through a 0.5-mm mesh sieve to separate macroinvertebrates from sediment, and the organisms retained were immediately fixed with buffered 10% formalin. Later in the labora-tory, all macroinvertebrates were sorted, counted and identified under a stereomicroscope to the lowest pos-sible taxonomic level. Two sediment aliquots of 30 g and 200 g were taken from each grab and stored at -20ºC to estimate the total organic matter (TOM) with the loss on ignition method following Kristensen and Andersen (1987), and grain-size characterization according to Holme and McIntyre (1984). Bottom water samples were collected at each station with a water pump, pre-served on ice in the absence of light, transported to the laboratory and stored at -20ºC until analysis. Posterior processing included estimating the total chlorophyll and pheophytin concentration using the colorimetric method (Jeffrey and Humphrey, 1975), the dissolved and total nutrient concentration (PO4, PT, NH4, NO2, NO3, NT and SiO4) following Koroleff (1977) and the suspended solid concentration (Total suspended solids (TSS, mg l-1) and organic suspended solids (OSS, mg l-1)) in compliance with the UNE-EN 872 norm (AENOR, 1996). In addi-

BENTHIC MACROINVERTEBRATES OF THE EBRO ESTUARY • 579
SCI. MAR., 75(3), September 2011, 577-584. ISSN 0214-8358 doi: 10.3989/scimar.2011.75n3577
tion, physicochemical and hydromorphological charac-teristics were recorded on each sampling occasion. A YSI 556 multi-parameter probe was used to measure water temperature (°C), dissolved oxygen (mg l-1), oxy-gen saturation (%), pH, salinity and conductivity (mS cm-1). Water depth (m) was measured using a Speedtech SM-5 depth-meter sounder. Water flow velocity (m s-1) was recorded with a Valeport m.001 current-meter, and water transparency was estimated using a Secchi disc. The accumulated permanence time (in days) of the salt wedge was calculated using daily mean flow values measured 40 km upstream from the river mouth (Torto-sa) by counting the accumulated days before each sam-pling occasion with mean flow values lower than 350 m3 s-1. This data is available at the Ebro Water Authority (CHE) web site (http://www.chebro.es/).
Data analysis
The following community descriptive parameters were calculated for each station and season (n=36): total abundance (N), density (D, ind m-2), richness (S), Shannon-Wiener’s diversity index (H’, as log2), Mar-galef index (d), Simpson dominance index (1- ’) and Pielou’s evenness index (J’). In addition, species were classified with the constancy index (Dajoz, 1971) into five categories according to the number of stations in which any given taxa was found in relation to the total number of stations: constant (>76%), very common (51-75%), common (26-50%), uncommon (13-25%) and rare (<12%). Each species was classified into feeding guilds based on the available literature. The feeding guilds included deposit feeders (DF), graz-ers (G), omnivores (O), parasites (Pa), predators (Pr) and suspension feeders (SF). Appendix 1 provides a list of the taxa, together with their feeding guild, that are mentioned in the text. Non-parametric multivari-
ate techniques were used as described by Field et al. (1982) to indentify the possible macroinvertebrate communities. A similarity matrix was computed using the Bray-Curtis coefficient (Legendre and Legendre, 1998) after the four root transformation was applied to the abundance data to downweight the contribution of the most abundant taxa to the similarity (Clarke and Warwick, 2001). All the other statistical analyses were performed using the different routines available in the Multivariate Ecological Research software package PRIMER V6 (Clarke and Gorley, 2006). The stations and taxa were ordered using non-metrical multidimen-sional scaling (MDS) (Clarke and Warwick, 2001). A similarity percentage analysis (SIMPER) that examines the contribution of each variable to the average resem-blances between sample groups was performed. This analysis was also used to identify taxa that contributed to dissimilarity among stations and estuary domains that were pre-determined by ordination analysis. Dif-ferences in the community composition were identified using the 1-way analysis of similarities test (ANOSIM) that hypothesizes for differences between groups of samples (defined a priori) through randomization meth-ods on a resemblance matrix. Finally, the relationship between the community structure and environmental variables was investigated with the BIOENV routine, which maximizes a rank correlation (Spearman’s co-efficient) between resemblance matrices derived from biotic and environmental data, iterating for all possible combinations of environmental variables (Clarke and Warwick, 2001). A Spearman’s coefficient value close to 0 indicates a weak relation between the community and environmental variables, whereas a value close to 1 indicates that the environmental variables selected explain the community structure.
RESULTS
Water and sediment features
The Ebro estuary has a sand dominated bottom and a relatively low TOM percentage in both the upper (UE) and lower (LE) parts and throughout the entire year (Table 1). During the study period the salt wedge was only found in the lower estuary stations. At these sta-tions, the accumulated permanence time was different in each season: 55, 143, 257 and 344 days respectively for summer, autumn, winter and spring. The null point (the tip of the salt wedge) was located between UE4 and LE5 in all sampling periods. Nutrient concentra-tions were higher in the upper estuary stretch (Table 1) except for the ammonia, nitrite, phosphate and silicate concentrations in spring and total phosphorous in sum-mer. The chlorophyll concentrations showed marked differences between the upper and lower estuary; the UE stretch had the highest values during winter and spring, whereas the maximum values in the LE stretch were in summer/autumn. Levels of total pheophytin were lower in the UE stretch except for during the two
Fig. 1. – Location of the Ebro estuary and its deltaic plain showing the nine sampling stations. UE, upper estuary stations; LE, lower
estuary stations; SW, position of the salt wedge tip.

580 • A. NEBRA et al.
SCI. MAR., 75(3), September 2011, 577-584. ISSN 0214-8358 doi: 10.3989/scimar.2011.75n3577
last seasons. The UE stretch always had seasonal mean water flow velocities higher than the LE stretch. The values of TSS and OSS were higher in the LE stretch in summer, autumn and winter, whereas in spring the UE stretch showed the maximum values.
Macroinvertebrate abundance, taxa richness and diversity
During one year of seasonal sampling in the Ebro estuary a total of 21805 individuals were collected be-longing to 214 different taxa that comprised 151 spe-cies, 115 families, 57 orders, 20 classes and 9 phyla (Supplementary material Appendix 1). Annelida was the dominant phylum and accounted for 71.07% of the total abundance. Polychaeta and Oligochaeta contrib-uted with 49.64% and 21.42% respectively. Spionidae was the most abundant family (28.56%) due to the contribution of the most dominant species Streblospio benedicti (24.10% of the total abundance). Another dominant phylum was Arthropoda, which contributed 15.56% of the total abundance, with Malacostraca ac-counting for 10.37% of the total abundance. Mollusca was the third most abundant phylum with 12.09% of the total abundance, and Bivalvia contributed 10.61% of the total abundance. In terms of species richness, Polycha-eta contributed with 49 different taxa (40 species) and Bivalvia with 37 taxa (32 sp), followed by Gastropoda with 29 taxa (18 sp) and Insecta with 24 taxa (14 sp). Applying Dajoz’s constancy index (considering the 9 stations), 1% of the taxa were found constant, 8% very common, 27% common, 20% uncommon and 44%
were rare. Applying the constancy index to UE stations revealed that 9% of the taxa were constant, 14% very common, 19% common, 58% were uncommon and no taxa were rare; whereas in the LE stretch 22% of the taxa were constant, 16% very common, 20% common and 42% were uncommon.
Total density values throughout seasons ranged from 216 to 20022 ind m-2 (Table 2). The highest den-sities were found at the mouth (station LE9) due to the high abundance of the polychaete S. benedicti. Inter-mediate densities were found in the uppermost stations UE1 and UE2 with a large contribution of Tubificidae and the introduced bivalve Corbicula fluminea. The lowest densities corresponded to stations UE3, UE4 and LE5 in the middle part of the estuary. Station LE9 had the highest richness values with a maximum of 69 taxa and an annual mean value of 48 taxa; other sta-tions located near the river mouth (LE8 and LE7) also reached high values of richness, whereas stations UE3, UE4 and LE5 showed the lowest richness values (Ta-ble 2). Diversity indices showed the same tendency as density and richness, with low values at stations locat-ed near the limit of the salt wedge (Table 2). In terms of the trophic structure, the deposit feeders (32%), suspension feeders (29%) and predators (17%) were the dominant feeding guilds in the entire estuary. The contribution of the different feeding guilds in the UE stretch was: deposit feeders (38%), predators (22%), grazers (19%), suspension feeders (14%), omnivores (5%) and parasites (3%). The trophic structure of the LE stretch was dominated by suspension feeders (35%) and deposit feeders (30%).
Table 1. – Sediment characteristics and water physicochemical parameters (seasonal mean±standard deviation, n=4) in the two different stretches. TOM, total organic matter in sediment; Transp., transparency; DO, dissolved oxygen; Cond., conductivity; Sal., salinity; TDS, total
dissolved salts; TSS, total suspended solids; OSS, organic suspended solids.
Upper Estuary Lower Estuary Summer Autumn Winter Spring Summer Autumn Winter Spring
Mud (%) 11.31±14.59 11.31±14.59 21.08±28.43 1.53±2.08 15.89±10.90 15.89±10.90 25.27±20.78 6.51±5.75Sand (%) 73.35±23.41 73.35±23.41 57.93±33.30 88.78±16.81 79.84±13.01 79.84±13.01 74.32±21.06 85.36±18.10Gravel (%) 15.34±27.22 15.34±27.22 20.99±36.79 9.69±17.68 4.27±6.26 4.27±6.26 0.41±0.29 8.13±12.52TOM (%) 2.67±1.03 2.67±1.03 2.89±1.11 2.45±1.88 4.03±1.22 4.03±1.22 4.36±1.59 3.70±2.21Depth (m) 3.50±1.73 4.25±1.89 3.75±2.22 4.25±2.06 6.00±1.41 6.80±1.48 6.00±1.58 6.00±1.58Velocity (m s-1 ) 0.13±0.06 0.17±0.05 0.14±0.05 0.42±0.10 0.06±0.04 0.10±0.09 0.05±0.05 0.25±0.21Transp. (m) 2.40±0.71 2.68±0.78 1.98±0.73 2.21±0.22 2.37±0.27 1.89±0.23 1.88±0.13 1.60±0.22T (ºC) 24.26±0.40 22.80±0.07 11.12±0.36 16.32±0.14 22.07±0.19 22.30±0.83 13.27±0.04 15.30±0.51DO (mg l-1) 7.85±0.47 7.89±1.22 13.82±0.69 7.94±0.69 5.25±1.22 6.00±2.4 10.32±0.83 6.72±2.11DO (%) 94.00±6.26 92.00±14.25 126.28±7.02 81.30±7.24 74.10±17.64 84.78±33.61 123.90±10.11 74.36±16.52Cond.(mS cm-1) 0.95±0.01 1.37±0.00 1.12±0.03 1.04±0.00 51.27±0.53 51.51±0.71 43.21±0.50 25.00±19.78Sal. 0.47±0.01 0.72±0.00 0.77±0.02 0.62±0.00 35.97±0.31 35.98±0.40 36.89±0.45 20.02±16.27TDS (g l-1) 0.62±0.01 0.93±0.00 0.99±0.02 0.81±0.00 35.30±0.27 35.30±0.34 36.19±0.39 20.09±15.95Chlorophyll (μg l-1) 0.09±0.06 1.16±0.24 1.07±0.91 2.83±2.82 1.01±0.80 2.83±1.06 0.79±0.23 0.69±0.41Pheophytin (μg l-1) 0.05±0.02 1.06±0.10 1.00±0.55 3.43±2.28 0.31±0.18 1.38±0.32 0.66±0.26 0.87±0.50pH 8.20±0.06 8.25±0.05 7.89±0.09 8.00±0.02 7.98±0.06 8.28±0.15 7.94±0.05 7.83±0.11PO4 (mg l-1) 0.02±0.00 0.03±0.00 0.03±0.01 0.03±0.01 0.01±0.01 0.01±0.02 0.01±0.01 0.03±0.01PT (mg l-1) 0.08±0.01 0.06±0.01 0.05±0.01 0.05±0.00 0.11±0.02 0.05±0.02 0.02±0.02 0.04±0.02NH4 (mg l-1) 0.02±0.02 0.04±0.03 0.02±0.02 0.19±0.14 0.05±0.02 0.09±0.12 0.05±0.02 0.20±0.30NO2 (mg l-1) 0.01±0.00 0.01±0.00 0.02±0.00 0.04±0.01 0.00±0.01 0.00±0.01 0.01±0.00 0.04±0.01NO3 (mg l-1) 2.08±0.16 1.85±0.34 3.52±0.05 4.45±0.15 0.04±0.03 0.04±0.02 0.10±0.02 3.26±0.89NT (mg l-1) 2.42±0.08 2.43±0.04 3.52±0.05 5.37±0.08 0.28±0.07 0.20±0.12 0.10±0.02 4.39±1.13SiO4 (mg l-1) 1.89±0.06 0.85±0.17 1.01±0.15 1.21±0.13 0.42±0.48 0.47±0.33 0.17±0.16 1.28±0.31TSS (mg l-1) 3.05±0.98 3.56±2.68 2.91±1.66 14.69±11.25 20.60±2.17 24.99±3.78 16.91±32.53 5.84±3.51OSS (mg l-1) 1.94±0.52 1.47±0.81 0.99±0.21 3.20±2.31 4.75±1.11 4.71±1.02 1.76±2.27 1.52±0.75OSS (%) 66.49±18.14 46.07±8.76 43.07±21.78 23.19±2.59 22.92±3.70 18.72±1.53 27.34±12.39 27.04±2.95
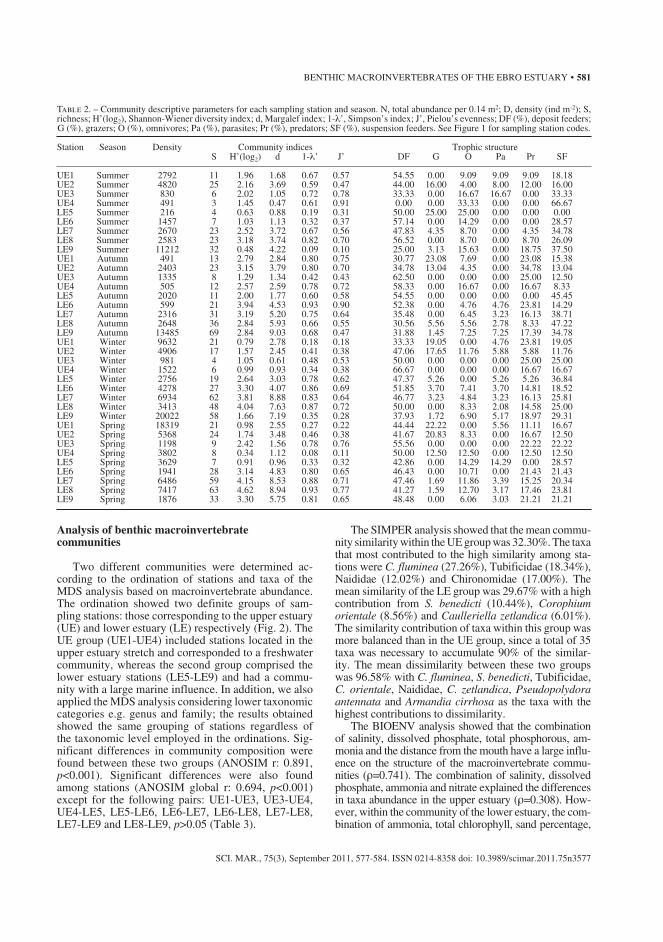
BENTHIC MACROINVERTEBRATES OF THE EBRO ESTUARY • 581
SCI. MAR., 75(3), September 2011, 577-584. ISSN 0214-8358 doi: 10.3989/scimar.2011.75n3577
Analysis of benthic macroinvertebrate communities
Two different communities were determined ac-cording to the ordination of stations and taxa of the MDS analysis based on macroinvertebrate abundance. The ordination showed two definite groups of sam-pling stations: those corresponding to the upper estuary (UE) and lower estuary (LE) respectively (Fig. 2). The UE group (UE1-UE4) included stations located in the upper estuary stretch and corresponded to a freshwater community, whereas the second group comprised the lower estuary stations (LE5-LE9) and had a commu-nity with a large marine influence. In addition, we also applied the MDS analysis considering lower taxonomic categories e.g. genus and family; the results obtained showed the same grouping of stations regardless of the taxonomic level employed in the ordinations. Sig-nificant differences in community composition were found between these two groups (ANOSIM r: 0.891, p<0.001). Significant differences were also found among stations (ANOSIM global r: 0.694, p<0.001) except for the following pairs: UE1-UE3, UE3-UE4, UE4-LE5, LE5-LE6, LE6-LE7, LE6-LE8, LE7-LE8, LE7-LE9 and LE8-LE9, p>0.05 (Table 3).
The SIMPER analysis showed that the mean commu-nity similarity within the UE group was 32.30%. The taxa that most contributed to the high similarity among sta-tions were C. fluminea (27.26%), Tubificidae (18.34%), Naididae (12.02%) and Chironomidae (17.00%). The mean similarity of the LE group was 29.67% with a high contribution from S. benedicti (10.44%), Corophium orientale (8.56%) and Caulleriella zetlandica (6.01%). The similarity contribution of taxa within this group was more balanced than in the UE group, since a total of 35 taxa was necessary to accumulate 90% of the similar-ity. The mean dissimilarity between these two groups was 96.58% with C. fluminea, S. benedicti, Tubificidae, C. orientale, Naididae, C. zetlandica, Pseudopolydora antennata and Armandia cirrhosa as the taxa with the highest contributions to dissimilarity.
The BIOENV analysis showed that the combination of salinity, dissolved phosphate, total phosphorous, am-monia and the distance from the mouth have a large influ-ence on the structure of the macroinvertebrate commu-nities ( =0.741). The combination of salinity, dissolved phosphate, ammonia and nitrate explained the differences in taxa abundance in the upper estuary ( =0.308). How-ever, within the community of the lower estuary, the com-bination of ammonia, total chlorophyll, sand percentage,
Table 2. – Community descriptive parameters for each sampling station and season. N, total abundance per 0.14 m2; D, density (ind m-2); S, richness; H’(log2), Shannon-Wiener diversity index; d, Margalef index; 1- ’, Simpson’s index; J’, Pielou’s evenness; DF (%), deposit feeders; G (%), grazers; O (%), omnivores; Pa (%), parasites; Pr (%), predators; SF (%), suspension feeders. See Figure 1 for sampling station codes.
Station Season Density Community indices Trophic structure S H’(log2) d 1- ’ J’ DF G O Pa Pr SF
UE1 Summer 2792 11 1.96 1.68 0.67 0.57 54.55 0.00 9.09 9.09 9.09 18.18UE2 Summer 4820 25 2.16 3.69 0.59 0.47 44.00 16.00 4.00 8.00 12.00 16.00UE3 Summer 830 6 2.02 1.05 0.72 0.78 33.33 0.00 16.67 16.67 0.00 33.33UE4 Summer 491 3 1.45 0.47 0.61 0.91 0.00 0.00 33.33 0.00 0.00 66.67LE5 Summer 216 4 0.63 0.88 0.19 0.31 50.00 25.00 25.00 0.00 0.00 0.00LE6 Summer 1457 7 1.03 1.13 0.32 0.37 57.14 0.00 14.29 0.00 0.00 28.57LE7 Summer 2670 23 2.52 3.72 0.67 0.56 47.83 4.35 8.70 0.00 4.35 34.78LE8 Summer 2583 23 3.18 3.74 0.82 0.70 56.52 0.00 8.70 0.00 8.70 26.09LE9 Summer 11212 32 0.48 4.22 0.09 0.10 25.00 3.13 15.63 0.00 18.75 37.50UE1 Autumn 491 13 2.79 2.84 0.80 0.75 30.77 23.08 7.69 0.00 23.08 15.38UE2 Autumn 2403 23 3.15 3.79 0.80 0.70 34.78 13.04 4.35 0.00 34.78 13.04UE3 Autumn 1335 8 1.29 1.34 0.42 0.43 62.50 0.00 0.00 0.00 25.00 12.50UE4 Autumn 505 12 2.57 2.59 0.78 0.72 58.33 0.00 16.67 0.00 16.67 8.33LE5 Autumn 2020 11 2.00 1.77 0.60 0.58 54.55 0.00 0.00 0.00 0.00 45.45LE6 Autumn 599 21 3.94 4.53 0.93 0.90 52.38 0.00 4.76 4.76 23.81 14.29LE7 Autumn 2316 31 3.19 5.20 0.75 0.64 35.48 0.00 6.45 3.23 16.13 38.71LE8 Autumn 2648 36 2.84 5.93 0.66 0.55 30.56 5.56 5.56 2.78 8.33 47.22LE9 Autumn 13485 69 2.84 9.03 0.68 0.47 31.88 1.45 7.25 7.25 17.39 34.78UE1 Winter 9632 21 0.79 2.78 0.18 0.18 33.33 19.05 0.00 4.76 23.81 19.05UE2 Winter 4906 17 1.57 2.45 0.41 0.38 47.06 17.65 11.76 5.88 5.88 11.76UE3 Winter 981 4 1.05 0.61 0.48 0.53 50.00 0.00 0.00 0.00 25.00 25.00UE4 Winter 1522 6 0.99 0.93 0.34 0.38 66.67 0.00 0.00 0.00 16.67 16.67LE5 Winter 2756 19 2.64 3.03 0.78 0.62 47.37 5.26 0.00 5.26 5.26 36.84LE6 Winter 4278 27 3.30 4.07 0.86 0.69 51.85 3.70 7.41 3.70 14.81 18.52LE7 Winter 6934 62 3.81 8.88 0.83 0.64 46.77 3.23 4.84 3.23 16.13 25.81LE8 Winter 3413 48 4.04 7.63 0.87 0.72 50.00 0.00 8.33 2.08 14.58 25.00LE9 Winter 20022 58 1.66 7.19 0.35 0.28 37.93 1.72 6.90 5.17 18.97 29.31UE1 Spring 18319 21 0.98 2.55 0.27 0.22 44.44 22.22 0.00 5.56 11.11 16.67UE2 Spring 5368 24 1.74 3.48 0.46 0.38 41.67 20.83 8.33 0.00 16.67 12.50UE3 Spring 1198 9 2.42 1.56 0.78 0.76 55.56 0.00 0.00 0.00 22.22 22.22UE4 Spring 3802 8 0.34 1.12 0.08 0.11 50.00 12.50 12.50 0.00 12.50 12.50LE5 Spring 3629 7 0.91 0.96 0.33 0.32 42.86 0.00 14.29 14.29 0.00 28.57LE6 Spring 1941 28 3.14 4.83 0.80 0.65 46.43 0.00 10.71 0.00 21.43 21.43LE7 Spring 6486 59 4.15 8.53 0.88 0.71 47.46 1.69 11.86 3.39 15.25 20.34LE8 Spring 7417 63 4.62 8.94 0.93 0.77 41.27 1.59 12.70 3.17 17.46 23.81LE9 Spring 1876 33 3.30 5.75 0.81 0.65 48.48 0.00 6.06 3.03 21.21 21.21

582 • A. NEBRA et al.
SCI. MAR., 75(3), September 2011, 577-584. ISSN 0214-8358 doi: 10.3989/scimar.2011.75n3577
TOM and the permanence time of the salt wedge showed the highest correlation and explained the main differences in the macroinvertebrate abundance data ( =0.681)
DISCUSSION
The whole Ebro estuary is dominated by sand; how-ever, the percentage of fine deposits such as clay or mud was higher in the lower stretch due to flocculation and settling processes and low velocities recorded at the salt
wedge (Sierra et. al., 2002). During the study period the bottom water layer of the estuary showed important dif-ferences in physicochemical features between the lower and upper estuary stretches. We found freshwater stations (UE1-UE4) that were not exposed to marine intrusions, and saltwater stations (LE5-LE9) that were permanently exposed to marine intrusions and had a well stratified wa-ter column. At LE stations, salinity in the salt wedge de-creased upstream with small fluctuations but with values always higher than 30, which evidences the weak mixing between water layers. In highly stratified estuaries the salt wedge dynamics are complex and can be explained by a combination of hydromorphological factors, such as the tide amplitude, river channel cross section and flow, and the freshwater runoff is one of the main factors determin-ing the salt wedge regime (Ibáñez et al., 1997). Neverthe-less, in the lower estuary the salt wedge was present on all sampling occasions and the permanence time almost reached a complete year. Although other long periods of marine intrusion in the Ebro estuary have been recorded before (Ibáñez et al., 1995), under natural conditions this period should be approximately 6 months per year (Ibáñez et al., 1997). These conditions of the quasi per-manent presence of the salt wedge in the lower estuary stretch are exacerbated by the strong flow regulation and the almost total absence of peak flows, which leads to reduced turbulence and therefore to highly stable density-thermal stratification (Ibáñez et al., 1995, 1996).
The present conditions of nutrient loading of the Ebro estuary are quite different from the past situation of eutrophication (Ibáñez et al., 1995). Under eutrophic conditions, and with long periods of permanence of the salt wedge in the lower estuary at the same time, the water quality was worse below the wedge than above it due to organic matter deposition and low water re-newal. This organic enrichment caused oxygen deple-tion through microbial consumption (Ibáñez et al., 1995; Casamayor et al., 2001). Recent changes in the nutrient content of the river, especially the reduction of phosphates, have reduced the primary production in the upper layer, whereas in the lower layer it has increased due to higher light penetration (Falco et al., 2010); thus, the hypoxic conditions in the lower layer have decreased (Casamayor et al., 2001; Ibáñez et al., 2008).
Under the present oligotrophication process, the long periods of salt wedge permanence ensure the stability of the water column, which allows the complexity of the benthic communities to increase, as suggested by Sousa et al. (2006a). The present situation is very different to that of the early nineties, when a survey conducted in October 1992 showed an impoverished macroinverte-brate community (only seven different taxa were found) due to eutrophication, which caused severe anoxic epi-sodes below the halocline (Ibáñez et al., 1995).
The benthic macroinvertebrate community in the Ebro estuary shows considerable spatial and temporal differences, with a complex structure and composition. The multivariate analysis defined two different com-munities: one from the lower and one from the upper
Fig. 2. – Two dimensional MDS plots based on Bray-Curtis similar-ities of fourth-root transformed macroinvertebrate abundance data: (a) ordination using inter-species resemblance matrix of nine sta-tions; (b) ordination of the nine stations sampled in the Ebro estuary. The dashed line and the solid line encircle the freshwater and marine communities respectively. See Figure 1 for sampling station codes.
Table 3. – One-way ANOSIM test to compare the macroinverte-brate communities at different sampling stations. The test results are shown in the lower diagonal of the table. Significant differences between stations (P<0.05) are indicated (*). The R values are shown in bold letters in the upper diagonal of the table. See Figure 1 for
sampling station codes.
UE1 UE2 UE3 UE4 LE5 LE6 LE7 LE8 LE9
UE1 0.708 0.458 0.552 1.000 1.000 1.000 1.000 1.000UE2 0.029* 0.719 0.635 1.000 1.000 1.000 1.000 1.000UE3 0.057 0.029* 0.219 0.917 0.990 1.000 1.000 1.000UE4 0.029* 0.029* 0.143 0.302 0.688 0.849 0.885 0.880LE5 0.029* 0.029* 0.029* 0.114 0.219 0.542 0.667 0.604LE6 0.029* 0.029* 0.029* 0.029* 0.143 0.167 0.115 0.448LE7 0.029* 0.029* 0.029* 0.029* 0.029* 0.171 0.000 0.240LE8 0.029* 0.029* 0.029* 0.029* 0.029* 0.200 1.000 0.083LE9 0.029* 0.029* 0.029* 0.029* 0.029* 0.029* 0.086 0.229

BENTHIC MACROINVERTEBRATES OF THE EBRO ESTUARY • 583
SCI. MAR., 75(3), September 2011, 577-584. ISSN 0214-8358 doi: 10.3989/scimar.2011.75n3577
estuary stretch. In contrast, the pattern described in more mixed estuaries (Rundle et al., 1998; Ysebaert et al., 1998; Sousa et al., 2008) supports the idea that these systems work as a continuum of overlapping com-munities along the salinity gradient, which fits with the ecocline boundary model suggested by Attrill and Rundle (2002). However, the weak longitudinal salinity gradient and the narrow transition zone between fresh and marine water suggest that the Ebro estuary fits much better into an ecotone model, when ecotone is defined as an area of relatively rapid change that produces a narrow ecological zone between two different and homogene-ous community types (Van der Maarel, 1990).
The upper stretch of the Ebro estuary was character-ized by an impoverished macroinvertebrate community dominated by the non-indigenous bivalve C. fluminea, which tends to acquire an invasive pattern (Sousa et al., 2006b), together with tolerant taxa such as Tubificidae, Naididae (Oligochaeta) and abundant Chiromidae. The amphipod C. orientale was well-represented in number of individuals but its presence was restricted to stations UE3 and UE4 located close to the salt wedge tip due to its euryhaline nature. The salt wedge community was dominated in terms of abundance by the Polychaeta and Malacostraca classes, followed by the phylum Mollusca. Nevertheless, in terms of richness it was dominated by molluscs, polychaetes and crustaceans in this order. This pattern was slightly different from those found in other temperate intertidal areas, where polychaetes are the most diverse group, followed by molluscs and crus-taceans (Ysebaert et al., 1998; Rodrigues et al., 2006). Comparing our results with those from other European estuarine ecosystems we found that the Ebro estuary was colonized in its mouth area by typical marine species associated with the Abra alba-Lagis koreni community (colonizing fine sediments rich in organic matter) and with the Nephtys spp. community (colonizing sandy sediments). These two communities are widely distrib-uted throughout European estuarine and coastal areas (Dauvin, 2000, 2007; Martín et al., 2000; Van Hoey et al., 2004; Puente et al., 2008). In addition to these com-munities, we also found tolerant groups dominated by Capitellidae and Spionidae (Polychaeta), together with Corbula gibba, which usually colonizes disturbed areas; whereas in the upper stations close to the null point the community was dominated by eurybiontic taxa like He-diste diversicolor, Perinereis cultrifera, Heteromastus filiformis, C. orientale and Cyathura carinata. These species are also very common in other European estu-aries and coastal areas (Marques et al., 1993; Ysebaert et al., 1998, 2003; Martín et al., 2000; Chainho et al., 2006; Rodrigues et al., 2006; Sousa et al., 2006a, 2008).
Currently, the Ebro estuary shows high levels of richness compared with other European estuaries (Ro-drigues et al., 2006). The trophic structure is well rep-resented with six different trophic guilds. Deposit feed-ers, suspension feeders and predators are dominant, which suggests that different resources are available (Brown et al., 2000). In the upper stretch the diversity
and richness decreased seawards, with minimum val-ues found close to the null point because the salinity fluctuation is a physiological barrier for stenohaline freshwater and marine taxa (Mannino and Montagna, 1997). However, diversity and richness at the salt wedge stations declined with increasing distance from the sea, which is a recurring tendency in mixed estuar-ies (Remane and Schleiper, 1971; Schlacher and Wool-bridge, 1996). In the Ebro estuary this impoverishment tendency could be explained by the increase in organic matter, ammonia and total phosphorous towards the tip of the salt wedge in combination with the salinity fluctuations in the same area.
The present study provides baseline data that can be used in future ecological studies on this impor-tant Mediterranean estuarine ecosystem, as well as in comparisons with other highly stratified estuaries. Complementary studies are necessary to improve our understanding of the spatial and temporal variability of the macrozoobenthic estuarine community. This knowledge could be an important tool for conserving the biodiversity in the Ebro estuary and could be used to develop biological indices for assessing its ecologi-cal status according to the Water Framework Directive of the European Union.
ACKNOWLEDGEMENTS
This research was supported by the Government of Catalonia (Catalan Water Agency, ACA). We are very grateful to C. Buendía, Ll. Jornet, C. Macaigne, D. Mateu, M. San Lorenzo and R. Valmaña for field assistance and laboratory work. Many thanks to M. González-Porto for helping us with Polychaeta identi-fication and to C. Reverté for the bibliographic search.
REFERENCES
AENOR. – 1996. Norma UNE-EN 872. Water quality. Determina-tion of total suspended solids. AENOR, Madrid, Spain.
Attrill, M.J. and S.D. Rundle. – 2002. Ecotone or ecocline: Eco-logical boundaries in estuaries. Est. Coast. and Shelf Sci., 55: 929-936.
Batalla, R.J., C.M. Gómez and G.M. Kondolf. – 2004. Reservoir-induced hydrological changes in the Ebro River basin (NE Spain). J. Hydrol., 290: 117-136.
Brown, S.S., G.R. Gaston, C.F. Rakocinski and R.W. Heard. – 2000. Effects of sediment contaminants and environmental gradients on macrobenthic community trophic structure in Gulf of Mexico estuaries. Estuaries, 23: 411-424.
Cacchione, D.A., D.E. Drake, M.A. Losada and R. Medina. – 1990. Bottom-boundary layer measurements on the continental shelf off the Ebro River, Spain. Mar. Geol., 95: 179-192.
Caiola, N., M.J. Vargas and A. Sostoa. – 2001. Feeding ecology of the endangered Valencia toothcarp, Valencia hispanica (Actin-opterygii: Valenciidae). Hydrobiologia, 448: 97-105.
Capaccioni-Azzati, R. and D. Martín. – 1992. Pseudomastus del-taicus gen. et sp. n. (Polychaeta: Capitellidae) from a shallow water bay in the North-western Mediterranean Sea. Zool. Scr., 21: 247-250.
Casamayor, E.O., J. Garcia-Cantizano, J. Mas and C. Pedros-Alio. – 2001. Primary production in estuarine oxic/anoxic interfaces: contribution of microbial dark CO2 fixation in the Ebro River Salt Wedge Estuary. Mar. Ecol. Prog. Ser., 215: 49-56.
Chainho, P., J.L. Costa, M.L. Chaves, M.F. Lane, D.M. Dauer and

584 • A. NEBRA et al.
SCI. MAR., 75(3), September 2011, 577-584. ISSN 0214-8358 doi: 10.3989/scimar.2011.75n3577
M.J. Costa. – 2006. Seasonal and spatial patterns of distribution of subtidal benthic invertebrate communities in the Mondego River, Portugal - a poikilohaline estuary. Hydrobiologia, 555: 59-74.
Clarke, K.R. and R.N. Gorley. – 2006. PRIMER v6: User Manual/Tutorial. PRIMER-E, Plymouth, UK.
Clarke, K.R. and R.M. Warwick. – 2001. Change in Marine Com-munities: An Approach to Statistical Analysis and Interpreta-tion, second ed. PRIMER-E, Plymouth, UK, 00-165.
Dajoz, R. – 1971. Précis d’Ecologie. Dunod, París, France.Dauer, D.M., J.A. Ranasinghe and S.B. Weisberg. – 2000. Rela-
tionships between benthic community condition, water quality, sediment quality, nutrient loads, and land use patterns in Chesa-peake Bay. Estuaries, 23: 80-96.
Dauvin, J.C. – 2000. The muddy fine sand Abra alba-Melinna pal-mata community of the Bay of Morlaix twenty years after the Amoco Cadiz oil spill. Mar. Pollut. Bul., 40: 528-536.
Dauvin, J.C. – 2007. Paradox of estuarine quality: benthic indica-tors and indices, consensus or debate for the future. Mar. Pollut. Bul., 55: 271-281.
Elliott, M. and V. Quintino. – 2007. The estuarine quality paradox, environmental homeostasis and the difficulty of detecting an-thropogenic stress in naturally stressed areas. Mar. Pollut. Bul., 54: 640-645.
Falco, S., L.F. Niencheski, M. Rodilla, I. Romero, J. González del Río, J.P. Sierra and C. Mosso. – 2010. Nutrient flux and budget in the Ebro estuary. Est. Coast. and Shelf Sci., 87: 92-102.
Ferreira, T., N. Caiola, F. Casals, J.M. Oliveira and A. Sostoa. – 2007a. Assessing perturbation of river fish communities in the Iberian Ecoregion. Fisheries Manag. Ecol., 14: 519-530.
Ferreira, T., J.M. Oliveira, N. Caiola, A. Sostoa, F. Casals, R. Cortes, A. Economou, S., Zogaris, D. Garcia-Jalón, M. Ilhéu, F. Martínez-Capel, D. Pont, C. Rogers and J. Prenda. – 2007b. Ec-ological traits of fish assemblages from Mediterranean Europe and their responses to human disturbance. Fisheries Manag. Ecol., 14: 473-481.
Field, J.G., K.R. Clarke and R.M. Warwick. – 1982. A practical strategy for analyzing multispecies distribution patterns. Mar. Ecol. Prog. Ser., 8: 7-52.
Gray, J.S., M. Elliott. – 2009. The ecology of marine sediments. Second edition Cambridge University Press, Cambridge, UK.
Hansen, D.V. and M. Rattray. – 1966. New dimensions in estuary classification. Limnol. Oceanogr., 11: 319-326.
Holme, N.A. and A.D. McIntyre. – 1984. Methods for the study of marine benthos. Blackwell Scientific Publications. London, UK.
Ibáñez, C., A. Rodrigues-Capítulo and N. Prat. – 1995. The combined impacts of river regulation and eutrophication on the dynamics of the salt wedge and the ecology of the lower Ebro River. In The ecological basis for river management, ed. D. Harper and A. Ferguson, 105-114. John Wiley and Sons, Chichester, UK.
Ibáñez, C., N. Prat and A. Canicio. – 1996. Changes in the hydrol-ogy and sediment transport produced by large dams on the lower Ebro River and its estuary. Regul. Rivers: Res. Manage., 12: 51-62.
Ibáñez, C., D. Pont and N. Prat. – 1997. Characterization of the Ebre and Rhone estuaries: A basis for defining and classifying salt-wedge estuaries. Limnol. Oceanogr., 42: 89-101.
Ibáñez, C., J. Saldaña and N. Prat. – 1999. A model to determine the advective circulation in a three layer, salt wedge estuary: application the Ebre River estuary. Est. Coast. Shelf Sci., 48: 271-279.
Ibáñez, C., N. Prat, C. Durán, M. Prados, A. Munné, R. Andreu, N. Caiola, N. Cid, H. Hampel, R. Sánchez and R. Trobajo. – 2008. Changes in dissolved nutrients in the lower Ebro river: Causes and consequences. Limnética, 27: 131-142.
Jeffrey, S.W. and G.F. Humphrey. – 1975. New spectrophotometric equations for determining chlorophylls a, b, c1 and c2 in higher plants, algae and natural phytoplankton. Biochem. Physiol. Pflanzen, 167: 191-194.
Koroleff, F. – 1977. Simultaneous persulphate oxidation of phos-phorus and nitrogen compounds in water. In report of the Baltic Intercalibration Worshop, 52-53.
Kristensen, E. and F.O. Andersen. – 1987. Determination of organ-ic-carbon in marine-sediments - a comparison of 2 chn-analyzer methods. J. Exp. Mar. Biol. Ecol., 109: 15-23.
Legendre, P and L. Legendre. – 1998. Numerical ecology. Elsevier, Amsterdam, Netherlands.
Mannino, A. and P.A. Montagna. – 1997. Small-scale spatial
variation of macrobenthic community structure. Estuaries, 20: 159-173.
Marques, J.C., P. Maranhao and M.A. Pardal. – 1993. Human im-pact assessment on the subtidal macrobenthic community struc-ture in the Mondego estuary (western Portugal). Est. Coast. and Shelf Sci., 37: 403-419.
Martín, D., S. Pinedo and R. Sardá. – 2000. Distribution patterns and trophic structure of soft-bottom Polychaete assemblages in a north-western Mediterranean shallow-water Bay. Ophelia, 53: 1-17.
McLusky, D.S. – 1999. Estuarine benthic ecology: A European per-spective. Aust. J. Ecol., 24: 302-311.
Morrisey, D.J., L. Howitt, A.J. Underwood and J.S. Stark. – 1992. Spatial variation in soft-sediment benthos. Mar. Ecol. Prog. Ser., 81: 197-204.
Puente, A., J.A. Juanes, A. García, C. Álvarez, J.A. Revilla and I. Carranza. – 2008. Ecological assessment of soft bottom ben-thic communities in northern Spanish estuaries. Ecol. Indic., 8: 373-388.
Remane, A. and C. Schlieper. – 1971. Biology of brackish water. Wiley Interscience, New York, USA.
Rodrigues, A.M., S. Meireles, T. Pereira, A. Gama and V. Quintino. – 2006. Spatial patterns of benthic macroinvertebrates in inter-tidal areas of a Southern european estuary: the Tagus, Portugal. Hydrobiologia, 555: 99-113.
Rovira, L., R. Trobajo and C. Ibáñez. – 2009. Periphytic diatom community in a Mediterranean salt wedge estuary: the Ebro Estuary (NE Iberian Peninsula). Acta Bot. Croat., 68: 285-300.
Rundle, S.D., M.J. Attrill and A. Arshad. – 1998. Seasonality in macroinvertebrate community composition across a neglected ecological boundary, the freshwater-estuarine transition zone. Aquat.Ecol., 32: 211-216.
Schlacher, T.A. and T.H. Wooldridge. – 1996. Axial zonation pat-terns of subtidal macrozoobenthos in the Gamtoos estuary, South Africa. Estuaries, 19: 680-696.
Sierra, J.P., A. Sánchez-Arcilla, J.G. Del Río, J. Flos, E. Movellán, C. Mosso, R. Martínez, M. Rodilla, S. Falco and I. Romero. – 2002. Spatial distribution of nutrients in the Ebro estuary and plume. Cont. Shelf Res., 22: 361-378.
Sierra, J.P., A. Sánchez-Arcilla, P.A. Figueras, J.G. Del Río, E.K. Rassmussen and C. Mosso. – 2004. Effects of discharge reduc-tions on salt wedge dynamics of the Ebro River. River Res. Appl., 20: 61-77.
Sousa, R., S. Dias and J.C. Antunes. – 2006a. Spatial subtidal mac-robenthic distribution in relation to abiotic conditions in the Lima estuary, NW of Portugal. Hydrobiologia, 559: 135-148.
Sousa, R., C. Antunes and L. Guilhermino. – 2006b. Factors influ-encing the occurrence and distribution of Corbicula fluminea (Müller, 1774) in the River Lima estuary. Ann. Limnol., 42: 165-171.
Sousa, R., S. Dias, V. Freitas and C. Antunes. – 2008. Subtidal macrozoobenthic assemblages along the River Minho estuarine gradient (north-west Iberian Peninsula). Aquatic Conserv: Mar. Freshw. Ecosyst., 18: 1063-1077.
Van der Maarel, E. – 1990. Ecotones and ecoclines are different. J. Veg. Sci., 1: 135-138.
Van Hoey, G., S. Degraer, M. Vincx. – 2004. Macrobenthic com-munity structure of soft-bottom sediments at the Belgian Conti-nental Shelf. Est. Coast. and Shelf Sci., 59: 599-613.
Ysebaert, T., P. Meire, J. Coosen and K. Essink. – 1998. Zonation of intertidal macrobenthos in the estuaries of Schelde and Ems. Aquat.Ecol., 32: 53-71.
Ysebaert, T., P.M.J. Herman, P. Meire, J. Craeymeersch, H. Ver-beek and C.H.R. Heip. – 2003. Large-scale spatial patterns in estuaries: estuarine macrobenthic communities in the Schelde estuary, NW Europe. Est. Coast. and Shelf Sci., 57: 335-355.
Scient. ed.: J.S. Troncoso.Received October 15, 2010. Accepted February 7, 2011.Published online June 6, 2011.
SUPPLEMENTARY MATERIAL
The following Appendix is available through the web pagehttp://www.icm.csic.es/scimar/supplm/sm75n3577sm.pdf
Appendix 1. – List of the identified taxa that were found at all the stations over the entire study period.

Community structure of benthic macroinvertebrates inhabiting a highly stratified Mediterranean estuary
ALFONSO NEBRA, NUNO CAIOLA and CARLES IBÁÑEZ
Supplementary material

S2 • A. NEBRA et al.
SCI. MAR., 75(3), September 2011, S1-S5. ISSN 0214-8358 Supplementary material
Appendix 1. – List of the identified taxa that were found at all the stations over the entire study period. The stations where each taxon was found are also listed. See Figure 1 for sampling station codes; FG, feeding guild (see Table 2 for feeding guild codes); CI, Constancy index;
Ct, constant; VC, very common; C, common; UC, uncommon; R, rare.
Taxa Summer Autumn Winter Spring FG CI CI CI UE LE
PHYLUM CNIDARIA Class Anthozoa Diadumene sp. LE9 Pr R UCPHYLUM PLATYHELMINTHES Class Turbellaria Dugesia sp. UE2 UE2 UE2 Pr R UC Turbellaria indet. UE2 UE1 Pr UC C PHYLUM NEMERTINA Class Enopla Nemertina indet. LE6,7,9 LE5,6,7,8,9 LE6,7,8,9 Pr VC Ct Prostoma graecense (Böhmig, 1892) UE2 UE1,2,4 UE2 Pr C VC PHYLUM NEMATODA Nematoda indet. UE1,2,3 LE9 UE1,2; LE9 UE1 Pa C VC UCPHYLUM MOLLUSCA Class Gastropoda Aplysiidae indet. LE9 LE8 G UC C Bittium reticulatum (da Costa, 1778) LE8,9 LE7,8,9 LE7,8,9 DF C VC Buccinum sp. LE9 O R UC Chrysallida sp. LE6,7,8,9 LE5,6,7,8,9 LE5,7,8,9 Pa VC Ct Eulimella polita (Verrill, 1872) LE9 Pa R UC Ferrissia clessiniana (Jickeli, 1882) UE2 UE2 UE2 G R UC Gyraulus albus (Müller, 1774) UE1,2,4 G C VC Haminoea navicula (da Costa, 1778) LE6,7 G UC C Hinia limata (Chemnitz, 1795) LE9 LE9 LE9 Pr R UC Hydrobia sp. LE7 LE5 LE7 G UC C Hydrobia ulvae (Pennant, 1777) LE7 G R UC Mangelia sp. LE9 O R UC Melanella polita (Linnaeus, 1758) LE9 Pa R UC Nassarius mutabilis (Linnaeus, 1758) LE9 LE9 O R UC Nassarius pygmaeus (Lamarck, 1822) LE7,8,9 LE9 O C VC Nassarius sp. LE7,9 O UC C Neverita josephinia Risso, 1826 LE9 LE9 Pr R UC Odostomia conoidea (Brocchi, 1814) LE8 Pa R UC Odostomia sp. LE9 Pa R UC Physella acuta (Draparnaud, 1805) UE2 UE1,2 UE1,2 UE1,2 G UC C Radix auricularia (Linnaeus, 1758) UE2 G R UC Radix peregra (Müller, 1774) UE2 UE1 UE2 G UC C Retusa truncatula (Bruguière, 1792) LE8 LE9 LE7 LE6,7,8 Pr C Ct Rissoa sp. LE9 LE9 G R UC Rissoa ventricosa Desmarest, 1814 LE8 G R UC Tricolia sp. LE8 G R UC Turbonilla lactea (Linnaeus, 1758) LE9 LE7 LE7 Pa UC C Turritella sp. LE9 SF R UC Class Bivalvia Abra alba (Wood, 1802) LE9 LE5,7,8,9 LE7,8,9 LE7,8,9 SF C Ct Abra nitida (Müller, 1776) LE9 LE9 LE8 SF UC C Acanthocardia echinata (Linnaeus, 1758) LE7,8,9 SF C VC Acanthocardia paucicostata (Sowerby, 1841) LE8 LE6,7 LE7,8,9 LE7,8 SF C Ct Acanthocardia tuberculata (Linnaeus, 1758) LE9 SF R UC Cerastoderma edule (Linnaeus, 1758) LE8 SF R UC Cerastoderma glaucum (Poiret, 1789) LE8 LE5,7 SF C VC Circomphalus casina (Linnaeus, 1758) LE7 LE8 LE8 SF UC C Corbicula fluminea (Müller, 1774) UE1,2,3,4 UE1,2,3,4 UE1,2,3,4 UE1,2,3 SF C Ct Corbula gibba (Olivi, 1792) LE7,9 LE5,6,7,8,9 LE5,6,7,8,9 LE5,6,7,8 SF VC Ct Donax semistriatus Poli, 1795 LE9 LE9 SF R UC Donax sp. LE9 SF R UC Donax trunculus Linnaeus, 1758 LE7 SF R UC Donax venustus Poli, 1795 LE8 SF R UC Dosinia lupinus (Linnaeus, 1758) LE8,9 LE7,8,9 LE8,9 SF C VC Gari fervensis (Gmelin, 1791) LE9 SF R UC Gastrana fragilis (Linnaeus, 1758) LE9 SF R UC Glycymeris glycymeris (Linnaeus, 1758) LE9 SF R UC Laevicardium crassum (Gmelin, 1791) LE8 SF R UC Lutraria lutraria (Linnaeus, 1758) LE9 SF R UC Mactra corallina (Linnaeus, 1758) LE7,9 LE7,8 SF C VC Mactra sp. LE9 LE9 SF R UC Musculus discors (Linnaeus, 1767) LE7,8 LE7,9 LE5,7 LE6,7,8 SF VC Ct Mytilus galloprovincialis Lamarck, 1819 LE8 SF R UC Pandora inaequivalvis (Linnaeus, 1758) LE7,8 LE7,8,9 LE8,9 LE7 SF C VC Pharus legumen (Linnaeus, 1758) LE9 LE9 SF R UC

BENTHIC MACROINVERTEBRATES OF THE EBRO ESTUARY • S3
SCI. MAR., 75(3), September 2011, S1-S5. ISSN 0214-8358 Supplementary material
Appendix 1 (cont.). – List of the identified taxa that were found at all the stations over the entire study period. The stations where each taxon was found are also listed. See Figure 1 for sampling station codes; FG, feeding guild (see Table 2 for feeding guild codes); CI, Constancy
index; Ct, constant; VC, very common; C, common; UC, uncommon; R, rare.
Taxa Summer Autumn Winter Spring FG CI CI CI UE LE
Pitar rudis (Poli, 1795) LE8 LE8 SF R UC Scrobicularia plana (da Costa, 1778) LE9 LE8 SF UC C Solemya togata (Poli, 1795) LE9 SF R UC Solen sp. LE9 LE5 SF UC C Spisula subtruncata (da Costa, 1778) LE8,9 LE9 LE7 LE7,8,9 SF C VC Tapes philippinarum (Adams and Reeve, 1850) LE7 LE7 SF R UC Tapes pullastra (Unspecified) LE7 LE7,8 SF UC C Tapes sp. LE8,9 LE6,7,8,9 LE7,8,9 SF C Ct Tellina albicans (Gmelin, 1791) LE8,9 LE7,9 LE7 SF C VC Tellina sp. LE8,9 LE7,9 LE6,9 SF C Ct Tellina tenuis da Costa, 1778 LE9 LE5,8,9 LE7 SF C Ct Class Scaphopoda Antalis novemcostata (Lamarck, 1818) LE8 Pr R UC Antalis sp. LE8,9 LE9 LE7,8 Pr C VCPHYLUM ANNELIDA Class Hirudinea Helobdella stagnalis (Linnaeus, 1758) UE2 Pr R UC Piscicola geometra (Linnaeus, 1758) UE2 Pa R UC Class Oligochaeta Haplotaxidae indet. UE3 DF R UC Lumbricidae indet. UE2 UE1 DF UC C Naididae indet. UE1,2 UE1,2,3 UE1,2,4; LE5 UE1,2,3,4 DF VC Ct UC Tubificidae indet. UE1,2,3; LE5 UE1,2,3,4 UE1,2,3 UE1,2,3 DF VC Ct UC Class Polychaeta Ampharete grubei Malmgren, 1865 LE6,7,8 LE6,7,8,9 LE6,7,8,9 LE6,7,8 DF C Ct Aricidea sp. LE8,9 LE6,7,8,9 LE7,8,9 LE6,7,8,9 DF VC Ct Armandia cirrhosa Filippi, 1861 LE6,7,8 LE5,6,7,9 LE5,6,7,9 LE7,8 DF VC Ct Capitella capitata (Fabricius, 1780) LE6 LE5,6,7,8,9 LE6,8,9 DF VC Ct Capitellidae indet. LE8 LE7 DF UC C Caulleriella zetlandica (McIntosh, 1911) LE8 LE6,7,8,9 LE6,7,8,9 LE6,7,8,9 DF C Ct Cirratulus cirratus (Müller, 1776) LE7,8,9 LE7,9 DF C VC Clymenura clypeata (Saint-Joseph, 1894) LE7 LE7,8 DF UC C Diopatra neapolitana Delle Chiaje, 1841 LE8,9 LE7,9 DF C VC Eteone picta Quatrefagues, 1865 LE6,7,9 LE7,9 LE7 Pr C VC Euclymene oerstedi (Claparède, 1863) LE7,8,9 LE6,7,8 DF C Ct Eunice harassii Audouin & Edwards, 1834 LE8,9 LE7 DF C VC Ficopomatus enigmaticus (Fauvel, 1923) LE6 SF R UC Glycera sp. LE6,9 LE6,7,8,9 LE6,7,8,9 Pr C Ct Glycera tesselata Grube, 1840 LE9 Pr R UC Glycera tridactyla Schmarda, 1861 LE8,9 LE6,7 Pr C Ct Harmothoe sp. LE6,9 LE7,8,9 Pr C Ct Hediste diversicolor (Müller, 1776) LE7,8 LE6,7,8 LE7,8 LE5,6,7,8 O C Ct Heteromastus filiformis (Claparède, 1864) LE5,6 LE7,8,9 LE6,7,8,9 DF VC Ct Hydroides norvegicus Gunnerus, 1768 LE7 SF R UC Lagis koreni Malmgren, 1866 LE9 LE6,9 DF UC C Laonice cirrata (Sars, 1851) LE8,9 DF UC C Lepidonotus squamatus (Linnaeus, 1758) LE7,9 LE8 Pr C VC Lumbrineris sp. LE7,8,9 LE6,7,8 LE7,8 Pr C Ct Magelona papillicornis Müller, 1858 LE9 LE7,9 DF UC C Melinna palmata Grube, 1870 LE6,7,8,9 LE5,7,8,9 LE6,7,8 DF VC Ct Micronephthys maryae San Martín, 1982 LE7 LE7,8,9 LE7,8,9 LE6,7,8,9 Pr C Ct Neosabellides oceanica (Fauvel, 1909) LE6,7,8 LE7 DF C VC Nephtys assimilis Örsted, 1843 LE9 Pr R UC Nephtys cirrosa (Ehlers, 1868) LE9 Pr R UC Nephtys hombergii Lamarck, 1818 LE9 Pr R UC Nephtys sp. LE6,8 Pr UC C Nereididae indet. UE4; LE6,7 UE4 DF C UC C Notomastus sp. LE9 LE7,8,9 DF C VC Oriopsis armandi (Claparède, 1864) LE7,8,9 LE5,7,9 LE5,6,9 UE4; LE5,8 SF VC UC Ct Paradoneis lyra (Southern, 1914) LE7,9 LE6,7,8,9 LE7,8,9 DF C Ct Perinereis cultrifera (Grube, 1840) LE5,6 UE4 LE6 UE4; LE8 O VC UC VC Phyllodoce mucosa Örsted, 1843 LE9 LE9 LE9 Pr R UC Phylo foetida (Claparède, 1869) LE8 LE7 DF UC C Pista cristata (Müller, 1776) LE7,8 LE6,7,8,9 LE7,8,9 LE7,8 DF C Ct Prionospio malmgreni Claparède, 1869 LE7,8,9 LE7,8,9 LE7,8,9 DF C VC Pseudopolydora antennata (Claparède, 1869) LE7,8 LE5,6,9 LE5,6,7,8,9 LE6,7,8,9 DF VC Ct Sabella pavonina Savigny, 1822 LE8 LE7,8 SF UC C Sabellidae indet. LE6 LE8,9 LE6 SF C VC Serpula vermicularis Linnaeus, 1767 LE5,6,7,8 LE7 SF C Ct Sigambra parva (Day, 1963) LE9 LE7,8,9 LE7,8 Pr C VC
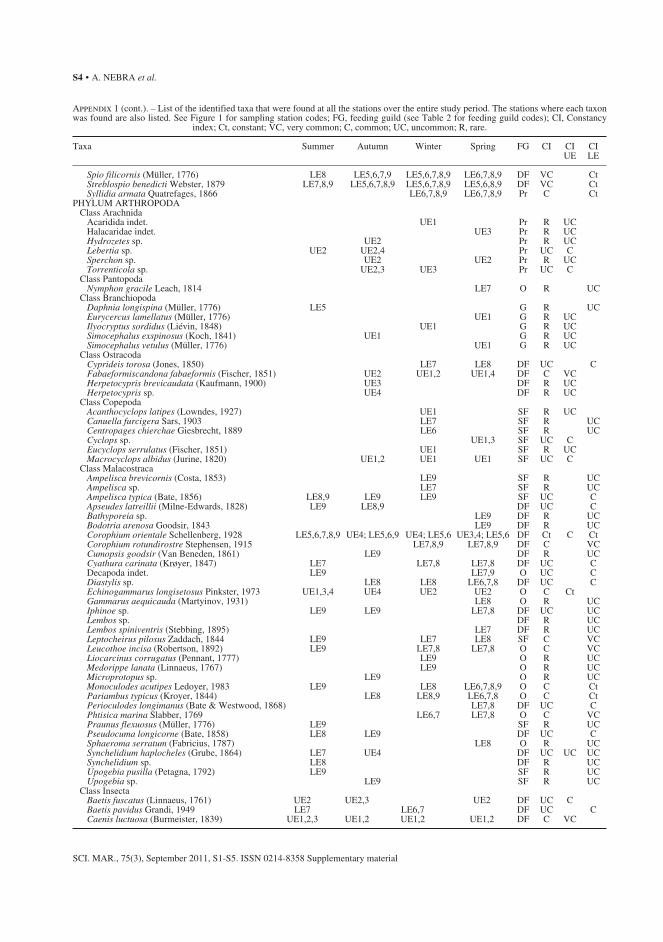
S4 • A. NEBRA et al.
SCI. MAR., 75(3), September 2011, S1-S5. ISSN 0214-8358 Supplementary material
Appendix 1 (cont.). – List of the identified taxa that were found at all the stations over the entire study period. The stations where each taxon was found are also listed. See Figure 1 for sampling station codes; FG, feeding guild (see Table 2 for feeding guild codes); CI, Constancy
index; Ct, constant; VC, very common; C, common; UC, uncommon; R, rare.
Taxa Summer Autumn Winter Spring FG CI CI CI UE LE
Spio filicornis (Müller, 1776) LE8 LE5,6,7,9 LE5,6,7,8,9 LE6,7,8,9 DF VC Ct Streblospio benedicti Webster, 1879 LE7,8,9 LE5,6,7,8,9 LE5,6,7,8,9 LE5,6,8,9 DF VC Ct Syllidia armata Quatrefages, 1866 LE6,7,8,9 LE6,7,8,9 Pr C CtPHYLUM ARTHROPODA Class Arachnida Acaridida indet. UE1 Pr R UC Halacaridae indet. UE3 Pr R UC Hydrozetes sp. UE2 Pr R UC Lebertia sp. UE2 UE2,4 Pr UC C Sperchon sp. UE2 UE2 Pr R UC Torrenticola sp. UE2,3 UE3 Pr UC C Class Pantopoda Nymphon gracile Leach, 1814 LE7 O R UC Class Branchiopoda Daphnia longispina (Müller, 1776) LE5 G R UC Eurycercus lamellatus (Müller, 1776) UE1 G R UC Ilyocryptus sordidus (Liévin, 1848) UE1 G R UC Simocephalus exspinosus (Koch, 1841) UE1 G R UC Simocephalus vetulus (Müller, 1776) UE1 G R UC Class Ostracoda Cyprideis torosa (Jones, 1850) LE7 LE8 DF UC C Fabaeformiscandona fabaeformis (Fischer, 1851) UE2 UE1,2 UE1,4 DF C VC Herpetocypris brevicaudata (Kaufmann, 1900) UE3 DF R UC Herpetocypris sp. UE4 DF R UC Class Copepoda Acanthocyclops latipes (Lowndes, 1927) UE1 SF R UC Canuella furcigera Sars, 1903 LE7 SF R UC Centropages chierchae Giesbrecht, 1889 LE6 SF R UC Cyclops sp. UE1,3 SF UC C Eucyclops serrulatus (Fischer, 1851) UE1 SF R UC Macrocyclops albidus (Jurine, 1820) UE1,2 UE1 UE1 SF UC C Class Malacostraca Ampelisca brevicornis (Costa, 1853) LE9 SF R UC Ampelisca sp. LE7 SF R UC Ampelisca typica (Bate, 1856) LE8,9 LE9 LE9 SF UC C Apseudes latreillii (Milne-Edwards, 1828) LE9 LE8,9 DF UC C Bathyporeia sp. LE9 DF R UC Bodotria arenosa Goodsir, 1843 LE9 DF R UC Corophium orientale Schellenberg, 1928 LE5,6,7,8,9 UE4; LE5,6,9 UE4; LE5,6 UE3,4; LE5,6 DF Ct C Ct Corophium rotundirostre Stephensen, 1915 LE7,8,9 LE7,8,9 DF C VC Cumopsis goodsir (Van Beneden, 1861) LE9 DF R UC Cyathura carinata (Krøyer, 1847) LE7 LE7,8 LE7,8 DF UC C Decapoda indet. LE9 LE7,9 O UC C Diastylis sp. LE8 LE8 LE6,7,8 DF UC C Echinogammarus longisetosus Pinkster, 1973 UE1,3,4 UE4 UE2 UE2 O C Ct Gammarus aequicauda (Martyinov, 1931) LE8 O R UC Iphinoe sp. LE9 LE9 LE7,8 DF UC UC Lembos sp. DF R UC Lembos spiniventris (Stebbing, 1895) LE7 DF R UC Leptocheirus pilosus Zaddach, 1844 LE9 LE7 LE8 SF C VC Leucothoe incisa (Robertson, 1892) LE9 LE7,8 LE7,8 O C VC Liocarcinus corrugatus (Pennant, 1777) LE9 O R UC Medorippe lanata (Linnaeus, 1767) LE9 O R UC Microprotopus sp. LE9 O R UC Monoculodes acutipes Ledoyer, 1983 LE9 LE8 LE6,7,8,9 O C Ct Pariambus typicus (Kroyer, 1844) LE8 LE8,9 LE6,7,8 O C Ct Perioculodes longimanus (Bate & Westwood, 1868) LE7,8 DF UC C Phtisica marina Slabber, 1769 LE6,7 LE7,8 O C VC Praunus flexuosus (Müller, 1776) LE9 SF R UC Pseudocuma longicorne (Bate, 1858) LE8 LE9 DF UC C Sphaeroma serratum (Fabricius, 1787) LE8 O R UC Synchelidium haplocheles (Grube, 1864) LE7 UE4 DF UC UC UC Synchelidium sp. LE8 DF R UC Upogebia pusilla (Petagna, 1792) LE9 SF R UC Upogebia sp. LE9 SF R UC Class Insecta Baetis fuscatus (Linnaeus, 1761) UE2 UE2,3 UE2 DF UC C Baetis pavidus Grandi, 1949 LE7 LE6,7 DF UC C Caenis luctuosa (Burmeister, 1839) UE1,2,3 UE1,2 UE1,2 UE1,2 DF C VC

BENTHIC MACROINVERTEBRATES OF THE EBRO ESTUARY • S5
SCI. MAR., 75(3), September 2011, S1-S5. ISSN 0214-8358 Supplementary material
Appendix 1 (cont.). – List of the identified taxa that were found at all the stations over the entire study period. The stations where each taxon was found are also listed. See Figure 1 for sampling station codes; FG, feeding guild (see Table 2 for feeding guild codes); CI, Constancy
index; Ct, constant; VC, very common; C, common; UC, uncommon; R, rare.
Taxa Summer Autumn Winter Spring FG CI CI CI UE LE
Ceraclea dissimilis (Stephens, 1836) UE2 DF R UC Ceraclea sobradieli (Navás, 1917) UE2 UE2 DF R UC Chironomus sp. LE7,8 UE4 UE1 UE1,3; LE6 DF VC VC VC Choroterpes picteti (Eaton, 1871) UE2 DF R UC Coenagrion pulchellum (Van der Linden, 1825) UE1 Pr R UC Coenagrionidae indet. UE1 UE1 Pr R UC Drypos sp. UE1 UE1 G R UC Ecnomus tenellus (Rambur, 1842) UE2 UE1,2 UE2 UE2 O UC C Ephoron virgo (Olivier, 1791) UE1,2,3,4 UE2 SF C Ct Hydropsyche exocellata Duföur, 1841 UE2 UE2 LE5 UE2 SF UC UC UC Hydroptila sp. UE2 UE2 UE2 G R UC Mystacides azurea (Linnaeus, 1761) UE2 DF R UC Orthotrichia angustella (McLachlan, 1865) UE2 G R UC Pseudocloeon atrebatinus Eaton, 1870 UE2 UE2 UE2 DF R UC Psychomyia pusilla (Fabricius, 1781) UE2 DF R UC Sf. Orthocladiinae indet. UE1,2; LE7 UE1,2,4 UE1,2,4; LE5,6,7 UE1,2; LE5,7,8 DF Ct VC Ct Sf. Tanypodinae indet. UE1 UE1,2,3,4 UE1 UE1,2,3,4 Pr C Ct Simulium erithrocephalum (De Geer, 1776) UE2 UE2 SF R UC Tr. Chironomini indet. UE1 UE4 UE2 UE2 DF C VC Tr. Tanytarsini indet. UE1,2 UE2,3 UE1,2 UE1,2,3 DF C VC Trithemis annulata (Palisot de Beauvois, 1807) UE1 Pr R UC PHYLUM PHORONIDA Class Phoronida Phoronis ovalis Wright, 1856 LE6 SF R UC Phoronis psammophila Cori, 1889 LE5,7,8,9 LE6,7,8 LE6,7,8 SF VC CtPHYLUM ECHINODERMATA Class Holothuroidea Thyone sp. LE7 LE7,8 DF UC C Class Ophiuroidea Amphipholis squamata (Delle Chiaje, 1828) LE9 LE9 LE7,8 LE8 DF C VC Amphiura chiajei Forbes, 1843 LE9 LE7 DF UC C Class Echinoidea Fibulariidae indet. LE9 DF R UC Echinocardium sp. LE9 DF R UC


Towards a suitable ecological status assessment of highly stratifiedmediterranean estuaries: A comparison of benthic invertebrate faunaindices
Alfonso Nebra *, Nuno Caiola, Gloria Muñoz-Camarillo, Silvia Rodríguez-Climent,Carles IbáñezIRTA - Aquatic Ecosystems. Ctra. Poble Nou km 5.5, E-43540, Sant Carles de la Ràpita, Spain
A R T I C L E I N F O
Article history:Received 12 November 2013Received in revised form 16 June 2014Accepted 17 June 2014
Keywords:Ecological statusStratified estuaryHydrological alterationTransitional watersBiotic indicesBenthic indicatorsWater Framework Directive
A B S T R A C T
Biotic indices developed to assess the ecological status of coastal waters according to the European WaterFramework Directive (WFD) often show discrepancies when they are applied in transitionalenvironments. Although several indices have been widely used in transitional waters throughoutEurope, there is still a lack of knowledge about their suitability assessing ecological status. We evaluatedthe performance of most common used biotic indices and community parameters (e.g. MultivariateAZTI's Marine Biotic Index (M-AMBI), BENTIX, Benthic Opportunistic Polychaetes Amphipods index(BOPA), diversity indices, species richness, abundance) that have been proposed in the scope of WFD,using data of macroinvertebrate community coming from a special case of transitional water body, thehighly stratified Ebro estuary. Additionally, we tested their ability to respond to the main pressuresaffecting the Ebro estuary, the hydrological alteration due to regulation and the pollution pressure due tonutrient enrichment. Estimation of hydrological alteration was based on flow historical data (period from1913 to 1963), that we assumed as 'hydrological reference conditions' for Ebro estuary. Pollution pressurewas estimated by means of PCA analysis including organic and nutrient enrichment related variables,expressed as a synthetic index by PCA factor scores extraction. All the community parameters were ableto detect changes in macrofauna composition along the estuarine gradients and were able to differentiatebetween the impoverished stations and the healthier ones. Regarding indices, the ratings werecontradictory and only M-AMBI classified the stations in the correct way. Strong significant correlationswere found between indices and metrics and the calculated pressures; nevertheless, these correlationsshowed a paradoxical result, since increasing hydrological alteration benefited the macrofauna,achieving great complexity. Other identified limitations of biotic indices were the oppositeclassifications, overestimation of ecological status and low resolution ability. We conclude that fortransitional water ecosystems, where each water body has particular characteristics, is difficult the use of'common biological' assessment tools as the results of this study, among others (more details indiscussion section), have demonstrated. Nevertheless, M-AMBI seemed to work in the correct way, sofurther investigation about its use for transitional waters is necessary. The development of new strategiessuch as the use of historical data, the use of metrics as a complement for the assessment could be areliable alternative.
ã 2014 Elsevier Ltd. All rights reserved.
1. Introduction
Estuaries are interface systems between rivers and sea,characterized by unstable hydrological, morphological and chem-ical conditions, resulting in stressful habitats where biological
communities are structured along strong environmental gradients(Day et al., 1989; Dauvin, 2007). Nevertheless, these complexecosystems are largely recognized by their high productivity andtheir importance, from both economic and conservation perspec-tives (Ysebaert et al., 1998; Edgar et al., 1999; McLusky, 1999;Pierson et al., 2002; Russell et al., 2006).
The rapid human population growth during the last century hasincreased the pressures over these areas threatening theirecological integrity, their economic value and even affecting
* Corresponding author. Tel.: +34 605 449 464; fax: +34 934 674 042.E-mail address: [email protected] (A. Nebra).
http://dx.doi.org/10.1016/j.ecolind.2014.06.0231470-160X/ã 2014 Elsevier Ltd. All rights reserved.
Ecological Indicators 46 (2014) 177–187
Contents lists available at ScienceDirect
Ecological Indicators
journal homepa ge: www.elsev ier .com/locate /ecol ind
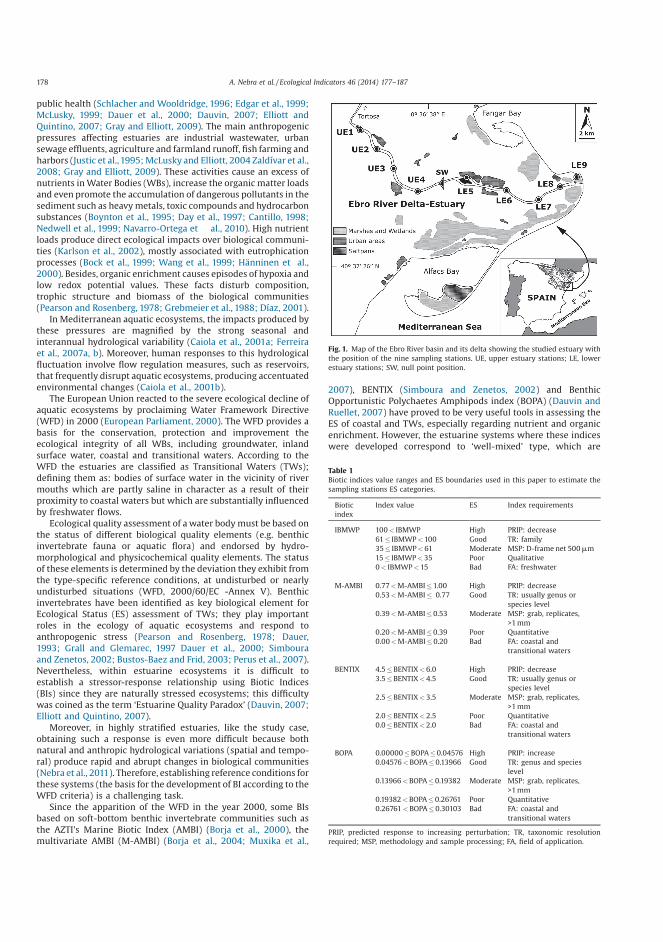
public health (Schlacher and Wooldridge, 1996; Edgar et al., 1999;McLusky, 1999; Dauer et al., 2000; Dauvin, 2007; Elliott andQuintino, 2007; Gray and Elliott, 2009). The main anthropogenicpressures affecting estuaries are industrial wastewater, urbansewage effluents, agriculture and farmland runoff, fish farming andharbors (Justic et al.,1995; McLusky and Elliott, 2004 Zaldívar et al.,2008; Gray and Elliott, 2009). These activities cause an excess ofnutrients in Water Bodies (WBs), increase the organic matter loadsand even promote the accumulation of dangerous pollutants in thesediment such as heavy metals, toxic compounds and hydrocarbonsubstances (Boynton et al., 1995; Day et al., 1997; Cantillo, 1998;Nedwell et al., 1999; Navarro-Ortega et al., 2010). High nutrientloads produce direct ecological impacts over biological communi-ties (Karlson et al., 2002), mostly associated with eutrophicationprocesses (Bock et al., 1999; Wang et al., 1999; Hänninen et al.,2000). Besides, organic enrichment causes episodes of hypoxia andlow redox potential values. These facts disturb composition,trophic structure and biomass of the biological communities(Pearson and Rosenberg, 1978; Grebmeier et al., 1988; Díaz, 2001).
In Mediterranean aquatic ecosystems, the impacts produced bythese pressures are magnified by the strong seasonal andinterannual hydrological variability (Caiola et al., 2001a; Ferreiraet al., 2007a, b). Moreover, human responses to this hydrologicalfluctuation involve flow regulation measures, such as reservoirs,that frequently disrupt aquatic ecosystems, producing accentuatedenvironmental changes (Caiola et al., 2001b).
The European Union reacted to the severe ecological decline ofaquatic ecosystems by proclaiming Water Framework Directive(WFD) in 2000 (European Parliament, 2000). The WFD provides abasis for the conservation, protection and improvement theecological integrity of all WBs, including groundwater, inlandsurface water, coastal and transitional waters. According to theWFD the estuaries are classified as Transitional Waters (TWs);defining them as: bodies of surface water in the vicinity of rivermouths which are partly saline in character as a result of theirproximity to coastal waters but which are substantially influencedby freshwater flows.
Ecological quality assessment of a water body must be based onthe status of different biological quality elements (e.g. benthicinvertebrate fauna or aquatic flora) and endorsed by hydro-morphological and physicochemical quality elements. The statusof these elements is determined by the deviation they exhibit fromthe type-specific reference conditions, at undisturbed or nearlyundisturbed situations (WFD, 2000/60/EC -Annex V). Benthicinvertebrates have been identified as key biological element forEcological Status (ES) assessment of TWs; they play importantroles in the ecology of aquatic ecosystems and respond toanthropogenic stress (Pearson and Rosenberg, 1978; Dauer,1993; Grall and Glemarec, 1997 Dauer et al., 2000; Simbouraand Zenetos, 2002; Bustos-Baez and Frid, 2003; Perus et al., 2007).Nevertheless, within estuarine ecosystems it is difficult toestablish a stressor-response relationship using Biotic Indices(BIs) since they are naturally stressed ecosystems; this difficultywas coined as the term ‘Estuarine Quality Paradox’ (Dauvin, 2007;Elliott and Quintino, 2007).
Moreover, in highly stratified estuaries, like the study case,obtaining such a response is even more difficult because bothnatural and anthropic hydrological variations (spatial and tempo-ral) produce rapid and abrupt changes in biological communities(Nebra et al., 2011). Therefore, establishing reference conditions forthese systems (the basis for the development of BI according to theWFD criteria) is a challenging task.
Since the apparition of the WFD in the year 2000, some BIsbased on soft-bottom benthic invertebrate communities such asthe AZTI's Marine Biotic Index (AMBI) (Borja et al., 2000), themultivariate AMBI (M-AMBI) (Borja et al., 2004; Muxika et al.,
2007), BENTIX (Simboura and Zenetos, 2002) and BenthicOpportunistic Polychaetes Amphipods index (BOPA) (Dauvin andRuellet, 2007) have proved to be very useful tools in assessing theES of coastal and TWs, especially regarding nutrient and organicenrichment. However, the estuarine systems where these indiceswere developed correspond to ‘well-mixed’ type, which are
Fig. 1. Map of the Ebro River basin and its delta showing the studied estuary withthe position of the nine sampling stations. UE, upper estuary stations; LE, lowerestuary stations; SW, null point position.
Table 1Biotic indices value ranges and ES boundaries used in this paper to estimate thesampling stations ES categories.
Bioticindex
Index value ES Index requirements
IBMWP 100 < IBMWP High PRIP: decrease61 � IBMWP < 100 Good TR: family35 � IBMWP < 61 Moderate MSP: D-frame net 500 mm15 � IBMWP < 35 Poor Qualitative0 < IBMWP < 15 Bad FA: freshwater
M-AMBI 0.77 < M-AMBI � 1.00 High PRIP: decrease0.53 < M-AMBI � 0.77 Good TR: usually genus or
species level0.39 < M-AMBI � 0.53 Moderate MSP: grab, replicates,
>1 mm0.20 < M-AMBI � 0.39 Poor Quantitative0.00 < M-AMBI � 0.20 Bad FA: coastal and
transitional waters
BENTIX 4.5 � BENTIX < 6.0 High PRIP: decrease3.5 � BENTIX < 4.5 Good TR: usually genus or
species level2.5 � BENTIX < 3.5 Moderate MSP: grab, replicates,
>1 mm2.0 � BENTIX < 2.5 Poor Quantitative0.0 � BENTIX < 2.0 Bad FA: coastal and
transitional waters
BOPA 0.00000 � BOPA � 0.04576 High PRIP: increase0.04576 < BOPA � 0.13966 Good TR: genus and species
level0.13966 < BOPA � 0.19382 Moderate MSP: grab, replicates,
>1 mm0.19382 < BOPA � 0.26761 Poor Quantitative0.26761 < BOPA � 0.30103 Bad FA: coastal and
transitional waters
PRIP, predicted response to increasing perturbation; TR, taxonomic resolutionrequired; MSP, methodology and sample processing; FA, field of application.
178 A. Nebra et al. / Ecological Indicators 46 (2014) 177–187

systems with different ecological dynamics compared with ‘highlystratified’ estuaries like the Ebro estuary.
The present study analyzes the performance of M-AMBI,BENTIX and BOPA indices developed under the scope of theWFD, to the main anthropic pressures on the Ebro estuary, a highlystratified Mediterranean estuary. It is expected that resultsobtained could assist on the development of a suitable ESassessment approach for salt wedge estuaries.
2. Methods
2.1. Study site
The Ebro estuary (Fig. 1) is a highly stratified or salt-wedgeestuary located at the NE of the Iberian Peninsula (40�4301000N,0�4003000E). The microtidal regime of the Mediterranean Sea about20 cm (Cacchione et al., 1990), promotes the formation of a saltwedge whose dynamics (advance, retreat and permanence) iscontrolled by the river discharge. Continuous river flow valuesexceeding 350–400 m3s�1 pushes the salt wedge from the riverchannel and the estuary becomes a river. Conversely, when theriver discharge is lower than 100 m3s�1, the salt wedge reaches itsmaximum distance upstream 30–32 km from the river mouth(Ibáñez et al., 1997); intermediate flows together with thebathymetry of river-bed placed the salt wedge in differentpositions (Ibáñez et al., 1996). The main land use in the basin(85,362 km2) is agriculture with more than 10,000 km2 ofirrigation, corresponding to approximately 90% of the water usagein the basin (Ibáñez et al., 2008). The main human impacts in thelower Ebro river and therefore its estuary are the strong flowregulation in the whole basin by nearly 190 dams (Batalla et al.,2004) and the nutrient enrichment of river water due to the inputof agricultural and urban sewage effluents (Sierra et al., 2002;Terrado et al., 2006; Falcó et al., 2010). Nevertheless, during thelast 15 years, an improvement of urban sewage treatment togetherwith the restriction in the use of phosphate-based compoundsdimmed the eutrophication process (Ibáñez et al., 2008, 2012a, b).
2.2. Sampling design and laboratory procedures
In order to cover the whole study area nine sampling stationswere established from the river mouth to 37 km upstream. This
stretch included the estuarine freshwater reach potentiallyaccessible by salt wedge (Fig. 1). Each station was sampledseasonally (July and October 2007; January and April 2008) forbenthic macroinvertebrates, in each sampling occasion threesediment samples were collected using a Ponar grab (0.046 m2),sediment grain size and total organic matter (TOM), dissolvedoxygen (DO), chlorophyll a, pheophytin, total suspended solids(TSS), organic suspended solids (OSS), nutrient loadings: phos-phate (PO4), total phosphorous (PT), ammonia (NH4), nitrite (NO2),nitrate (NO3), total nitrogen (NT) and hydromorphological char-acteristics (depth, flow velocity and water transparency) (seeNebra et al., 2011 for detailed sampling and analysis procedures).
2.3. Biotic indices computation
The benthic macroinvertebrates of the Ebro estuary werestructured in two contrasting communities associated with theupper estuary (UE) and lower estuary (LE) stretches, fresh andsaltwater respectively; regardless of the sampling season due tomaintained flows throughout the year (Nebra et al., 2011).Therefore, the sensitivity of the BIs and metrics to humandisturbance was analyzed separately, using specific BIs andmetrics for these two stretches. For the UE, the applied BI was theIberian Biological Monitoring Working Party (IBMWP) (Alba-Tercedor et al., 2002) adapted for WFD requirements by CatalanWater Agency (ACA, 2006) see Table 1 for ES Boundaries andfurther information. Some commonly used freshwater macro-invertebrate metrics were also computed; these were: thepercentages of functional feeding groups (grazers, depositfeeders, parasites, predators and suspension feeders) and thenumber and ratios (total and relative) of invertebrate orderscomprising sensitive taxa (Ephemeroptera, Plecoptera, Trichop-tera, Coleoptera, Bivalvia and Odonata). Regarding LE stations M-AMBI, BENTIX and BOPA were applied (Table 1); the computationof the three marine indices (M-AMBI, BENTIX and BOPA) is basedon the frequencies of functional or ecological groups that areconsidered as metrics. In these cases, besides the BI score, themetrics' individual scores were also analyzed. The descriptions,codes and predictable response to human pressures of thecomputed indices and metrics are summarized in Tables 3, 4 and5. Moreover, the number of taxonomic ranks (families andgenera), Shannon–Wiener diversity, Margalef diversity, Simpsondominance and Pielou's evenness indices as well as community
Table 2Water physic-chemical parameters (annual mean and standard deviation) and sediment characteristics of the 9 sampling stations.
Upper estuary stretch Lower estuary stretch
UE1 UE2 UE3 UE4 LE5 LE6 LE7 LE8 LE9
Mouth distance (km) 37.00 34.00 30.00 25.00 18.00 12.00 6.00 3.00 0.00Salinity 0.65 � 0.13 0.64 � 0.13 0.64 � 0.13 0.65 � 0.13 26.98 � 17.58 34.79 � 2.66 35.34 � 2.00 35.57 � 2.20 28.40 � 16.35DO (mg l�1) 9.43 � 2.92 8.90 � 2.92 9.18 � 3.06 9.99 � 3.23 6.21 � 3.59 6.36 � 3.36 6.82 � 2.42 7.55 � 2.20 8.41 � 1.56DO (%) 98.68 � 21.50 93.18 � 19.77 96.63 � 21.50 105.10 � 20.85 73.50 � 34.82 80.90 � 37.53 88.10 � 26.72 98.48 � 25.85 105.45 � 17.76PO4 (mg l�1) 0.02 � 0.01 0.03 � 0.01 0.03 � 0.00 0.02 � 0.01 0.03 � 0.01 0.01 � 0.01 0.01 � 0.01 0.01 � 0.02 0.01 � 0.02PT (mg l�1) 0.05 � 0.01 0.06 � 0.01 0.05 � 0.01 0.05 � 0.01 0.06 � 0.03 0.04 � 0.02 0.04 � 0.02 0.03 � 0.01 0.03 � 0.02NH4 (mg l�1) 0.04 � 0.05 0.05 � 0.06 0.06 � 0.03 0.13 � 0.18 0.30 � 0.30 0.06 � 0.02 0.03 � 0.01 0.03 � 0.01 0.06 � 0.07NO2 (mg l�1) 0.02 � 0.01 0.02 � 0.01 0.02 � 0.01 0.02 � 0.02 0.02 � 0.02 0.02 � 0.03 0.01 � 0.02 0.01 � 0.01 0.01 � 0.02NO3 (mg l�1) 3.07 � 1.19 2.94 � 1.26 3.01 � 1.32 2.89 � 1.20 1.08 � 1.98 0.87 � 1.63 0.85 � 1.6 0.49 � 0.88 1.01 � 1.93NT (mg l�1) 3.40 � 1.36 3.43 � 1.41 3.45 � 1.39 3.47 � 1.41 1.53 � 2.57 1.38 � 2.37 1.17 � 1.93 0.78� 1.20 1.36 � 2.44SiO4 (mg l�1) 1.26 � 0.39 1.15 � 0.52 1.20 � 0.55 1.35 � 0.40 1.03 � 0.48 0.64 � 0.64 0.39 � 0.55 0.40� 0.38 0.46 � 0.55Chlorophyll (mg l�1) 2.65 � 3.08 0.75 � 0.47 0.87 � 0.70 0.88 � 0.72 0.91 � 0.52 0.87 � 0.95 1.56 � 1.51 1.94 � 1.45 1.37 � 1.04Pheophytin (mg l�1) 2.43 � 3.02 0.99 � 0.86 1.01 � 0.85 1.12 � 1.13 1.18 � 0.73 0.78 � 0.47 0.77 � 0.56 0.61 � 0.43 0.69 � 0.32TSS (mg l�1) 9.21 � 14.52 2.83 � 2.25 4.85 � 2.62 7.32 � 4.07 14.43 � 9.34 13.06 � 10.69 12.52 � 10.61 13.35 � 12.87 32.06 � 30.53OSS (mg l�1) 2.41 � 2.75 1.40 � 0.85 1.59 � 0.33 2.20 � 0.75 3.43 � 2.30 2.92 � 2.18 2.61 � 1.91 2.76 � 2.35 4.21 � 2.29OSS (%) 48.05 � 22.93 59.66 � 26.71 37.27 � 13.08 33.83 � 13.72 25.87 � 6.56 27.2 � 9.76 23.94 � 5.1 23.39 � 4.13 19.62 � 9.70Mud (%) 12.36 � 6.46 0.18 � 0.11 31.56 � 24.48 1.13 � 0.88 1.91 � 1.20 13.22 � 6.04 16.69 � 10.34 15.27 � 0.54 32.36 � 21.25Sand (%) 86.69 � 6.56 43.66 � 16.41 66.53 � 24.69 96.55 � 2.70 97.86 � 1.11 84.33 � 4.24 82.47 � 9.99 69.41 � 12.75 65.13 � 19.93Gravel (%) 0.95 � 0.11 56.16 � 16.31 1.91 � 0.21 2.33 � 1.82 0.23 � 0.08 2.45 � 1.80 0.85 � 0.35 15.33 � 12.21 2.51 � 1.91TOM (%) 3.37 � 0.76 1.30 � 0.28 3.55 � 0.24 2.47 � 1.43 2.09 � 0.24 4.86 � 0.54 3.64 � 1.30 5.07 � 1.79 4.47 � 1.04
A. Nebra et al. / Ecological Indicators 46 (2014) 177–187 179

structure and abundance descriptors (total abundance, densityand taxa richness) were calculated.
2.4. Hydrological alteration
Prior to river regulation in the early sixties, big floods werecommon in the lower Ebro (Ibáñez et al., 1996); the suppression ofsuch floods together with minimum flow conditions in summerand autumn led to an altered salt wedge dynamics in the Ebroestuary. For this reason an estimation of hydrological alterationwas made with the aim of quantifying the effect over the biologicalcommunities. The Hydrological Pressure for the Ebro estuary wasexpressed as the deviation of the salt wedge dynamics from the‘expected natural dynamics’ that it would correspond to eachsampling occasion. For this, the dynamics of the salt wedge(position, probability of occurrence and permanence time in days)was calculated for each sampling station and occasion as a functionof the daily average river flows. The position was estimatedfollowing Ibáñez et al. (1996), permanence time in days wasestimated by counting the accumulated days before each samplingoccasion with mean flow values lower than 350 m3s�1 according toIbáñez (1993), data available at Ebro Basin Authority web site(station 9027: Tortosa). Then, the dynamics of salt wedge (position,presence probability and permanence in days) was computed foreach month and each sampling station during the period from 1913to 1963 using Ebro Water Authority daily average flow values atTortosa station. This time series represents the natural flow period,i.e. period before the construction of the two dams responsible forthe lower Ebro regulation. The Hydrological Pressure was finallyexpressed as the absolute value of the deviation of the salt wedgepresence (expressed as probability and time) from the monthlyaverage probability and number of days of the salt wedge duringnatural flows period.
2.5. Data analysis
Principal Component Analysis (PCA) was performed separatelyfor each estuarine stretch (UE and LE) with the organic pollutionrelated variables (DO, nutrients, chlorophyll a, pheophytin andorganic matter in sediment and in suspension). Kaiser-Meyer-Olkin (KMO) measure of sampling adequacy was used to assess theusefulness of a PCA. KMO ranges from 0 to 1 and should be >0.5 ifvariables are sufficiently interdependent for PCA to be useful(Tabachnick and Fidell, 2001). Once obtained the final PCAs, thetwo first factors of each PCA were merged by summing (invertingthe values if their trends were opposed) as a combined index ofPollution Pressure. One way ANOVA followed by Post-hoc (LSD)test were carried out among stations for testing environmentalparameters differences. To test the response of the BIs and metricsto the anthropogenic disturbance gradient, a correlation analysiswas carried out with the Pollution Pressure index and withHydrological Pressure index (probability and time). The measuredvariables were log or square root transformed (for absolute valuesand percentages, respectively) because homoscedasticity andlinearity were clearly improved. Statistical analyses were per-formed using STATISTICA 8 software.
3. Results
3.1. Benthic environmental condition
During the study period daily mean river discharge was alwaysbelow 350 m3s�1 allowing the penetration of the salt wedge. Thisfact divided the estuary in two different stretches ‘upper and lowerestuary’ (UE and LE); the UE (stations UE1-UE4) had freshwater(0.65 g l�1�0.005) (Table 2); whereas the LE five stations (LE5-LE9) had marine water ranging from (26.98 g l�1�17.58) to(35.57 g l�1� 2.20), ANOVA revealed no significant differencesfor salinity within each stretch. LE stations permanence time of saltwedge was different for each sampling occasion 52, 140, 254 and341 days for summer, autumn, winter and spring, respectively. Thenull point or salt wedge's tip was always located at the sameposition, between UE4-LE5 stations (25–18 Km from river mouth).Regarding nutrient concentrations, in general terms were higher inriver water than in sea water (Table 2); especially for phosphates,nitrates, total nitrogen and silicate. Regarding LE stretch, LE5showed the highest nutrient values such as PO4 (0.03 mg l�1
� 0.01), PT (0.06 mg l�1�0.03) and NH4whose concentration valuewas five times greater than values reported for other stations(0.30 mg l�1�0.30). Regarding LE stations, ANOVA (P < 0.05)revealed significant differences among LE5 and the rest of stationsfor PO4 (post-hoc test, P < 0.0307 to 0.0438), PT (post-hoc test,
Table 3Significant Spearman correlation coefficients among the BI scores, hydrologicalpressure expressed as the deviation of wedge occurrence probability and asdeviation of permanence time from natural flow regime conditions, pollutionpressure, environmental parameters and the community descriptive parameters(UE stretch n = 16; LE stretch n = 20).
Calculated pressures IBMWP M-AMBI BENTIX BOPA
H. pressure (p) – 0.624b �0.570b 0.530a
H. pressure (days) – 0.660b �0.599b 0.554a
P. pressure �0.505a �0.484a 0.520a �0.474a
Environ. parametersDO (mg l�1) – – �0.489a –
NH4 (mg l�1) – �0.490a 0.464a –
PT (mg l�1) 0.580a – – –
TSS (mg l�1) – – – �0.476a
OSS (mg l�1) – �0.458a – �0.512a
TOM (%) �0.648b 0.529a �0.552a 0.502a
Community parametersRichness (S) 0.940b 0.902b �0.838b 0.516a
Number of families 0.957b – – –
Number of genera 0.933b – – –
Density (ind m�2) 0.523a 0.501a �0.588b –
Margalef index (d) 0.942b 0.933b �0.825b 0.582b
Pielou's evenness (J') – 0.629b – 0.663b
Shannon–Wiener index (H') – 0.863b – 0.742b
Simpson index (1-l') – 0.758b – 0.707b
Deposit feeders (%) – – 0.570b –
Grazers (%) 0.816b – – –
Predators (%) – 0.748b �0.887b 0.589b
Suspension feeders (%) �0.573a – – –
DO, dissolved oxygen; PT, total phosphorous; TSS, total suspended solids; OSS,organic suspended solids; TOM, total organic matter in sediment.
a p < 0.05.b p < 0.01.
Table 4Significant Spearman correlation coefficients among the UE Hydrological Pressureexpressed as the deviation of wedge occurrence probability from probability innatural flow regime conditions, UE Pollution Pressure, community descriptiveparameters and the individual metrics (n = 16).
PRIP H. pressure (p) P. pressure
Shannon–Wiener index (H’) Decrease – �0.522a
EPT Decrease – �0.662b
EPT (%) Decrease 0.518a �0.605a
EPT/oligochaeta Decrease – �0.575a
EPT/diptera Decrease – �0.698b
EP Decrease – �0.666b
EP/total taxa (%) Decrease 0.542a –
EPTCBO Decrease – �0.599a
PRIP, predicted response to increasing perturbation; EPT, ephemeroptera,plecoptera and trichoptera; EP, ephemeroptera and plecoptera; EPTCBO, ephemer-optera, plecoptera, trichoptera, coleoptera, bivalvia and odonata.
a p < 0.05.b p < 0.01.
180 A. Nebra et al. / Ecological Indicators 46 (2014) 177–187

P < 0.0297 to 0.0448) and NH4 (post-hoc test, P < 0.0099 to0.0229). The other nutrients showed an increase tendency fromLE9 to LE5, from river mouth to null point. DO values were higher inUE stretch ranging from (8.90 � 2.92) to (9.99 � 3.23); whereas inLE stations oxygen concentrations decreased upstream, the lowestvalues were recorded at stations close to the null point (Table 2).Chlorophyll a concentrations were slightly higher in LE stations butwithout significant differences between UE and LE stations(0.25 mg l�1�0.10 to 0.47 mg l�1�0.07, respectively). Pheophytinlevels in the UE stations were close to 1.00 mg l�1; except for thestation UE1 in which the pheophytin largely exceeded the2.00 mg l�1. The LE stations presented pheophytin levels rangingfrom 0.61 mg l�1�0.43 to 1.18 mg l�1�0.73. The percentage oforganic matter in sediment was slightly higher in LE stationsranging from (2.09 � 0.24) to (4.86 � 0.54); ANOVA (P < 0.05)revealed significant differences in TOM content, among stationsUE1-UE2 (post-hoc test, P < 0.0041), UE2-UE3 (post-hoc test,
P < 0.0024) and LE5 and the rest of stations (except LE7) (post-hoctest, P < 0.0019 to 0.0089).
The first two axes of the PCA for the UE explained 87.17%(62.00% and 25.17%, respectively) of the total variation. KMO(0.561) indicated the usefulness of the PCA; NO2, NO3 and NH4
were positively correlated with the first PCA axis. In contrast, TOM,OSS were positively correlated with second axis. The first andsecond axis of PCA for the LE explained 53.4% and 23.89%respectively of the total variation. KMO (0.692) indicated theusefulness of the PCA; NO2, NO3 and PO4were positively correlatedwith the first PCA axis; the second axis was mainly related with NH4
and
OSS.
3.2. Macroinvertebrate abundance, taxa richness and diversity
A total of 21,805 individuals were collected belonging to 214different taxa; for more detailed community results see Nebra et al.
Fig. 2. Community descriptive parameters (annual mean � standard deviation bars, n = 4) recorded at each station. See Fig. 1 for sampling stations' codification.
A. Nebra et al. / Ecological Indicators 46 (2014) 177–187 181

(2011). Higher densities were found at LE stretch (Fig. 2), especiallyat those stations near river mouth. LE9 station showed an annualmean of 11,650 ind m�2. Intermediate density values were found inupper estuary stations due to the contribution of Tubificidae andthe non-indigenous taxon Corbicula fluminea. The lowest densitiescorresponded to stations UE3, UE4, LE5 and LE6 located aroundnull point. This pattern was similar in taxa richness terms (Fig. 2);station LE9 showed the highest richness values around 50 differenttaxa of annual mean. Stations located near river mouth LE8 and LE7reached high values of richness too; whereas stations UE3, UE4 andLE5 showed the lowest values. Regarding diversity indices, all ofthem showed higher values in LE stations (Fig. 2) with a decreasingtendency towards null point.
3.3. Benthic biological indices and individual metrics
Due to the dynamic of the Ebro estuary specific BIs and metricswere computed for each stretch (UE and LE).
3.3.1. IBMWPAll the families found in UE stations computed for IBMWP
calculation. Concerning UE stations,12.4% were classified as ‘Good’,18.8% as ‘Moderate’, 31.3% as ‘Poor’ and 37.5% as ‘Bad’. There wasn'tany station achieving ‘High’ ES. The worst ES ratings correspondedto stations UE3 and UE4 which ranged between ‘Bad’ and ‘Poor’(Fig. 3); UE2 ranged between ‘Moderate’ and ‘Good’ achieving thiscategory in summer and spring. Station UE1ratings ranged from‘Bad’ to ‘Moderate’. Spearman correlation coefficient reportedsignificant correlations among IBMWP and 10 analyzed variables(Table 3). The Pollution Pressure showed strong negative correla-tion with IBMWP. Regarding community parameters richnessmeasures, density and Margalef index showed significant andstrong positive correlation with IBMWP. Total organic matter insediment showed significant negative correlation with IBMWP.
3.3.2. M-AMBIThe percentage of non-scoring taxa in LE stations was very low
(0.14% � 0.30). results showed that 25.00% of LE stations wereclassified as ‘High’, 45.00% as ‘Good’, 15.00% as ‘Moderate’ and15.00% as ‘Poor’; there were no ‘Bad’ ES rating (Fig. 3). Worst ESratings corresponded to LE5 which ranged between ‘Poor’ and‘Moderate’ (Fig. 3); LE6 ranged between ‘Poor’ and ‘Good’ reachingthis category in the last three sampling occasions. LE7-LE8 showed‘Good’ and ‘High’ ratings in the two first and two last samplingoccasions respectively. The LE9 ES ranged between ‘Moderate’ and‘High’.
Spearman correlation reported significant correlations amongM-AMBI and 13 analyzed factors (Table 3). The HydrologicalPressure as probability and time reported strong positive correla-tion with this index; conversely the Pollution Pressure showednegative correlation. Regarding community parameters, all ofthem showed significant and strong positive correlation with M-AMBI. Ammonium was negatively correlated with M-AMBI.
3.3.3. BENTIXSimilarly to M-AMBI, BENTIX index showed similar percentages
of non-scoring taxa 0.18% � 0.30. Within LE stretch, the 25.00% ofstations were classified as ‘High’, 5.00% as ‘Good’, 55.00% as‘Moderate’ and 15.00% as ‘Poor’; there were no ‘Bad’ ES ratings.Contrary to M-AMBI, best ES ratings corresponded to LE5 whichranged between ‘Moderate’ and ‘High’; this rating was achieved inthree of the sampling occasions (Fig. 3). LE6 ranged between ‘Poor’and ‘High’ achieving ‘Moderate’ rating in two sampling occasions.LE7-LE8 showed similar pattern with ‘Moderate’ category in thethree last sampling occasions; station LE9 ratings ranged between‘Poor’ and ‘Moderate’. Spearman correlation coefficient reported
significant correlations among BENTIX and 11 analyzed variables(Table 3). Both measures of Hydrological Pressure showed strongnegative correlation with BENTIX, nevertheless the Pollutionpressure was positively correlated. Richness and Margalef indexshowed significant and strong negative correlation with BENTIX.
Fig. 3. Ecological status classification of UE and LE stations recorded at eachsampling occasion after applying the four different BIs: IBMWP, M-AMBI, BENTIXand BOPA. See Fig. 1 for sampling stations' codification.
182 A. Nebra et al. / Ecological Indicators 46 (2014) 177–187

Regarding environmental parameters, DO showed negative corre-lation with BENTIX.
3.3.4. BOPAAccording to this index, the benthic estuarine condition ranged
between ‘High’ and ‘Poor’ ES categories; there were no ‘Bad’ ESrating. A 45.00% of LE stations were classified as ‘High’, 25.00% as‘Good’, 20.00% as ‘Moderate’ and 10.00% as ‘Poor’. Best ES ratingscorresponded to station LE5 which reached ‘High’ ES in allsampling occasions; following LE9 with ‘High’ category in three ofthe four sampling occasions (Fig. 3). LE6 ranged between ‘High’ and‘Poor’ ES and together with LE8 were the only ones reaching ‘Poor’rating with BOPA. LE7 ratings ranged between ‘Moderate’ and‘High’ and showed ‘Moderate’ category in two sampling occasions;LE8 was the only station that did not reach ‘High’ ES rating withBOPA.
Spearman correlation analysis indicated significant correlationsamong BOPA and 12 analyzed variables (Table 3). BOPA waspositively correlated with Hydrological Pressure and negativelywith Pollution Pressure. With regard to community descriptiveparameters, richness, Margalef index, Pielou's evenness, Shannon–Wiener's diversity index and Simpson index showed significantstrong positive correlations with BOPA; TSS and OSS showednegative correlation with BOPA.
3.3.5. Individual metricsSpearman correlation coefficients indicated strong significant
negative correlations among Pollution Pressure for UE stretch andmetrics such as Shannon–Wiener index and EPT (see Table 4 fordata and abbreviations). In contrast, Hydrological pressure for UEreach was strong and positively correlated with the percentage ofEPT (%) and EP/Total (%), despite of the predicted response toincreasing perturbation (PRIP) for these two metrics. Spearmancorrelation coefficients indicated strong significant correlationsamong Pollution Pressure for LE stretch and six metrics in theexpected way of their PRIP. Nevertheless, four metrics e.g. BENTIX-GI (%) a sensitive species group, showed a correlation not accordingwith their PRIP. Hydrological pressure for LE stretch showed strongcorrelations with the great part of the metrics; nevertheless thesecorrelations were not according with their PRIP (Table 5).
4. Discussion
4.1. Anthropogenic pressures and environmental condition of Ebroestuary bottom
Currently, main anthropogenic pressures affecting Ebro estuaryare nutrient enrichment and alteration of the natural flow regime.Nutrient loadings of Ebro River are consequence of the inputs ofwastewater mainly from agriculture and urban areas on the wholeEbro basin (Lacorte et al., 2006; Terrado et al., 2006). Wateranalysis revealed similar nutrient concentrations as recorded bySierra et al. (2002) and Falcó et al. (2010). Despite of severeeutrophication episodes occurring in the recent past (Ibáñez et al.,1995), during the last decade the chemical status of Ebro estuaryhas clearly improved. Nutrient inputs have considerably decreasedin the whole basin (Sierra et al., 2002; Ibáñez et al., 2008) limitingthe primary production and therefore the sedimentary input oforganic matter throughout the halocline by entrainment processes,alleviating the impact over estuary bottom (Ibáñez et al., 1995).
Conversely, the hydrological alteration produced by regulationcould be considered the most important anthropogenic pressureaffecting lower Ebro River and therefore its estuary. Regulationmaintains a decreasing tendency of annual mean flow due constantincrement on water demand, mainly for hydroelectric powergeneration and agricultural irrigation (Ibáñez et al., 1996, 2008;Sierra et al., 2004; Falcó et al., 2010). Moreover, natural variationsof river discharge are homogenized through the year buffering theMediterranean seasonality.
The worst impact caused by regulation over estuary ecology,excluding sediment retention by damming and the associatedhabitat loss and delta regression (Ibáñez et al., 1996), is thealteration of salt wedge dynamics. In natural regime flowconditions the salt wedge could advance till its maximum ondry periods or even totally disappear during high flow periods (formore details see Ibáñez et al., 1995, 1996; Movellán, 2004).However, the actual homogeneity in river discharges assures thepresence of the salt wedge virtually in the same position for longperiods (Ibáñez et al., 1995; Sierra et al., 2002; Falcó et al., 2010).This fact was corroborated by results obtained in this study (Fig.1);Ebro estuary remained divided in two contrasting stretches (UEand LE) according with the physicochemical parameters recorded,
Table 5Significant Spearman correlation coefficients among the LE Hydrological Pressure expressed as the deviation of wedge occurrence probability and as deviation of permanencetime from natural flow regime conditions, LE Pollution Pressure and the individual metrics (n = 20).
PRIP H. pressure (p) H. pressure (days) P. pressure
Richness (S) Decrease 0.609b 0.639b �0.578b
Number of families Decrease 0.581b – –
Number of genera Decrease 0.548a – –
Margalef index (d) Decrease 0.629b 0.686b �0.584b
Pielou’s evenness (J’) Decrease 0.450a 0.511a –
Shannon–Wiener index (H’) Decrease 0.604b 0.654b –
Simpson index (1�l’) Decrease 0.542a 0.577a –
Predators (%) Decrease 0.585b 0.637b �0.559a
BENTIX_GI (%) Decrease �0.534a �0.558a 0.503a
BENTIX_GIII (%) Increase 0.597b 0.519a –
BENTIX_Tolerant (%) Increase 0.566b 0.596b �0.498a
BOPA_Amphip. Decrease �0.496a �0.596b 0.609b
BOPA_Polych. Increase 0.591a 0.651b �0.474a
AMBI_GI (%) Decrease – 0.470a �0.488a
AMBI_GII (%) Decrease – 0.504a –
AMBI_GIII (%) Increase – �0.509a 0.487a
AMBI_GIV (%) Increase 0.510a 0.583b –
AMBI_GV (%) Increase 0.513a – –
AMBI_Sensitive (%) Decrease – 0.495a �0.469a
PRIP, predicted response to increasing perturbation.a p < 0.05.b p < 0.01.
A. Nebra et al. / Ecological Indicators 46 (2014) 177–187 183

and supported by the results obtained after analysis of macro-invertebrate community (Nebra et al., 2011).
Coupled to long periods of salt wedge the water quality isworsening below the halocline due low water renewal rate; sincefreshwater flushing events are important for removing theaccumulated pollutants and materials (Pierson et al., 2002). Theentrainment processes between layers allows sedimentation ofsuspension particles and died organisms from the upper layer tothe bottom (Lewis, 1997). This input of organic matter togetherwith the sewage effluents discharged by two urban areas locateddownstream (Fig.1) and suspension materials coming from the seaundergo a progressive accumulation towards the null point byfrontal convergent circulation (Largier, 1993). The chemicalreactions at the sediment surface releasing nutrients and organicmatter decomposition (Stanley and Nixon, 1992; Pierson et al.,2002) could explain nutrient and oxygen concentrations found atLE5-LE6 stations (Table 2). The accumulation of diverse materialscould promote eutrophication and oxygen depletion throughmicrobial consumption (Stanley and Nixon, 1992; Largier 1993;Pierson et al., 2002) as occurred in the 90 's decade. Despite wateranoxia was not recorded at any station of LE stretch, certainhypoxia with a declining gradient in DO from river mouth to nullpoint was identified during study period; conversely, oxygenvalues for UE stretch were not a limiting factor. Benthic macro-invertebrates were more exposed to high nutrient levels and lowdissolved oxygen concentrations from mouth to null point, benthiccondition improved upstream once overcome null point. Insummary, the Ebro estuary is recovering its chemical statusapproaching it to ‘chemical reference conditions’, on the otherhand regulation is distancing the Ebro estuary from ‘hydrologicalreference conditions’, whose for this type of estuaries means greathydrological variation, this fact is especially relevant due toMediterranean climate seasonality.
The novelty of this study lies in the way to quantifyanthropogenic pressures; pollution pressure was estimated byPCA analysis including organic enrichment related variables,expressed as a synthetic index by PCA factor scores extraction.Estimation of hydrological alteration was based in historical data(period from 1913; to 1963), that we assume as ‘hydrologicalreference conditions’ for Ebro estuary. This way, allowed us toevaluate deviation of salt wedge dynamics from natural conditionand therefore its relevance for estuarine ecology. We identify anincrease on occurrence probability and permanence time for LEstretch and just the opposite for UE stretch.
4.2. Response of macroinvertebrate community to increasingperturbation
Differences found in macroinvertebrate community withineach estuary stretch seemed to be independent from sedimentgrain-size and salinity. The lack of salinity gradient and the smallvariations recorded in sediment composition suggested otherfactors causing changes in community, such as the accumulationof nutrients or pollutants, the degree of exposition, organicmatter, oxygen saturation or the water renewal among others(Carvalho et al., 2006). The impoverishment tendency followedby macroinvertebrate community in LE stretch was in accordancewith nutrient enrichment and hypoxia gradients described. Thevariability of the community parameters showed a markedspatial difference among the studied stations. In an overall viewrichness, density and diversity indices decreased progressivelyalong nutrient enrichment and oxygen depletion gradient fromriver mouth to the null point; once overcome this stressed zonethese parameters increased again upwards (Fig. 2). Regarding LEstretch, those stations with degraded condition benthos (LE5 andLE6) had fewer species, lower abundances and lower diversity
values than stations with a healthier benthos (LE7, LE8 and LE9).Thus, the community parameters seemed to characterize thestations coherently with the environmental gradients identifiedin the estuary bottom. Nevertheless, there are other possibleexplanations for community impoverishment tendency land-wards; only euryhaline taxa are able to displace simultaneouslywith salt wedge's tip, its advance and retreat varied during daywith discharge fluctuations depending on electric power genera-tion demand. This fact force stenobiontic taxa to disappear.Seawards this stress disappears increasing the stability of abioticfactors; then the complexity of community is recovered assuggested by Sousa et al. (2006). Moreover, stations located nearmouth (LE7, LE8 and LE9) can be easily recolonized by constantinput of species from adjacent marine areas (Teske andWooldridge, 2001). Also, Josefson and Hansen (2004) pointedout the low velocity of salt water flux into the estuaries as a causeof low richness by regulating larval dispersal from adjacent seaareas. Despite we found long periods of salt wedge's permanence,time enough to assure the colonization of stations LE7 and LE8.These stations demonstrated to be especially complex incomposition, showing high richness and density values. Thus‘elasticity’ (rapid community recovery), that is promoted by thepresence of undisturbed communities in the vicinity of aparticular site (Muxika et al., 2005), was assured. The option ofdaily stress at stations close to null point seemed to be plausibleand complementary with oxygen-nutrient gradient and notmutually exclusive.
4.3. Biotic indices and metrics suitability
Results obtained in this study evidenced that suitableecological status assessment of TWs is a really complex task. Itis important to consider overall hindrances and limitationsconcerning TWs, such as description of reference conditions oridentification of typologies, as well as the study case's particularones. In the Ebro estuary case we found assessment difficultiesdue to its particular characteristics (stratified estuary). Withrespect to UE stations, the IBMWP showed no correlation withHydrological Pressure; probably due to IBMWP was designed toassess impact of organic enrichment or because deviationsobtained from natural flow regime were quite small to reflectthem in a clear impact to freshwater reach community.Nevertheless, results showed that IBMWP and several metrics,e.g. Shannon–Wiener index or EPT, responded to PollutionPressure in the expected way (negatively correlated), accordingwith the PRIP. Despite of the sampling method used was not themost suitable for IBMWP; it showed an acceptable discriminatoryability identifying four ES categories.
Concerning LE stations, the response of community parametersand individual metrics was the expected showing negativecorrelation with the Pollution Pressure, except for those metricsbeing part of BENTIX and BOPA (Tables 3 and 5). Nevertheless, thisstudy revealed a paradoxical response to increasing HydrologicalPressure as probability or permanence time; keeping in mind thatthe expected response for a pressure is a clear negative impact overbiological communities (richness loss, enhance high abundance offew species and low diversities), correlation analysis revealed thatRichness, diversity indices and M-AMBI showed a positiveresponse to increasing hydrological alteration just the oppositeof their PRIP. Thus, hydrological alteration led to an artificialstability of abiotic conditions facilitating the prompt achievementof ‘environmental homeostasis’, this promote the substitution ofmacroinvertebrate community by other community best struc-tured, integrated by typical members of coastal areas and with agreat complexity comparing with community found in othertemperate estuaries (Nebra et al., 2011).
184 A. Nebra et al. / Ecological Indicators 46 (2014) 177–187
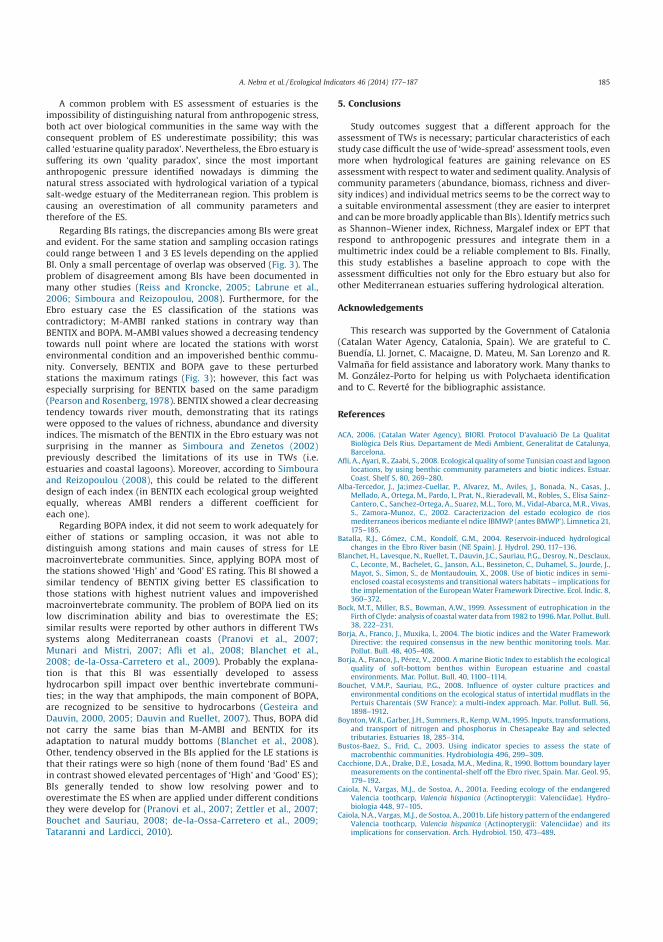
A common problem with ES assessment of estuaries is theimpossibility of distinguishing natural from anthropogenic stress,both act over biological communities in the same way with theconsequent problem of ES underestimate possibility; this wascalled ‘estuarine quality paradox’. Nevertheless, the Ebro estuary issuffering its own ‘quality paradox’, since the most importantanthropogenic pressure identified nowadays is dimming thenatural stress associated with hydrological variation of a typicalsalt-wedge estuary of the Mediterranean region. This problem iscausing an overestimation of all community parameters andtherefore of the ES.
Regarding BIs ratings, the discrepancies among BIs were greatand evident. For the same station and sampling occasion ratingscould range between 1 and 3 ES levels depending on the appliedBI. Only a small percentage of overlap was observed (Fig. 3). Theproblem of disagreement among BIs have been documented inmany other studies (Reiss and Kroncke, 2005; Labrune et al.,2006; Simboura and Reizopoulou, 2008). Furthermore, for theEbro estuary case the ES classification of the stations wascontradictory; M-AMBI ranked stations in contrary way thanBENTIX and BOPA. M-AMBI values showed a decreasing tendencytowards null point where are located the stations with worstenvironmental condition and an impoverished benthic commu-nity. Conversely, BENTIX and BOPA gave to these perturbedstations the maximum ratings (Fig. 3); however, this fact wasespecially surprising for BENTIX based on the same paradigm(Pearson and Rosenberg, 1978). BENTIX showed a clear decreasingtendency towards river mouth, demonstrating that its ratingswere opposed to the values of richness, abundance and diversityindices. The mismatch of the BENTIX in the Ebro estuary was notsurprising in the manner as Simboura and Zenetos (2002)previously described the limitations of its use in TWs (i.e.estuaries and coastal lagoons). Moreover, according to Simbouraand Reizopoulou (2008), this could be related to the differentdesign of each index (in BENTIX each ecological group weightedequally, whereas AMBI renders a different coefficient foreach one).
Regarding BOPA index, it did not seem to work adequately foreither of stations or sampling occasion, it was not able todistinguish among stations and main causes of stress for LEmacroinvertebrate communities. Since, applying BOPA most ofthe stations showed ‘High’ and ‘Good’ ES rating. This BI showed asimilar tendency of BENTIX giving better ES classification tothose stations with highest nutrient values and impoverishedmacroinvertebrate community. The problem of BOPA lied on itslow discrimination ability and bias to overestimate the ES;similar results were reported by other authors in different TWssystems along Mediterranean coasts (Pranovi et al., 2007;Munari and Mistri, 2007; Afli et al., 2008; Blanchet et al.,2008; de-la-Ossa-Carretero et al., 2009). Probably the explana-tion is that this BI was essentially developed to assesshydrocarbon spill impact over benthic invertebrate communi-ties; in the way that amphipods, the main component of BOPA,are recognized to be sensitive to hydrocarbons (Gesteira andDauvin, 2000, 2005; Dauvin and Ruellet, 2007). Thus, BOPA didnot carry the same bias than M-AMBI and BENTIX for itsadaptation to natural muddy bottoms (Blanchet et al., 2008).Other, tendency observed in the BIs applied for the LE stations isthat their ratings were so high (none of them found ‘Bad’ ES andin contrast showed elevated percentages of ‘High’ and ‘Good’ ES);BIs generally tended to show low resolving power and tooverestimate the ES when are applied under different conditionsthey were develop for (Pranovi et al., 2007; Zettler et al., 2007;Bouchet and Sauriau, 2008; de-la-Ossa-Carretero et al., 2009;Tataranni and Lardicci, 2010).
5. Conclusions
Study outcomes suggest that a different approach for theassessment of TWs is necessary; particular characteristics of eachstudy case difficult the use of ‘wide-spread’ assessment tools, evenmore when hydrological features are gaining relevance on ESassessment with respect to water and sediment quality. Analysis ofcommunity parameters (abundance, biomass, richness and diver-sity indices) and individual metrics seems to be the correct way toa suitable environmental assessment (they are easier to interpretand can be more broadly applicable than BIs). Identify metrics suchas Shannon–Wiener index, Richness, Margalef index or EPT thatrespond to anthropogenic pressures and integrate them in amultimetric index could be a reliable complement to BIs. Finally,this study establishes a baseline approach to cope with theassessment difficulties not only for the Ebro estuary but also forother Mediterranean estuaries suffering hydrological alteration.
Acknowledgements
This research was supported by the Government of Catalonia(Catalan Water Agency, Catalonia, Spain). We are grateful to C.Buendía, Ll. Jornet, C. Macaigne, D. Mateu, M. San Lorenzo and R.Valmaña for field assistance and laboratory work. Many thanks toM. González-Porto for helping us with Polychaeta identificationand to C. Reverté for the bibliographic assistance.
References
ACA, 2006. (Catalan Water Agency), BIORI. Protocol D'avaluaciò De La QualitatBiològica Dels Rius. Departament de Medi Ambient, Generalitat de Catalunya,Barcelona.
Afli, A., Ayari, R., Zaabi, S., 2008. Ecological quality of some Tunisian coast and lagoonlocations, by using benthic community parameters and biotic indices. Estuar.Coast. Shelf S. 80, 269–280.
Alba-Tercedor, J., Ja;imez-Cuellar, P., Alvarez, M., Aviles, J., Bonada, N., Casas, J.,Mellado, A., Ortega, M., Pardo, I., Prat, N., Rieradevall, M., Robles, S., Elisa Sainz-Cantero, C., Sanchez-Ortega, A., Suarez, M.L., Toro, M., Vidal-Abarca, M.R., Vivas,S., Zamora-Munoz, C., 2002. Caracterizacion del estado ecologico de riosmediterraneos ibericos mediante el ndice IBMWP (antes BMWP'). Limnetica 21,175–185.
Batalla, R.J., Gómez, C.M., Kondolf, G.M., 2004. Reservoir-induced hydrologicalchanges in the Ebro River basin (NE Spain). J. Hydrol. 290, 117–136.
Blanchet, H., Lavesque, N., Ruellet, T., Dauvin, J.C., Sauriau, P.G., Desroy, N., Desclaux,C., Leconte, M., Bachelet, G., Janson, A.L., Bessineton, C., Duhamel, S., Jourde, J.,Mayot, S., Simon, S., de Montaudouin, X., 2008. Use of biotic indices in semi-enclosed coastal ecosystems and transitional waters habitats – implications forthe implementation of the European Water Framework Directive. Ecol. Indic. 8,360–372.
Bock, M.T., Miller, B.S., Bowman, A.W., 1999. Assessment of eutrophication in theFirth of Clyde: analysis of coastal water data from 1982 to 1996. Mar. Pollut. Bull.38, 222–231.
Borja, A., Franco, J., Muxika, I., 2004. The biotic indices and the Water FrameworkDirective: the required consensus in the new benthic monitoring tools. Mar.Pollut. Bull. 48, 405–408.
Borja, A., Franco, J., Pérez, V., 2000. A marine Biotic Index to establish the ecologicalquality of soft-bottom benthos within European estuarine and coastalenvironments. Mar. Pollut. Bull. 40, 1100–1114.
Bouchet, V.M.P., Sauriau, P.G., 2008. Influence of oyster culture practices andenvironmental conditions on the ecological status of intertidal mudflats in thePertuis Charentais (SW France): a multi-index approach. Mar. Pollut. Bull. 56,1898–1912.
Boynton, W.R., Garber, J.H., Summers, R., Kemp, W.M.,1995. Inputs, transformations,and transport of nitrogen and phosphorus in Chesapeake Bay and selectedtributaries. Estuaries 18, 285–314.
Bustos-Baez, S., Frid, C., 2003. Using indicator species to assess the state ofmacrobenthic communities. Hydrobiologia 496, 299–309.
Cacchione, D.A., Drake, D.E., Losada, M.A., Medina, R., 1990. Bottom boundary layermeasurements on the continental-shelf off the Ebro river, Spain. Mar. Geol. 95,179–192.
Caiola, N., Vargas, M.J., de Sostoa, A., 2001a. Feeding ecology of the endangeredValencia toothcarp, Valencia hispanica (Actinopterygii: Valenciidae). Hydro-biologia 448, 97–105.
Caiola, N.A., Vargas, M.J., de Sostoa, A., 2001b. Life history pattern of the endangeredValencia toothcarp, Valencia hispanica (Actinopterygii: Valenciidae) and itsimplications for conservation. Arch. Hydrobiol. 150, 473–489.
A. Nebra et al. / Ecological Indicators 46 (2014) 177–187 185

Cantillo, A.Y., 1998. Comparison of results of mussel watch programs of the UnitedStates and France with worldwide mussel watch studies. Mar. Pollut. Bull. 36,712–717.
Carvalho, S., Gaspar, M.B., Moura, A., Vale, C., Antunes, P., Gil, O., da Fonseca, L.C.,Falcao, M., 2006. The use of the marine biotic index AMBI in the assessment ofthe ecological status of the Obidos lagoon (Portugal). Mar. Pollut. Bull. 52,1414–1424.
Dauer, D.M., 1993. Biological criteria, environmental health and estuarine macro-benthic community structure. Mar. Pollut. Bull. 26, 249–257.
Dauer, D.M., Ranasinghe, J.A., Weisberg, S.B., 2000. Relationships between benthiccommunity condition, water quality, sediment quality, nutrient loads, and landuse patterns in Chesapeake Bay. Estuaries 23, 80–96.
Dauvin, J.C., 2007. Paradox of estuarine quality: benthic indicators and indices,consensus or debate for the future. Mar. Pollut. Bull. 55, 271–281.
Dauvin, J.C., Ruellet, T., 2007. Polychaete/amphipod ratio revisited. Mar. Pollut. Bull.55, 215–224.
Day, J.W., Hall, C.A.S., Kemp, W.M., Yáñez-Arancibia, A., 1989. Estuarine Ecology.John Wiley and Sons Ltd, New York.
Day, J.W., Martin, J.F., Cardoch, L., Templet, P.H., 1997. System functioning as a basisfor sustainable management of deltaic ecosystems. Coast. Manage. 25, 115–153.
de-la-Ossa-Carretero, J.A., del-Pilar-Ruso, Y., Gimenez-Casalduero, F., Sanchez-Lizaso, J.L., 2009. Testing BOPA index in sewage affected soft-bottomcommunities in the north-western Mediterranean. Mar. Pollut. Bull. 58,332–340.
Díaz, R.J., 2001. Overview of hypoxia around the world. J. Environ. Qual. 30, 275–281.Edgar, G.J., Barrett, N.S., Last, P.R., 1999. The distribution of macroinvertebrates and
fishes in Tasmanian estuaries. J. Biogeogr. 26, 1169–1189.Elliott, M., Quintino, V., 2007. The estuarine quality paradox, environmental
homeostasis and the difficulty of detecting anthropogenic stress in naturallystressed areas. Mar. Pollut. Bull. 54, 640–645.
European Parliament, 2000. Directive /60/EC of the European Parliament and of thecouncil establishing a framework for the community action in the field of waterpolicy. Off. J. Eur. Union 327, 1–73.
Falcó, S., Niencheski, L.F., Rodilla, M., Romero, I., del Rio, J.G., Sierra, J.P., Mosso, C., 2010.Nutrient flux and budget in the Ebro estuary. Estuar. Coast. Shelf S. 87, 92–102.
Ferreira, T., Caiola, N., Casals, F., Oliveira, J.M., De Sostoa, A., 2007a. Assessingperturbation of river fish communities in the Iberian Ecoregion. Fish. Manage.Ecol. 14, 519–530.
Ferreira, T., Oliveira, J., Caiola, N., de Sostoa, A., Casals, F., Cortes, R., Economou, A.,Zogaris, S., García-Jalón, D., Ilheu, M., Martínez-Capel, F., Pont, D., Rogers, C.,Prenda, J., 2007b. Ecological traits of fish assemblages from MediterraneanEurope and their responses to human disturbance. Fish. Manage. Ecol. 14,473–481.
Gesteira, J.L.G., Dauvin, J.C., 2000. Amphipods are good bioindicators of the impactof oil spills on soft-bottom macrobenthic communities. Mar. Pollut. Bull. 40,1017–1027.
Gesteira, J.L.G., Dauvin, J.C., 2005. Impact of the Aegean Sea oil spill on the subtidalfine sand macrobenthic community of the Ares-Betanzos Ría (NorthwestSpain). Mar. Environ. Res. 60, 289–316.
Grall, J., Glemarec, M., 1997. Using biotic indices to estimate macrobenthiccommunity perturbations in the Bay of Brest. Estuar. Coast. Shelf S. 44, 43–53.
Gray, J.S., Elliott, M., 2009. The Ecology of Marine Sediments, second ed. CambridgeUniversity Press, Cambridge.
Grebmeier, J.M., McRoy, C.P., Feder, H.M., 1988. Pelagic-benthic coupling on the shelfof the northern Bering and Chukchi seas. l. Food-supply source and benthicbiomass. Mar. Ecol. Prog. Ser. 48, 57–67.
Hänninen, J., Vuorinen, I., Helminen, H., Kirkkala, T., Lehtila, K., 2000. Trends andgradients in nutrient concentrations and loading in the Archipelago Seanorthern Baltic, in 1970–1997. Estuar. Coast. Shelf S. 50, 153–171.
Ibáñez, C., 1993. Dinàmica Hidrològica I Funcionament Ecològic Del Tram EstuariDel Ebre. University of Barcelona, Barcelona.
Ibáñez, C., Alcaraz, C., Caiola, N., Rovira, A., Trobajo, R., Alonso, M., Durán, C., Jiménez,P.J., Munné, A., Prat, N., 2012a. Regime shift from phytoplankton to macrophytedominance in a large river: top-down versus bottom-up effects. Sci. TotalEnviron. 416, 314–322.
Ibáñez, C., Caiola, N., Rovira, A., Real, M., 2012b. Monitoring the effects of floods onsubmerged macrophytes in a large river. Sci. Total Environ. 440, 132–139.
Ibáñez, C., Pont, D., Prat, N.,1997. Characterization of the Ebre and Rhone estuaries: abasis for defining and classifying salt-wedge estuaries. Limnol. Oceanogr. 42,89–101.
Ibáñez, C., Prat, N., Canicio, A., 1996. Changes in the hydrology and sedimenttransport produced by large dams on the lower Ebro River and its estuary. Regul.Rivers Res. Manage. 12, 51–62.
Ibáñez, C., Prat, N., Durán, C., Pardos, M., Munné, A., Andreu, R., Caiola, N., Cid, N.,Hampel, H., Sánchez, R., Trobajo, R., 2008. Changes in dissolved nutrients in thelower Ebro River: causes and consequences. Limnetica 27, 131–142.
Ibáñez, C., Rodrigues-Capitulo, A., Prat, N., 1995. The combined impacts of riverregulation and eutrophication on the dynamicsof the salt wedge and theecology of the lower Ebro River. The Ecological Basis for River Management.John Wiley and Sons, Chichester, UK, pp. 105–114.
Josefson, A.B., Hansen, J.L.S., 2004. Species richness of benthic macrofauna in Danishestuaries and coastal areas. Global Ecol. Biogeogr. 13, 273–288.
Justic, D., Rabalais, N.N., Turner, R.E., Dortch, Q., 1995. Changes in nutrient structureof river-dominated coastal waters stoichiometric nutrient balance and itsconsequences. Estuar. Coast. Shelf S. 40, 339–356.
Karlson, K., Rosenberg, R., Bonsdorff, E., 2002. Temporal and spatial large-scaleeffects of eutrophication and oxygen deficiency on benthic fauna inScandinavian and Baltic waters – a review. Oceanogr. Mar. Biol.: Ann. Rev.40, 427–489.
Labrune, C., Amouroux, J.M., Sarda, R., Dutrieux, E., Thorin, S., Rosenberg, R.,Gremare, A., 2006. Characterization of the ecological quality of the coastal Gulfof Lions (NW Mediterranean). A comparative approach based on three bioticindices. Mar. Pollut. Bull. 52, 34–47.
Lacorte, S., Raldua, D., Martínez, E., Navarro, A., Diez, S., Bayona, J.M., Barcelò, D.,2006. Pilot survey of a broad range of priority pollutants in sediment and fishfrom the Ebro river basin (NE Spain). Environ. Pollut. 140, 471–482.
Largier, J.L., 1993. Estuarine fronts – how important are they. Estuaries 16, 1–11.Lewis, R., 1997. Dispersion in Estuaries and Coastal Waters. John Wiley and Sons Ltd,
Michigan.McLusky, D.S.,1999. Estuarine benthic ecology: a European perspective. Aust. J. Ecol.
24, 302–311.McLusky, D.S., Elliott, M., 2004. The Estuarine Ecosystem: Ecology, Threats and
Management, third ed. Oxford University Press Inc., New York.Movellán, E., 2004. Modelado De La Cuña Salina Y Del Flujo De Nutrientes En El
Tramo Estuarino Del Río Ebro. University of Barcelona, Barcelona.Munari, C., Mistri, M., 2007. Evaluation of the applicability of a fuzzy index of
ecosystem integrity (FINE) to characterize the status of Tyrrhenian lagoons.Mar. Environ. Res. 64, 629–638.
Muxika, I., Borja, A., Bald, J., 2007. Using historical data, expert judgment andmultivariate analysis in assessing reference conditions and benthic ecologicalstatus, according to the European Water Framework Directive. Mar. Pollut. Bull.55, 16–29.
Muxika, I., Borja, A., Bonne, W., 2005. The suitability of the marine biotic index(AMBI) to new impact sources along European coasts. Ecol. Indic. 5, 19–31.
Navarro-Ortega, A., Tauler, R., Lacorte, S., Barcelo, D., 2010. Occurrence and transportof PAHs, pesticides and alkylphenols in sediment samples along the Ebro RiverBasin. J. Hydrol. 383, 5–17.
Nebra, A., Caiola, N., Ibáñez, C., 2011. Community structure of benthic macro-invertebrates inhabiting a highly stratified Mediterranean estuary. Sci. Mar. 75,577–584.
Nedwell, D.B., Jickells, T.D., Trimmer, M., Sanders, R., 1999. Nutrients in estuaries.Estuaries. Adv. Ecol. Res. 29, 43–92.
Pearson, T.H., Rosenberg, R., 1978. Macrobenthic succession in relation to organicenrichment and pollution of the marine environment. Oceanogr. Mar. Biol. Ann.Rev. 16, 229–311.
Perus, J., Bonsdorff, E., Back, S., Lax, H.-G., Villnas, A., Westberg, V., 2007. Zoobenthosas indicators of ecological status in coastal brackish waters: a comparative studyfrom the Baltic Sea. Ambio 36, 250–256.
Pierson, W.L., Bishop, K., Van Senden, D., Horton, P.R., Adamantilis, C.A., 2002.Environmental Water Requirements to Maintain Estuarine Processes. Environ-mental Flows Initiative, Technical Report Number 3, Water Research LaboratoryTechnical Report /11, Environmental Flows Initiative Technical Report, 3,National River Health Program. Report prepared for EnvironmentAustralia.
Pranovi, F., Da Ponte, F., Torricelli, P., 2007. Application of biotic indices andrelationship with structural and functional features of macrobenthic commu-nity in the lagoon of Venice: an example over a long time series of data. Mar.Pollut. Bull. 54, 1607–1618.
Reiss, H., Kroncke, I., 2005. Seasonal variability of benthic indices: an approach totest the applicability of different indices for ecosystem quality assessment. Mar.Pollut. Bull. 50, 1490–1499.
Russell, M.J., Montagna, P.A., Kalke, R.D., 2006. The effect of freshwater inflow on netecosystem metabolism in Lavaca Bay Texas. Estuar. Coast. Shelf S. 68, 231–244.
Schlacher, T.A., Wooldridge, T.H., 1996. Ecological responses to reductions infreshwater supply and quality in South Africa's estuaries: lessons formanagement and conservation. J. Coast. Conserv. 2, 115–130.
Sierra, J.P., Sánchez-Arcilla, A., del Rio, J.G., Flos, J., Movellán, E., Mösso, C., Martínez,R., Rodilla, M., Falcó, S., Romero, I., 2002. Spatial distribution of nutrients in theEbro estuary and plume. Cont. Shelf Res. 22, 361–378.
Sierra, J.P., Sánchez-Arcilla, A., Figueras, P.A., del Rio, J.G., Rassmussen, E.K., Mösso,C., 2004. Effects of discharge reductions on salt wedge dynamics of the EbroRiver. River Res. Appl. 20, 61–77.
Simboura, N., Reizopoulou, S., 2008. An intercalibration of classification metrics ofbenthic macroinvertebrates in coastal and transitional ecosystems of theEastern Mediterranean ecoregion (Greece). Mar. Pollut. Bull. 56, 116–126.
Simboura, N., Zenetos, A., 2002. Benthic indicators to use in ecological qualityclassification of Mediterranean soft bottom marine ecosystems, including a newbiotic index. Mediterr. Mar. Sci. 3, 77–111.
Sousa, R., Dias, S., Antunes, J.C., 2006. Spatial subtidal macrobenthic distribution inrelation to abiotic conditions in the Lima estuary, NW of Portugal. Hydrobiologia559, 135–148.
Stanley, D.W., Nixon, S.W., 1992. Stratification and bottom-water hypoxia in thePamlico River estuary. Estuaries 15, 270–281.
Tabachnick, B.G., Fidell, L.S., 2001. Computer-Assisted Research Design and Analysis.Allyn and Bacon, Boston.
Tataranni, M., Lardicci, C., 2010. Performance of some biotic indices in the realvariable world: a case study at different spatial scales in North-WesternMediterranean Sea. Environ. Pollut. 158, 26–34.
Terrado, M., Barceló, D., Tauler, R., 2006. Identification and distribution ofcontamination sources in the Ebro river basin by chemometrics modelingcoupled to geographical information systems. Talanta 70, 691–704.
186 A. Nebra et al. / Ecological Indicators 46 (2014) 177–187

Teske, P.R., Wooldridge, T., 2001. A comparison of the macrobenthic faunas ofpermanently open and temporarily open/closed South African estuaries.Hydrobiologia 464, 227–243.
Wang, P.F., Martin, J., Morrison, G., 1999. Water quality and eutrophication on TampaBay Florida. Estuar. Coast. Shelf S. 49, 1–20.
Ysebaert, T., Meire, P., Coosen, J., Essink, K., 1998. Zonation of intertidal macro-benthos in the estuaries of Schelde and Ems. Aquat. Ecol. 32, 53–71.
Zaldívar, J.M., Cardoso, A.C., Viaroli, P., Newton, A., de Wit, R., Ibáñez, C., Reizopoulou,S., Somma, F., Razinkovas, A., Basset, A., Holmer, M., Murray, N., 2008.Eutrophication in transitional waters: an overview. Transit. Waters Monogr. 1,1–78.
Zettler, M.L., Schiedek, D., Bobertz, B., 2007. Benthic biodiversity indices versussalinity gradient in the southern Baltic Sea. Mar. Pollut. Bull. 55, 258–270.
A. Nebra et al. / Ecological Indicators 46 (2014) 177–187 187


[email protected] https://www.researchgate.net/profile/Alfonso_Nebra/
http://www.linkedin.com/in/anebracostas/