ecological study
TRANSCRIPT

Ecological
StudyAchievement Standard Science 1.12
4 Internal Credits
Ms Gibellini

Achievement Standard
describes observations or findings;
uses findings to identify change in environmental
factors; and
describes how changes in environmental factors
affect organisms.
Uses findings and biological ideas and makes
significant causal links between changed
environmental factors and the ecosystem
characteristics or process including the impact on
organisms and the implications for the ecosystem as
a whole

SLO Describe the components of an ecosystem, including
abiotic and biotic factors
Define ecological niche and give examples
Draw food chains and webs and identify keystone species and effects of changes on systems
Describe intra and inter specific relationships within a community
Discuss the importance of diversity within a populations
Identify the impacts humans can have on ecosystems
Discuss the effects of urbanisation, on the above factors of an ecosystem
Carry out measuring of abiotic and biotic factors
Graph and interpret data

TermsTerm Definition
Abiotic Non living
Biotic Living
Ecosystem All the non living and living things within a
large defined area
Population A group of interbreeding organisms
Substrate The ground contents (soil, concrete, sand)
Urbanisation Removal of natural habitat to build
houses, roads, foot paths
Erosion Break down and removal of soil particles
Intraspecific Relationships within the same species
interspecific Relationships between species

SLO
Describe the components of an
ecosystem, including abiotic and biotic
factors


Abiotic vs biotic factorsAbiotic
non living
Temperature
Light intensity
Moisture
Substrate
Chemicals/pH
Biotic Predators
Prey
Courtship and
mating behaviours
competition

Success Criteria
List the abiotic factors
School Grounds
Esby Park
List the biotic factors
School Grounds
Esby Park

Success Criteria List the abiotic factors
School Grounds
sand, gravel nearby, housing, high temperature, high light, high winds, dusty, low pH, low dissolved oxygen, high turbidity, no leaf litter, little variation to stream shape
Easby Park
Low light, large rocks, clay, leaf litter, low winds, low temperatures, high rainfall, high dissolved oxygen, faster flowing stream, irregular shape and bottom, steep cliff on side of stream
List the biotic factors
School Grounds
Low diversity, snails, worms, grass, flax, algae
Easby
Mayfly nymphs, stonefly nymphs, damsel flies leaf litter, freshwater crayfish, native tree – five finger, titoki, beech, broadleaf, ferns, pungas, fallen trees (rotting) near/on bank

SLO
Define ecological niche
and give examples

Ecological Niche
An organisms ecological niche includes:
- Where it lives
- What it eats
- Its predators
- Adaptations it has to help it survive
- When its active (day or night)
- https://www.youtube.com/watch?v=xIVixvcR4Jc

Success CriteriaResearch and find out:
Describe the ecological niche of
Mayfly nymph Healthy Stream
Herbivore, lives under rocks, fast moving water, predators are fish and birds, active day and night, hooks to hold onto rocks so doesn’t get washed away, gills so it can breath underwater, cannot tolerate poor water quality
Worm Polluted Stream
Eats mud and plants, breaths through body walls, can regrow parts, tolerate poor water quality
(Where it lives, What it eats, Adaptations it has to help it survive, When its active (day or night), what eats it

SLO
Draw food chains and webs
and identify keystone
species and effects of
changes on systems
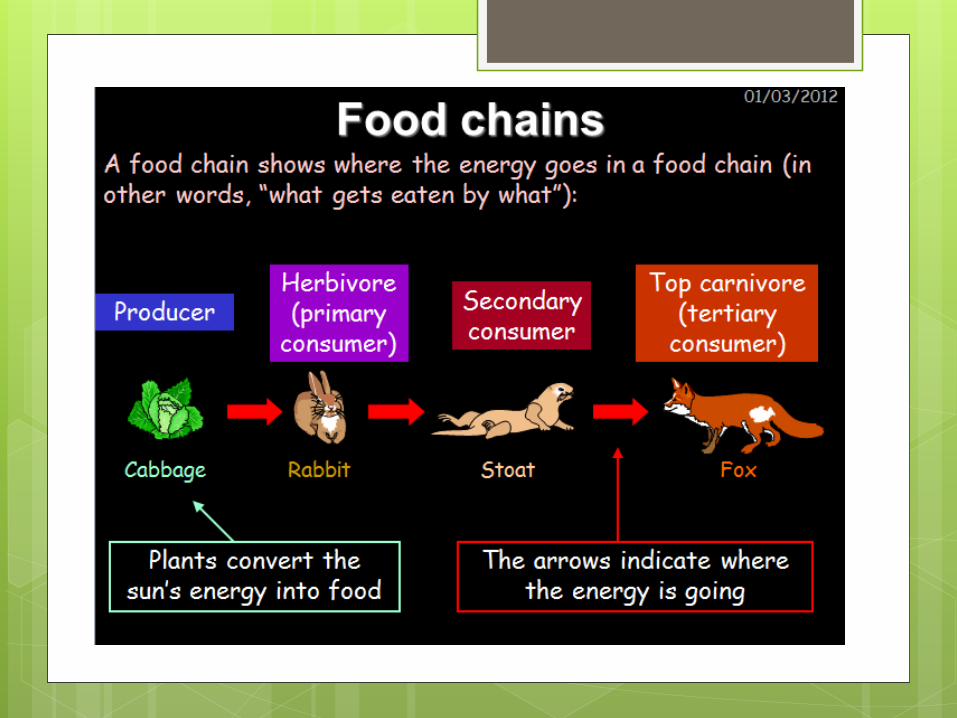

Food webs
show all the
food chains
within an
ecosystem


Success Criteria Write a food chain for
Healthy streamPhytoplankton case caddis small fish heron
Polluted StreamDetris worms eel
How does increasing the amount of leaf litter falling into a stream affect the food web?
- Overhanging trees drop leaves into stream, increases numbers of mayflies, caddis, midges and therefore numbers of stoneflies, small fish, large fish, birds, eels
How does removing the habitat for nymphs affect the food web?
- No overhanging trees, no leaves to hide in, digger clears stream bed, decreases number of nymphs as nowhere to hide, this decreases diversity (number of species living there and results in poor stream health and puts the ecosystem at risk of collapse.

SLO
Describe intra and inter
specific relationships
within a community
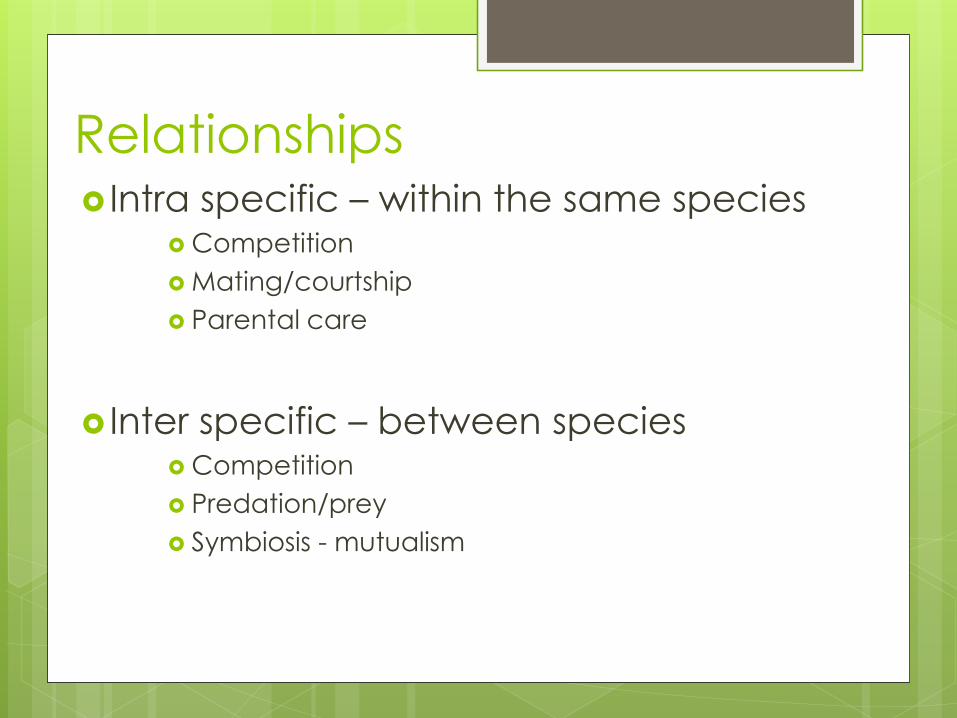
Relationships Intra specific – within the same species
Competition
Mating/courtship
Parental care
Inter specific – between species Competition
Predation/prey
Symbiosis - mutualism

SLO
Discuss the importance of
diversity within populations

Diversity
Diversity – differences
In order to survive environmental changes
it is essential that populations have
differences
Populations with limited diversity are much
more susceptible to extinction

Success Criteria
Describe the diversity above and below
the reservoir?
What could the council do to improve the
diversity below the reservoir?

SLO
Identify the impacts humans can have on ecosystems
Discuss the effects of urbanisation, on the above factors of an ecosystem
Human Activities
Urbanisation – building of houses, roads,
foot paths, construction of pipes
(sewerage, power, water) drainage
Deforestation – large scale removal of
trees
Pollution – air, soil, water

Impact of Humans on Streams
Increase erosion – removal of bank vegetation
Removal of habitat – artificial channels
Increased pesticides – runoff from farms, homes
Increased nitrates – run off from farms, homes
Reduce clarity – erosion and run off, storm water drains
Reduction in pH – run off from homes
Increase in sun light and temperature – tree removal

Impact of Urbanisation
Reduced habitats, loss of riparian zones
Increased turbidity
Increased erosion (loss of riparian zones)
Movement or death of sensitive species
Loss of key species within food web, leads
to loss of other species
Reduced diversity
Rapid changes in river flow

Success Criteria
List the abiotic and biotic factors of
Reservoir stream
For each state how urbanisation has
affected them

04/03/2015
Pollution Indicators
In dirty water leeches
and midges will survive
In average water more
species (like the
dragonfly and cranefly)
will survive
In clean water a lot
more species (like the
mayfly and caddisfly)
will survive
The quality of water can be monitored by looking
at the species of insect in the water:

TermsTerm Definition
Abiotic Non living
Biotic Living
Ecosystem All the non living and living things within a large
defined area
Population A group of interbreeding organisms
Substrate The ground contents (soil, concrete, sand)
Urbanisation Removal of natural habitat to build houses, roads, foot
paths
Erosion Break down and removal of soil particles
Intraspecific Relationships within the same species
interspecific Relationships between species
Riparian Zone 10 m either side of river, abiotic and biotic features
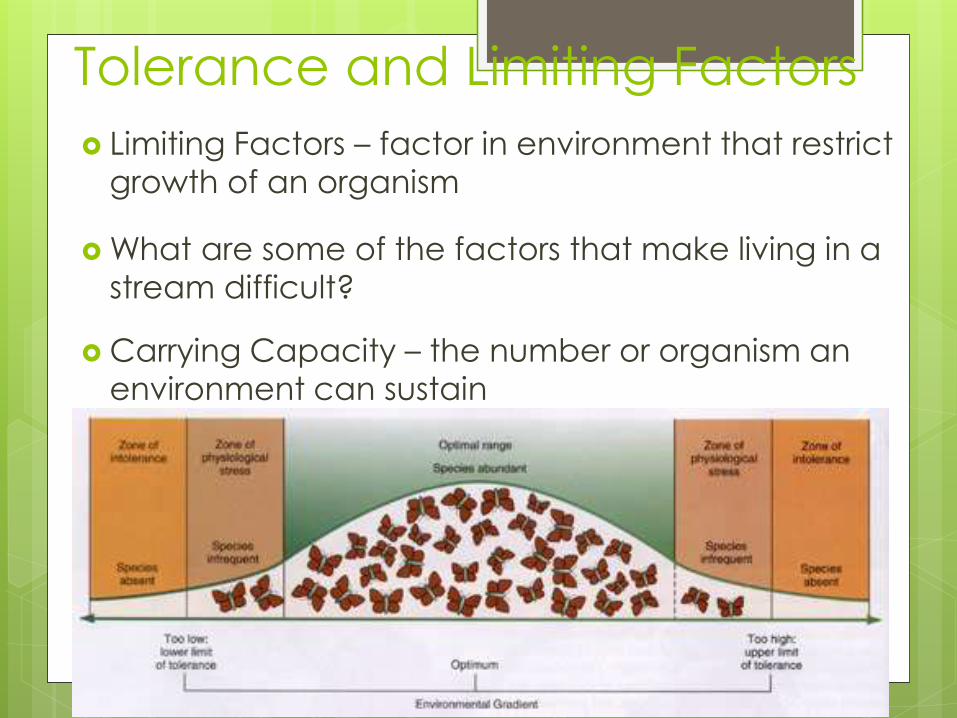
Tolerance and Limiting Factors
Limiting Factors – factor in environment that restrict
growth of an organism
What are some of the factors that make living in a
stream difficult?
Carrying Capacity – the number or organism an
environment can sustain

Tolerance of Stream Organisms
Aquatic macroinvertebrates are good indicators of
stream quality because:
They are affected by the physical, chemical, and
biological conditions of the stream.
They can't escape pollution and show the effects of
short- and long term pollution events.
They may show the cumulative impacts of pollution.
They may show the impacts from habitat loss not
detected by traditional water quality assessments.
They are a critical part of the stream's food web.
Some are very intolerant of pollution.
They are relatively easy to sample and identify.

Abiotic Factors
For each of the abiotic factors listed, describe how
they might be altered and the effect on specific
(named) marcro invertebrates this change might
have:
- Stream flow
- Dissolved Oxygen
- Temperature
- pH
- Turbitidy
- Substrate

Stream Flow and Dissolved Oxygen Sped up by concreting the sides of the chanel,
removing debris, daming and releasing water upstream, how water level
Slowed down by reducing water level, increasing debris,
Fast flowing water brings in but can also wash away food, silt and debris
Fast flowing water tends to have a higher oxygen content and lower temperature
Macro invertebrates that breath using gills (mayflies, stoneflies, dobsonflies) need to have a constant fresh supply of oxygenated water
Snails prefer slow moving water with lots of algae to feed on

Temperature
Temperature is affected by the flow of the stream,
the amount of bush overhanging the stream and the
time of the year
Temperature also affects the amount of dissolved
oxygen in the water, the warmer the water the less
oxygen it holds
Low temperatures can slow the metabolism of some
macro inverts
High temperatures can also kill some macro inverts

Substrate

Turbitidy

Two sites at a lake
were sampled.
One site was near
a popular camping
spot, the other site
part way around
the lake where
access was more
difficult.
Biological Impact
Practice Question
Site near camping spot
Second site

Macroinvertebrates found
Camping Site Sensitivity
ScoreIsolated Site Sensitivity
Score
Worms – 7 1 Mayflies – 3 4
Crustaceans –
2
2 Dragon flies – 2 3
Midges/sandfli
es – 8
1 Midges/sandflie
s – 7
1
Snails -5 2 Crustaceans – 3 2
Caddis fly – 4 3
Water beetles -
2
3
Damsel flies – 4 3
Total found =
22
Total found = 23

Practice Question
Describe the abiotic and biotic factors
for the two sites
List organism found
Why are some organism found at one
location and not the other?
What impact does the lack or over
population of certain organism have
on the ecosystem as a whole?

Internal Assessment
Task 1 – Collect data
Task 2 – Process Data
- tabulate data, graph it, average
- calculate tolerance
Task 3 – Write a report on effects of abiotic
factors on biotic factors

Data ProcessingDevelop a table to record the similarities and
differences in the environmental factors in the two
areas of the freshwater ecosystem. For some
factors averages for each area may have to be
calculated:
Location Temp Turbidity Dissolved O2
Light Level
pH Substrate Speedof Flow
Pollution Tolerance Rating
Healthy Stream
17’C +1m 14 mgL-1 Low/med
7.2 Fast
Polluted Stream
14’C +1m 10 mgL-1 V. High 7.8 Slow

For each area of the freshwater ecosystem, calculate the percentage of the total present for each macro-invertebrate.
To do this, divide the number of macro-invertebrates in the area by the total number of macro-invertebrates found in that area.
eg. % mayflies = number of mayflies found x 100
total number of macro-invertebrates
Record this information in a table and draw a bar graph to compare all the data from each of the two areas.

Calculate the pollution tolerance index for each area and determine the water quality of each area.
The Pollution Tolerance Index (PTI) uses indicator organisms and their tolerance to pollution (called a sensitivity score) to give an assessment of water quality. To calculate the pollution tolerance index for each area multiply the number of types of organisms in each tolerance level by their sensitivity score (4, 3, 2 or 1).
For example:
In a sample that contains mayflies (tolerance score 4), stoneflies (tolerance score 4), caddis fly (tolerance score 3) and some diptera (tolerance score 1), the calculation would be:
2 x 4 (2 different types of organisms each with tolerance scores of 4 ie Mayflies and
stoneflies)
+ 1 x 3 ( 1 type of organism with a tolerance score of 3 ie caddis fly)
+ 1 x 1 (1 type of organism with a tolerance score of 1 ie diptera).
Pollution Tolerance Index = (2 x 4) + (1 x 3) + (1 x 1) = 8 + 3 + 1 = 12

PTI Value Water Quality Rating
23 and above Excellent
17 – 22 Good
11 – 16 Fair
10 or less Poor
Now compare your calculated pollution tolerance index (PTI) with
the scale below:

PTI
Pollution tolerance indicator tells us how
many different kinds of species are found
The more species, the more diverse, the
healthier the river
It also tells us how many pollution sensitive
organisms are found
The more pollutant sensitive species, the
higher the PTI and therefore the healthier
the stream

Your task:1. Calculate the Pollution Tolerance index
at each site and find out the water
quality.
2. Calculate the percentage of the total
for each species at each site and draw
a bar graph of this data for each site.
3. Write a paragraph about the health of
the lake at the two different sites,
based on what we have learned.

Reporting
Use your observations and finds from Tasks 1 and 2 and biological ideas about ecology to write a report on the impact of urbanisation on water quality and the diversity of organisms in a freshwater ecosystem.
In the report:
Use all your findings and your own ideas to make significant causal links to explain the impact of urbanisation on the two areas studied along the Reservoir creek. The effects on the stream may be differing environmental factors (including water quality) which may have had implications for the ecosystem as a whole.

Report Format
Introduction
Describe what an ecosystem is
What is urbanisation
When urbanisation started and how much residential
development has occurred down the Reservoir
Creek.
Map (of entire length of stream) and names of
locations you will be discussing

Method:
Briefly outline what you did/how
you collected data, where,
Results:
Put your tabulated results here
Graphs
Put your profile diagram here
Include a few pictures – you
need to say what they show

Discussion
Describe abiotic and biotic features of both areas
Discuss how they are different
Discuss what has caused the differences in both abiotic and biotic features (urbanisation)
How does urbanisation affect streams? (ie increases run off)
What are the general impacts of urbanisation on streams
Why is diversity important to ecosystems
The fauna (animals) and flora (plants) that made up the Reservoir Creek ecosystem before any urbanisation.
Specifically link environmental changes to changes in species found
Discuss the importance of these differences on the ecosystem as a whole (diversity)
Use actual data from your tables to illustrate changes,
You need to discuss differences between the two sites surveyed.
Your discussion must be related to the effects on the ecosystem due to urbanisation.

Excellence:Abiotic Factor Link Biotic Factor Ecosystem
(because) (causing) (resulting in)
Effect Cause Result Impact on Ecosystem as a whole
Eg.
High temp Trees removed (no shade) reduced oxygen in
water, loss(migration or extinction) of some macro invertebrates as they prefer cooler water reduces diversity in ecosystem and
puts whole ecosystem at risk
(Remember to compare this with above the reservoir)
Flash Flooding narrowing of stream channel, increase run off
due to urbanisation removal of food source and macro
invertebrates reduces diversity in ecosystem

Conclusion:
Summarise the body
- using biological ideas to make significant causal links between the changed environment factors and ecological characteristic or processes to explain the impact on organisms and the implications on the ecosystem as a whole
- How has the river changed and what caused the change and what are the long term implications of this change?
- Suggestions of what could be done to improve the stream

Achievement Standard
describes observations or findings;
uses findings to identify change in environmental
factors; and
describes how changes in environmental factors
affect organisms.
Uses findings and biological ideas and makes
significant causal links between changed
environmental factors and the ecosystem
characteristics or process including the impact on
organisms and the implications for the ecosystem as
a whole