ecological purchase intentions
TRANSCRIPT
Erasmus University Rotterdam| Rajiv Hanoeman
Ecological Purchase Intentions Do consumers actually care about the environment?
Master Thesis
Program: Economics and Business
Specialization: Marketing
Rajiv Hanoeman
Student number: 313087
Thesis supervisor: Drs. N. Hofstra
July, 2013
Erasmus University Rotterdam| Rajiv Hanoeman
Abstract
Consumers of the world have been made more aware of environmental issues that have risen
during this time. The shift towards environmental behaviour has been in part due to the
popularity rise in ecological awareness. Studying environmental behaviour is a popular subject
in the academic field. Many researchers investigated the motives what drives one to act this
way. Although a great amount of studies have been done on behaviour, very little has been
written primarily on ecological purchase intentions. This paper aims to contribute to that scarce
research. A sample of 2668 respondents was utilized to determine whether consumers actually
care about a sustainable environment and which factors influence their ecological purchase
intentions. The factors environmental attitude, perceived responsibilities and age were applied
to measure these intentions. Several variables were linked to these factors. The variables of
environmental attitude and age had the largest impact on ecological purchase intentions, with
the need to talk as the strongest predictor. The results reflected that according to the consumers
themselves, they value a sustainable environment. However, the environmental concerns are
not consistently translated to their actual intentions.
Erasmus University Rotterdam| Rajiv Hanoeman
Preface & acknowledgements
Fascinated and inspired by environmental documentaries of Tegenlicht (Dutch) and the non-
profit organisation the Story of Stuff, my interests and willingness to act in the environmental
field rapidly grew. Hence the decision to write about ecological purchase intentions was not a
difficult choice to make. Despite several setbacks and challenging times I encountered during
the thesis period, I am glad to eventually contribute to this field.
My thesis supervisor Nel Hofstra is also a big inspiration for environmental consciousness.
I sincerely felt privileged to have her as my supervisor, I am grateful for the guidance that she
provided during this period. My thanks also go to Luit Kloosterman for providing the dataset for
this research.
Furthermore, my thanks go to my family and friends who supported me. I would also like to
thank my classmate and friend Leonaris Rey for motivating and accompanying me when I went
to the University to work on my thesis. Most of all I want to thank my parents, brother Kishan
Hanoeman and sister Natasha Hanoeman for believing in me. Their positive energy guided me
through my academic career.
“Be the change that you wish to see in the world.”
- Mahatma Ghandi -
Rajiv D. Hanoeman
August, 2013

Erasmus University Rotterdam| Rajiv Hanoeman
1
Table of Contents
Chapter 1 Introduction .............................................................................................................................. 3
1.1 Managerial relevance................................................................................................................................ 4
1.2 Relevant Research.................................................................................................................................... 6
1.3 Research questions .................................................................................................................................. 8
Chapter 2 Theoretical Background ....................................................................................................... 10
2.1 Green versus Ecological ......................................................................................................................... 10
2.2 Theory of planned behaviour.................................................................................................................. 10
2.3 Environmental attitude ............................................................................................................................ 12
2.4 Perceived responsibility .......................................................................................................................... 13
2.5 Ecological consumer ............................................................................................................................... 15
2.5.1 Demographic factor: Age................................................................................................................. 17
2.6 Hypotheses .............................................................................................................................................. 18
Chapter 3 Methodology and Dataset .................................................................................................... 19
3.1 Conceptual Framework ........................................................................................................................... 19
3.2 Measures ................................................................................................................................................. 20
3.3 Sample and data description .................................................................................................................. 21
3.3.1 Environmental attitude variables..................................................................................................... 22
3.3.2 Perceived responsibility variables .................................................................................................. 24
3.3.3 Age variable ..................................................................................................................................... 26
3.3.4 Dependent variable.......................................................................................................................... 26
3.4 Data analyses .......................................................................................................................................... 27
3.4.1 Data preparation .............................................................................................................................. 27
3.4.2 Normal distribution ........................................................................................................................... 27
3.4.3 Correlation analysis ......................................................................................................................... 29
3.4.4 Multiple regression analysis ............................................................................................................ 30
Erasmus University Rotterdam| Rajiv Hanoeman
2
Chapter 4 Results..................................................................................................................................... 32
4.1 Correlation results ................................................................................................................................... 32
4.2 Multiple regression results ...................................................................................................................... 33
4.3 Overview of results.................................................................................................................................. 35
Chapter 5 Conclusion .............................................................................................................................. 37
5.1 Limitations ................................................................................................................................................ 38
5.2 Recommendations for further research ................................................................................................. 39
References ................................................................................................................................................... 40
Appendix ................................................................................................................................................... 44
Appendix 1: Questionnaire ........................................................................................................................... 44
Appendix 2: Frequency tables SPSS output ............................................................................................... 46
Appendix 3: Normal distribution plots & table.............................................................................................. 48
Appendix 4: Correlation table ....................................................................................................................... 50
Appendix 5: Regression tables ..................................................................................................................... 51

Erasmus University Rotterdam| Rajiv Hanoeman
3
Chapter 1 Introduction
Over the past few decades, consumers of the world have been made more aware of
environmental issues that have risen during this time. They have been made aware of these
issues in increasing levels in areas that are unavoidable to the up-to-date citizen. Areas such as
the media (McIntosh, 1991), increased number of environmental groups (Tapon and Leighton,
1991), and stricter laws pertaining to the environment both nationally and internationally
(Charter, 1992) can be considered. In one way or another all can be seen as significant.
This is important, because consumers themselves are heavily involved as factors in
environmental pollution, as there are many consumption patterns that link back to ecological
damage (Balderjahn, 1988). It has been found that specific demographics, personality, human
values and attitude variables can be used for grouping ecologically-concerned consumers.
Balderjahn’s research on this focused on understanding what determined a consumer’s
ecological consciousness, using predictors based on the above-mentioned variables as well as
theoretical frameworks based on prior research on ecological-concerned consumers.
The United Nations also determined that the biggest cause of deterioration of the global
environment is the unsustainable pattern of consumption and production, mainly in
industrialized countries (UNEP, 2001). The plan of action that the UN created and intended to
use globally, called Agenda 21, contained the above statement. Despite the advancement in
human development, with the increase of consumption it results in environmental degradation
(Thompson et al., 2010). One of the solutions to this was stated in Agenda 21, called
sustainable consumption, and is defined as the consumption of goods and services that satisfy
the needs of the present generations without compromising the needs of the future ones
(Heiskanen and Pantzar, 1997).
In the past few years, these areas added to the concerns of the public, the top issues being
mainly about the quality of water, hazardous / toxic waste, pollution from public and private
transportation, deforestation, and more, just to name a few (Ottman, 2011, The New Rules of
Green Marketing).

Erasmus University Rotterdam| Rajiv Hanoeman
4
1.1 Managerial relevance Ottman (2011) continues into discussing various points where companies can make use of
these turn of events for consumers wanting to go green, noting them as business opportunities.
Due to the growing demand for green products and services by consumers, businesses
themselves can promote themselves as green companies offering greener products and
services than their competitors. This in turn enhances their sales, their image, and gives the
employees and the company on a whole a boosted morale to uphold.
With the concept of a premium cost increase for a green good over a regular version of a good,
consumers that are willing to green are prepared to pay extra. There are sceptics that require
proof through research before making the extra investments for the extra costs of introducing
new green products. For those willing to buy however, accept the premium price because
expectations have grown over the years, and environmental friendliness can be seen as an
additional measure of quality for products.
Along with this new measure of quality, green products also can offer consumer benefits which
can also be marketed as additional advantages on top of being greener than the competition.
Ottman (2011) listed benefits such as compact fluorescent light bulbs saving more money while
used and last longer at the same time, hybrid cars running near silently and gives the driver a
green image and organic produce being safer and having better taste.
Another benefit to striving to go green is that it is a new source of innovation according to
Ottman. Going green and creating opportunities to go green is doing something new in itself,
and in order to stand out from the competition, you will need to create green technologies,
business models and designs. These will bring attention to your company through new
customers as well as the public eye and create new competitive advantages that also show that
your company is moving with the current times and trends, as well as staying ahead of the
curve. Some examples given by Ottman include Toyota converting vehicle manufactories that
were truck- and SUV-focused to manufacture hybrid-engine vehicles, and in-home energy
meters that allow you to monitor your energy use within your home.
Ottman did however focus on the other side of greener products, which can in fact lead to
increased costs for manufacturing. For example, greener packaging in a different size causing
issues with shipping crate sizes, or even extra costly activities, such as transporting waste in
Erasmus University Rotterdam| Rajiv Hanoeman
5
bulk to be recycled. This is the reason behind the use of the tool called life-cycle assessment
(LCA), and it assesses all of the steps and issues involved with creating a greener product. The
assessment focuses on four main topics: raw materials acquisition and processing,
manufacturing and distribution, product use and packaging and after-use/disposal. With
conducting an LCA, decisions have to be made in the process over things. For example,
deciding whether to look at the product alone or include its packaging. Other issues to keep
account for are those that the consumer has to add themselves to the product in order to
function throughout its lifetime or the waste from the transportation of the product. This
assessment is very crucial to keep in mind when making the decision to make greener products
because realistically-speaking, it is not an easy or cheap conversion.
Chen and Chang (2012) also agree with the idea that companies should apply green marketing
strategies to increase the value of their products to customers and environmental watchers,
which in turn also increased their competitive advantage in this regard. They state that as green
products are more popular in markets today, green marketing is more common and the
companies going along with this are seen to be more in tune with current trends. These
marketing activities include creation and promotion of products that meet customer’s needs in
terms of environmental care. Not only does a company stand out more on their own compared
to other non-green companies when they use green marketing, but they can create new rules in
their market through their green marketing. Peattie (1992) repeats that consumers are willing to
buy greener products that have been proven through research to be safer for the environment,
and therefore stated that companies should provide this reliable proof to reduce customer’s
perceived risk. Even though it can be hard to provide this information, it is a must to do so to win
their trust.
Chen (2008) listed the five following reasons for companies to adopt green marketing:
Utilizing green opportunities.
Increasing corporate images.
Raising product value.
Enhancing competitive advantages.
Complying with environmental trends.
It is also noted by Chen (2012) that executing green marketing can raise consumer purchase
intentions. There are potential consumers that have a view about greener goods being of lower

Erasmus University Rotterdam| Rajiv Hanoeman
6
quality or do not deliver on promises for the environmental safety. Also, consumers may not
agree on attributes that depend on taste or opinion, such as value, quality, price and
performance. The best way to get consumers to see those attributes as superior in the greener
product is to compare them to non-green products, and to enhance consumer purchase
intentions, greenness and high-quality attributes need to be combined. Reducing consumer
perceived risk about how they feel negatively about greener products can ease their doubts and
raise their trust.
Balderjahn (1988) determined that in order to develop ecologically appropriate market
segmentation strategies, a proper identification and description of an ecologically-concerned
consumer is needed for both private and public sectors. These segmentation strategies can
help companies know how to better position their greener good in order to appeal more to
consumers. Regardless, it is best for the manufacturers to clearly show that the product does
not harm the environment and that purchase and usage of the product contributes to
environmental damage reduction.
Finally, Grimmer and Bingham (2013) state that some consumers seek to buy goods based on
a company’s role in society and its level of environmental responsibility. Therefore it is a major
point to go green for a company, and to make sure that it is known to the public and market. In
2008, green consumers had an annual buying power of $500 billion worldwide (Ferraro, 2009).
Even in the years of the financial crisis of 2008, spending for greener goods and services
increased by 18% over the two years of the crisis (The Co-operative Bank, 2010). Focusing on
the UK alone during the crisis showed that the green market grew from £36.5 billion in 2007 to
£43.2 billion in 2009. These figures show that due to the growth in green expenditure reflect that
consumers have a positive attitude towards greener products, and included greener options into
their purchasing decisions according to Maignan and Ferrell (2004) and Vermillion and Peart
(2010).
1.2 Relevant Research Research has been conducted in the past about ecological behaviour, and one important piece
of research was conducted by Fraj and Martinez (2007) where it focused on environmental
attitudes as meaningful predictors of ecological behaviour. They found that consumers
increasingly choose ecological products when they shop because of them being healthier
Erasmus University Rotterdam| Rajiv Hanoeman
7
options and the help they give in sustaining the environment for the future. Consumers are
prepared to abandon harmful goods and make the switch to greener goods, and companies are
aware of how important it is to reflect that in the developing and marketing of their green goods.
They developed a conceptual model and framework and found that environmental attitudes
have a significant effect on ecological behaviour. Their research helped them to understand how
consumers feel and how their attitudes best define their behaviour in relation to environmental
problems.
Barr (2003) conducted research on whether environmental action is influenced by a number of
factors, such as environmental values, situational characteristics and psychological variables.
This research began because of the increase in interest in how people could be encouraged to
be more ecological at home. The factors mentioned before were found to be crucial in
promoting environmentally responsible behaviours like saving energy and waste recycling.
With the above-mentioned research papers, it shows the most similar research done to this
paper, but more papers came across what is considered a consumer paradox when it comes to
what they think about the environment, and what they actually do to help it.
Diekmann and Preisendörferer (1998) found that it was shown that there are considerable
inconsistencies between society’s environmental attitudes and their behaviour. They look at and
dissect the concept of environmental behaviour from two separate views to get a better
understanding of these inconsistencies. They found three strategies that these two views have
in common, which were shifting attention, low-cost, and subjective-rationality. Even despite a
high degree of consciousness for the environment, it was found that everyday experience
pointed to obvious inconsistencies between verbal claims and actual behaviour, with behaviour
following traditional lines of action.
Wong et al. (1996) and Aspinall (1993) found a paradox as well, that despite the increase in
society’s sympathy towards the environment, environmentally-friendly products had not
achieved the expected level of market success. Kalafatis et al. (1999) noted that in many
consumer product categories, environmentally-friendly producers had achieved disappointingly-
low levels of market share.
Erasmus University Rotterdam| Rajiv Hanoeman
8
This finding was supported by the findings of UK surveys that showed that although consumers
had increasing concerns with the environment’s state of being, even at a decreasing rate, their
willingness to buy environmentally-friendly products had dropped.
Grimmer and Bingham (2013) also make note that despite increased interest, evidence for the
impact of the environmental initiatives on consumer behaviour is both contradictory and
equivocal. The actual size of the green market despite the growing talk of trends has been
questioned as well (Papaoikonomou et al., 2011). Cowe and Williams (2000) refer to the 30:3
syndrome, which meant that while 30% of consumers may say that they are concerned about
firms’ social responsibility, green goods account for 3% of the market share at the most.
Polonsky (2011) talked about how green marketing is not reaching its potential for influencing
consumer behaviour as well as improving the environment. Carrington et al. (2010) notes that
even though the number of consumers that proclaim to be motivated by social and
environmental issues grow, there is evidence that shows that the translation to actual
consumption is less obvious. Devinney et al. (2010) shortly puts it that the green consumer is
mythical to them.
1.3 Research questions The contradictions stated in the preceding paragraph might raise questions if consumers
actually appreciate a sustainable environment. It has been shown above that although the
consumers might say they care about the environment, the results of the previously mentioned
studies show otherwise. The consumers’ paradox will also be studied in this paper.
In the previous paragraph it is also stated that several studies have been conducted on
environmental behaviour. This is a very broad topic, including recycling, waste management,
consuming etc. The current paper therefore will only focus on purchase intentions instead of
behaviour.
The goal of this paper is to examine how certain factors affect the ecological purchase
intentions of consumers. Not many studies exist about ecological purchase intentions, despite
being mentioned in numerous papers. In this way, the research will contribute to scarce
research in a growing market.

Erasmus University Rotterdam| Rajiv Hanoeman
9
Based on the initial findings, the actual value of a sustainable environment to consumers seems
questionable. By measuring ecological purchase intentions, this can be tested. Therefore, the
research question of this thesis will be:
“Do consumers value a sustainable environment and which factors affect their ecological purchase intentions?”
The following sub research questions will support to answer the main question:
Does a positive environmental attitude affect ecological purchase intentions?
Do perceived responsibilities affect ecological purchase intentions?
Does age influences ecological purchase intentions?
Erasmus University Rotterdam| Rajiv Hanoeman
10
Chapter 2 Theoretical Background
2.1 Green versus Ecological Nowadays the term green is often used to indicate environmental concerns. Green can be
described as a descriptor, for a good or service for example, which inflicts reduced or minimum
or no harm to the environment. It is used by companies in green marketing for their goods and
services to emphasize that they have an environmentally-safer alternative to others in the
market. The level of green can vary from a slight change compared to a regular good, to a
completely environmentally-friendly process of creation until shipping that does no harm at all to
the environment.
Looking at the definition of ecological and it is a deeper, more meaningful representation of what
is needed for the environment. The Merriam-Webster dictionary1 defines ecological as “the
study of the relationship between organisms and their environment”, in this case, organisms
pertain to humans specifically. Another description2 states that it is “the branch of sociology that
is concerned with studying the relationships between human groups and their physical and
social environments”. A third description2 states that it is “the study of the detrimental effects of
modern civilization on the environment, with a view towards prevention or reversal through
conservation”. This third description is the one that this research paper will side with, and is the
reason why ecological is used in the research question instead of green. Since there is no
vague measurement involved, the goal is clear to preserve or reverse the damage done to the
environment.
2.2 Theory of planned behaviour This paper uses the theory of planned behaviour based on the original thought process, the
theory of reasoned action, or TRA, written by Fishbein & Ajzen (1975). The idea behind this
theory is that consumer’s attitudes and subjective norm towards environmental issues can steer
them towards greener purchases for the sake of the environment. The model for TRA is
supported and has been cited by many research papers linked to consumer behaviour literature
where the goal was to predict intentions. One paper that used TRA in such a manner was by
Lee and Green (1991). TRA was also used to determine the behaviour of consumers in the 1 http://www.merriam-webster.com/dictionary/ecology 2 http://www.thefreedictionary.com/ecological

Erasmus University Rotterdam| Rajiv Hanoeman
11
research done by Mostafa (2007) and Mei et al. (2012). The main reasons TRA was acceptable
to use in those papers was a combination of the following assumptions: that purchase intentions
were based on the consumer’s preference, that consumers are rational and use the information
available to them as a basis for their choice, and that consumers consider the consequences of
their choice of product purchased (Dodd, 2010; Fishbein and Ajzen, 1975).
With that brief insight into the predecessor of the theory of planned behaviour, Ajzen (1985) took
TRA and expanded it past the limiting factor of looking at consumer preference (volitional
control). This was done by including beliefs in relation to the possession of necessary resources
and opportunities for performing a certain behaviour (Madden, 1992) and the thought that the
more resources and opportunities a consumer thinks that they have, the greater the perceived
behavioural control over their behaviour.
This perceived behaviour control is a variable that is added to the existing model of TRA which
has a direct effect on behaviour and an indirect effect on behaviour via intentions. This indirect
behaviour implies that when a consumer feels that they have little control over doing what they
want to do because of a lack of resources, then they have low motivation to do the action even if
they believe that doing the action is a good thing (Madden, 1992). Consumers’ behaviour is
strongly influenced by the confidence they have in their ability to perform the behaviour
(Bandura et al., 1980). This, according to them, is why the indirect link from perceived
behavioural control to intentions is a reflection of the motivational influence of control on
behaviour via intentions. The other link to perceived behaviour control from behaviour is a direct
link that reflects the actual control that a consumer has over their actions.
Ajzen and Madden (1986) completed their first test of this theory with students’ class
attendance, where the results showed that perceived behaviour control was a significant
predictor of intentions after controlling for attitudes and subjective norms. But on the contrary,
perceived behavioural control did not contribute to the prediction of target behaviour after
controlling for intentions. This shows with the significant level of response that intentions are a
far better connection for predictions than with predicting behaviour.
Oreg and Katz-Gerro (2006) built on Ajzen’s theory by testing a model that predicted pro-
environmental behaviour with the addition of Inglehart’s and Schwart’s individual works on value
dimensions. Inglehart’s postmaterialistic values showed to be the more significant of the two,

Erasmus University Rotterdam| Rajiv Hanoeman
12
affecting environmental concern, leading to environmental concern, perceived threat and
perceived behavioural control affecting willingness to sacrifice, affecting a number of pro-
environmental behaviours.
Kalafatis et al. (1999) also used Ajzen’s theory as a conceptual framework for their paper on
cross-market examination with green marketing. Their result showed that there was significant
support for the robustness in explaining intention, while the theory varied in accordance to
behaviour depending on how established and clearly-formatted the market was. This is yet more
proof that intentions should be used in measurements over behaviour.
In short, the theory of planned behaviour would predict two possible effects of perceived
behavioural control on behaviour, where perceived behavioural control firstly reflects
motivational factors which have an indirect effect on behaviour through intentions, and secondly
where it reflects actual control with a direct link to behaviour independent of intentions.
2.3 Environmental attitude Eilam and Trop (2012) defined environmental attitude as a requirement for achieving
environmental behaviour. An analysis was made between pro-environmental attitudes and
behaviour, where intention to act was a determinant of pro-environmental behaviour. This
intention to act was a factor made up of variables, including attitudes. A 1993 survey used by
Eilam and Trop (2012) found high levels of environmental attitudes and low levels of
environmental behaviour. This finding did not give the feeling of a positive conclusion as in the
end, it is action that makes a difference. Kinnear et al. (1973) stated that a buyer’s attitude has
to express their concern for ecology. It was also written that attitudes have served as predictors
of energy conservation behaviour, ecologically-conscious purchasing and product use and
recycling.
Balderjahn (1988) stated that other researchers had found that specific factors, including
attitudinal variables were useful for characterizing ecologically-concerned consumers. Dersken
and Gartrell (1993) had concluded in their research that environmental attitudes affect recycling
behaviour only where a structured recycling program existed. Guagnano et al. (1995) also
looked into recycling behaviour, with attitude theories decreasing in predictive value as more
external factors came into play.

Erasmus University Rotterdam| Rajiv Hanoeman
13
The research conducted by Fraj and Martinez (2007) focused on environmental attitudes as
meaningful predictors of ecological behaviour. They concluded that environmental attitudes
have a significant effect on ecological behaviour, and learned more about what attitudes define
their behaviour in relation to environmental problems.
These theory discussions from paragraph 2.2 and 2.3 lead into the first hypothesis for this paper
to solve, which is:
H1: A positive environmental attitude enhances ecological purchase intentions
2.4 Perceived responsibility The first trace of the concept of perceived responsibility comes from the paper of Kinnear et al.
(1973) where perceived consumer effectiveness was identified and was created as a measure
to see how far a person believes an individual consumer can be effective in pollution reduction.
Henion and Wilson (1976) take this measure and expand it to determine that the ecologically-
concerned consumer is an internally-controlled individual, and this concept is a strong predictor
for their perception of economic problems.
Mei et al. (2012) discuss perceived responsibility by first looking at government initiative. It
refers to the initiative taken by the national government or the support given by the national
government (Diekmeyer, 2008). Diekmeyer stated that the role of the government in
environmental protection is undeniable, and as the role model to its country, they should lead by
example in organizing sustainability programs. By leading, the government should initiate and
promote sustainable events to the community to bring about sustainability awareness to its
society (Mei et al., 2012). Chen and Chai (2010) mentioned an example of a government
leading by example with the Malaysian government publicizing various strategies to implement
sustainable consumption and development. Haron et al. (2005) also used Malaysia as an
example by using social advertisement to educate their people about environmental awareness
and concern.
Mei et al. (2012) mentioned peer pressure in their paper, and this research uses their stand on it
as an addition to perceived responsibility. Cohan’s (2009) take on perceived responsibility
referred to the psychological pressure that each person experienced when comparing their
Erasmus University Rotterdam| Rajiv Hanoeman
14
actions with others, or in other words, peer pressure. He states that it was clear that supplying
people with information was not enough to create a change in behaviour. Peer pressure by not
following the same decision as others in their surrounding could cause a large behavioural shift,
thus changing their surrounding could change that person’s mindset (Daido, 2004). Social
influence was also mentioned in regards to perceived responsibility as whether an action should
or should not be performed by someone in another’s point of view (Kalafatis et al., 1999). Social
influence was found by Lee (2008) to be the top predictor of young consumer purchasing
behaviour in Hong Kong. Also mentioned and argued was that social influence was the top
factor in defining purchase intentions for environmental goods in the UK (Kalafatis et al., 1999).
Stern et al. (1995) stated the importance of looking into the social structure that individuals are
situated in, based on their concept of social structures shaping the individuals that exist in them.
The theory behind this is that these social structures shape individuals’ experiences, leading to
shaping their personal values, beliefs and behaviours. Oreg and Katz-Gerro (2006) determined
that individuals’ environmental attitudes and behaviour are not only determined by
socioeconomic logic but also by the peer pressure of cultural values.
This research saw a correlation with perceived responsibility and social responsibility with the
research conducted by Thompson et al. (2010) where it was found that social responsibility is
the concept where businesses are obliged to handle society’s welfare further than the
requirements of society. These obligations include minimizing harmful impacts to the
environment, and should ideally be managed as a whole, rather than as individual undertakings.
A company cannot think about the creation of an ecological product without considering how
every factor involved in creating the product impacts the environment, in other words, the entire
product life cycle (Wasik, 1996).
Specifically, firms have been increasingly noticeable to the public in terms of environmental
issues in part due to environmental disasters caused by industrial manufacturers around the
world (Chen, 2011). This unwanted exposure to the public and mainstream reputation has
resulted in more companies making themselves more ecological in terms of image and
infrastructure, also due to the rising concerns of global warming (Molina-Azorí et al., 2009;
Haden et al., 2009). This shows that firms should apply green marketing strategies to enhance
the perceived value of their company and products in light of the rise in environmental
awareness, and in turn, increase their competitive advantage with competitors (Chen and
Erasmus University Rotterdam| Rajiv Hanoeman
15
Chang, 2012). To successfully sell their eco-friendly products to the public, companies should
provide reliable information to customers willing to buy green products with trustworthy
information that reduces their perceived risk (Peattie, 1992).
Eilam and Trop (2012) looked at how the role of acquisition of environmental behaviour was
explained by the assumption that changes on a personal level can lead to changes on a societal
level for sustainability. In short, if everyone acts environmentally-minded, society will act
environmentally safe. Fraj and Martinez (2007) briefly mention that people are aware that
environmental protection is not only up to firms and institutions but also their own responsibility
as consumers. Diekmann and Preisendörfer (1998) discussed the differences with aspirations
and reality, where many conferences deal with environmental issues but fail to meet
expectations. Next, it was discussed about national governments having restrictive funding for
environmental agencies, and political parties using promises for environmental policies with no
real effort to carry them out. Finally, at the individual citizen-level, they note that aspirations and
reality do not appear to co-exist together.
Despite the research made in perceived responsibilities shown in this subchapter, consumer
perceived responsibility has not been measured in most papers. This study can contribute a
new factor to intentions by testing with the following hypotheses:
H2a: Perceived social responsibility influences ecological purchase intentions
H2b: Perceived corporate responsibility influences ecological purchase intentions
H2c: Perceived governmental responsibility influences ecological purchase intentions
2.5 Ecological consumer Brooker (1976) discussed an early concept of the ecological consumer, the socially conscious
consumer. The paper concluded that individuals who are higher in self-actualization are more
likely to be ecological consumers over those with lower levels. This meant that as the person
becomes psychologically healthier, the likelier this person will take action for the sake of
society/the environment. The use of ecological products shows that there is concern for the
preservation of a healthy environment, although the results aren’t immediately seen. The
ecological consumer must be one that is willing to bear the possible extra costs of these
ecological products, and assume the value of the future benefits of the environment. This also

Erasmus University Rotterdam| Rajiv Hanoeman
16
includes passing on alternative, cheaper goods that are more harmful to the environment. This
target group of consumers is also perfect for other products to help other various types of social
problems.
Thompson et al. (2010) continues with their interpretation using green consumerism, where if
corporations are to continue using environmental marketing strategies, consumers must willing
to buy the green goods they are marketing. Therefore, gaining an understanding of an
ecological consumer is crucial. Kilbourne et al. (2002) state that there isn’t a clear agreement of
ecological consumers and what they want, will do or how to measure them. Peattie (2001)
reached a universally-accepted explanation for ecological consumer behaviour - it will occur
when concern for the environment translates into ecologically conscious consumer behaviour.
Most of the ecological consumer behaviour researchers try to categorize ecological consumers
by linking various variables with consumers that show ecologically-conscious consumer
behaviour (Thompson et al., 2010).
Ecological consumers are pictured to make ecological purchasing decisions according to two
purchase characteristics. These are the will to change to buy a green good, and the confidence
in this green good (Peattie, 2001). In these goods, there is an imbalance of information between
the consumer and the company making the good. According to Akerlof (1970), this often results
in consumer confusion or ignorance in regards to the range of quality of goods in the market.
One of the things that causes this is how green goods have qualities that cannot be evaluated
or experienced before purchasing them (Karstens and Belz, 2006). An example of green usage
that has wide appeal is the use of recycled, eco-friendly paper, because it does not differ much
in price from other paper, and the confidence is high in this type of good.
Another definition of an ecological consumer is from the research by Renfro (2010), where it
was defined as a consumer who supports businesses that are run in environmentally-friendly
ways. The ecological consumer is also concerned about how green the purchased good is as
well.
Mei et al. (2012) listed attributes that an ecological consumer could have:
Most-likely well-educated young adult women with more money to spend
They will expect green products to function as well as non-green products, and aren’t willing
to pay too much extra or give up too much quality

Erasmus University Rotterdam| Rajiv Hanoeman
17
Will not solely buy a green product just for the environmental benefits alone, must still meet
their basic needs in a product
Will be likelier to respond to product attributes that benefit them personally
Are not willing to take one much extra inconvenience with using the green product, or make
extra effort to purchase the product over a non-green product
Are not expecting a perfectly-green product for the environment, but are looking for active
movements in environmental benefits, backed by facts
Each of these attributes was listed with a possible implication for the green marketing that
corresponded with each attribute, with a solution for each of them as well. Lu et al. (2010) talked
about consumer trust positively affect consumer purchase intentions, and when focusing on
ecological consumers, it would imply that ecological trust of goods would positively affect their
ecological purchase intentions. Thompson et al. (2010) also showed a similar stance by saying
that if a consumer does not have confidence in the green good having a meaningful influence,
they are less likely to have a preference for green goods in general. This is once again crucial
for marketers to make clear so that ecological consumers can have confidence in the benefits of
the ecological good.
2.5.1 Demographic factor: Age Thompson et al. (2010) talked about prior research, namely Straughan and Roberts (1999) and
Rowlands et al. (2003) stating that demographic variables alone are not effective in marketing
use to segment green consumers. These authors stated that a combination of psychographic
and demographic variables is a better solution for the segmentation of green consumers.
Balderjahn (1988) shared the same thought process when it was stated that the predictive
power of demographic and socioeconomic variable is normally low.
Diekmann and Preisendörfer (1998) discussed the negative effect of age on environmental
consciousness and how it was in line with earlier research such as VanLiere and Dunlap (1980)
and Jones and Dunlap (1992). Diekmann and Preisendörfer (1998) stated that although
younger people are much better informed about ecological problems and show higher levels of
environmental consciousness, there is no significant effect with age on behaviour. This is in line
with many other research papers which concluded that for the younger generation, what is
being said and actual behaviour do not match often. Older people have shown to be less
Erasmus University Rotterdam| Rajiv Hanoeman
18
environmentally concerned when it came to their shopping behaviour including recycling. On the
other hand, their means of transportation involved less use of automobiles, meaning less
pollution (Diekmann and Preisendörfer, 1998).
However, Gilg et al. (2004) found that age had a positive impact on green consumption, with
older age groups more likely to save their money and consume less than the younger age
groups. The more recent study of Gilg et al. (2004) might suggest that the significance of age
has increased. With the statements above to justify, this paper decided to use the demographic
factor age as a variable, and formed the third hypothesis:
H3: Age influences ecological purchase intentions
2.6 Hypotheses To summarize, the following hypotheses have been formulated based on the discussed theory:
H1: A positive environmental attitude enhances ecological purchase intentions
H2a: Perceived social responsibility influences ecological purchase intentions
H2b: Perceived corporate responsibility influences ecological purchase intentions
H2c: Perceived governmental responsibility influences ecological purchase intentions
H3: Age influences ecological purchase intentions

Erasmus University Rotterdam| Rajiv Hanoeman
19
Chapter 3 Methodology and Dataset
This chapter begins by introducing the conceptual framework. Subsequently, the questionnaire
and its measures will be discussed, the hypotheses will be linked to the framework, a
description of the data will be given and data analyses will be explained.
3.1 Conceptual Framework According to the theoretical background, there are several elements that could influence
ecological purchase intentions. This research proposes a conceptual framework that suggests
that ecological purchase intentions are directly influenced by three factors.
Figure 1 Conceptual Framework
The described literature has argued that environmental attitude can be an important factor to
foresee ecological purchase intentions. Fraj and Martinez (2007) for example focused on
environmental attitudes as meaningful predictors. Eilam and Trop (2012) defined environmental
attitude as a requirement for achieving environmental behaviour.
Age
Ecological Purchase Intentions
Environmental Attitude
Perceived Responsibilities
Erasmus University Rotterdam| Rajiv Hanoeman
20
Perceived responsibilities can be considered as the consumer’s opinion on who is accountable
for the production and usage of eco-friendly products. These responsibilities will be measured
and tested for ecological purchase intentions. In this paper a distinction is made into corporate,
governmental and social responsibilities. Even though the concept of consumer’s perceived
responsibility was established in 1973 (Kinnear et al.), very little has been written about this
concept.
According to the literature, age is also a factor that can affect the ecological purchase intentions.
Diekmann and Preisendörfer (1998) stated that age did not have a significant effect on
ecological behaviour. Nevertheless, in a more recent study of Gilg et al. (2004), age did had a
significant impact on behaviour. To validate if the age factor is significant, the influence of age
will be tested on purchase intentions in this paper.
The goal of this thesis is to discover more about the three factors, and if they significantly affect
ecological purchase intentions. The following subchapters will discuss how these factors will be
tested.
3.2 Measures A questionnaire3 has been used to evaluate the consumer’s view about certain environmental
topics. The questionnaire is in English and it consists of 18 questions. However, 5 questions
have been disregarded due to the lack of relevance for this study. The main goal of the
questionnaire is to examine how the respondents consider the environment. This paper will test
if the opinions of the respondents are congruent with their purchasing intentions.
The first section of the questionnaire emphasizes on the general concern about the
environment. A distinction has been made between flora and fauna. Respondents are surveyed
on how they feel about these two topics. Besides questions about flora and fauna, there is also
a consumers’ awareness question. This question discusses the significance and actuality of
eco-friendly products.
In the second section eco-friendly definitions and responsibilities are argued. Via multiple
questions, the respondents are inquired about their opinion concerning the meaning of eco-
3 See appendix 1
Erasmus University Rotterdam| Rajiv Hanoeman
21
friendly and who should be responsible for these types of solutions. The perceived roles of the
corporate world, the government and the consumers are measured. Furthermore, respondents
are inquired regarding the importance on how companies should act to fulfil the current trend of
eco-friendly products and services.
The third and final section contains questions that address the respondent’s environmental
intentions. Striving to be more eco-friendly and the need to talk about environmental issues are
measured. When compared with the questions of the first two sections, these questions give
insight on the thoughts that consumers have will translate into their intentions. The impact of
eco-friendly labels and age are also measured in the final section.
A five-point Likert scale has been used in the first two sections to measure the opinion based
items. The scale ranges in order from one extreme to the other, namely strongly disagree to
strongly agree. Options in the middle are disagree, neutral and agree. In the third section of the
questionnaire, besides the five-point scale, a three-point scale for yes and no answers is used
to test the environmental intentions. Lastly, age is categorized in 5 groups.
3.3 Sample and data description The data for this research was obtained via third-year students who participated in the
Consumer Behavior course in 2011 & 2012 at the Erasmus University Rotterdam. The objective
of their assignment was to measure differences on environmental topics between generations.
The students were divided into pairs. Each team collected approximately 25 respondents. In
total, 2668 valid results were collected. To enhance the validity of the samples the students
took, this research combines all the results.
The students distributed the questionnaire via various channels. E-mail and online networks like
Facebook were used. A face-to-face method was also applied by the students. For example,
students who did not follow the course were inquired at the campus. Besides Dutch students,
international students participated in the course as well. However, no nationalities and places of
residency were noted, therefore it cannot be assumed that all the respondents have a Dutch
nationality or live in Holland.

Erasmus University Rotterdam| Rajiv Hanoeman
22
The questions that are important for this research are described with descriptive analyses. The
statistical program IBM SPSS, version 19, will be used to examine the collected data. Graphic
analyses of the results are made in bar charts, and are viewed in the next subchapters to assist
each analysis. Each bar chart will display the proportion distribution to each response of the
specific question. In the following figure, the relationship between the hypotheses and each
factor that influences ecological purchase intentions are linked.
Figure 2 Conceptual Framework linked with hypotheses
With the above figure giving a clear visualization of the established relationship between the
hypotheses and factors, the corresponding variables will be discussed in the following
paragraph.
3.3.1 Environmental attitude variables
In total there are 4 variables regarding environmental attitude. The first question about
environmental attitude states that an increasing amount of consumers recognizes the relevance
of taking care about ‘’mother earth’’ considering the design, production and disposing of the
purchased products. 74.7% agrees with this statement, this is in line with the increased
environmental awareness that has been discussed in the introduction.
•H1: A positive environmental attitude enhances ecological purchase intentions
Environmental Attitude
•H2a: Perceived social responsibility influences ecological purchase intentions
•H2b: Perceived corporate responsibility influences ecological purchase intentions
•H2c: Perceived governmental responsibility influences ecological purchase intentions
Perceived Responsibilities
•H3: Age influences ecological purchase intentions
Age
Ecological Purchase
Intentions

Erasmus University Rotterdam| Rajiv Hanoeman
23
0,9%
2,7%
9,0%
56,4%
31,0%
Strongly Disagree
Disagree
Neutral
Agree
Strongly Agree
Chart 2 Caring about flora
The following two questions ask if the respondents agree with statement ‘’Caring about the flora
(vegetation) and fauna (animals) is important’’. For these questions a large number of at least
87% agrees that both topics are important. There is very little difference between these two
results. It seems that the respondents value both flora and fauna almost equally important.
Similar to the previous question this outcome can be seen as expected considering the rise in
environmental consciousness.
The final environmental attitude variable measured if the respondents felt the need to talk about
environmental issues with their family and friends. 28.3% of the respondents did not felt the
need at all. Nevertheless, the majority of the respondents did actually share their environmental
concerns.
1,5%
9,3%
14,5%
60,6%
14,1%
Strongly Disagree
Disagree
Neutral
Agree
Strongly Agree
Chart 1 Recognize the relevance
0,9%
1,9%
9,0%
55,0%
33,2%
Strongly Disagree
Disagree
Neutral
Agree
Strongly Agree
Chart 3 Caring about fauna
28,3%
52,4%
19,3%
Not at all
Sometimes
Yes
Chart 4 The need to talk

Erasmus University Rotterdam| Rajiv Hanoeman
24
2,2%
10,6%
18,9%
47,5%
20,8%
Strongly Disagree
Disagree
Neutral
Agree
Strongly Agree
Chart 7 Social/cultural based solutions
4,2%
19,3%
20,6%
42,1%
13,8%
Strongly Disagree
Disagree
Neutral
Agree
Strongly Agree
Chart 5 Technology based solutions
3.3.2 Perceived responsibility variables
To measure perceived responsibilities, 6 variables have been selected. The graphs on this page
regard the section where the respondents were inquired about what they felt eco-friendliness
should have a strong focus on. Technology based is a variable for perceived corporate
responsibility.
Striking is that more respondents feel that society is responsible for eco-friendly solutions
instead of the technology bases and government based solutions. According to 68.3% of the
respondents, society should focus on eco-friendly solutions, whereas 48.1% agrees with the
government and 55.9% agrees that it should be technology based. The disagreement levels
reflect the same distribution. Chart 6 is the only variable that is linked with perceived
governmental responsibility.
6,1%
22,0%
24,7%
37,9%
9,2%
Strongly Disagree
Disagree
Neutral
Agree
Strongly Agree
Chart 6 Government based solutions

Erasmus University Rotterdam| Rajiv Hanoeman
25
Chart 8 corresponds with the statement that the business needs to pay attention to the
environmental impact in order to meet legal requirements without disturbing their potential of
expanding market segment. 68% of the respondents agree with this statement.
Chart 9 corresponds with the statement
that the business needs to pay attention to
current production methods and
consuming behaviour of the consumers in
order to minimize the use of energy,
pollution and waste. An astonishing
number of 86.5% agrees with this
statement.
Chart 10 corresponds with the
statement that consumers are
responsible to make a change in
purchasing eco-friendly products.
70.5% of the respondents agree that
they are responsible.
2,2%
8,4%
21,4%
53,9%
14,1%
Strongly Disagree
Disagree
Neutral
Agree
Strongly Agree
Chart 8 Business_legal_requirements
1,0%
3,3%
9,2%
52,0%
34,5%
Strongly Disagree
Disagree
Neutral
Agree
Strongly Agree
Chart 9 Business_production_methods
2,1%
9,5%
17,9%
44,4%
26,1%
Strongly Disagree
Disagree
Neutral
Agree
Strongly Agree
Chart 10 Consumers are responsible
Erasmus University Rotterdam| Rajiv Hanoeman
26
1,0%
59,6%
20,5%
12,1%
6,8%
< 17
18 - 26
27 - 40
41 - 55
> 55
Chart 11 Age
4,1%
22,7%
31,4%
34,3%
7,5%
Strongly Disagree
Disagree
Neutral
Agree
Strongly Agree
Chart 12 Striving to be more eco-friendly
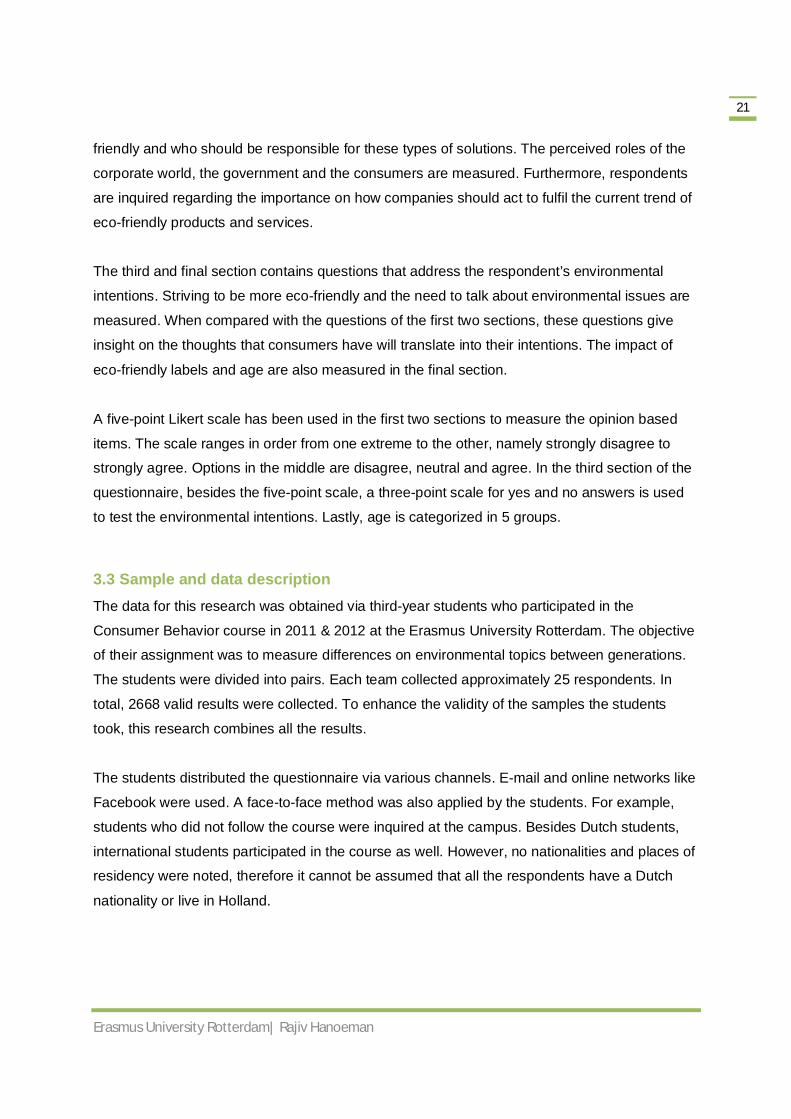
3.3.3 Age variable
A large majority of the respondents are between 18 and 26 years old. Explanation for this could
be that several teams surveyed their friends and other students at the campus. Only 1% of this
sample is younger than 18. Diekmann and Preisendörfer (1998) and Gilg et al. (2004) stated
that older age groups are less likely to consume eco-friendly.
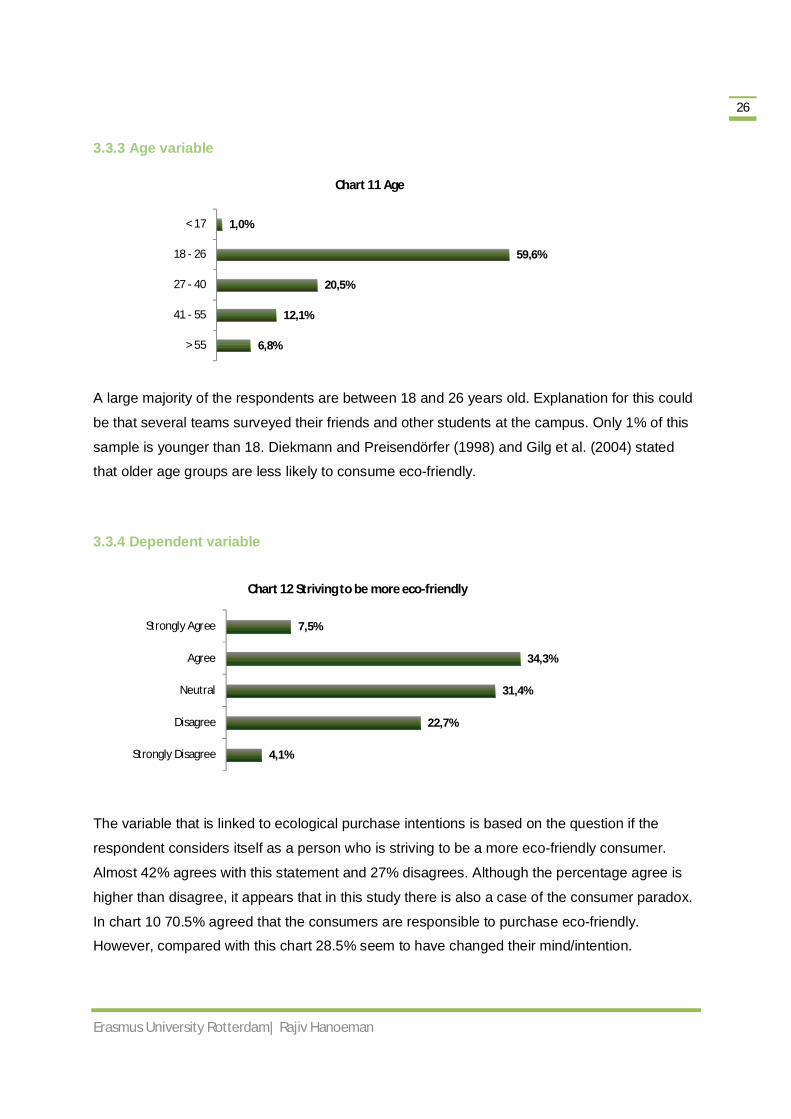
3.3.4 Dependent variable
The variable that is linked to ecological purchase intentions is based on the question if the
respondent considers itself as a person who is striving to be a more eco-friendly consumer.
Almost 42% agrees with this statement and 27% disagrees. Although the percentage agree is
higher than disagree, it appears that in this study there is also a case of the consumer paradox.
In chart 10 70.5% agreed that the consumers are responsible to purchase eco-friendly.
However, compared with this chart 28.5% seem to have changed their mind/intention.

Erasmus University Rotterdam| Rajiv Hanoeman
27
3.4 Data analyses In this subchapter, statistical subjects will be discussed. The statistical program IBM SPSS,
version 19, has been used to examine the collected data. Firstly, the preliminary work that is
necessary to correctly assess the data will be mentioned. From then on, various statistical tests
which have been applied will be discussed.
3.4.1 Data preparation
The adopted data was entered in excel. For this study the data has been inserted and modified
in SPSS. For the majority of the questions, a five-point Likert scale had been used in the survey.
These questions are coded as ordinal variables in SPSS. 1 for strongly disagree, 2 for disagree
– 5 for strongly agree. The remaining questions are coded as nominal variables: no as 1, do not
know/sometimes as 2 and yes as 3. Finally, age is dissected in 5 categories. To examine the
significance and influence of each age category, dummy variables (recoded into 0 and 1) have
been constructed. There were no missing values in the dataset.
3.4.2 Normal distribution
To determine which statistical tests can be used to analyse the data, the normality of the
collected data has to be assessed first. Furthermore, normal distributions are good descriptions
for random sampling and to estimate several types of chance outcomes, such as tossing a coin
many times (Moore, 2003).
‘’The normal distribution in statistics, also known as the Gaussian distribution, is defined by the
two parameters mean and standard deviation. It can be considered as a theoretical frequency
distribution for a set of variable data, usually represented by a bell-shaped curve symmetrical
about the mean’’4. Normally distributed data implies that the majority of the observations in a
sample are near the mean, whereas relatively few observations deviate to the left or right
border. The difference among these observations is measured by the standard deviation.
There are several options in SPSS to test if the data is normally distributed. In this paper a
normal probability plot will be constructed and histograms will be plotted. The normal probability
plot is a graphical method that reflects the values of the dependent variable against the
standardized values of the independent variables. If the values follow a straight linear line, it can
4 http://easycalculation.com/statistics/learn-normal-distribution.php
Erasmus University Rotterdam| Rajiv Hanoeman
28
be assumed that the data is normally distributed .The histograms reflect each of the variables in
graphs with a bell-shaped curve, the data can be considered normal if the curve is symmetrical.
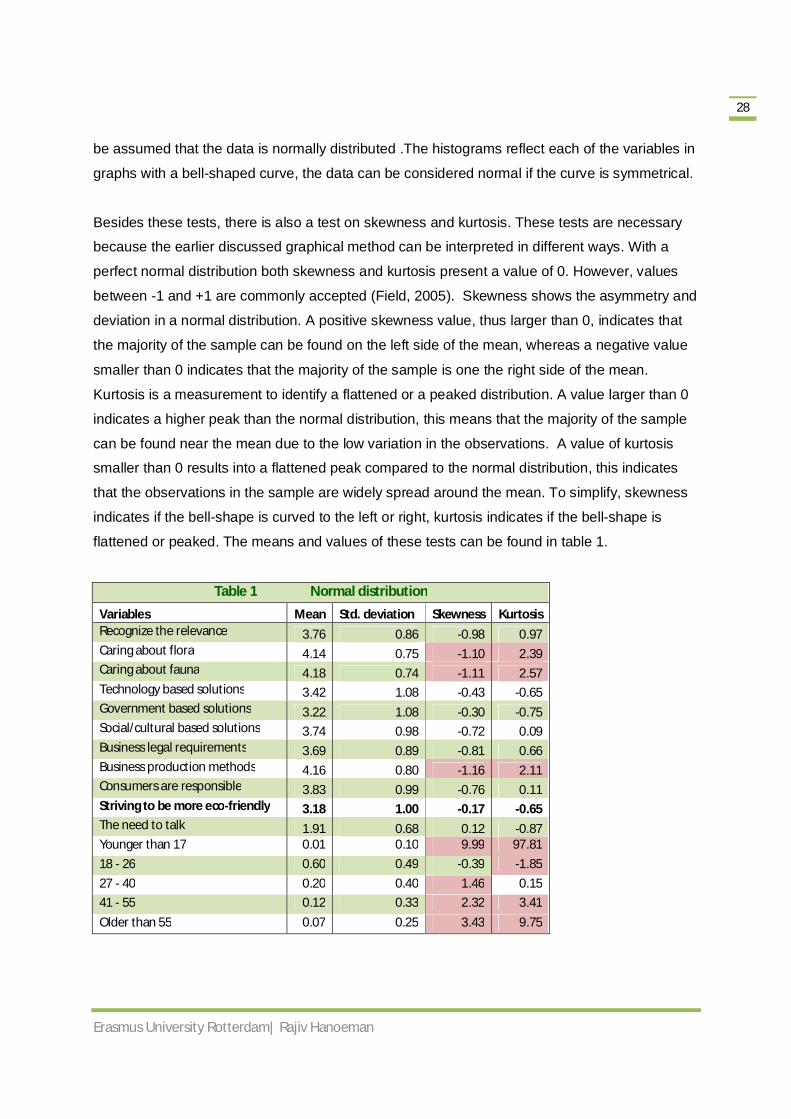
Besides these tests, there is also a test on skewness and kurtosis. These tests are necessary
because the earlier discussed graphical method can be interpreted in different ways. With a
perfect normal distribution both skewness and kurtosis present a value of 0. However, values
between -1 and +1 are commonly accepted (Field, 2005). Skewness shows the asymmetry and
deviation in a normal distribution. A positive skewness value, thus larger than 0, indicates that
the majority of the sample can be found on the left side of the mean, whereas a negative value
smaller than 0 indicates that the majority of the sample is one the right side of the mean.
Kurtosis is a measurement to identify a flattened or a peaked distribution. A value larger than 0
indicates a higher peak than the normal distribution, this means that the majority of the sample
can be found near the mean due to the low variation in the observations. A value of kurtosis
smaller than 0 results into a flattened peak compared to the normal distribution, this indicates
that the observations in the sample are widely spread around the mean. To simplify, skewness
indicates if the bell-shape is curved to the left or right, kurtosis indicates if the bell-shape is
flattened or peaked. The means and values of these tests can be found in table 1.
Table 1 Normal distribution
Variables Mean Std. deviation Skewness Kurtosis Recognize the relevance 3.76 0.86 -0.98 0.97 Caring about flora 4.14 0.75 -1.10 2.39 Caring about fauna 4.18 0.74 -1.11 2.57 Technology based solutions 3.42 1.08 -0.43 -0.65 Government based solutions 3.22 1.08 -0.30 -0.75 Social/cultural based solutions 3.74 0.98 -0.72 0.09 Business legal requirements 3.69 0.89 -0.81 0.66 Business production methods 4.16 0.80 -1.16 2.11 Consumers are responsible 3.83 0.99 -0.76 0.11 Striving to be more eco-friendly 3.18 1.00 -0.17 -0.65 The need to talk 1.91 0.68 0.12 -0.87 Younger than 17 0.01 0.10 9.99 97.81 18 - 26 0.60 0.49 -0.39 -1.85 27 - 40 0.20 0.40 1.46 0.15 41 - 55 0.12 0.33 2.32 3.41 Older than 55 0.07 0.25 3.43 9.75

Erasmus University Rotterdam| Rajiv Hanoeman
29
According to the normality tests, 8 out of the 16 of the variables are not normal distributed.
However, the dependent variable is normally distributed. The normal probability plot and the
corresponding histogram also confirm the normality of the dependent variable related with the
independent variables. This is one of the key assumptions for using multiple regression
analysis, the corresponding graphs can be found in appendix 3.
3.4.3 Correlation analysis A correlation test measures to what extent linear relationships exists amongst the variables
(Field, 2005). The correlation describes the strength, also known as effect size, and direction of
the linear relationship. Using this analysis can determine which variables are valuable to further
examine. In this paper it will be measured to what extent the independent variables (X)
associate with the dependent variable (Y).
The correlation analysis results into a coefficient that can be positive as well as negative. The
value lies between -1 and 1. A coefficient of 0 indicates that there is no relationship at all
between the variables, and a value of 1 or -1 means there is a perfect positive or negative
relationship. For example, if the correlation coefficient between caring about fauna and caring
about flora is 1, it means that caring about fauna implies that the respondent also cares about
the flora.
Pearson’s correlation coefficient will be used to measure the relationships, also known as
Pearson’s r. The coefficient is useful because it provides an unbiased measure of the
importance of an effect (Field, 2005). In his book Field also states commonly accepted numbers
for effect size:
Small effect r ≈ 0.10
Medium effect r ≈ 0.30
Large effect r ≈ 0.50
In SPSS the significance and effect size (r) of correlations can be calculated. A relationship
between variables exists if the correlation coefficients are significant.
Person’s formula can be found on the next page, where µx refers to the means of the
independent variables whereas µy reflects the mean of the dependent variable. σx and σy
reflect the standard deviation.

Erasmus University Rotterdam| Rajiv Hanoeman
30
(3.1) Pearson’s correlation coefficient formula
풓 =퐶푂푉푥푦σxσy
= ∑(푋푖 − μx)(푌푖 − μy)
(푁− 1)σxσy
3.4.4 Multiple regression analysis
While correlation measures the effect size of a linear relationship among two variables,
regression goes a step further. It is believed that regression analysis is probably the most widely
applied statistical method for forecasting and financial analysis. With regression analysis it is
possible to predict one variable from another. A correlation coefficient reflects how strong a
relationship between two variables is, regression analysis constructs a predictive model based
on the data. Through this model values of the dependent variable can be predicted from the
independent variables (Field, 2005).
In this paper it will be examined which variables can indicate/predict ecological purchase
intentions. As mentioned earlier, this study has 16 variables including the dependent variable.
Hence the predictive power of 15 variables will be tested. To determine if these variables
influence effect on ecological purchase intentions, a significance level, also known as p-value,
of 5% will be applied. This level suggests that only if it is certain by 95% that the result is
genuine, it can be accepted as significant (Field, 2005).
In SPSS Linear Regression will be selected to construct the regression model.
To clarify how multiple regression analyses work, the formula can be found below. In this
research the dependent variable is ordinal, so it is not possible to reproduce the same formula
for the data. However, the results can predict the influence on ecological purchase intentions
(3.2) Multiple regression formula
Y = β0 + β1X1 + β2X2 + ……. βnXn + ε
Where:
Y = Dependent variable
Xn = Independent variables
β0 = Intercept/starting point of the model
βn = Coefficients/estimates belonging to each variable x for the individual i
ε = error or residue of the model

Erasmus University Rotterdam| Rajiv Hanoeman
31
To use regression analysis, several assumptions have to be met/true:
Normal distribution
This assumption has already been tested and fulfilled by the normal probability plot,
histogram, skewness and kurtosis. Nevertheless, from a statistical view it is
recommended that all variables used in the model are normally distributed.
Lack of multicollinearity
A risk in many datasets is multicollinearity, this stands for a high correlation between
independent variables. In the previous subchapter it was mentioned that a high
correlation is favourable, however this only applies to the correlation between a
dependent and independent variable. A strong correlation between independent
variables can result into an arbitrary regression model. In this the case both variables
practically explain the same variance in the dependent variable due to the high
standard error and low coefficient. Consequently, the importance of the variables in
the model cannot be determined. Multicollinearity can be measured in SPSS with the
option collinearity diagnostics. This option produces a variance inflation factor (VIF).
According to several researchers that Field (2005) states in his book, VIF values
above 10 and below 0.2 are worthy of concern. In this study the values are between
1 and 2, the numbers can be found in appendix 5.
Linear relationships among dependent and independent variables
This assumption has already been tested and fulfilled by the normal probability plot
and correlation analysis.
Independent errors
For any succeeding observations in regression analysis, the residuals should be
uncorrelated (Field, 2005). This problem is also known as autocorrelation and it often
occurs with time series in regression models. It can wrongfully enlarge regression
estimates and increase p values. For this assumption Durbin-Watson is the test to
use in SPSS. The number of this test varies between 0 and 4. A number near 2 is
commonly accepted, and implies that there is very little correlation between
residuals. In this study the Durbin-Watson number is 1.7, hence this assumption has
been met.
Erasmus University Rotterdam| Rajiv Hanoeman
32
0,24
0,33
0,32
0,04
0,08
0,16
0,05
0,19
0,28
0,41
-0,16
0,08
0,11
0,05
Recognize the relevance
Caring about flora
Caring about fauna
Technology based solutions
Government based solutions
Social based solutions
Business legal requirements
Business production methods
Consumers are responsible
Need to talk
18 - 26
27 - 40
40 - 55
Older than 55
Chart 13 Correlations with the strive to be an eco-friendly consumer
Chapter 4 Results
In this chapter the statistical results and importance of the correlation analysis and regression
analysis will be discussed. Subsequently, at the end of this chapter the hypotheses will be
tested by means of these results.
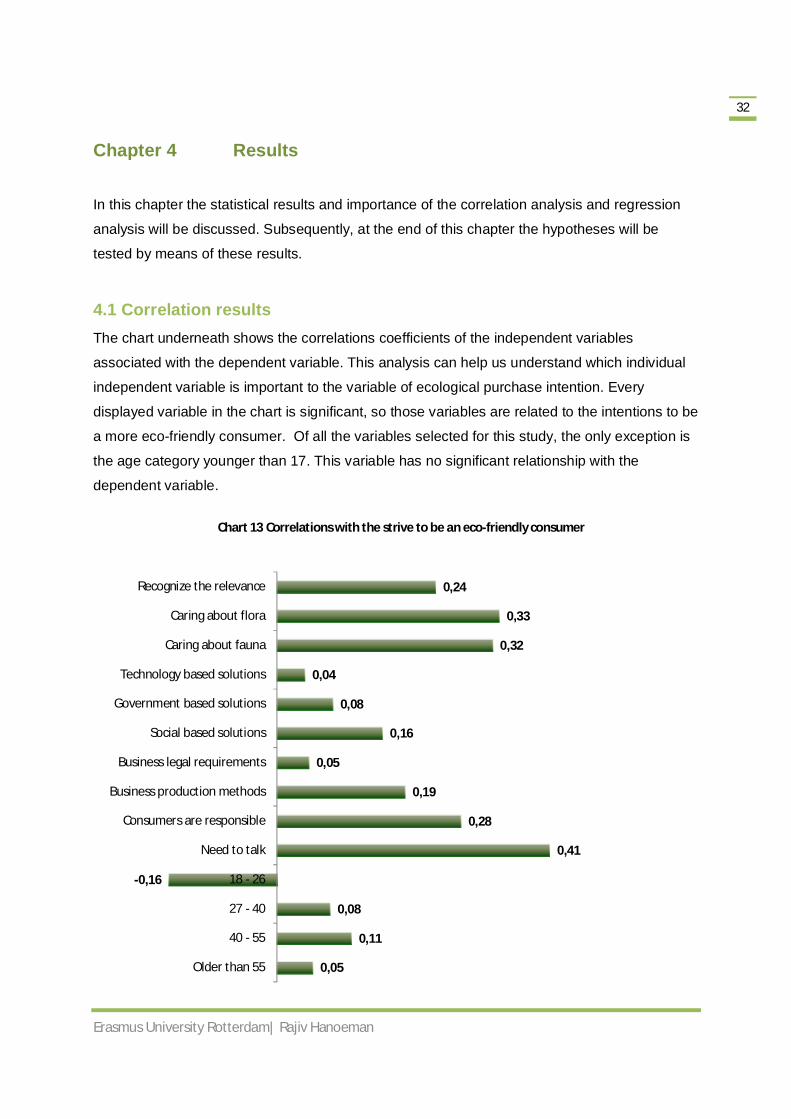
4.1 Correlation results The chart underneath shows the correlations coefficients of the independent variables
associated with the dependent variable. This analysis can help us understand which individual
independent variable is important to the variable of ecological purchase intention. Every
displayed variable in the chart is significant, so those variables are related to the intentions to be
a more eco-friendly consumer. Of all the variables selected for this study, the only exception is
the age category younger than 17. This variable has no significant relationship with the
dependent variable.

Erasmus University Rotterdam| Rajiv Hanoeman
33
The other age category of 18 – 26 appears to be the only variable that has a negative
relationship with the dependent variable. This implies that an increase in that age category
results into a decrease in the strive to be an eco-friendly consumers. However, with a coefficient
of –0.16 the effect size is relatively small as discovered from the previous chapter. The small
effect size also implies for the other age categories, where respondents between 40 – 55 years
old appear to have the strongest association versus the respondents of 55 years and older with
the lowest association of the age categories.
Most variables regarding the perceived responsibilities similarly show small effect sizes related
to ecological purchase intentions. The statement that eco-friendly means a strong focus on
technology based solutions has the lowest effect of all variables on ecological purchase
intentions. The only variable directly linked to governmental responsibility also has a low
association with ecological purchase intentions. On the other hand, the statement that
consumers are responsible to make a change in purchasing eco-friendly products has a
medium effect size with a coefficient of 0.28. This is the strongest association within perceived
responsibilities, and certainly worth examining.
From all the selected ones in this model, the variables linked to environmental attitude appear to
have the largest effect size on ecological purchase intentions. The statement that an increasing
amount of consumers recognizes the relevance of taking care about ‘’mother earth’’ considering
the design, production and disposing of purchased products has the lowest association within
this set. Feeling the need to talk about environmental issues with family/friends has the highest
association with ecological purchase intentions of all variables in this paper. With a coefficient of
0.41 the effect size is exactly between medium and large, respectively 0.3 and 0.5. This implies
that the need to talk is an important variable regarding ecological purchase intentions.
The correlation amongst all the variables can be found in appendix 4. As expected the
correlation between caring about flora and fauna is the highest of all, nonetheless the VIF is
acceptable for using both variables in the regression analysis.
4.2 Multiple regression results Although correlation analysis is useful to study the different variables, the analysis cannot
determine in which direction the dependent variable will follow when all variables are tested
together. In this subchapter we will discuss the predictive power of the significant variables.
Erasmus University Rotterdam| Rajiv Hanoeman
34
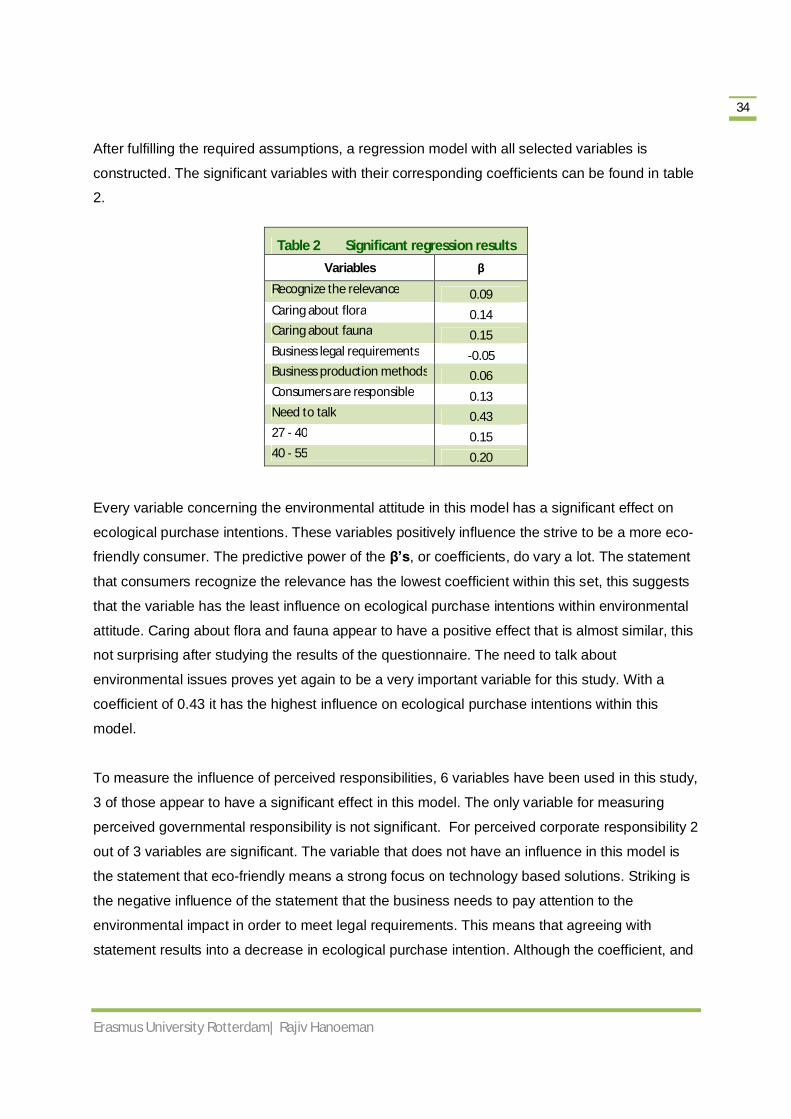
After fulfilling the required assumptions, a regression model with all selected variables is
constructed. The significant variables with their corresponding coefficients can be found in table
2.
Table 2 Significant regression results Variables β
Recognize the relevance 0.09 Caring about flora 0.14 Caring about fauna 0.15 Business legal requirements -0.05 Business production methods 0.06 Consumers are responsible 0.13 Need to talk 0.43 27 - 40 0.15 40 - 55 0.20
Every variable concerning the environmental attitude in this model has a significant effect on
ecological purchase intentions. These variables positively influence the strive to be a more eco-
friendly consumer. The predictive power of the β’s, or coefficients, do vary a lot. The statement
that consumers recognize the relevance has the lowest coefficient within this set, this suggests
that the variable has the least influence on ecological purchase intentions within environmental
attitude. Caring about flora and fauna appear to have a positive effect that is almost similar, this
not surprising after studying the results of the questionnaire. The need to talk about
environmental issues proves yet again to be a very important variable for this study. With a
coefficient of 0.43 it has the highest influence on ecological purchase intentions within this
model.
To measure the influence of perceived responsibilities, 6 variables have been used in this study,
3 of those appear to have a significant effect in this model. The only variable for measuring
perceived governmental responsibility is not significant. For perceived corporate responsibility 2
out of 3 variables are significant. The variable that does not have an influence in this model is
the statement that eco-friendly means a strong focus on technology based solutions. Striking is
the negative influence of the statement that the business needs to pay attention to the
environmental impact in order to meet legal requirements. This means that agreeing with
statement results into a decrease in ecological purchase intention. Although the coefficient, and

Erasmus University Rotterdam| Rajiv Hanoeman
35
therefore the predictive power, is relatively low, this variable has a significant value. Perceived
social responsibility has 1 significant variable out of 2. The insignificant variable is the statement
that eco-friendly means a strong focus on social/cultural based solutions. However, the other
statement that consumers are responsible to make a change in purchasing eco-friendly
products, is significant and has a predictive power of 0.13 which can be considered as
influential.
Of the 5 age categories, 3 groups appear to be insignificant in this model. The groups of 27 - 40
and 40 – 55 have a significant influence on ecological purchase intentions with respectively
coefficients of 0.15 and 0.20. This implies that the category of 40 – 55 has a stronger intention
than the younger group. In fact, the specific category is the second most powerful predictor in
the regression model. The other variables and a total overview of the regression model can be
found in appendix 5.
4.3 Overview of results In this subchapter the hypotheses and independent variables are linked in order to indicate the
consequences of the previous discussed results.
H1: A positive environmental attitude enhances ecological purchase intentions
Recognize the relevance is significant with a β of 0.09
Caring about flora is significant with a β of 0.14
Caring about fauna is significant β of 0.15
Need to talk is significant with a β of 0.43
This hypothesis is supported, all variables are significant.
H2a: Perceived social responsibility influences ecological purchase intentions
Social/cultural based solutions is not significant
Consumers are responsible is significant with a β of 0.13
This hypothesis is supported. Despite the insignificance of one variable, the correlation and β of
the other variable appear to be significant enough to affect ecological purchase intentions.
Recommended is to further investigate this topic, and if possible add more variables to
determine the importance of this topic.
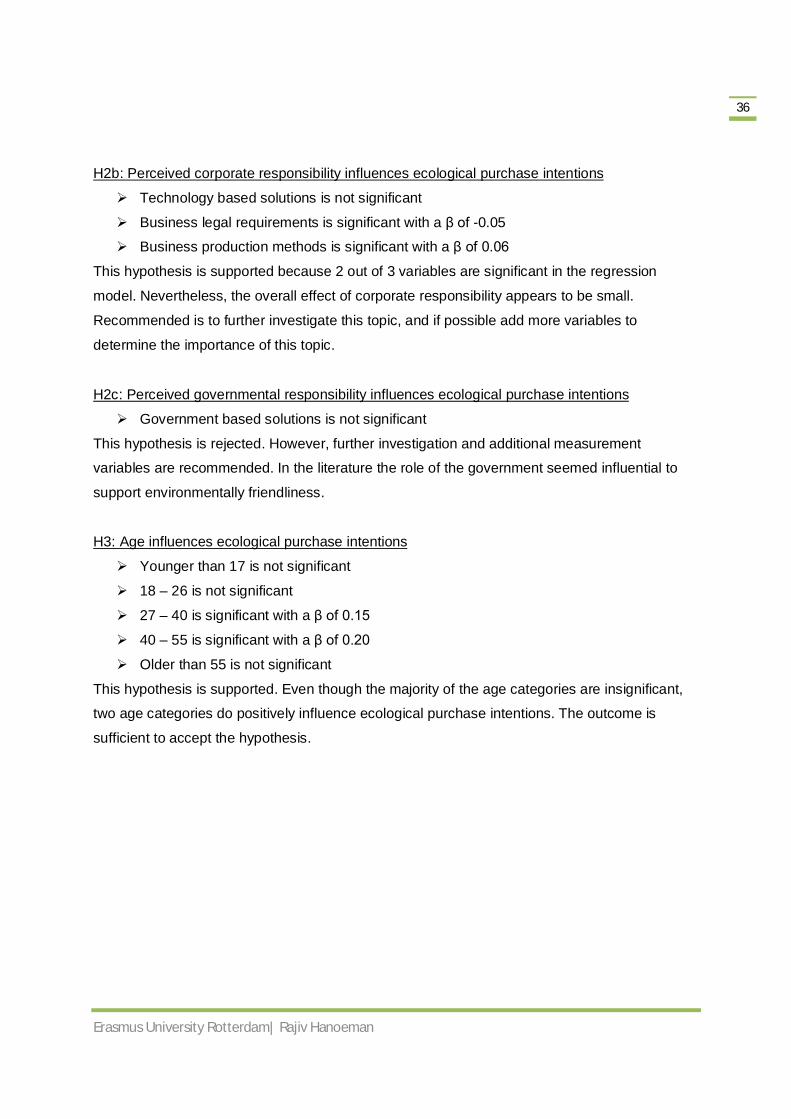
Erasmus University Rotterdam| Rajiv Hanoeman
36
H2b: Perceived corporate responsibility influences ecological purchase intentions
Technology based solutions is not significant
Business legal requirements is significant with a β of -0.05
Business production methods is significant with a β of 0.06
This hypothesis is supported because 2 out of 3 variables are significant in the regression
model. Nevertheless, the overall effect of corporate responsibility appears to be small.
Recommended is to further investigate this topic, and if possible add more variables to
determine the importance of this topic.
H2c: Perceived governmental responsibility influences ecological purchase intentions
Government based solutions is not significant
This hypothesis is rejected. However, further investigation and additional measurement
variables are recommended. In the literature the role of the government seemed influential to
support environmentally friendliness.
H3: Age influences ecological purchase intentions
Younger than 17 is not significant
18 – 26 is not significant
27 – 40 is significant with a β of 0.15
40 – 55 is significant with a β of 0.20
Older than 55 is not significant
This hypothesis is supported. Even though the majority of the age categories are insignificant,
two age categories do positively influence ecological purchase intentions. The outcome is
sufficient to accept the hypothesis.

Erasmus University Rotterdam| Rajiv Hanoeman
37
Chapter 5 Conclusion
The following research question was formulated at the beginning of this paper:
“Do consumers value a sustainable environment and which factors affect their ecological purchase intentions?”
To measure if consumers value a sustainable environment, the answers of both questions
caring about the flora and fauna will be studied. These questions have been discussed in
chapter 3.3.1, to recall 87% of the respondents agreed that both topics are important, while
70.5% agrees that consumers themselves are responsible for purchasing eco-friendly products.
Based on these percentages it can be assumed that they do value a sustainable environment.
Nevertheless, compared with the level of agreement with the dependent variable, only 42%
strives to eco-friendly consumption. This is in line with the consumer paradox theories of
Diekmann and Preisendörferer (1998), Carrington et al. (2010), and Grimmer and Bingham
(2013). They all found inconsistencies between society’s environmental attitudes and their
behaviour. To conclude, consumers say that they value a sustainable environment, however
only half of them behave this way.
To answer the second part of the main question, the sub research questions will be discussed
assisted by the literature and results.
Does a positive environmental attitude affect ecological purchase intentions?
A positive environmental attitude proves to be an influential indicator for ecological purchase
intentions in this research. Fraj and Martinez (2007), and Eliam Trop (2012) had similar findings
regarding the predictive power of environmental attitudes. In the study of Kinnear et al. (1973)
attitudes also served as indicators for ecologically-conscious purchasing.
Within this study all the selected variables for environmental attitudes have a significant effect
on ecological purchase intentions. Feeling the need to talk about environmental issues with
family and friends appears to be a powerful predictor for ecological purchase intentions, this
variable has the highest coefficient of the regression model.

Erasmus University Rotterdam| Rajiv Hanoeman
38
Do perceived responsibilities affect ecological purchase intentions?
Chen and Chai (2010), and Mei et al. (2012) mention that the government should initiate and
promote sustainability for their society. The respondents of this study disagree, perceived
governmental responsibility does not affect ecological purchase intentions. Only one variable is
used in this study, it is desirable if more are added.
The results show a partial effect on perceived social responsibilities. At the same time, this
effect is the strongest of all entities with perceived responsibilities. The variable consumers are
responsible is significant and the correlation coefficient is relatively high, hence perceived social
responsibility affects ecological purchase intentions.
The same applies for perceived corporate responsibilities, 2 out of 3 variables are significant.
Nevertheless, the predictive power of this factor is questionable due to the negative and positive
coefficients with almost the same value.
Does age influences ecological purchase intentions?
Diekmann and Preisendörfer (1998) did not found a significant effect with age on environmental
behaviour. They also stated that older people have shown to be less environmentally concerned
when it came to their shopping behaviour. However, Gilg et al. (2004) found that age had a
positive impact on green consumption. In this research the younger age groups also consumed
more eco-friendly products.
Similar to Gilg et al.(2004), in this study a positive influence of age on ecological purchase
intentions is established. The respondents between 27 – 40 and 40 – 55 showed a significant
effect. In this study the influence of the older group is larger.
5.1 Limitations A major limitation is that this research design was largely adapted onto the available
questionnaire and available dataset. A crucial shortcoming is that some themes have been left
untouched in this questionnaire. For instance, there are very little psychographics and no
demographics of the respondents besides age. These data can help gaining a better
understanding of the ecological consumer. Even though the statements of Balderjahn (1998)
and Thompson et al. (2010) state that the predictive power of demographics is low, more recent
studies of Mei et al. (2012) and Ottmann (2011) segment the ecological consumers based on
demographic and psychographic variables. Both studies seem to agree that females are more
likely to consume eco-friendly products.
Erasmus University Rotterdam| Rajiv Hanoeman
39
Another limitation might be that some student teams used the face-to-face method for the
survey. A major disadvantage of this method is that the presence of the interviewers might
encourage social desirable answers rather than a respondent’s truthful answers (Duffy et al.
2005). With this study on ecological intentions the answers the respondents gave, might be
biased towards environmental conscious. The number of respondents that were surveyed by
the face-to-face method is not known, thus it cannot be determined how many of them might not
answered truthfully so they do not seem oblivious to the environment.
Finally, multiple regression analysis is used while not all variables are normally distributed.
Although the results of the normal probability plot and histogram justified the applied method, in
the statistical field is preferred that all the variables for regression are normally distributed. The
largest distortions occurred in the age categories. To prevent this in the future it is wise to
approach and record an equal amount of these groups.
5.2 Recommendations for further research A recommendation is to expand research on the need to talk about environmental issues. This
has proven to be a strong predictor in this model. If this variable appears to be significant in
other studies, it might be a useful variable to utilize in the academic and managerial field. In
addition, demographics and psychographics should be added in the research model to gain a
better understanding of the consumer.
Perceived responsibilities might provide new insights in this field. In this study a few variables
that are linked to these responsibilities have significant outcomes. Nevertheless, the predictive
powers of these variables appear to be low. To determine if perceived responsibilities can
contribute to this field, it is advisable to conduct a study with more variables per entity and
determine if the influence is similarly significant.
Eco-friendly labels might also be predictors for ecological purchase intentions. In the survey
there was a question about these labels. Respondents were asked if, according to them, eco-
friendly labels on shopping goods will improve the environment. The majority responded
positively, and this resulted into a significant variable. In appendix 5 an additional regression
model with the eco-friendly label variable is constructed. Due to the magnitude of this subject,
this variable has not been discussed in this paper.

Erasmus University Rotterdam| Rajiv Hanoeman
40
References Papers
Ajzen, I. (1985) ''From intentions to actions: a theory of planned behaviour'', in Kuhl, J. and Beckmann, J. (Eds),
Action-Control:From Cognition to Behaviour, Springer-Verlag, Heidelberg; pp. 11 – 39
Ajzen, I. (1991) ''The Theory of Planned Behavior'', Organizational Behavior and Human Decision Processes 50;
pp. 179 - 211
Ajzen, I., Timko, C., & White, J.B. (1982) ''Self-monitoring and the attitude-behavior relation'', Journal of Personality
and Social Psychology 42; pp. 426 - 435
Balderjahn, I. (1988) ''Personality Variables and Environmental Attitudes as Predictors of Ecologically
Responsible Consumption Patterns'', Journal of Business Research 17; pp 51 - 56
Bandhura, A., Adams, N.E., Hardy, A.B., & Howells, G.N. (1980) ''Tests of the generality of self-efficacy theory'',
Cognitive Therapy and Research 4; pp. 39 - 66
Barr, S. (2003) ''Strategies for Sustainability: Citizens and Responsible Environmental Behaviour, Area Vol. 35 No.
3; pp. 227 - 240
Brooker, G. (1976) ''The Self-Actualizing Socially Conscious Consumer'', Journal of Consumer Research, Vol. 3,
No. 2; pp. 107 - 112
Chen, T. B., & Chai, L. T. (2010) ''Attitude towards the environment and green products: Consumers perspective'',
Management Science and Engineering 4; pp. 27 - 39
Chen, Y. S. & Chang, C.H. (2012) ''Enhance green purchase intentions: The roles of green perceived value, green
perceived risk, and green trust'', Management Decision Vol. 50 No. 3; pp. 502 - 520
Cohan, P. S. (2009). Use Peer Pressure To Sell Your Product. Retrieved from: www.financialexecutives.org
Daido, K (2004) ''Risk-averse agents with peer pressure'', Applied Economics Letters; pp. 383 – 386
Derksen, L. & Gartrell, J. (1993) ''The Social Context of Recycling'', American Sociological Review 58; pp. 434 -
442
Diekmann, A. & Preisendörfer, P. (1998) ''Environmental Behavior: Discrepancies Between Aspirations And
Reality'', Rationality and Society Vol. 10; pp. 79 - 102
Diekmeyer, P. (2008) ''Bribery in public procurement: protecting your company from corruption''
Erasmus University Rotterdam| Rajiv Hanoeman
41
Duffy, B., Smith, K., Tehanian, G. & Bremer, J. (2005) ‘’Comparing data from online and face-to-face surveys’’,
International Journal of Market Research Vol. 47; pp. 615 - 639
Eilam, E. & Trop, T. (2012) ''Environmental Attitudes and Environmental Behavior-Which Is the Horse and Which Is
the Cart?'', Sustainability 2012, 4; pp. 2210 - 2246
Fishbein, M., & Ajzen, I. (1975) ''Belief, attitude, intention and behavior: An introduction to theory and research
reading'' MA: Addison-Wesley
Fraj, E. & Martinez, E. (2007) ''Ecological consumer behaviour: an empirical analysis'', International Journal of
Consumer Studies 31; pp. 26 – 33
Gilg, A., Barr, S. & Ford, N. (2005) ''Green consumption or sustainable lifestyles? Identifying the sustainable
consumer'', Futures 37; pp. 481 - 504
Grimmer, M. & Bingham, T. (2013) ''Company environmental performance and consumer purchase intentions'',
Journal of Business Research 66; pp. 1946 - 1953
Guagnano, G.A., Stern, P.C. & Dietz, T. (1995) ''Influences on attitude-behavior relationships: a neutral experiment
with kerbside recycling'', Environment and Behavior 27; pp. 699 - 718
Haron. S. A., Paim. L., & Yahaya. N. (2005) ‘’Towards sustainable consumption: an examination of environmental
knowledge among Malaysians’’, International Journal of Consumer Studies, 29(5); pp. 426 – 436
Henion, K.E. & Wilson, William H. (1976) ''The Ecologically Concerned Consumer and Locus of Control, in
Ecological Marketing'', Karl E. Henion and Thomas C. Kinnear, eds. American Marketing Association Series,
Austin, Tex; pp. 131 - 144
Jones, R.E. & Dunlap, R.E. (1992) ''The Social Bases of Environmental Concerns: Have They Changed over
Time?'', Rural Sociology 57; pp. 28 - 47
Kalafatis, S.P., Pollard. M, East, R., Tsogas, M.H. (1999) ''Green marketing and Ajzen's theory of planned
behaviour: a cross-market examination'', Journal of Consumer Marketing, Vol. 16 No.5; pp. 441- 460
Kinnear, T.C., & Taylor, J.R. (1973) ''The Effect of Ecological Concern on Brand Perceptions'', Journal of Marketing
Research; pp. 191 - 197
Lee, C. and Green, R.T. (1991) ''Cross-cultural examination of the Fishbein behavioural intentions model'', Journal
of International Business Studies Vol. 22 No. 2; pp. 289 - 305
Erasmus University Rotterdam| Rajiv Hanoeman
42
Lu, Y., Zhao, L. and Wang, B. (2010), “From virtual community members to C2C e-commerce buyers: Trust in
virtual communities and its effect on consumers’ purchase intention”, Electronic Commerce Research and
Applications, Vol. 9 No. 4; pp. 346 - 360.
Madden, T. J., Ellen, P.S. & Ajzen, I. (1992) ''A Comparison of the Theory of Planned Behavior and the Theory of
Reasoned Action'', Personality and Social Psychology Bulletin, Vol. 18 No. 1; pp. 3 - 9
McIntosh, A. (1991) ''The impact of environmental issues on marketing and politics in the 1990s'', Journal of Market
Reseatch Society, Vol. 33 No. 3; pp. 205 - 217
Mei, O.J., Ling. K.C. & Piew, T.H. (2012) ''The Antecedents of Green Purchase Intention among Malaysian
Consumers'' , Asian Social Science; Vol. 8, No. 13; pp. 248 - 263
Mostafa, M. M. (2007) ''Gender differences in Egyptian consumers green purchase behavior: The effects of
environmental knowledge, concern and attitude'', International Journal of Consumer Study 31; pp. 220 - 229.
Oreg, S. & Katz-Gerro, T. (2006) ''Prediciting Proenvironmental Behavior Cross-Nationally Values, the Theory of
Planned Behavior and Value-Belief-Norm Theory'', ENVIRONMENT AND BEHAVIOR, Vol. 38 No. 4; pp. 462 - 483
Renfro, L. A. (2010) ''Green business operations and green marketing'', Gatton Student Research Publication, 2.
Stern, P.C., Dietz, T. & Guagnano, G.A. (1995) ''The new ecological paradigm in social-psychological context'',
Environment and Behavior 27; pp. 723 - 743
Tapon, F. and Leighton, T. (1991), ''Green as strategy: lessons from the chemical industry'', Strategic Management
Society; pp. 23 – 26
Thompson, D.W., Anderson, R.C., Hansen, E.N. & Kahle, L.R. (2010) ''Green Segmentation and Environmental
Certification: Insights from Forest Products'', Business Strategy and the Environment 19; pp. 319 - 334
Van Liere, K.D. & Dunlap, R.E. (1980) ''The Social Bases of Environmental Concern: A Review of Hypotheses,
Explanations and Empirical Evidince'', Public Opinion Quarterly 44; pp. 181 - 197
Wray-Lake, L., Flanagan, C.A. & Osgood, D.W. (2010) ''Examining Trends in Adolescent Environmental Attitudes,
Beliefs, and Behaviors Across Three Decades'', Environment and Behavior Vol. 42 No.1; pp. 65 – 85

Erasmus University Rotterdam| Rajiv Hanoeman
43
Books Charter, M. (1992) ''Greener Marketing: A Responsible Approach to Business’’, Greenleaf, Sheffield
Field, A. (2005) ‘’Discovering Statistics Using SPS’’ Second edition, Sage Publications
Moore, D.S., McCabe, G.P., Duckworth, W.M. & Sclove, S.L. (2003) ‘’The Practice of Business Statistics, Using
data for decisions’’, W.H. Freeman and Company
Ottmann, J.A. (2011) ‘’The New Rules of Green Marketing. Strategies, Tools and Inspiration for Sustainable
branding’’ Greenleaf Publishing
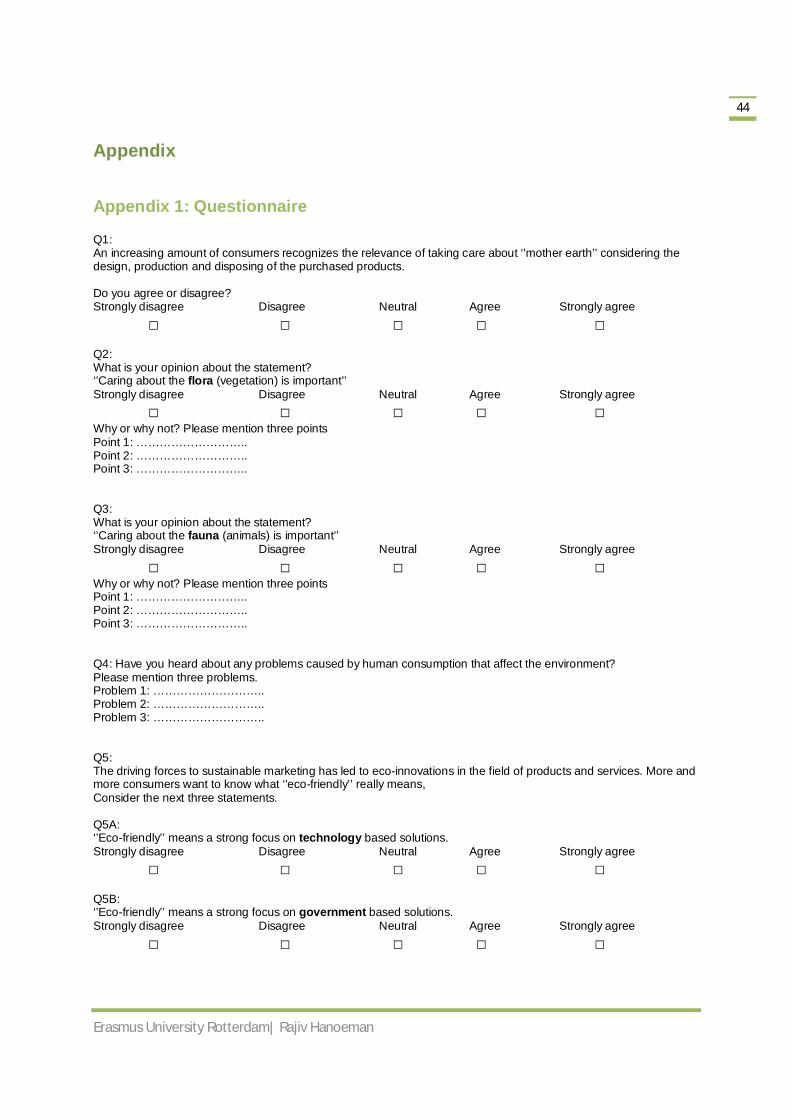
Erasmus University Rotterdam| Rajiv Hanoeman
44
Appendix
Appendix 1: Questionnaire Q1: An increasing amount of consumers recognizes the relevance of taking care about ‘’mother earth’’ considering the design, production and disposing of the purchased products. Do you agree or disagree? Strongly disagree Disagree Neutral Agree Strongly agree □ □ □ □ □ Q2: What is your opinion about the statement? ‘’Caring about the flora (vegetation) is important’’ Strongly disagree Disagree Neutral Agree Strongly agree □ □ □ □ □ Why or why not? Please mention three points Point 1: ……………………….. Point 2: ……………………….. Point 3: ……………………….. Q3: What is your opinion about the statement? ‘’Caring about the fauna (animals) is important’’ Strongly disagree Disagree Neutral Agree Strongly agree □ □ □ □ □ Why or why not? Please mention three points Point 1: ……………………….. Point 2: ……………………….. Point 3: ……………………….. Q4: Have you heard about any problems caused by human consumption that affect the environment? Please mention three problems. Problem 1: ……………………….. Problem 2: ……………………….. Problem 3: ……………………….. Q5: The driving forces to sustainable marketing has led to eco-innovations in the field of products and services. More and more consumers want to know what ‘’eco-friendly’’ really means, Consider the next three statements. Q5A: ‘’Eco-friendly’’ means a strong focus on technology based solutions. Strongly disagree Disagree Neutral Agree Strongly agree □ □ □ □ □ Q5B: ‘’Eco-friendly’’ means a strong focus on government based solutions. Strongly disagree Disagree Neutral Agree Strongly agree □ □ □ □ □

Erasmus University Rotterdam| Rajiv Hanoeman
45
Q5C: ‘’Eco-friendly’’ means a strong focus on social/cultural based solutions. Strongly disagree Disagree Neutral Agree Strongly agree □ □ □ □ □ Q6: The trend on the demand side of the food industry and food chains(shops) shows that consumers are more and more concerned with ‘eco-friendly’ food products. Consequently the industry and the shop chains have to change their methods of production and selling of the products. Where do you think the business should start to make the change? Consider the next three statements: Q6A: The business needs to pay attention to the environmental impact in order to meet legal requirements without disturbing their potential of expanding market segment. Strongly disagree Disagree Neutral Agree Strongly agree □ □ □ □ □ Q6B: The business needs to current business production methods and consuming behaviour of the consumers in order to minimize the use of energy, pollution and waste. Strongly disagree Disagree Neutral Agree Strongly agree □ □ □ □ □ Q6C: Consumers are responsible to make a change in purchasing ‘eco-friendly’ products.. Strongly disagree Disagree Neutral Agree Strongly agree □ □ □ □ □ Q7: One of the ideas for creating a better environment is to change the behaviour of consumers towards more ‘eco-friendliness’ or sustainable purchasing. Q7A: Do you consider yourself as a person who is striving to be a more ‘eco-friendly’ consumer? Strongly disagree Disagree Neutral Agree Strongly agree □ □ □ □ □ Q7B: Do you feel the need to talk about environmental issues with your family/friends? Not at all Sometimes Yes □ □ □ Q7C: Do you think ‘eco-friendly’ labels on shopping goods will improve the environment? No Don’t know Yes □ □ □ Q8: Do you prefer organic wine/beer above a fair trade wine/beer? No Don’t know Yes □ □ □

Erasmus University Rotterdam| Rajiv Hanoeman
46
Q9: What does it mean to say that something is ‘natural’? ………………………………………………………......... Q10: What should people do to live in harmony with nature? ……………………………………………………………… Q11: Suppose you are the minister of environmental affairs, what would be your main policy goals? ………………………………………………………………. Q12: What is the age of the respondent? 8 - 17 18 - 26 27 - 40 41 - 55 Older than 55 □ □ □ □ □
Appendix 2: Frequency tables SPSS output
Consumers recognize the relevance of taking care of ''mother earth''
Caring about the flora (vegetation) is important Frequency Percent Frequency Percent
Valid Strongly Disagree
40 1.5
Valid Strongly Disagree
23 .9
Disagree 248 9.3
Disagree 73 2.7
Neutral 387 14.5
Neutral 240 9.0
Agree 1617 60.6
Agree 1505 56.4
Strongly Agree
376 14.1
Strongly Agree
827 31.0
Total 2668 100.0
Total 2668 100.0
Caring about the fauna is important
Eco-friendly means a strong focus on technology
based solutions Frequency Percent
Frequency Percent
Valid Strongly Disagree
24 .9
Valid Strongly Disagree
112 4.2
Disagree 52 1.9
Disagree 514 19.3
Neutral 239 9.0
Neutral 550 20.6
Agree 1467 55.0
Agree 1124 42.1
Strongly Agree
886 33.2
Strongly Agree
368 13.8
Total 2668 100.0
Total 2668 100.0

Erasmus University Rotterdam| Rajiv Hanoeman
47
Eco-friendly means a strong focus on government based solutions
Eco-friendly means a strong focus on social/cultural based solutions
Frequency Percent
Frequency Percent Valid Strongly
Disagree 164 6.1
Valid Strongly Disagree
58 2.2
Disagree 587 22.0
Disagree 283 10.6
Neutral 660 24.7
Neutral 505 18.9
Agree 1011 37.9
Agree 1267 47.5
Strongly Agree
246 9.2
Strongly Agree
555 20.8
Total 2668 100.0
Total 2668 100.0
Business legal requirements
Business production methods
Frequency Percent
Frequency Percent Valid Strongly
Disagree 58 2.2
Valid Strongly Disagree
27 1.0
Disagree 225 8.4
Disagree 88 3.3
Neutral 571 21.4
Neutral 245 9.2
Agree 1438 53.9
Agree 1387 52.0
Strongly Agree
376 14.1
Strongly Agree
921 34.5
Total 2668 100.0
Total 2668 100.0
Consumers are responsible to make a change in purchasing eco-friendly products
Do you consider yourself as a person who is striving to be a more 'eco-friendly' consumer?
Frequency Percent
Frequency Percent Valid Strongly
Disagree 56 2.1
Valid Strongly Disagree
110 4.1
Disagree 253 9.5
Disagree 605 22.7
Neutral 478 17.9
Neutral 837 31.4
Agree 1184 44.4
Agree 915 34.3
Strongly Agree
697 26.1
Strongly Agree
201 7.5
Total 2668 100.0
Total 2668 100.0

Erasmus University Rotterdam| Rajiv Hanoeman
48
Do you feel the need to talk about environmental
issues with your family/friends?
Do you think 'eco-friendly' labels on shopping goods will improve the environment?
Frequency Percent
Frequency Percent Valid Not at all 755 28.3
Valid No 518 19.4
Sometimes 1399 52.4
Do not know
827 31.0
Yes 514 19.3
Yes 1323 49.6
Total 2668 100.0
Total 2668 100.0
Appendix 3: Normal distribution plots & table Normal Probability Plot

Erasmus University Rotterdam| Rajiv Hanoeman
49
Descriptive Statistics
N Mean Skewness Kurtosis
Statistic Statistic Statistic Statistic Consumers recognize the relevance of taking care of ''mother earth''
2668 3,76 -,979 ,971
Caring about the flora (vegetation) is important 2668 4,14 -1,104 2,386
Caring about the fauna is important 2668 4,18 -1,112 2,566
Eco-friendly means a strong focus on technology based solutions
2668 3,42 -,432 -,654
Eco-friendly means a strong focus on government based solutions
2668 3,22 -,299 -,754
Eco-friendly means a strong focus on social/cultural based solutions
2668 3,74 -,715 ,085
Business_legal_requirements 2668 3,69 -,813 ,657
Business_production_methods 2668 4,16 -1,160 2,105
Consumers are responsible to make a change in purchasing eco-friendly products
2668 3,83 -,761 ,112
Do you consider yourself as a person who is striving to be a more 'eco-friendly' consumer?
2668 3,18 -,171 -,653
Do you feel the need to talk about environmental issues with your family/friends?
2668 1,91 ,116 -,867
Younger than 17 2668 ,0097 9,987 97,811
18 - 26 2668 ,5963 -,393 -1,847
27 - 40 2668 ,2046 1,465 ,146
41 - 55 2668 ,1211 2,325 3,406
Older than 55 2668 ,0682 3,427 9,753
Valid N (listwise) 2668
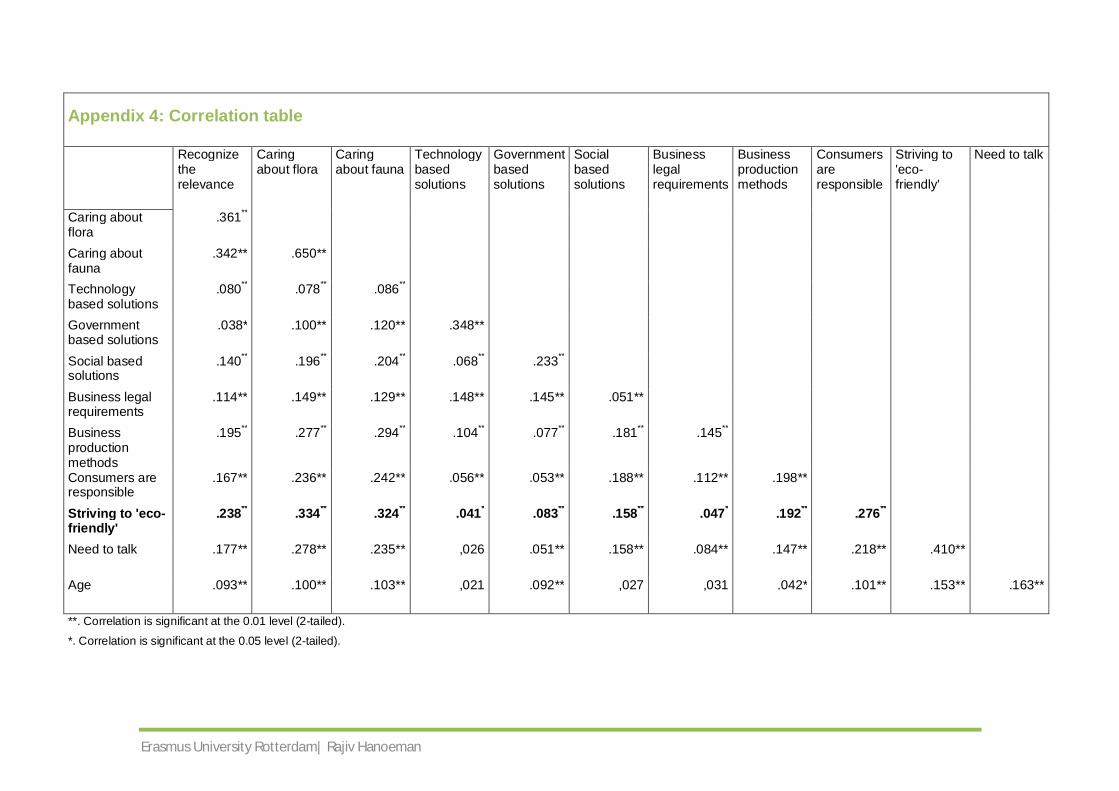
Erasmus University Rotterdam| Rajiv Hanoeman
Appendix 4: Correlation table
Recognize the relevance
Caring about flora
Caring about fauna
Technology based solutions
Government based solutions
Social based solutions
Business legal requirements
Business production methods
Consumers are responsible
Striving to 'eco-friendly'
Need to talk
Caring about flora
.361**
Caring about fauna
.342** .650**
Technology based solutions
.080** .078** .086**
Government based solutions
.038* .100** .120** .348**
Social based solutions
.140** .196** .204** .068** .233**
Business legal requirements
.114** .149** .129** .148** .145** .051**
Business production methods
.195** .277** .294** .104** .077** .181** .145**
Consumers are responsible
.167** .236** .242** .056** .053** .188** .112** .198**
Striving to 'eco-friendly'
.238** .334** .324** .041* .083** .158** .047* .192** .276**
Need to talk .177** .278** .235** ,026 .051** .158** .084** .147** .218** .410**
Age .093** .100** .103** ,021 .092** ,027 ,031 .042* .101** .153** .163**
**. Correlation is significant at the 0.01 level (2-tailed).
*. Correlation is significant at the 0.05 level (2-tailed).

Erasmus University Rotterdam| Rajiv Hanoeman
51
Appendix 5: Regression tables Coefficientsa The insignificant variables are marked
Model
Unstandardized Coefficients
t Sig.
Collinearity Statistics
B Std. Error VIF 1 (Constant) ,076 ,142 ,535 ,592
Consumers recognize the relevance of taking care of ''mother earth''
,089 ,021 4,184 ,000 1,205
Caring about the flora (vegetation) is important ,136 ,030 4,491 ,000 1,884
Caring about the fauna is important ,146 ,030 4,789 ,000 1,844
Eco-friendly means a strong focus on technology based solutions
-,009 ,017 -,537 ,591 1,167
Eco-friendly means a strong focus on government based solutions
,030 ,017 1,743 ,082 1,224
Eco-friendly means a strong focus on social/cultural based solutions
,018 ,018 ,997 ,319 1,149
Business_legal_requirements -,049 ,019 -2,529 ,011 1,072
Business_production_methods ,060 ,022 2,671 ,008 1,166
Consumers are responsible to make a change in purchasing eco-friendly products
,134 ,018 7,502 ,000 1,141
Do you feel the need to talk about environmental issues with your family/friends?
,431 ,026 16,502 ,000 1,154
Younger than 17 ,138 ,171 ,809 ,419 1,019
27 - 40 ,154 ,043 3,583 ,000 1,088
41 - 55 ,203 ,053 3,816 ,000 1,090
Older than 55 ,088 ,068 1,297 ,195 1,060
a. Dependent Variable: Do you consider yourself as a person who is striving to be a more 'eco-friendly' consumer?
Model Summaryb
Model R R
Square Adjusted R Square Std. Error of the Estimate Durbin-Watson 1 .520a ,270 ,266 ,858 1,700
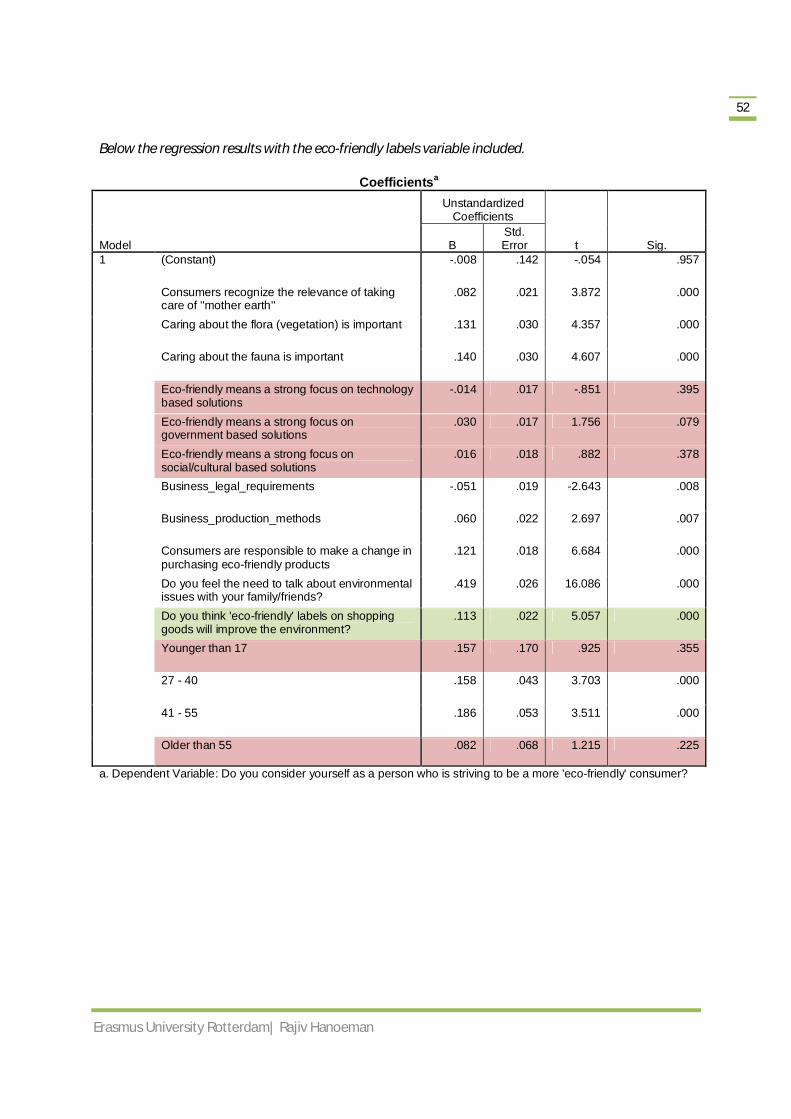
Erasmus University Rotterdam| Rajiv Hanoeman
52
Below the regression results with the eco-friendly labels variable included.
Coefficientsa
Model
Unstandardized Coefficients
t Sig. B Std. Error
1 (Constant) -.008 .142 -.054 .957
Consumers recognize the relevance of taking care of ''mother earth''
.082 .021 3.872 .000
Caring about the flora (vegetation) is important .131 .030 4.357 .000
Caring about the fauna is important .140 .030 4.607 .000
Eco-friendly means a strong focus on technology based solutions
-.014 .017 -.851 .395
Eco-friendly means a strong focus on government based solutions
.030 .017 1.756 .079
Eco-friendly means a strong focus on social/cultural based solutions
.016 .018 .882 .378
Business_legal_requirements -.051 .019 -2.643 .008
Business_production_methods .060 .022 2.697 .007
Consumers are responsible to make a change in purchasing eco-friendly products
.121 .018 6.684 .000
Do you feel the need to talk about environmental issues with your family/friends?
.419 .026 16.086 .000
Do you think 'eco-friendly' labels on shopping goods will improve the environment?
.113 .022 5.057 .000
Younger than 17 .157 .170 .925 .355
27 - 40 .158 .043 3.703 .000
41 - 55 .186 .053 3.511 .000
Older than 55 .082 .068 1.215 .225
a. Dependent Variable: Do you consider yourself as a person who is striving to be a more 'eco-friendly' consumer?