ecological life zones of saint lucia blackwell science, ltd
TRANSCRIPT
© 2001 Blackwell Science Ltd. http://www.blackwell-science.com/geb
549
RESEARCH ARTICLE
Global Ecology & Biogeography
(2001)
10
, 549–566
Blackwell Science, Ltd
Ecological life zones of Saint Lucia
CORNELIUS ISAAC and CHARLES P.-A. BOURQUE
Faculty of Forestry and Environmental
Management, University of New Brunswick, Fredericton, New Brunswick, Canada E3B 6C2
ABSTRACT
Aim
The purpose of this study is to apply geo-graphical information and artificial neural network(ANN) technologies in assessing ecosystem dis-tribution on the island of Saint Lucia, as well asto develop an improved ecological classificationusing Holdridge’s system of natural life zones.
Location
Saint Lucia is a Caribbean island statelocated at 14
°
N and 61
°
W and of a land area of616 km
2
.
Methods
The main inputs for classifying life zoneswere a 25-m
×
25-m digital elevation model ofSaint Lucia (DEM), mean annual temperature andannual total precipitation. The DEM was initiallyobtained by digitizing contour lines on a topo-graphic map. Elevation–temperature regressionsdeveloped for Puerto Rico were used to generatepoint-estimates of mean temperature across theisland of Saint Lucia. A generalized (trained)ANN was employed to create an annual total rain-fall surface for the island. The variables of longi-
tude, latitude and elevation were used to constructthe rainfall model. Comparison of predicted andobserved total precipitation revealed that theANN explained over 95% of variability exhibitedin the observed data, within a standard error ofestimate of 123 mm (~6% of the total precipitation).
Results
Three complete and three transitionallife zones were identified as occurring on SaintLucia. Twelve per cent of the island was classifiedas tropical premontane moist /wet, 20% as tropi-cal premontane wet, 6% as subtropical dry/moist,29% as subtropical moist, 26% as subtropical moist/wet and 7% as subtropical wet.
Conclusion
Quality of life zone delineationdepends on an objective application of universallyaccepted criteria and available terrain analysistechnologies.
Key words
Artificial neural network, biotemper-ature, Caribbean, digital elevation models, Hold-ridge life zones, land use, model comparison,potential evapotranspiration ratio, St Lucia.
INTRODUCTION
Climate is described as the aggregate weatherconditions of a place or region. Given that weatherconditions vary both temporally and spatially, anenormous number of climates can be describedfor the planet. In order to minimize this com-plexity, several attempts have been made to rep-resent climates as broad classes within which aresubclasses for describing regional and local siteconditions.
The Ancient Greeks were perhaps the first toattempt classification of global climate (Lutgens
& Tarbuck, 1995). Since then, numerous climate-classification models have been advanced, simplybecause the use of any system is determined bythe availability of relevant data and purpose ofapplication (Holdridge, 1947; Sawyer & Lindsey,1964; Lutgens & Tarbuck, 1995). Two well-knownsystems relating climate and vegetation are theKoeppen and Holdridge systems (Waide
et al.
, 1998).Use of the Holdridge system for classifying
world life zones is primarily concentrated in thetropics, where it has been proven to be very usefulin ecological and land use programmes (Sawyer &Lindsey, 1964; Ewel & Whitmore, 1973; Scatena &Lugo, 1995; Garcia-Martino
et al.
, 1996). Manycountries in Africa, the Caribbean and Latin
Corresponding author: [email protected]
GEB257.fm Page 549 Friday, September 7, 2001 10:07 AM

550
Cornelius Isaac and Charles P.-A. Bourque
© 2001 Blackwell Science Ltd,
Global Ecology & Biogeography
,
10
, 549–566
America use this system. To these countries, theHoldridge system has become an indispensabletool for comparing climates. The Caribbean islandof Saint Lucia, the subject of this paper, also hadits ecosystems classified by the Holdridge system(OAS, 1986). This was preceded by an earliermodel developed by Beard (1949). However, theevolution of computers, geographic informationsystems (GIS) and artificial neural networks(ANNs) have opened the way for new opportun-ities, perspectives and interpretation of complexenvironmental patterns in assessing landscapes.The purpose of this paper is to apply these newtechnologies in assessing ecosystem distributionon the island of Saint Lucia and to develop animproved ecological classification, using the Hold-ridge system for classifying world life zones asthe main reference.
METHODS
Study site
Saint Lucia is a Caribbean island state, locatedjust south of the Antillean Archipelago. It is situ-ated at 14
°
north latitude and 61
°
west longitude(Fig. 1). The island has a total land area of616 km
2
, with a maximum length and width of 43and 23 km, respectively. The highest elevation onthe island is 950 m above mean sea level (asl).Long-term mean annual rainfall ranges from1152 mm near the coast to more than 3000 mmin the interior, mountainous region of the island.Long-term mean annual temperature is 26
°
C.
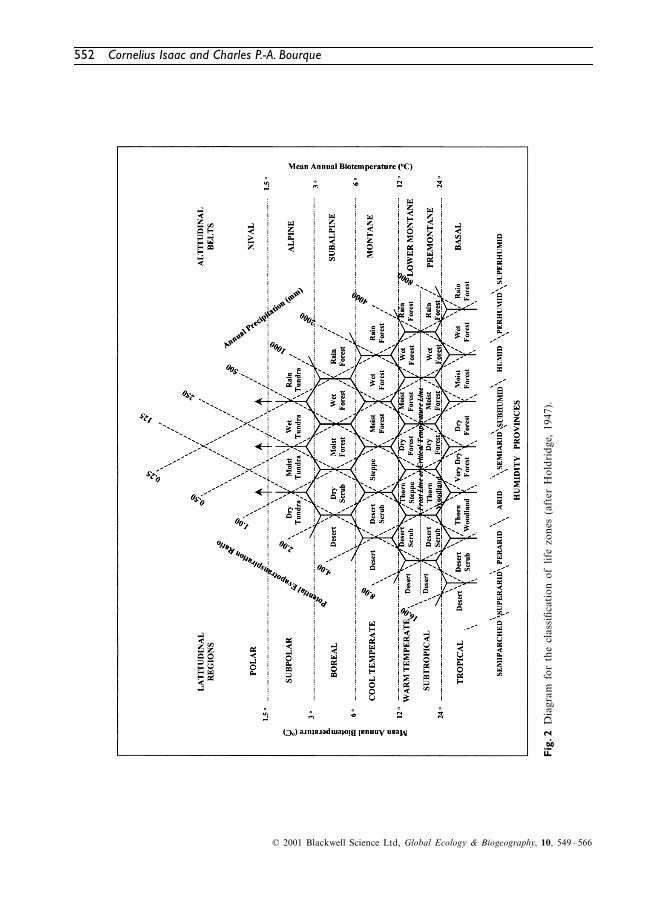
Holdridge system of life zone classification
The Holdridge system (Holdridge, 1947) attemptsto define relatively equal and comparable ecolog-ical units called life zones (LZs). The variables ofbiotemperature, precipitation and potential evapo-transpiration ratio form the axes of a triangularmatrix from which LZs are identified (Fig. 2).Superimposed on the triangular grid are hexa-gonal boundaries that define each LZ. Life zonesare primarily climatic divisions that define condi-tions for ecosystem functioning (Holdridge
et al.
,1971; Lugo
et al.
, 1999). Life zones can be sub-divided into associations which ‘account for thecausal relationships between the vegetation andother local environmental factors’ (Holdridge
et al.
, 1971). Holdridge (1967) defined an associ-ation as ‘a range of environmental conditionswithin a life zone, together with its living organ-isms, within which the total complex of physi-ognomy of plants and activities of the animals areunique’. Thus, associations are secondary levelclassifications of the Holdridge system, which arebased on either local climatic, edaphic, atmo-spheric or hydric conditions (Holdridge
et al.
, 1971).Corners of the hexagonal grid enclosed by theguideline limits of biotemperature, precipitationand humidity contain some characteristics ofadjacent zones and are defined as transitionalLZs (Holdridge
et al.
, 1971). Biotemperature wasdefined as ‘the mean of unit-period temperatureswith the substitution of zero for all unit periodvalues below 0
°
C and above 30
°
C’ (Holdridge
et al.
, 1971). This is based on the assumption thatplants become physiologically inactive beyondthis temperature range.
The potential evapotranspiration ratio axis ofFig. 2 is an expression of relative wetness of anarea. This ratio is derived from the interaction ofbiotemperature and precipitation (Holdridge,1962). Latitudinal regions, indicated on the leftof Fig. 2, make the system capable of worldwideapplication. Each region consists of a basal orsea level region and various altitudinal belts.Altitudinal belts are determined by mean annualbiotemperature. Detailed descriptions of Holdridge’slife zone model are provided in various papers,including Holdridge (1947), Sawyer & Lindsey(1964), Holdridge
et al
. (1971), Sawyer & Lindsay(1971), Ewel & Whitmore (1973) and Lugo
et al
.(1999).
Data preparation
Digital elevation model
The digital elevation model (DEM) for this studywas a precursor to computations for subsequentdata analysis and preparation (Fig. 1). The DEMdata were obtained initially by digitizing contourlines (15 m intervals) from a 1 : 25000 scale topo-graphic map of Saint Lucia (Directorate of Over-seas Surveys, 1981). Digitizing occurred in UniversalTransverse Mercator coordinates, Datum Clarke1880, and a false origin of Zone 20 N. A DEMof 9
×
9-m grid size was developed from thesedata. This was resampled to a 25
×
25-m grid sizeusing an algorithm developed by Yerahmiel & Hall
GEB257.fm Page 550 Friday, September 7, 2001 10:07 AM

Ecological life zones of Saint Lucia
551
© 2001 Blackwell Science Ltd,
Global Ecology & Biogeography
,
10
, 549–566
Fig
. 1R
elat
ive
loca
tion
of
Sain
t L
ucia
and
top
ogra
phy
deri
ved
from
a 2
5 ×
25-m
DE
M.
GEB257.fm Page 551 Friday, September 7, 2001 10:07 AM
552
Cornelius Isaac and Charles P.-A. Bourque
© 2001 Blackwell Science Ltd,
Global Ecology & Biogeography
,
10
, 549–566
Fig
. 2D
iagr
am f
or t
he c
lass
ifica
tion
of
life
zone
s (a
fter
Hol
drid
ge,
1947
).
GEB257.fm Page 552 Friday, September 7, 2001 10:07 AM
Ecological life zones of Saint Lucia
553
© 2001 Blackwell Science Ltd,
Global Ecology & Biogeography
,
10
, 549–566
(1997). This algorithm uses bidirectional third-degree parabolic blending functions to extrapolatesmooth fitting surfaces over cells of the DEM.
Mean annual temperature
The development of a long-term mean annualtemperature surface for Saint Lucia was based, inpart, on work carried out by Meléndez-Colom(2000) at the Luquillo Experimental Forest ofPuerto Rico. This was necessary because of thelimited number of temperature monitoringstations on the island of Saint Lucia. The geo-graphical proximity and similarity in biological,topographic and geological features of the twoislands gives strength to the assumption thattemperature–elevation relationships are generallysimilar. Meléndez-Colom presented three regres-sion equations relating air temperature to elevation.These were obtained from temperature stationswithin combinations of closed and open canopyforest at various elevations, i.e.
26.9 – (0.00618
×
elevation);
r
2
= 0.95 (1a)T (
°
C) = 26.5 – (0.00561
×
elevation);
r
2
= 0.91 (1b)26.4 – (0.00558
×
elevation);
r
2
= 0.94. (1c)
These equations support the observation that themagnitude of temperature differences along anelevational gradient, while dominated by topo-graphy, is also a function of the characteristicsof energy exchange features present on the land(McNaughton & Jarvis, 1983).
To relate Meléndez-Colom’s equations toSaint Lucia, each equation (1a–c) was tested bycomparing their predicted mean annual airtemperature (PT
–
M-C
) with measured long-termmean annual air temperature recorded in SaintLucia (MT
–
slu
). Output from equations 1a, 1b and
1c was the closest to MT–
slu
at Hewanorra, Roseauand Union stations, respectively (Table 1).
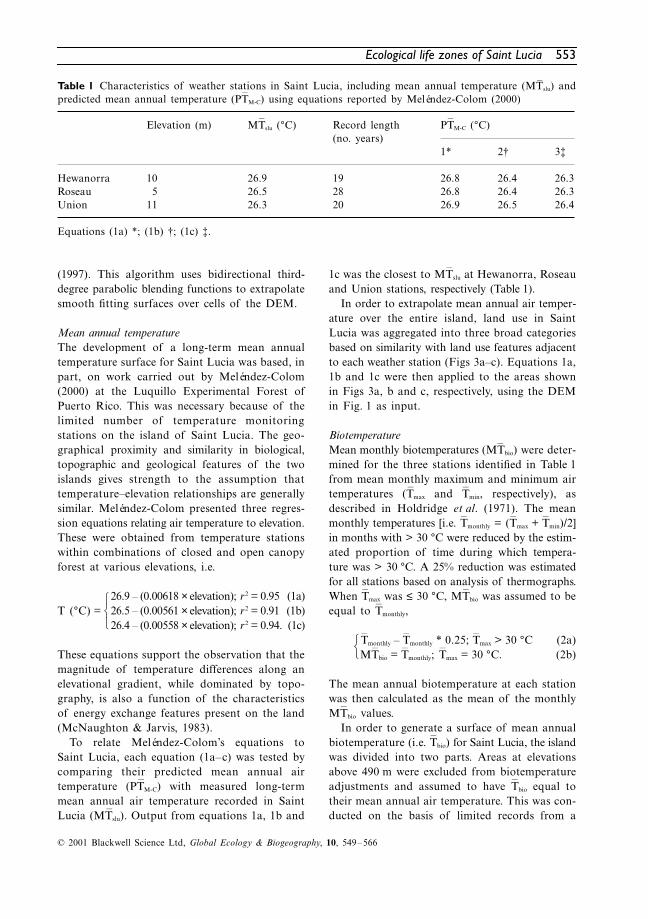
In order to extrapolate mean annual air temper-ature over the entire island, land use in SaintLucia was aggregated into three broad categoriesbased on similarity with land use features adjacentto each weather station (Figs 3a–c). Equations 1a,1b and 1c were then applied to the areas shownin Figs 3a, b and c, respectively, using the DEMin Fig. 1 as input.
Biotemperature
Mean monthly biotemperatures (MT–
bio
) were deter-mined for the three stations identified in Table 1from mean monthly maximum and minimum airtemperatures (T
–
max
and T–
min
, respectively), asdescribed in Holdridge
et al
. (1971). The meanmonthly temperatures [i.e. T
–
monthly
= (T–
max
+ T–
min
)/2]in months with > 30
°
C were reduced by the estim-ated proportion of time during which tempera-ture was > 30
°
C. A 25% reduction was estimatedfor all stations based on analysis of thermographs.When T
–
max
was
≤
30
°
C, MT–
bio
was assumed to beequal to T
–
monthly
,
T–
monthly
– T–
monthly
* 0.25; T–
max
> 30
°
C (2a)MT
–
bio
= T–
monthly
; T–
max
= 30
°
C. (2b)
The mean annual biotemperature at each stationwas then calculated as the mean of the monthlyMT
–
bio
values.In order to generate a surface of mean annual
biotemperature (i.e. T–
bio
) for Saint Lucia, the islandwas divided into two parts. Areas at elevationsabove 490 m were excluded from biotemperatureadjustments and assumed to have T
–
bio
equal totheir mean annual air temperature. This was con-ducted on the basis of limited records from a
Table 1 Characteristics of weather stations in Saint Lucia, including mean annual temperature (MT–
slu) andpredicted mean annual temperature (PT
–M-C) using equations reported by Meléndez-Colom (2000)
Elevation (m) MT–
slu (°C) Record length (no. years)
PT–
M-C (°C)
1* 2† 3‡
Hewanorra 10 26.9 19 26.8 26.4 26.3Roseau 5 26.5 28 26.8 26.4 26.3Union 11 26.3 20 26.9 26.5 26.4
Equations (1a) *; (1b) †; (1c) ‡.
123
!@
GEB257.fm Page 553 Friday, September 7, 2001 10:07 AM
554
Cornelius Isaac and Charles P.-A. Bourque
© 2001 Blackwell Science Ltd,
Global Ecology & Biogeography
,
10
, 549–566
Fig
. 3A
ggre
gati
on o
f la
nd u
se t
ypes
in
Sain
t L
ucia
int
o br
oad
cate
gori
es b
ased
on
land
use
fea
ture
s ad
jace
nt t
o th
e w
eath
er s
tati
ons
of (
a) H
ewan
orra
(b)
Ros
eau
and
(c)
Uni
on.
Ass
ocia
ted
land
use
cat
egor
ies
incl
ude
(a)
gras
slan
ds,
open
woo
dlan
ds a
nd s
crub
for
est
(b)
agri
cult
ural
are
as a
nd (
c) f
ores
t an
dag
ro-f
ores
try
area
s.
GEB257.fm Page 554 Friday, September 7, 2001 10:07 AM
Ecological life zones of Saint Lucia
555
© 2001 Blackwell Science Ltd,
Global Ecology & Biogeography
,
10
, 549–566
temporary interior station (Edmund Forest) whichindicated that, even during the warmest periods(June–November), air temperature seldom risesabove 30
°
C. This station was located at 490 m asl.Areas below 490 m were subjected to a simplelinear model (equation 3) relating mean elevationof the three permanent weather stations and theirT–
bio
(8.7 m, 22.3
°
C) with that of the temporarystation at Edmund forest (490 m, 23.5
°
C);
T–
bio
= 22.3 + (0.002493
×
elevation). (3)
Latitudinal adjustments
To determine the latitudinal regions for SaintLucia, T
–
bio
was increased to sea level values at alapse rate of 6
°
C km
–1
. This rate is commonly usedsince most areas of the world fall within therange of 5.5–6.5
°
C km
–1
(Ewel & Whitmore, 1973;Bourque
et al.
, 2000).
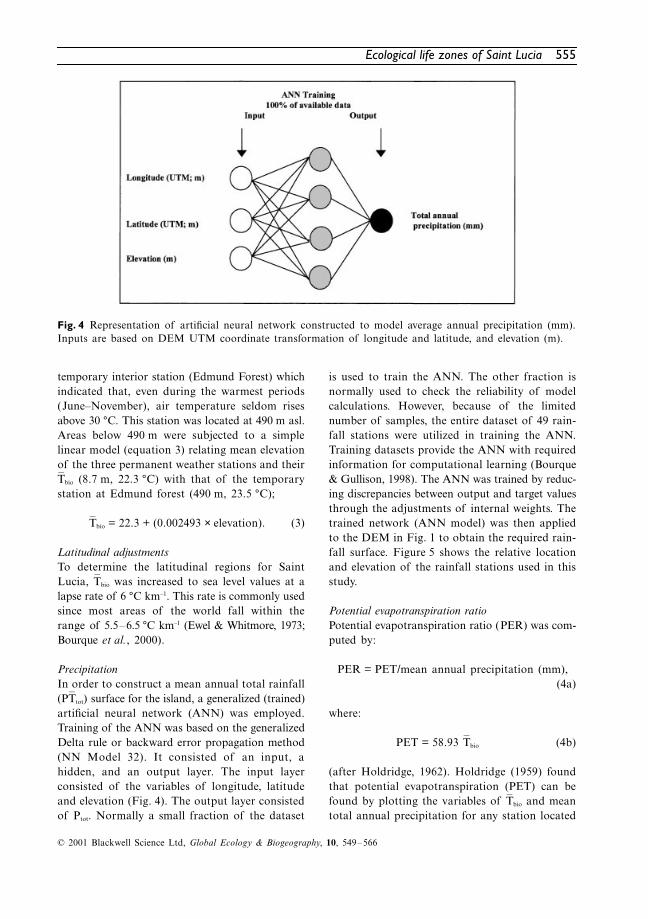
Precipitation
In order to construct a mean annual total rainfall(PT
–
tot
) surface for the island, a generalized (trained)artificial neural network (ANN) was employed.Training of the ANN was based on the generalizedDelta rule or backward error propagation method(NN Model 32). It consisted of an input, ahidden, and an output layer. The input layerconsisted of the variables of longitude, latitudeand elevation (Fig. 4). The output layer consistedof P
tot
. Normally a small fraction of the dataset
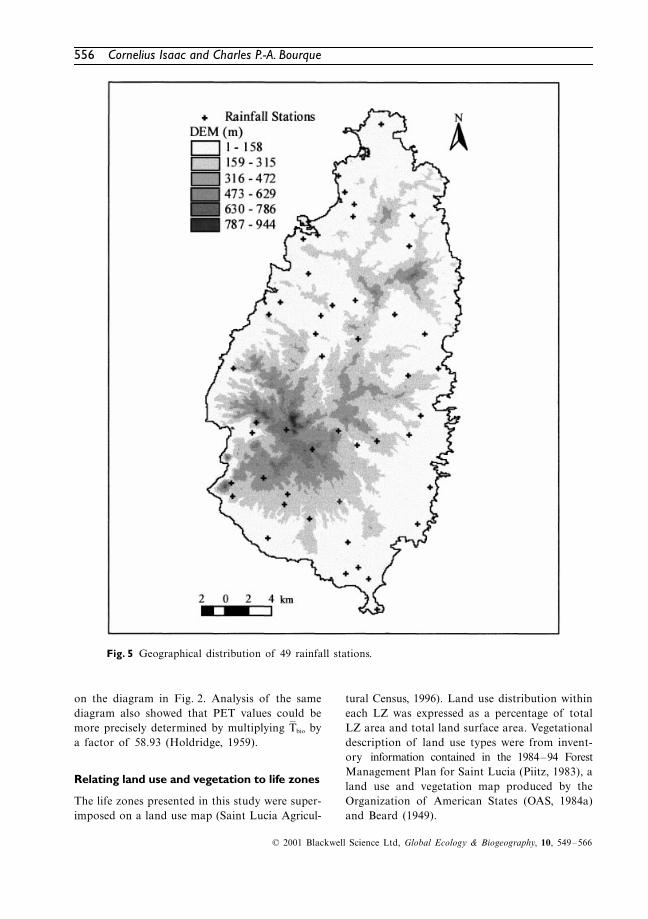
is used to train the ANN. The other fraction isnormally used to check the reliability of modelcalculations. However, because of the limitednumber of samples, the entire dataset of 49 rain-fall stations were utilized in training the ANN.Training datasets provide the ANN with requiredinformation for computational learning (Bourque& Gullison, 1998). The ANN was trained by reduc-ing discrepancies between output and target valuesthrough the adjustments of internal weights. Thetrained network (ANN model) was then appliedto the DEM in Fig. 1 to obtain the required rain-fall surface. Figure 5 shows the relative locationand elevation of the rainfall stations used in thisstudy.
Potential evapotranspiration ratio
Potential evapotranspiration ratio (PER) was com-puted by:
PER = PET/mean annual precipitation (mm), (4a)
where:
PET = 58.93 T–
bio
(4b)
(after Holdridge, 1962). Holdridge (1959) foundthat potential evapotranspiration (PET) can befound by plotting the variables of T
–
bio
and meantotal annual precipitation for any station located
Fig. 4 Representation of artificial neural network constructed to model average annual precipitation (mm).Inputs are based on DEM UTM coordinate transformation of longitude and latitude, and elevation (m).
GEB257.fm Page 555 Friday, September 7, 2001 10:07 AM
556
Cornelius Isaac and Charles P.-A. Bourque
© 2001 Blackwell Science Ltd,
Global Ecology & Biogeography
,
10
, 549–566
on the diagram in Fig. 2. Analysis of the samediagram also showed that PET values could bemore precisely determined by multiplying T
–
bio
bya factor of 58.93 (Holdridge, 1959).
Relating land use and vegetation to life zones
The life zones presented in this study were super-imposed on a land use map (Saint Lucia Agricul-
tural Census, 1996). Land use distribution withineach LZ was expressed as a percentage of totalLZ area and total land surface area. Vegetationaldescription of land use types were from invent-ory information contained in the 1984–94 ForestManagement Plan for Saint Lucia (Piitz, 1983), aland use and vegetation map produced by theOrganization of American States (OAS, 1984a)and Beard (1949).
Fig. 5 Geographical distribution of 49 rainfall stations.
GEB257.fm Page 556 Friday, September 7, 2001 10:07 AM

Ecological life zones of Saint Lucia
557
© 2001 Blackwell Science Ltd, Global Ecology & Biogeography, 10, 549–566
Fig
. 6D
istr
ibut
ion
of (
a) m
ean
annu
al t
empe
ratu
re (
°C),
(b)
mea
n an
nual
bio
tem
pera
ture
(°C
) an
d (c
) la
titu
dina
l re
gion
s.
GEB257.fm Page 557 Friday, September 7, 2001 10:07 AM

558 Cornelius Isaac and Charles P.-A. Bourque
© 2001 Blackwell Science Ltd, Global Ecology & Biogeography, 10, 549–566
RESULTS AND DISCUSSION
Mean annual temperature
The spatial distribution pattern of mean annual tem-perature (°C) is shown in Fig. 6a. Temperatureranged from 21 °C at sites of highest elevation to28 °C along the coast. The method used to com-pute the distribution of mean annual temperatureappears valid considering the fact that it was ableto predict the measured value of 23.5 °C at theEdmund Forest station.
Biotemperature
The mean annual biotemperature (T–
bio) for the islandwas 22.3 °C (Table 2). There was a difference betweenmean annual temperature and T
–bio of 4.3 °C.
Roseau had the highest temperature difference(5.6 °C) and Union had the least (2.9 °C). Spatialdistribution of the mean annual biotemperaturefound in this study is shown in Fig. 6b. All bio-temperatures were within the premontane alti-tudinal belt (i.e. within 18–24 °C).
Latitudinal regions
Increasing biotemperature to a value at sea levelat a rate of 6 °C km–1 resulted in two latitudinalregions (Fig. 6c). The lower elevation sites wereclassified as subtropical (sea level T
–bio < 24 °C) and
the higher elevation as tropical (sea level T–
bio >24 °C). The subtropical region comprised 68% ofland area, while the tropical region comprised 32%.
Precipitation
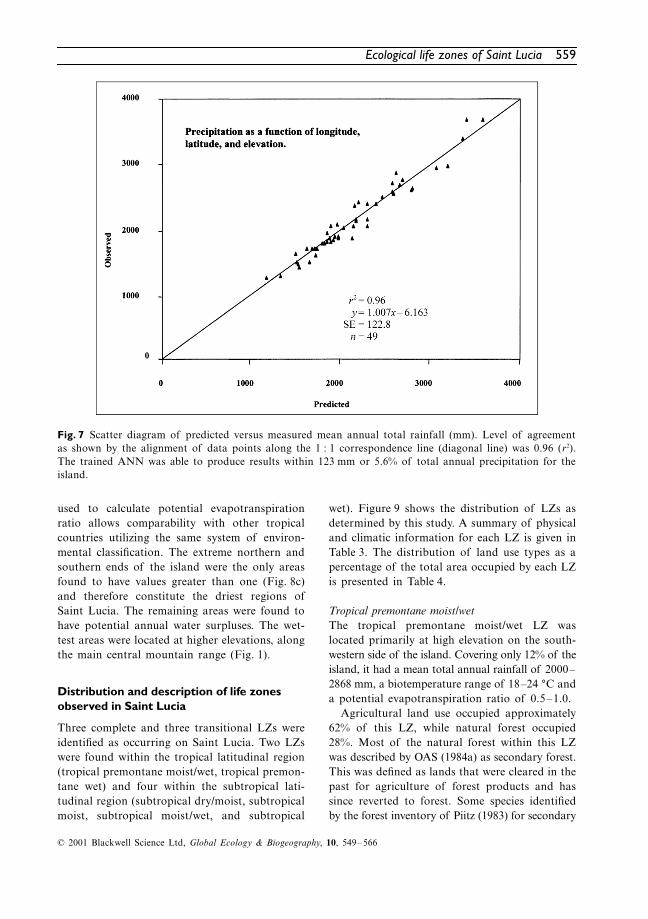
A comparison of ANN-predicted and observedvalues of mean annual total rainfall (Ptot) is pre-
sented in Fig. 7. For perfect agreement, all datapoints should align perfectly along the 1 : 1 cor-respondence line (diagonal line). While the valueof the intercept (–6.1633) fitted to the data wasstatistically different from zero, the slope of theregression line (1.0065) was not different fromunity at the 5% significance level. The resultsshow that, for the most part, the trained ANNwas able to produce results within 123 mm. Thisrepresents 5.6% of Ptot for the island (2172 mm).The ANN was able to explain about 96% of thevariability in the data. Analysis of internal net-work connection weights revealed that elevationcontributed 55% towards the calculation of pre-cipitation, followed by longitude (30%) and lati-tude (15%).
ANN prediction of rainfall correctly repre-sented Ptot of the 49 rainfall stations used fromthe training dataset. Spatial distribution showedorographic effects and that of the north-eastprevailing winds (Fig. 8a). Thus, while rainfallincreases with elevation, there is more rainfall fetch(horizontal distribution) on the leeward side ofthe mountain ranges than on the windward sidefor similar rainfall amounts. The rainfall sur-face was also divided into the two ranges (1000–2000 and 2000–4000) so as to facilitate LZ deter-mination with the Holdridge life zone matrix(Fig. 8b).
Potential evapotranspiration ratio
The potential evapotranspiration ratio providesan indication of the relative wetness of an area.Values greater than one may have significantannual water deficits, while those with values lessthan one generally experience annual water sur-pluses (Ewel & Whitmore, 1973). The method
Table 2 Summary of calculations for mean annual temperature, mean annual biotemperature (T–
bio), and theirdifferences (∆T)
Station Height asl (m)
Mean annual temperature (°C) T–
bio (°C) ∆T (°C) Record length (no. years)
Data resolution
Min Max Mean
Hewanorra 10 22.8 31.7 26.9 22.5 4.4 19 monthRoseau 5 20.7 31.7 26.5 20.9 5.6 28 monthUnion 11 17.0 32.6 26.3 23.4 2.9 20 monthMean 8.7 20.2 32.0 26.5 22.3 4.3Edmund Forest 490 18 27 23.5 23.5 0 1 hour
GEB257.fm Page 558 Friday, September 7, 2001 10:07 AM
Ecological life zones of Saint Lucia 559
© 2001 Blackwell Science Ltd, Global Ecology & Biogeography, 10, 549–566
used to calculate potential evapotranspirationratio allows comparability with other tropicalcountries utilizing the same system of environ-mental classification. The extreme northern andsouthern ends of the island were the only areasfound to have values greater than one (Fig. 8c)and therefore constitute the driest regions ofSaint Lucia. The remaining areas were found tohave potential annual water surpluses. The wet-test areas were located at higher elevations, alongthe main central mountain range (Fig. 1).
Distribution and description of life zones observed in Saint Lucia
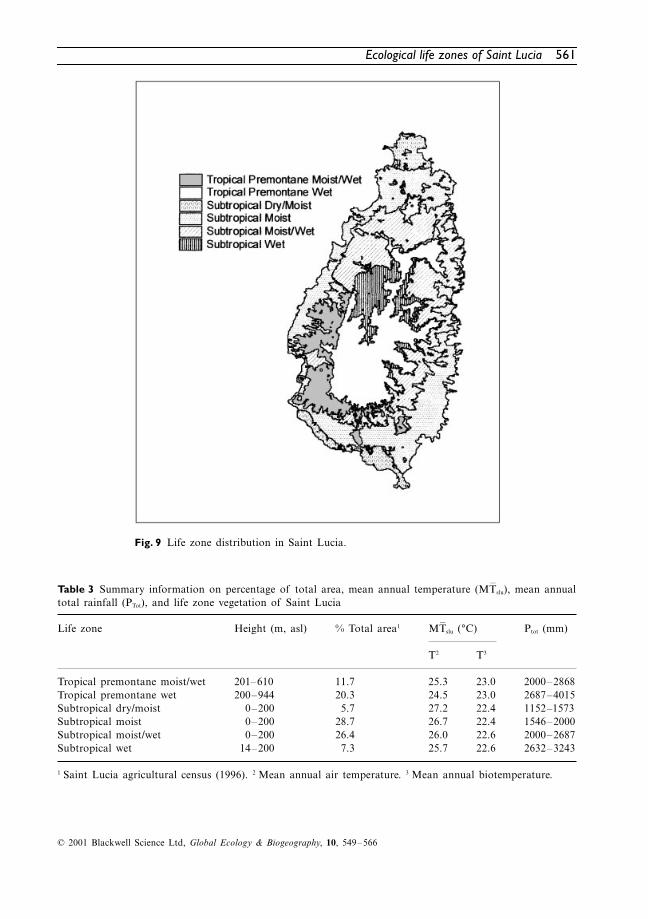
Three complete and three transitional LZs wereidentified as occurring on Saint Lucia. Two LZswere found within the tropical latitudinal region(tropical premontane moist/wet, tropical premon-tane wet) and four within the subtropical lati-tudinal region (subtropical dry/moist, subtropicalmoist, subtropical moist/wet, and subtropical
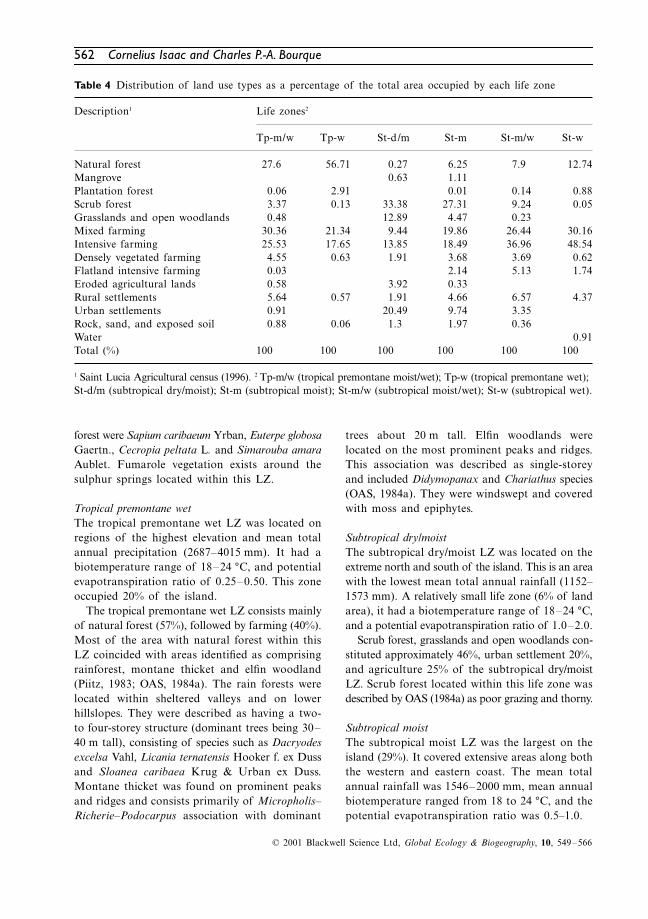
wet). Figure 9 shows the distribution of LZs asdetermined by this study. A summary of physicaland climatic information for each LZ is given inTable 3. The distribution of land use types as apercentage of the total area occupied by each LZis presented in Table 4.
Tropical premontane moist/wetThe tropical premontane moist/wet LZ waslocated primarily at high elevation on the south-western side of the island. Covering only 12% of theisland, it had a mean total annual rainfall of 2000–2868 mm, a biotemperature range of 18–24 °C anda potential evapotranspiration ratio of 0.5–1.0.
Agricultural land use occupied approximately62% of this LZ, while natural forest occupied28%. Most of the natural forest within this LZwas described by OAS (1984a) as secondary forest.This was defined as lands that were cleared in thepast for agriculture of forest products and hassince reverted to forest. Some species identifiedby the forest inventory of Piitz (1983) for secondary
Fig. 7 Scatter diagram of predicted versus measured mean annual total rainfall (mm). Level of agreementas shown by the alignment of data points along the 1 : 1 correspondence line (diagonal line) was 0.96 (r2).The trained ANN was able to produce results within 123 mm or 5.6% of total annual precipitation for theisland.
GEB257.fm Page 559 Friday, September 7, 2001 10:07 AM

560Cornelius Isaac and Charles P.-A. Bourque
© 2001 B
lackwell Science L
td, Global E
cology & B
iogeography, 10, 549–
566
Fig. 8 Distribution (a) mean annual total rainfall (mm), (b) rainfall (mm) grouped for life zone determinations and (c) potential evapotranspiration ratio.
GE
B257.fm
Page 560 F
riday, Septem
ber 7, 2001 10:07 AM
Ecological life zones of Saint Lucia 561
© 2001 Blackwell Science Ltd, Global Ecology & Biogeography, 10, 549–566
Fig. 9 Life zone distribution in Saint Lucia.
Table 3 Summary information on percentage of total area, mean annual temperature (MT–
slu), mean annualtotal rainfall (PTot), and life zone vegetation of Saint Lucia
Life zone Height (m, asl) % Total area1 MT–
slu (°C) Ptot (mm)
T2 T3
Tropical premontane moist/wet 201–610 11.7 25.3 23.0 2000–2868Tropical premontane wet 200–944 20.3 24.5 23.0 2687–4015Subtropical dry/moist 0–200 5.7 27.2 22.4 1152–1573Subtropical moist 0–200 28.7 26.7 22.4 1546–2000Subtropical moist/wet 0–200 26.4 26.0 22.6 2000–2687Subtropical wet 14–200 7.3 25.7 22.6 2632–3243
1 Saint Lucia agricultural census (1996). 2 Mean annual air temperature. 3 Mean annual biotemperature.
GEB257.fm Page 561 Friday, September 7, 2001 10:07 AM
562 Cornelius Isaac and Charles P.-A. Bourque
© 2001 Blackwell Science Ltd, Global Ecology & Biogeography, 10, 549–566
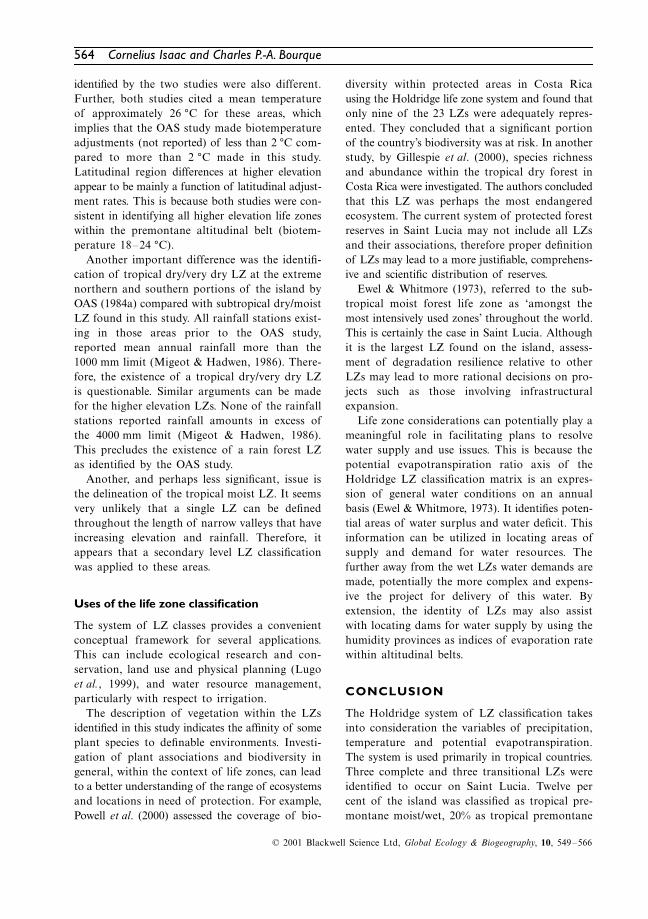
forest were Sapium caribaeum Yrban, Euterpe globosaGaertn., Cecropia peltata L. and Simarouba amaraAublet. Fumarole vegetation exists around thesulphur springs located within this LZ.
Tropical premontane wetThe tropical premontane wet LZ was located onregions of the highest elevation and mean totalannual precipitation (2687–4015 mm). It had abiotemperature range of 18–24 °C, and potentialevapotranspiration ratio of 0.25–0.50. This zoneoccupied 20% of the island.
The tropical premontane wet LZ consists mainlyof natural forest (57%), followed by farming (40%).Most of the area with natural forest within thisLZ coincided with areas identified as comprisingrainforest, montane thicket and elfin woodland(Piitz, 1983; OAS, 1984a). The rain forests werelocated within sheltered valleys and on lowerhillslopes. They were described as having a two-to four-storey structure (dominant trees being 30–40 m tall), consisting of species such as Dacryodesexcelsa Vahl, Licania ternatensis Hooker f. ex Dussand Sloanea caribaea Krug & Urban ex Duss.Montane thicket was found on prominent peaksand ridges and consists primarily of Micropholis–Richerie–Podocarpus association with dominant
trees about 20 m tall. Elfin woodlands werelocated on the most prominent peaks and ridges.This association was described as single-storeyand included Didymopanax and Chariathus species(OAS, 1984a). They were windswept and coveredwith moss and epiphytes.
Subtropical dry/moistThe subtropical dry/moist LZ was located on theextreme north and south of the island. This is an areawith the lowest mean total annual rainfall (1152–1573 mm). A relatively small life zone (6% of landarea), it had a biotemperature range of 18–24 °C,and a potential evapotranspiration ratio of 1.0–2.0.
Scrub forest, grasslands and open woodlands con-stituted approximately 46%, urban settlement 20%,and agriculture 25% of the subtropical dry/moistLZ. Scrub forest located within this life zone wasdescribed by OAS (1984a) as poor grazing and thorny.
Subtropical moistThe subtropical moist LZ was the largest on theisland (29%). It covered extensive areas along boththe western and eastern coast. The mean totalannual rainfall was 1546–2000 mm, mean annualbiotemperature ranged from 18 to 24 °C, and thepotential evapotranspiration ratio was 0.5–1.0.
Table 4 Distribution of land use types as a percentage of the total area occupied by each life zone
Description1 Life zones2
Tp-m/w Tp-w St-d/m St-m St-m/w St-w
Natural forest 27.6 56.71 0.27 6.25 7.9 12.74Mangrove 0.63 1.11Plantation forest 0.06 2.91 0.01 0.14 0.88Scrub forest 3.37 0.13 33.38 27.31 9.24 0.05Grasslands and open woodlands 0.48 12.89 4.47 0.23Mixed farming 30.36 21.34 9.44 19.86 26.44 30.16Intensive farming 25.53 17.65 13.85 18.49 36.96 48.54Densely vegetated farming 4.55 0.63 1.91 3.68 3.69 0.62Flatland intensive farming 0.03 2.14 5.13 1.74Eroded agricultural lands 0.58 3.92 0.33Rural settlements 5.64 0.57 1.91 4.66 6.57 4.37Urban settlements 0.91 20.49 9.74 3.35Rock, sand, and exposed soil 0.88 0.06 1.3 1.97 0.36Water 0.91Total (%) 100 100 100 100 100 100
1 Saint Lucia Agricultural census (1996). 2 Tp-m/w (tropical premontane moist/wet); Tp-w (tropical premontane wet); St-d/m (subtropical dry/moist); St-m (subtropical moist); St-m/w (subtropical moist/wet); St-w (subtropical wet).
GEB257.fm Page 562 Friday, September 7, 2001 10:07 AM

Ecological life zones of Saint Lucia 563
© 2001 Blackwell Science Ltd, Global Ecology & Biogeography, 10, 549–566
Agriculture and urbanization have replaced alarge percentage of the natural vegetation of thisLZ. Together they covered 59% of the total areaof the subtropical moist LZ. Scrub, grasslandsand open woodlands occupied 32% of the area. Thescrub forest was described as xerophytic, scatteredand low growing (Beard, 1949; Piitz, 1983; OAS,1984a). Gonzalez & Zak (1996) argued that sincemost of the natural vegetation of the scrub forestwas harvested before the earliest study (Beard,1949), it is difficult to ascertain whether site con-ditions or disturbance was the main cause for theshort stature of the vegetation. Beard (1949), andalso Gonzalez & Zak (1996), identified Tabebuiapallida (Lindley) Miers and Coccoloba pubescensL. among species found within the scrub forest.
Subtropical moist/wetThe subtropical moist /wet forest was the secondlargest LZ on the island (26%). It encompassedareas with mean total annual rainfall of 2000–2687 mm, mean annual biotemperature of 18–24 °C, and potential evapotranspiration ratio of0.5–1.0. This zone was located between the low-land coastal LZ and the high elevation interior.
Most of the natural vegetation of the sub-tropical moist/wet LZ has been replaced by agri-culture (72%). Scrub forest, grasslands and openwoodlands comprised 9%, natural forest 8% andsettlements 10% of the total area within this LZ.Areas with natural forest were identified by OAS(1984a) as secondary forest with light-demandingspecies such as S. caribaeum, E. globosa, C. peltataand S. amara. Ferns and mosses were also reported.
Subtropical wetThe subtropical wet forest was located mainly tothe north-west, and along the lower eastern fringesof the tropical premontane wet LZ. It covered7% of the land area. This zone received 2632–3243 mm of rainfall annually, had a biotempera-ture range of 18–24 °C, and a potential evapo-transpiration ratio of less than 0.5.
The subtropical wet LZ was dominated byagricultural land uses (81%). Natural forest (13%)was described by OAS (1984a) as mainly second-ary. Settlements occupied approximately 4% ofthis LZ.
Comparison with previous life zone classification
The Organization of American States (OAS),through its regional department, produced a LZmap for Saint Lucia in the early 1980s (OAS,1984b). The map identified seven LZs comparedwith six by this study (Table 5). Apart from differ-ences in LZs, there were also significant area andpositional differences. Most areas at lower eleva-tion were found by the OAS study to be withinthe tropical latitudinal region, with subtropicallatitudinal region occurring at higher elevation. Thepresent study identified subtropical latitudinalregion at lower elevations and tropical latitudinalregion at higher elevations. The different latitud-inal region at lower elevation may be a functionof differences in both biotemperature calcula-tions and latitudinal adjustment rates (sea-levelbiotemperature), given that the altitudinal belts
Table 5 Comparison of life zones identified by OAS (1984a) and this study for the same general location
Life zones % Total area Mean annual temperature (°C)
OAS1 This study OAS1 This study OAS1 This study
Tropical dry/very dry Subtropical dry/moist 2 6 26 27Tropical dry Subtropical moist 32 29 26 27Tropical moist Subtropical moist/wet & wet 13 34 26 26Subtropical moist Subtropical moist/wet 7 26 212 26Subtropical wet Tropical premontane moist /wet 31 12 212 25Subtropical wet/rain Tropical premontane wet 12 20 19 25Subtropical rain Tropical premontane wet 2 20 19 25
1 Organization of American States (1984a). 2 Reported as 18–24 °C.
GEB257.fm Page 563 Friday, September 7, 2001 10:07 AM
564 Cornelius Isaac and Charles P.-A. Bourque
© 2001 Blackwell Science Ltd, Global Ecology & Biogeography, 10, 549–566
identified by the two studies were also different.Further, both studies cited a mean temperatureof approximately 26 °C for these areas, whichimplies that the OAS study made biotemperatureadjustments (not reported) of less than 2 °C com-pared to more than 2 °C made in this study.Latitudinal region differences at higher elevationappear to be mainly a function of latitudinal adjust-ment rates. This is because both studies were con-sistent in identifying all higher elevation life zoneswithin the premontane altitudinal belt (biotem-perature 18–24 °C).
Another important difference was the identifi-cation of tropical dry/very dry LZ at the extremenorthern and southern portions of the island byOAS (1984a) compared with subtropical dry/moistLZ found in this study. All rainfall stations exist-ing in those areas prior to the OAS study,reported mean annual rainfall more than the1000 mm limit (Migeot & Hadwen, 1986). There-fore, the existence of a tropical dry/very dry LZis questionable. Similar arguments can be madefor the higher elevation LZs. None of the rainfallstations reported rainfall amounts in excess ofthe 4000 mm limit (Migeot & Hadwen, 1986).This precludes the existence of a rain forest LZas identified by the OAS study.
Another, and perhaps less significant, issue isthe delineation of the tropical moist LZ. It seemsvery unlikely that a single LZ can be definedthroughout the length of narrow valleys that haveincreasing elevation and rainfall. Therefore, itappears that a secondary level LZ classificationwas applied to these areas.
Uses of the life zone classification
The system of LZ classes provides a convenientconceptual framework for several applications.This can include ecological research and con-servation, land use and physical planning (Lugoet al., 1999), and water resource management,particularly with respect to irrigation.
The description of vegetation within the LZsidentified in this study indicates the affinity of someplant species to definable environments. Investi-gation of plant associations and biodiversity ingeneral, within the context of life zones, can leadto a better understanding of the range of ecosystemsand locations in need of protection. For example,Powell et al. (2000) assessed the coverage of bio-
diversity within protected areas in Costa Ricausing the Holdridge life zone system and found thatonly nine of the 23 LZs were adequately repres-ented. They concluded that a significant portionof the country’s biodiversity was at risk. In anotherstudy, by Gillespie et al. (2000), species richnessand abundance within the tropical dry forest inCosta Rica were investigated. The authors concludedthat this LZ was perhaps the most endangeredecosystem. The current system of protected forestreserves in Saint Lucia may not include all LZsand their associations, therefore proper definitionof LZs may lead to a more justifiable, comprehens-ive and scientific distribution of reserves.
Ewel & Whitmore (1973), referred to the sub-tropical moist forest life zone as ‘amongst themost intensively used zones’ throughout the world.This is certainly the case in Saint Lucia. Althoughit is the largest LZ found on the island, assess-ment of degradation resilience relative to otherLZs may lead to more rational decisions on pro-jects such as those involving infrastructuralexpansion.
Life zone considerations can potentially play ameaningful role in facilitating plans to resolvewater supply and use issues. This is because thepotential evapotranspiration ratio axis of theHoldridge LZ classification matrix is an expres-sion of general water conditions on an annualbasis (Ewel & Whitmore, 1973). It identifies poten-tial areas of water surplus and water deficit. Thisinformation can be utilized in locating areas ofsupply and demand for water resources. Thefurther away from the wet LZs water demands aremade, potentially the more complex and expens-ive the project for delivery of this water. Byextension, the identity of LZs may also assistwith locating dams for water supply by using thehumidity provinces as indices of evaporation ratewithin altitudinal belts.
CONCLUSION
The Holdridge system of LZ classification takesinto consideration the variables of precipitation,temperature and potential evapotranspiration.The system is used primarily in tropical countries.Three complete and three transitional LZs wereidentified to occur on Saint Lucia. Twelve percent of the island was classified as tropical pre-montane moist/wet, 20% as tropical premontane
GEB257.fm Page 564 Friday, September 7, 2001 10:07 AM
Ecological life zones of Saint Lucia 565
© 2001 Blackwell Science Ltd, Global Ecology & Biogeography, 10, 549–566
wet, 6% as subtropical dry/moist, 29% as sub-tropical moist, 26% as subtropical moist/wet, and7% as subtropical wet. Life zone classification forSaint Lucia by a previous study was not consist-ent with available long-term rainfall data, andmay not have adhered strictly to universallyaccepted guidelines in the determination of LZclasses. Application of the system of life zones isrelevant to ecological research and conservation,physical and land use planning and water resourceassessment and development.
ACKNOWLEDGMENTS
Climate data used in this document were pro-vided by the Engineering Division within theMinistry of Agriculture and the MeteorologicalDepartment within the Ministry of Communi-cation of Saint Lucia. We thank E. H. Helmer,A. E. Lugo and F. Scatena of The InternationalInstitute of Tropical Forestry, USDA, ForestService, and J. K. Zimmerman from the Institutefor Tropical Ecosystem Studies at the Universityof Puerto Rico for providing copies of publica-tions critical to this study. We are grateful forfunding provided by the Natural Sciences andEngineering Council of Canada in the form of anoperating grant to CPAB.
REFERENCES
Agricultural Census (1996) Physical planning GISoffice and forestry department GIS office. Govern-ment of Saint Lucia, Saint Lucia, West Indies.
Beard, J. (1949) The natural vegetation of the Wind-ward and Leeward Islands. Oxford Forestry Mem,no. 21. Clarendon Press, Oxford, UK.
Bourque, C.P.-A. & Gullison, J.J. (1998) A techniqueto predict hourly potential solar radiation andtemperature for a mostly unmonitored area in theCape Breton Highlands. Canadian Journal of SoilScience, 78, 409–420.
Bourque, C.P.-A., Meng, F.-R., Gullison, J.J. &Bridgland, J. (2000) Biophysical and potential vegeta-tion growth surfaces for a small watershed innorthern Cape Breton Island, Nova Scotia, Canada.Canadian Journal of Forest Research, 30, 1179–1195.
Directorate of Overseas Surveys (1981) Map of SaintLucia (1: 25,000), Series E803 (DOS 345), 5th edn.Government of the United Kingdom for the Govern-ment of Saint Lucia, Lands and Surveys Department,Saint Lucia.
Ewel, J.J. & Whitmore, J.L. (1973) The EcologicalLife Zones of Puerto Rico and the U.S. Virgin Islands.
Forest Service Research Paper ITF-18. US Deptof Agriculture, Forest Service.
Garcia-Martino, A.R., Warner, G.S., Scatena, F.N.& Civco, D.L. (1996) Rainfall, runoff, and elevationrelationships in the Luquillo Mountains of PuertoRico. Caribbean Journal of Science, 32, 413–424.
Gillespie, T.W., Grijalva, A. & Farris, C.N. (2000) Diver-sity, composition, and structure of tropical dry for-ests in Central America. Plant Ecology, 147, 37–47.
Gonzalez, O.J. & Zak, D.R. (1996) Tropical dry forestsof Saint Lucia, West Indies: vegetation and soilproperties. Biotropica, 28, 618–626.
Holdridge, L.R. (1947) Determination of world plantformations from simple climatic data. Science, 105,367–368.
Holdridge, L.R. (1959) Simple method for determin-ing potential evapotranspiration from temperaturedata. Science, 1130, 572.
Holdridge, L.R. (1962) The determination of atmos-phere water movements. Ecology, 43, 1–9.
Holdridge, L.R. (1967) Life zone ecology. TropicalScience Center, San Jose, Costa Rica.
Holdridge, L.R., Grenke, W.C., Hatheway, W.H.,Liang, T. & Tosi, J.A. Jr (1971) Forest environmentsin tropical life zones: a pilot study. Pergamon Press,Oxford.
Lugo, A.E., Brown, S.L., Dodson, R., Smith, T.S. &Shugart, H.H. (1999) The Holdridge life zones of theconterminous United States in relation to ecosystemmapping. Journal of Biogeography, 26, 1025–1038.
Lutgens, F.K. & Tarbuck, E.J. (1995) The atmosphere.Prentice Hall, Canada, Inc., Toronto.
McNaughton, K.G. & Jarvis, P.G. (1983) Predictingeffects of vegetation changes on transpiration andevaporation. Water deficits and plant growth (ed.by T.T. Kozlowski), pp. 1–47. Academic Press,Inc., New York.
Meléndez-Colom, Eda, C. (2000) Regression relation-ships of air temperature and elevation along an eleva-tion gradient in the Luquillo Experimental Forest(LEF), Puerto Rico. Retrieved on March 13, 2000from the World Wide Web: http://sunceer.upr.clu.edu/DATA/eda/bistempdata/Bis-temp.htm.
Migeot, J. & Hadwen, P. (1986) Saint Lucia waterresources, 2 vols. United Nations Water ResourceExploration Assessment, Department of TechnicalCooperation, Bridgetown, Barbados.
Organization of American States (OAS) (1984a) Mapof Saint Lucia: land use and vegetation, scale1:50,000. OAS, Department of Regional Develop-ment, Washington, DC.
Organization of American States (OAS) (1984b)Map of Saint Lucia: life zones, scale 1:50,000. OAS,Department of Regional Development, Washington,DC.
Organization of American States (OAS) (1986) SaintLucia natural resources and agricultural developmentproject. OAS, Department of Regional Develop-ment, Washington, DC.
GEB257.fm Page 565 Friday, September 7, 2001 10:07 AM
566 Cornelius Isaac and Charles P.-A. Bourque
© 2001 Blackwell Science Ltd, Global Ecology & Biogeography, 10, 549–566
Piitz, P. (1983) Forest inventory report. Prepared forCIDA for the Saint Lucia-CIDA Forest Manage-ment Assistance Project. Ottawa, Canada.
Powell, G.V.N., Barborak, J. & Rodriguez, S.M. (2000)Assessing representativeness of protected naturalareas in Costa Rica for conserving biodiversity: apreliminary gap analysis. Conservation Biology, 93,35–41.
Sawyer, J.O. Jr & Lindsey, A.A. (1964) The Holdridgebioclimatic formations of the eastern and centralUnited States. Proceedings of the Indiana Academyof Science, 73, 105–112.
Sawyer, J.O. & Lindsey, A.A. (1971) Vegetation ofthe life zones in Costa Rica. The Indiana Academyof Science, Indianapolis, Indiana.
Scatena, F.N. & Lugo, A.E. (1995) Geomorphology,disturbance, and the vegetation and soils of twosubtropical wet steepland watersheds in PuertoRico. Geomorphology, 13, 199–213.
Waide, R.B., Zimmerman, J.K. & Scatena, F.N. (1998)Controls of primary productivity: lessons fromthe Luquillo Mountains in Puerto Rico. Ecology,79, 31–37.
Yerahmiel, D. & Hall, K.H. (1997) Interpolation ofDTM using bi-directional third-degree parabolicequations, with Fortran subroutines. Computersand Geoscience, 23, 1013–1020.
BIOSKETCHES
Cornelius Isaac has worked in the field of forestry in Saint Lucia, West Indies in various capacities since 1982. He is currently enrolled in the MScF program in the Faculty of Forestry and Environmental Management at the University of New Brunswick, Fredericton. Mr Isaac has been most interested in understanding and investigating the relationships of climate and climate change with the spatial distribution of natural vegetation and water resources on the island.
Dr Charles Bourque is an associate professor of forest meteorology in the Faculty of Forestry and Environmental Management, UNB. His research interests lie in the areas of land-use impacts on water availability and quality, atmosphere–forest interactions, energy and mass exchange within the atmosphere, and forest landscape/watershed processes.
GEB257.fm Page 566 Friday, September 7, 2001 10:07 AM