ecological, historical and evolutionary determinants of modularity in weighted seed-dispersal...
TRANSCRIPT
LETTER Ecological, historical and evolutionary determinants of
modularity in weighted seed-dispersal networks
Matthias Schleuning,1* Lili
Ingmann,1 Rouven Strauß,2
Susanne A. Fritz,1 Bo Dalsgaard,3
D. Matthias Dehling,1 Michaela
Plein,1,4 Francisco Saavedra,1,5
Brody Sandel,6 Jens-Christian
Svenning,6 Katrin B€ohning-
Gaese1,7 and Carsten F. Dormann8
Abstract
Modularity is a recurrent and important property of bipartite ecological networks. Although well-resolved ecological networks describe interaction frequencies between species pairs, modularity ofbipartite networks has been analysed only on the basis of binary presence–absence data. Weemploy a new algorithm to detect modularity in weighted bipartite networks in a global analysisof avian seed-dispersal networks. We define roles of species, such as connector values, forweighted and binary networks and associate them with avian species traits and phylogeny. Theweighted, but not binary, analysis identified a positive relationship between climatic seasonalityand modularity, whereas past climate stability and phylogenetic signal were only weakly related tomodularity. Connector values were associated with foraging behaviour and were phylogeneticallyconserved. The weighted modularity analysis demonstrates the dominating impact of ecologicalfactors on the structure of seed-dispersal networks, but also underscores the relevance of evolu-tionary history in shaping species roles in ecological communities.
Keywords
Avian seed dispersal, current and past climate, ecological networks, evolutionary history, macro-ecology, modularity, phylogeny, seasonality, traits, weighted bipartite networks.
Ecology Letters (2014) 17: 454–463
INTRODUCTION
Species evolve and coexist entangled in networks of interact-ing species (Bascompte & Jordano 2007). A recurrent struc-ture of many types of ecological networks is modularity,which describes the existence of sub-communities within net-works (Newman & Girvan 2004; Th�ebault 2013). The modu-lar structure of ecological networks is a consequence of bothecological and evolutionary processes and has been suggestedto be important for species coexistence and community stabil-ity (Olesen et al. 2007; Th�ebault & Fontaine 2010).Interaction frequencies between species pairs are closely
associated with the functional interdependence between spe-cies (V�azquez et al. 2005) and define the structure of ecologi-cal networks (Ings et al. 2009). Neglecting the quantitativenature of species interactions can lead to an incomplete under-standing of the processes shaping ecological networks (Scottiet al. 2007; Ings et al. 2009; Staniczenko et al. 2013). In con-trast to weighted analysis of other network properties, such asnestedness (Bascompte & Jordano 2007; Staniczenko et al.2013), algorithms for detecting modularity in weighted bipar-tite networks have not yet been explored in ecology (Th�ebault2013). In consequence, we have an incomplete knowledge of
modularity patterns in bipartite networks, such as thosedescribing reciprocal mutualisms between plants and animals(Bascompte & Jordano 2007).Macroecological analyses of ecological networks have begun
to examine the impacts of current ecological and past climaticfactors on network structure (Dalsgaard et al. 2011, 2013;Schleuning et al. 2012). First, ecological factors that mayinfluence modularity include gradients in productivity andresource diversity (Trøjelsgaard & Olesen 2013), including sea-sonal resource fluctuations (Bosch et al. 2009). Ecologicalresponses of species to spatiotemporal resource variability aredriven by the ability of consumer species to adapt their forag-ing behaviour to current ecological conditions (Carnicer et al.2009; Mulwa et al. 2013). Such processes may lead to general-ised interactions at high productivity and resource diversity(Schleuning et al. 2012) and may favour the formation ofmodules comprising species with overlapping phenologicalschedules in seasonal climates (Bosch et al. 2009; Mart�ınGonz�alez et al. 2012). Second, past climate change may beassociated with the disruption of co-adapted species pairs,especially in periods of high past climatic instability. Hence, adecrease in modularity with increasing past climatic instabilitycan be expected, as found in pollination networks (Dalsgaard
1Biodiversity and Climate Research Centre (BiK-F) and Senckenberg
Gesellschaft f€ur Naturforschung, Senckenberganlage 25, 60325, Frankfurt am
Main, Germany2Department of Computer Science, Technion – Israel Institute of Technology,
Haifa, 32000, Israel3Center for Macroecology, Evolution and Climate, Natural History Museum of
Denmark, University of Copenhagen, 2100, Copenhagen Ø, Denmark4School of Botany, The University of Melbourne, Parkville, VIC, 3010,
Australia
5Institute for Biology/Geobotany and Botanical Garden, Martin-Luther-
University, Halle-Wittenberg, Am Kirchtor 1, 06108, Halle (Saale), Germany6Ecoinformatics and Biodiversity, Department of Bioscience, Aarhus
University, 8000, Aarhus C, Denmark7Department of Biological Sciences, Johann Wolfgang Goethe-Universit€at
Frankfurt, Max–von-Laue-Straße 9, 60438, Frankfurt (Main), Germany8Biometry and Environmental System Analysis, University of Freiburg, 79106,
Freiburg, Germany
*Correspondence: E-mail: [email protected]
© 2014 John Wiley & Sons Ltd/CNRS
Ecology Letters, (2014) 17: 454–463 doi: 10.1111/ele.12245
et al. 2013). Third, interactions in ecological networks may bephylogenetically conserved (Rezende et al. 2007; Gomez et al.2010), so related species may form modules that interact withsimilar sets of species (Krasnov et al. 2012), potentially lead-ing to a positive relationship between modularity and phylo-genetic signal in a network. However, there are no integrativestudies testing whether current ecological factors, past climaticstability or evolutionary processes are the main determinantsof bipartite network structure.In addition to comparisons of modularity among networks,
the variability in species roles within networks is ecologicallyrelevant because ecological networks are composed ofindividual species that vary in their functional importance(Stouffer et al. 2012). Olesen et al. (2007) adopted a classifica-tion system that assigns species roles based on positions of spe-cies in modular networks, distinguishing between speciesdefining the modules and species linking different modules(Guimer�a & Amaral 2005). Subsequent studies of binary net-works have referred to this classification (e.g. Donatti et al.2011; Mello et al. 2011), but have rarely tested explicitlywhether species roles were randomly distributed among speciesor were associated with species traits or phylogeny (but see Do-natti et al. 2011 for a single binary network).We employ a new method to detect modularity and to
describe species roles in bipartite weighted networks, and applythis method to a global data set of 18 seed-dispersal networksdescribing interactions between about 500 fleshy-fruited plantand about 400 frugivorous bird species. To test the effects ofcurrent ecological and past climatic factors on modularity, weobtained information about mean and variance of current cli-matic conditions and quantified past (late Quaternary) climaticfluctuations at all study locations. To estimate the phylogeneticsignal in the interaction networks, we obtained a phylogeny ofavian frugivores and computed the co-variation betweenshared phylogenetic history and interaction similarity acrossall avian species pairs (Rezende et al. 2007). In addition, wecollected information on five important traits of avian frugi-vores (Schleuning et al. 2011; Menke et al. 2012), related totheir morphology (body mass), foraging behaviour (degree offrugivory, social foraging behaviour) and spatiotemporaloccurrence (forest dependence, migratory behaviour). We usethis unique set of weighted interaction networks and climatic,phylogenetic and trait data to test (1) whether macroecologicalpatterns in modularity are primarily influenced by current eco-logical factors, past climatic stability or evolutionary history;and (2) whether species traits and phylogeny influence speciesroles in ecological networks. The weighted modularity analysisfinds that (1) the degree of modularity in seed-dispersal net-works is most closely related to current ecological factors, andthat (2) foraging behaviour and evolutionary history contrib-ute to the variability in avian species roles.
MATERIAL AND METHODS
Data set
We compiled a data set of 18 weighted interaction networksbetween plants with fleshy fruits and their avian seed dispers-ers (see Table S1). Other animal seed dispersers (e.g. monkeys,
bats) were not included because a comparative analysis ofphylogenetic and trait effects is not meaningful for distantlyrelated groups. Ecologically, the focus on avian seed dispers-ers is reasonable because birds are the most species-rich groupof frugivorous animals (Kissling et al. 2009).All networks in the data set describe interactions between
fleshy-fruited plants and avian frugivores at the communitylevel, although the extent of sampling varied among studies(Table S1). Networks were recorded by observing frugivorevisits to plant individuals, except in two studies that werebased on faecal samples from birds (Table S1). All studiesprovided estimates of interaction frequencies, i.e. the numberof bird individuals feeding on the fruits or the number of birdindividuals carrying seeds of a particular plant species. Esti-mates of interaction efficiencies, such as differences in seedhandling, were not available. Interaction frequency is a goodproxy for interaction strength, being usually more importantthan interaction efficiency (V�azquez et al. 2005), and we there-fore do not differentiate between seed-dispersal and plant–fru-givore networks in this study.All studies covered at least the main fruiting period in the
study area, and species richness per network ranged from 24to 121 plant and bird species (Table S1). Overall, networkscomprised almost 85 000 interaction events. We defined sam-pling intensity for each network as the ratio between the num-ber of observed interaction events (square root transformed)and the geometric mean of the number of plant and animalspecies (Schleuning et al. 2012). This measure of samplingeffort reflects the number of interaction events observed perspecies and accounts for higher observation requirements inspecies-rich than species-poor networks. This matters in mac-roecological analyses because species richness decreases withabsolute latitude (n = 18 networks; Pearson correlation,r = �0.57, P = 0.01).
Modularity algorithm
We employed a new algorithm (QuanBiMo) to calculate theweighted modularity of bipartite interaction networks, which isdescribed in detail in Dormann & Strauß (2014). In principle,this algorithm follows the approach of Clauset et al. (2008). Itbuilds a random binary tree whose leaves represent the interact-ing species and associates a structure with each tree defining thesubdivision of species into modules. To define a new subdivi-sion, random swaps of branches at any level are performed, fol-lowed by an evaluation of whether the new subdivision has ahigher modularity value than the previous one. The algorithmemploys a stochastic hill-climbing approach, i.e. an increase inmodularity is always accepted, and a tree with lower modularityis accepted with a probability inversely proportional to the lossin modularity. The objective function is the bipartite version ofNewman’s quantity of modularity Q (Barber 2007):
Q ¼ 1
2N
Xij
Aij � Kij
� �d ðmi;mjÞ ;
where N is the total number of observed interactions in thenetwork and Aij is the normalised number of interactions
© 2014 John Wiley & Sons Ltd/CNRS
Letter Modularity of weighted ecological networks 455
between bird species i and plant species j. The term Kij repre-sents the expected probability of interactions within a moduleassuming no preferences in the participating species, which isa suitable null model (Barber 2007). When applying the algo-rithm to binary data, the null model does not constrain thetotal number of interactions, but the number of links per spe-cies. The module to which a species i or j is assigned is mi andmj respectively. The indicator function d (mi, mj) is 1 ifmi = mj (i.e. when species i and j are in the same module) and0 if mi 6¼ mj. The modularity Q ranges from 0, which meansthat the community has no more links between species withina module than expected by chance, to 1, which equals themaximum degree of modularity.We searched for the best division of a network into modules
in five independent runs of the algorithm. If no further improve-ment was recorded after 107 swaps, the run was terminated andthe result interpreted as the optimum. We recorded the degreeof modularity Q, the number of detected modules and the affili-ation of each species to a module for the run with the highestmodularity (see Table S1 for the low variability in Q amongruns). To compare the performance of the algorithm in detect-ing modules in weighted and binary networks, we calculated Qfor each network from the weighted matrices and from binary-transformed matrices (n = 18; weighted vs. binary Q, r = 0.49,P = 0.04). To test whether the classification of plant and birdspecies into modules was associated with their overlap in inter-action partners, we employed a multivariate analysis of vari-ance based on Horn–Morisita interaction distances amongplant and bird species respectively (Gomez et al. 2010).As modularity tends to be higher in poorly sampled net-
works (Dormann & Strauß 2014) and as sampling intensityvaried among studies (Table S1), we corrected estimates ofmodularity Q with two alternative null models. First, werandomised interactions with the Patefield algorithm (nullmodel PA, see Bl€uthgen et al. 2008), which randomly redistrib-utes interaction events among all cells of the network whileconstraining the total number of interactions per species. Itassumes that species interact randomly, without constrainingthe degree of specialisation in a network. Second, we rando-mised interactions with an alternative null model (null modelVA), proposed by V�azquez et al. (2007), constraining the totalnumber of interactions per species and the network connec-tance (i.e. the proportion of realised links). This null modelassumes that network connectance is an inherent networkproperty (e.g. defined by the number of forbidden links). Itredistributes interaction events randomly among species untilthe number of filled cells in the matrix equals that in the origi-nal matrix; remaining interactions are then distributed amongfilled cells (V�azquez et al. 2007). To obtain estimates of Q forboth null models, we used the same settings for the modularityalgorithm as for the real networks (107 swaps, 5 independentruns). For each null model, we obtained 100 randomisations.Null-model estimates of Q were associated with samplingintensity and were not confounded with latitude (Fig. S1a–d).For each network, we calculated two null-model corrected ver-sions of weighted and binary modularity, DQPA and DQVA, asthe difference between observed modularity Q and meanQNULL.PA and QNULL.VA respectively (n = 18; weighted DQ:r = 0.98, P < 0.01; binary DQ: r = 0.35, P = 0.16).
To identify species roles in modular networks, we followedGuimer�a & Amaral (2005) and Olesen et al. (2007) and foreach species defined its standardised within-module degree zand its participation coefficient c (i.e. the evenness of the linkdistribution across modules) from both weighted and binarymatrices. Within-module degree z and participation coefficientc were characterised for a network with M modules as:
z ¼ kis � ksSDks
� �; c ¼ 1�
XMt¼1
kitki
� �2
where kis is the number of links of species i to other species inits own module s, ks is the average kis of all species in modules, SDks is the standard deviation of kis of all species in modules, kit is the number of links of species i to module t and ki isthe total number of links of species i. Weighted versions of zand c were computed by using species strength instead of spe-cies degree (sensu Bascompte & Jordano 2007).
Macroecological patterns
We recorded absolute latitude for each study location (range:0°–52°) and obtained climate estimates at a resolution of2.5 arc-minutes for mean annual temperature (MAT), temper-ature seasonality measured as the coefficient of variation inmonthly mean temperatures on the Kelvin scale (CVMAT),mean annual precipitation (MAP) and precipitation seasonali-ty (CVMAP), i.e. the coefficient of variation in monthly precip-itation (Hijmans et al. 2005). MAT and MAP as well asCVMAT and CVMAP were correlated (n = 18; MAT vs. MAP:r = 0.71, P < 0.01; CVMAT vs. CVMAP: r = –0.59, P = 0.01).Past climate stability was estimated as climate-change velocitysince the Last Glacial Maximum (LGM, 21 000 years ago),which describes the rate at which climatic conditions havemoved over the Earth’s surface (Sandel et al. 2011). Climatechange since LGM captures one of the strongest climaticshifts of the Quaternary, and the spatial pattern of this changeis representative for the last several hundred thousand years(Sandel et al. 2011). We derived climate-change velocities forboth changes in temperature (VELMAT) and precipitation(VELMAP), which were based on 2.5 arc-minute resolutionmaps of contemporary climate (Hijmans et al. 2005) andpaleo-climate projections (CCSM3 model; Braconnot et al.2007). VELMAT and VELMAP were not significantly correlated(n = 18, r = 0.20, P = 0.44).To assess the degree of shared evolutionary history among
birds, we obtained a phylogeny of avian frugivores from arecently published super-tree (Jetz et al. 2012). We obtained asample of 1000 dated pseudo-posterior trees for the 390 birdspecies in our networks. As these trees did not vary substan-tially in topology and branch lengths, we obtained a maxi-mum clade credibility tree across our 1000 samples. Toquantify the phylogenetic signal in interaction patterns foreach network, we calculated phylogenetic pair-wise distancesacross all species in the phylogenetic tree (standardised torange between 0 and 1). These were related to an inverse mea-sure of interaction similarity among avian frugivores, i.e. thedistances in interaction patterns between all avian speciespairs within a network, employing the Horn–Morisita metric
© 2014 John Wiley & Sons Ltd/CNRS
456 M. Schleuning et al. Letter
(ranging between 0 and 1). The avian phylogenetic signal ininteraction patterns (PHYLO) was then calculated as the cor-relation coefficient between phylogenetic and interaction dis-tances (separately for weighted and binary matrices), asobtained from parametric Mantel tests (Rezende et al. 2007),i.e. high correlations indicate similar interaction patterns inphylogenetically related species. We also ran partial Manteltests accounting for differences in degree among species whichresulted in qualitatively identical results (Table S1).First, we tested whether modularity Q and DQ of weighted
and binary interaction matrices were associated with absolutelatitude and whether sampling effort and species richness influ-enced modularity and its relationship with latitude. Second, wefit univariate relationships of MAT, MAP, CVMAT (log),CVMAP (log), VELMAT (log), VELMAP (log) and PHYLO withweighted and binary modularity DQ with simple linear modelsand spatial simultaneous autoregressive error (SAR) models.For spatial analyses, we defined the neighbourhood of eachstudy location by the four nearest locations. To test modelrobustness and the influence of single, potentially inadequatelysampled networks, we sub-sampled studies with a jackknifeprocedure and computed standard deviations of r2 across theresulting linear models (n = 18). Third, we fit multi-predictormodels for both weighted and binary modularity DQ. We com-pared model fit according to the small-sample corrected Akaikeinformation criterion (AICc) among linear models including allcombinations of predictor variables and a null model onlyincluding the intercept. We did not include interaction termsbetween predictor variables because of the limited sample size.We calculated the relative importance of each predictor vari-able by summing Akaike weights across all models includingthe respective variable (Burnham & Anderson 2002, p. 168).
Species roles
We selected avian species traits that were related to bird mor-phology (body mass), foraging behaviour (degree of frugivory,social foraging) or to spatial and temporal patterns in speciesoccurrence (forest dependence, migratory behaviour). Weexpected that species roles in networks could be simulta-neously influenced by each of the five traits. Bird taxonomyfollowed Clements et al. (2012), except for Chlorophoniacyanea (Thraupidae, not Fringillidae) and Spindalis portoricen-sis (bird family undefined). We were able to compile completetrait information for 345 of the 390 bird species (see AppendixS1 for reference details): (1) Body mass was recorded as meanbody mass for male and female individuals; (2) obligate andpartial frugivores feeding on fruit as a major food source andopportunistic frugivores that use fruit as a minor complemen-tary food source (according to Kissling et al. 2009); (3) socialforagers that frequently forage in conspecific and mixed-spe-cies flocks, and non-social foragers; (4) forest specialists andspecies that also inhabit non-forest habitats and (5) short- orlong-distance migratory species and residents.We calculated weighted and binary z values (within-module
degree) and c values (participation coefficient), as well as speciesstrength and degree (sensu Bascompte & Jordano 2007), andexcluded all species with a single observation from these calcu-lations. To ensure comparability among networks, we standar-
dised z and c values as well as species strength and degree tozero mean and unit variance for each network. For each birdspecies that occurred in more than one network (n = 81 spe-cies), we calculated an average of standardised z and c valuesand species strength and degree across all networks (Krasnovet al. 2012). We tested phylogenetic signals in z and c valuesand in species strength and degree, by computing the k statistic(Pagel 1999), testing it against a random shuffle of values acrossthe tips of the phylogeny. An analysis of phylogenetic signalbased on Blomberg’s K and the same null model yielded quali-tatively identical results (Blomberg et al. 2003). We also testedphylogenetic signals in species traits, employing the k statisticfor continuous and the d statistic for binary traits (Fritz & Pur-vis 2010). We found strong phylogenetic conservatism in alltraits (body mass k = 1; all binary traits, 0.16 < d < 0.44;P < 0.01 in all cases). Therefore, we tested the influence of spe-cies traits on z and c values with phylogenetic generalised linearmodels (PGLMs), accounting for phylogenetic co-variationamong species. This method optimises the degree of phyloge-netic co-variation (k) with a maximum likelihood approach(Freckleton et al. 2002). We fit PGLMs of weighted and binaryz and c values and of species strength and degree with all combi-nations of trait variables (but not their interaction terms), and anull model only including the intercept, and identified the mini-mal adequate model based on the lowest AICc. We additionallycalculated the relative importance of each trait across all modelcombinations according to their summed Akaike weights(Burnham & Anderson 2002, p. 168).
RESULTS
Different measures of modularity
In almost all seed-dispersal networks, interaction distancesamong both bird and plant species were significantly associ-ated with their classification into modules, especially inweighted analyses (Table S2). Weighted networks were signifi-cantly more modular than expected from null models (except asingle network, P < 0.01 for both null models; Table S1). Bycontrast, only 6 of 18 binary networks were significantly mod-ular according to both null models (Table S1). Weighted andbinary Q were positively related to the number of modulesdetected in a network, although this relationship was signifi-cant only for binary networks (n = 18; weighted Q, r = 0.39,P = 0.11; binary Q, r = 0.67, P < 0.01). The number of mod-ules in a network was closely related to sampling intensity(n = 18; weighted analysis, r = �0.79, P < 0.01; binary analy-sis r = �0.76, P < 0.01), as was the case for uncorrectedweighted and binary Q (Table S3, Fig. S1e and f). Both null-model corrected modularities (DQPA, DQVA) were not influ-enced by effects related to sampling effort and species richness(Table S3, Fig. S1e and f) and were therefore used in furtheranalyses.
Macroecological patterns
Weighted network modularity DQPA increased with latitude(Table 1), whereas binary DQPA was also positively, but lessstrongly related to latitude (Table 1). In univariate linear and
© 2014 John Wiley & Sons Ltd/CNRS
Letter Modularity of weighted ecological networks 457
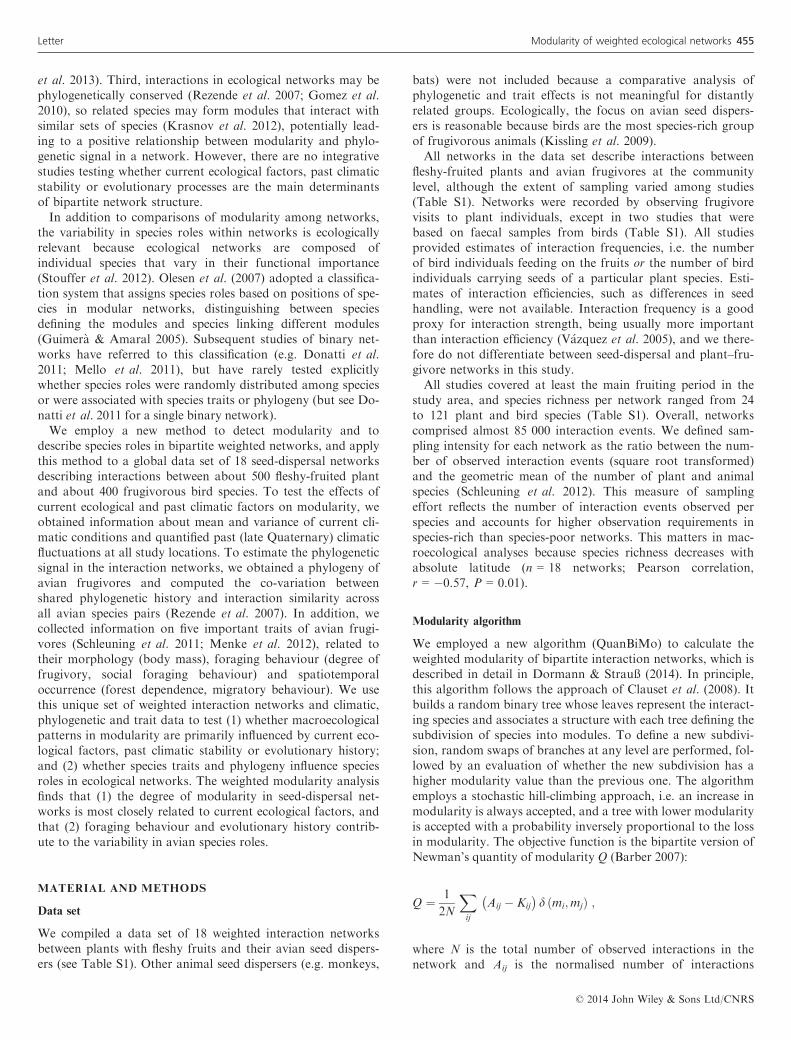
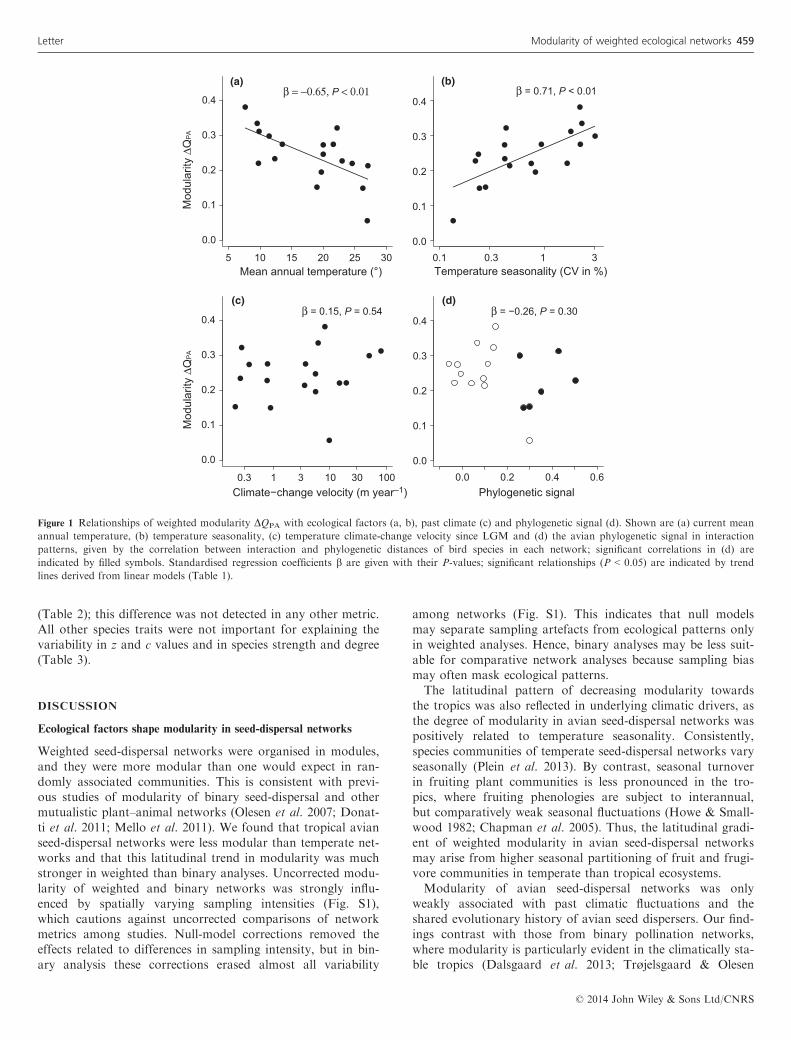
SAR models, weighted modularity DQPA was associated nega-tively with current mean annual temperature (MAT) and posi-tively with temperature seasonality (CVMAT), but wasunrelated to temperature climate-change velocity (VELMAT)and the avian phylogenetic signal in interaction patterns(PHYLO) (Table 1, Fig. 1). Effects of temperature variableson weighted modularity were generally stronger than those ofprecipitation variables (Table 1). In multi-predictor models, allbest-fit models of weighted DQPA included CVMAT and itsimportance was more than twice as high as that of other pre-dictors (Table 1). As null-model corrections removed mostvariability among binary networks (Fig. S1f), the proportionof explained variance was generally much lower in binary thanweighted modularity DQPA (Table 1, Fig. S2). Results basedon the second, more constrained null model (DQVA) were qual-itatively identical, especially in weighted analyses (Table S4).
Species roles
Weighted and binary measures of z and c values were posi-tively correlated (n = 312 species; z values: r = 0.46, P < 0.01;c values: r = 0.63, P < 0.01). However, the positive correlationwas contingent on sampling intensity and decreased exponen-
tially with increasing sampling intensity (Fig. S3). Speciesstrength was positively related to weighted measures of z andc values, especially to z values (z values: r = 0.78, P < 0.01; cvalues: r = 0.30, P < 0.01), and species degree was positivelyrelated to weighted z and c values (r = 0.60, P < 0.01 in bothcases). We did not detect a phylogenetic signal in within-mod-ule degree z, neither in weighted (k < 0.01, P = 1) nor binaryanalyses (k = 0.18, P = 0.28), nor in species strength(k < 0.01, P = 1). By contrast, c values exhibited a moderatebut significant phylogenetic signal in weighted (k = 0.37,P < 0.01) and binary (k = 0.31, P = 0.02) analyses, corre-sponding to a significant phylogenetic signal in species degree(k = 0.35, P < 0.01). Mostly tropical lineages, e.g. paleotropi-cal families Pycnonotidae and Lybiidae and neotropicalfamilies Pipridae and Thraupidae, showed consistently highc values and species degree (Fig. 2).Effects of species traits on z and c values and on species
strength and degree were generally weak (Table 2). Consistentacross all species-level metrics and weighted and binary analy-ses, values were higher for obligate and partial than foropportunistic frugivores (Table 2). In addition, frugivorousspecies with social foraging behaviour showed consistentlyhigher weighted and binary c values than solitary foragers
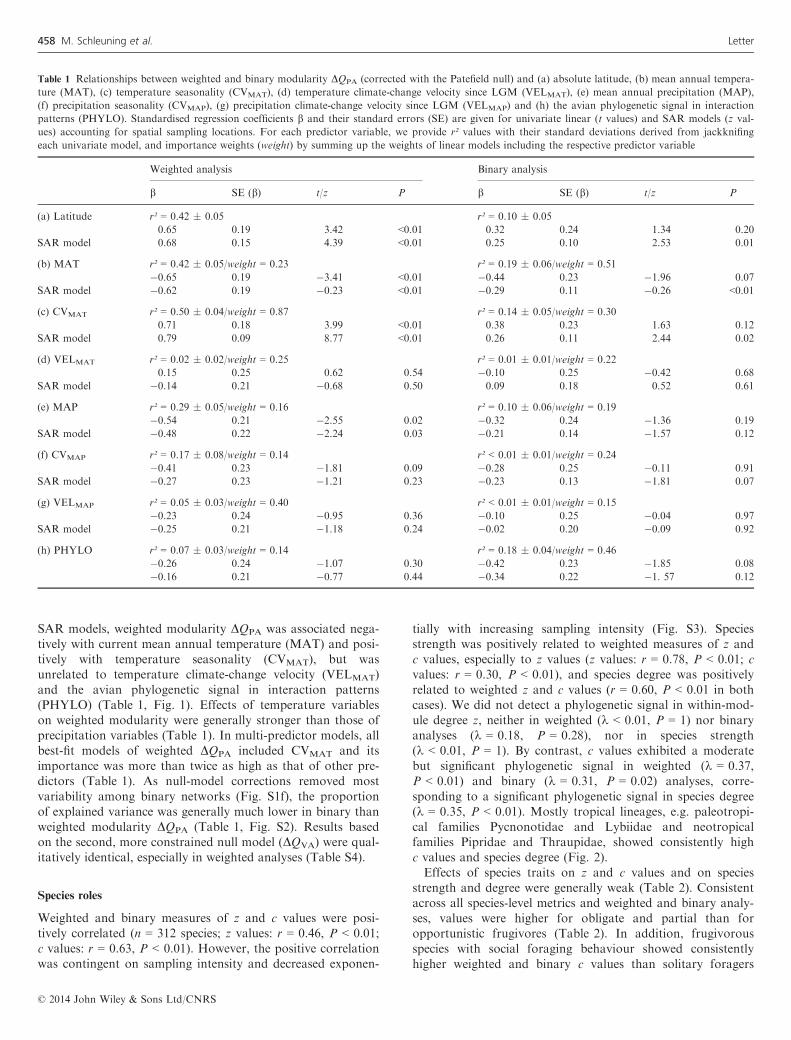
Table 1 Relationships between weighted and binary modularity DQPA (corrected with the Patefield null) and (a) absolute latitude, (b) mean annual tempera-
ture (MAT), (c) temperature seasonality (CVMAT), (d) temperature climate-change velocity since LGM (VELMAT), (e) mean annual precipitation (MAP),
(f) precipitation seasonality (CVMAP), (g) precipitation climate-change velocity since LGM (VELMAP) and (h) the avian phylogenetic signal in interaction
patterns (PHYLO). Standardised regression coefficients b and their standard errors (SE) are given for univariate linear (t values) and SAR models (z val-
ues) accounting for spatial sampling locations. For each predictor variable, we provide r² values with their standard deviations derived from jackknifing
each univariate model, and importance weights (weight) by summing up the weights of linear models including the respective predictor variable
Weighted analysis Binary analysis
b SE (b) t/z P b SE (b) t/z P
(a) Latitude r² = 0.42 � 0.05 r² = 0.10 � 0.05
0.65 0.19 3.42 <0.01 0.32 0.24 1.34 0.20
SAR model 0.68 0.15 4.39 <0.01 0.25 0.10 2.53 0.01
(b) MAT r² = 0.42 � 0.05/weight = 0.23 r² = 0.19 � 0.06/weight = 0.51
�0.65 0.19 �3.41 <0.01 �0.44 0.23 �1.96 0.07
SAR model �0.62 0.19 �0.23 <0.01 �0.29 0.11 �0.26 <0.01
(c) CVMAT r² = 0.50 � 0.04/weight = 0.87 r² = 0.14 � 0.05/weight = 0.30
0.71 0.18 3.99 <0.01 0.38 0.23 1.63 0.12
SAR model 0.79 0.09 8.77 <0.01 0.26 0.11 2.44 0.02
(d) VELMAT r² = 0.02 � 0.02/weight = 0.25 r² = 0.01 � 0.01/weight = 0.22
0.15 0.25 0.62 0.54 �0.10 0.25 �0.42 0.68
SAR model �0.14 0.21 �0.68 0.50 0.09 0.18 0.52 0.61
(e) MAP r² = 0.29 � 0.05/weight = 0.16 r² = 0.10 � 0.06/weight = 0.19
�0.54 0.21 �2.55 0.02 �0.32 0.24 �1.36 0.19
SAR model �0.48 0.22 �2.24 0.03 �0.21 0.14 �1.57 0.12
(f) CVMAP r² = 0.17 � 0.08/weight = 0.14 r² < 0.01 � 0.01/weight = 0.24
�0.41 0.23 �1.81 0.09 �0.28 0.25 �0.11 0.91
SAR model �0.27 0.23 �1.21 0.23 �0.23 0.13 �1.81 0.07
(g) VELMAP r² = 0.05 � 0.03/weight = 0.40 r² < 0.01 � 0.01/weight = 0.15
�0.23 0.24 �0.95 0.36 �0.10 0.25 �0.04 0.97
SAR model �0.25 0.21 �1.18 0.24 �0.02 0.20 �0.09 0.92
(h) PHYLO r² = 0.07 � 0.03/weight = 0.14 r² = 0.18 � 0.04/weight = 0.46
�0.26 0.24 �1.07 0.30 �0.42 0.23 �1.85 0.08
�0.16 0.21 �0.77 0.44 �0.34 0.22 �1. 57 0.12
© 2014 John Wiley & Sons Ltd/CNRS
458 M. Schleuning et al. Letter
(Table 2); this difference was not detected in any other metric.All other species traits were not important for explaining thevariability in z and c values and in species strength and degree(Table 3).
DISCUSSION
Ecological factors shape modularity in seed-dispersal networks
Weighted seed-dispersal networks were organised in modules,and they were more modular than one would expect in ran-domly associated communities. This is consistent with previ-ous studies of modularity of binary seed-dispersal and othermutualistic plant–animal networks (Olesen et al. 2007; Donat-ti et al. 2011; Mello et al. 2011). We found that tropical avianseed-dispersal networks were less modular than temperate net-works and that this latitudinal trend in modularity was muchstronger in weighted than binary analyses. Uncorrected modu-larity of weighted and binary networks was strongly influ-enced by spatially varying sampling intensities (Fig. S1),which cautions against uncorrected comparisons of networkmetrics among studies. Null-model corrections removed theeffects related to differences in sampling intensity, but in bin-ary analysis these corrections erased almost all variability
among networks (Fig. S1). This indicates that null modelsmay separate sampling artefacts from ecological patterns onlyin weighted analyses. Hence, binary analyses may be less suit-able for comparative network analyses because sampling biasmay often mask ecological patterns.The latitudinal pattern of decreasing modularity towards
the tropics was also reflected in underlying climatic drivers, asthe degree of modularity in avian seed-dispersal networks waspositively related to temperature seasonality. Consistently,species communities of temperate seed-dispersal networks varyseasonally (Plein et al. 2013). By contrast, seasonal turnoverin fruiting plant communities is less pronounced in the tro-pics, where fruiting phenologies are subject to interannual,but comparatively weak seasonal fluctuations (Howe & Small-wood 1982; Chapman et al. 2005). Thus, the latitudinal gradi-ent of weighted modularity in avian seed-dispersal networksmay arise from higher seasonal partitioning of fruit and frugi-vore communities in temperate than tropical ecosystems.Modularity of avian seed-dispersal networks was only
weakly associated with past climatic fluctuations and theshared evolutionary history of avian seed dispersers. Our find-ings contrast with those from binary pollination networks,where modularity is particularly evident in the climatically sta-ble tropics (Dalsgaard et al. 2013; Trøjelsgaard & Olesen
5 10 15 20 25 30
0.0
0.1
0.2
0.3
0.4
Mean annual temperature (°)
Mod
ular
ity Δ
QP
A
β = −0.65, P < 0.01
0.0 0.2 0.4 0.60.0
0.1
0.2
0.3
0.4
Phylogenetic signal
β = −0.26, P = 0.30
0.0
0.1
0.2
0.3
0.4
Temperature seasonality (CV in %)0.1 0.3 1 3
β = 0.71, P < 0.01
0.0
0.1
0.2
0.3
0.4
Climate−change velocity (m year–1)
Mod
ular
ity Δ
QP
A
0.3 1 3 10 30 100
β = 0.15, P = 0.54
(a) (b)
(c) (d)
Figure 1 Relationships of weighted modularity DQPA with ecological factors (a, b), past climate (c) and phylogenetic signal (d). Shown are (a) current mean
annual temperature, (b) temperature seasonality, (c) temperature climate-change velocity since LGM and (d) the avian phylogenetic signal in interaction
patterns, given by the correlation between interaction and phylogenetic distances of bird species in each network; significant correlations in (d) are
indicated by filled symbols. Standardised regression coefficients b are given with their P-values; significant relationships (P < 0.05) are indicated by trend
lines derived from linear models (Table 1).
© 2014 John Wiley & Sons Ltd/CNRS
Letter Modularity of weighted ecological networks 459

2013). While most animal-dispersed plant species address func-tionally diverse seed-disperser communities that vary in spaceand time (Plein et al. 2013), animal-pollinated plants dependon transfer of conspecific pollen and thus on flower-constantpollinators (Pellmyr 2002). Hence, selective forces on plants inseed-dispersal systems differ from those in pollination systems,which could explain the observed differences in latitudinalmodularity patterns. The observed ecological effects on modu-larity emphasise that ecological factors, such as seasonal fluc-
tuations in ecological communities (Bosch et al. 2009; Mart�ınGonz�alez et al. 2012), should receive the same attention in theinterpretation of modularity as evolutionary processes (Donat-ti et al. 2011; Krasnov et al. 2012).
Phylogeny and foraging behaviour influence species roles
We found no phylogenetic signal in the within-module degreeof bird species, which was also only weakly related to species
||||||||||||||||||||||||||||||| ||||||||||| ||||||||||||| ||||||||||| ||||||||||||||||||||||
|||||||||||||||||||||||||| ||||||||||||| ||||||||||||||||||||||||||||||||||||||||||||||||
||||||||||| ||||||||||||| ||||||||||||||||||||||||||||||||||||||||||||||||||||||||||| |||||
||||||||||||||||||||||||||||||||||||||||||||||||||||||||||||||||||| |||||||||||||||||||||
|||||||||||||||||||||||||||||||||||||||||||||||||||||||||||||||||||||||||||| |||||||||
|||||||||||||||||||||||||||||||||||||||||||||||||| ||||||||||||| ||||||||||| ||||||||||||||
|||||||||||||||||||||||||||||||||| ||||||||||||| ||||||||||| ||||||||||||||||||||||||||||||
||||||| ||||||||||| ||||||||||||| ||||||||||| ||||||||||||||||||||||||||||||||||||| |||||||||
|| ||||||||||||| ||||||||||| ||||||||||||||||||||||||||||||||||||| ||||||||||| ||||||||||||| |
|||||||||| |||||||||||||||||| |||||||||||||||||||||||||||||||||||||||||||||||||||||||||
||||||||||||||| |||||||||||||||||||||||||||||||||||||||||||||||||||||||||||||||||||||||||
|||||||||||||||||||||||||||||||||||||||||||||||||||||||||| ||||||||||||||||||||||||||||||
|||||||||||||||||||||||||||||||||||||||||| ||||||||||||||||||||||||||||||||||||||||||||||
||||||||||||||| ||||||||||| |||||||||||||||||||||||| |||||||||||||||||||||||||||||||||||
|||||||||||||||||||||||||||||||||| |||||||||||||||||||||||||||||||||||||||||||||||||||||
|||||||||||||||| ||||||||||||||||||||||||||||||||||||||||||||||||||||||||||||||||||||||||
|||||||||||||||||||||||||||||||||||||||||||||||||||||||||||||||||||||||| ||||||||||||||||
|||||||||||||||||||||||||||||||||||||||||||||||||||||||| |||||||||||||||||||||||||||||||
|||||||||||||||||||||||||||| ||||||||||||||||||||| |||||||||||||||||||||||| ||||||||||||
|||||||||||||||||||||||||||||||||||| |||||||||||||||||||||||| ||||||||||||||||||||||||||||
|||||||||||||||||||| ||||||||||||||||||||||||||||||||||||||||||||||||||||||||||||||||||||
|||| ||||||||||||||||||||| ||| |||||||||||||||||||||||||||||||||||||||||||||||||||||||||||
|||||||||| |||||||||||||||||||||||||||||||||||||||||||||||| ||||||||||||||||||||||
| || |||||||||| ||||||||||||||||||||||||||||||||||| |||||||||||||||||| || ||||||||||||||||||||
|||||||||||||||| || ||||||| |||||||| |||||||||| ||||||||||||||| |||||||||||||||||||| ||| ||||||
||||||||| || |||||||||| |||||||| ||||||| |||||||||||||||||||| |||||||||||||||||| || ||||||||||||
|||||| ||||||| ||||||||||||| ||||||| |||||||| ||||||| ||| || |||||||||||||||||| |||||||||||||||||
| ||||||||||||||| || ||||| ||||| ||||||||||||||| ||||||||| ||||||||||||||||||||||| ||||||||||
||||| ||||||| ||||||||||||||||| || |||||||||||||||||||||||||||||||||||| || ||||||||||||||||||
|| ||||| || |||||||||||||| ||||||||||||||||||||| || ||||||||||||||| ||| || ||||| |||||||||||||||
||||||||||||| ||||||| ||| ||||||||||||||| || ||| ||||||||||||||| |||||||||||||||||||| ||||||| |||
|||||||||| ||||| || ||||||||||||||||| |||||||||||||||||||| ||||||||||||||| ||| || ||||| || ||||||
|||||||||||| |||||| || |||||||||||||||||||||||||||||||||||| || |||||||||||||||||| |||||||||
||||||||||| ||||||||||||||| ||||||| ||| || ||||||||||||||| ||| |||||||||||||||||||| ||||||||||||
||| |||||||||| |||||||| ||||||| || ||| ||||||||||||||||||||||||||||||||| || |||||||||||||||||| ||
||||| || |||||||||||||||||||||||||||||||||||| || ||||||||||||||| ||| |||||||||||||||||||||||||
|||||||||| |||||||||| || ||||||||||||||| ||| |||||||||||||||||||||||||| || ||||||||||||||| ||
|||||||||||||||| ||||| ||||||| |||||||| ||||||| ||| || ||||||||||||||| |||||||||||||||||| ||| ||||
||||||||||| || ||||| ||||| |||||||| ||||||| || |||||||||||||||||| |||||||||||||||||| || ||||||||||
|||||||| ||||||| |||||||||||||||||||| |||||||| ||||||| ||| || |||||||||||||||||| |||||||||||||||
||||| ||||||| |||||||| ||||||| ||| ||||||||||||||| |||||||||||||||||||||||||||||||||||||| || |||
|||||||||||| ||| ||||||| ||||||||||| || |||||||||||||||||| ||||||||||||||| ||| ||||||||||||||
| |||||||||||||||||||||||||||||||||||||||| ||||| || |||||||||||||||||| |||||||||||||||||||||
|||||||||||||| ||| || ||||| || |||||||| ||||||||||||||||||||||||||||||||||||||||||||| ||| || ||||
| |||||||||| ||| ||||||| ||||||||||||||||||||||||||||||||||| |||||||||||||||||| || ||||||||||||
||| ||||||||||||||||||||||| ||||||| |||||||| ||||||| ||| || ||||||||||||||| ||||||||||| 0.8
0.6
0.4
0.2
0.0
2
1
0
–1
–2
3
BucerotidaeTodidaePicidaeRam
phasti-dae
Oriolid
ae
Monar
chida
e
Corvida
e
Stenos
tirida
e
RemizidaeParidaeAcrocephalidae
AegithalidaePhylloscopidae
CisticolidaeLeiothrichidaeZosteropidae
Sylviidae
Regulidae
Bombycillidae10 millionyears
Galliformes
Columbi-formes
Pici-
formes
Lybiidae
Pip
ridae
Pycnonotidae
Turd
idae
Psittaci-
formes
Pass
eri-
form
esS
ubos
cine
s
Oscines
Thraupidae
Corv
oi-
dea
Sylvoidea
Muscicapoidea
Passeroidea
NectariniidaeEstrildidae
Ploceidae
Passeridae Fringillidae Spindalis
Paru
lidae
Embe
rizid
ae
Icte
ridae
Card
inalid
ae
NumididaeCracidaeRallidaeCuculidaeMusophagi-
daeColumbidae
ColiidaeTrogonidae
Psittacidae
CotingidaeTi
tyrid
ae
Tyrannidae
Mal
acon
otid
ae
Plat
yste
irida
e
Vire
onida
e
Sittidae
Sturnidae
Mimidae
Muscicapidae
speciesdegree
weightedand binaryc values
|||||||||||||||| |||||| ||||||| |||||| |||| ||| |||||| ||||||||||||| |||| ||||||||| ||||| |||||||| || ||||| |||||| ||| |||||||||| ||||| ||||||||| |
| ||||| ||||| ||| || ||||||||| || ||| ||||||| ||| |||||||||| |||| ||||||||| ||| |||||||| || ||| |||||||| ||| || |||||||| || ||| |||| |||||| ||| ||||| ||| ||
||| || |||||| || ||| ||||| ||| || ||| || ||| ||| || ||| ||| ||||| || ||| ||||| ||| || |||| ||||| || || ||| ||| ||||| || |||| ||| || || ||| ||| ||||||| || |||| ||| ||||
|| |||| ||||||| |||| |||||||| |||||| ||||||| ||||||| |||||| |||| ||||| |||| ||| |||||||||| ||| |||| ||||||| || |||||||||| ||| || || |||||| ||| ||||| |
|||| ||| || |||||| || ||| ||| ||||| || ||| |||||||| || |||| || ||||| || ||| |||||||| || |||| ||||| || ||| || |||||||| || ||| |||| || ||||| || |||||||| || ||| ||| |
|||||| ||| ||| ||||| || ||| ||| ||||| || |||| || ||||| || |||| || || ||| || |||| ||||| || || |||| || || ||| || |||| || ||| || ||| ||| || ||||| || |||| ||| ||||| |||| ||
| ||||| |||||||| ||||| |||||| || ||||||||| || |||||||| ||| ||| || ||||| ||| || |||||||| ||| ||| ||||| || ||| || |||||||| ||||| |||| || ||||| || |||||||| |
|| || || ||||||||| ||| ||||||| ||| |||| |||||| ||| ||| ||||||| |||||| |||| ||||||||| ||||||| |||||| || || ||| |||||| ||||| || |||||| ||||||| |||||| ||| |||
|| |||| ||||||||||||||| ||||| ||||||| |||||||||||||| ||||| ||||||| ||||||||||||| |||| ||||||||| ||| || |||||||| ||| |||| |||||| ||| |||||||||| ||| |
| |||||||| ||| ||||| ||||| ||| || |||||| || ||| ||| || ||| || ||| ||||| || |||||| || ||||| |||||| ||||| |||||||| || ||||| |||||| ||| ||||| ||||| ||||| ||||
||||| ||||| ||||||| |||||||||||||| ||| ||||||||| ||| |||||||||| |||| ||||| ||||| || |||||||||| ||| |||| || ||||| || |||||||| || ||| || |||||||| ||| ||||
| ||| || ||| |||||||| || ||| ||| ||||| || ||| |||||||| || |||| || ||||| || ||| ||||| ||| || ||| |||||| || ||| || ||| ||||| || ||| |||| ||||||| || ||| ||||| || ||| ||
| ||||| || |||| || ||||| || |||||| ||||| || |||| || ||||| || |||| |||| ||| || |||||| ||| || || || |||||||| || |||| ||||| ||||| || || |||||||| ||| |||| |||| |||
|| |||||||| || ||| || |||||||| ||| ||||| ||| || ||| || |||||| || ||| ||| || |||||||| ||||| ||| || |||| ||||||| || ||| ||||| ||||| |||| || ||| || ||| || |||||||| |
| ||| |||| || |||| ||| ||| ||||| || ||||||| |||||| |||| || ||||| || |||| || ||||||| |||| || ||||| || |||| || || ||| || |||| || ||| || |||||| || || ||| |||||| || ||| |
| ||| ||| || ||||| |||||| ||| ||||| || || ||| || ||||||||||| |||| ||||||| || ||||||||||||| ||| |||||||| ||| || ||
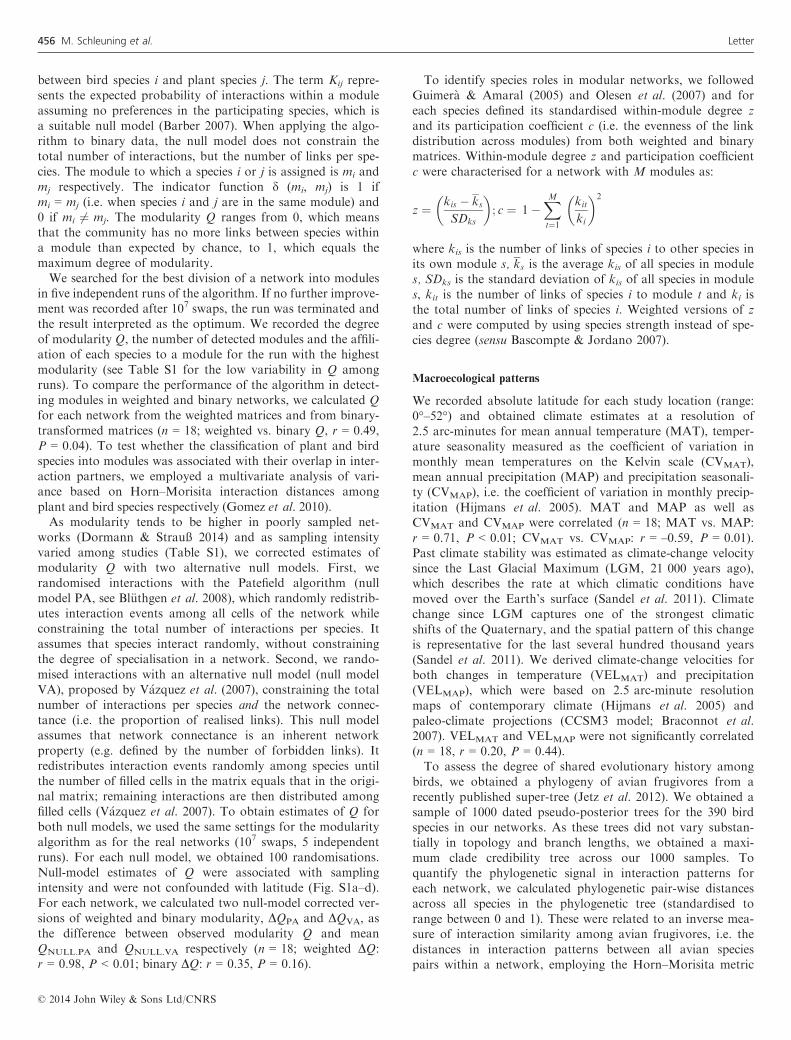
Figure 2 The distribution of weighted (inner circle) and binary (middle circle) c values as well as species degree (outer circle) across the phylogeny of avian
frugivores. Red tips indicate high, blue tips indicate low values. For improved visualisation, colour scales are based on raw c values and standardised
species degree (standard deviation units). Branch lengths are proportional to time (see scale bar), ancestral branches of key taxonomic groups and bird
families are labelled. Grey branches indicate bird families for which connector values and species degree were significantly larger than the overall mean
(only families with > 5 species tested): Lybiidae, Pipridae and Pycnonotidae for weighted and binary c and species degree, Thraupidae for weighted c and
species degree and Turdidae for weighted and binary c.
© 2014 John Wiley & Sons Ltd/CNRS
460 M. Schleuning et al. Letter
traits. This suggests that modules in avian seed-dispersal net-works are mostly formed by temporary associations of birdspecies feeding on the same plants (Plein et al. 2013). Speciesstrength, which is closely related to species abundance (Basco-mpte & Jordano 2007), was correlated with within-moduledegree and was also unrelated to avian phylogeny. This sug-gests that factors related to species abundance, rather thanphylogenetically conserved traits, were the main determinantsof the modular structure of avian seed-dispersal networks.In contrast to weak effects on within-module degree, phy-
logeny and selected species traits were significantly related toparticipation coefficients of frugivores, i.e. to the capacity ofspecies to interact across modules and thus to connect differ-ent modules. The connector values of species were related tospecies degree, which was also phylogenetically conserved (seealso Rezende et al. 2007). Accordingly, the disposition to feedon a high diversity of different fruit species seems to be con-centrated in certain clades in the avian phylogeny. In general,traits related to foraging behaviour were most important for
differences in connector values, whereas avian body size wasthe trait contributing the least information to weighted analy-ses. This contrasts with the particular importance of body sizein food webs (Woodward et al. 2005). It is likely that traitsrelated to foraging behaviour are more important than coarsemorphological variables in studies of specific functionalgroups of species. The apparent importance of body size inprevious work on binary seed-dispersal networks (Donattiet al. 2011) could potentially be explained by fundamentaldifferences between phylogenetic lineages (i.e. mammals vs.birds) rather than by body size per se, calling for rigorousphylogenetic correction in comparative analyses of speciesroles.Our study underscores previous findings that opportunistic
frugivores fill marginal positions in seed-dispersal networks,whereas the core of interactions is contributed by obligate andpartial frugivores (Schleuning et al. 2011). Obligate and par-tial frugivores tend to interact across modules because theyhave to feed on many fruiting plants to balance their nutri-tional demands and the spatiotemporal patchiness in fruitavailability. The importance of obligate and partial frugivoresis particularly high in the tropics (Kissling et al. 2009), wherethey contribute more interactions to seed-dispersal networks(mean � SE: 80.5 � 2.2%; n = 18 networks) than in temper-ate systems (57.3 � 8.1%). Social foraging behaviour was theother key trait defining avian connector species and may con-strain the formation of modules within seed-dispersal net-works. In accordance with this, many frugivorous tropicalbirds are known to forage in mixed-species flocks (Saraccoet al. 2004). In our study, species that tended to forage insocial flocks contributed more than half of the interactions totropical networks (56.9 � 6.7%) and significantly fewer inter-actions to temperate networks (32.1 � 5.7%).The results of the species-level analyses correspond well to
macroecological patterns in modularity. Low modularity intropical seed-dispersal systems may be associated with theimportance of social and generalist frugivores found in spe-cific phylogenetic lineages of tropical birds. The importanceof generalist species for the evolution of seed-dispersal sys-
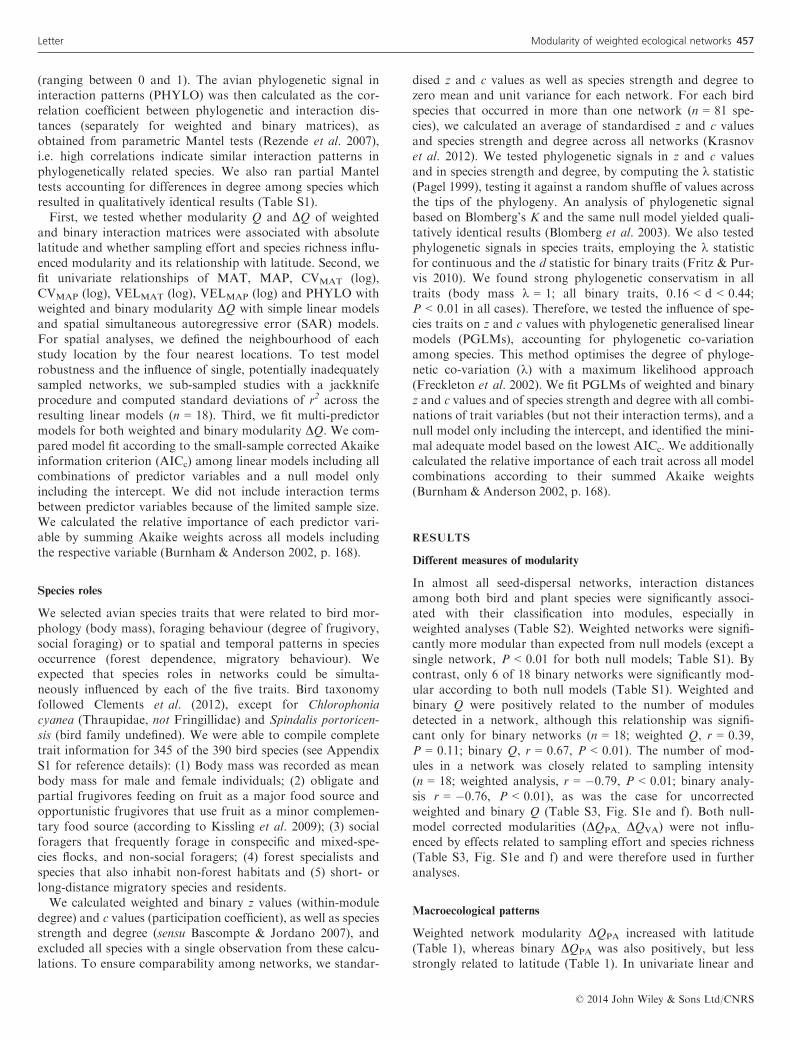
Table 2 Effects of species traits on (a) within-module degree z, (b) participation coefficients c and (c) species strength and degree in weighted and binary
avian seed-dispersal networks. Minimal adequate phylogenetic generalised linear models (PGLMs), controlling for avian phylogeny, are given (according to
AICc values), identified in comparisons between PGLMs containing all possible combinations of five traits of avian frugivores, i.e. degree of frugivory,
social foraging behaviour, migratory behaviour, forest dependence and body mass. Standardised regression coefficients b with their standard errors, t-statis-
tics and P-values for each predictor as well as r² and optimised phylogenetic co-variation k for each model are given
Weighted analysis Binary analysis
b SE (b) t P b SE (b) t P
(a) z values k = 0, P = 1; r² = 0.03 k = 0, P = 1; r² = 0.05
Degree of frugivory 0.32 0.10 3.29 <0.01 0.30 0.11 2.78 <0.01Forest dependence – – – – 0.25 0.10 2.38 0.02
(b) c values k = 0.26, P = 0.06; r² = 0.06 k = 0.18, P = 0.03; r² = 0.11
Degree of frugivory 0.39 0.11 3.56 <0.01 0.48 0.11 4.44 <0.01Social foraging 0.35 0.13 2.69 <0.01 0.46 0.13 3.48 <0.01Migratory behaviour – – – – –0.10 0.12 �0.78 0.44
(c) Strength/degree k = 0, P = 1; r² = 0.06 k = 0.20, P = 0.01; r² = 0.09
Degree of frugivory 0.43 0.09 4.62 <0.01 0.55 0.10 5.42 <0.01
Table 3 The importance of bird traits for explaining variation in within-
module degree z, participation coefficients c and species strength and
degree in weighted and binary avian seed-dispersal networks. Importance
weights were calculated across phylogenetic generalised linear models
(PGLMs) including all combinations of main effects of trait variables,
and the importance for each predictor variable is given by summing up
the Akaike weights of all PGLMs including the respective variable (Burn-
ham & Anderson 2002, p. 168)
Weighted analysis Binary analysis
z value c value strength z value c value degree
Degree of
frugivory
0.98 0.99 1.00 0.94 1.00 1.00
Social foraging 0.45 0.89 0.47 0.46 0.98 0.60
Migratory
behaviour
0.29 0.31 0.27 0.27 0.57 0.28
Forest
dependence
0.31 0.34 0.29 0.86 0.19 0.37
Body mass
(log)
0.27 0.20 0.29 0.29 0.34 0.38
© 2014 John Wiley & Sons Ltd/CNRS
Letter Modularity of weighted ecological networks 461
tems has been noted previously, assuming that these speciesare primarily large frugivores (e.g. quetzals and large coting-ids, Guimar~aes et al. 2011). Our findings suggest that alsospecies-rich lineages of small tropical frugivores, such as bul-buls (Pycnonotidae) and tanagers (Thraupidae), have beenkey nodes in the evolution of these networks. Hence, the lowmodularity of tropical seed-dispersal systems may also resultfrom the pervasive connector traits of specific lineages oftropical frugivores.
CONCLUSIONS
Networks of any kind are usually poorly represented by bin-ary links (Barrat et al. 2004; Scotti et al. 2007). The robust-ness and relevance of modularity analyses in ecology increasewhen including information on interaction frequencies (Ingset al. 2009). We employ a weighted modularity concept forbipartite networks and show that macroecological patterns inseed-dispersal networks were best resolved in weighted analy-ses, accounting for sampling bias with null-model corrections.Our approach to weighted modularity was also informativefor associating roles of species with phylogeny and speciestraits, here yielding similar patterns in weighted and binaryanalyses. This illustrates that modularity analyses of weightedbipartite networks may improve our understanding of the eco-logical and evolutionary causes of modularity in differenttypes of bipartite ecological networks. For the case of seed-dispersal networks, we demonstrate that the modular structureof plant–frugivore associations is primarily determined by cur-rent ecological factors and that phylogeny and foragingbehaviour have significant effects on the functional roles ofavian seed dispersers in modular networks.
ACKNOWLEDGEMENTS
David Weiß and Mathias Templin compiled trait data for fru-givorous birds, and Thomas Hovestadt provided the seed-dis-persal network published in his dissertation. MS, LI, DMD,SAF, MP, FS and KBG were supported by the research fund-ing programme Landes-Offensive zur Entwicklung Wissens-chaftlich-€okonomischer Exzellenz (LOEWE) of Hesse’sMinistry of Higher Education, Research, and the Arts. DMDwas also supported by the German Academic Exchange Ser-vice (DAAD) and FS by the German Research Foundation(DFG). JCS was supported by the European Research Coun-cil (ERC-2012-StG-310886-HISTFUNC). BD was supportedby the Carlsberg Foundation, and thanks to the DanishNational Research Foundation for its support of the Centerfor Macroecology, Evolution and Climate. CFD acknowl-edges funding by the Helmholtz Association (VH-NG 247).
AUTHORSHIP
MS and CFD conceived the idea. RS and CFD developed themodularity algorithm. MS, LI, DMD, MP, FS and KBG con-tributed network data. BD, BS and JCS contributed climatemodels. SAF contributed phylogenetic data. MS, LI, RS, SAFand CFD performed analyses. MS and CFD drafted the man-uscript. All authors contributed to interpretation and writing.
REFERENCES
Barber, M. (2007). Modularity and community detection in bipartite
networks. Phys. Rev. E, 76, 066102.
Barrat, A., Barth�elemy, M., Pastor-Satorras, R. & Vespignani, A. (2004).
The architecture of complex weighted networks. Proc. Natl Acad. Sci.
USA, 101, 3747–3752.Bascompte, J. & Jordano, P. (2007). Plant-animal mutualistic networks:
the architecture of biodiversity. Ann. Rev. Ecol. Evol. Syst., 38, 567–593.
Blomberg, S.P., Garland., T. Jr & Ives, A.R. (2003). Testing for
phylogenetic signal in comparative data: behavioral traits are more
labile. Evolution, 57, 717–745.Bl€uthgen, N., Fr€und, J., V�azquez, D.P. & Menzel, F. (2008). What do
interaction network metrics tell us about specialization and biological
traits? Ecology, 89, 3387–3399.Bosch, J., Mart�ın Gonz�alez, A.M., Rodrigo, A. & Navarro, D. (2009).
Plant–pollinator networks: adding the pollinator’s perspective. Ecol.
Lett., 12, 409–419.Braconnot, P., Otto-Bliesner, B., Harrison, S., Joussaume, S., Peterchmitt,
J.-Y., Abe-Ouchi, A. et al. (2007). Results of PMIP2 coupled
simulations of the Mid-Holocene and Last Glacial Maximum-Part 1:
experiments and large-scale features. Clim. Past, 3, 261–277.Burnham, K.P. & Anderson, D.R. (2002). Model selection and multimodel
inference. 2nd edn. Springer-Verlag, New York.
Carnicer, J., Jordano, P. & Meli�an, C. (2009). The temporal dynamics of
resource use by frugivorous birds: a network approach. Ecology, 90,
1958–1970.Chapman, C.A., Chapman, L.J., Struhsaker, T.T., Zanne, A.E., Clark,
C.J. & Poulsen, J.R. (2005). A long-term evaluation of fruiting
phenology: importance of climate change. J. Trop. Ecol., 21, 31–45.Clauset, A., Moore, C. & Newman, M.E.J. (2008). Hierarchical structure
and the prediction of missing links in networks. Nature, 101, 98–101.Clements, J.F., Schulenberg, T.S., Iliff, M.J., Sullivan, B.L., Wood, C.L.
& Roberson, D. (2012). The eBird/Clements checklist of birds of the
world: Version 6.7. Available at: http://www.birds.cornell.edu/
clementschecklist. Last accessed 19 November 2012.
Dalsgaard, B., Mag�ard, E., Fjelds�a, J., Mart�ın Gonz�alez, A.M., Rahbek,
C., Olesen, J.M. et al. (2011). Specialization in plant-hummingbird
networks is associated with species richness, contemporary precipitation
and quaternary climate-change velocity. PLoS ONE, 6, e25891.
Dalsgaard, B., Trøjelsgaard, K., Mart�ın Gonz�alez, A.M., Nogu�es-Bravo,
D., Ollerton, J., Petanidou, T. et al. (2013). Historical climate-change
influences modularity and nestedness of pollination networks.
Ecography, 12, 1331–1340.Donatti, C.I., Guimar~aes, P.R., Galetti, M., Pizo, M.A., Marquitti, F.M.D.
& Dirzo, R. (2011). Analysis of a hyper-diverse seed dispersal network:
modularity and underlying mechanisms. Ecol. Lett., 14, 773–781.Dormann, C.F. & Strauß, R. (2014). A method for detecting modules in
quantitative bipartite networks. Methods Ecol. Evol., 5, 90–98.Freckleton, R.P., Harvey, P.H. & Pagel, M. (2002). Phylogenetic analysis
and comparative data: A test and review of evidence. Am. Nat., 160,
712–726.Fritz, S.A. & Purvis, A. (2010). Selectivity in mammalian extinction risk
and threat types: a new measure of phylogenetic signal strength in
binary traits. Conserv. Biol., 24, 1042–1051.Gomez, J.M., Verd�u, M. & Perfectti, F. (2010). Ecological interactions
are evolutionarily conserved across the entire tree of life. Nature, 465,
918–922.Guimar~aes, P.R., Jordano, P. & Thompson, J.N. (2011). Evolution and
coevolution in mutualistic networks. Ecol. Lett., 14, 877–885.Guimer�a, R. & Amaral, L.A.N. (2005). Functional cartography of
complex metabolic networks. Nature, 433, 895–900.Hijmans, R.J., Cameron, S.E., Parra, J.L., Jones, P.G. & Jarvis, A.
(2005). Very high resolution interpolated climate surfaces for global
land areas. Int. J. Climatol., 25, 1965–1978.Howe, H.F. & Smallwood, J. (1982). Ecology of seed dispersal. Annu.
Rev. Ecol., 13, 201–228.
© 2014 John Wiley & Sons Ltd/CNRS
462 M. Schleuning et al. Letter
Ings, T.C., Montoya, J.M., Bascompte, J., Bl€uthgen, N., Brown, L.,
Dormann, C.F. et al. (2009). Ecological networks - beyond food webs.
J. Anim. Ecol., 78, 253–269.Jetz, W., Thomas, G.H., Joy, J.B., Hartmann, K. & Mooers, A.O. (2012).
The global diversity of birds in space and time. Nature, 491, 444–448.Kissling, W.D., B€ohning-Gaese, K. & Jetz, W. (2009). The global
distribution of frugivory in birds. Global Ecol. Biogeogr., 18, 150–162.Krasnov, B.R., Fortuna, M.A., Mouillot, D., Khokhlova, I.S., Shenbrot,
G.I. & Poulin, R. (2012). Phylogenetic signal in module composition
and species connectivity in compartmentalized host-parasite networks.
Am. Nat., 179, 501–511.Mart�ın Gonz�alez, A.M., Allesina, S., Rodrigo, A. & Bosch, J. (2012).
Drivers of compartmentalization in a Mediterranean pollination
network. Oikos, 121, 2001–2013.Mello, M.A.R., Marquitti, F.M.D., Guimar~aes, P.R., Kalko, E.K.V.,
Jordano, P. & de Aguiar, M.A.M. (2011). The modularity of seed
dispersal: differences in structure and robustness between bat- and bird-
fruit networks. Oecologia, 167, 131–140.Menke, S., B€ohning-Gaese, K. & Schleuning, M. (2012). Plant–frugivore
networks are less specialized and more robust at forest–farmland edges
than in the interior of a tropical forest. Oikos, 121, 1553–1566.Mulwa, R., Neuschulz, E.L., B€ohning-Gaese, K. & Schleuning, M. (2013).
Seasonal fluctuations of resource abundance and avian feeding guilds
across forest–farmland boundaries in tropical Africa.Oikos, 122, 524–532.Newman, M.E.J. & Girvan, M. (2004). Finding and evaluating
community structure in networks. Phys. Rev. E Stat. Nonlin. Soft
Matter Phys., 69, 1–16.Olesen, J.M., Bascompte, J., Dupont, Y.L. & Jordano, P. (2007). The
modularity of pollination networks. Proc. Natl Acad. Sci. USA, 104,
19891–19896.Pagel, M. (1999). Inferring the historical patterns of biological evolution.
Nature, 401, 877–884.Pellmyr, O. (2002). Pollination by animals. In: Plant-Animal Interactions:
An Evolutionary Approach (eds Herrera, C.M. & Pellmyr, O.).
Blackwell, Oxford, UK, pp. 157–184.Plein, M., L€angsfeld, L., Neuschulz, E.L., Schultheiß, C., Ingmann, L.,
T€opfer, T. et al. (2013). Constant properties of plant-frugivore
networks despite fluctuations in fruit and bird communities in space
and time. Ecology, 94, 1296–1306.Rezende, E.L., Lavabre, J.E., Guimar~aes, P.R., Jordano, P. &
Bascompte, J. (2007). Non-random coextinctions in phylogenetically
structured mutualistic networks. Nature, 448, 925–928.Sandel, B., Arge, L., Dalsgaard, B., Davies, R.G., Gaston, K.J.,
Sutherland, W.J. et al. (2011). The influence of late Quaternary climate-
change velocity on species endemism. Science, 334, 660–664.Saracco, J.F., Collazo, J.A. & Groom, M.J. (2004). How do frugivores
track resources? Insights from spatial analyses of bird foraging in a
tropical forest Oecologia, 139, 235–245.
Schleuning, M., Bl€uthgen, N., Fl€orchinger, M., Braun, J., Schaefer, H.M. &
B€ohning-Gaese, K. (2011). Specialization and interaction strength in a
tropical plant-frugivore network differ among forest strata. Ecology, 92,
26–36.Schleuning, M., Fr€und, J., Klein, A.-M., Abrahamczyk, S., Alarc�on, R.,
Albrecht, M. et al. (2012). Specialization of mutualistic interaction
networks decreases toward tropical latitudes. Curr. Biol., 22, 1925–1931.
Scotti, M., Podani, J. & Jord�an, F. (2007). Weighting, scale dependence
and indirect effects in ecological networks: a comparative study. Ecol.
Complex., 4, 148–159.Staniczenko, P.P.A., Kopp, J.C. & Allesina, S. (2013). The ghost of
nestedness in ecological networks. Nat. Commun., 4, 1391.
Stouffer, D.B., Sales-Pardo, M., Sirer, M.I. & Bascompte, J. (2012).
Evolutionary conservation of species’ roles in food webs. Science, 335,
1489–1492.Th�ebault, E. (2013). Identifying compartments in presence–absence
matrices and bipartite networks: insights into modularity measures. J.
Biogeogr., 40, 759–768.Th�ebault, E. & Fontaine, C. (2010). Stability of ecological communities
and the architecture of mutualistic and trophic networks. Science, 329,
853–856.Trøjelsgaard, K. & Olesen, J.M. (2013). Macroecology of pollination
networks. Global Ecol. Biogeogr., 22, 149–162.V�azquez, D., Morris, W.F. & Jordano, P. (2005). Interaction frequency as
a surrogate for the total effect of animal mutualists on plants. Ecol.
Lett., 8, 1088–1094.V�azquez, D.P., Meli�an, C., Williams, N.M., Bl€uthgen, N., Krasnov, B.R.
& Poulin, R. (2007). Species abundance and asymmetric interaction
strength in ecological networks. Oikos, 116, 1120–1127.Woodward, G., Ebenman, B., Emmerson, M., Montoya, J.M., Olesen,
J.M., Valido, A. et al. (2005). Body size in ecological networks. Trends
Ecol. Evol., 20, 402–409.
SUPPORTING INFORMATION
Additional Supporting Information may be downloaded viathe online version of this article at Wiley Online Library(www.ecologyletters.com).
Editor, Jose GomezManuscript received 12 September 2013First decision made 25 October 2013Manuscript accepted 17 December 2013
© 2014 John Wiley & Sons Ltd/CNRS
Letter Modularity of weighted ecological networks 463