ecological determinants of bioeconomics in three intertidal chitons (acanthopleura spp.)
TRANSCRIPT

Ecological Determinants of Bioeconomics in Three Intertidal Chitons (Acanthopleura Spp.)Author(s): S. Focardi and G. ChelazziSource: Journal of Animal Ecology, Vol. 59, No. 1 (Feb., 1990), pp. 347-362Published by: British Ecological SocietyStable URL: http://www.jstor.org/stable/5177 .
Accessed: 07/05/2014 19:21
Your use of the JSTOR archive indicates your acceptance of the Terms & Conditions of Use, available at .http://www.jstor.org/page/info/about/policies/terms.jsp
.JSTOR is a not-for-profit service that helps scholars, researchers, and students discover, use, and build upon a wide range ofcontent in a trusted digital archive. We use information technology and tools to increase productivity and facilitate new formsof scholarship. For more information about JSTOR, please contact [email protected].
.
British Ecological Society is collaborating with JSTOR to digitize, preserve and extend access to Journal ofAnimal Ecology.
http://www.jstor.org
This content downloaded from 169.229.32.136 on Wed, 7 May 2014 19:21:38 PMAll use subject to JSTOR Terms and Conditions

Journal of Animal Ecology (1990), 59, 347-362
ECOLOGICAL DETERMINANTS OF BIOECONOMICS IN THREE INTERTIDAL CHITONS
(ACANTHOPLEURA SPP.)
BY S. FOCARDI AND G. CHELAZZI
Istituto Nazionale di Biologia della Selvaggina, 40064 Ozzano dell' Emilia, Italy and Dipartimento di Biologia Animale e Genetica dell' Universita, 50125 Firenze, Italy
SUMMARY
(1) The organization of foraging in time and space was assessed in three species of chitons (Mollusca: Polyplacophora)-Acanthopleura gemmata, Indian and Pacific Ocean; A. brevispinosa, Western Indian Ocean; A. granulata, Caribbean Sea-which experience different intertidal conditions.
(2) Sampling the individual positions twice a day through a semi-lunar period gave bulk information on the variation of the resting-feeding strategy in time, while continuous tracking of individual paths permitted the detailed analysis of the spatial strategy adopted by chitons inside each activity phase.
(3) The three species exhibit a different bioeconomical organization: central place foraging based on homing and zonal shuttling (A. gemmata), alternance of homing and dispersive movements (A. brevispinosa), and prevalence of ranging pattern (A. granulata).
(4) The discriminant analysis of foraging-path parameters has shown that both spatial variables (mainly related to the amplitude of tidal oscillations and exposure to waves) and temporal ones (related to diel and tidal environmental oscillations) account for the observed interspecific differences in movement patterns.
(5) The utmost importance of spatial parameters-and related modification in shelter availability and exposure to predators-in shaping the specific foraging behaviour has been revealed by a principal component analysis.
INTRODUCTION
Quite different movement patterns are adopted by congeneric intertidal chitons and gastropods. Branch (1975) was able to arrange eleven South African limpets (Patella spp.) in an almost continuous array on the basis of their long-term spatial behaviour: a fine tuning of movement pattern results in niche apportionment between sympatric species and in their specific adaptation to different intertidal conditions.
In a recent review on orientation of intertidal chitons and gastropods Chelazzi, Focardi & Deneubourg (1988) have shown that two main spatial strategies predominate in these molluscs: central place and ranging patterns. Very deterministic central place systems have been reported for Patella depressa (Cook et al. 1969), P. vulgata (Bree 1959), P. longicosta (Branch 1971), Collisella (Acmaea) scabra (Hewatt 1940) and Notoacmea petterdi (Creese 1980). Homing, scar individuality and territorialism are the classical behavioural adaptations observed in these species (Stimson 1970). A completely different model of activity is the ranging pattern described by Underwood (1977) in some Australian limpets and trochids and possibly present in some littorinids as well (McQuaid 1981; Petraitis 1982): inside their specific zonal belt snails move more or less randomly
347
This content downloaded from 169.229.32.136 on Wed, 7 May 2014 19:21:38 PMAll use subject to JSTOR Terms and Conditions
Determinants of bioeconomics
without any observed directionality to gain access to shelters or food patches. These different patterns must obviously be related to variations in the physical and biological structure of the intertidal environment, but the relationships between behaviour and
ecology in intertidal molluscs are still poorly understood due to the scarcity of long-term studies on individual activity and detailed analyses of individual paths.
In the present study, both long-term discrete positioning and short-term integral path recording were used to analyse the organization in space and time of the foraging behaviour in three congeneric intertidal chitons and to assess the relationships between their behaviour and environmental structure. The three Acanthopleura species A. gemmata (Blainville), Indian and Pacific Ocean; A. brevispinosa (Sowerby), Western Indian Ocean; A. granulata Gmelin, Caribbean Sea-are very similar in morphology and colonize the eulittoral zone of similarly composed and structured rocky shores (limestone cliffs) where they graze on epilithic and endolithic algae.
Detailed analyses have been made of the spatial behaviour of the two East African
species in sympatry (Chelazzi, Focardi & Deneubourg 1983) and of both home defence
against conspecific intruders (Chelazzi et al. 1983; Chelazzi & Parpagnoli 1987) and trail-
following in A. gemmata (Chelazzi, Della Santina & Parpagnoli 1987). On the contrary, only a brief report is available on the homing behaviour of A. granulata (Mook 1983). Some notes on its biology, ecology and behaviour are reported by Lewis (1960) and Glynn (1970).
The data in the present report refer to the foraging behaviour of the three species in their most typical rocky shore environment: quite sheltered for A. gemmata, moderately exposed for A. granulata and exposed for A. brevispinosa.
MATERIALS AND METHODS
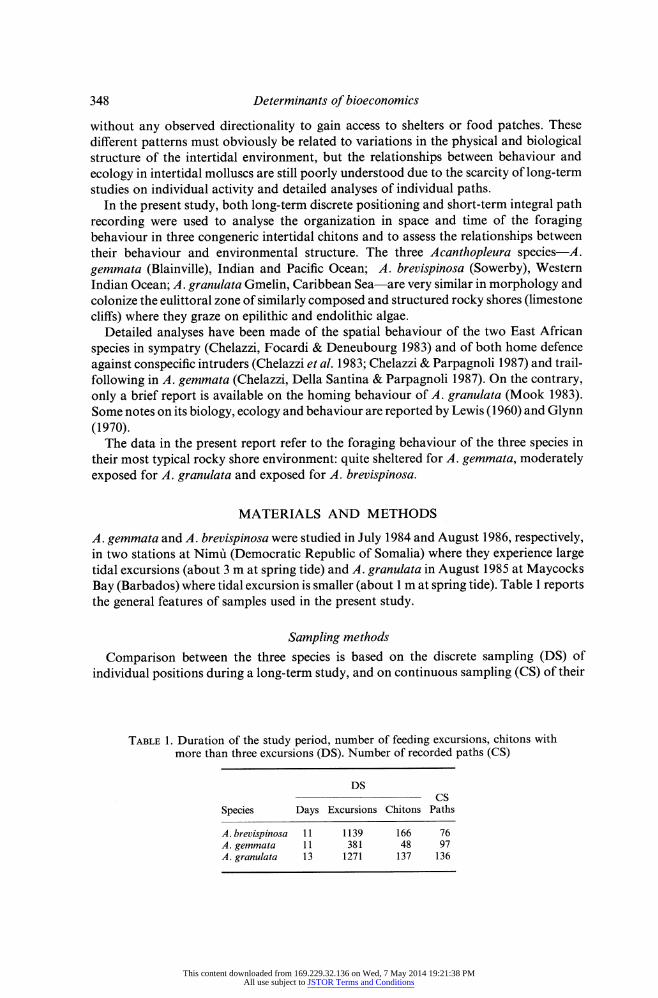
A. gemmata and A. brevispinosa were studied in July 1984 and August 1986, respectively, in two stations at Nimui (Democratic Republic of Somalia) where they experience large tidal excursions (about 3 m at spring tide) and A. granulata in August 1985 at Maycocks Bay (Barbados) where tidal excursion is smaller (about 1 m at spring tide). Table 1 reports the general features of samples used in the present study.
Sampling methods
Comparison between the three species is based on the discrete sampling (DS) of individual positions during a long-term study, and on continuous sampling (CS) of their
TABLE 1. Duration of the study period, number of feeding excursions, chitons with more than three excursions (DS). Number of recorded paths (CS)
DS CS
Species Days Excursions Chitons Paths
A. brevispinosa 11 1139 166 76 A. gemmata 11 381 48 97 A. granulata 13 1271 137 136
348
This content downloaded from 169.229.32.136 on Wed, 7 May 2014 19:21:38 PMAll use subject to JSTOR Terms and Conditions

S. FOCARDI AND G. CHELAZZI
paths during each activity phase. Long-term studies were made using reiterative triangulation of individually marked animals from reference stalks. Triangulation of individual fixes was made twice a day, during diurnal and nocturnal low tides. As these species rest during the day and move about to feed during nocturnal low tides (A. gemmata and A. brevispinosa), or at night regardless of the tidal phase (A. granulata), this temporal organization of sampling gave information on the sequence of resting and feeding positions. This type of position recording was carried out for one semi-lunar period in each species.
Continuous tracking of animals' activity (CS) was done using the motographic method (LED-tracking) introduced by Chelazzi, Innocenti & Della Santina (1983) for the study of movements in intertidal molluscs. This simple technique provides integral information on individual movement, when the diel component of the activity phase is nocturnal, as in the three species considered.
Analysis of data
Discrete positions A triplet of fixes relative to a diurnal position (Dj), the next nocturnal (N1) and the
following diurnal fix (Dj+ l) describes an activity phase. The following parameters were computed (j= 1,...., n- 1; where n is the total number of days of observation): (i) the length of the outward branch of the feeding excursion is estimated by computing the vector connecting the Di diurnal fix (rest site) to the following Nj nocturnal fix. The length of the outward emi-excursion lo is the length of this vector; (ii) the angle k relative to the same vector, taking the upward (landward) direction as zero direction; (iii) for each activity phase we computed the ratio t = 2d/(lo + r) where lr is the length of the return branch of the feeding excursion and d is the distance between Dj and Dy+ i. Animals were considered 'inactive' when performing lo displacements shorter than 5 cm.
The mean values of lo and t were computed for each animal, with a least three lo > 5 cm, while the individual resultant vector of 0 distributions was obtained according to Batschelet (1981). Standard deviation was used to estimate the dispersion of linear variables, while the angular scattering was computed as the length of the resultant vector (r) of angular distributions.
The dynamic of shelter occupation was studied using the distribution of the uninterrupted sequence of days each chiton rests in the same scar.
Paths After being digitized, each individual path obtained by LED-tracking (CS) was
analysed in order to obtain the following motion parameters: (i) actual length of the path during each activity phase (L); (ii) total time spent in activity during each activity phase (T); (iii) mean speed (V=L/T); (iv) maximum linear distance from the starting point reached during each excursion (MD); (v) time from start to reaching the MD, setting T= 1 (TMD); (vi) angle between the line connecting the starting and farthest points, and the vertical, taking the landward direction as zero (A); (vii) relative homing error (RHE= HE/L), where HE is the distance between the start and final point of each path.
The paths were further analysed by dividing the excursion length into ten equal segments for which the average speed and the homeward component of the segment orientation (for details see Chelazzi, Innocenti & Della Santina 1983) were computed. The homeward component ranges between 1 (when all chitons head homeward) and -1 (when all head away from home) in the considered path segment.
349
This content downloaded from 169.229.32.136 on Wed, 7 May 2014 19:21:38 PMAll use subject to JSTOR Terms and Conditions

Determinants of bioeconomics
RESULTS
Utilization of the potential activity phase and duration of activity The utilization of each potential activity phase was assessed from the DS data by
computing the fraction of active animals in each session. The average value through the study period is 0-73, 0-61 and 0-69 for A. gemmata, A. brevispinosa and A. granulata, respectively, a significant difference being detected only between A. brevispinosa and A. granulata (Mann-Whitney U-test; n = 11, n2= 13, U=37, P< 005). Nevertheless, activity follows a distinct neap-spring cycle in the two East African species, reaching the maximum during spring tides (0-86 and 0.82) and the minimum during neap tides (0-43 and 0-41) in A. gemmata and A. brevispinosa, respectively. No such variation was observed in A. granulata.
The duration of activity within each activity phase is markedly different in the three species. The total activity time (T) obtained from CS data (time between start and stop) is 5.0 + 1 4 h in A. gemmata, 6-3 + 2-1 h in A. brevispinosa, and 8-1 + 2.2 h in A. granulata. The three frequency distributions from which these mean values have been computed are statistically different (X
2 = 168, P < 0-001).
Length and orientation of the feeding excursion
The length of each individual excursion obtained by CS data (L) markedly differs between the three species, decreasing in the order A. gemmata> A. brevispinosa> A. granulata (L = 213 + 99 cm, 127 + 29, 97 ? 66, respectively). Again, the three frequency distributions are significantly different (X2 = 128, P< 0001). The DS data confirm this difference: the second-order mean outward emi-excursion (lo) is 56+13 cm for A. gemmata, 36 + 13 for A. brevispinosa and 28 + 10 for A. granulata, respectively (X
2 = 147, P < 0.001). The underestimate of DS with respect to CS data depends on the winding of chitons' paths and on the fact that while CS information was gathered only around spring tides, DS study covers a larger part of the spring-neap cycle. In fact, the DS data show a variation in excursion length during the synodic month in the two East African species: their excursions are longer during spring tide. No such trend was observed in the Caribbean species.
CS and DS recording gave concordant information on the orientation of individual excursions along the sea-land axis. The results of LED-tracking are reported in Table 2, while those of DS studies are shown in Fig. 1. The angular distributions of the feeding excursions of A. gemmata and A. brevispinosa are significantly clustered around their mean orientation (Rayleigh's test, z= 219 and z=232, respectively, P< 0-001), with a prevalent downward orientation (V-test, u=3.56, P<0-01 and u=21.6, P<0.001,
TABLE 2. Orientation of feeding excursions (CS data). Resultant parameters of the distribution of A angles. PHI, mean angle (0?= upward); r, length of the resultant vector; z, Rayleigh test statistics; u, V-test statistics (taking 180? as the expected
direction)
Species PHI r z u
A. brevispinosa 148 0.433 14-25** 4.53** A. gemmata 170 0-672 43-80** 9.22** A. granulata 207 0.059 0-47 0-87
**P<0-01.
350
This content downloaded from 169.229.32.136 on Wed, 7 May 2014 19:21:38 PMAll use subject to JSTOR Terms and Conditions

S. FOCARDI AND G. CHELAZZI
Land Land
Sea
FIG. 1. Orientation of the feeding excursions: frequency distribution (%) of all q (inner polygon) and individual resultants (dots). Outer arrow shows the second-order resultant direction of the
individual q.
respectively). A. granulata heads randomly (Rayleigh's test, z = 2-24, P> 0-05), showing only a weak, non-significant, orientation parallel to the coast line (V-test, u = 2013, P> 0-05). Similarly, the second order analysis of the individual mean orientation, (, shows that A. brevispinosa is seaward oriented (Rayleigh's test, z= 82-3, P< 0-001; V-test, u=12-7, P<0 01), while A. gemmata distribution is clustered around the mean orientation (Rayleigh's test, z= 4093, P<0-05) but not seaward oriented (V-test, u = 1-608, P > 0-05). The ( distribution of A. granulata is not clustered around the mean direction (Rayleigh's test, z= 2-27, P> 0-05), but significantly oriented parallel to the shore line (V-test, u = 2-02, P < 0-05) showing that this chiton actively disperses along the shore line maintaining a constant zonal level.
351
This content downloaded from 169.229.32.136 on Wed, 7 May 2014 19:21:38 PMAll use subject to JSTOR Terms and Conditions
Determinants of bioeconomics
30- (b)
20- (a) 20-
10- 10- __
0 0-2 04 0 6 0.8 I'0
o 30- (c)
a) u
20-
I0-
0 0-2 0.4 0-6 0-8 10
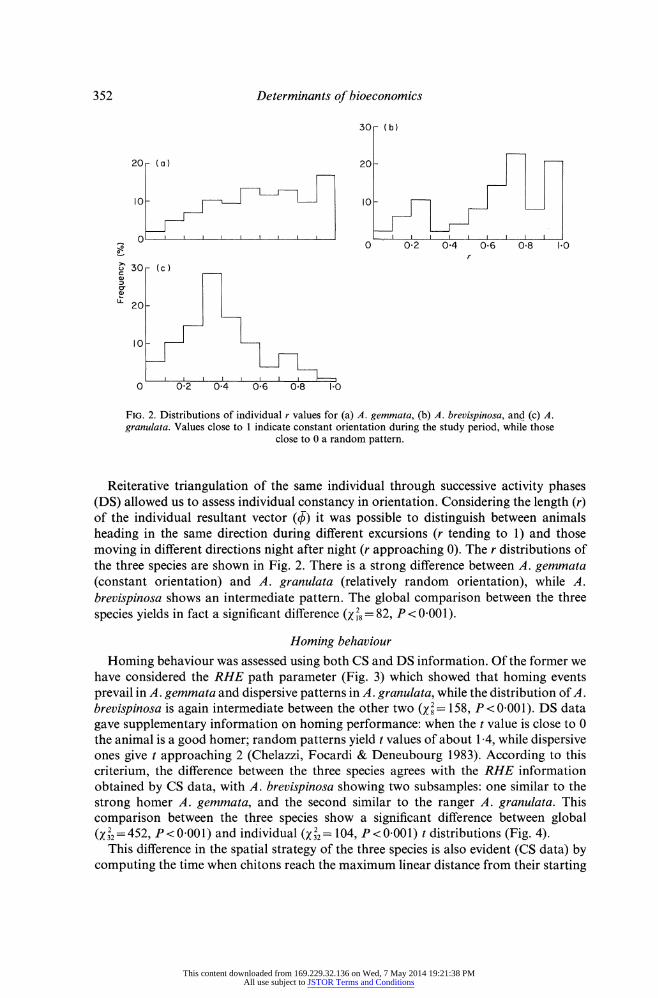
FIG. 2. Distributions of individual r values for (a) A. gemmata, (b) A. brevispinosa, and (c) A. granulata. Values close to 1 indicate constant orientation during the study period, while those
close to 0 a random pattern.
Reiterative triangulation of the same individual through successive activity phases (DS) allowed us to assess individual constancy in orientation. Considering the length (r) of the individual resultant vector (?) it was possible to distinguish between animals heading in the same direction during different excursions (r tending to 1) and those moving in different directions night after night (r approaching 0). The r distributions of the three species are shown in Fig. 2. There is a strong difference between A. gemmata (constant orientation) and A. granulata (relatively random orientation), while A. brevispinosa shows an intermediate pattern. The global comparison between the three
species yields in fact a significant difference (x 2= 82, P < 0.001).
Homing behaviour
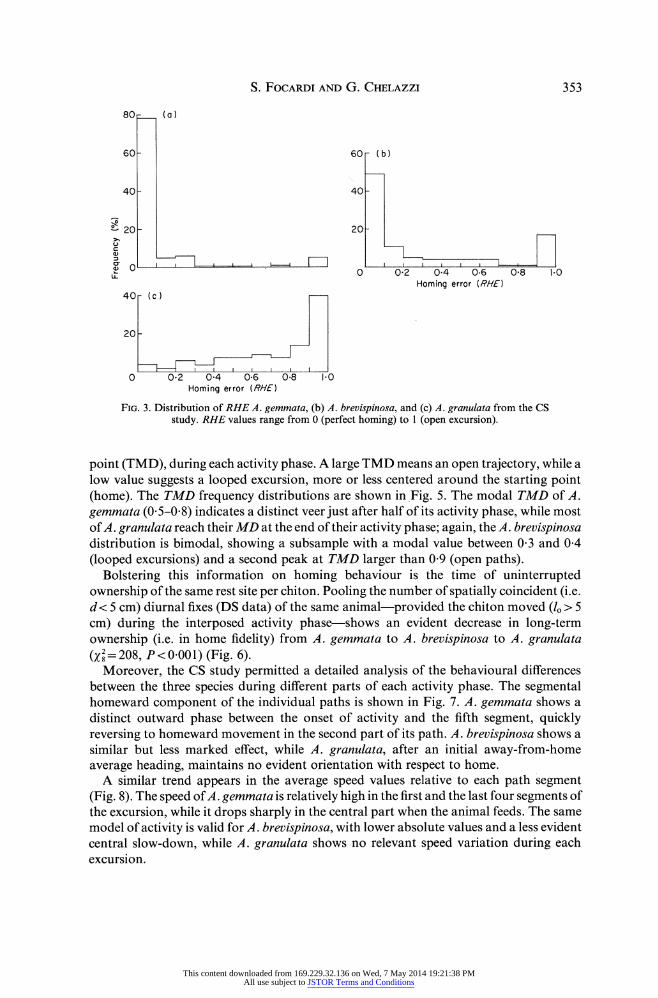
Homing behaviour was assessed using both CS and DS information. Of the former we have considered the RHE path parameter (Fig. 3) which showed that homing events prevail in A. gemmata and dispersive patterns in A. granulata, while the distribution of A. brevispinosa is again intermediate between the other two (2= 158, P<0-001). DS data gave supplementary information on homing performance: when the t value is close to 0 the animal is a good homer; random patterns yield t values of about 1-4, while dispersive ones give t approaching 2 (Chelazzi, Focardi & Deneubourg 1983). According to this criterium, the difference between the three species agrees with the RHE information obtained by CS data, with A. brevispinosa showing two subsamples: one similar to the strong homer A. gemmata, and the second similar to the ranger A. granulata. This comparison between the three species show a significant difference between global (X2 = 452, P <0-001) and individual ( 2= 104, P <0-001) t distributions (Fig. 4). 32 32
This difference in the spatial strategy of the three species is also evident (CS data) by computing the time when chitons reach the maximum linear distance from their starting
352
This content downloaded from 169.229.32.136 on Wed, 7 May 2014 19:21:38 PMAll use subject to JSTOR Terms and Conditions
S. FOCARDI AND G. CHELAZZI
80-_ (a)
60- 60- (b)
40- 40-
20- 20-
1 1 0- i ii 1 I II i i i i i i I ?
0 '
' '
I U 0 0-2 0-4 016 0-8 1-0
Homing error (RHE) 40- (c)
20-
0 0-2
,
I I I ,- 0 0-2 0'4 0-6 08 1.0
Homing error (RHE)
FIG. 3. Distribution of RHE A. gemmata, (b) A. brevispinosa, and (c) A. granulata from the CS study. RHE values range from 0 (perfect homing) to 1 (open excursion).
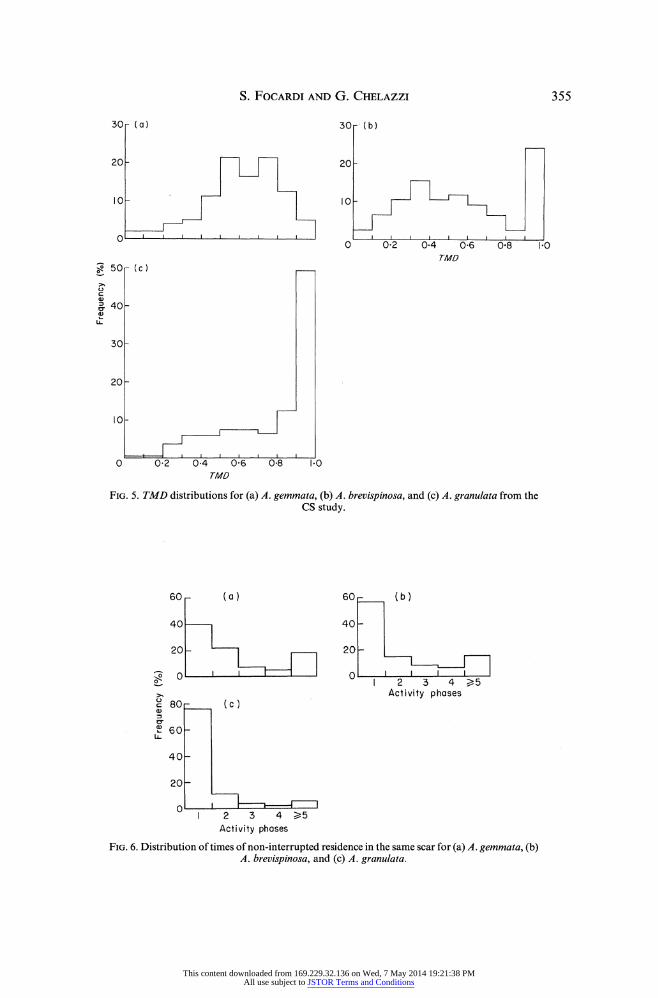
point (TMD), during each activity phase. A large TMD means an open trajectory, while a low value suggests a looped excursion, more or less centered around the starting point (home). The TMD frequency distributions are shown in Fig. 5. The modal TMD of A. gemmata (0 5-0.8) indicates a distinct veer just after half of its activity phase, while most of A. granulata reach their MD at the end of their activity phase; again, the A. brevispinosa distribution is bimodal, showing a subsample with a modal value between 0-3 and 0-4 (looped excursions) and a second peak at TMD larger than 0-9 (open paths).
Bolstering this information on homing behaviour is the time of uninterrupted ownership of the same rest site per chiton. Pooling the number of spatially coincident (i.e. d< 5 cm) diurnal fixes (DS data) of the same animal-provided the chiton moved (lo > 5 cm) during the interposed activity phase-shows an evident decrease in long-term ownership (i.e. in home fidelity) from A. gemmata to A. brevispinosa to A. granulata (Z = 208, P < 0001) (Fig. 6).
Moreover, the CS study permitted a detailed analysis of the behavioural differences between the three species during different parts of each activity phase. The segmental homeward component of the individual paths is shown in Fig. 7. A. gemmata shows a distinct outward phase between the onset of activity and the fifth segment, quickly reversing to homeward movement in the second part of its path. A. brevispinosa shows a similar but less marked effect, while A. granulata, after an initial away-from-home average heading, maintains no evident orientation with respect to home.
A similar trend appears in the average speed values relative to each path segment (Fig. 8). The speed of A. gemmata is relatively high in the first and the last four segments of the excursion, while it drops sharply in the central part when the animal feeds. The same model of activity is valid for A. brevispinosa, with lower absolute values and a less evident central slow-down, while A. granulata shows no relevant speed variation during each excursion.
353
This content downloaded from 169.229.32.136 on Wed, 7 May 2014 19:21:38 PMAll use subject to JSTOR Terms and Conditions

Determinants of bioeconomics
(a)
I. r _
0~ ~ ~ ~ ~ ~ ~ ~
(b)
60-
50-
-0: -0 :: . :I. -* ::: : 0 ::00 :0 000 00 0 00 : ,w . ,
1 11
I to I I 1
00 .0 0 ?
*0 00? 00 0000.000 0000 0???
?? ?? ~?
I? I? I I? I? I? I? I? I? I? li
0 2 4 6 8 10 12 14 16 18
FIG. 4. Global (histogram) and mean individual (dots) distribution of t for (a) A. gemmata, (b) A. brevispinosa, and (c) A. granulata from the DS study. t values close to 0 indicate a perfect homing performance, while values close to 2 indicate a dispersive pattern (see the text for further details).
354
80-
70-
60-
50-
40-
30
20
10
70-
40
30
20
10
0 I I I I I I I I I I I I I I I
0 0 00 00 -0e 00 * 0 0 0 0 -0 0 0
a 0 0 0
0 0l >1 C)
tT Q) :3 o-
I
35(
2(
I (
This content downloaded from 169.229.32.136 on Wed, 7 May 2014 19:21:38 PMAll use subject to JSTOR Terms and Conditions
S. FOCARDI AND G. CHELAZZI
5u- (a) 30 -
MO - H I 1 20-
10- 10-
-F 0
- (ci
(b)
0-2 0-4 0-6 0' 8 1-0 TMD
30-
20-
10-
0 0-2 0-4 0-6 08 TMD
1.0
FIG. 5. TMD distributions for (a) A. gemmata, (b) A. brevispinosa, and (c) A. granulata from the CS study.
60 - (a) 60- (b)
40 1 40-
20- 20-
o.n 0 0 ., [ - 0 ,_- 7
_
-_ >,
a)
IL 6
4
2
1 2 3 4 >5 Activity phases
U- c )
0-
0-
0-
n F-F 1 2 3 4 >5
Activity phases
FIG. 6. Distribution of times of non-interrupted residence in the same scar for (a) A. gemmata, (b) A. brevispinosa, and (c) A. granulata.
50
40
LL
355
7 I- 3 __
2
I
i I iii ii
I - n
This content downloaded from 169.229.32.136 on Wed, 7 May 2014 19:21:38 PMAll use subject to JSTOR Terms and Conditions

Determinants of bioeconomics
1.0- (a)
0 6 - 0-6-
02- 0-6- (b)
-0-2- 0-2-
a)
0
S -0'4- -0-2-
0- 2 - o _ 3
0I. 02 04 0.6 0-8 1-0 Path fractions
- (c)
0-2-
0 ---- .-? 4- - 0- - -
_Multivariate an_alysis of the CS data
are signifI different in the t001. One of the two
0-rmnn fnto acus r h 0.2
0 0a2 0.4 0-6 0O8 10 Path fractions
FIG. 7. Segmental homeward component of path orientation for (a) A. gemmata, (b) A. brevispinosa, and (c) A. granulata. The total path length is set equal to one (CS study).
In synthesis, the two East African species show a distinct triphasic activity pattern (fast outward movement, slow locomotion during feeding, fast homing), while the Caribbean species exhibits a monophasic pattern, with continuous mingling of locomotion and feeding, mostly exempt from homing behaviour.
Multivariate analysis of the CS data The preceding analysis reveals a systematic difference in the behaviour of the three
species. In particular the behaviour of A. brevispinosa often appears intermediate between that of the other two chitons. In order to assess which are the most critical parameters in determining the observed interspecific ethological differences we performed a discrimi- nant analysis between the three species based on the CS parameters. In this analysis path orientation (A) was replaced by its cosine (CA) in order to avoid comparing a circular variable to linear ones.
As the comparison is between three groups, two uncorrelated discriminant functions can be computed which maximize the ratio of inter- to intra-species sums of squares. The two discriminant functions account for the 87-1% of the total variance, and their means are significantly different in the three species (x2= 3689, P < 0001). One of the two discriminant functions accounts for the 92-9% of the explained variance, the other for the
356
This content downloaded from 169.229.32.136 on Wed, 7 May 2014 19:21:38 PMAll use subject to JSTOR Terms and Conditions

S. FOCARDI AND G. CHELAZZI
150- (a)
100-
}0 I ' i\
I I I I l
(b)
i 4
i
50-
50- (c)
I I i i i I I i I I 0 0-2 0-4 0-6
Path fractions 0.8 1.0
FIG. 8. Segmental speed of locomotion for (a) A. gemmata, (b) A. brevispinosa, and (c) A. granulata. The total path length is set equal to one (CS study).
TABLE 3. Within-species correlations between discriminant variables of CS data and canonical discriminant functions. For the variables' symbols see the text
Variable Function 1 Function 2
V -0-698 0-415 RHE 0-648 0-418 L -0-461 0-423 CA 0-326 0.091 TMD 0-224 0-655 MD -0-406 0-514 T 0-092 -0-369
71%, but this second function also significantly discriminates between the three species (X2=41-9, P< 0001). How much each original variable contributes to the different discriminant functions is reported in Table 3. Variables playing a more relevant role in between-species discrimination are V, RHE, L and CA. The temporal variables (T and TMD) play a minor role and contribute mainly to the second discriminant function.
50-
_r E
-- 100- -o a (n
357
I
This content downloaded from 169.229.32.136 on Wed, 7 May 2014 19:21:38 PMAll use subject to JSTOR Terms and Conditions
Determinants of bioeconomics
A. gemmata A. granulata 4-
0-
-4- A. brevispinosa
-8- I , I , I I I I
-8 -4 0 4 8
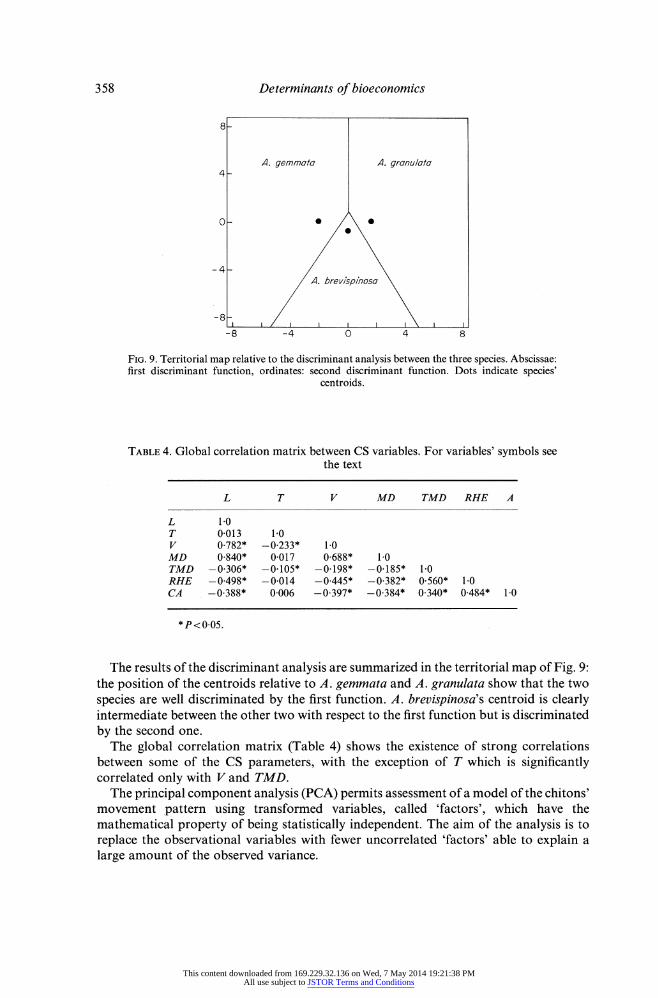
FIG. 9. Territorial map relative to the discriminant analysis between the three species. Abscissae: first discriminant function, ordinates: second discriminant function. Dots indicate species'
centroids.
TABLE 4. Global correlation matrix between CS variables. For variables' symbols see the text
L T V MD TMD RHE A
L 1-0 T 0-013 1'0 V 0-782* -0-233* 1'0 MD 0-840* 0-017 0-688* 1-0 TMD -0-306* -0-105* - 0-198* -0-185* 1-0 RHE -0-498* -0-014 -0-445* -0-382* 0-560* 1-0 CA -0-388* 0-006 -0-397* -0-384* 0-340* 0-484* 1-0
*P < 0-05.
The results of the discriminant analysis are summarized in the territorial map of Fig. 9: the position of the centroids relative to A. gemmata and A. granulata show that the two species are well discriminated by the first function. A. brevispinosa's centroid is clearly intermediate between the other two with respect to the first function but is discriminated by the second one.
The global correlation matrix (Table 4) shows the existence of strong correlations between some of the CS parameters, with the exception of T which is significantly correlated only with V and TMD.
The principal component analysis (PCA) permits assessment of a model of the chitons' movement pattern using transformed variables, called 'factors', which have the mathematical property of being statistically independent. The aim of the analysis is to replace the observational variables with fewer uncorrelated 'factors' able to explain a large amount of the observed variance.
358
This content downloaded from 169.229.32.136 on Wed, 7 May 2014 19:21:38 PMAll use subject to JSTOR Terms and Conditions

S. FOCARDI AND G. CHELAZZI 359
4-
3-
c- . 2-
I-
2 3 4 5 6 7 Factors
FIG. 10. Amount of normalized variance explained by each of the seven factors.
TABLE 5. Rotated factors loadings in the principal component analysis of CS data. For variables' symbols see the text
Factor 1 Factor 2
V 0-915 - 0004 L 0-892 -0-2 MD 0-862 -01 TMD -0-184 0-804 T -0-3 -0-524 RHE -0-492 0-663 CA -0-479 0-488
We first transformed the seven original variables into the same number of independent factors. Clearly these factors can explain the observed variance in toto. In order to obtain comparable results, parameter variances have been normalized (i.e. each variance has been set equal to 1 and the global one to 7). Figure 10 graphically shows the amount of total variance which can be explained by each factor: three factors explain practically no variance, two an amount of variance smaller than one while the remaining two explain 66% of the variance.
Table 5 reports the composition of the two main factors in terms of the original variables. The factors have been rotated to minimize the number of variables with high loadings on each of them. Factor one, accounting for about half of the whole variance, is mainly composed of spatial parameters (L and MD) and by V, while factor two refers to temporal parameters (T and TMD). The orientation of feeding excursion (CA) and the homing error (RHE) contributes to both factors.
The two independent factors revealed by the PCA have a direct ecological significance: the first is related to the spatial distribution of resources and the second reflects the temporal constraints.
This content downloaded from 169.229.32.136 on Wed, 7 May 2014 19:21:38 PMAll use subject to JSTOR Terms and Conditions

Determinants of bioeconomics
DISCUSSION
The combined use of discrete position sampling and continuous path recording proved to be a powerful tool in assessing the bioeconomics of the three chiton species. The two techniques are complementary, in that they provide a full description of individual exploitation of each activity phase (LED-tracking) and of long-term foraging organiza- tion (triangulation). The shortcomings of each method are compensated for when used together: CS cannot be easily applied for long time on a large number of animals while DS, besides underestimating actual displacements, must be properly scheduled on the basis of CS information in order to obtain data on both rest and feeding sites. Moreover, due to its discontinuity, triangulation is more suitable for describing the spatial pattern of animals having a definite triphasic activity, such as the two East African species, than for the monophasic A. granulata, whose pattern requires more frequent positioning than twice a day to be satisfactorily described.
A first obvious difference between the East African A. gemmata and A. brevispinosa and the Caribbean A. granulata concerns the organization of their foraging behaviour in time. The former two species show a diel-tidal activity rhythm, limited to the nocturnal low tides. This limits the average duration of each activity phase and generates spring-neap oscillations in activity and excursion length affecting the time available for feeding during the semi-lunar period. These short- and long-term constraints depend on the tidal regime they experience in their geographical range: semi-diurnal tides with an average MHW- MLW difference of about 2-5 m. This means that their rest zone (mean-upper eulittoral) is well submerged (A. gemmata) or splashed (A. brevispinosa) at high tide and exposed during low tide. In such tidal conditions, locomotion during diurnal low tides is critical due to the risk of dehydration and overheating, while movement at high tide is probably limited by risk of predation by marine animals. On the contrary, A. granulata experiences lower tidal variations in the study area, where it is almost continuously splashed or sprayed even at low tide, so that the timing of its potential activity phase does not depend on a tidal component, and related spring-neap oscillations.
A second consequence of the different tidal regime is the amount of zonal segregation between rest and feeding areas. The two East African species show a definite land-sea orientation in their feeding excursions, while A. granulata is not vertically oriented. Due to large tidal oscillations, algal growth on the shores where the former two species live follows a large qualitative and quantitative gradient along the sea-land axis with the green and blue-green algae mostly flourishing between MSL and MLWN, just where chitons usually feed. Zonal shuttling superimposed on homing behaviour is present in other intertidal molluscs such as limpets and neritid gastropods (Chelazzi, Focardi & Deneubourg 1988) living on shores subject to large tidal excursions. On the contrary, the lower tidal oscillations in the study area of A. granulata narrows the sea-land algal distribution gradient and eliminates the need for zonal shuttling during its feeding excursions.
Each Acanthopleura species considered in this analysis alternates central place foraging with ranging movements, but they differ in the relative importance of the two patterns. Due to their morphology, homing in chitons is probably linked more to predator avoidance and resources exploitation than to the reduction of physical stresses (dehydration) allowed in limpets by the shell-substrate complementarity (Cook 1976).
A quantitative estimate of predation pressure on the three species is not available, but qualitative observations suggest that this decreases in the order A. gemmata> A.
360
This content downloaded from 169.229.32.136 on Wed, 7 May 2014 19:21:38 PMAll use subject to JSTOR Terms and Conditions

S. FOCARDI AND G. CHELAZZI
brevispinosa > A. granulata in relation to different tidal and exposure conditions. Fishes (Arothron spp.) prey on A. gemmata when it rests out of its scar during high tide, which explains the importance of the homing pattern and scar digging and defence observed in this species (Chelazzi et al. 1983). On the other hand, due to the longer feeding excursions of the two shuttler species and relative higher cost of locomotion, the 'extra-cost' related to their homing is relatively lower than in A. granulata. In these conditions a slight intrinsic benefit related to the central place strategy may be sufficient to evolve this behaviour. Such is probably the case of A. brevispinosa, whose relaxed homing is not coupled with other behavioural adaptations. The lowest degree of homing is shown by the Caribbean species which lives in the splash zone and is subject to less severe predation than the other two species.
The central place organization of foraging is more or less mingled with ranging movements in other intertidal molluscs as well which are often reported as showing 'poor homing performance' or 'statistical homing' as the limpet Acmaea digitalis (Frank 1964). But dispersive movements must not be reductively considered as due to failure of the homing mechanism; instead they have intrinsic benefits, allowing regulation of the population density and reduction of resources over-exploitation (Underwood 1979).
In synthesis, the basic ecological factors shaping the timing and spatial organization of foraging in the three populations studied are essentially tidal regime and exposure of the coast to the waves. These modify the spatial pattern of resources (feeding grounds and shelters) and stress factors (physical and biotic) which in turn must be considered as the proximate ecological factors shaping the specific behaviour.
Nevertheless, when comparing different species we must take into account the possible intraspecific behavioural variability. Some elements of the spatial behaviour of the three species are probably very stable, such as the stereotyped homing, scar digging and scar defence of A. gemmata, while others can vary between different populations of the same species. The analysis has shown the existence of individually different strategy in A. brevispinosa with respect to home fidelity or in the case of the zonal orientation of its excursions: when this species colonizes less exposed stations than those considered here, its feeding loops are not oriented along the sea-land axis. This may depend on the presence of the strong food competitor A. gemmata at lower levels of the shore (Chelazzi, Focardi & Deneubourg 1983). Moreover, in the very peculiar environment of the intertidal caves of the East African limestone coast, where the substrate is particularly smooth and strong tangential forces act on A. brevispinosa at high tide, this species reorganizes its behaviour in well-defined group resting (personal observations) never observed in the typical coast.
Behavioural variability between populations inhabiting different environments and even between adjacent subpopulations is also shown by A. granulata. For instance, the amount of homing mingled with ranging is larger in the sample observed by triangulation than in the adjacent group of chitons utilized for the LED-tracking which inhabited a steeper substrate. This agrees with Mook's (1983) finding that the homing performance of this species varies according to the exposure to wave action.
Since this variability affects groups between which the genetic flow is probably very high due to external fecundation and pelagic larvae, it must be based on some factors regulating behaviour according to the local ecology. The spatial pattern of these chitons is based minimally on specific and genetically controlled taxes with respect to such external cues as gravity or light, and mostly on their capacity to follow personal and/or conspecific trails. This capacity in chitons and gastropods must not be viewed as a deterministic and
361
This content downloaded from 169.229.32.136 on Wed, 7 May 2014 19:21:38 PMAll use subject to JSTOR Terms and Conditions
362 Determinants of bioeconomics
invariant mechanism: there is increasing evidence that it depends on the motivational state of the animal during trail-laying and trail-following (Chelazzi, Della Santina & Parpagnoli 1987).
REFERENCES
Batschelet, E. (1981). Circular Statistics in Biology. Academic Press, London. Branch, G. M. (1971). The ecology of Patella L. from the Cape Peninsula, South Africa. 1. Zonation, movements
and feeding. Zoologica Africana, 6, 1-38. Branch, G. M. (1975). Intraspecific competition in Patella cochlear Born. Journal of Animal Ecology, 44, 263-
282. Bree, P. J. H. (1959). Homing-gedrag van Patella vulgata L. Verslagen van de gewone vergadering der Afdeeling
natuurkunde K. Nederlandse Akademie van wetenschappen, 68, 106-108. Chelazzi, G., Della Santina, P. & Parpagnoli, D. (1987). Trail following in the chiton Acanthopleura gemmata:
operational and ecological problems. Marine Biology, 95, 539-545. Chelazzi, G., Focardi, S. & Deneubourg, J. L. (1983). A comparative study on the movement patterns of two
sympatric tropical chitons (Mollusca: Polyplacophora). Marine Biology, 74, 115-125. Chelazzi, G., Focardi, S. & Deneubourg, J. L. (1988). Analysis of movement patterns and orientation
mechanisms in intertidal chitons and gastropods. Behavioural Adaptations to Intertidal Life (Ed. by G. Chelazzi & M. Vannini) pp. clxxiii-clxxxiv. NATO ASI Series A vol. 151. Plenum Press, New York.
Chelazzi, G., Focardi, S., Deneubourg, J. L. & Innocenti, R. (1983). Competition for the home and aggressive behaviour in the chiton Acanthopleura gemmata Blainville (Mollusca: Polyplacophora). Behavioral Ecology and Sociobiology, 14, 15-20.
Chelazzi, G, Innocenti, R. & Della Santina, P. (1983). Zonal migration and trail following of an intertidal gastropod analyzed by LED-tracking in the field. Marine Behaviour and Physiology, 10, 121-136.
Chelazzi, G. & Parpagnoli, D. (1987). Behavioural responses to crowding modification and home intrusion in Acanthopleura gemmata (Mollusca, Polyplacophora). Ethology, 75, 109-118.
Cook, S. B. (1976). The role of the 'home scar' in pulmonate limpets. Bulletin of the American Malacological Union, 1976, 34-37.
Cook, A., Bamford, O. S., Freeman, J. D. B. & Teidman, D.J. (1969). A study on the homing habit of the limpet. Animal Behaviour, 17, 330-339.
Creese, R. G. (1980). An analysis of distribution and abundance of populations of the high-shore limpet Notoacmaea petterdi (Tenison-Woods). Oecologia, 45, 252-260.
Frank, P. W. (1964). On home range of limpets. American Naturalist, 98, 99-104. Glynn P.W. (1970). On the ecology of the Caribbean chiton Acanthopleura granulata Gmelin and Chiton
tuberculatus L.: density, mortality, feding reproduction and growth. Smithsonian Contribution to Zoology, 66, 1-21.
Hewatt, W. G. (1940). Observations on the homing limpet Acmaea scabra Gould. American Midland Naturalist, 24, 205-208.
Lewis, J.B. (1960). The coral reef and coral communities of Barbados, West Indies. Canadian Journal of Zoology, 38, 1133-1145.
McQuaid, C. D. (1981). The establishment and maintenance of vertical size gradient in populations of Littorina africana knysnaensis (Philippi) on an exposed rocky shore. Journal of Experimental Marine Biology and Ecology, 54, 77-89.
Mook, D. (1983). Homing in the West Indian chiton Acanthopleura granulata Gmelin, 1791. Veliger, 26, 101- 105.
Petraitis, P. S. (1982). Occurrence of random and directional movements in the periwinkle Littorina littorea (L.). Journal of Experimental Marine Biology and Ecology, 59, 207-217.
Stimson, J. (1970). Territorial behaviour of the owl limpet, Lottia gigantea. Ecology, 51, 113-118. Underwood, A. J. (1977). Movements of intertidal gastropods. Journal of Experimental Marine Biology and
Ecology, 26, 191-201. Underwood, A. J. (1979). The ecology of intertidal gastropods. Advances in Marine Biology, 16, 111-210.
(Received 27 June 1989)
This content downloaded from 169.229.32.136 on Wed, 7 May 2014 19:21:38 PMAll use subject to JSTOR Terms and Conditions