ecological correlates and determinants in the geographical variation of deer morphology
TRANSCRIPT
Oecologia (2012) 169:981–994
DOI 10.1007/s00442-012-2270-7POPULATION ECOLOGY - ORIGINAL RESEARCH
Ecological correlates and determinants in the geographical variation of deer morphology
Chisato Terada · Shirow Tatsuzawa · Takashi Saitoh
Received: 24 January 2011 / Accepted: 23 January 2012 / Published online: 11 February 2012© Springer-Verlag 2012
Abstract Previous studies on patterns in ungulate sizevariations have emphasized the eVect of a particular envi-ronmental factor such as Bergmann’s rule and the islandrule. However, although multiple environmental factorsmay inXuence the body size, these studies focused on a sin-gle factor, and various measurements that may be inXu-enced by diVerent environmental factors (at least partly)were used as indices of body size. In this study, we usedseveral skull and limb measurements to examine size varia-tions among island populations of sika deer (Cervus nip-pon) in southern Japan considering the eVects of multipleenvironmental factors. We found that all measurementsdiVered markedly between populations. We focused on theskull and limb condylobasal length (CBL) and metacarpallength because they had the most important variationsamong the populations and the largest sample sizes. Thecommon environmental factors inXuencing CBL and meta-carpal length were island area and precipitation. Since theseenvironmental factors reXect the availability of food
resources, the causal factor of body size variation may befood resources. Interpopulation variation in metacarpallength was greater than that of CBL, indicating that meta-carpal length may be aVected by additional factors besidesthe common factors shared with CBL. SpeciWc environ-mental factors inXuencing relative (CBL adjusted) metacar-pal length were precipitation and slope. A common directcause of those environmental factors was discussed in rela-tion to topography. Analyses of phenotypic variation usingmultiple measurements with multiple environmental factorsare useful to gain insight into underlying causes and canlead to identiWcation of a measurement-speciWc variationwith a speciWc driving force.
Keywords Cervus nippon · Metacarpal length · Condylobasal length · Bergmann’s rule · Island rule
Introduction
Geographic variations in morphological traits within a spe-cies in relation to environmental factors have long inter-ested biologists. Darwin’s observation of the Wnches in theGalapagos archipelagos was one of the Wrst attempts toexplain morphological variations by natural selection(Darwin 1859), and they have been caused by diVerences infood resources between the islands (Grant et al. 1976;Grant 1986). Morphological divergence among related spe-cies or populations in relation to environmental factors pro-vides insight into natural selection, and thus the process ofspeciation (Mayr 1963).
Artiodactyla species, which are widely distributed, havelarge geographic variations. A greater understanding of theunderlying variation constraints may provide insight intothe interaction between ecology and microevolutionary
Communicated by Jean-Michel Gaillard.
Electronic supplementary material The online version of this article (doi:10.1007/s00442-012-2270-7) contains supplementary material, which is available to authorized users.
C. Terada (&) · T. SaitohGraduate School of Environmental Science, Hokkaido University, North 9, West 9, Sapporo 060-0809, Japane-mail: [email protected]
S. TatsuzawaResearch Group of Regional Science, Graduate School of Letters, Hokkaido University, North 10, West 7, Sapporo 060-0810, Japan
T. SaitohField Science Center, Hokkaido University, North 11, West 10, Sapporo 060-0811, Japan
123

982 Oecologia (2012) 169:981–994
processes. One of the most general and investigated pat-terns in Artiodactyla is the relationship between body sizevariations and environmental gradients. Bergmann’s rule,which states that body size increases with increasing lati-tudes, is a well-known pattern (Ashton et al. 2000; Meiriand Dayan 2003). The island rule is also well known, stat-ing that Artiodactyla body size on a small island tends to besmaller than on larger islands (Foster 1964; Heaney 1978;Lomolino 2005). A relationship between precipitation andbody size has been found in arid areas, with body size beingpositively related to precipitation (Capellini and Gosling2007). Body size variations are also explained by foodavailability and energy during periods of growth (Case1978; Geist 1987; Wolverton et al. 2009). These body sizevariations may have occurred over long periods of time.Changes, however, can also occur over short periods oftime in relation to population density, which has a negativeimpact on body size (Toïgo et al. 2006; Bonenfant et al.2009).
In this study, we focused on the sika deer (Cervus nip-pon) in the southern part of the Japanese archipelago. Thesika deer is widely distributed throughout eastern andnortheastern Asia, from the Ussuri region of Siberia tonorthern Vietnam, Taiwan, and Japan (Ohtaishi 1986;Whitehead 1993). Since sika deer have a high level of mor-phological/geographical variation, they are classiWed into14 subspecies based on body size, antler size, and pelagecolor (Ohtaishi 1986). Although the southern parts of theJapanese archipelago are small compared to the distributionrange of the deer, Wve subspecies inhabit this compact area.Thus, large morphological variations are likely to occur inrelation to environmental factors in this compact area.
Based on the above previous studies, we can make thefollowing predictions: (1) sika deer body size increaseswith increasing latitude, thus increasing in colder environ-ments based on Bergmann’s rule; (2) body size on a smallisland tends to be smaller than on large islands based on theisland rule; (3) body size is not related to precipitationbecause this study area is not arid; (4) body size is posi-tively related to food productivity; and (5) body size is neg-atively related to population density.
Bergmann’s rule describes body size variation patternsbased on the latitudinal gradient. The diVerence associatedwith latitude may also be related to temperature, and thuslatitude is used as a proxy of temperature. Meanwhile, theisland rule explains variation based on the island area.However, these rules do not exclude other eVects. Sizepatterns can covary with multiple factors (Romano andFicetola 2010). When multiple factors are selected asexplanatory variables for body size variation, we may gaininsight into the underlying cause of the variation. Mostexplanatory variables (environmental factors) may indi-rectly inXuence body size. Thus, a direct cause of body size
covariation with multiple environmental factors may exist.For example, some environmental factors are connectedwith food availability (McNab 2010), even though otherdirect causes likely exist. Temperature may inXuence theheat dissipation and conservation of animals and the pri-mary production of food resources, while island area mayinXuence predator fauna and food resources. If both tem-perature and island area are selected, we could extract foodresources as a notable direct cause of body size variation.Thus, comprehensive studies that simultaneously analyzemultiple factors are required. However, such studies havenot been performed for ungulates (see the following studiesfor other taxonomic groups: Yom-Tov and GeVen 2006;Meiri et al. 2007; Blois et al. 2008; Romano and Ficetola2010).
In ungulates, several traits have been used as indices ofbody size, including body mass, skull length, tooth mea-surements, and limb length (Klein 1964; Janis 1990; Scott1990; Meiri and Dayan 2003). Body mass, tooth measure-ment (i.e., tooth row or molar size), and skull length havebeen used to examine Bergmann’s rule and the island rule(Ashton et al. 2000; Meiri et al. 2006), while variations inhind foot length were used to explain the eVects of short-term changes in nutrition (Klein 1964; Toïgo et al. 2006;Zannèse et al. 2006; Wolverton et al. 2009; Garel et al.2010). Measurements used as an index of body size may beinXuenced by common and measurement-speciWc environ-mental factors (Lomolino 2005), and analyses using multi-ple measurements may lead to the discovery ofmeasurement-speciWc variations produced by a speciWcdriving force.
We focused on limb length variation in order to analyzethe relationship between common and measurement-spe-ciWc variation. Phenomena involving variations on limbmorphology in Artiodactyla are separated into two majorcategories: regular allometric changes correlated withincreasing size, and deviations from the regular scalingrelated to particular habitats, i.e., species inhabiting moun-tainous habitats have shorter limbs than species in Xat habi-tats (Scott 1985, 1987). Island topologies in this study areavary and the study populations have been isolated for anextended period of time. Thus, limb length variationsamong populations are expected to have high measure-ment-speciWc variations. Based on these points, we pre-dicted that: (6) limb length has a common variation sharedwith other measurements correlated with body size and ameasurement-speciWc variation, which can be explained byisland topology.
In this study, we provide a comprehensive analysis ofsize variations among island populations of sika deer usingseveral measurements and multiple environmental factorsto test the above six predictions. First, we evaluated therelationship between body size variation and each environ-
123
Oecologia (2012) 169:981–994 983
mental factor that could explain the size variations. Second,we analyzed body size variation with multiple factors.Lastly, we examined measurement-speciWc variations andtheir determinant environmental factors focusing on limblength.
Materials and methods
Study areas and samples
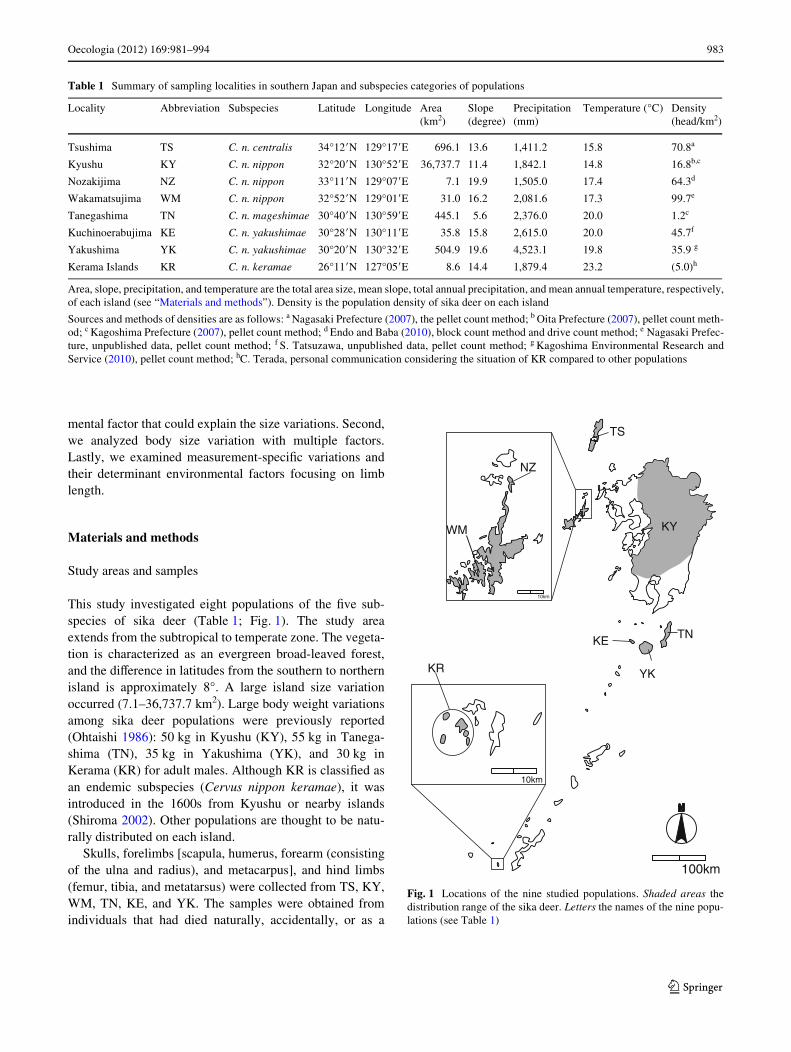
This study investigated eight populations of the Wve sub-species of sika deer (Table 1; Fig. 1). The study areaextends from the subtropical to temperate zone. The vegeta-tion is characterized as an evergreen broad-leaved forest,and the diVerence in latitudes from the southern to northernisland is approximately 8°. A large island size variationoccurred (7.1–36,737.7 km2). Large body weight variationsamong sika deer populations were previously reported(Ohtaishi 1986): 50 kg in Kyushu (KY), 55 kg in Tanega-shima (TN), 35 kg in Yakushima (YK), and 30 kg inKerama (KR) for adult males. Although KR is classiWed asan endemic subspecies (Cervus nippon keramae), it wasintroduced in the 1600s from Kyushu or nearby islands(Shiroma 2002). Other populations are thought to be natu-rally distributed on each island.
Skulls, forelimbs [scapula, humerus, forearm (consistingof the ulna and radius), and metacarpus], and hind limbs(femur, tibia, and metatarsus) were collected from TS, KY,WM, TN, KE, and YK. The samples were obtained fromindividuals that had died naturally, accidentally, or as a
Table 1 Summary of sampling localities in southern Japan and subspecies categories of populations
Area, slope, precipitation, and temperature are the total area size, mean slope, total annual precipitation, and mean annual temperature, respectively,of each island (see “Materials and methods”). Density is the population density of sika deer on each island
Sources and methods of densities are as follows: a Nagasaki Prefecture (2007), the pellet count method; b Oita Prefecture (2007), pellet count meth-od; c Kagoshima Prefecture (2007), pellet count method; d Endo and Baba (2010), block count method and drive count method; e Nagasaki Prefec-ture, unpublished data, pellet count method; f S. Tatsuzawa, unpublished data, pellet count method; g Kagoshima Environmental Research andService (2010), pellet count method; hC. Terada, personal communication considering the situation of KR compared to other populations
Locality Abbreviation Subspecies Latitude Longitude Area (km2)
Slope (degree)
Precipitation (mm)
Temperature (°C) Density (head/km2)
Tsushima TS C. n. centralis 34°12�N 129°17�E 696.1 13.6 1,411.2 15.8 70.8a
Kyushu KY C. n. nippon 32°20�N 130°52�E 36,737.7 11.4 1,842.1 14.8 16.8b,c
Nozakijima NZ C. n. nippon 33°11�N 129°07�E 7.1 19.9 1,505.0 17.4 64.3d
Wakamatsujima WM C. n. nippon 32°52�N 129°01�E 31.0 16.2 2,081.6 17.3 99.7e
Tanegashima TN C. n. mageshimae 30°40�N 130°59�E 445.1 5.6 2,376.0 20.0 1.2c
Kuchinoerabujima KE C. n. yakushimae 30°28�N 130°11�E 35.8 15.8 2,615.0 20.0 45.7f
Yakushima YK C. n. yakushimae 30°20�N 130°32�E 504.9 19.6 4,523.1 19.8 35.9 g
Kerama Islands KR C. n. keramae 26°11�N 127°05�E 8.6 14.4 1,879.4 23.2 (5.0)h
Fig. 1 Locations of the nine studied populations. Shaded areas thedistribution range of the sika deer. Letters the names of the nine popu-lations (see Table 1)
100km
TS
10km
KE TN
YK
NZ
WM
KR
KY
10km
123
984 Oecologia (2012) 169:981–994
result of culling and hunting from 2007 to 2009. Specimensfrom NZ and KR were obtained from the Kita-KyushuMuseum of Natural History and Human History, andRyukyu University, respectively. Sample sizes were diVer-ent among populations with respect to each measurementand the sexes [see Electronic supplementary materials(ESM), Table S1].
Measurements
Although mass is the most common index of body size, itoften varies greatly depending on the seasonal and dailyevents aVecting an individual. Conversely, measurementsof skulls, teeth, and other bones are stable after individualsreach maturity and have been used in many previous stud-ies to explore geographical variations among ungulate pop-ulations (e.g., Lister 1989; Smith et al. 2002; Raia andMeiri 2006; Capellini and Gosling 2007). Therefore, cond-ylobasal length (CBL), length of the upper tooth row(UTR), and the greatest lengths of forelimb bones (i.e.,scapula, humerus, forearm, and metacarpus) and hind limbbones (i.e., femur, tibia, and metatarsus) were used as sizeindices in this study. The methods for measuring skulls andlimb bones followed those of von den Driesch (1976). Allsamples were measured by the senior author, and all traitswere measured once. To assess measurement errors, weselectively measured 30 samples for nine measurements induplicate. Repeatability for all measurements was assessedby the method of Lessells and Boag (1987), and these val-ues were above 0.99. Only samples with completed skeletalgrowth, which were recognized by eruption of the thirdmolar (von den Driesch 1976; Ohtaishi 1980), wereincluded in analyses. To examine diVerences in measure-ments between natural and accidental deaths, skeletal sizeswere compared using KE male samples; as few sampleshad experienced natural deaths, statistical comparisonswere not possible for other populations. No signiWcantdiVerences were observed between natural and accidentaldeaths in any measurement (t test, P > 0.23; data notshown). Thus, diVerences between the causes of death werenot considered in our analyses. Measurements were takenwith digital calipers to 0.01 mm precision. Although mea-surements were taken from left-side points when possible,right-side points were used when left-side samples were inpoor condition. Fractured or deformed bones were excludedfrom the analyses.
Environmental variables
We examined most factors that may be associated with sizevariations among ungulate populations, including sex,mean annual temperature, annual precipitation, latitude,island area, island topography, population density, and nor-
malized diVerence vegetation index (NDVI) as an index offood availability. Except at Kuchinoerabujima (KE), themean annual temperatures and total annual precipitationbetween 2001 and 2010 were obtained from the website ofthe Japan Meteorological Agency (http://www.jma.go.jp/jma/index.html). Since no weather information was avail-able for KE in the database, the mean annual temperaturewas estimated based on data from a thermometer screen onKE from November 2010 to May 2011, which was pro-vided by an elementary school on KE. We estimatedmonthly temperatures from June to October on KE using amultiple linear regression model with monthly mean tem-peratures on neighboring islands (YK and TN). Data onannual precipitation from 2001 to 2010 in KE wereobtained from Kagoshima Prefecture (unpublished data).The latitude and longitude of each island were deWned asthose of the central location.
We included the mean slope of the island as an index oftopography. To calculate these values, we Wrst sampled thealtitudinal value of each 100 £ 100-m grid from a 10 £ 10-mdigital elevation model (DEM; Geospatial InformationAuthority of Japan). This 100 £ 100-m grid was adoptedconsidering the home range size of sika deer in this studyarea (between 3.0 and 3.6 ha on NZ) (Endo and Doi 1996).Second, we calculated an angle of slope from the maximumvalue of the diVerence in elevation between each grid andits eight neighbor grids. Finally, the slope values of all gridswere averaged for each island. All geographical calcula-tions were conducted using a geographical information sys-tem (ArcGIS10.0; ESRI, Redlands, CA, USA, 2010) andspatial analyst tool.
The densities of sika deer in each population wereobtained from wildlife conservation and management plansestablished by local governments (Table 1). Since data onthe population density of KR were not available, weassumed the density based on the situation of KR comparedto other populations.
Since the NDVI (an index of absorbed photosyntheti-cally active radiation) is thought to correlate with above-ground net primary productivity (Pettorelli et al. 2005), weused the NDVI as an index of food availability. Weobtained NDVI data between 2005 and 2010 from theTerra/MODIS 250 m monthly composite NDVI data setprovided by the collaborative project of the GeospatialInformation Authority of Japan and Tokai University (http://www1.gsi.go.jp/geowww/EODAS/ndvi-download.html).The slopes of NDVI from March to May and the average ofNDVI in May were assessed because spring vegetationconditions aVect the body mass of deer (HerWndal et al.2006; Pettorelli et al. 2006). The integrated NDVI values(INDVI), which correspond to the sum of the NDVI valuesover the growing season were also calculated (Pettorelliet al. 2005). No diVerences were detected in the slopes
123
Oecologia (2012) 169:981–994 985
between islands. NDVI in May was highly correlated withINDVI (F1,16 = 13.14, R2 = 0.68, P = 0.01). Therefore, weused INDVI in the following analyses.
Statistical analysis
To examine whether morphological variations occurredbetween populations, two-way ANOVAs were performed.Populations consisting of only male or female sampleswere excluded from the ANOVAs (see ESM, Table S1).Since sika deer exhibit sexual dimorphism in size (Ochiaiand Asada 1995; Yokoyama 2009), we considered popula-tion, sex, and their interaction as factors. The variable mea-surements (CBL and metacarpal length) betweenpopulations were selected from the skull and limb measure-ments based on the eVect size (partial �2) of population(see ESM, Table S2), and are the focus of the followinganalyses.
To test predictions (1)–(5), generalized linear models(GLMs) were applied using each of the seven environmen-tal variables [temperature, latitude, area (island area), pre-cipitation, density, INDVI, and slope] and sex on CBL andmetacarpal length (see “Results”) using a normal distribu-tion with an identity link function. Means for the measure-ments of each sex for each population were log10-transformed and used as the response variables, weightingthem with the inverse of those variances to account fordiVerences in sample size. Precipitation and area werelog10 -transformed, as their distributions appeared log-normal rather than normal.
To examine whether multiple environmental factorsaVect CBL or metacarpal length, GLMs were appliedincluding all environmental variables. Before the GLMs,the variance inXation factor (VIF) was calculated for eachexplanatory variable to examine multicollinearity. Vari-ables with a high VIF (>10) were likely to cause multicol-linearity problems. Temperature, latitude, and density werehighly correlated. To maintain a low VIF (<10), latitudeand density were removed from the explanatory variablesfor the following reasons. Latitude has been used as a proxyof temperature and was closely related to temperature(F1,7 = 44.97, R2 = 0.90, P = 0.0003). The reliability of thepopulation density estimation for each island was lowerthan that of the meteorological data because temperatureswere obtained by the standardized methods of the JapanMeteorological Agency, except at KE, while densities wereestimated by diVerent researchers using various methods indiVerent seasons. Therefore, we used six variables (sex,temperature, area, precipitation, INDVI, and slope) asexplanatory variables in the GLMs. Model selections wereperformed based on an information theoretic approachusing Akaike’s information criterion (AIC; Burnham andAnderson 2002). AIC values and Akaike weights were
computed for all alternatives and compared to select anadequate model. According to the principal of parsimony,when alternative models had indistinguishable AIC values(�AIC < 2), a model with fewer parameters was selected(Burnham and Anderson 2002). To compare the relativeimportance of environmental eVects on CBL and metacar-pal length, standardized partial regression coeYcients (�)were calculated for continuous variables.
To distinguish measurement-speciWc variation fromcommon variation shared with other measurements, wecompared population variations between measurements. Ameasurement with higher measurement-speciWc variationmay show higher interpopulation variation. Therefore,measurement (metacarpal length) which had the highestvariation among populations was focused (see “Results”)and was used to test prediction (6). We assumed an allome-tric relationship between CBL and metacarpal length:Y = aXb, where X is CBL and Y is metacarpal length. Thevariables were log10 transformed (log10Y = blog10X + a).An ANCOVA on metacarpal length, which considered pop-ulation as an explanatory variable and CBL as a covariatevariable, was performed. Bonferroni corrections were usedto adjust statistical signiWcance for multiple comparisons.The eVect sizes of CBL and population on metacarpallength were evaluated on the basis of classical �2 (Maxwellet al. 1981; Pierce et al. 2004): classical �2 = (SSfactor ¡dffactorMSerror)/(SStotal + MSerror), where SSfactor is the sum ofsquares for each factor, SStotal is the total variation, dffactor
is the degree of freedom for each factor, and MSerror is themean square of the residuals. Classical �2 is preferred tocompare the strength of the eVect size between explana-tory variables in an analysis. Prior to conductingANCOVA, we performed three-way ANOVA on meta-carpal length with CBL, sex, population and their inter-actions to determine whether sex aVected metacarpallength. Populations that had four or more specimens foreach sex were included in the three-way ANOVA (seeESM, Table S1).
To examine the eVects of environmental factors on mea-surement-speciWc variation, a GLM was applied usingintercepts of the allometric equation (a) of each populationthat had metacarpal length-speciWc variation as a responsevariable and four environmental factors (temperature, area,precipitation, INDVI, and slope) as explanatory variablesusing a normal distribution with an identity link function.The procedures of GLM applied to CBL were also used forthe intercept. Partial residual plots which illustrate the rela-tionship between an explanatory variable and the responsevariable (a) after controlling for the eVects of othervariables for the best-Wt model were presented (Fox andWeisberg 2010).
All statistical analyses were performed using R 2.14.0 (RCore Development Team, 2011).
123
986 Oecologia (2012) 169:981–994
Results
Variations in measurements
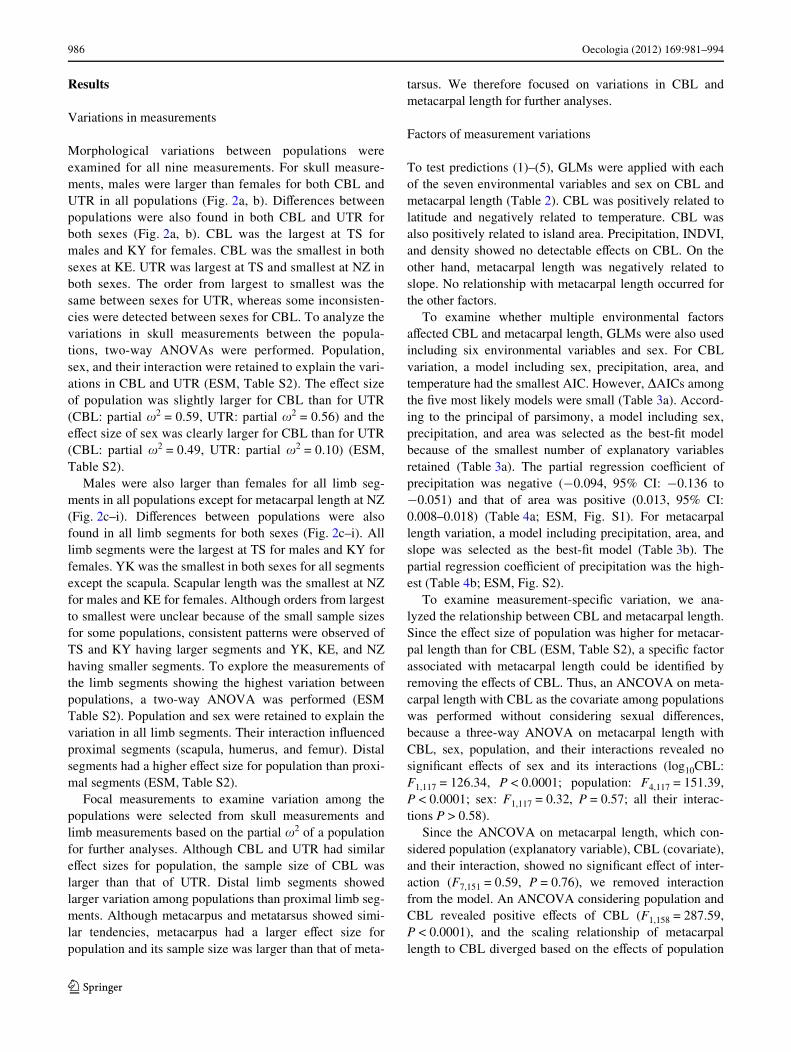
Morphological variations between populations wereexamined for all nine measurements. For skull measure-ments, males were larger than females for both CBL andUTR in all populations (Fig. 2a, b). DiVerences betweenpopulations were also found in both CBL and UTR forboth sexes (Fig. 2a, b). CBL was the largest at TS formales and KY for females. CBL was the smallest in bothsexes at KE. UTR was largest at TS and smallest at NZ inboth sexes. The order from largest to smallest was thesame between sexes for UTR, whereas some inconsisten-cies were detected between sexes for CBL. To analyze thevariations in skull measurements between the popula-tions, two-way ANOVAs were performed. Population,sex, and their interaction were retained to explain the vari-ations in CBL and UTR (ESM, Table S2). The eVect sizeof population was slightly larger for CBL than for UTR(CBL: partial �2 = 0.59, UTR: partial �2 = 0.56) and theeVect size of sex was clearly larger for CBL than for UTR(CBL: partial �2 = 0.49, UTR: partial �2 = 0.10) (ESM,Table S2).
Males were also larger than females for all limb seg-ments in all populations except for metacarpal length at NZ(Fig. 2c–i). DiVerences between populations were alsofound in all limb segments for both sexes (Fig. 2c–i). Alllimb segments were the largest at TS for males and KY forfemales. YK was the smallest in both sexes for all segmentsexcept the scapula. Scapular length was the smallest at NZfor males and KE for females. Although orders from largestto smallest were unclear because of the small sample sizesfor some populations, consistent patterns were observed ofTS and KY having larger segments and YK, KE, and NZhaving smaller segments. To explore the measurements ofthe limb segments showing the highest variation betweenpopulations, a two-way ANOVA was performed (ESMTable S2). Population and sex were retained to explain thevariation in all limb segments. Their interaction inXuencedproximal segments (scapula, humerus, and femur). Distalsegments had a higher eVect size for population than proxi-mal segments (ESM, Table S2).
Focal measurements to examine variation among thepopulations were selected from skull measurements andlimb measurements based on the partial �2 of a populationfor further analyses. Although CBL and UTR had similareVect sizes for population, the sample size of CBL waslarger than that of UTR. Distal limb segments showedlarger variation among populations than proximal limb seg-ments. Although metacarpus and metatarsus showed simi-lar tendencies, metacarpus had a larger eVect size forpopulation and its sample size was larger than that of meta-
tarsus. We therefore focused on variations in CBL andmetacarpal length for further analyses.
Factors of measurement variations
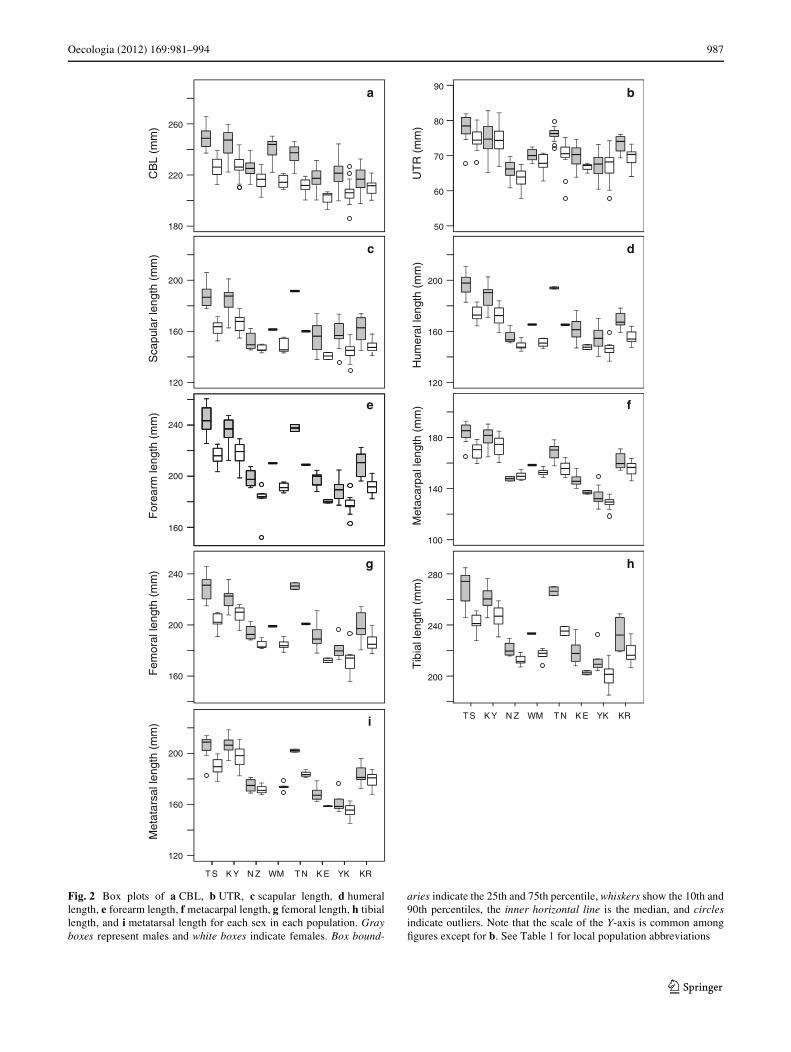
To test predictions (1)–(5), GLMs were applied with eachof the seven environmental variables and sex on CBL andmetacarpal length (Table 2). CBL was positively related tolatitude and negatively related to temperature. CBL wasalso positively related to island area. Precipitation, INDVI,and density showed no detectable eVects on CBL. On theother hand, metacarpal length was negatively related toslope. No relationship with metacarpal length occurred forthe other factors.
To examine whether multiple environmental factorsaVected CBL and metacarpal length, GLMs were also usedincluding six environmental variables and sex. For CBLvariation, a model including sex, precipitation, area, andtemperature had the smallest AIC. However, �AICs amongthe Wve most likely models were small (Table 3a). Accord-ing to the principal of parsimony, a model including sex,precipitation, and area was selected as the best-Wt modelbecause of the smallest number of explanatory variablesretained (Table 3a). The partial regression coeYcient ofprecipitation was negative (¡0.094, 95% CI: ¡0.136 to¡0.051) and that of area was positive (0.013, 95% CI:0.008–0.018) (Table 4a; ESM, Fig. S1). For metacarpallength variation, a model including precipitation, area, andslope was selected as the best-Wt model (Table 3b). Thepartial regression coeYcient of precipitation was the high-est (Table 4b; ESM, Fig. S2).
To examine measurement-speciWc variation, we ana-lyzed the relationship between CBL and metacarpal length.Since the eVect size of population was higher for metacar-pal length than for CBL (ESM, Table S2), a speciWc factorassociated with metacarpal length could be identiWed byremoving the eVects of CBL. Thus, an ANCOVA on meta-carpal length with CBL as the covariate among populationswas performed without considering sexual diVerences,because a three-way ANOVA on metacarpal length withCBL, sex, population, and their interactions revealed nosigniWcant eVects of sex and its interactions (log10CBL:F1,117 = 126.34, P < 0.0001; population: F4,117 = 151.39,P < 0.0001; sex: F1,117 = 0.32, P = 0.57; all their interac-tions P > 0.58).
Since the ANCOVA on metacarpal length, which con-sidered population (explanatory variable), CBL (covariate),and their interaction, showed no signiWcant eVect of inter-action (F7,151 = 0.59, P = 0.76), we removed interactionfrom the model. An ANCOVA considering population andCBL revealed positive eVects of CBL (F1,158 = 287.59,P < 0.0001), and the scaling relationship of metacarpallength to CBL diverged based on the eVects of population
123
Oecologia (2012) 169:981–994 987
Fig. 2 Box plots of a CBL, b UTR, c scapular length, d humerallength, e forearm length, f metacarpal length, g femoral length, h tibiallength, and i metatarsal length for each sex in each population. Grayboxes represent males and white boxes indicate females. Box bound-
aries indicate the 25th and 75th percentile, whiskers show the 10th and90th percentiles, the inner horizontal line is the median, and circlesindicate outliers. Note that the scale of the Y-axis is common amongWgures except for b. See Table 1 for local population abbreviations
180
220
260
CB
L (m
m)
UT
R (
mm
)
120
160
200
Sca
pula
r le
ngth
(m
m)
120
160
200
160
200
240
For
earm
leng
th (
mm
)
100
140
180
Met
acar
pal l
engt
h (m
m)
Fem
oral
leng
th (
mm
)
200
240
280
Tib
ial l
engt
h (m
m)
120
160
200
Met
atar
sal l
engt
h (m
m)
Hum
eral
leng
th (
mm
)
T S N Z T N YKWM
T S N Z T N YKWM
K Y K E KR
K Y K E KR
160
200
240
50
60
70
80
90ba
dc
fe
hg
i
123
988 Oecologia (2012) 169:981–994
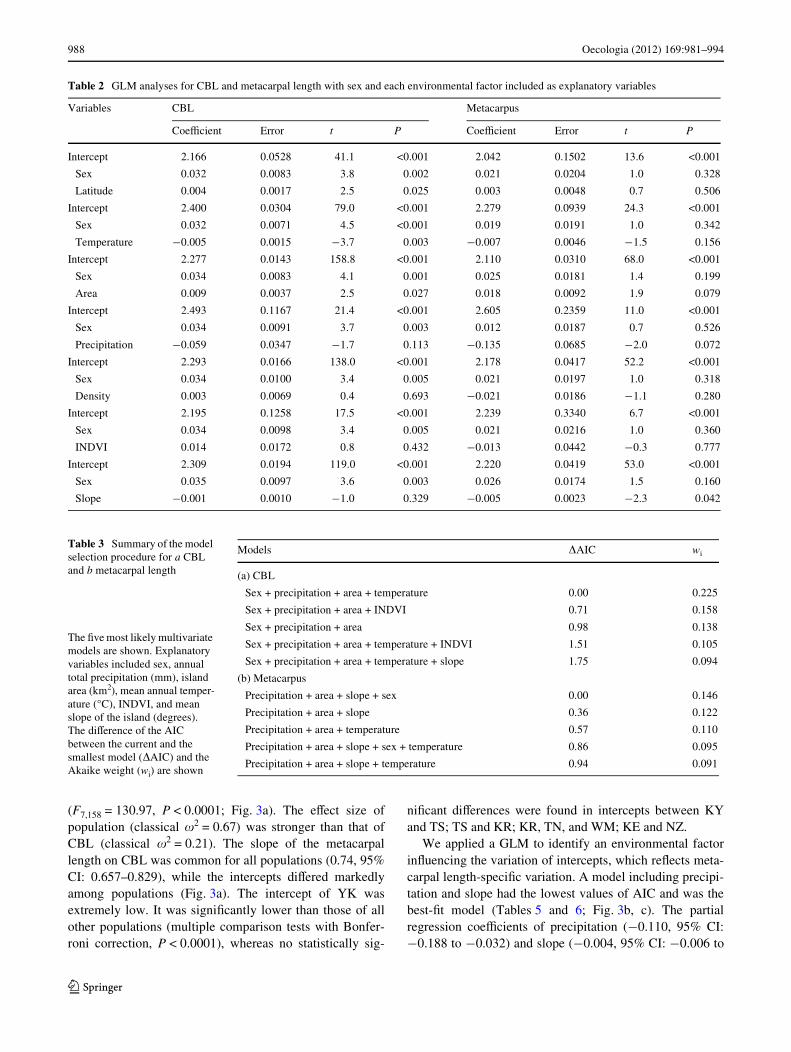
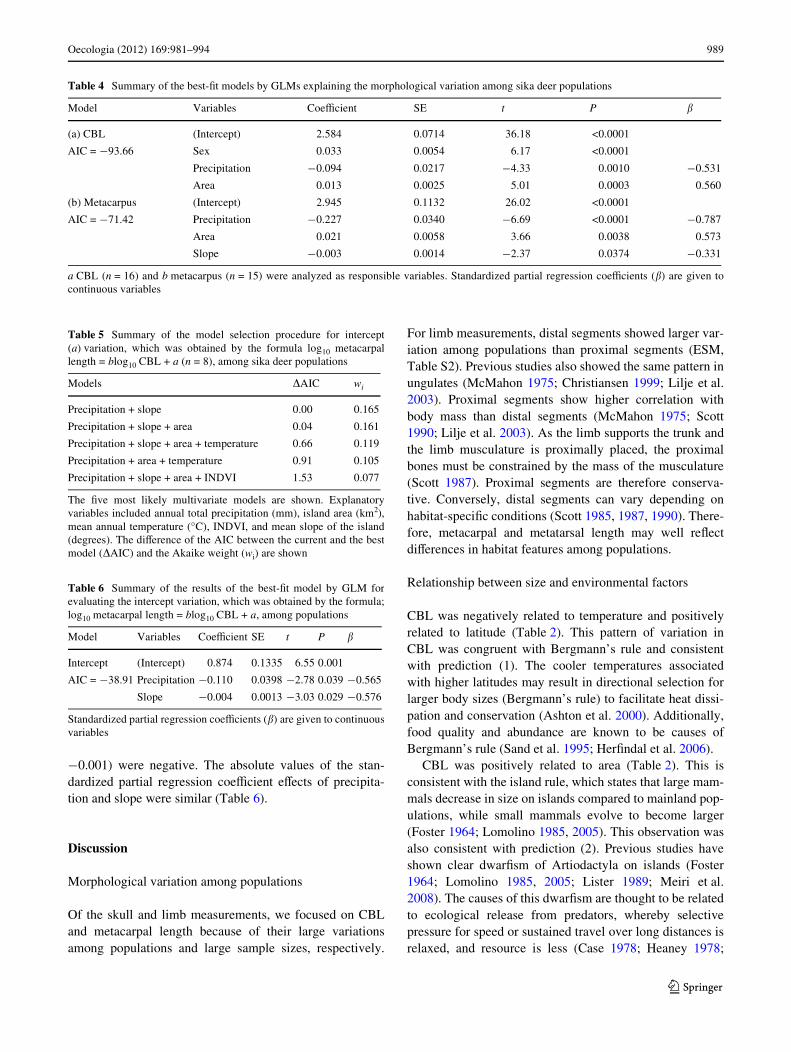
(F7,158 = 130.97, P < 0.0001; Fig. 3a). The eVect size ofpopulation (classical �2 = 0.67) was stronger than that ofCBL (classical �2 = 0.21). The slope of the metacarpallength on CBL was common for all populations (0.74, 95%CI: 0.657–0.829), while the intercepts diVered markedlyamong populations (Fig. 3a). The intercept of YK wasextremely low. It was signiWcantly lower than those of allother populations (multiple comparison tests with Bonfer-roni correction, P < 0.0001), whereas no statistically sig-
niWcant diVerences were found in intercepts between KYand TS; TS and KR; KR, TN, and WM; KE and NZ.
We applied a GLM to identify an environmental factorinXuencing the variation of intercepts, which reXects meta-carpal length-speciWc variation. A model including precipi-tation and slope had the lowest values of AIC and was thebest-Wt model (Tables 5 and 6; Fig. 3b, c). The partialregression coeYcients of precipitation (¡0.110, 95% CI:¡0.188 to ¡0.032) and slope (¡0.004, 95% CI: ¡0.006 to
Table 2 GLM analyses for CBL and metacarpal length with sex and each environmental factor included as explanatory variables
Variables CBL Metacarpus
CoeYcient Error t P CoeYcient Error t P
Intercept 2.166 0.0528 41.1 <0.001 2.042 0.1502 13.6 <0.001
Sex 0.032 0.0083 3.8 0.002 0.021 0.0204 1.0 0.328
Latitude 0.004 0.0017 2.5 0.025 0.003 0.0048 0.7 0.506
Intercept 2.400 0.0304 79.0 <0.001 2.279 0.0939 24.3 <0.001
Sex 0.032 0.0071 4.5 <0.001 0.019 0.0191 1.0 0.342
Temperature ¡0.005 0.0015 ¡3.7 0.003 ¡0.007 0.0046 ¡1.5 0.156
Intercept 2.277 0.0143 158.8 <0.001 2.110 0.0310 68.0 <0.001
Sex 0.034 0.0083 4.1 0.001 0.025 0.0181 1.4 0.199
Area 0.009 0.0037 2.5 0.027 0.018 0.0092 1.9 0.079
Intercept 2.493 0.1167 21.4 <0.001 2.605 0.2359 11.0 <0.001
Sex 0.034 0.0091 3.7 0.003 0.012 0.0187 0.7 0.526
Precipitation ¡0.059 0.0347 ¡1.7 0.113 ¡0.135 0.0685 ¡2.0 0.072
Intercept 2.293 0.0166 138.0 <0.001 2.178 0.0417 52.2 <0.001
Sex 0.034 0.0100 3.4 0.005 0.021 0.0197 1.0 0.318
Density 0.003 0.0069 0.4 0.693 ¡0.021 0.0186 ¡1.1 0.280
Intercept 2.195 0.1258 17.5 <0.001 2.239 0.3340 6.7 <0.001
Sex 0.034 0.0098 3.4 0.005 0.021 0.0216 1.0 0.360
INDVI 0.014 0.0172 0.8 0.432 ¡0.013 0.0442 ¡0.3 0.777
Intercept 2.309 0.0194 119.0 <0.001 2.220 0.0419 53.0 <0.001
Sex 0.035 0.0097 3.6 0.003 0.026 0.0174 1.5 0.160
Slope ¡0.001 0.0010 ¡1.0 0.329 ¡0.005 0.0023 ¡2.3 0.042
Table 3 Summary of the model selection procedure for a CBL and b metacarpal length
Models �AIC wi
(a) CBL
Sex + precipitation + area + temperature 0.00 0.225
Sex + precipitation + area + INDVI 0.71 0.158
Sex + precipitation + area 0.98 0.138
Sex + precipitation + area + temperature + INDVI 1.51 0.105
Sex + precipitation + area + temperature + slope 1.75 0.094
(b) Metacarpus
Precipitation + area + slope + sex 0.00 0.146
Precipitation + area + slope 0.36 0.122
Precipitation + area + temperature 0.57 0.110
Precipitation + area + slope + sex + temperature 0.86 0.095
Precipitation + area + slope + temperature 0.94 0.091
The Wve most likely multivariate models are shown. Explanatory variables included sex, annual total precipitation (mm), island area (km2), mean annual temper-ature (°C), INDVI, and mean slope of the island (degrees). The diVerence of the AIC between the current and the smallest model (�AIC) and the Akaike weight (wi) are shown
123
Oecologia (2012) 169:981–994 989
¡0.001) were negative. The absolute values of the stan-dardized partial regression coeYcient eVects of precipita-tion and slope were similar (Table 6).
Discussion
Morphological variation among populations
Of the skull and limb measurements, we focused on CBLand metacarpal length because of their large variationsamong populations and large sample sizes, respectively.
For limb measurements, distal segments showed larger var-iation among populations than proximal segments (ESM,Table S2). Previous studies also showed the same pattern inungulates (McMahon 1975; Christiansen 1999; Lilje et al.2003). Proximal segments show higher correlation withbody mass than distal segments (McMahon 1975; Scott1990; Lilje et al. 2003). As the limb supports the trunk andthe limb musculature is proximally placed, the proximalbones must be constrained by the mass of the musculature(Scott 1987). Proximal segments are therefore conserva-tive. Conversely, distal segments can vary depending onhabitat-speciWc conditions (Scott 1985, 1987, 1990). There-fore, metacarpal and metatarsal length may well reXectdiVerences in habitat features among populations.
Relationship between size and environmental factors
CBL was negatively related to temperature and positivelyrelated to latitude (Table 2). This pattern of variation inCBL was congruent with Bergmann’s rule and consistentwith prediction (1). The cooler temperatures associatedwith higher latitudes may result in directional selection forlarger body sizes (Bergmann’s rule) to facilitate heat dissi-pation and conservation (Ashton et al. 2000). Additionally,food quality and abundance are known to be causes ofBergmann’s rule (Sand et al. 1995; HerWndal et al. 2006).
CBL was positively related to area (Table 2). This isconsistent with the island rule, which states that large mam-mals decrease in size on islands compared to mainland pop-ulations, while small mammals evolve to become larger(Foster 1964; Lomolino 1985, 2005). This observation wasalso consistent with prediction (2). Previous studies haveshown clear dwarWsm of Artiodactyla on islands (Foster1964; Lomolino 1985, 2005; Lister 1989; Meiri et al.2008). The causes of this dwarWsm are thought to be relatedto ecological release from predators, whereby selectivepressure for speed or sustained travel over long distances isrelaxed, and resource is less (Case 1978; Heaney 1978;
Table 5 Summary of the model selection procedure for intercept(a) variation, which was obtained by the formula log10 metacarpallength = blog10 CBL + a (n = 8), among sika deer populations
The Wve most likely multivariate models are shown. Explanatoryvariables included annual total precipitation (mm), island area (km2),mean annual temperature (°C), INDVI, and mean slope of the island(degrees). The diVerence of the AIC between the current and the bestmodel (�AIC) and the Akaike weight (wi) are shown
Models �AIC wi
Precipitation + slope 0.00 0.165
Precipitation + slope + area 0.04 0.161
Precipitation + slope + area + temperature 0.66 0.119
Precipitation + area + temperature 0.91 0.105
Precipitation + slope + area + INDVI 1.53 0.077
Table 6 Summary of the results of the best-Wt model by GLM forevaluating the intercept variation, which was obtained by the formula;log10 metacarpal length = blog10 CBL + a, among populations
Standardized partial regression coeYcients (�) are given to continuousvariables
Model Variables CoeYcient SE t P �
Intercept (Intercept) 0.874 0.1335 6.55 0.001
AIC = ¡38.91 Precipitation ¡0.110 0.0398 ¡2.78 0.039 ¡0.565
Slope ¡0.004 0.0013 ¡3.03 0.029 ¡0.576
Table 4 Summary of the best-Wt models by GLMs explaining the morphological variation among sika deer populations
a CBL (n = 16) and b metacarpus (n = 15) were analyzed as responsible variables. Standardized partial regression coeYcients (�) are given tocontinuous variables
Model Variables CoeYcient SE t P �
(a) CBL (Intercept) 2.584 0.0714 36.18 <0.0001
AIC = ¡93.66 Sex 0.033 0.0054 6.17 <0.0001
Precipitation ¡0.094 0.0217 ¡4.33 0.0010 ¡0.531
Area 0.013 0.0025 5.01 0.0003 0.560
(b) Metacarpus (Intercept) 2.945 0.1132 26.02 <0.0001
AIC = ¡71.42 Precipitation ¡0.227 0.0340 ¡6.69 <0.0001 ¡0.787
Area 0.021 0.0058 3.66 0.0038 0.573
Slope ¡0.003 0.0014 ¡2.37 0.0374 ¡0.331
123
990 Oecologia (2012) 169:981–994
Klein et al. 1987; Lomolino 2005). However, sika deerhave no predators in the study area [Canis lupus is extincton Kyushu Island (KY), which is the largest island, and theother islands have no native predators; Ohdachi et al.2009]. Although diVerences in the degree of hunting pres-sure among populations are unknown, all sika deer popula-tions have experienced hunting pressure on the islands(except for KR) over time. If the degree of hunting pressureon each island is equal, one Wnds it diYcult to explain thecurrent size variation related to island size as being causedby ecological release from predators.
No relationship between precipitation and CBL wasdetected, as expected by prediction (3). However, the anal-
yses considering all environmental factors suggest that pre-cipitation should be considered when explaining the CBLvariation, in addition to sex, and area (Table 4a). In con-trast, temperature was not retained in the best-Wt model forexplaining the CBL variation, although temperatureshowed statistically signiWcant eVect on CBL at a singlefactor analysis (Table 2). These selected environmental fac-tors (precipitation and area) may complementary andsimultaneously aVect CBL, but the eVects of other factorsmay be limited and not be compensative.
CBL was negatively related to precipitation based on theGLM using multiple environmental factors. This patternwas opposite to that found in previous studies on mammals
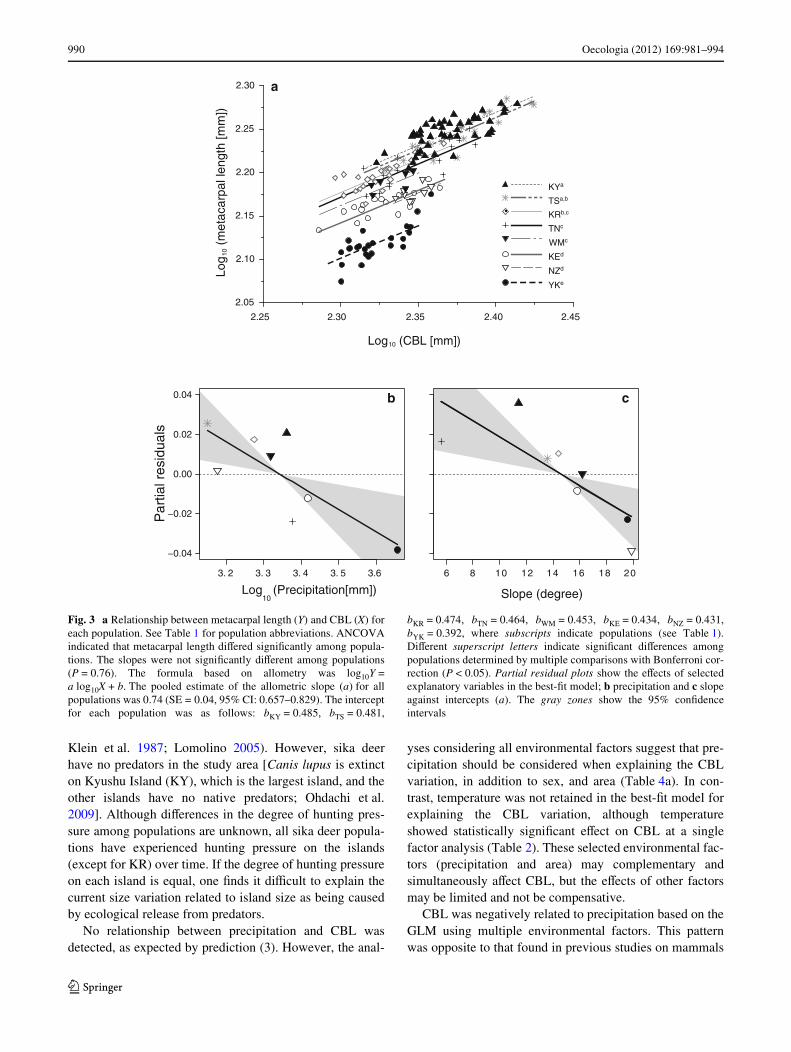
Fig. 3 a Relationship between metacarpal length (Y) and CBL (X) foreach population. See Table 1 for population abbreviations. ANCOVAindicated that metacarpal length diVered signiWcantly among popula-tions. The slopes were not signiWcantly diVerent among populations(P = 0.76). The formula based on allometry was log10Y =a log10X + b. The pooled estimate of the allometric slope (a) for allpopulations was 0.74 (SE = 0.04, 95% CI: 0.657–0.829). The interceptfor each population was as follows: bKY = 0.485, bTS = 0.481,
bKR = 0.474, bTN = 0.464, bWM = 0.453, bKE = 0.434, bNZ = 0.431,bYK = 0.392, where subscripts indicate populations (see Table 1).DiVerent superscript letters indicate signiWcant diVerences amongpopulations determined by multiple comparisons with Bonferroni cor-rection (P < 0.05). Partial residual plots show the eVects of selectedexplanatory variables in the best-Wt model; b precipitation and c slopeagainst intercepts (a). The gray zones show the 95% conWdenceintervals
2.05
2.10
2.15
2.20
2.25
2.30
Log
10 (
met
acar
pal l
engt
h [m
m])
2.25 2.30 2.35 2.40 2.45
Log10 (CBL [mm])
KYa
TSa,b
KRb,c
TNc
WMc
KEd
NZd
YKe
a
b
−0.04
−0.02
0.00
0.02
0.04
3. 2 3. 3 3. 4 3. 5 3.6 6 8 10 12 14 16 18 20
Slope (degree)
Par
tial r
esid
uals
Log10
(Precipitation[mm])
c
123
Oecologia (2012) 169:981–994 991
in arid areas (Yom-Tov and GeVen 2006; Capellini andGosling 2007; Blois et al. 2008). Precipitation has beenused as an index of primary production or abundance offood resources. Primary production is thought to increasewith precipitation in arid areas. For African ungulates, pop-ulations in areas with high precipitation have larger bodysize than those in areas with lower precipitation (Capelliniand Gosling 2007). This study area, however, is located inthe East Asian monsoon area, and thus precipitation isunlikely to be a limiting factor of the food production ofsika deer. Precipitation may represent the amount of sun-light, which limits food production in this study area. Sincesunlight was negatively correlated with precipitation in thisstudy area (data were obtained from the website of theJapan Meteorological Agency), body size decreased withdecreasing sunlight.
Food resources are aVected by various factors includingarea, precipitation, temperature, and others. In other words,food resources are regarded as an integral including theeVects of those factors and are listed as a possible directcause of all the above variables, although other directcauses cannot be excluded. McNab (2010) extensivelyreviewed studies on geographic body size variations inmammals, examining inXuential rules that describe geo-graphic patterns based on various environmental factors(e.g., Bergmann’s rule, the island rule) and concluded thatthose rules can be generalized as “resource rules” (see alsoYom-Tov and GeVen 2006). This study demonstrated thatthe geographic body size variation was explained by themultiple environmental factors related to food resources(precipitation and area) and supports the conclusion ofMcNab (2010). Analyses of phenotypic variation with mul-tiple factors are useful to gain insight into direct causes.
Predictions (4) for NDVI and (5) for density were notsupported by GLMs using each of the seven environmentalvariables and sex on CBL. Although food resources are con-sidered a possible cause of size variation, INDVI had nodetectable eVects on size variation, which was thought to bean index of food availability. Vegetation cover in this areawas mostly evergreen broad-leaved forests. Biomass underevergreen broad-leaved forests is small because plants underthe forest do not have access to suYcient sunlight. There-fore, variations in NDVI do not correlate with the forestXoor biomass, which is the actual food resource of the sikadeer. Population density had no detectable eVects on themeasurements in this study. The reliability of the populationdensity data was low, because densities were obtained bydiVerent researchers using diVerent methods in diVerent sea-sons. The present result that population density showed noeVects on the measurements is inconclusive. Further investi-gations should be performed to examine this relationship.
IdentiWcation of a measurement-speciWc variation
The interpopulation variation in metacarpal length waslarger than that in CBL (ESM, Table S2). EVects of bodysize variation may be common in all measurements andeach measurement may also have additional variationderived from their speciWc cause. Since variance is addi-tive, the large interpopulation variation in metacarpallength compared to CBL suggests that metacarpal lengthmay have a considerable speciWc eVect in addition to com-mon eVects shared with CBL.
Metacarpal length was not aVected by any single envi-ronmental factor that inXuenced CBL. Slope was the onlyfactor retained for explaining metacarpal length variation(Table 2) and thus it may be speciWc to metacarpal lengthvariation.
The multi-environmental factor analyses also showeddiVerences between CBL and metacarpal length. Area, pre-cipitation, and slope contributed to explaining variations inmetacarpal length, whereas sex, area, and precipitation con-tributed to explaining CBL (Table 4). Area, precipitation,and slope are complementary and simultaneously aVectmetacarpal length. Area and precipitation may aVect meta-carpal length through a common shared variable with CBL,while slope may generate measurement-speciWc variationin metacarpal length.
To explore an environmental factor that is speciWc tometacarpal length variation, metacarpal length was ana-lyzed among populations based on the allometric equation(log10 metacarpal length = alog10 CBL + b) (Fig. 3a). Theslope of the equation did not diVer among populations,while intercepts had a speciWc value for each population.The common slope value suggests that the increasing ratioof metacarpal length to CBL was the same among popula-tions. The term including CBL (alog10 CBL) should be sub-jected to the same environmental eVects as CBL, while theintercepts (b) should show speciWc eVects on metacarpallength.
An isometric relationship between size measurements inan individual is expected in intraspeciWc comparisons(McMahon and Bonner 1983). However, in this study, theallometry between CBL and metacarpal length was nega-tive (a < 1); large individuals had relatively shorter meta-carpal lengths than small individuals. The negativeallometry of limb length has been discussed in relation tobending resistance in interspeciWc comparisons of artiodac-tyls (McMahon 1975; Scott 1987; Christiansen 1999).Large individuals may reduce bending stress during loco-motion or stabilize the center of gravity by having shorterlimbs than smaller individuals, though the present studyanalyzed only intraspeciWc variations.
123
992 Oecologia (2012) 169:981–994
Factors generating a measurement-speciWc variation
To identify a speciWc factor associated with metacarpallength variation, we focused on variables that inXuencedthe intercepts (slope and precipitation) (Table 6). Artiodac-tyla species found in open habitats tend to have longermetacarpal bones, whereas those in mountainous habitatshave shorter limbs (Scott 1985, 1987). The fact that theintercepts were negatively related to slope (Table 6;Fig. 3c) indicates that populations on steeper habitats hadshorter limbs. This is consistent with prediction (6) and thepattern described by Scott (1985, 1987). Although Scott(1985, 1987) did not clearly explain a mechanism of thepattern observed among diVerent habitats, long distal limblength was suggested to be associated with rapid locomo-tion, and thus species living in open habitats had increasedspeed to escape predators. On the other hand, speciesinhabiting mountainous areas in which foot strength ismore important than speed would likely have shortened dis-tal segments. In steeper areas, stability may be preferredover speed to avoid falling oV a cliV and thus shorter meta-carpals were favored.
Unexpectedly, intercepts were negatively related to pre-cipitation (Fig. 3b). Although snow depth is a key factoraVecting the distribution range of sika deer and seems to becritical for their locomotion (Klein et al. 1987; Takatsuki1992), the eVect of snow in this study area is minimal sinceannual snowfall is <5 cm. One possibility involves theeVects of precipitation on the hardness and/or slipperinessof the ground. On muddy and/or slippery habitats, whichare conditioned by rain, shorter limbs may also be favoredfor stabilizing the center of gravity. The other possibility isthat precipitation may reXect the topological features ofislands. Flat islands tend to be dry, whereas islands withhigh mountains tend to have heavy rainfall (Whittaker1998). The eVects of precipitation may also support thehypothesis that mountainous habitats lead to relativelyshort limbs.
Although relative limb length has been reported to varyamong local populations in relation to habitat use or loco-motor performance in lizards (Sinervo and Losos 1991;Calsbeek et al. 2007), relationships at the intraspeciWc levelhave not been examined in large mammals. This is the Wrststudy to demonstrate a clear diVerence in relative metacar-pal length at the intraspeciWc level in ungulates. FactorsaVecting limb length may include two aspects of selectivepressure: one relating to body size and the other speciWc tofeet (Scott 1985, 1987). To discuss in detail the selectiveforces inXuencing foot length, these two aspects should beseparated. This study demonstrates that island topography(i.e., slope, condition of the surface) may be a speciWc fac-tor inXuencing limb length. Further studies focusing on therelationship between foot-speciWc variation and habitat
topography are warranted. Genetic studies corresponding tomorphological variations are promising and can be used toelucidate whether the observed morphological variationsreported here are generated by local adaption.
Acknowledgments We thank members of the hunting clubs at eachof our study sites for helping with sample collection. The PrimateResearch Institute of Kyoto University allowed us to use their facilitiesat the Yakushima Field Research Station and members of the Institutealso helped us in collecting samples. We thank M. Izawa, T. Shiroma,T. Doi, A. Endo, M. Baba, Ryukyu University, and the Kita-KyushuMuseum of Natural History and Human History for providing accessto samples; H. Uno, T. Mano, and the Hokkaido Institute of Environ-mental Sciences for providing a place to prepare osteal specimens;Kanagatake Elementary School and the Sediment Control Division ofKagoshima Prefecture for providing weather data; the AgriculturalAdministration Division of Nagasaki Prefecture for providing deerdensity data; T. Akasaka for helping with GIS analysis; T. Kubo andH. Iijima for advice on statistical analyses; E. Dyson for help with theEnglish language editing; O. Kishida for discussion and comments onthe manuscript; H. Abe, T. Koizumi, and N. Ohtaishi for their helpfulcomments; and J-M. Gaillard, C. Bonenfant, and anonymous reviewersfor their suggestions to improve the manuscript. This study was sup-ported by a Grant-in-Aid from the Japan Society for the Promotion ofScience (JSPS) Fellows (22-2966) and by a grant from the Global COEProgram of the Graduate School of Environmental Science, HokkaidoUniversity, to C. Terada.
References
Ashton KG, Tracy MC, de Queiroz A (2000) Is Bergmann’s rule validfor mammals? Am Nat 156:390–415
Blois JL, Feranec RS, Hadly EA (2008) Environmental inXuences onspatial and temporal patterns of body-size variation in Californiaground squirrels (Spermophilus beecheyi). J Biogeogr 35:602–613
Bonenfant C, Gaillard JM, Coulson T, Festa-Bianchet M, Loison A,Garel M, Loe LE, Blanchard P, Pettorelli N, Owen-Smith N, DuToit J, Duncan P (2009) Empirical evidence of density-depen-dence in populations of large herbivores. Adv Ecol Res 41:313–357
Burnham KP, Anderson DR (2002) Model selection and multi-modelinference: a practical information-theoretic approach. Springer,New York
Calsbeek R, Smith TB, Bardeleben C (2007) IntraspeciWc variation inAnolis sagrei mirrors the adaptive radiation of Greater Antilleananoles. Biol J Linn Soc 90:189–199
Capellini I, Gosling LM (2007) Habitat primary production and theevolution of body size within the hartebeest clade. Biol J Linn Soc92:431–440
Case TJ (1978) A general explanation for insular body size trends interrestrial vertebrates. Ecology 59:1–18
Christiansen P (1999) Scaling of the limb long bones to body mass interrestrial mammals. J Morphol 239:167–190
Darwin C (1859) On the origin of species by means of natural selec-tion. Murray, London
Endo A, Baba M (2010) Report of sika deer on Nozaki Island in Ojikatown. Faculty of Agriculture, Saga University, Saga
Endo A, Doi T (1996) Home range of female sika deer Cervus nipponon Nozaki Island, the Goto Archipelago, Japan. Mamm Stud21:27–35
Foster JB (1964) Evolution of mammals on islands. Nature 202:234–235
123
Oecologia (2012) 169:981–994 993
Fox J, Weisberg S (2010) An R Companion to applied regression, 2ndedn. Sage, New York
Garel M, Gaillard JM, Chevrier T, Michallet J, Delorme D, van LaereG (2010) Testing reliability of body size measurements usinghind foot length in Roe deer. J Wildl Manag 74:1382–1386
Geist V (1987) Bergmann’s rule is invalid. Can J Zool 65:1035–1038Grant PR (1986) Ecology and evolution of Darwin’s Wnches. Princeton
University Press, PrincetonGrant PR, Grant BR, Smith JN, Abbott IJ, Abbott LK (1976) Darwin’s
Wnches: population variation and natural selection. Proc NatlAcad Sci USA 73:257–261
Heaney LR (1978) Island area and body size of insular mammals: evi-dence from the tri-colored squirrel (Callosciurus prevosti) ofSoutheast Asia. Evolution 32:29–44
HerWndal I, Solberg E, Sæther BE, Høgda KA, Andersen R (2006)Environmental phenology and geographical gradients in moosebody mass. Oecologia 150:213–224
Janis CM (1990) Correlation of cranial and dental variables with bodysize in ungulates and macropodoids. In: Damuth J, Macfadden BJ(eds) Body size in mammalian paleobiology: estimation and bio-logical implication. Cambridge University Press, Cambridge,pp 255–300
Kagoshima Environmental Research and Service (2010) Report toconsider measures for accurate management of sika deer popula-tion on Yakushima in Kirishima-Yaku National Park. KagoshimaEnvironmental Research and Service, Kagoshima
Kagoshima Prefecture (2007) SpeciWed wildlife management plans forsika deer. Forestry and Fishery Department, Kagoshima prefec-ture, Kagoshima
Klein DR (1964) Range-related diVerences in growth of deer reXectedin skeletal ratios. J Mamm 45:226–235
Klein DR, Meldgaard M, Fancy SG (1987) Factors determining leglength in Rangifer tarandus. J Mamm 68:642–655
Lessells CM, Boag PT (1987) Unrepeatable repeatabilities—a com-mon mistake. Auk 104:116–121
Lilje KE, Tardieu C, Fischer MS (2003) Scaling of long bones in rumi-nants with respect to the scapula. J Zool Syst Evol Res 41:118–126
Lister AM (1989) Rapid dwarWng of red deer on Jersey in the last inter-glacial. Nature 342:539–542
Lomolino MV (1985) Body size of mammals on islands—the islandrule reexamined. Am Nat 125:310–316
Lomolino MV (2005) Body size evolution in insular vertebrates: gen-erality of the island rule. J Biogeogr 32:1683–1699
Maxwell SE, Camp CJ, Arvey RD (1981) Measures of strength ofassociation—a comparative-examination. J Appl Psychol66:525–534
Mayr E (1963) Animal species and evolution. Belknap Press of Har-vard University Press, Cambridge
McMahon T (1975) Allometry and biomechanics: limb bones in adultungulates. Am Nat 109:547–563
McMahon TA, Bonner JT (1983) On size and life. Freeman, New YorkMcNab BK (2010) Geographic and temporal correlations of mamma-
lian size reconsidered: a resource rule. Oecologia 164:13–23Meiri S, Dayan T (2003) On the validity of Bergmann’s rule.
J Biogeogr 30:331–351Meiri S, Dayan T, SimberloV D (2006) The generality of the island rule
reexamined. J Biogeogr 33:1571–1577Meiri S, Yom-Tov Y, GeVen E (2007) What determines conformity to
Bergmann’s rule? Glob Ecol Biogeogr 16:788–794Meiri S, Cooper N, Purvis A (2008) The island rule: made to be bro-
ken? Proc R Soc Lond B 275:141–148Nagasaki Prefecture (2007) SpeciWed wildlife management plans for
sika deer (Tsushima). Nagasaki Prefecture, NagasakiOchiai K, Asada M (1995) Growth in the body size of sika deer (Cer-
vus nippon) on the Boso Peninsula central Japan. J Nat Hist MusInst Chiba 3:223–232
Ohdachi SD, Ishibashi Y, Iwasa MA, Saitoh T (2009) The wild mam-mals of Japan. Shoukadoh, Kyoto
Ohtaishi N (1980) Estimation of sex, age, and season of death usingmandibles of Cervus nippon excavated from an archaeologicalsite. Archaeol Nat Sci 13:51–74
Ohtaishi N (1986) Preliminary memorandum of classiWcation, distribu-tion, and geological variation on sika deer. Mamm Sci 53:13–17
Oita Prefecture (2007) SpeciWed wildlife management plans for sikadeer. Agriculture, Forestry and Fishery Department, Oita prefec-ture, Oita
Pettorelli N, Vik JO, Mysterud A, Gaillard JM, Tucker CJ, Stenseth NC(2005) Using the satellite-derived NDVI to assess ecologicalresponses to environmental change. Trends Ecol Evol 20:503–510
Pettorelli N, Gaillard JM, Mysterud A, Duncan P, Stenseth NC, Delor-me D, Van Laere G, Töigo C, Klein F (2006) Using a proxy ofplant productivity (NDVI) to Wnd key periods for animal perfor-mance: the case of roe deer. Oikos 112:565–572
Pierce CA, Block RA, Aguinis H (2004) Cautionary note on reportingeta-squared values from multifactor ANOVA designs. EducPsychol Meas 64:916–924
Raia P, Meiri S (2006) The island rule in large mammals: paleontologymeets ecology. Evolution 60:1731–1742
Romano A, Ficetola GF (2010) Ecogeographic variation of body sizein the spectacled salamanders (Salamandrina): inXuence ofgenetic structure and local factors. J Biogeogr 37:2358–2370
Sand H, Cederlund G, Danell K (1995) Geographical and latitudinalvariation in growth patterns and adult body size of Swedishmoose (Alces alces). Oecologia 102:433–442
Scott KM (1985) Allometric trends and locomotor adaptations in theBovidae. Bull Am Mus Nat Hist 179:197–288
Scott KM (1987) Allometry and habitat-related adaptations in the post-cranial skeleton of Cervidae. In: Wemmer CM (ed) Biology andmanagement of the Cervidae. Smithdonian Institution Press,Washington, pp 65–80
Scott KM (1990) Postcranial dimensions of ungulates as predictors ofbody mass. In: Damuth J, Macfadden BJ (eds) Body size in mam-malian paleobiology: estimation and biological implication. Cam-bridge University Press, Cambridge, pp 301–336
Shiroma T (2002) Why the kerama deer Cervus nippon keramae liveson the Kerama islands: notes on the artiWcial introduction of sikadeer Cervus nippon into Ryukyu in the seventeenth century. BullHistoriogr Inst 27:209–218
Sinervo B, Losos JB (1991) Walking the tight rope—arboreal sprintperformance among Sceloporus occidentalis lizard populations.Ecology 72:1225–1233
Smith PA, Schaefer JA, Patterson BR (2002) Variation at high lati-tudes: the geography of body size and cranial morphology of themuskox, Ovibos moschatus. J Biogeogr 29:1089–1094
Takatsuki S (1992) Foot morphology and distribution of sika deer inrelation to snow depth in Japan. Ecol Res 7:19–23
Toïgo C, Gaillard JM, Van Laere G, Hewison M, Morellet N (2006)How does environmental variation inXuence body mass, bodysize, and body condition? Roe deer as a case study. Ecography29:301–308
von den Driesch A (1976) A guide to the measurement of animal bonesfrom archaeological sites. Harvard University, Peabody Museumof Archaeology and Ethnology, Cambridge
Whitehead GK (1993) Encyclopedia of deer. Swann Hill Press,Shrewsbury
Whittaker RJ (1998) Island biogeography: ecology, evolution and con-servation. Oxford University Press, Oxford
Wolverton S, Huston MA, Kennedy JH, Cagle K, Cornelius JD (2009)Conformation to Bergmann’s rule in white-tailed deer can beexplained by food availability. Am Midl Nat 162:403–417
Yokoyama M (2009) Biology of sika deer in Hyogo: characteristics ofreproduction, food habits, growth, and condition. In: McCullough
123

994 Oecologia (2012) 169:981–994
DR, Takatsuki S, Kaji K (eds) Sika deer: biology and manage-ment of native and introduced populations. Springer, Tokyo,pp 193–205
Yom-Tov Y, GeVen E (2006) Geographic variation in body size: theeVects of ambient temperature and precipitation. Oecologia148:213–218
Zannèse A, Baïsse A, Gaillard JM, Hewison AJM, Saint-Hilaire K,Toïgo C, Van Laere G, Morellet N (2006) Hind foot length: anindicator for monitoring roe deer populations at a landscape scale.Wildl Soc Bull 34:351–358
123