ecological and environmental management during the … · ecological and environmental management...
TRANSCRIPT

December 2016 • Oil and Gas Facilities 1
Ecological and Environmental Management During the Hail 3D Transition-Zone Survey:
Safe Working Practices Within a UNESCO World-Biosphere Reserve
G. S. MacGlennon, P. B. Nilsson, and G. A. Casson, Abu Dhabi National Oil Company
(Southall et al. 2007; Madsen and Møhl 2000; OSPAR Commission 2009). Several studies have noted a range of adverse reactions of ma-rine fauna to seismic operations. Documented effects of seismic sur-veys on marine fauna include spatial-avoidance behavior by Atlantic spotted dolphins (Stenella frontalis) (Weir 2008), bowhead whales (Balaena mysticetus) (Ljungblad et al. 1988), and several species of delphinids and mysticetes in UK waters (Stone and Tasker 2006); startle-and-dive response in loggerhead sea turtles (Caretta caretta) (DeRuiter and Doukara 2012); altered vocalization patterns in blue whales (Balaenoptera musculus) (Di Iorio and Clark 2010); and com-plete cessation of vocalizations in fin whales (Balaenoptera physalis) (Clark and Gagnon 2006). For a review of seismic-survey effects on marine mammals and other environmental implications, see Gordon et al. (2003) and McCauley et al. (2000).
It is worth noting, however, that several similar studies were either inconclusive or found little to no evidence of negative im-pacts on marine fauna from seismic-survey activities (Gosselin and Lawson 2005; Parente et al. 2006; Richardson et al. 1986; Weir 2007; Yazvenko et al. 2007).
The Hail 3D transition-zone seismic survey constitutes the first of its kind in the UAE with mitigation measures dedicated to tran-sition-zone surveys. Further, transition-zone seismic surveys as a whole represent only a small percentage of seismic operations worldwide. This, coupled with the lack of any survey-specific on-site regulatory management within the UAE for marine mam-mals and other marine fauna during seismic operations, highlights the need to develop a set of guidelines for industrial best practice within the region.
Current national environmental legislation for marine mammals and turtles in the UAE is limited and not specific to mitigation during seismic operations. Dugong (Dugong dugon) are protected under UAE Federal Laws No. 23 and 24 (1999); however, these mostly refer to the protection of dugong from direct hunting and fishing ac-tivities. Regional environmental legislation includes Appendix II of the Convention on the Conservation of Wildlife and Their Natural Habitats in the Countries of the Gulf Cooperation Council (Cooper-ation Council for the Arab States of the Gulf 2009), which provides general protection for one species of marine mammal, D. dugon, but does not cover any other species or cover specific operations such as marine seismic surveys. International legislation agreed by the UAE includes the signing of three memorandums of understanding: the Memorandum of Understanding on the Conservation and Manage-ment of Marine Turtles and Their Habitats of the Indian Ocean and South-East Asia (CMS 2009), the Memorandum of Understanding on the Conservation and Management of Dugongs (Dugong dugon) and Their Habitats Throughout Their Range (CMS 2007), and, most recently, the Memorandum of Understanding on the Conservation of Migratory Sharks (CMS 2014).
In areas where there is no specific regulatory management for marine fauna during seismic operations, it is considered environ-
Copyright © 2016 Society of Petroleum Engineers
This paper (SPE 177780) was accepted for presentation at the Abu Dhabi International Petroleum Exhibition and Conference, Abu Dhabi, 9–12 November 2015, and revised for publication. Original manuscript received for review 31 October 2015. Revised manuscript received for review 4 April 2016. Paper peer approved 6 April 2016.
SummaryThe Hail 3D transition-zone seismic survey, carried out by Abu Dhabi National Oil Company (ADNOC) in 2013–14, was located within an area considered to be of significant national and inter-national environmental importance. Falling within a designated marine protected area (MPA) that was ratified by Abu Dhabi minis-terial decree, as well as in a United Nations Educational, Scientific, and Cultural Organization (UNESCO) world-biosphere reserve, high standards of environmental and ecological management throughout the acquisition program were of paramount importance.
Effective environmental and ecological management throughout the project was attained through the design and implementation of numerous working procedures and monitoring programs. These in-cluded the development of specific sets of mitigation guidelines for use during transition-zone surveys for minimizing disturbance and injury to marine mammals and turtles and for operating within mangrove areas, and the use of environmental profiling, auditing, and post-operational monitoring in both the terrestrial and ma-rine environment for collecting new data on the biodiversity and ecology of the area.
For the first time, we present ecological and environmental data collected over a period of 12 months within the Hail shoal area. In addition to data on species numbers and distributions, we present a method for effectively managing complex seismic surveys being car-ried out simultaneously in both the marine and terrestrial environment.
For marine-mammal and turtle species, visual observations were compared over time and analyzed against seismic activity by use of a regression analysis. Our results demonstrate seasonal variation in total numbers throughout the year, with no significant reduction in ob-served numbers occurring as a result of seismic-exploration activities.
We further demonstrate how a complex seismic survey can be managed and supervised to mitigate and minimize the environ-mental footprint or negative impacts on biodiversity as a result of the exploration and resource development considered crucial to the socioeconomic development of Abu Dhabi.
IntroductionMarine seismic operations that use air guns have the potential to negatively impact marine wildlife, including cetaceans, sirenians, sea turtles, and other marine taxa.
Many papers have been penned to numerous journals and maga-zines of diverse areas of erudition and learning pertaining to the effects of subsurface audio disturbance from seismic-source acoustic energy
SPE_OGF_177780_160014.indd 1 09/11/16 4:46 PM

2 Oil and Gas Facilities • December 2016
mental best practice to adopt and follow the guidelines of other countries, which in most cases have been the Joint Nature Conser-vation Committee (JNCC) guidelines of the UK. These guidelines, while well-established and offering a good framework for marine-mammal mitigation, were originally designed as part of the Agree-ment on the Conservation of Small Cetaceans in the Baltic, North East Atlantic, Irish and North Seas (ASCOBANS 2015) convention for use in the deep waters of the North Sea (Weir and Dolman 2007), and do not in all cases provide a comprehensive and fully work-able set of guidelines for different types of seismic survey such as transition-zone surveys. For use during the Hail 3D transition-zone seismic survey, a set of guidelines were created that, while modeled originally on the JNCC guidelines, could be used during transition-
zone surveys, taking into consideration the complexity of such op-erations and yet providing the best-possible mitigation measures to prevent disturbance/injury to marine mammals and turtles.
Prospect Location. The prospect zone is located in the Hail field, approximately 95 km west of Abu Dhabi. Covering an area of 636 km2, the acquisition area falls over a transition zone that includes land, tidal flats, and shallow water (Fig. 1). The majority of the prospect area falls within one of the five designated MPAs within the UAE (Fig. 2), which is the only one that has currently been rati-fied by Abu Dhabi ministerial decree (Emiri Decree No. 18 of 2001 Declaring Marawah as a Protected Marine Area). Further to this protection, the area was also designated a world-biosphere reserve
Fig. 1—Map of prospect/study area. (Google Earth; Image: Landset; Data: SIO, NOAA, US Navy, NGA, GEBCO.)
Yasat MarineProtected Area
Barqa AI SoqourProtected Area
Yaw AI DibsaProtected Area
Beda HazaaProtected Area
AI TawiProtected Area
RamlahProtected Area
AI HoubaraProtected Area
BidaaProtected Area
Al GhadaProtected Area
Ras Ghanada Marine Protected Area
Al Saadiyat Marine National Park
Mangrove National Park
Marawah MarineBlosphere Reserve
Bul Syayeef MPA
Al Wathba Wetland Reserve
Jebel Hafeet National Park
Marine Protected areas
Terrestrial protected areas
13.5%
14.6%
DilfawyaProtected Area
Qasr Al SarabProtected Area
Source: EAD Annual Report 2013
Marine and Terrestrial Protected Areas in Abu Dhabi
Arabian Oryx Protected Area
Fig. 2—Map displaying protected areas established across the emirate of Abu Dhabi (EAD 2013).
SPE_OGF_177780_160014.indd 2 09/11/16 4:46 PM

December 2016 • Oil and Gas Facilities 3
in 2007 as part of UNESCO’s “man and biosphere program,” cov-ering a total area of 4255 km2 (Fig. 3), making any management and environmental mitigation particularly important.
Biosphere reserves are intended to support sociocultural and envi-ronmentally sensitive economic and human development alongside biodiversity conservation. This remit is usually achieved through zona-tion, with a central “core” and surrounding buffer zone, each with spe-cific activities controlled for each. The Hail shoal falls on the outer edge of the designated core zone and within the buffer zones of the MPA.
Because of the international importance of this designation, the Abu Dhabi government has a responsibility to ensure the area is conserved and managed sensitively. Designation of areas and awards by UNESCO are reviewed periodically (every 10 years) and can be removed (or undesignated) should the strict criteria not continue to be met (Nautica Environmental Associates LLC 2012).
MethodsBefore any survey activities within the area, an extensive project-specific health, safety, and environmental impact assessment (HSEIA) was produced on behalf of ADNOC. The purpose of this document was to identify potential environmental hazards that could occur as a result of project activities and to detail methods either to remove these hazards or to reduce them to lower levels as far as reasonably practicable.
Environmental supervision on the project was carried out by two ADNOC representatives. One representative was on crew at all times providing constant environmental supervision throughout the course of the survey. In addition, the seismic contractor was re-quested to provide a team of protected-species observers (PSOs) and passive-acoustic-monitoring (PAM) operators. This took the
form of two PSOs and one PAM operator on crew at any one time. The purpose of these personnel was to carry out protected-species mitigation during seismic activities.
Mitigation Protocol During Marine Seismic Surveys. One PSO was placed onboard each of the larger source vessels (800 and 1,120 in.3, respectively) during seismic-survey activity. These ob-servers monitored seismic operations to ensure compliance with the specific mitigation measures created for the survey by ADNOC (Appendix A).
The seismic survey took place from north to south. This arrange-ment, while allowing for optimal survey activity, also allowed activi-ties to be restricted as much as possible to occur outside of periods of high sensitivity for key species in specific areas, as identified in the project HSEIA. This was particularly important for work being car-ried out near Hail Natural and Umm Amim Islands, both recognized as being highly important areas for birds, including a number of UAE priority species (Nautica Environmental Associates LLC 2012).
Visual assessments of the surrounding area were made before any use of the seismic air guns by means of a combination of scan-ning the surrounding water with the naked eye and using binoculars (10×40) to further examine areas of interest, a method commonly used in marine-mammal monitoring (JNCC 2015).
Monitoring effort continued throughout all seismic operations, with all observations recorded to analyze trends and distributions. Information gathered during a sighting included date, start and end times of encounter, species (or higher taxonomic grouping if unable to determine species), number, location [latitude and lon-gitude, World Geodetic System 1984 (International Terrestrial Ref-erence Frame 2008)], water depth to mean sea level, a description
Mubarraz
Arc Hail 2
Umm Amim
Marawah
Hail 3Hail natural
Fig. 3—Satellite image of islands within the prospect area: Hail 2, Hail 3, Arc, Hail Natural, Mubarraz, Marawah, and Umm Amim. (Google Earth; Image: DigitalGlobe; Data: SIO, NOAA, US Navy, NGA, GEBCO.)
SPE_OGF_177780_160014.indd 3 09/11/16 4:47 PM

4 Oil and Gas Facilities • December 2016
of characteristics, behavior, bearing and range from vessel, direc-tion of travel (relative to vessel and compass points), air-gun ac-tivity during sighting, and any mitigation actions if required.
Additional Monitoring and Surveys. In addition to monitoring during marine seismic operations, the following surveys were de-signed to provide a more-extensive environmental and ecological monitoring program in the Hail 3D prospect area. These surveys were carried out by the ADNOC environmental representative. During all additional monitoring surveys, position data were collect-ed by use of a Garmin® eTrex 20 handheld global-positioning-sys-tem (GPS) unit, and images were recorded by use of a Nikon® D60 camera with 18- to 55-mm, 55- to 200-mm Nikor lens or a Canon® Rebel T2 with a 55- to 300-mm Canon lens. Because all oil fields in the UAE are protected by security protocols, especially for film and picture taking, all cameras had Critical National Infrastructure Authority authorization before being taken to the survey sites.
The aims of these surveys were1. To identify hazards to the environment as a result of survey
activities, removing or reducing these hazards where possible2. To monitor survey activities in real time, reviewing existing
hazard-mitigation measures and implementing further mea-sures where required
3. To assess and document existing environmental damage in the area not attributable to survey activities
4. To make environmental assessments after survey activities to identify any damage to the environment as a result of opera-tions and restoration work needed, if any
5. To collect data on the abundance and distribution of marine mammals, birds (terrestrial and marine), sea turtles, and other marine fauna located within the Hail prospect area
6. To allow analysis over time, highlighting trends and/or changes throughout the duration of the project
7. To allow analysis across the prospect area, identifying and highlighting key areas of ecological importance
8. To collect any other relevant information relating to the envi-ronment in the prospect area
The following surveys were designed to achieve these aims and, combined with the standard marine-fauna surveys being conducted alongside marine seismic operations, provided a more-detailed view of ecological and environmental conditions within the Hail prospect area during the project.
• Island environmental surveys, carried out before, during, and after survey operations
• Prospect cross-sectional surveys• Opportunistic vessel surveys
Island Environmental Surveys. A number of islands are located within the seismic-survey area (Fig. 3). These islands differ widely in their characteristics, ranging from natural uninhabited islands with vegetation cover and sand flats to man-made islands con-sisting mainly of sand and coral rubble.
By conducting environmental surveys on these islands, a better understanding of species abundance and diversity within the pros-pect area could be achieved along with the identification of poten-tial environmental impacts on specific species of interest.
The aims of island environmental surveys were1. To assess potential impacts deriving from the seismic acqui-
sition program using Vibroseis® trucks and upholes 2. To identify and select areas of environmental sensitivity to
be designated as exclusions with a safety buffer zone during seismic operations
3. To conduct bird surveys by means of total counts and bird-nest surveys to allow survey planning around peak times for breeding birds
4. To investigate the presence of sea turtles and sea turtle nest sites
5. To conduct marine-mammal/turtle carcass surveys6. To collect any other relevant environmental data, as necessary Island environmental surveys were carried out on foot, recording
observations and species numbers. Areas of specific interest, such as uphole drill locations and areas with mangrove growth, were surveyed before, during, and after survey operations. A further set of mitigation measures was developed for use during operations within mangrove areas and were used during all land-based seismic operations (Appendix B).
Cross-Sectional Surveys. The prospect zone covers an area of approximately 636 km2. While large amounts of ecological data were collected during marine seismic operations, these data were limited to areas in which the two large seismic-source vessels had been operating. The purpose of the prospect cross-sectional sur-veys was to conduct dedicated marine-mammal, seabird, and other marine-fauna surveys along predetermined transect lines, which would cover as much of the prospect area as possible independent from operational activities. To achieve this, three survey transect lines were created, crossing the prospect area (Fig. 4). Visual moni-toring for marine fauna followed the same procedure as monitoring during seismic activities.
The aims of these surveys were1. To record marine fauna in the survey area 2. To collect data from a much wider area and independantly of
marine seismic operations, allowing the identification of key areas of high marine-fauna density
3. To be repeatable and allow comparisons over time, high-lighting trends and seasonal changes in species diversity and abundance throughout the duration of the project
Cross-sectional transects were surveyed by use of a variety of vessels, depending on water depths and the tide cycle. During all surveys, the vessels traveled at speeds of approximately 11 knots, with the observer positioned on deck in a position that provided the best field of view around the vessel. Observations were recorded whenever made, at any distance or location.
Opportunistic Vessel Surveys. Whenever onboard a vessel, but not engaged in a cross-sectional survey, observations of marine mammals, turtles, other marine vertebrates, and birds were made and recorded as opportunistic sightings. This allowed the recording of data that would otherwise go unrecorded as vessels moved around the prospect for transect surveys or transiting to and from different islands. Surveys were completed as described previously, except for survey lines (see cross-sectional-survey method).
Standardization of Data. To standardize observation data, the unit observation rate (Or) was created. The observation rate was cal-culated by dividing the number of observations (On) by the total observation time (Ot) and multiplying by 100, thus creating a unit
1 3
2
Fig. 4—Satellite image of prospect area highlighting cross-sec-tional survey transects (1 = Hail NW, 2 = Hail SE, 3 = Mubarraz Channel). (Google Earth; Image: DigitalGlobe; Data: SIO, NOAA, US Navy, NGA, GEBCO).
SPE_OGF_177780_160014.indd 4 09/11/16 4:47 PM

December 2016 • Oil and Gas Facilities 5
of measure that allowed comparisons to be made between surveys that differed in duration:
OO
Orn
t
= ×100 . .......................................................................(1)
Plotting Distribution Data and Statistical Analysis. Observation data were plotted with QGIS (2015) software. Statistical analysis was carried out using Microsoft® Excel.
Additional Mitigation Measures. Throughout the course of the project, activities were monitored actively and, where necessary, additional mitigation measures were implemented. These include the designation of specific vehicle-crossing routes while moving vibrators and other vehicles between islands over shallow-water areas. These routes were scouted ahead of any large-vehicle move-ments by use of a small all-terrain vehicle and mapped to avoid ar-eas of seagrass growth and other sensitive areas. Designated routes were marked with white flags and entered into GPS devices for use by other vehicles. The use of designated routes allowed any
90
Seismic survey
Total Marine Mammal Observations (Sightings)
Additional survey (combined)
Seismic survey
Total Marine Mammal Observations (Individuals)
Additional survey (combined)
80
70
8
73
510
20
9
99
29
57
37
3043
9
2
3
20 239 3
2
60
50
40
30
20
Num
ber
of O
bser
vatio
nsN
umbe
r of
Obs
erva
tions
10
0Dugong
(Dugong dugon)Bottlenose
dolphin(Tursiops sp.)
Humpbackdolphin(Sousa
chinensis)
Species
Unidentifieddolphin
Unidentifiedmarine mammal
Finless porpoise(Neophocaenaphocaenoides)
Dugong(Dugong dugon)
Bottlenosedolphin
(Tursiops sp.)
Humpbackdolphin(Sousa
chinensis)
Species
Unidentifieddolphin
Unidentifiedmarine mammal
Finless porpoise(Neophocaenaphocaenoides)
0
20
40
60
80
100
120
Fig. 5—Total marine-mammal observations by species and survey type.
SPE_OGF_177780_160014.indd 5 09/11/16 4:47 PM

6 Oil and Gas Facilities • December 2016
0
0.00
1.00
2.00
3.00
4.00
5.00
6.00
7.00
8.00
9.00
10.00
Dugongs
Humpback dolphins
Bottlenose dolphins
Finless porpoises
Dugongs
Humpback dolphins
Bottlenose dolphins
Finless porpoises
Tota
l Num
ber
of In
divi
dual
s S
ight
ed
5
10
15
20
25
Total Marine Mammal Individuals
Marine Mammal Observation Rates
Obs
erva
tion
Rat
e (O
r)
30
Jan-
14
Dec-1
3
Feb-1
4
Mar-1
4
Apr-1
4
May-1
4
Jun-
14Ju
l-14
Aug-1
4
Sep-1
4
Oct-14
Nov-1
4
Month
Jan-
14
Dec-1
3
Feb-1
4
Mar-1
4
Apr-1
4
May-1
4
Jun-
14Ju
l-14
Aug-1
4
Sep-1
4
Oct-14
Nov-1
4
Month
(a)
(b)
Fig. 6—(a) Total numbers of dugongs, dolphins, and finless porpoises observed by all observers on all surveys from December 2013 to November 2014. (b) Observation rates (number of individuals/on-effort observational hours × 100) of dugongs, dolphins, and fin-less porpoises from December 2013 to November 2014.
SpeciesSeismicSurvey
Other Survey (Transect)
Other Survey (Opportunistic)
Other Survey (Combined)
SightingsDugong (Dugong dugon) 73 1 7 8Bottlenose dolphin (Tursiops sp.) 20 5 0 5Humpback dolphin (Sousa chinensis) 20 1 9 10Unidentified dolphin 23 0 0 0Finless porpoise (Neophocaena
phocaenoides)9 0 2 2
Unidentified marine mammal 3 0 0 0Total Marine Mammals 148 7 18 25Individuals
Dugong (Dugong dugon) 99 1 8 9Bottlenose dolphin (Tursiops sp.) 57 29 0 29Humpback dolphin (Sousa chinensis) 30 2 35 37Unidentified dolphin 43 0 0 0Finless porpoise (Neophocaena
phocaenoides)9 0 2 2
Unidentified marine mammal 3 0 0 0Total Marine Mammals 241 32 45 77
Table 1—Total marine-mammal observations by species and survey type.
SPE_OGF_177780_160014.indd 6 09/11/16 4:47 PM

December 2016 • Oil and Gas Facilities 7
potential disturbance to substrate to be limited to areas of reduced environmental sensitivity.
Species abundance and distribution were monitored continu-ously throughout the project. This allowed the mapping and iden-tification of high-density areas for certain species. Once identified, additional mitigation measures were used within these areas to fur-ther reduce potential environmental risk. These included vessel speed limits within two areas identified as being of high density for dugongs and sea turtles.
Further additional mitigation measures specific to location were used within the UNESCO core zone. A small area on the eastern part of the survey area fell within the core-zone designation. While operating in this location, vessel movements were highly restricted, with only vessels involved in active survey being permitted and no vessels on standby allowed within this zone. No bunkering or maintenance involving hydraulic fluid, fuel, water coolant, or bilge pump was allowed. Anchor points were restricted to three predes-ignated locations that had been surveyed and confirmed to be clear of seagrass and coral before deployment. In addition, the anchoring system used within these areas involved a low-impact weight system that further reduced impact on the sea floor.
All vessels and Vibroseis vehicles were fitted with fuel-spill-containment equipment. Both vessels and Vibroseis vehicles oper-ating within the shallow water followed the vessel-spill emergency contingency plan prepared before the start of the survey. Further spill-mitigation measures included specialized spill-free fueling
fittings fixed to vessels and biodegradable hydraulic oil used in Vi-broseis vehicles.
All vessels used during the seismic survey were either jet pro-pelled or fitted with prop guards, with speeds reduced to prevent injury to marine species and disturbance to sea grass by propeller damage.
ResultsMarine-Fauna Observations. Sighting data for marine mammals, sea turtles, and other marine vertebrates (e.g., rays) from all observ-ers and types of surveys (e.g., observations from seismic vessel, dedicated survey transects, and opportunistic surveys) were com-bined to increase sample size and enable enhanced investigation of ecological parameters (e.g., seasonality, group size). The results are presented by taxonomic grouping in the following subsections.
Marine Mammals. A total of 318 marine mammals distributed over 173 sightings were recorded during the project (Fig. 5; Table 1). Of these, 81 sightings (47%) were of dugongs (D. dugon), 89 sight-ings (51%) were of cetaceans, and three sightings (2%) were of unidentified marine mammals. Cetaceans accounted for 63% (On = 207) of the 318 individual marine mammals observed, with du-gong sightings making up 34% (On = 108). Of the 207 cetaceans observed, 196 were dolphins and 11 were finless porpoises. Of the 196 dolphins sighted, 43 (22%) could not be identified to species level as a result of several factors that made identification difficult (e.g., distance and brevity of sighting).
2.5
LegendLegend
Dugong3d_hail
Porpoise, FinlessMarine mammal sp.
Dolphin, Humpback 3d_hail
Dolphin, Bottlenose
Legend Legend
Turtle sp. Stingray, CommonStingray sp.Ray, Uarnak sp.Ray, Spotted eagle
Ray, Round RibbontailRay, EagleRay, sp.
Ray, Mobula3d_hail
Turtle, LoggerheadTurtle, HawksbillTurtle, Green3d_hail
Dolphin sp0 2.5 5 7.5 10 km
2.5 0 2.5 5 7.5 10 km 2.5 0 2.5 5 7.5 10 km
2.5 0 2.5 5 7.5 10 km
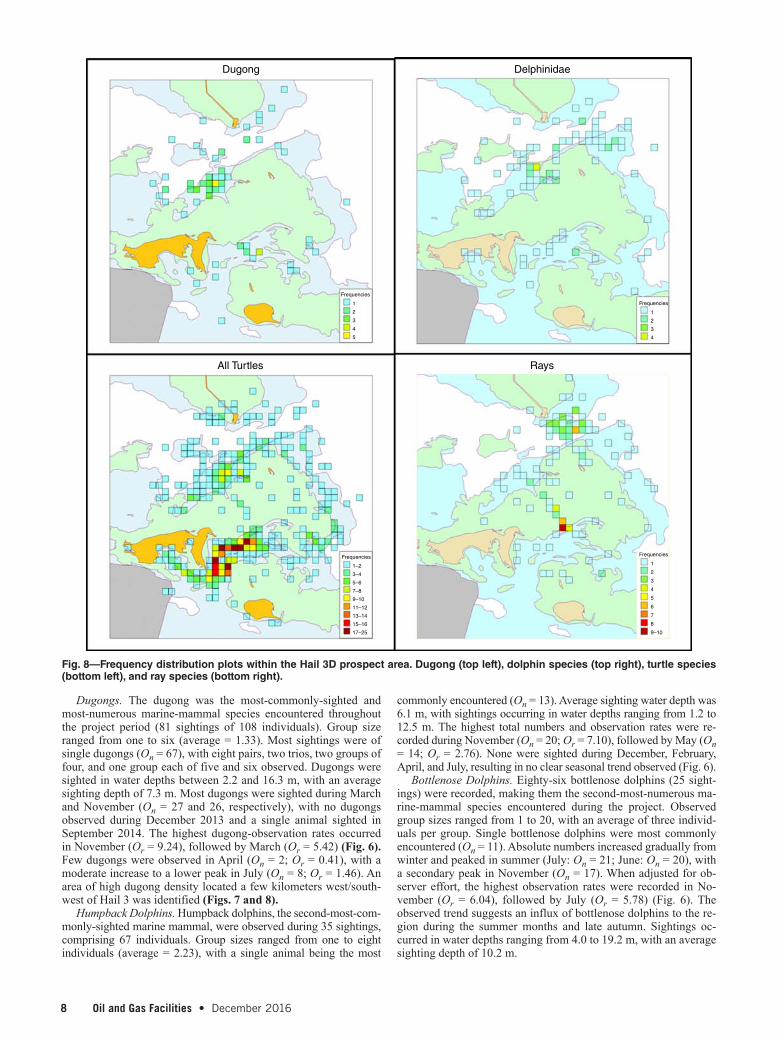
Fig. 7—Observations within the Hail 3D prospect areas. Dugong (top left), dolphin species (top right), turtle species (bottom left), and ray species (bottom right).
SPE_OGF_177780_160014.indd 7 09/11/16 4:47 PM
8 Oil and Gas Facilities • December 2016
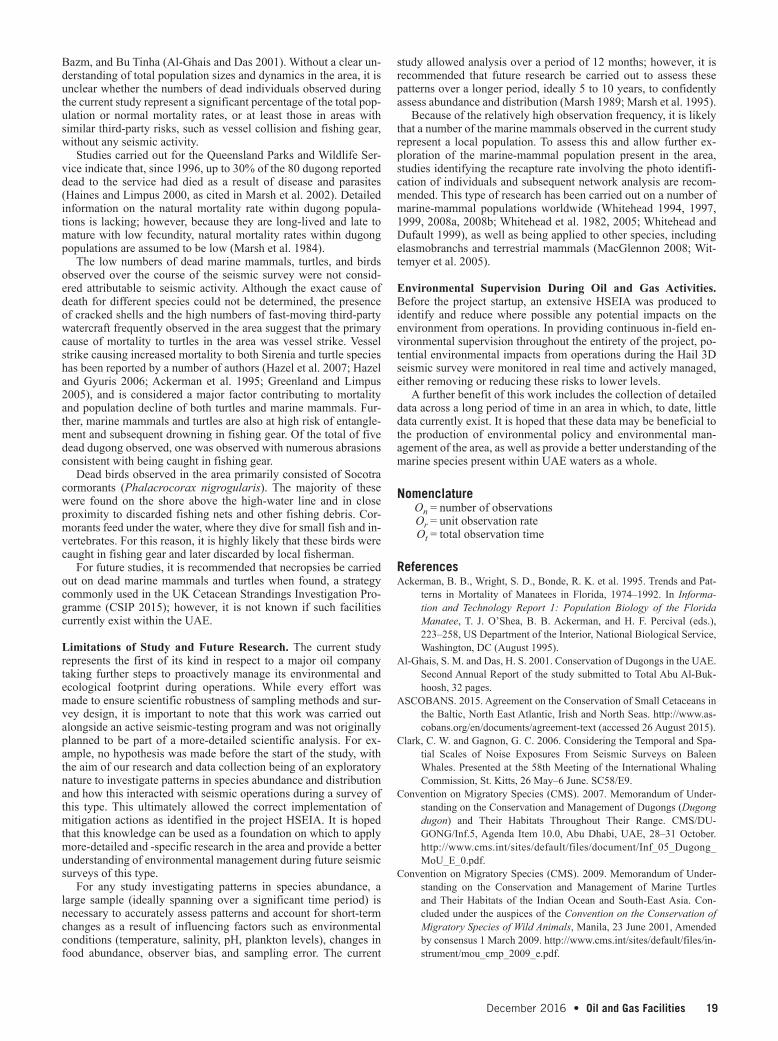
Dugongs. The dugong was the most-commonly-sighted and most-numerous marine-mammal species encountered throughout the project period (81 sightings of 108 individuals). Group size ranged from one to six (average = 1.33). Most sightings were of single dugongs (On = 67), with eight pairs, two trios, two groups of four, and one group each of five and six observed. Dugongs were sighted in water depths between 2.2 and 16.3 m, with an average sighting depth of 7.3 m. Most dugongs were sighted during March and November (On = 27 and 26, respectively), with no dugongs observed during December 2013 and a single animal sighted in September 2014. The highest dugong-observation rates occurred in November (Or = 9.24), followed by March (Or = 5.42) (Fig. 6). Few dugongs were observed in April (On = 2; Or = 0.41), with a moderate increase to a lower peak in July (On = 8; Or = 1.46). An area of high dugong density located a few kilometers west/south-west of Hail 3 was identified (Figs. 7 and 8).
Humpback Dolphins. Humpback dolphins, the second-most-com-monly-sighted marine mammal, were observed during 35 sightings, comprising 67 individuals. Group sizes ranged from one to eight individuals (average = 2.23), with a single animal being the most
commonly encountered (On = 13). Average sighting water depth was 6.1 m, with sightings occurring in water depths ranging from 1.2 to 12.5 m. The highest total numbers and observation rates were re-corded during November (On = 20; Or = 7.10), followed by May (On = 14; Or = 2.76). None were sighted during December, February, April, and July, resulting in no clear seasonal trend observed (Fig. 6).
Bottlenose Dolphins. Eighty-six bottlenose dolphins (25 sight-ings) were recorded, making them the second-most-numerous ma-rine-mammal species encountered during the project. Observed group sizes ranged from 1 to 20, with an average of three individ-uals per group. Single bottlenose dolphins were most commonly encountered (On = 11). Absolute numbers increased gradually from winter and peaked in summer (July: On = 21; June: On = 20), with a secondary peak in November (On = 17). When adjusted for ob-server effort, the highest observation rates were recorded in No-vember (Or = 6.04), followed by July (Or = 5.78) (Fig. 6). The observed trend suggests an influx of bottlenose dolphins to the re-gion during the summer months and late autumn. Sightings oc-curred in water depths ranging from 4.0 to 19.2 m, with an average sighting depth of 10.2 m.
Dugong Delphinidae
All Turtles Rays
Frequencies
1
2
3
4
Frequencies
1
2
3
4
Frequencies
1
2
3
4
5
6
7
8
9–10
Frequencies
1–2
3–4
5–6
7–8
9–10
11–12
13–14
15–16
17–25
5
Fig. 8—Frequency distribution plots within the Hail 3D prospect area. Dugong (top left), dolphin species (top right), turtle species (bottom left), and ray species (bottom right).
SPE_OGF_177780_160014.indd 8 09/11/16 4:47 PM

December 2016 • Oil and Gas Facilities 9
Finless Porpoises. Eleven finless porpoises were observed during the survey, all of which were of single animals (Fig. 6). During the month of May, five finless porpoises were recorded. Sighting water depths ranged from 1.9 to 13.3 m, with an average sighting depth of 7.6 m.
Sea Turtles. A total of 1,089 sea turtles were recorded by all ob-servers on seismic, transect, and opportunistic surveys during the project (Fig. 9; Table 2). Of these, 676 turtles (62%) could not be identified to species, owing to several factors such as brevity of sighting and distance and similarity in appearance between species. A cautionary approach to sea turtle identification was adopted during
the project, with observers only assigning a specific species designa-tion to a sighting if it could be determined with great certainty. Total turtle numbers and observation rates increased gradually throughout the year, with peak numbers and sighting rates—299 and 312 and Or = 74.40 and 74.90, respectively— recorded during September and October (Fig. 10). An area of high sea turtle density was identified off the east of Marawah Island (Figs. 7 and 8). Sighting depth did not vary significantly among species, and ranged from 0.3 to 16.8 m (av-erage = 6.2 m) when all turtle sightings were combined.
Green Turtles. The green turtle was the most-commonly-en-countered sea turtle identified to species (On = 304), accounting for
Seismic survey Additional survey (combined)
Seismic survey Additional survey (combined)
800
700
600
500
400
300
200Num
ber
of O
bser
vatio
ns
100
0
400
450
500
350
300
250
200
150
100
Num
ber
of O
bser
vatio
ns
50
0
59
226
27
44
29
275
63 45 1
527
149
1
337
103
Total Turtle Observations (Sightings)
Total Turtle Observations (Individuals)
Species
Loggerhead turtle(Caretta caretta)
Green turtle(Chelonia mydas)
Hawksbill turtle(Eretmochelys
imbricata)
Unidentified turtleOlive ridley turtle(Lepidochelys
olivacea)
Species
Loggerhead turtle(Caretta caretta)
Green turtle(Chelonia mydas)
Hawksbill turtle(Eretmochelys
imbricata)
Unidentified turtleOlive ridley turtle(Lepidochelys
olivacea)
Fig. 9—Total turtle observations by species and survey type.
SPE_OGF_177780_160014.indd 9 09/11/16 4:47 PM

10 Oil and Gas Facilities • December 2016
Jan-
14
Dec-1
3
Feb-1
4
Mar-1
4
Apr-1
4
May-1
4
Jun-
14
Jul-1
4
Aug-1
4
Sep-1
4
Oct-14
Nov-1
4
Month
(a)
Jan-
14
Dec-1
3
Feb-1
4
Mar-1
4
Apr-1
4
May-1
4
Jun-
14
Jul-1
4
Aug-1
4
Sep-1
4
Oct-14
Nov-1
4
Month
0.00
5.00
10.00
15.00
20.00
25.00
30.00
35.00
(b)
Total Turtle Individuals by Species
Total Turtle Observation Rates by Species
Obs
erva
tion
Rat
e (O
r)
0
Green turtles
Loggerhead turtles
Hawksbill turtles
Green turtles
Loggerhead turtles
Hawksbill turtles
20
40
60
80
100
120
140
Tota
l Num
ber
of In
divi
dual
s S
ight
ed
Fig. 10—(a) Total number of sea turtles by species sighted by all observers on all surveys from December 2013 to November 2014. (b) Observation rates (number of individuals/on-effort observational hours × 100) of sea turtles by species from December 2013 to November 2014.
SpeciesSeismicSurvey
Other Survey (Transect)
Other Survey (Opportunistic)
OtherSurvey
(Combined)
SightingsLoggerhead turtle (Caretta caretta) 59 0 0 0Green turtle (Chelonia mydas) 226 5 22 27Hawksbill turtle (Eretmochelys
imbricata) 44 0 0 0
Olive ridley turtle (Lepidochelysolivacea) 1 0 0 0
Unidentified turtle 337 6 97 103Total Turtles 667 11 119 130Individuals
Loggerhead turtle (Caretta caretta) 63 0 0 0Green turtle (Chelonia mydas) 275 5 24 29Hawksbill turtle (Eretmochelys
imbricata) 45 0 0 0
Olive ridley turtle (Lepidochelysolivacea) 1 0 0 0
Unidentified turtle 527 7 142 149Total Turtles 911 12 166 178
Table 2—Total turtle observations by species and survey type.
SPE_OGF_177780_160014.indd 10 09/11/16 4:48 PM

December 2016 • Oil and Gas Facilities 11
Olive Ridley Turtle. A single olive ridley turtle was recorded in June.
Rays. A total of 184 rays were observed throughout the pro-gram. Of those that could be identified to species level, 52 were eagle rays of the genus Mylobatidae. These were most often ob-served jumping 0.5 to 1.5 m out of the water in the deeper wa-ters between Mubarraz and the shallower shoals to the south, with sighting depths ranging between 10.1 and 16.4 m (average = 13.4 m) (Figs. 7 and 8). These rays are common in the area and known to often jump out of the water to avoid predators and remove para-sites. In addition, stingrays were frequently encountered over the shallow sandy areas throughout much of the southern portion of the prospect. A total of 41 stingrays were sighted, seven of which were identified as the round ribbon-tail ray (Taeniura meyeri) and one as belonging to the Uarnak complex of stingrays. Sighting depths for stingrays ranged between 1 and 3 m, with an average of 1.7 m. Rays were recorded during every month between January and No-vember 2014, with a peak in February (On = 56) (Fig. 11).
Comparison of Observations With Seismic Activity and Survey Type. No significant association was observed between marine-mammal observation rates recorded alongside seismic surveys (in-dividuals and observations) and total seismic activity (R2 = 0.01 and 0.02, respectively). This result remains the same when com-paring marine-mammal observation rates recorded during ad-ditional surveys (individuals and observations) and total seismic activity (R2 = –0.1 and –0.20, respectively) (Fig. 12; Table 3). In contrast, highly significant positive associations were observed be-tween turtle observation rates recorded alongside seismic surveys (individuals and observations) and total seismic activity (R2 = 0.39 and 0.32, respectively; P ≤ 0.001). No significant association was observed between turtle observation rates and total seismic surveys during additional surveys (R2 = 0.03 and 0.03, respectively) (Fig. 13; Table 4).
28% of all turtle sightings. An area of high green turtle density co-incided with the area of high overall turtle density off the east coast of Marawah Island (Figs. 7 and 8). Low total numbers and observa-tion rates were recorded in January, but climbed steadily to a peak in September (On = 125; Or = 31.10). However, green turtle num-bers and observation rates decreased in October to approximately one-half of those observed during the previous month (On = 70; Or = 16.80) (Fig. 10).
Loggerhead Turtles. Loggerhead turtles, the second-most-com-monly-observed sea turtle identified to species, were observed every month between April and November, with monthly totals ranging from two (November) to a high of 13 in August, with a re-sultant observation rate of 3.23 for that month (Fig. 10).
Hawksbill Turtles. This species was observed every month be-tween June and November, with monthly totals ranging from four in June to a high of 13 in July (Or = 4.36) (Fig. 10).
0
Jan-
14
Feb-1
4
Mar-1
4
Apr-1
4
May-1
4
Jun-
14Ju
l-14
Aug-1
4
Sep-1
4
Oct-14
Nov-1
4
Tota
l Obs
evat
ions
Tota
l Obs
evat
ion
Rat
e (O
r)
10
Total observations
Total Ray Observations
Observation rate
20
30
40
50
60
Month
0.0
5.0
10.0
15.0
20.0
25.0
Fig.11—Total ray observations and observation rates by month from January to November 2014.
00
2.75 3.3
3.32
3.34
3.36
3.38
3.4
3.42
3.44
3.46
2.8
2.85
2.9
2.95
3
3.05
3.1
3.15
0.5
1
1.5
2
2.5
3
3.5
4
50 100
Total Seismic Activity (hours)
Rate of Marine Mammal Observations DuringOther Survey With Total Seismic Activity
Rate of Marine Mammal Individuals DuringOther Survey With Total Seismic Activity
Rate of Marine Mammal Observations DuringSeismic Survey With Total Seismic Activity
Rate of Marine Mammal Individuals DuringSeismic Survey With Total Seismic Activity
150 200 250 300
y = 0.0015x + 1.9268R 2 = 0.0127
y = 0.0014x + 2.2756R 2 = 0.0246
y = –0.0002x + 3.0069R 2 = 0.0134
y = –0.0004x + 3.447R 2 = 0.2034
0 50 100
Total Seismic Activity (hours)
150 200 250 300 0 50 100
Total Seismic Activity (hours)
150 200 250 300
0 50 100
Total Seismic Activity (hours)
150 200 250 300
Log-
Nor
mal
Obs
erva
tion
Rat
e(I
nOr)
0
0.5
1
1.5
2
2.5
3
3.5
4
Log-
Nor
mal
Obs
erva
tion
Rat
e(I
nOr)
Log-
Nor
mal
Obs
erva
tion
Rat
e(I
nOr)
Log-
Nor
mal
Obs
erva
tion
Rat
e(I
nOr)
Fig.12—Scatter plots of log-normal observation rates with total seismic hours. Marine-mammal total observations during seismic survey (top left) is On = 40, and total individuals during seismic survey (top right) is On = 40. Total marine-mammal observations dur-ing other survey (bottom left) is On = 12, and total individuals during other survey (bottom right) is On = 12. Marine-mammal obser-vations during seismic survey (lnMMObsSeis), marine-mammal individuals during seismic survey (lnMMIndSeis), marine-mammal observations during other survey (lnMMindsOther), and marine-mammal individuals during other survey (lnMMIndsOther).
SPE_OGF_177780_160014.indd 11 09/11/16 4:48 PM

12 Oil and Gas Facilities • December 2016
marine mammals and turtles by means of one-way Anova analysis. Mean depth during observations of bottlenose dolphins (Tursiops sp.) was significantly greater than for other marine-mammal spe-cies, with an average observation depth of 10.2 m (P ≤ 0.05) (Fig. 14; Table 7).
No significant difference was observed between mean water depths during observations of different turtle species (Fig. 15).
Damage to Substrate and the Terrestrial Environment. After completion of operations on Marawah Island, post-operation sur-veys were carried out alongside operator decommission surveys, during which the only impact noted was that of vehicle tracks and compressed ground vegetation outside of the designated environ-mental exclusion zones. The total area of impacted ground vegeta-tion was estimated to be approximately 14 000 m2.
No damage to bird nests was observed on any island. This was mostly because of Vibroseis activities being limited to areas below the high-tide mark on all islands except Marawah, where no bird
Observation rates of marine-mammal and turtle observations and individuals were compared between survey types (seismic and additional monitoring) and are presented in Tables 5 and 6. Both marine mammals and turtles showed greater observation rates for both total individuals (Z-score = –3.94 and –4.24, respectively) and observations during the additional survey methods compared with surveys carried out alongside seismic activity (P ≤ 0.001).
Species Distribution. Observation data were plotted to allow comparison of distribution within the study area. After plotting observation data, three areas of high observation concrentration were observed. The majority of dugong observations took place west/northwest of Hail 3 Island, high numbers of ray species were observed in the channel north of Hail 3 Island, and high concen-trations of turtle observations were made along the east coast of Marawah Island (Figs. 7 and 8). No area of concentrated observa-tions was observed for cetacean species.
Analysis of Observation Depth by Species. Mean water depths recorded during observations were compared between species for
Log-Normal Observation Rates: Total Marine-Mammal Observations During Seismic Survey (InMMObsSeis)
Regression Statistics
Multiple R 0.112786131R2 0.012720711Adjusted R2 –0.012594142Standard error 0.686173727Observations 41
ANOVA
df SS MS F SignificanceF
Regression 1 0.236594231 0.236594231 0.5024999 0.482619914Residual 39 18.36254098 0.470834384Total 40 18.59913521
CoefficientsStandard
Error t Stat P-Value Lower 95% Upper 95% Lower 95.0% Upper 95.0%
Intercept 1.926812833 0.304596867 6.325780198 1.82784E–07 1.310707515 2.542918151 1.310707515 2.542918151X Variable 1 0.001533124 0.002162765 0.708872273 0.482619914 –0.002841481 0.005907729 –0.002841481 0.005907729
Log-Normal Observation Rates: Total Marine-Mammal Individuals During Seismic Survey (InMMIndSeis)
Regression Statistics
Multiple R 0.156700343R2 0.024554998Adjusted R2 –0.000456413Standard error 0.43770672Observations 41
ANOVA
df SS MS F SignificanceF
Regression 1 0.188091055 0.188091055 0.981751818 0.327874608Residual 39 7.471899734 0.191587173Total 40 7.659990789
CoefficientsStandard
Error t Stat P-Value Lower 95% Upper 95% Lower 95.0% Upper 95.0%
Intercept 2.275627 0.194300788 11.71187738 2.4276E–14 1.882616561 2.668637439 1.882616561 2.668637439X Variable 1 0.001366971 0.001379617 0.9908339 0.327874608 –0.001423567 0.004157509 –0.001423567 0.004157509
Table 3—Regression analysis log-normal observations with total seismic activity. Marine-mammal observations during seismic survey (lnMMObsSeis), marine-mammal individuals during seismic survey (lnMMIndSeis), marine-mammal observations during other survey (lnMMObsOther), and marine-mammal individuals during other survey (lnMMIndsOther).
SPE_OGF_177780_160014.indd 12 09/11/16 4:48 PM

December 2016 • Oil and Gas Facilities 13
found on Mubarraz in March. It was noted that this individual had numerous abrasions consistent with being caught in fishing gear. The dead dolphin was a juvenile humpback dolphin found in a des-iccated state on Arc Island in September.
DiscussionThroughout the course of the 3D seismic survey, no significant environmental impact was observed. This includes any impacts to both the marine and the terrestrial environment.
Species-Observation Rates. Observation rates of individuals fluctu-ated throughout the course of the seismic survey; however, no signif-icant reduction in observation rates for marine mammals and turtles was observed. Dugong, humpback dolphin, and bottlenose dolphin individual-observation rates all showed sharp increases toward the end of the seismic survey, peaking to highest levels during October and November. A similar pattern was observed with turtle species, with fluctuation throughout the seismic survey, but with loggerhead
nests or other environmentally sensitive areas were observed along source lines.
Vehicle tracks below the high-tide mark were monitored regu-larly and noted to be of short-term impact, remaining visible for only a number of days.
Species Mortality. During the course of the current project, five dead dugongs, one dead dolphin, one dead juvenile baleen whale, and 10 dead sea turtles were recorded (Fig. 16). The dead whale was estimated at approximately 5 m in length and may have been a Bryde’s whale (Balaenoptera edeni), although this could not be established conclusively from the images obtained. Of the 10 dead sea turtles encountered, three were identified as green turtles, two as loggerhead turtles, and one as an olive ridley turtle, with the re-maining four not identified to species. The finding of a dead olive ridley sea turtle further confirms the presence of this species in this area, with one at-sea sighting reported during the project. Out of the five dead dugongs reported, four were found at sea in various stages of decay, with one dugong in an advanced stage of decomposition
Log-Normal Observation Rates: Total Marine-Mammal Observations During Other Survey (InMMObsOther)
Regression Statistics
Multiple R 0.115830861R2 0.013416788Adjusted R2 –0.085241533Standard error 0.088730761Observations 12
ANOVA
df SS MS F SignificanceF
Regression 1 0.001070689 0.001070689 0.135992467 0.719985626Residual 10 0.07873148 0.007873148Total 11 0.079802169
CoefficientsStandard
Error t Stat P-Value Lower 95% Upper 95% Lower 95.0% Upper 95.0%
Intercept 3.006885213 0.112651202 26.69199404 1.2576E–10 2.755882693 3.257887733 2.755882693 3.257887733X Variable 1 –0.000246096 0.000667339 –0.368771565 0.719985626 –0.001733019 0.001240828 –0.001733019 0.001240828
Log-Normal Observation Rates: Total Marine-Mammal Individuals During Other Survey (InMMIndsOther)
Regression Statistics
Multiple R 0.450971707R2 0.203375481Adjusted R2 0.123713029Standard error 0.035369241Observations 12
ANOVA
df SS MS F SignificanceF
Regression 1 0.003193717 0.003193717 2.552965366 0.141171217Residual 10 0.012509832 0.001250983Total 11 0.015703549
CoefficientsStandard
Error t Stat P-Value Lower 95% Upper 95% Lower 95.0% Upper 95.0%
Intercept 3.447022157 0.044904242 76.76384292 3.43683E-15 3.346969272 3.547075043 3.346969272 3.547075043X Variable 1 –0.000425031 0.00026601 –1.597800165 0.141171217 –0.001017738 0.000167676 –0.001017738 0.000167676
Table 3 (continued)—Regression analysis log-normal observations with total seismic activity. Marine-mammal observations during seismic survey (lnMMObsSeis), marine-mammal individuals during seismic survey (lnMMIndSeis), marine-mammal observations during other survey (lnMMObsOther), and marine-mammal individuals during other survey (lnMMIndsOther).
SPE_OGF_177780_160014.indd 13 09/11/16 4:48 PM

14 Oil and Gas Facilities • December 2016
found during observations made by other surveys; however, this re-sult was not significant.
The observed results suggest that while total seismic activity can be considered a reliable indicator of total turtle numbers, the relationship is positive, with turtle numbers increasing with in-creased seismic activity. It is not clear why a positive relationship should occur for these species, but it is possible that the noise cre-ated by seismic activity may cause turtles to spend more time at the surface, where they are more easily observed by vessel-based observers. Observations of turtles fleeing at the water’s surface have been reported to be inversely correlated with vessel speed (Hazel et al. 2007). This is most likely a result of turtles having time to react to oncoming vessels and moving accordingly. All of the seismic-source vessels used in the current project were slow moving, particularly during active seismic survey. Therefore, the increased turtle observations reported during increased seismic ac-tivity may be more related to the vessel speed than the seismic noise itself.
Observation Rates by Survey Type. Observation rates of both marine mammals and turtles were significantly higher during ad-ditional surveys than when recorded alongside seismic activity (P ≤ 0.01). This included observation rates of both total observa-tions and total individuals.
The general purpose of protected-species mitigation measures, including those developed for use during this survey, is to allow seismic activity to occur while reducing the risk of injury and dis-turbance to those species (JNCC 2010). The primary tools used to achieve this aim include the use of prewatch and soft-start proce-dures—first, to ensure that no animals are within a critical distance of the sound source before any seismic activity, and, second, to in-troduce the sound source gradually at increasing levels to allow
and hawksbill turtles remaining at similar levels. Green turtle obser-vation rate, however, showed a sharp peak during September.
While the current study represents the first of its kind in the area providing unique data on the distribution and frequency of marine species, data collection was limited to the duration of the seismic survey. To accurately assess species patterns, a longer-term study is recommended, ideally over the course of a full year to assess an-nual changes. Longer studies covering a period of 10 years have been suggested by some authors, with at least two surveys carried out 10 years apart, allowing for a 95% confidence rate in observed trends (Marsh 1989; Marsh et al. 1995).
To assess clearly any impact on species numbers within the area, observation rates should be analyzed across the short, medium, and long term. Our data collection was limited to a period of 12 months and displays fluctuations across the short and medium term, over which observation rates showed marked increases for most species; however, long-term trends could not be assessed.
Observation Rates With Seismic Activity. No significant relation-ship was found between marine-mammal observation rates (both observations and individuals) and total seismic activity, either dur-ing observations made alongside the seismic survey or during other surveys. This result suggests that the amount of seismic activity (in this case, the total number of seismic hours) cannot be considered a reliable indicator of marine-mammal numbers and that, during the current study, increasing the amount of seismic activity did not di-rectly reduce marine-mammal numbers within the area.
In contrast, a significant positive relationship between the amount of seismic activity and total turtle observation rates (ob-servations and individuals) was recorded during observations made alongside seismic activity (P ≤ 0.001). A positive relationship be-tween total turtle observations and total seismic activity was also
Total Turtle Observations During Seismic SurveyWith Total Seismic Activity
Total Turtle Individuals During Seismic SurveyWith Total Seismic Activity
Total Turtle Observations During Other SurveyWith Total Seismic Activity
Total Turtle Individuals During Other SurveyWith Total Seismic Activity
01.5
1.7
1.9
2.1
2.3
2.5
2.7
2.9
50 100
Total Seismic Activity (hours)
150 200 250
y –0.0041x + 1.6566R 2 = 0.3872
y –0.004x + 1.981R 2 = 0.3243
y = 9×10⁻⁵x + 2.7595R 2 = 0.0314
y = 7×10⁻⁵x + 3.108R 2 = 0.0337
300 01.5
1.7
1.9
2.1
2.3
2.5
2.7
2.9
3.1
50 100
Total Seismic Activity (hours)
150 200 250 300
02.6
2.65
2.7
2.75
2.8
2.85
50 100
Total Seismic Activity (hours) Total Seismic Activity (hours)
150 200 250 300 03.063.073.083.093.13.113.123.133.143.153.16
50 100 150 200 250 300
Log-
Nor
mal
Obs
erva
tion
Rat
e(I
nOr)
Log-
Nor
mal
Obs
erva
tion
Rat
e(I
nOr)
Log-
Nor
mal
Obs
erva
tion
Rat
e(I
nOr)
Log-
Nor
mal
Obs
erva
tion
Rat
e(I
nOr)
Fig.13—Scatter plots of log-normal observation rates with total seismic hours. Turtle total observations during seismic survey (top left) is On = 44, and total individuals during seismic survey (top right) is On = 44. Total turtle observations during other survey (bot-tom left) and total individuals during other survey (bottom right) are On = 17. Turtle observations during seismic survey (lnTObsSeis), turtle individuals during seismic survey (lnTIndSeis), turtle observations during other survey (lnTindsOther), and turtle individuals during other survey (lnTIndsOther).
SPE_OGF_177780_160014.indd 14 09/11/16 4:48 PM

December 2016 • Oil and Gas Facilities 15
After analysis comparing observation rates with total seismic activity, no significant result was observed for marine mammals, but a significant positive association was observed for turtles.
Our data suggest that while animals may have moved away from seismic activity, this effect was temporary, with no large-scale net movement out of the surrounding area during the study period. This indicates that the mitigation measures put in place for the project may have been successful in their aims to ensure that animals were temporarily moved away from activity so that seismic testing could be carried out safely without permanently displacing individuals.
Species Distribution and Density. Throughout the course of the study, the location of species observations were recorded and plotted using QGIS (2015) software. In doing so, near-real-time monitoring of species distribution and relative densities within the prospect area was achieved. Areas of high relative density were re-corded for dugong, turtle, and ray species within the prospect area west/southwest of Hail 3 Island, along the east coast of Marawah
any animals within close proximity that were not observed to move away to a safer distance before full power is achieved.
The higher observation rates recorded during surveys carried out independently and away from any seismic activity compared with those recorded alongside seismic activity suggest that both marine mammals and turtles may be moving away from the sound source, but are not displaced significantly from the wider sur-rounding area.
Patterns of Observation Rates. Observation rates of all species fluctuated over time; however, no overall reduction was observed to occur over the study period as a result of the seismic activity being carried out. For a number of species, observation rates in-creased sharply toward the later stages of the survey (October–November 2014). Further, after comparisons between survey types, our data show higher observation rates for all species groups during the additional surveys compared with those carried out alongside seismic operations.
Log-Normal Observation Rates: Total Turtle Observations During Seismic Survey (InTObsSeis)
Regression Statistics
Multiple R 0.62224537R2 0.387189301Adjusted R2 0.372937889Standard error 0.257888632Observations 45
ANOVA
df SS MS F SignificanceF
Regression 1 1.806882287 1.806882287 27.16848771 5.03581E–06Residual 43 2.859781492 0.066506546Total 44 4.666663779
CoefficientsStandard
Error t Stat P Value Lower 95% Upper 95% Lower 95.0% Upper 95.0%
Intercept 1.656582263 0.114038791 14.52648041 3.43534E–18 1.426601123 1.886563403 1.426601123 1.886563403X Variable 1 0.004117825 0.000790015 5.212339946 5.03581E–06 0.002524608 0.005711041 0.002524608 0.005711041
Log-Normal Observation Rates: Total Turtle Individuals During Seismic Survey (InTIndSeis)
Regression Statistics
Multiple R 0.569470456R2 0.3242966Adjusted R2 0.308582567Standard error 0.286907177Observations 45
ANOVA
df SS MS F SignificanceF
Regression 1 1.698781691 1.698781691 20.63738882 4.45355E–05Residual 43 3.539576315 0.082315728Total 44 5.238358006
CoefficientsStandard
Error t Stat P Value Lower 95% Upper 95% Lower 95.0% Upper 95.0%
Intercept 1.980953079 0.126870841 15.61393511 2.50064E–19 1.725093644 2.236812514 1.725093644 2.236812514X Variable 1 0.003992746 0.00087891 4.542839291 4.45355E–05 0.002220255 0.005765237 0.002220255 0.005765237
Table 4—Regression analysis log-normal observation rates with total seismic activity. Turtle observations during seismic survey (lnTObs Seis), turtle individuals during seismic survey (lnTIndSeis), turtle observations during other survey (lnTObsOther), and turtle individuals dur-ing other survey (lnTIndsOther).
SPE_OGF_177780_160014.indd 15 09/11/16 4:48 PM

16 Oil and Gas Facilities • December 2016
the majority of rays observed in the channel north of Hail 3 Island belonged to the Myliobatidae family, a group of species that prefer deeper, faster-moving waters. Most of the species observed at the southern end of the channel in the center of the study area belonged to the Dasyatidae family, which prefer shallower sandy areas.
Average water depth during observation was recorded and com-pared between species for marine mammals and turtles. Of the ma-rine-mammal species observed, most observations took place in waters 6 to 7 m deep. The mean water depth during observations of bottlenose dolphins (Tursiops sp.), however, was significantly greater than that for other species at 10.2 m. This pattern is also visible in Fig. 7, with bottlenose dolphins predominantly being ob-served in the deeper waters in the north of the study area. No signif-icant difference was observed between mean water depths during turtle observations.
Damage to Substrate and the Terrestrial Environment. The mit-igation measures created for use while operating within mangrove
Island, and north of Hail Island within the deepwater channel be-tween Hail 3 Island and Mubarraz Island, respectively.
Upon discovery of these high-density areas for dugong and sea turtles, additional mitigation measures were created and used for vessels operating within these areas. This included vessel speed limits being reduced to a maximum of 10 knots and in-creased awareness and observation by vessel crew while moving throughout the areas.
No increase to species mortality was observed while operating within these areas.
The reason for the higher concentration of dugong observa-tions in one particular area is not clear. Further investigation of the area revealed the substrate to consist mainly of algae-covered coral rubble and not significant seagrass beds, as would be expected if the area was used for feeding. Instead, the area may represent a site used more as a nursery or other social purpose.
For ray species, the areas of concentrated observations were ex-pected when considering the biology of these species. For example,
Log-Normal Observation Rates: Total Turtle Observations During Other Survey (InTObsOther)
Regression Statistics
Multiple R 0.177232167R2 0.031411241Adjusted R2 –0.033161343Standard error 0.019506667Observations 17
ANOVA
df SS MS F SignificanceF
Regression 1 0.000185099 0.000185099 0.486448569 0.49618502Residual 15 0.005707651 0.00038051Total 16 0.00589275
CoefficientsStandard
Error t Stat P-Value Lower 95% Upper 95% Lower 95.0% Upper 95.0%
Intercept 2.759525085 0.02076569 132.8886802 1.87251E–24 2.715264065 2.803786104 2.715264065 2.803786104X Variable 1 8.97319E–05 0.000128655 0.69745865 0.49618502 –0.000184491 0.000363954 –0.000184491 0.000363954
Log-Normal Observation Rates: Total Turtle Individuals During Other Survey (InTIndsOther)
Regression Statistics
Multiple R 0.187078222R2 0.034998261Adjusted R2 –0.045418551Standard error 0.01449426Observations 14
ANOVA
df SS MS F SignificanceF
Regression 1 9.14306E–05 9.14306E–05 0.435210751 0.521903464Residual 12 0.002521003 0.000210084Total 13 0.002612434
CoefficientsStandard
Error t Stat P-Value Lower 95% Upper 95% Lower 95.0% Upper 95.0%
Intercept 3.109414278 0.015593989 199.3982571 1.70221E–22 3.075437894 3.143390662 3.075437894 3.143390662X Variable 1 6.36257E–05 9.64457E–05 0.659705049 0.521903464 –0.000146511 0.000273763 –0.000146511 0.000273763
Table 4 (continued)—Regression analysis log-normal observation rates with total seismic activity. Turtle observations during seismic survey (lnTObsSeis), turtle individuals during seismic survey (lnTIndSeis), turtle observations during other survey (lnTObsOther), and turtle individu-als during other survey (lnTIndsOther).
SPE_OGF_177780_160014.indd 16 09/11/16 4:48 PM

December 2016 • Oil and Gas Facilities 17
Seismic Survey Other Survey
SpeciesObs. (On)
Obs. Rate(Or) lnOr
Individuals(On)
Obs. Rate(Or) lnOr
Obs. (On)
Obs. Rate(Or) lnOr
Individuals(On)
Obs. Rate(Or) lnOr
Dugong (Dugong dugon) 73 1.74 0.30 99 2.35 0.30 8 6.69 0.31 9 7.52 0.27Bottlenose dolphin
(Tursiops sp.) 20 0.48 0.21 57 1.36 0.27 5 4.18 0.30 29 24.25 0.28
Humpback dolphin (Sousachinensis) 20 0.48 0.21 30 0.71 0.24 10 8.36 0.31 37 30.93 0.28
Unidentified dolphin 23 0.55 0.22 43 1.02 0.25 0 0.00 0.00 0 0.00 0.00Finless porpoise
(Neophocaenaphocaenoides)
9 0.21 0.16 9 0.21 0.18 2 1.67 0.29 2 1.67 0.26
Unidentified marine mammal 3 0.07 0.11 3 0.07 0.14 0 0.00 0.00 0 0.00 0.00
Total Marine Mammals 148 3.52 0.35 241 5.73 0.35 25 20.90 0.32 77 64.38 0.28
Loggerhead turtle (Carettacaretta) 59 1.40 0.28 63 1.50 0.27 0 0.00 0.00 0 0.00 0.00
Green turtle (Cheloniamydas) 226 5.37 0.39 275 6.54 0.36 27 22.57 0.32 29 24.25 0.28
Hawksbill turtle (Eretmochelys imbricata) 44 1.05 0.26 45 1.07 0.26 0 0.00 0.00 0 0.00 0.00
Olive ridley turtle (Lepidochelys olivacea) 1 0.02 0.07 1 0.02 0.11 0 0.00 0.00 0 0.00 0.00
Unidentified turtle 337 8.01 0.42 527 12.53 0.40 103 86.11 0.33 149 124.5 0.29Total Turtles 667 15.86 0.48 911 21.66 0.43 130 108.69 0.33 178 148.8 0.29
Table 5—Total observation numbers and rates by species and survey type (lnOr = log-normal observation rate).
Seismic Survey Other Survey
Species Group On Mean (Or) SD (Or) Median N Mean (Or) SD (Or) Median Z-score P-value
SightingsMarine mammals 11 2.96 1.84 2.42 11 40.00 20.22 35.59 –3.94 <0.001Turtles 17 28.06 22.35 22.57 17 179.37 184.20 125.79 –4.24 <0.001
IndividualsMarine Mammals 11 5.82 6.35 3.37 11 129.95 146.13 96.62 –3.87 <0.001Turtles 17 39.08 39.14 24.35 17 261.96 351.28 157.23 –3.82 <0.001
Table 6—Mann-Whitney U test comparing mean observation rates during weeks of sightings during both survey types between seismic and additional survey methods for marine mammals and turtles. (SD = standard deviation.)
0Dolphin, B Dolphin, H Dugong Porpoise
Dep
th (
m)
5
10
15
20
Marine Mammal Observation Water Depth
Fig.14—Box plot of marine-mammal observation depths by species (P ≤ 0.05).
SPE_OGF_177780_160014.indd 17 09/11/16 4:48 PM

18 Oil and Gas Facilities • December 2016
Seismic operations on Marawah Island included the use of Vi-broseis vehicles across a large portion of the island. Three areas of high environmental sensitivity were recorded on the island, con-sisting of three areas of mangrove growth along the eastern shore-line. As a result, no vehicles were permitted to enter these areas and all equipment was laid by hand by trained and experienced crew.
During environmental-profile surveys before seismic opera-tions, existing environmental damage within these areas was re-corded, including the presence of garbage and evidence of tree harvesting. No additional significant damage was recorded during post-operation assessments of these areas. Damage to other areas not classified as environmentally sensitive was limited to vehicle tracks within the substrate and patches of crushed or compressed vegetation. Affected vegetation in these areas were dominated by halophytic, salt-resistant plants and semi-woody dwarf shrubs, none of which are listed as being a conservation concern.
Species Mortality. Our data represents total numbers observed. At present, few population assessments of marine species specific to the area have been carried out, with the current study representing the first of its kind to describe marine-mammal- and turtle-species numbers.
A study carried out by Al-Ghais and Das (2001) estimated du-gong numbers in the wider area to be 1,861 in the summer, in-creasing to 2,185 in the winter. These sightings indicated key areas (80% of recorded sightings during study) to occur around the is-lands of Abu Al Abyad, Salalah, Marawah, Janannah, Al-Fayl, Al
areas were used during operations within the terrestrial environ-ment. As a result, no significant damage to substrate and the ter-restrial environment was observed.
On Hail 2, Arc, Umm Amim, and Hail Natural Island, Vibroseis activities were limited to the sand flats below the high-water mark. Any other equipment that needed to be laid across the islands and in areas of vegetation was done so by hand by crew who had been strictly instructed and trained to minimize environment disturbance in these areas.
Depth Range (m)
Species/Species Group Average Depth
(m) Minimum Maximum Project Total
Sightings
Dugong 7.3 2.2 16.3 81Indo-Pacific humpback dolphin 6.1 1.2 12.5 30Bottlenose dolphin 10.2 4.1 19.2 25Finless porpoise 7.6 1.9 13.3 11Green turtle 6.3 1.0 16.1 253Loggerhead turtle 6.7 0.5 15.7 59Hawksbill turtle 5.6 1.0 14.6 44Olive ridley turtle n/a 6.0 6.0 1Turtle sp. 6.2 0.3 16.8 440All turtles combined 6.2 0.3 16.8 797
Table 7—Water depths during observations of marine-mammal and turtle species.
Turtle sp.
Turtle Observation Water Depth
0
Dep
th (
m)
4
8
12
16
Turtle, Gr Turtle, Ha Turtle, Lo
Fig.15—Box plot of turtle observation depths by species (nonsignificant).
10
5
1 1
WhaleDolphinDugongSea Turtles0
Tota
l Num
ber
2
4
6
8
10
12
Species/Species Group
Total Number of Dead Animals Observed
Fig.16—Total number of dead animals observed throughout the study by species.
SPE_OGF_177780_160014.indd 18 09/11/16 4:48 PM
December 2016 • Oil and Gas Facilities 19
study allowed analysis over a period of 12 months; however, it is recommended that future research be carried out to assess these patterns over a longer period, ideally 5 to 10 years, to confidently assess abundance and distribution (Marsh 1989; Marsh et al. 1995).
Because of the relatively high observation frequency, it is likely that a number of the marine mammals observed in the current study represent a local population. To assess this and allow further ex-ploration of the marine-mammal population present in the area, studies identifying the recapture rate involving the photo identifi-cation of individuals and subsequent network analysis are recom-mended. This type of research has been carried out on a number of marine-mammal populations worldwide (Whitehead 1994, 1997, 1999, 2008a, 2008b; Whitehead et al. 1982, 2005; Whitehead and Dufault 1999), as well as being applied to other species, including elasmobranchs and terrestrial mammals (MacGlennon 2008; Wit-temyer et al. 2005).
Environmental Supervision During Oil and Gas Activities. Before the project startup, an extensive HSEIA was produced to identify and reduce where possible any potential impacts on the environment from operations. In providing continuous in-field en-vironmental supervision throughout the entirety of the project, po-tential environmental impacts from operations during the Hail 3D seismic survey were monitored in real time and actively managed, either removing or reducing these risks to lower levels.
A further benefit of this work includes the collection of detailed data across a long period of time in an area in which, to date, little data currently exist. It is hoped that these data may be beneficial to the production of environmental policy and environmental man-agement of the area, as well as provide a better understanding of the marine species present within UAE waters as a whole.
Nomenclature On = number of observations Or = unit observation rate Ot = total observation time
ReferencesAckerman, B. B., Wright, S. D., Bonde, R. K. et al. 1995. Trends and Pat-
terns in Mortality of Manatees in Florida, 1974–1992. In Informa-tion and Technology Report 1: Population Biology of the Florida Manatee, T. J. O’Shea, B. B. Ackerman, and H. F. Percival (eds.), 223–258, US Department of the Interior, National Biological Service, Washington, DC (August 1995).
Al-Ghais, S. M. and Das, H. S. 2001. Conservation of Dugongs in the UAE. Second Annual Report of the study submitted to Total Abu Al-Buk-hoosh, 32 pages.
ASCOBANS. 2015. Agreement on the Conservation of Small Cetaceans in the Baltic, North East Atlantic, Irish and North Seas. http://www.as-cobans.org/en/documents/agreement-text (accessed 26 August 2015).
Clark, C. W. and Gagnon, G. C. 2006. Considering the Temporal and Spa-tial Scales of Noise Exposures From Seismic Surveys on Baleen Whales. Presented at the 58th Meeting of the International Whaling Commission, St. Kitts, 26 May–6 June. SC58/E9.
Convention on Migratory Species (CMS). 2007. Memorandum of Under-standing on the Conservation and Management of Dugongs (Dugong dugon) and Their Habitats Throughout Their Range. CMS/DU-GONG/Inf.5, Agenda Item 10.0, Abu Dhabi, UAE, 28–31 October. http://www.cms.int/sites/default/files/document/Inf_05_Dugong_MoU_E_0.pdf.
Convention on Migratory Species (CMS). 2009. Memorandum of Under-standing on the Conservation and Management of Marine Turtles and Their Habitats of the Indian Ocean and South-East Asia. Con-cluded under the auspices of the Convention on the Conservation of Migratory Species of Wild Animals, Manila, 23 June 2001, Amended by consensus 1 March 2009. http://www.cms.int/sites/default/files/in-strument/mou_cmp_2009_e.pdf.
Bazm, and Bu Tinha (Al-Ghais and Das 2001). Without a clear un-derstanding of total population sizes and dynamics in the area, it is unclear whether the numbers of dead individuals observed during the current study represent a significant percentage of the total pop-ulation or normal mortality rates, or at least those in areas with similar third-party risks, such as vessel collision and fishing gear, without any seismic activity.
Studies carried out for the Queensland Parks and Wildlife Ser-vice indicate that, since 1996, up to 30% of the 80 dugong reported dead to the service had died as a result of disease and parasites (Haines and Limpus 2000, as cited in Marsh et al. 2002). Detailed information on the natural mortality rate within dugong popula-tions is lacking; however, because they are long-lived and late to mature with low fecundity, natural mortality rates within dugong populations are assumed to be low (Marsh et al. 1984).
The low numbers of dead marine mammals, turtles, and birds observed over the course of the seismic survey were not consid-ered attributable to seismic activity. Although the exact cause of death for different species could not be determined, the presence of cracked shells and the high numbers of fast-moving third-party watercraft frequently observed in the area suggest that the primary cause of mortality to turtles in the area was vessel strike. Vessel strike causing increased mortality to both Sirenia and turtle species has been reported by a number of authors (Hazel et al. 2007; Hazel and Gyuris 2006; Ackerman et al. 1995; Greenland and Limpus 2005), and is considered a major factor contributing to mortality and population decline of both turtles and marine mammals. Fur-ther, marine mammals and turtles are also at high risk of entangle-ment and subsequent drowning in fishing gear. Of the total of five dead dugong observed, one was observed with numerous abrasions consistent with being caught in fishing gear.
Dead birds observed in the area primarily consisted of Socotra cormorants (Phalacrocorax nigrogularis). The majority of these were found on the shore above the high-water line and in close proximity to discarded fishing nets and other fishing debris. Cor-morants feed under the water, where they dive for small fish and in-vertebrates. For this reason, it is highly likely that these birds were caught in fishing gear and later discarded by local fisherman.
For future studies, it is recommended that necropsies be carried out on dead marine mammals and turtles when found, a strategy commonly used in the UK Cetacean Strandings Investigation Pro-gramme (CSIP 2015); however, it is not known if such facilities currently exist within the UAE.
Limitations of Study and Future Research. The current study represents the first of its kind in respect to a major oil company taking further steps to proactively manage its environmental and ecological footprint during operations. While every effort was made to ensure scientific robustness of sampling methods and sur-vey design, it is important to note that this work was carried out alongside an active seismic-testing program and was not originally planned to be part of a more-detailed scientific analysis. For ex-ample, no hypothesis was made before the start of the study, with the aim of our research and data collection being of an exploratory nature to investigate patterns in species abundance and distribution and how this interacted with seismic operations during a survey of this type. This ultimately allowed the correct implementation of mitigation actions as identified in the project HSEIA. It is hoped that this knowledge can be used as a foundation on which to apply more-detailed and -specific research in the area and provide a better understanding of environmental management during future seismic surveys of this type.
For any study investigating patterns in species abundance, a large sample (ideally spanning over a significant time period) is necessary to accurately assess patterns and account for short-term changes as a result of influencing factors such as environmental conditions (temperature, salinity, pH, plankton levels), changes in food abundance, observer bias, and sampling error. The current
SPE_OGF_177780_160014.indd 19 09/11/16 4:48 PM
20 Oil and Gas Facilities • December 2016
State of the Marine Environment Report for Australia: Technical Annex 1. The Marine Environment, L. P. Zann and P. Kailola (eds.), 151–166. Queensland, Australia: Great Barrier Reef Marine Park Authority.
Marsh, H., Heinsohn, G. E., and Marsh, L. M. 1984. Breeding Cycle, Life History and Population Dynamics of the Dugong, Dugong dugon (Si-renia: Dugongidae). Australian Journal of Zoology 32 (6): 767–788. http://dx.doi.org/10.1071/ZO9840767.
Marsh, H., Penrose, H., Eros, C. et al. 2002. Dugong Status Report and Action Plans for Countries and Territories. UNEP/DEWA/RS.02-1, United Nations Environment Programme, Nairobi, Kenya, http://www.unep.org/NairobiConvention/docs/dugong.pdf.
McCauley, R. D., Fewtrell, J., Duncan, A. J. et al. 2000. Marine Seismic Surveys—A Study of Environmental Implications. APPEA 2000: 692–708.
Nautica Environmental Associates LLC. 2012. ADNOC Hail Field 3D Seismic Survey Health, Safety and Environmental Impact Assess-ment Report. ADCO MWO No. 92218379, internal report, Abu Dhabi, UAE.
OSPAR Commission. 2009. Overview of the Impacts of Anthropogenic Underwater Sound in the Marine Environment. Publication Number 441/2009, OSPAR Commision, London, http://qsr2010.ospar.org/media/assessments/p00441_Noise_background_document.pdf (ac-cessed 12 August 2015).
Parente, C. L., Lontra, J. D., and de Araújo, M. E. 2006. Occurrence of Sea Turtles During Seismic Surveys in Northeastern Brazil. Biota Neo-trop. 6 (1). http://dx.doi.org/10.1590/S1676-06032006000100004.
QGIS, A Free and Open Source Geographic Information System. 2015. http://www.qgis.org/en/site/index.html (accessed 26 August 2015).
Richardson, W. J., Würsig, B., and Greene, C. R. 1986. Reactions of Bow-head Whales, Balaena mysticetus, to Seismic Exploration in the Ca-nadian Beaufort Sea. J Acoust Soc Am 79 (4): 1117–1128. http://www.ncbi.nlm.nih.gov/pubmed/3700867.
Southall, B. L., Bowles, A. E., Ellison, W. T. et al. 2007. Marine Mammal Noise Exposure Criteria: Initial Scientific Recommendations. Aquatic Mammals 33 (4): 411–414. http://dx.doi.org/10.1578/AM.33. 4.2007.411.
Stone, C. J. and Tasker, M. L. 2006. The Effects of Seismic Airguns on Cetaceans in UK Waters. J. Cetacean Res. Manage. 8 (3): 255–263.
Federal Law No. [23] of the year 1999 Concerning Exploitation, Protection and Development of the Living Aquatic Resources in the State of the United Arab Emirates. 1999. Ministry of Agriculture and Fisheries, UAE (issued 7 August 2001). https://www.ead.ae/Documents/PDF-Files/Federal-Law-No-23-of-1999-Eng.pdf.
Federal Law No. (24) of 1999 for the Protection and Development of the Environment. 1999. UAE Official Gazette, Issue No. 340 (28 October 1999). http://faolex.fao.org/docs/pdf/uae67811E.pdf.
Weir, C. R. 2007. Observations of Marine Turtles in Relation to Seismic Airgun Sound off Angola. Marine Turtle Newsletter 116: 17–20. http://www.seaturtle.org/mtn/archives/mtn116/mtn116p17.shtml.
Weir, C. R. 2008. Overt Responses of Humpback Whales (Megaptera no-vaeangliae), Sperm Whales (Physeter macrocephalus), and Atlantic Spotted Dolphins (Stenella frontalis) to Seismic Exploration off An-gola. Aquatic Mammals 34 (1): 71–83. http://dx.doi.org/10.1578/AM.34.1.2008.71.
Weir, C. R. and Dolman, S. J. 2007. Comparative Review of the Regional Marine Mammal Mitigation Guidelines Implemented During Indus-trial Seismic Surveys, and Guidance Towards a Worldwide Standard. Journal of International Wildlife Law and Policy 10 (1): 1–27. http://dx.doi.org/10.1080/13880290701229838.
Whitehead, H. 1994. Investigating Structure and Temporal Scale in Social Organisations Using Identified Individuals. Behavioural Ecology 6 (2): 199–208. http://dx.doi.org/10.1093/beheco/6.2.199.
Whitehead, H. 1997. Analysing Animal Social Structure. Animal Behaviour 53 (5): 1053–1067. http://dx.doi.org/10.1006/anbe.1996.0358.
Whitehead, H. 1999. Testing Association Patterns of Social Animals. Animal Behaviour 57 (6): F26–F29. http://dx.doi.org/10.1006/anbe.1999.1099.
Convention on Migratory Species (CMS). 2014. Memorandum of Under-standing on the Conservation of Migratory Sharks. Article IV(4), CMS Secretariat, http://www.cms.int/sites/default/files/instrument/Migratory_Shark_MoU_Eng.pdf.
Cooperation Council for the Arab States of the Gulf. 2009. Convention on the Conservation of Wildlife and Their Natural Habitats in the Coun-tries of the Gulf Cooperation Council. Appendix (II): To Be Protected Fauna Species, http://www.gcc-sg.org/en-us/CognitiveSources/Dig-italLibrary/Lists/DigitalLibrary/Forests%20pastures%20and%20wildlife/1274593978.pdf.
CSIP. 2015. UK Cetacean Strandings Investigation Programme, http://uk-strandings.org/ (accessed 17 August 2015).
DeRuiter, S. L. and Doukara, K. L. 2012. Loggerhead Turtles Dive in Re-sponse to Airgun Sound Exposure. Endang Species Res 16: 55–63.
Di Iorio, L. and Clark, C. W. 2010. Exposure to Seismic Survey Alters Blue Whale Acoustic Communication. Biology Letters 6 (1): 51–54. http://dx.doi.org/10.1098/rsbl.2009.0651.
Emiri Decree No. (18) of 2001 Declaring Marawah as a Protected Ma-rine Area (in Arabic), https://www.ead.ae/Pages/Resources/environ-mental-laws.aspx.
Environmental Agency – Abu Dhabi (EAD). 2013. Marine and Terrestrial Protected Areas in Abu Dhabi. In Annual Report 2013, 45, EAD, https://www.ead.ae/Publications/Annual%20Report%202013/EAD-Annual-report-ENG-2013-amended-2.pdf (accessed 18 August 2015).
Gordon, J., Gillespie, D., Potter, J. et al. 2003. A Review of the Effects of Seismic Surveys on Marine Mammals. Marine Tech Soc 37 (3): 16–34. http://dx.doi.org/10.4031/002533203787536998.
Gosselin, J. F. and Lawson, J. 2005. Distribution and Abundance Indices of Marine Mammals in the Gully and Two Adjacent Canyons of the Scotian Shelf Before and During Nearby Hydrocarbon Seismic Ex-ploration Programs in April and July, 2003. In Acoustic Monitoring and Marine Mammal Surveys in the Gully and Outer Scotian Shelf Before and During Active Seismic Programs, K. Lee, H. Bain, and G. V. Hurley (eds.), Environmental Studies Research Funds Report No. 151, 117–138, Fisheries and Oceans Canada (December 2005), http://www.esrfunds.org/pdf/151.pdf.
Greenland, J. A. and Limpus, C. J. 2005. Marine Wildlife Stranding and Mor-tality, Data and Reports, Dugong 2004. Department of Environment and Heritage Protection, Queensland Government, Brisbane, Australia.
Hazel, J. and Gyuris, E. 2006. Vessel-Related Mortality of Sea Turtles in Queensland, Australia. Wildlife Research 33 (2): 149–154. http://dx.doi.org/10.1071/WR04097.
Hazel, J., Lawler, I. R., Marsh, H. et al. 2007. Vessel Speed Increases Col-lision Risk for the Green Turtle Chelonia mydas. Endang Species Res 3: 105–113. http://www.int-res.com/articles/esr2007/3/n003p105.pdf.
International Terrestrial Reference Frame. 2008. itrf.ensg.ign.fr.Joint Nature Conservation Committee (JNCC). 2010. JNCC Guidelines for
Minimising the Risk of Injury and Disturbance to Marine Mammals From Seismic Surveys. Report, JNCC, Marine Advice, Aberdeen (Au-gust 2010), http://jncc.defra.gov.uk/pdf/jncc_guidelines_seismic%20guidelines_aug%202010.pdf.
Joint Nature Conservation Committee (JNCC). 2015. Seismic Survey, http://jncc.defra.gov.uk/page-1534 (accessed 26 August 2015).
Ljungblad, D. K., Würsig, B., Swartz, S. L. et al. 1988. Observations on the Behavioral Responses of Bowhead Whales (Balaena mysticetus) to Active Geophysical Vessels in the Alaskan Beaufort Sea. Arctic 41 (3): 183–194. http://www.jstor.org/stable/40510714.
MacGlennon, G. 2008. Social Structure and Behaviour of the Manta Ray (Manta birostris) in the Republic of the Maldives. MSc thesis, Bangor University, Bangor, UK.
Madsen, P. T. and Møhl, B. 2000. Sperm Whales (Physeter catodon L. 1758) Do Not React to Sounds From Detonators. J Acoust Soc Am 107 (1): 668–671. http://www.ncbi.nlm.nih.gov/pubmed/10641677.
Marsh, H. 1989. Biological Basis for Managing Dugongs and Other Large Ver-tebrates in the Great Barrier Reef Marine Park. Report to the Great Bar-rier Reef Marine Park Authority, Queensland, Australia (unpublished).
Marsh, H., Corkeron, P. J., Limpus, C. J. et al. 1995. The Reptiles and Mammals in Australian Seas: Their Status and Management. In
SPE_OGF_177780_160014.indd 20 09/11/16 4:48 PM

December 2016 • Oil and Gas Facilities 21
as per observations made during a prewatch. It shall be the decision of the PSO to decide if animals are distressed and a shutdown is required. Operators must facilitate the PSO in this regard.
Guidelines if Marine Mammals/Turtles Remain Stationary in Location. If during a prewatch marine mammals/turtles are ob-served remaining stationary in a particular location and enter the mitigation zone, then a delay to operations must follow, as in the preceding, and run until there has been at least a minimum of 30 minutes of marine-mammal/turtle clear time since the last observa-tion within the 500-m mitigation zone.
Once an observation of marine mammal/turtle has been made, a vessel may not conduct a soft start away from the location and im-mediately return to continue shooting the seismic source toward the animals.
It may be advisable in the preceding situation to relocate opera-tions away from the area to prevent long delays.
Soft-Start Procedure. The soft start is defined as the time that air guns commence shooting until the time that full operational power is obtained. Power should be built up slowly from a low-energy startup (e.g., starting with the smallest air-gun in the array and gradually adding in others) over at least 20 minutes to give adequate time for marine mammals/turtles to leave the area. This buildup of power should occur in uniform stages to provide a con-stant increase in output. There must be a soft start every time the air guns are used (exemption for testing at low power, as detailed subsequently). The duration of the preshooting search (at least 30 minutes) and the soft-start procedure (at least 10 or 20 minutes, de-pending on source size) should be factored into the survey design.
General Advice To Follow for Soft Starts. To minimize ad-ditional noise in the marine environment, a soft start (from com-mencement of soft start to commencement of the line) must not be significantly longer than 20 minutes and not exceed 40 minutes (for example, soft starts greater than 40 minutes are considered to be excessive, and an explanation must be provided within the PSO report).
Once the soft start has been performed and the air guns are at full power, the survey line should start immediately. Operators must avoid unnecessary firing at full power before commencement of the line.
During simultaneous operations, each source vessel must com-plete its own soft start in accordance with the preceding guidance.
Soft Starts for Mini-Source Vessels (Source ≤ 320 in.3). Be-cause of the lower volume source, a reduced soft-start time of 10 minutes will be acceptable for mini-sources up to 320 in.3. Soft starts for mini-sources must follow the same criteria (with the ex-ception of duration) stated previously for soft-start procedures.
Soft-Starts and Air-gun Testing. Air-gun tests may be required before a survey commences, or to test damaged or misfiring guns following repair, or to trial new arrays. Individual air guns, or the entire array, may need testing, and the air guns may be tested at varying power levels. The following guidance is provided to clarify when a soft start is required:
• If the intention is to test all air guns at full power, then a 20-minute soft start is required (10 minutes for mini-source up to 320 in.3).
• If the intention is to test a single air gun on low power, then a soft start is not required.
• If the intention is to test a single air gun or a number of guns on high power, then the air gun or air guns should be fired at lower power first, and the power then increased to the level of the required test; this should be carried out over a time period proportional to the number of guns being tested and ideally not exceed 20 minutes in duration.
Break in Firing >10 Minutes. If, for any reason, firing of the air guns has stopped and not restarted for at least 10 minutes, then a prewatch (30 minutes) and soft start must be carried out before
Whitehead, H. 2008a. Precision and Power in the Analysis of Social Struc-ture Using Associations. Animal Behaviour 75 (3): 1093–1099. http://dx.doi.org/10.1016/j.anbehav.2007.08.022.
Whitehead, H. 2008b. Analyzing Animal Societies: Quantitative Methods for Vertebrate Social Analysis. Chicago: University of Chicago Press.
Whitehead, H. and Dufault, S. 1999. Techniques for Analyzing Vertebrate Social Structure Using Identified Individuals: Review and Recom-mendations. Advances in the Study of Behavior 28: 33–74. http://dx.doi.org/10.1016/S0065-3454(08)60215-6.
Whitehead, H., Bejder, L., and Ottensmeyer, C. A. 2005. Testing Associ-ation Patterns: Issues Arising and Extensions. Animal Behaviour 69 (5): E1–E6. http://dx.doi.org/10.1016/j.anbehav.2004.11.004.
Whitehead, H., Silver, R., and Harcourt, P. 1982. The Migration of Hump-back Whales Along the Northeast Coast of Newfoundland. Can. J. Zool. 60 (9): 2173–2179. http://dx.doi.org/10.1139/z82-278.
Wittemyer, G., Douglas-Hamilton, I., Getz, W. M. 2005. The Socioecology of Elephants: Analysis of the Processes Creating Multitiered So-cial Structures. Animal Behaviour 69 (6): 1357–1371. http://dx.doi.org/10.1016/j.anbehav.2004.08.018.
Yazvenko, S. B., McDonald, T. L., Blokhin, S. A. et al. 2007. Feeding of Western Gray Whales During a Seismic Survey Near Sakhalin Is-land, Russia. Environ Monit Assess 134 (1–3): 93–106. http://dx.doi.org/10.1007/s10661-007-9810-3.
Appendix A—Marine Mammal and Sea Turtle Mitigation Guidelines for Transition-Zone Seismic Operations: ADNOC Hail and Shuweihat 3D CampaignThe following guidelines are based on the JNCC (2010) Guidelines for Minimizing the Risk of Injury and Disturbance to Marine Mam-mals From Seismic Surveys and adapted for use during the Hail and Shuweihat 3D seismic project.
Preshooting Search (Prewatch). During daylight hours, a pre-shooting search (prewatch) will comprise a 30-minute watch be-fore the use of any air guns. A visual assessment will be made to determine if any marine mammals or turtles are within 500 m of the center of the air-gun array (mitigation zone).
If a single boat is to be used with a line change between survey lines, to facilitate effective timing for operations, the prewatch may commence before the end of line (while the air guns are still firing). This is useful for surveys with a relatively short line change.
The PSO will conduct the prewatch from the highest possible vantage point that can be used safely.
Prewatches and other operations must be monitored by a ded-icated PSO on all large-source vessels. A dedicated PSO is one whose only responsibility on the vessel is to monitor operations and apply protected-species mitigation. For mini-source vessels, a member of the crew may conduct prewatch and monitor operations so long as they have received training in marine-mammal/turtle-mitigation monitoring.
Marine-Mammal and Turtle Sightings/PAM Detections Within Mitigation Zone. If marine mammals/turtles are observed/detected within 500 m of the center of the air-gun array during a prewatch, the soft start for the seismic source must be delayed until their pas-sage, or the transit of the vessel, results in the marine mammals/turtles being more than 500 m away from the source. In both cases, there must be a 30-minute delay from the time of the last sighting/detection within 500 m of the source to the commencement of the soft start to determine whether the animals have left the area.
Marine-Mammals/Turtle Sightings/Detections After Soft Start. Once a soft start has commenced and while operating at full power, there is no requirement to shut down if marine mammals/turtles are observed within the mitigation zone unless any obvious signs of distress are observed. If signs of distress are observed, operators must shutdown the source and follow the guidance in the preceding
SPE_OGF_177780_160014.indd 21 09/11/16 4:48 PM

22 Oil and Gas Facilities • December 2016
not be practical to have a PAM system with towed array on each source vessel. In this scenario, a PAM station may be used, where a dedicated PAM vessel/platform is used to deploy hydrophones and monitor a mitigation zone of at least 500 m.
If the mitigation zone surrounding the PAM-hydrophone array has been clear of any marine-mammal detections for a period of at least 30 minutes, then each source vessel may approach the PAM station to initiate a soft start. Soft starts by each source vessel should be initiated as close to the PAM station as is safe to do so and must not be more than 500 m away.
Once soft start has commenced, there is no requirement to re-main with the PAM station, and source vessels may head toward the line.
If a break in firing lasting longer than 10 minutes occurs, then, as in the preceding stated guidance, the source vessel must return to the PAM station to restart the soft start. This can be done immedi-ately and without delay so long as a constant watch has taken place by means of PAM in the area and no marine-mammal detections have been made in the preceding 30 minutes. If no constant watch has been maintained by means of PAM, then a 30-minute prewatch must precede any soft-start operation.
Simultaneous Operations. At least one PSO will be placed on each source vessel. This will allow constant monitoring and prevent delays from the need to conduct a new prewatch should a break in firing that is longer than 10 minutes occur. If multiple vessels are to be used in the same area, soft starts must be completed as close as possible to the start of line time. A soft start followed by lengthy pe-riods shooting with minimum source before the start of a line will be considered excessive and an explanation must be provided in the PSO report (see preceding guidance during a line change).
Summary of Mitigation Measures (Fig. A-1). • 30-minute prewatch before any use of guns (30-minute PAM
search in hours of darkness)• 20–40-minute soft start (source > 320 in.3)• 10–40-minute soft start (mini-source ≤ 320 in.3) • Minimum of one dedicated PSO on each source vessel (source
> 320 in.3)• Vessel crew may conduct prewatch and monitor operations on
mini-source vessels (source up to 320 in.3)• 500-m mitigation zone for marine mammals/turtles• No shutdown if observation/detection after soft start or at full
power (unless obvious signs of distress are observed)• Break in activity of less than 10 minutes, no action required if
mitigation zone is clear; 30-minute delay if marine mammals/turtles are present
• Break in activity of more than 10 minutes, soft start required (additional prewatch required only if constant monitoring has not taken place)
• Soft start required for full gun test• No soft start required for single gun test at low power
Glossary of Terms.• Prewatch: The period of time in which an observer must
watch/listen for marine mammals/turtles within the mitiga-tion zone.
• Mitigation zone: Defined as a 500-m area around the air-gun source.
• Soft start: The gradual increase in power and output of seismic air-gun arrays.
• PSO: Protected species observer.• PAM: Passive acoustic monitoring.• Mini-source: Source with output ≤ 320 in.3. • Large source: Source with output > 320 in.3.• Marine mammal: Dolphin, whale, or dugong.• Dedicated PSO: A suitably qualified and trained individual
whose only role on the vessel is to monitor for marine mam-mals, turtles, and other protected species.
recommencing shooting at full power. The requirement for a pre-shooting search only applies if there was no PSO on duty and ob-serving at this time. If a constant watch has been maintained and no marine mammals/turtles have been observed within the exclusion zone for at least 30 minutes, then an immediate soft-start procedure may begin. For operations at night, a constant watch cannot be main-tained by PAM if the source vessels are operating more than 500 m away from the PAM vessel. In this scenario, source vessels must re-turn to the mitigation zone maintained by PAM to restart a soft start.
Break in Firing <10 Minutes. Any break in firing for less than 10 minutes will require the PSO/crew member to conduct a visual assessment (not a prewatch) to assess if any marine mammals/tur-tles are present in the mitigation zone. If none are present, then firing may recommence immediately; if present, then a 30-minute delay will be made in accordance with the preshooting watch guidelines detailed previously. For operations at night, no assess-ment can be made.
Guidance During Line Change. Because of the unique nature of shallow-water and transition-zone surveys, it is often a require-ment to start and stop lines at short notice, shifting between lines in response to shallow water and other obstacles. To prevent the need for additional soft starts, and thus excessive noise in the environ-ment, source vessels may use a minimum source to conduct a shot at least once every 10 minutes between survey lines. This must be the lowest possible source output from the array with a shot greater than 160 dB (dB re 1 μPa).
Note that this procedure may be used to avoid additional soft starts and delays in response to short line changes and unfore-seen circumstances. It may not be used to keep a source vessel “on standby” (soft start completed and at full power but not on a survey line) for significant lengths of time. Any occurrence where the miti-gation gun is used for more than 30 minutes (i.e., soft start has been completed but no line has been started) will require an explanation in the PSO report.
Passive-Acoustic Monitoring. During hours of darkness, PAM effort is the only available method of mitigation for marine mam-mals. It should be noted that turtles do not communicate acousti-cally, and thus, it is assumed these will not be detected by PAM, even if present.
During hours of darkness, the prewatch will be at least 30 min-utes in duration.
Because of the nature of transition-zone surveys, during which multiple source vessels (often small in size) are to be used, it may
Start of line
Commencesoft start (20 minutes source>320 in.3, 10 minutessource up to 320 in.3
NOYES
Prewatch (30 minutes)
Marine mammal/turtleobserved/detected within500 m mitigation zone
Delay soft start
Fig. A-1—Flow diagram for start of any air-gun operation.
SPE_OGF_177780_160014.indd 22 09/11/16 4:48 PM

December 2016 • Oil and Gas Facilities 23
Use of Vibroseis Trucks and Other Vehicles. To prevent the need for clearing vegetation and other environmental impacts, the use of Vibroseis trucks and other vehicles shall not take place within man-grove areas. Vibration-point offsets will be made where required. Despite the environmental impacts accessing these areas with ve-hicles would have, they are generally not suitable for vehicles and pose additional risks to personnel and machinery.
Receiver Lines. Where receiver lines cross areas of mangrove, they should be laid with minimal disturbance to wildlife and vegetation.
As stated previously, the use of vehicles for cable layout should be avoided, with cables and other equipment being taken into the mangrove area by hand.
The clearing of vegetation must be avoided as much as possible; instead, the cable should be run around dense vegetation.
Geophones or other receivers should be planted in such a manner as to avoid damage to vegetation and, in particular, the root systems of mangrove trees.
If using geophones, these should be bunched to minimize the area of potential impact and planted in such a way as to avoid dam-aging root systems or other vegetation.
Crew Training. Crew operating in mangrove areas must be in-formed regarding the environmental considerations of such areas and trained to minimize environmental disturbance. Environmental-safety flash cards should be produced, and measures to minimize disturbance should be incorporated into preactivity toolbox talks.
Crew should be instructed that any hunting/fishing or collection of flora/fauna is strictly prohibited.
Removal of Equipment and Rubbish. After operations have been completed, all equipment used in the area must be removed and no rub-bish left behind. It is also recommended that any rubbish found already in the area from third parties be removed and disposed of correctly.
Environmental Profile. An environmental profile of each area with planned activity must be made by means of a pre-operations survey with the collection of baseline data. These surveys allow the establishment of baseline information to assess the current condi-tion and presence of existing environmental damage. This informa-tion can be compared to the presurvey EIA to assess its applicabil-ity and note any differences if they occur. Any changes noted at this point can be factored into project design. It is also important for comparisons to be made between pre- and post-operation data to assess any impacts that may have occurred as a result of operations.
Environmental profiles should include the following:• Detailed description of the area concerned• Images of areas where operations are to occur• Details of any existing environmental damage• Details of potential impacts from planned operations• Relevance of impacts and mitigation measures identified by
project EIA• Additional mitigation considerations if required
Environmental Monitoring. Throughout and after operations within mangrove areas, environmental monitoring should be car-ried out. This may take the form of environmental audits and post-operation/decommission surveys.
Environmental Audit. Environmental audits should be carried out during operations and cover all types of work to be conducted in the mangrove area. The purpose of such audits is to assess the im-pact of ongoing operations, identify if existing mitigation measures are successful in preventing/reducing as far as possible environ-mental damage, and introduce further measures if required.
Detailed reports should include the following: • Details of the operations being carried out
Appendix B—Environmental Mitigation Measures for Seismic-Exploration Activities Within Mangrove AreasThe following highlights the environmental mitigation measures used during seismic-exploration activities within mangrove areas on the Hail and Shuweihat 3D seismic surveys, and incorporates information from the ADNOC environmental-management plan and the oil and gas exploration and production in mangrove areas guidelines produced in collaboration between the International Union for Conservation of Nature (IUCN) and the Exploration and Production (E&P) forum.
Reason for the Development of Site-Specific Mitigation Measures. Mangrove forests represent a valuable resource both ecologically and socio-economically. By providing an important nursery habitat for numerous fish (many of which support com-mercial offshore fisheries) and marine invertebrates and feeding/roosting areas for large numbers of birds, these areas are character-ized by their importance to wider ecosystem function.
Mangroves are essentially wetland forests and, as such, are rep-resented within the 1971 Convention on Wetlands of International Importance (Ramsar Convention), an international convention for the conservation of wetland habitats. The UAE became a member of the 1971 Ramsar Convention in 2007 and, as such, has a respon-sibility to ensure wetland conservation and the management of ac-tivities with potential negative effects on such areas.
The IUCN, in collaboration with the E&P forum, have set out general guidelines for oil and gas activities in mangrove areas, which include the following:
“Operations should be planned and operated in a manner that avoids or, where unavoidable, minimizes direct or indirect adverse impacts on the mangrove environment.”
This can be achieved by:• The minimal use of mangrove forest areas• Minimal interruption to freshwater flow within the mangroves• Minimal alteration to tidal flows within the mangroves• Minimal disruption to vegetation• Minimal disruption to soils and sediments• Maintenance of buffer zones along coastlines• The control of environmental pollution• Careful planning of activities• The selection of techniques and equipment to minimize infra-
structure within the mangrove area• Careful monitoring of activities to identify unexpected im-
pacts Full details of these general guidelines can be found in the oil
and gas exploration and production in mangrove areas guidelines produced in collaboration between the IUCN and the E&P forum. While this document outlines general guidelines, it identifies the need for site/project-specific guidelines and mitigation measures to be developed.
In accordance with the general guidance of the IUCN and E&P forum, the following site/project-specific guidelines and miti-gation measures were used during the Hail and Shuweihat 3D seismic surveys.
Survey Planning. Survey planning will at an early stage consult with relevant experts in the production of a project-specific envi-ronmental-impact assessment (EIA) to identify areas of concern and the potential impacts of the seismic-survey operations. The EIA should identify all potential impacts and cover all activities. Where impacts are unavoidable, mitigation measures to reduce the impact as much as reasonably practicable within the requirements of the 1971 Ramsar Convention should be highlighted.
Operator’s environmental-management plans should be re-viewed to ensure they meet ADNOC standards.
Operators should be made aware of environmental consider-ations and mitigation measures highlighted in the project EIA to ensure they are met and factored into the survey design.
SPE_OGF_177780_160014.indd 23 09/11/16 4:48 PM

24 Oil and Gas Facilities • December 2016
holds a BSc degree in zoology and an MSc degree in ecology from Bangor University, and is a chartered scientist and chartered marine scientist with the science council, as well as a full member of the Insti-tute of Marine Engineering, Science and Technology.
Peter Nilsson is currently working as an environmental adviser for ADNOC in the Arabian Gulf. Previously, he worked as a field researcher and scientist in various locations, focusing on seabird and marine-mammal ecology, and has authored or coauthored several scientific papers, conference abstracts, and technical reports in these fields. Nilsson holds a BS degree in marine biology from Hawaii Pacific Univer-sity and an MS degree in marine biology from the University of Alaska, Fairbanks.
George Ainslie Casson is a senior geophysicist in ADNOC’s Exploration Division, specializing in seismic-survey acquisition. He has 35 years of industry experience and 23 years of global-field-operations experience. Casson holds a master’s degree and a post-graduate degree in manage-ment from Manchester University, UK. He is a certified JNCC Marine Mammal Observer and Bureau of Ocean Energy Management, Regu-lation and Enforcement PSO. Casson’s operational experience ranges from deep sea to deep desert, transition zone, mangrove, and jungle. He has reported and written on environmental aspects of and sightings during seismic surveys since 1996, including a full-year ornithological survey in Algeria. Casson is currently reading MSc Biodiversity, Wildlife and Ecosystem Health at the University of Edinburgh.
• Images of these operations, particularly in reference to their interaction with the environment
• Details of any environmental damage caused • An assessment of existing mitigation measures and their ef-
fectiveness in preventing/reducing environmental damage • Details of further mitigation measures if required
Post-Operation/Decommission Surveys. Post-operation/decom-mission surveys must be completed after operations have finished within the mangrove area. The purpose of such surveys is to assess the impact of operations and identify any environmental restora-tion needed.
Comparisons should be made with data collected during envi-ronmental profiles to assist in this process.
Detailed reports should include the following: • Detailed description of the area concerned• Images of areas where operations have occurred • Details of any damage caused during operations or during de-
mobilization from the working area
Gareth MacGlennon currently works as an environmental adviser for ADNOC. He has worked as an environmental consultant for 6 years, in-cluding work in Antarctica, the Arctic, the Middle East, Africa, and Asia. MacGlennon’s specific research interests include the development and implementation of practical environmental-management techniques and ecology. He has delivered a number of presentations to special-interest groups and industry conferences on these topics. MacGlennon
SPE_OGF_177780_160014.indd 24 09/11/16 4:48 PM