ecole polytechnique fédérale de lausanne epfl · ecole spéciale de lausanne 1853 1946 1969 today...
TRANSCRIPT

Ecole Polytechnique
Fédérale de Lausanne
EPFL
EPFL Presentation | 02.2014
Ecole spéciale
de Lausanne
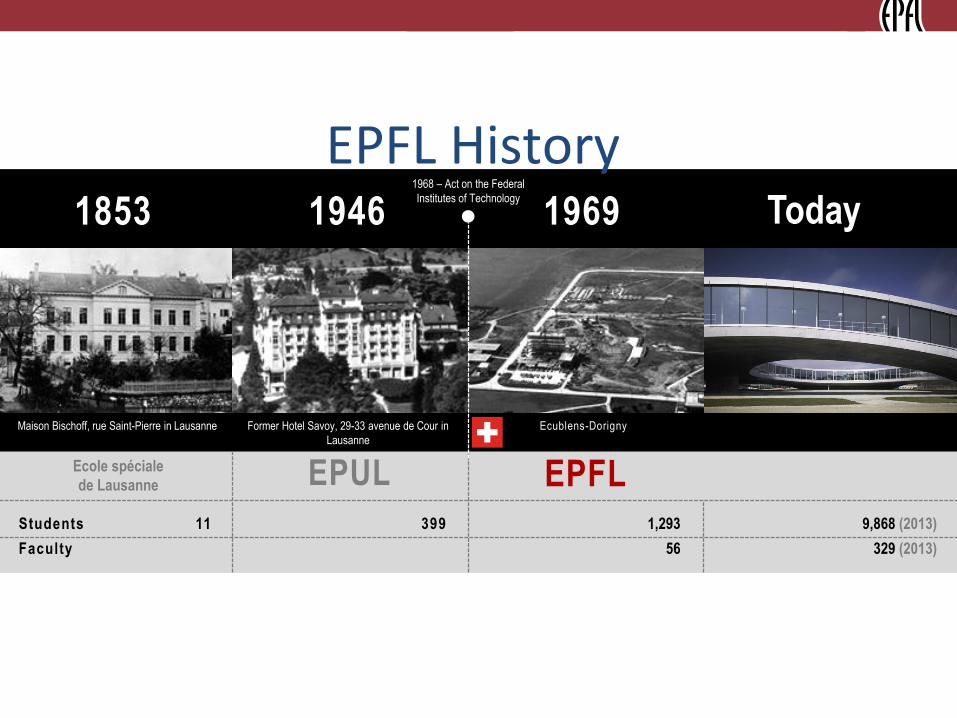
1853 1946 1969 Today
EPUL EPFLStudents
Faculty
11 399 1,293
56
9,868 (2013)
329 (2013)
Maison Bischoff, rue Saint-Pierre in Lausanne Former Hotel Savoy, 29-33 avenue de Cour in
Lausanne
1968 – Act on the Federal
Institutes of Technology
Ecublens-Dorigny
Looking back… More than 150 years
EPFL History

3
1969 … 2014
Looking back… 1969 to the present day
Premises > 54 hectares > approx. 561,800 sq.m
Fast-paced development (1969-
2014)
EPFLLausanne
ETHZurich
PSIP a u l S c h e r re r In s t i tu te
WSLF o re s t , S n o w &
L a n d s c a p e
EMPAMaterials
EAWAGWater management, treatment &
protection
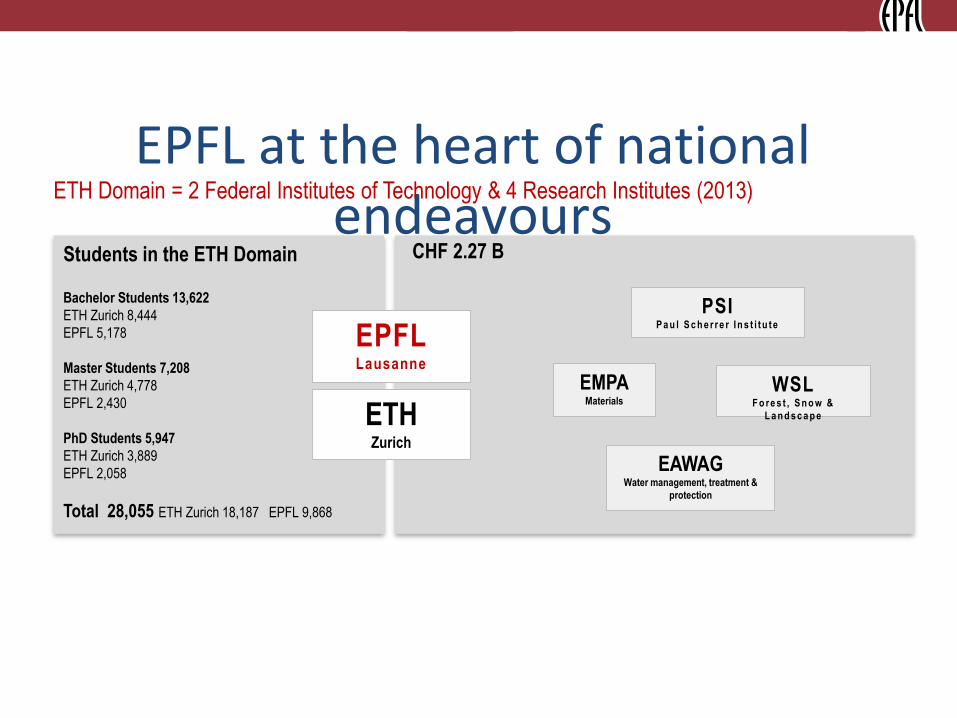
EPFL at the heart of national endeavours
Students in the ETH Domain
Bachelor Students 13,622
ETH Zurich 8,444
EPFL 5,178
Master Students 7,208
ETH Zurich 4,778
EPFL 2,430
PhD Students 5,947
ETH Zurich 3,889
EPFL 2,058
Total 28,055 ETH Zurich 18,187 EPFL 9,868
ETH Domain = 2 Federal Institutes of Technology & 4 Research Institutes (2013)
CHF 2.27 B
Background The ETH Domain

Missions
Education Research
Technology Transfer
of scientists,
engineers & architects
advanced, fundamental & applied
to industry
& society
Background
EPFL’s three missions according to the Federal Act
6
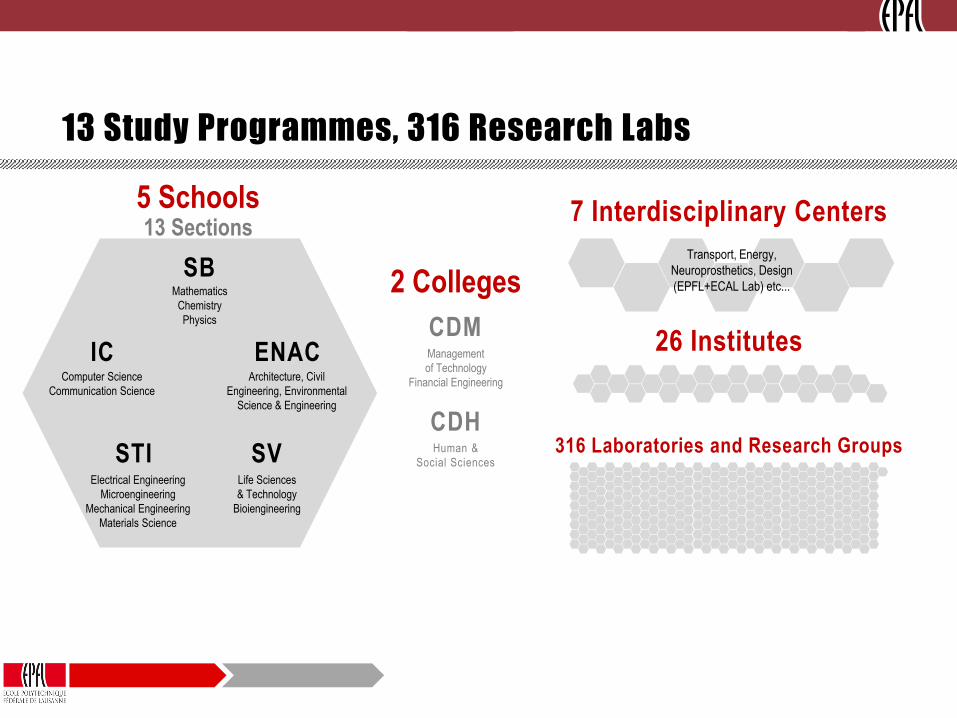
13 Study Programmes, 316 Research Labs
Overview Education
Mathematics
Chemistry
Physics
ENAC
SB
IC
STI SV
CDM
CDH
5 Schools13 Sections
316 Laboratories and Research Groups
2 Colleges
7 Interdisciplinary Centers
26 InstitutesArchitecture, Civil
Engineering, Environmental
Science & Engineering
Human &
Social Sciences
Computer Science
Communication Science
Electrical Engineering
Microengineering
Mechanical Engineering
Materials Science
Life Sciences
& Technology
Bioiengineering
Management
of Technology
Financial Engineering
Transport, Energy,
Neuroprosthetics, Design
(EPFL+ECAL Lab) etc...

Overview Students
9,868 Students
in 2013
Switzerland
Europe
Asia & OceaniaAmericas
Africa
45.3%41%
2.6%
3.3%
7.7%
Origin of Students (Bachelor+Master+PhD)

8
Study programs at EPFL
Overview Education
Bachelor’s Master’s Doctorate~ 3 years ~ 2 years
Undergraduate Graduate
Master of
advanced Studies
EPFL
Bachelor’s
degree
programs
(13 programs)
EPFL
Master’s
degree
programs
(22 programs)EPFL doctoral school
(18 schools)
MAS
(6)
Swiss baccalaureate (without restrictions)
EU (with restriction)
Polymaths (Swiss students)
CMS(non-EU students)
Vocational baccalaureate
Other degrees (upon
application)
~ 4-6 years
~ 2,100 students ~ 2,000 students – PhD candidates 148 students~ 4,900 students
Swiss or foreign Bachelor’s
degrees
(upon application)
Swiss or foreign Master’s
degrees
(upon application)
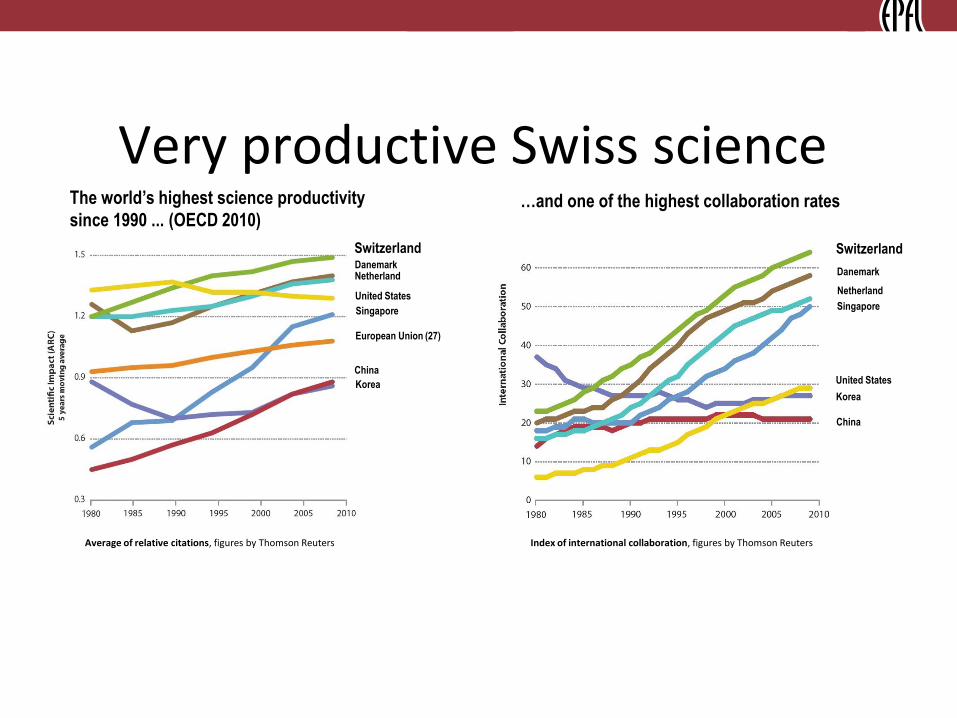
Research Swiss Science
The world’s highest science productivity
since 1990 ... (OECD 2010)
SwitzerlandDanemarkNetherland
United States
Singapore
European Union (27)
China
Korea
Average of relative citations, figures by Thomson Reuters
…and one of the highest collaboration rates
Index of international collaboration, figures by Thomson Reuters
Switzerland
Danemark
Netherland
Singapore
United States
Korea
China
Very productive Swiss science

European Ranking 2013 – The EPFL is well-placed
Leiden
Citations/paper normalised by volume
and publication field, across all fields.
300 largest European universities.
Ranking
Shanghaï(Eng./Tech. & Computer Science)
1. University of Cambridge
2. EPFL
3. Imperial College, London
4. University of Manchester
5. ETH Zurich
Most cited scientists.
Number of papers published.
% of papers published in top 20 science
journals.
THE(Eng. & Technology)
1. University of Cambridge
2. University of Oxford
3. ETH Zurich
4. Imperial College, London
5. EPFL
Reputation.
Citations/paper normalised by publication
field, across all fields.
QS(Eng. & Technology)
Reputation.
Citations/paper.
Student/faculty ratio.
Main Criteria
Research
1. University of Cambridge
2. ETH Zurich
3. Imperial College, London
5. University of Oxford
4. EPFL
(Eng. & Technology)
1. EPFL
2. Weizmann Institute of Science
3. University of Cambridge
4. ETH Zurich
5. University of Oxford
(PP (top-10%) indicator)

Global Ranking 2013 – U.S. on top, EPFL close behind...
Ranking
Leiden(PP (top-10%) indicator – World)
Citations/paper normalised by volume and
publication field, across all fields.
World’s 500 largest universities.
Shanghaï(Eng./Tech. & Computer Science)
Most cited scientists.
Number of papers published.
% of papers published in top 20 science
journals.
15. EPFL
THE(Eng. & Technology)
15. EPFL
Reputation.
Citations/paper normalised by publication
field, across all fields.
QS(Eng. & Technology)
Reputation.
Citations/paper.
Student/faculty ratio.
Main Criteria
Research
1. MIT
2. Stanford University
3. Uni. of California, Berkeley
4. California Institute of Technology
5. Princeton University
1. MIT
2. Stanford University
3. Uni. of California, Berkeley
4. University of Texas
5. University of Illinois
1. MIT
2. Uni. of Calif, Santa Barbara
3. Stanford University
4. Princeton University
5. Harvard University
13. EPFL
1. MIT
2. Stanford University
3. University of Cambridge
4. Uni. of California, Berkeley
5. ETH Zurich
8. EPFL
(Eng. & Technology)
Europe
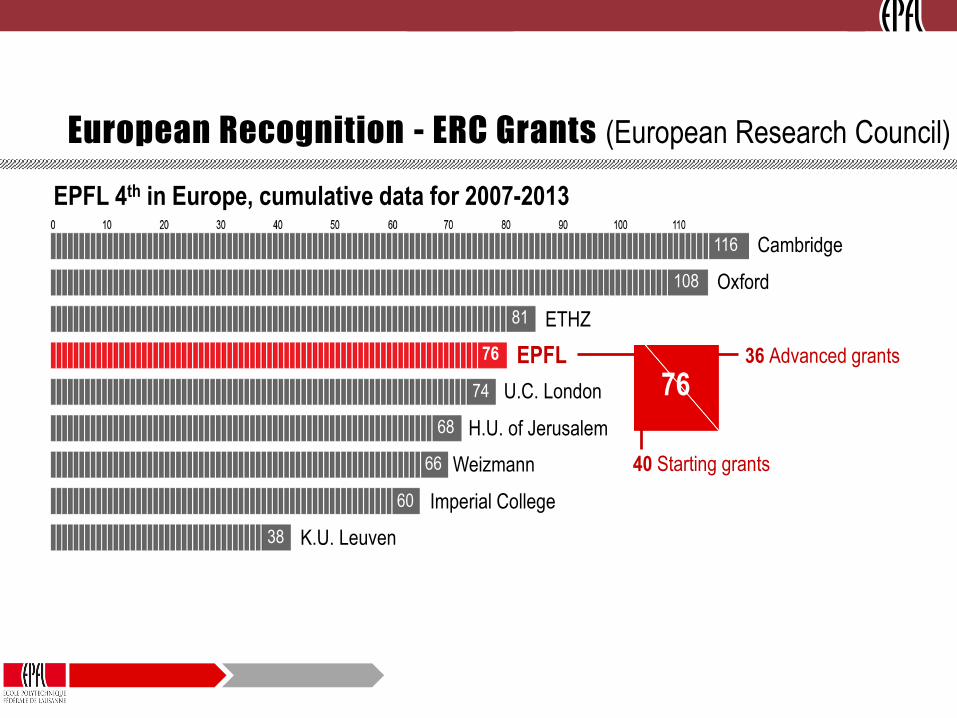
EPFL 4th in Europe, cumulative data for 2007-2013
European Recognition - ERC Grants (European Research Council)
Research
Cambridge
Oxford
EPFL
ETHZ
H.U. of Jerusalem
Imperial College
U.C. London
Weizmann
K.U. Leuven
116
108
76
81
74
68
66
60
38
40 Starting grants
36 Advanced grants
76

13
Alinghi (twice winner: 2003, 2007)
HYDROS: Hydroptère.chSolar Impulse
Great Technology Adventures
Innovation In figures
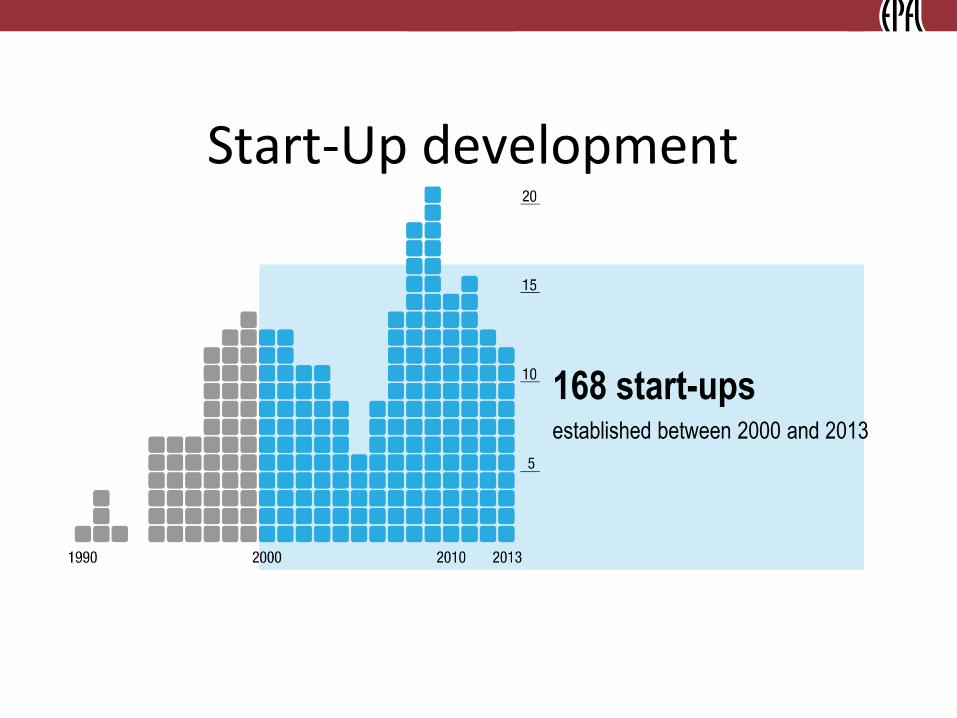
Start-Up development
168 start-upsestablished between 2000 and 2013
15
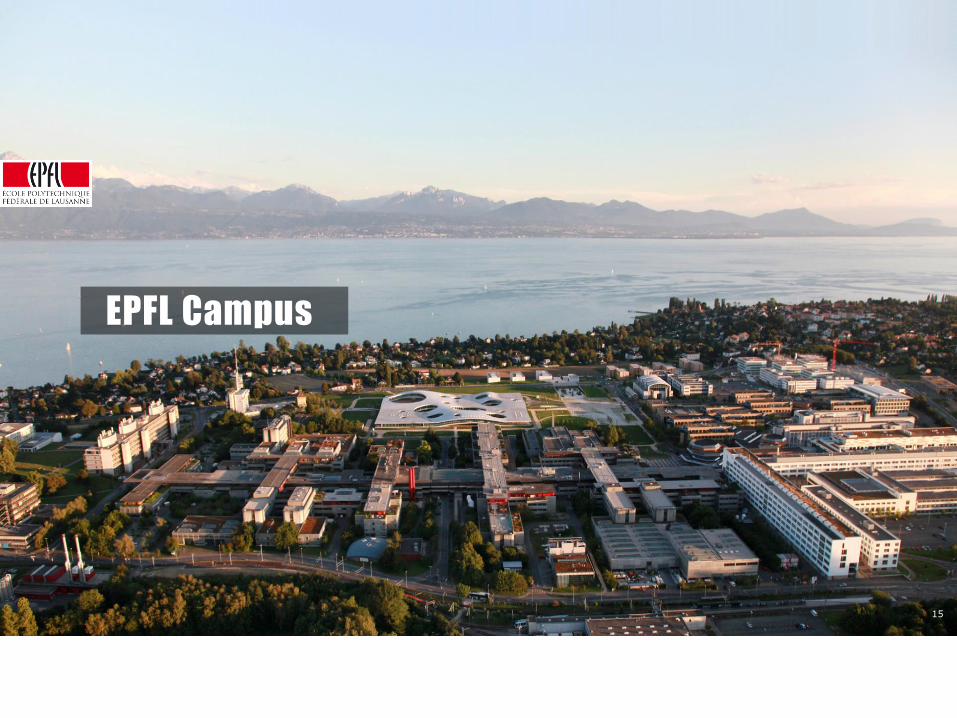
EPFL Campus

High-Performance Transaction Processing on Non-uniform
Hardware Topologies
Danica Porobic
DIAS, EPFL

Core Core Core
L1
L2
L1
L2
L1
L2
L3
Core
L1
L2
Memory controller
Inter-socket links
Core Core Core
L1
L2
L1
L2
L1
L2
L3
Memory controller
Core
L1
L2
Inter-socket links
17
Multisocket multicores
Communication latencies vary by an order-of-magnitude
L1
Inter-socket links Inter-socket links
50 cycles500 cycles
<10 cycles
IslandL3

OS
Impact of Islands: TPC-C PaymentThread Placement
0
2
4
6
8
10
12
Thro
ugh
pu
t (K
tps)
4socket x 6cores
39%
18
? ?? ?
Spread Island
Islands significantly impact OLTP applications
0
20
40
60
80
100
120
140
160
Sharednothing
Sharedeverything
Thro
ugh
pu
t (K
tps)
4.5x
4socket x 6cores
Communication granularity
19
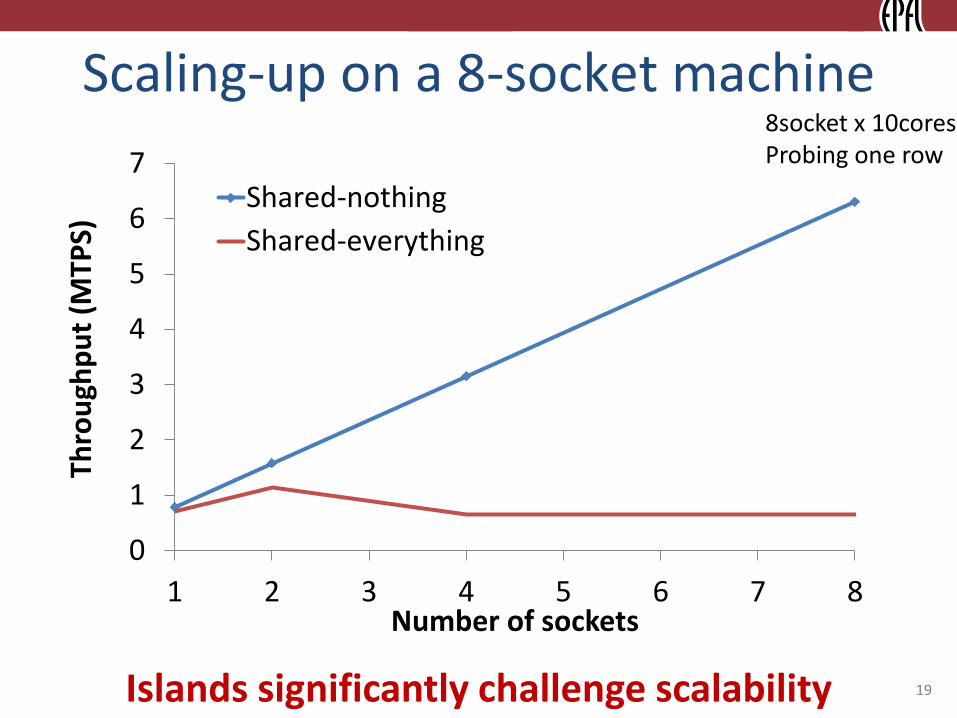
Scaling-up on a 8-socket machine
0
1
2
3
4
5
6
7
1 2 3 4 5 6 7 8
Thro
ugh
pu
t (M
TPS)
Number of sockets
Shared-nothing
Shared-everything
Islands significantly challenge scalability
8socket x 10coresProbing one row
Outline
• Introduction
• Impact of Hardware Islands on OLTP
• Adaptive Transaction Processing for Islands
• Conclusions
20

OLTP System Configurations
Shared-everything Shared-nothing Islandshared-nothing
21

Partition sensitive microbenchmark
• Single-site version– Probe/update N rows from the local partition
• Multi-site version– Probe/update 1 row from the local partition
– Probe/update N-1 rows uniformly from any partition
– Partitions may reside on the same instance
22

23
Multi-site transactions: reads
0
50
100
150
200
0 20 40 60 80 100
Thro
ugh
pu
t (K
Tps)
% Multisite transactions
Shared-everything
Shared-nothing
Island shared-nothing
Contention for shared data
No locks or latches
Messaging overhead
Fewer messages for 1 transaction
More nodes -> faster performance drop
4socket x 6coresN=10

0
10
20
30
40
50
60
0% 50% 100%
Tim
e p
er
tran
sact
ion
s (µ
s)
Multisite transactions
Logging
Locking
Communication
Xct management
Other
Where are the bottlenecks? Read case
24
Island shared-nothingN=10
Communication overhead dominates

25
Multi-site transactions: updates
0
20
40
60
80
100
120
0 20 40 60 80 100
Thro
ugh
pu
t (K
Tps)
% Multisite transactions
Shared-everything
Shared-nothing
Island shared-nothing
No latches
2 phase commit
Update distributed transactions are more expensive
4socket x 6coresN=10

0
50
100
150
200
250
300
0% 50% 100%
Tim
e p
er
tran
sact
ion
s (µ
s)
Multisite transactions
Logging
Locking
Communication
Xct management
Other
Where are the bottlenecks? Update case
26Several overheads contribute to the cost
Island shared-nothingN=10

OLTP on Hardware Islands
• Shared-everything: stable, but non-optimal
• Shared-nothing: fast, but sensitive to workload
• Island shared-nothing: a robust middle-ground
• Challenges:– Optimal configuration depends on workload and hardware
– Expensive repartitioning due to physical data movement
27Can we have one system that adapts to all cases?

Outline
• Introduction
• Impact of Hardware Islands on OLTP
• Adaptive Transaction Processing for Islands
• Conclusion
28

29
Critical path of transaction execution
Many accesses to shared data structures
Core Core Core Core Core Core Core Core
Data
System state

30
PLP: Physiologically partitioned SE
System state is still shared
Core Core Core Core Core Core Core Core
System state

31
Perfectly partitionable workload
0
1
2
3
4
5
6
7
1 2 3 4 5 6 7 8
Thro
ugh
pu
t (M
TPS)
Number of sockets
Shared-nothing
PLP
Inter-socket accesses to system state are a bottleneck
8socket x 10coresProbing one row

32
ATraPos: Island-aware SE
Core Core Core Core Core Core Core Core
System state System state

33
Perfectly partitionable workload
0
1
2
3
4
5
6
7
1 2 3 4 5 6 7 8
Thro
ugh
pu
t (M
TPS)
Number of sockets
Shared-nothingPLPATraPos
Island awareness brings scalability
8socket x 10coresProbing one row

34
Naive partitioning and placement
0
300
600
900
1200
1500
1800
2100
PLP ATraPosHW-aware
ATraPosLoad
balanced
ATraPos
Thro
ugh
pu
t (K
TPS)
Cores are overloaded with contending threads
8 socket x 10 core800K rows per table
Probing 1 row each from A and B
Probe A Probe B
1.9x

35
ATraPos partitioning and placement
0
300
600
900
1200
1500
1800
2100
PLP ATraPosHW-aware
ATraPosLoad
balanced
ATraPos
Thro
ugh
pu
t (K
TPS)
Ignoring Islands -> synchronization overhead
4.4x
Probe A Probe B
8 socket x 10 core800K rows per table
Probing 1 row each from A and B

36
ATraPos partitioning and placement
0
300
600
900
1200
1500
1800
2100
PLP ATraPosHW-aware
ATraPosLoad
balanced
ATraPos
Thro
ugh
pu
t (K
TPS)
ATraPos: balanced load + reduced synchronization
4.8x
Probe A Probe B
8 socket x 10 core800K rows per table
Probing 1 row each from A and B
37
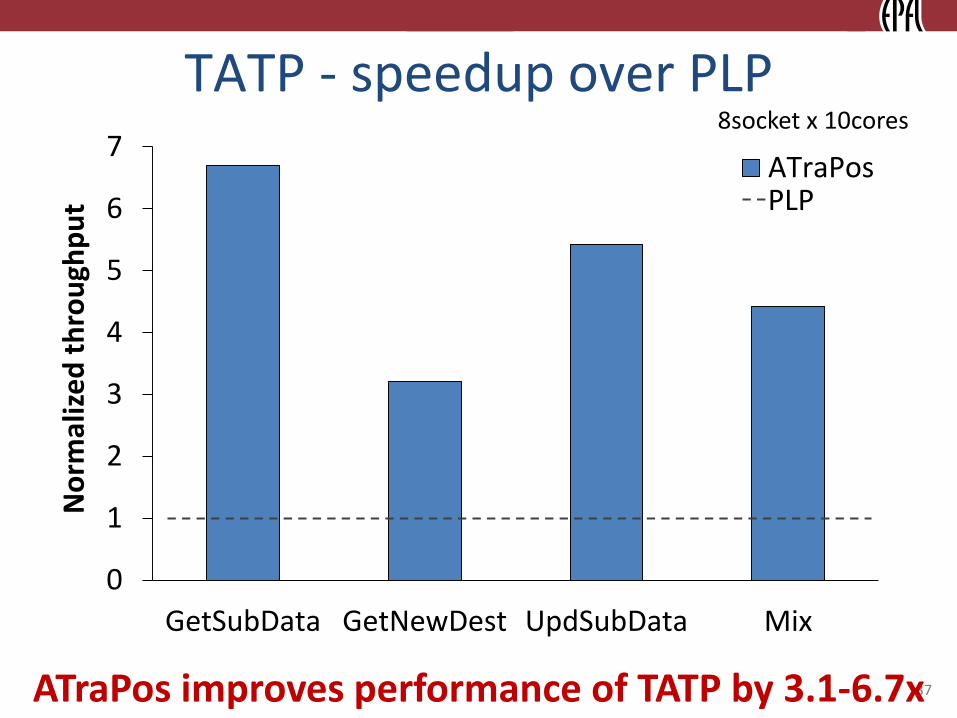
TATP - speedup over PLP
0
1
2
3
4
5
6
7
GetSubData GetNewDest UpdSubData Mix
No
rmal
ize
d t
hro
ugh
pu
t
ATraPos
ATraPos improves performance of TATP by 3.1-6.7x
8socket x 10cores
PLP

38
Dynamic workloads
0
60
120
180
240
300
360
0 15 30 45 60 75 90
Thro
ugh
pu
t (K
TPS)
Time (s)
Static
ATraPos
ATraPos gracefully adapts to any change
8 sockets x 10 coresTATP
UpdSubData
GetNewDest
Mix
Repartitioning
Monitoring

• OLTP on Hardware Islands– Shared-everything: stable, non-optimal performance
– Shared-nothing: fast, sensitive to workload
– Island shared-nothing: a robust middle ground
– Optimal configuration depends on workload and hardware
• Adaptive transaction processing for Islands– Minimal inter-socket accesses in the critical path
– Workload and HW-aware partitioning and placement
– Lightweight monitoring and repartitioning
Summary
39Thank you!