ecocultural range-expansion scenarios for the replacement...
TRANSCRIPT

Theoretical Population Biology 119 (2018) 3–14
Contents lists available at ScienceDirect
Theoretical Population Biology
journal homepage: www.elsevier.com/locate/tpb
Ecocultural range-expansion scenarios for the replacement orassimilation of Neanderthals by modern humansJoe Yuichiro Wakano a,1, William Gilpin b,1, Seiji Kadowaki c, Marcus W. Feldman d,*,Kenichi Aoki ea School of Interdisciplinary Mathematical Sciences, Meiji University, Nakano 4-21-1, Nakano-ku, Tokyo 164-8525, Japanb Department of Applied Physics, Stanford University, Stanford CA 94305-5020, USAc Nagoya University Museum, Nagoya University, Furo-cho, Chikusa-ku, Nagoya 464-8601, Japand Department of Biology, Stanford University, Stanford CA 94305-5020, USAe Organization for the Strategic Coordination of Research and Intellectual Properties, Meiji University, Nakano 4-21-1, Nakano-ku, Tokyo 164-8525, Japan
a r t i c l e i n f o
Article history:Received 1 September 2017Available online 12 October 2017
Keywords:CompetitionSpatial diffusionTraveling wavesMultiple wave frontsLocal coexistence conditionsBladelets/microliths
a b s t r a c t
Recent archaeological records no longer support a simple dichotomous characterization of the cul-tures/behaviors of Neanderthals and modern humans, but indicate much cultural/behavioral variabilityover time and space. Thus, in modeling the replacement or assimilation of Neanderthals by modernhumans, it is of interest to consider cultural dynamics and their relation to demographic change. Theecocultural framework for the competition between hominid species allows their carrying capacities todepend on somemeasure of the levels of culture they possess. In the present study both population densi-ties and the densities of skilled individuals in Neanderthals and modern humans are spatially distributedand subject to change by spatial diffusion, ecological competition, and cultural transmission within eachspecies. We analyze the resulting range expansions in terms of the demographic, ecological and culturalparameters that determine how the carrying capacities relate to the local densities of skilled individualsin each species. Of special interest is the case of cognitive and intrinsic-demographic equivalence of thetwo species. The range expansion dynamics may consist of multiple wave fronts of different speeds,each of which originates from a traveling wave solution. Properties of these traveling wave solutions aremathematically derived. Depending on the parameters, these travelingwaves can result in replacement ofNeanderthals bymodern humans, or assimilation of the former by the latter. In both the replacement andassimilation scenarios, the first wave of intrusive modern humans is characterized by a low populationdensity and a low density of skilled individuals, with implications for archaeological visibility. The firstinvasion is due to weak interspecific competition. A second wave of invasion may be induced by culturaldifferences between moderns and Neanderthals. Spatially and temporally extended coexistence of thetwo species, which would have facilitated the transfer of genes from Neanderthal into modern humansand vice versa, is observed in the traveling waves, except when niche overlap between the two speciesis extremely high. Archaeological findings on the spatial and temporal distributions of the Initial UpperPalaeolithic and the Early Upper Palaeolithic and of the coexistence of Neanderthals and modern humansare discussed.
© 2017 Elsevier Inc. All rights reserved.
1. Introduction
Recent archaeological and anthropological findings and anal-yses suggest that modern humans had reoccupied the MiddleEast by 55 kya (Hershkovitz et al., 2015) and indicate that theysubsequently overlapped with Neanderthals in Europe betweenabout 45 and 40 kya, after which the latter disappeared from
* Corresponding author.E-mail address:[email protected] (M.W. Feldman).
1 These authors contributed equally.
Europe (Mellars, 2006a; Benazzi et al., 2011, 2015; Higham et al.,2014; Hublin, 2015; Roebroeks and Soressi, 2016). Although Nean-derthal effective population size shows an overall decreasing trendafter about 0.5 to 1.0 Mya (Prüfer et al., 2014), the Neanderthalpopulation in Europe during the Middle Palaeolithic may havefluctuated in response to climatic cycles (Hublin and Roebroeks,2009). Importantly the Neanderthal population appears to haverepeatedly recovered when environmental conditions improvedand, in particular, may have attained its maximum size, at least inGermany, just before the arrival ofmodern humans (Richter, 2016).
https://doi.org/10.1016/j.tpb.2017.09.0040040-5809/© 2017 Elsevier Inc. All rights reserved.
4 J.Y. Wakano et al. / Theoretical Population Biology 119 (2018) 3–14
Hence, Neanderthal extinction cannot readily be explained by cli-mate change per se, and given that the two species overlapped andlikely exploited similar niches (Banks et al., 2008; Hoffecker, 2009;Nigst et al., 2014; Roebroeks and Soressi, 2016), the most plausiblecause of the replacement of the indigenous Neanderthals by theintrusive modern humans is interspecific competition.
What competitive advantage did themodern humans have overthe Neanderthals (and other archaic human species in Eurasia)?The prevailing view among archaeologists is that modern humanswere culturally/technologically more advanced than the coevalNeanderthals, perhaps because they possessed more advancedcognitive abilities (e.g., Mellars, 2006a, b, c; Klein, 2008; Bar-Yosef,2013; Wynn et al., 2016). However, this interpretation has beencontested by Zilhão et al. (2010), Villa and Roebroeks (2014), andRoebroeks and Soressi (2016)who do not see ‘‘substantial cognitiveand technological differences’’ [italics added] in the archaeologicalrecord. These latter authors favor a strictly demographic scenario,whereby the resident Neanderthals were overwhelmed by thenumerically superior modern humans. Genetic and archaeologicalstudies do, on balance, suggest that modern humans were morenumerous than the Neanderthals (Atkinson et al., 2009; Prüfer etal., 2014; Mellars and French, 2011; Villa and Roebroeks, 2014;Kuhlwilmet al., 2016), but donot provide a compelling explanationfor the numerical disparity.
Dependence of the culture/technology level of a human popu-lation on its size – a larger population is predicted to have a higher‘‘culture level’’ – has been the focus of many theoretical (Shen-nan, 2001; Henrich, 2004; Strimling et al., 2009; Mesoudi, 2011;Lehmann et al., 2011; Aoki et al., 2011; Kobayashi and Aoki, 2012;Fogarty et al., 2015, 2017), psychological (Caldwell and Millen,2010; Derex et al., 2013;Muthukrishna et al., 2014), archaeological(Clark, 2011; Klein and Steele, 2013), and ethnological (Collard etal., 2016; Read, 2006; Kline and Boyd, 2010) studies. These studiestreat population size as a parameter, determined by undefinedcauses or manipulated by the experimenter. But culture level mayhave a reciprocal effect on population size, in which case the lattershould also be assumed to be a variable. Moreover, ‘‘[a]ny processof population replacement and extinction reduces ultimately to aquestion of numbers’’ (Mellars and French, 2011).
Mathematical models of the coupled dynamics of the size andculture level of a population, where both quantities are variables,are therefore more relevant (Lee, 1986; Ghirlanda and Enquist,2007; Richerson et al., 2009; Aoki, 2015). They show that thepopulation (in isolation) may exist in either of two states: largewith a high culture level, or small with a low culture level. His-torical contingency may then determine which of these equilibriais reached. Importantly, the empirical observation that populationsize and number of tool types are not correlated in ethnographichunter–gatherers (Collard et al., 2016) does not invalidate thesemodels – the sampled populations may be distributed around justone of the two equilibria – as argued by Aoki (2015).
A standard model of interspecific competition is the Lotka–Volterra (LV) model (Shigesada and Kawasaki, 1997), which trackssize changes in two competing populations. Gilpin et al. (2016)introduced into this framework an interaction between the sizeand culture level of each of two competing regional populations,the Neanderthals and modern humans. Specifically, innovationsthat raise culture level were assumed more likely to occur inlarger populations, and the carrying capacity of each species wasassumed to be a function of its culture level. The dynamics of eachspecies in isolation allow bistability as noted above. When bothspecies are considered together, the interaction between popula-tion size and culture level produces multiple equilibria, but mostimportantly allows a population with a higher culture level but asmaller size to outcompete a larger population at a lower culturelevel.
Spatially explicitmathematical and/or computationalmodels ofthe invasion by modern humans and their eventual replacementof resident Neanderthals have taken several different forms. Inan early model (Flores, 1998), competition of the LV type, with aviability advantage assumed for modern humans, was extendedto include diffusion (random non-directional migration) by mod-ern humans (but not the Neanderthals). A sequel model (Flores,2011) – and a subsequent closely related one (Wang and Lai,2012) – allowed diffusion by both competing species and gave riseto traveling wave solutions of the type known for the Fisher–KPPequation (Fisher, 1937; Kolmogoroff et al., 1937). In a differentvein, Aoki (1998) formulated a reaction–diffusionmodel assumingculture/technology transfer frommodernhumans toNeanderthals,which predicted that the Middle Palaeolithic would be replaced bytransitional cultures (e.g., Châtelperronian), which in turn wouldbe replaced by the Upper Palaeolithic (Welker et al., 2016).
A spatially explicit computational model for the spread of mod-ern humans into regions occupied by Neanderthals was proposedby Currat and Excoffier (2004, 2011) and Currat et al. (2008).Theirmodel assumes a demographic advantage tomodern humansthat entails eventual replacement and shows that even a smallamount of interbreeding at the wave front would result in massiveintrogression of Neanderthal genes into modern humans, whichis contrary to observation (Green et al., 2010; Reich et al., 2010;Prüfer et al., 2014). They conclude, therefore, that there wereobstacles to interbreeding.
The spread of Neolithic farmers across Europe was one of thefirst archaeological applications of the Fisher–KPPwave of advancemodel (Ammerman and Cavalli-Sforza, 1971, 1973, 1984), yieldinga theoretical prediction for the speed of expansion consistent withthe empirical estimate of about 1 km/yr. More complex reaction–diffusion models allowing for conversion of indigenous hunter–gatherers to farming have also been proposed (Aoki et al., 1996).
A modified Fisher–KPP model incorporating a time delaybetween successive migrations (equivalent to the mean genera-tion time) was subsequently applied to the post-LGM recoloniza-tion of Europe by Upper Palaeolithic hunter–gatherers (Fort etal., 2004), where the speed inferred from archaeological data is0.4–1.1 km/yr. Based on a limited amount of data (Bar-Yosef andPilbeam, 2000; Stringer et al., 2000). Fort et al. (2004) suggestedthat the speed of the modern human wave of advance into theLevant and Europe was 0.5 km/yr. With a larger data set of cali-brated radiocarbon dates, Mellars (2006a) produced an estimateof perhaps 0.4 km/yr for the rate of spread of modern humansfrom the Levant into Europe. The latter two estimates pertain tothe case where modern humans were invading regions occupiedbyNeanderthals, as opposed to the formerwhere spreadwas likelyinto empty space. Interestingly, the latter two estimates (0.5 km/yrand 0.4 km/yr) are at the lower end of the range of the former(0.4–1.1 km/yr), which is consistent with the theoretical pre-dictions of the diffusive LV competition model (Shigesada andKawasaki, 1997).
Reaction–diffusion models have also been applied to compe-tition between exploiters and altruists (Wakano, 2006) and tocompetition between individual and social learners (Wakano et al.,2011).
In the present study we investigate theoretically the spatialspread of modern humans into regions, including non-EuropeanEurasia, occupied by Neanderthals and/or other archaics. Our goalsare to obtain the conditions under which the former can replace orassimilate the latter, to predict the speed at which replacement orassimilationwill occur given that it does, and to estimate the dura-tion of regional overlap (coexistence) of the two species. To do so,we formulate a reaction–diffusion model that introduces, into ourprevious model (Gilpin et al., 2016), spatial structure and diffusionbetween neighboring regions of this space. Our ecocultural model

J.Y. Wakano et al. / Theoretical Population Biology 119 (2018) 3–14 5
differs from the standard diffusive LV competition model in thatthe carrying capacities of the competing species are not arbitrarilyfixed, but can vary at short distances in response to the culture levelof the regional population. In other words, we posit a significanteffect of the culture levels of modern humans and Neanderthals onthe success or failure of the range expansion of the former, throughtheir effect on relative population densities.
More specifically, Gilpin et al. (2016) defined a variable calledculture level to quantify culture, where culture level can be inter-preted as the number of cultural traits, toolkit size, toolkit sophisti-cation, etc. However, culture level is not an appropriate variable fora reaction–diffusionmodel, so we quantify culture here in terms ofthe density of ‘‘skilled’’ individuals – i.e., individuals with a set ofuseful cultural traits – who form a subset of the population.
A possible example of the kind of skill we have in mindis the know-how and ability to manufacture and use bladeletsand microliths. We realize that the advantages afforded by mi-crolithic technologies and their spatial/temporal distribution arecontentious issues in archaeology (e.g., Bar-Yosef and Kuhn, 1999;Kuhn, 2002; Eren et al., 2008; Hiscock et al., 2011; Brown et al.,2012; Zwyns et al., 2012; Mellars et al., 2013; Villa and Roebroeks,2014; Hublin, 2015; Boëda et al., 2015). Nevertheless, we mentionit here so as the readermay forma concrete image ofwhatwemeanby a skill, deferring the detailed considerations of the questionuntilthe Discussion.
For simplicity, the current model ignores interbreeding, whichis known to have occurred (Green et al., 2010; Reich et al., 2010;Kuhlwilm et al., 2016), and culture/technology transfer betweenspecies, which may or may not have occurred (Bar-Yosef, 2013;Villa and Roebroeks, 2014; Roussel et al., 2016). We also assume aspatially uniform environment, i.e., geomorphological and climaticobstacles to range expansion are not modeled here. Moreover,the distinction between high and low culture levels is, to a firstapproximation, assumed to apply in all regions.
2. Models
For two competing species in an unstructured habitat, we set
dN1
dt= r1N1
(1 −
N1 + b12N2
M1(Z1)
), (1a)
dN2
dt= r2N2
(1 −
N2 + b21N1
M2(Z2)
), (1b)
dZ1dt
= r1Z1
(1 −
N1 + b12N2
M1(Z1)
)− γ1Z1 + δ1(N1 − Z1), (1c)
dZ2dt
= r2Z2
(1 −
N2 + b21N1
M2(Z2)
)− γ2Z2 + δ2(N2 − Z2). (1d)
The derivation is given in Supporting Information (SI) 1 (see Ap-pendix A).
Variables and parameters indexed by 1 and 2 refer to the resi-dent archaics and the intrusive moderns, respectively. The depen-dent variables are the population density, Ni(t), and the densityof skilled individuals, Zi(t), at time t , where 0 ≤ Zi(t) ≤ Ni(t).Each newborn chooses a random member of its population asan exemplar from whom it acquires the skill if that exemplar isskilled. Eqs. (1c) and (1d) are derived assuming random obliquetransmission within each species, but the equations and hence theresults do not change on assuming that cultural transmission ispartly vertical (Cavalli Sforza and Feldman, 1981, p. 84). Skilledindividuals then lose their skill at rate γi, and unskilled individualscan acquire the skills by innovation at rate δi. Loss of skill could bedue, for example, to imperfect recollection, lack of practice, or tocultural drift (Henrich, 2004). In addition, ri is the intrinsic growthrate, b12 and b21 are the interspecific competition coefficients, and
Mi(Zi) =
{MiL if Zi < Z∗
iMiH if Zi ≥ Z∗
i(1e)
is the carrying capacity of species i (1 or 2). That is, Mi(Zi) is stepfunctionwith a discontinuous upshift fromMiL toMiH at the criticaldensity of skilled individuals, Z∗
i (see, e.g., Henrich, 2004; Powellet al., 2009; Ghirlanda and Enquist, 2007, Fig. 1). We will refer toparameter Z∗
i as the ‘‘threshold’’, larger values of which entail thatmore skilled individuals are required to support the high carryingcapacity. More general forms for Mi(Zi) can be assumed withoutchanging the qualitative behavior of model Eqs. (1a)–(1d) (Aoki,2015; Gilpin et al., 2016). Importantly, Eq. (1) ignores transfer,either of genes (interbreeding) or of the skills (acculturation),between the two species.
Furthermore, we assume
MiL <Z∗
i
θi< MiH , (1f)
where θi =δi
γi+δi. The constraint (1f) entails that each species in
isolation can exist stably at either the low or the high carryingcapacity (bistability). A larger value of parameter θi implies greatercognitive (learning) ability, because γi and δi are the rates of lossand acquisition of the skills by social learning and innovation,respectively. Alternatively, it can mean that the skills are easier toretain or innovate.
We now introduce spatial structure, specifically an infinite one-dimensional space, and diffusion between neighboring regionsof this space. Let Ni(x, t) and Zi(x, t) represent the density of allindividuals (population density) and of skilled individuals (skilleddensity), respectively, of species i (= 1, 2) at location x and time t .With regard to our archaeological example of bladelets/microliths,it seems reasonable to assume that skilled density would be posi-tively correlated with the visibility or abundance of such artefactsin lithic assemblages. We allow for possibly different diffusioncoefficients (one-half the mean squared migration distance perunit time) in the two species, D1 and D2, and write our reaction–diffusion model as
∂N1
∂t= D1
∂2N1
∂x2+ r1N1
(1 −
N1 + b12N2
M1(Z1)
)(2a)
∂N2
∂t= D2
∂2N2
∂x2+ r2N2
(1 −
N2 + b21N1
M2(Z2)
)(2b)
∂Z1∂t
= D1∂2Z1∂x2
+ r1Z1
(1 −
N1 + b12N2
M1(Z1)
)− (γ1 + δ1)Z1 + δ1N1 (2c)
∂Z2∂t
= D2∂2Z2∂x2
+ r2Z2
(1 −
N2 + b21N1
M2(Z2)
)− (γ2 + δ2)Z2 + δ2N2 (2d)
where Mi(Zi) is given by Eq. (1e) and satisfies inequalities (1f).We focus on characterizing each traveling wave solution (TWS)
of Eq. (2). From anthropologically reasonable initial conditions,multiple traveling wave fronts with different speeds are observed,which originate from several different TWSs of Eq. (2). We willstudy the directionalities and speeds of these TWSs.
3. Results
3.1. Without spatial structure
3.1.1. Existence and local stability of equilibriaInternal (coexistence of the two species) equilibria of Eq. (1)
take the form
N1 =M1 − b12M2
1 − b12b21, Z1 = θ1N1, N2 =
M2 − b21M1
1 − b12b21,
Z2 = θ2N2,
(3)
6 J.Y. Wakano et al. / Theoretical Population Biology 119 (2018) 3–14
where Mi = Mi(Zi) and θi =δi
γi+δi. Existence requires N1 > 0, N2 >
0 and that the consistency condition
Ni <Z∗
i
θiwhen Mi = MiL (4a)
Ni ≥Z∗
i
θiwhen Mi = MiH (4b)
be satisfied. Each such equilibrium is locally stable if b12b21 < 1.Since Mi = MiL or MiH , up to four internal equilibria of the form inEq. (3) may exist.
Edge (exclusion of one species by the other) equilibria of theform
N1 = M1, Z1 = θ1M1, N2 = 0, Z2 = 0, (5a)
or
N1 = 0, Z1 = 0, N2 = M2, Z2 = θ2M2, (5b)
also exist given inequalities (1f), and are locally stable if b21 >M2M1
and b12 >M1M2
, respectively. Since Mi = MiL or MiH , there are atotal of four edge equilibria. The zero equilibrium (extinction ofboth species) exists and is unstable.
It is shown in SI 2 that Zi(t) converges to θiNi(t) from all initialconditions that satisfy Ni(0) > 0.
3.1.2. Special case of cognitive and intrinsic-demographic equivalencewith partial niche overlap
Weconsider here the special casewhen all parameter values areidentical in the two species, which entails cognitive and intrinsic-demographic equivalence of Neanderthals and modern humans.Moreover, we assume partial overlap of the niches (Banks et al.,2008; Hoffecker, 2009; Roebroeks and Soressi, 2016) of the twospecies and correspondingly set b12 = b21 = b < 1.
We use the shorthand notation
ELL =
(ML
1 + b,
ML
1 + b
)(6a)
ELH =
(ML − bMH
1 − b2,MH − bML
1 − b2
)(6b)
EHL =
(MH − bML
1 − b2,ML − bMH
1 − b2
)(6c)
EHH =
(MH
1 + b,
MH
1 + b
)(6d)
to denote the four internal equilibria. The first and second quan-tities in the parentheses on the right hand sides of Eq. (6) are thevalues of N1 and N2, respectively, obtained by settingM1L = M2L =
ML, M1H = M2H = MH , and b12 = b21 = b in Eq. (3). The densitiesof skilled individuals at these equilibria are then Z1 = θ N1 andZ2 = θ N2, where θ1 = θ2 = θ . We will refer to ELL and EHH as thelow and high symmetrical internal equilibria, respectively, and toELH and EHL as the asymmetrical internal equilibria.
Similarly, we write the four edge equilibria as
EL0 = (ML, 0) (7a)
E0L = (0,ML) (7b)
EH0 = (MH , 0) (7c)
E0H = (0,MH) . (7d)
Here, EL0 and E0L are the low edge equilibria, whereas EH0 and E0Hare the high edge equilibria.
Combining our basic assumption inequalities (1f) with the sim-plifying assumptionsmade here, we find that the low edge equilib-ria, EL0 and E0L, exist but are unstable. For the other equilibria, we
can distinguish two cases. First, ifML < Z∗
θ<
MH1+b and 0 < b <
MLMH
,all four internal equilibria, ELL, ELH , EHL, and EHH , exist and are locallystable; then both high edge equilibria, EH0 and E0H , are unstable(Fig. 1 panel A). Second, if ML < Z∗
θ<
MH1+b and ML
MH< b < 1, then
both symmetrical internal equilibria, ELL and EHH , as well as bothhigh edge equilibria, EH0 and E0H , exist and are locally stable; underthese conditions the asymmetrical internal equilibria, ELH and EHL,do not exist (Fig. 1 panel B).
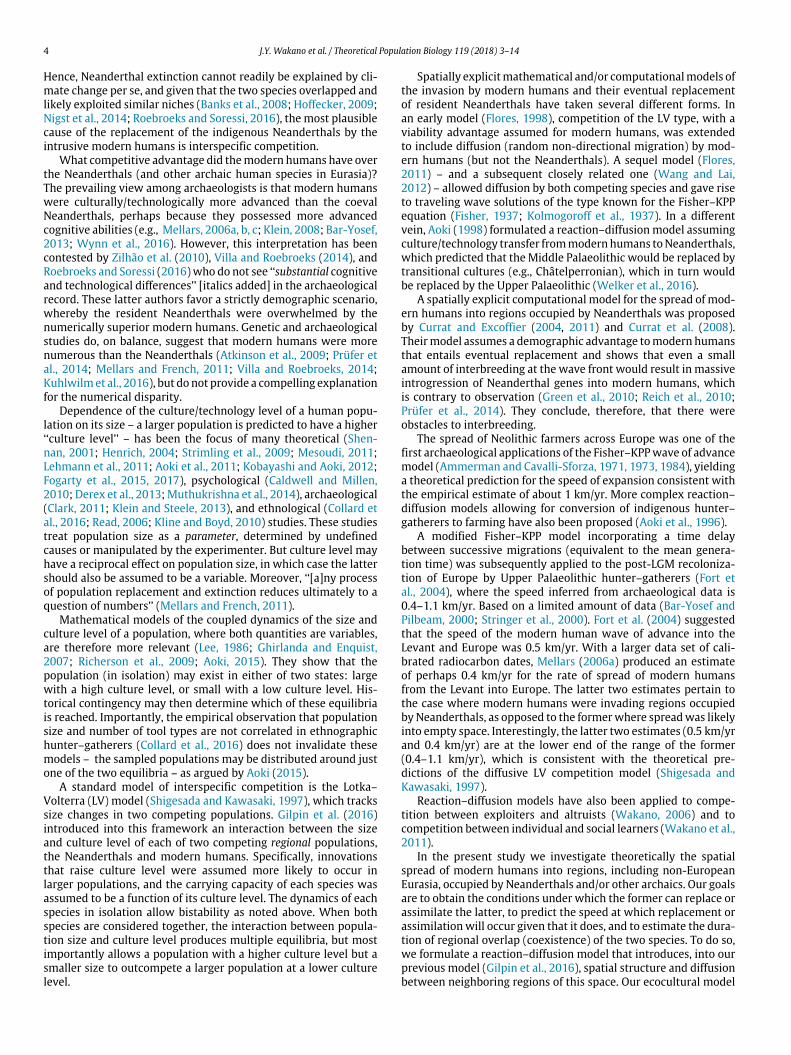
Fig. 1 plots these equilibria in the (N1,N2)−plane, on the as-sumption that Z1(t) and Z2(t) have converged to θN1(t) and θN2(t),respectively. It can be shown that the basins of attraction of thefour locally stable equilibria in each of the two cases distinguishedabove are the four rectangular regions bounded by a verticaldashed line at N1 = Z∗/θ and a horizontal dashed line at N2 =
Z∗/θ . As discussed in Section 3.2.3, the directionality of a TWSconnecting two locally stable equilibria (i.e., a bistable wave) isdetermined by the locations of these boundaries relative to thelocations of these equilibria.
3.2. With spatial structure
3.2.1. A special solution of Eq. (2)We show in SI 2 that, if Eq. (2) has a solution, then a special
solution of the formZ1(x, t) = θ1N1(x, t)Z2(x, t) = θ2N2(x, t)
(8)
exists, which is globally stable (for demographically relevant so-lutions). Convergence to the solution in Eq. (8) entails that thenumber of dependent variables can be reduced from four to two,as a result of which the null cline analysis illustrated in Fig. 1 tointerpret the dynamics without spatial structure remains useful instudying the dynamics with spatial structure.
3.2.2. Eigenstructure analysis at an edge equilibrium and the mini-mum speed of a TWS
In SI 3, we derive the minimum possible speed of a TWS thatconnects an edge equilibrium Eq. (5b) (where N1 = 0) to aninternal (coexistence) equilibrium Eq. (3), which is
|v| ≥ 2
√D1r1
(1 − b12
M2
M1
). (9a)
The minimum speed is important as it often, though not neces-sarily, corresponds to the realized speed, which is estimated bynumerical analysis, of a TWS (Shigesada and Kawasaki, 1997).However, without further information, we cannot determinewhether v is positive or negative – the wave front may move rightor left, respectively – so ‘‘minimum’’ here refers to the absolutevalue of the speed. Nevertheless, inequality (9a) defines a non-zero minimum speed only if b12 <
M1M2
, in which case the edgeequilibrium Eq. (5b) is unstable. Hence, if the internal equilibriumEq. (3) to which the TWS is connected is locally stable, we haveby definition a monostable wave, and its directionality is such thatthe spatial regions where equilibrium Eq. (5b) (with N1 = 0) holdscontract.
Similarly, the minimum speed of a TWS that connects an edgeequilibrium Eq. (5a) (where N2 = 0) to an internal (coexistence)equilibrium Eq. (3) is given by
|v| ≥ 2
√D2r2
(1 − b21
M1
M2
). (9b)
Inequality (9b) defines a non-zero minimum speed only if b21 <M2M1
, in which case the edge equilibrium Eq. (5a) is unstable.
J.Y. Wakano et al. / Theoretical Population Biology 119 (2018) 3–14 7
Fig. 1. Dynamics of Eq. (1) in the (N1,N2)-plane. Parameter values are equal in the two species. Zi(t) = θNi(t) is assumed. Solid lines indicate the null clines dNidt = 0. The
dashed vertical and horizontal lines indicate the thresholds Ni = Z∗/θ where the carrying capacities jump between ML and MH . Blue and red refer to species i = 1 and 2,respectively. Intersections of two null clines correspond to locally stable (filled circles) and unstable (open circle) equilibria. Equilibria emphasized in the text are labelled.Trajectories are indicated by thin lines with arrowheads. We set b = 0.1 in panel A and b = 0.5 in panel B. Other parameter values are θ = 0.5, Z∗
= 12, r = 1, ML = 10,MH = 50.
3.2.3. Direction of travel of a bistable waveA bistable wave connects two locally stable equilibria of Fig. 1.
Unlike themonostablewave the speed of bistablewave is uniquelydetermined. However, we are unable to derive it mathematically,and we obtain instead an approximate condition that predicts itsdirectionality, i.e. whether it is positive, zero, or negative.
For simplicity, we consider only the situation analyzed inSection 3.1.2 with identical parameter values assumed for bothspecies. Fig. 1 panel A illustrates the case where all four internalequilibria are locally stable. Consider a TWS connecting the twolocally stable internal equilibria ELH and ELL. Assume as in Fig. 2panel A that ELH holds to the left of the wave front and ELL to theright. As shown in SI 4, an approximate condition for the spatialregions where ELH holds to expand at the expense of the regionswhere ELL holds is
2((1 − b2)Z∗
θ
)3
+ 3bML
((1 − b2)Z∗
θ
)2
−ML(M2
H + (1 − 3b)MHML + b3M2L
)< 0. (10a)
For given values of ML,MH , and b, the critical value of Z∗/θ thatpredicts zero speed can be obtained by numerically solving thecubic Eq. (10a) (black triangle in Fig. 3A).
A similar analysis can be done for a TWS connecting the locallystable edge equilibrium, E0H , and the locally stable internal equilib-rium, ELL. When the configuration of null-clines is as in Fig. 1 panelB,which occurswhenML < Z∗/θ and ML
MH< b < 1, an approximate
condition for the spatial regions where E0H holds to expand at theexpense of the regions where ELL holds (Fig. 2 panel B) is
2b(1 + b)2(MH − ML)(Z∗
θ
)3
− b(1 + b)2M3HML + (1 + 3b)M3
L MH < 0 (10b)
(black triangle in Fig. 3B).
3.3. Numerical analysis
Numerical simulations of Eq. (2) were performed on the finitespatial domain 0 ≤ x ≤ L with zero-flux boundary conditions.Our purpose here is to investigate the conditions under whichmodern humans could have replaced or assimilated the archaic
humans, even if as claimed by some archaeologists, their cognitive(learning) capabilities did not differ (e.g., Zilhão et al., 2010;Villa and Roebroeks, 2014; Roebroeks and Soressi, 2016). Hence,we equate the three parameters related to cognition in the twospecies: γ1 = γ2 = γ , δ1 = δ2 = δ, Z∗
1 = Z∗
2 = Z∗. Since wealso wish to explore whether an intrinsic demographic superiorityof modern humans is a necessary condition for replacement orassimilation, we set all demographic parameters equal in the twospecies: r1 = r2 = r , M1L = M2L = ML, M1H = M2H = MH ,D1 = D2 = D, b12 = b21 = b.
On the other hand, we posit an advantage tomodern humans inthe initial conditions. Invoking bistability of regional populationsin isolation – i.e., ML < Z∗/θ < MH (inequalities (1f)) – weassume that due to historical contingency modern and archaichumans were distributed throughout Africa and Eurasia at thehigh and low carrying capacities, respectively. This assumptionof disparate initial densities is informed by available genetic andarchaeological estimates of the effective and census populationsizes of Neanderthals and modern humans at around the timeof the latter’s out-of-Africa dispersal (Bocquet-Appel et al., 2005;Atkinson et al., 2009;Mellars and French, 2011; Bocquet-Appel andDegioanni, 2013; Villa and Roebroeks, 2014; Prüfer et al., 2014;Kuhlwilm et al., 2016). Specifically, representing the spatial extentof Africa and Eurasia by the left and right halves of our finite spatialdomain 0 ≤ x ≤ L, we set
N1(x, 0) = 0,N2(x, 0) = MH for 0 ≤ x ≤L2
(11a)
N1(x, 0) = ML, N2(x, 0) = 0 forL2
< x ≤ L (11b)
Z1(x, 0) = θN1(x, 0) for 0 ≤ x ≤ L (11c)
Z2(x, 0) = θN2(x, 0) for 0 ≤ x ≤ L. (11d)
The skilled densities were always seen to converge to the quasi-equilibrium values, Zi(x, t) = θNi(x, t), whether or not conditions(11c) and (11d) were imposed at the start of the simulation.
Itmay be special pleading to assume that allmodern human andarchaic regional populations would initially have been at the highand low carrying capacities, respectively, due in effect to chance.Later we show that relaxing the stringent condition Eq. (11) doesnot significantly affect our results, but first we describe the basic
8 J.Y. Wakano et al. / Theoretical Population Biology 119 (2018) 3–14
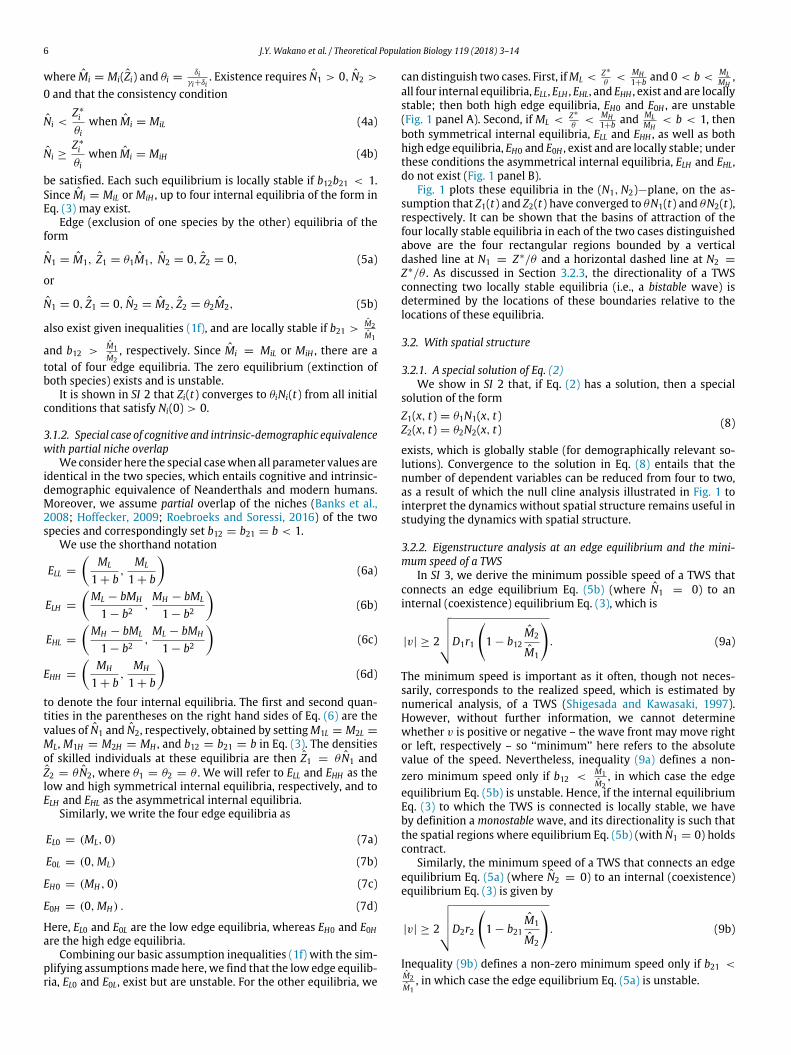
Fig. 2. Numerical solutions of Eq. (2) on the finite spatial domain. Parameter values are equal in the two species. (Upper) Kymographs showing the evolution of the systemEq. (2) from the spatially-segregated initial conditions Eq. (11). Time on the vertical axis is measured downward and stops when the second wave front reaches the rightboundary. At any previous moment, the densities in different regions of space are close to the following equilibria: exclusion of species 1 (Eq. (7c)) and species 2 (Eq. (7a)) asindicated by red and blue shading, respectively; low symmetrical coexistence of the two species (Eq. (6a)) as indicated by green shading; and asymmetrical coexistence withspecies 2 at the higher density (Eq. (6b)) as indicated by brown shading. Qualitatively different types of invasion – assimilation when b = 0.1 (panel A) and replacementwhen b = 0.5 (panel B) – are observed. (Lower) Snapshots of the wave profiles at the time indicated by white dashed horizontal lines on the kymographs above, withdirectionalities indicated by gray arrows and their relative speeds by the lengths of these arrows. Other parameter values are γ = δ = 0.2, Z∗
= 11, r = 1, D = 1,ML = 20,MH = 50.
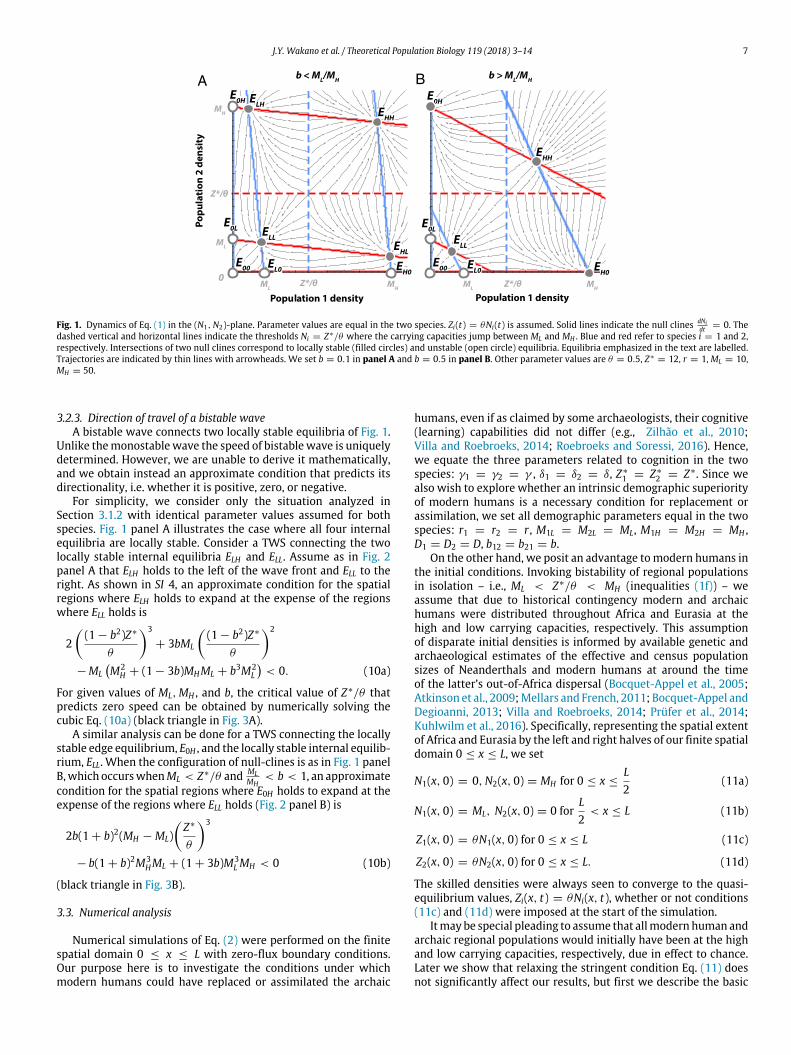
Fig. 3. Dependence of the speeds of the wave fronts on Z∗/θ (ratio of the threshold density of skilled individuals to cognitive ability). Numerically-determined speeds of thewave fronts for the two strengths of competition shown in the previous figure, b = 0.1 (A) and b = 0.5 (B). The speeds of the first, second, and third waves are indicatedby blue, brown, and red discs, respectively. Analytical predictions for the minimum speeds are indicated by solid lines, when known (Eqs. (12a) and (12b)). Only the speedof the second wave depends on Z∗/θ . Note this speed does not depend on Z∗ and θ individually, because it is measured after convergence to Eq. (8). Assimilation (A) orreplacement (B) can only occur when the speed of this second wave is greater than zero, which can be predicted analytically (black triangle, Eqs. (10a) and (10b)). Since thisspeed is negatively correlated with Z∗/θ , the duration of low coexistence (equilibrium ELL) is shorter for smaller values of Z∗/θ . Gray discs give the speeds of a qualitativelydifferent solution with a wave profile that differs from those illustrated in Fig. 2 (Supporting Fig. 4). Fixed parameter values are θ = 0.5, r = 1, D = 1, ML = 20,MH = 50.
scenarios of replacement and assimilation that are predicted underthis condition.
Due to the assumed difference in initial densities, we never ob-serve extinction of modern humans in the numerical simulations.The demographically ‘‘worst’’ scenario for modern humans is rep-resented by a solution such that ELL eventually displaces all otherequilibria and, in particular, such that the initially high density ofmodern humans at the left of the spatial domain collapses (seebelow). In other words, modern and archaic humans are predictedeventually to coexist at the same low density ML
1+b throughoutAfrica and Eurasia. We may take this scenario as the default caseagainst which the effects of altering the parameter values may becompared. In what follows, we assumeML < Z∗
θ<
MH1+b .
3.4. Assimilation scenario
When 0 < b <MLMH
, three wave fronts, two monostable andone bistable, form spontaneously after an initial transient. Fig. 2Alower panel shows a snapshot of thewave profiles. Themonostablewave front at the right (the first wave) travels toward the right(i.e., with positive speed), with the result that the low coexistenceequilibrium, ELL (Eq. (6a)), replaces the low edge equilibrium, EL0(Eq. (7a)). This wave front represents the expansion of a relativelysmall number of modern humans into regions previously occupiedsolely by Neanderthals, and is shown in Fig. 2A upper panel asa transition from blue to green. The observed speed is in goodagreement with the analytically-derived minimum speed Eq. (9b),
J.Y. Wakano et al. / Theoretical Population Biology 119 (2018) 3–14 9
which reduces here to
v = 2√Dr (1 − b). (12a)
In the example illustrated in Fig. 2A (lower panel), the bistablewave front in the middle (the second wave) represents the furtherexpansion of modern humans such that in its wake they exist ata higher density than the Neanderthals. This wave front movestoward the right (i.e., with positive speed) because inequality (10a)is satisfied here. Hence, the asymmetric coexistence equilibrium,ELH (Eq. (6b), brown shading in Fig. 2A upper panel), replaces thelow coexistence equilibrium, ELL (Eq. (6a), green). For the param-eter values considered in this paper, however, the second waveis slower than the first wave, which entails that low coexistencelasts longer at regions that are closer to the periphery of the spatialdomain (compare the lengths of the vertical transects through thegreen triangle in Fig. 2A upper panel).
As Z∗/θ approaches MH1+b from below, inequality (10a) no longer
holds, the speed becomes negative (Fig. 3 panel A), andwe observethe default case. From Fig. 1 panel A, we see that Z∗/θ is thehorizontal threshold between the domains of attraction of ELH andof ELL in the (N1,N2)−plane. The intuitive reason why relativelylarge values of Z∗/θ are associated with negative speeds of thesecond wave is that this threshold is pushed upward, so that thelatter domain of attraction becomes larger. A negative speedmeansthat ELH is replaced by ELL.
Finally, the monostable wave front at the left (third wave)travels toward the left (i.e., with negative speed) and representsthe expansion of a relatively small number of Neanderthals intoregions where modern humans were resident. That is, the asym-metric coexistence equilibrium, ELH (Eq. (6b), brown), replaces thehigh edge equilibrium, E0H (Eq. (7d), red). The observed speed is ingood agreement with the analytically-derivedminimum speed Eq.(9a), which reduces here to
v = −2
√Dr(1 − b
MH
ML
). (12b)
We call the pattern of eventswhen the secondwavehas positivespeed the ‘‘assimilation’’ scenario, because a relatively small num-ber of archaics remains after invasion by moderns, and althoughnot explicitly modeled, the former would by interbreeding beabsorbed into the latter. Interestingly, as Fig. 2A lower panel shows,four different equilibria of Eq. (1) are simultaneously visible in thesimulation in separate regions of the one-dimensional domain –from left to right E0H , ELH , ELL, EL0 – with smooth spatial gradientsmonotonically interpolating between these equilibria.
To summarize, when 0 < b <MLMH
and Z∗/θ is sufficiently small,our analysis predicts the assimilation of Neanderthals by modernhumans. Importantly, it is the directionality of the second wave inour ecocultural model that determines whether assimilation willoccur (positive speed in Fig. 3 panel A). This assimilation scenario,however, entails that Neanderthals would have contributed tothe ancestry of Africans as well as Eurasians, a prediction that iscurrently not supported by genetic studies.
3.5. Replacement scenario
When interspecific competition is stronger, with MLMH
< b < 1, atranscritical bifurcation occurs in Eq. (1) such that the asymmetriccoexistence equilibria (Eqs. (6b), (6c)) become unstable, but thehigh edge equilibria (Eqs. (7c), (7d)) are now locally stable. Thisqualitatively changes the wave profiles, such that only onemonos-table and one bistable wave front now occur. For the parametervalues assumed in Fig. 2B, both travel toward the right (i.e., withpositive speed). Moreover, the monostable first wave has an ob-served speed that agrees with the analytically-derived minimumEq. (12a).
The bistable secondwave represents the complete replacementof Neanderthals by modern humans. We call this the ‘‘replace-ment’’ scenario. As in the previous case of 0 < b <
MLMH
, lowcoexistence lasts longer at regions that are closer to the peripheryof the spatial domain (see also Fig. 4). For larger values of Z∗/θthan is assumed in Fig. 2B, the speed of the secondwave is negative(Fig. 3 panel B), and we again observe the default case. In this case,replacement does not occur.
In summary, when MLMH
< b < 1 and Z∗/θ is sufficientlysmall, our analysis predicts the replacement of Neanderthals bymodern humans. It is the directionality of the second wave thatagain determineswhether replacement, in this case, can occur (Fig.3 panel B).
3.6. Critical level of niche overlap
In both assimilation and replacement scenarios, carrying capac-ities of both species are low in the first wave, while increased car-rying capacity associatedwith cultural difference drives the secondwave. The first wave is due to ecological invasion by moderns whoexploit the niche that is not used by Neanderthals. Thus, whenniche overlap is larger (i.e., b is closer to 1), the first wave becomesslower (see Eq. (12a)). The second wave is a cultural invasion bymoderns who utilize their increased carrying capacity, which issupported by high skilled density. Thus, the speed of the secondwave is faster when the advantage of culture (MH/ML) is largeror when transition to a higher carrying capacity is more likely tooccur (Z∗/θ is smaller). Keeping these culture-related parametersconstant, the first wave could be slower than the second wavewhen b is close to 1. This speculation is consistentwith the analyticresult of the special case b → 1, where the speed of the first waveis zero (Eq. (12a)), while the speed of the second wave can be stillpositive (inequality (10b) holds whenMH/ML is sufficiently large).The speculation is also supported by numerical calculations for b >0.95 (Supporting Fig. 3), in which case the first and second wavescoincide to form a single wave (profiles not shown). Intuitively, ifthe two species’ niches are almost identical, ecological invasionis nearly impossible and cultural difference becomes the majorreason for invasion of Neanderthals bymoderns. If niche differenceis small but not negligible, thenwe observewave profiles as shownin Fig. 2B. Although we set a large advantage of culture (MH/ML =
50/20), our numerics showed that a low coexistence region ofmodern humans and Neanderthals appears and expands even forrelatively high niche overlap (b = 95%).
3.7. Local overlap in the replacement scenario
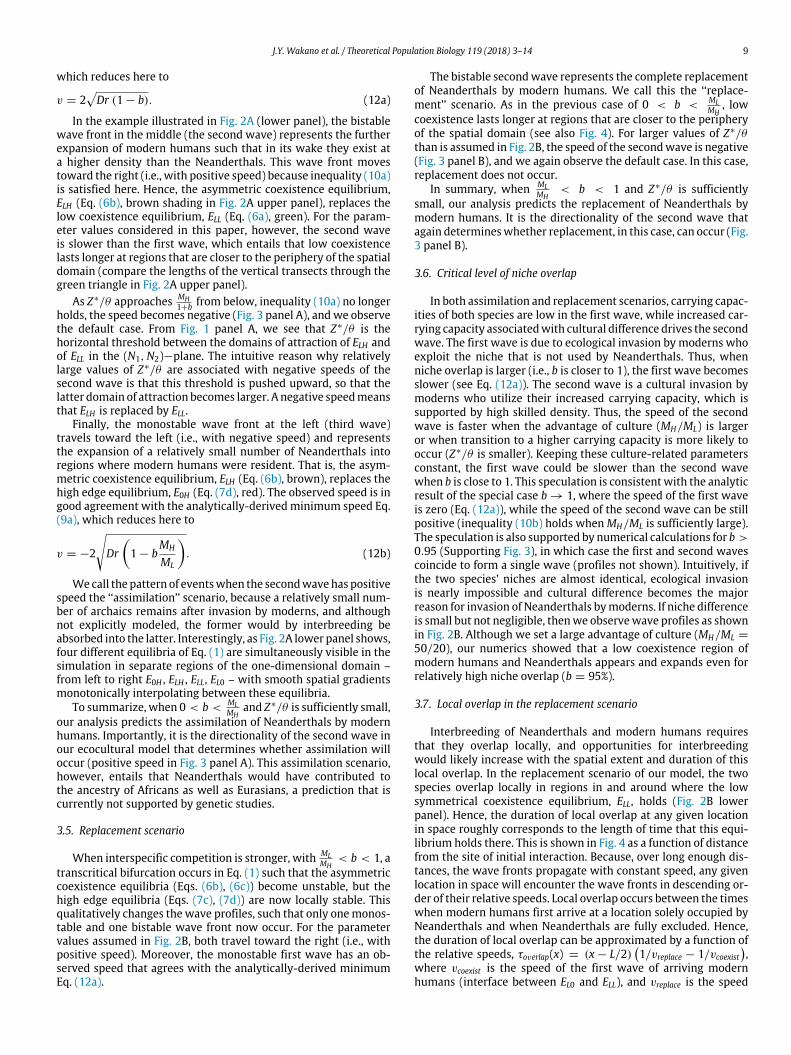
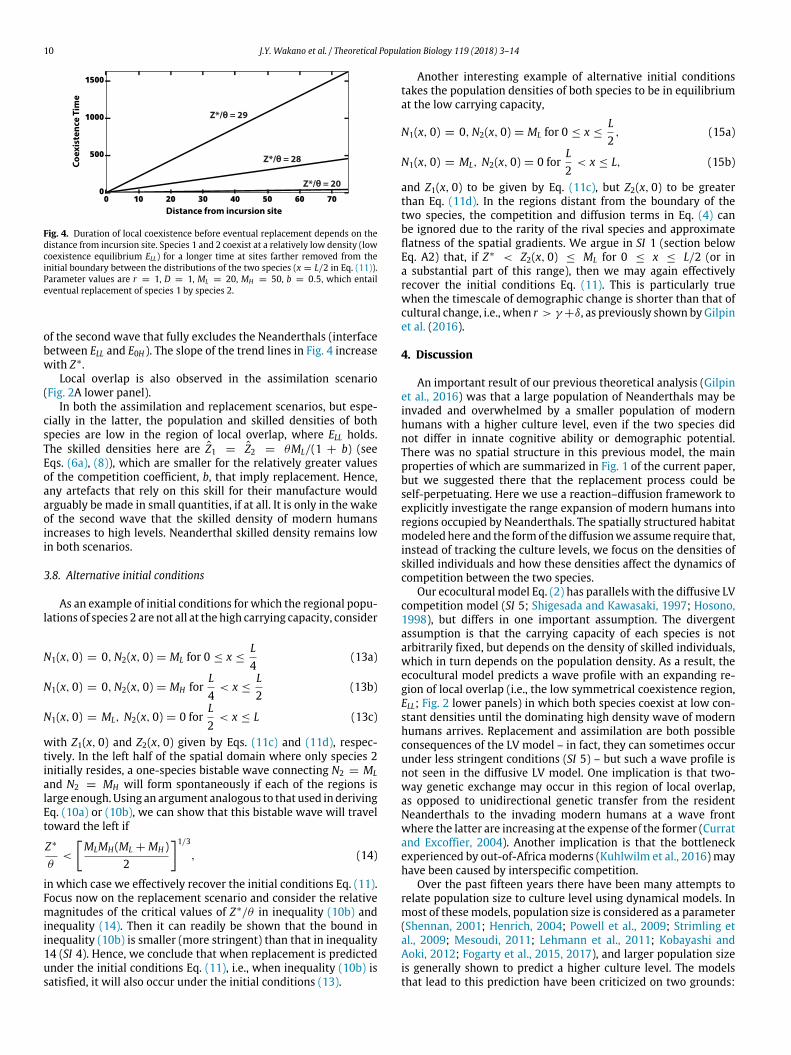
Interbreeding of Neanderthals and modern humans requiresthat they overlap locally, and opportunities for interbreedingwould likely increase with the spatial extent and duration of thislocal overlap. In the replacement scenario of our model, the twospecies overlap locally in regions in and around where the lowsymmetrical coexistence equilibrium, ELL, holds (Fig. 2B lowerpanel). Hence, the duration of local overlap at any given locationin space roughly corresponds to the length of time that this equi-librium holds there. This is shown in Fig. 4 as a function of distancefrom the site of initial interaction. Because, over long enough dis-tances, the wave fronts propagate with constant speed, any givenlocation in space will encounter the wave fronts in descending or-der of their relative speeds. Local overlap occurs between the timeswhen modern humans first arrive at a location solely occupied byNeanderthals and when Neanderthals are fully excluded. Hence,the duration of local overlap can be approximated by a function ofthe relative speeds, τoverlap(x) = (x − L/2)
(1/vreplace − 1/vcoexist
),
where vcoexist is the speed of the first wave of arriving modernhumans (interface between EL0 and ELL), and vreplace is the speed
10 J.Y. Wakano et al. / Theoretical Population Biology 119 (2018) 3–14
Fig. 4. Duration of local coexistence before eventual replacement depends on thedistance from incursion site. Species 1 and 2 coexist at a relatively low density (lowcoexistence equilibrium ELL) for a longer time at sites farther removed from theinitial boundary between the distributions of the two species (x = L/2 in Eq. (11)).Parameter values are r = 1, D = 1, ML = 20, MH = 50, b = 0.5, which entaileventual replacement of species 1 by species 2.
of the second wave that fully excludes the Neanderthals (interfacebetween ELL and E0H ). The slope of the trend lines in Fig. 4 increasewith Z∗.
Local overlap is also observed in the assimilation scenario(Fig. 2A lower panel).
In both the assimilation and replacement scenarios, but espe-cially in the latter, the population and skilled densities of bothspecies are low in the region of local overlap, where ELL holds.The skilled densities here are Z1 = Z2 = θML/(1 + b) (seeEqs. (6a), (8)), which are smaller for the relatively greater valuesof the competition coefficient, b, that imply replacement. Hence,any artefacts that rely on this skill for their manufacture wouldarguably be made in small quantities, if at all. It is only in the wakeof the second wave that the skilled density of modern humansincreases to high levels. Neanderthal skilled density remains lowin both scenarios.
3.8. Alternative initial conditions
As an example of initial conditions for which the regional popu-lations of species 2 are not all at the high carrying capacity, consider
N1(x, 0) = 0,N2(x, 0) = ML for 0 ≤ x ≤L4
(13a)
N1(x, 0) = 0,N2(x, 0) = MH forL4
< x ≤L2
(13b)
N1(x, 0) = ML, N2(x, 0) = 0 forL2
< x ≤ L (13c)
with Z1(x, 0) and Z2(x, 0) given by Eqs. (11c) and (11d), respec-tively. In the left half of the spatial domain where only species 2initially resides, a one-species bistable wave connecting N2 = MLand N2 = MH will form spontaneously if each of the regions islarge enough. Using an argument analogous to that used in derivingEq. (10a) or (10b), we can show that this bistable wave will traveltoward the left if
Z∗
θ<
[MLMH (ML + MH )
2
]1/3, (14)
in which case we effectively recover the initial conditions Eq. (11).Focus now on the replacement scenario and consider the relativemagnitudes of the critical values of Z∗/θ in inequality (10b) andinequality (14). Then it can readily be shown that the bound ininequality (10b) is smaller (more stringent) than that in inequality14 (SI 4). Hence, we conclude that when replacement is predictedunder the initial conditions Eq. (11), i.e., when inequality (10b) issatisfied, it will also occur under the initial conditions (13).
Another interesting example of alternative initial conditionstakes the population densities of both species to be in equilibriumat the low carrying capacity,
N1(x, 0) = 0,N2(x, 0) = ML for 0 ≤ x ≤L2, (15a)
N1(x, 0) = ML, N2(x, 0) = 0 forL2
< x ≤ L, (15b)
and Z1(x, 0) to be given by Eq. (11c), but Z2(x, 0) to be greaterthan Eq. (11d). In the regions distant from the boundary of thetwo species, the competition and diffusion terms in Eq. (4) canbe ignored due to the rarity of the rival species and approximateflatness of the spatial gradients. We argue in SI 1 (section belowEq. A2) that, if Z∗ < Z2(x, 0) ≤ ML for 0 ≤ x ≤ L/2 (or ina substantial part of this range), then we may again effectivelyrecover the initial conditions Eq. (11). This is particularly truewhen the timescale of demographic change is shorter than that ofcultural change, i.e., when r > γ +δ, as previously shown byGilpinet al. (2016).
4. Discussion
An important result of our previous theoretical analysis (Gilpinet al., 2016) was that a large population of Neanderthals may beinvaded and overwhelmed by a smaller population of modernhumans with a higher culture level, even if the two species didnot differ in innate cognitive ability or demographic potential.There was no spatial structure in this previous model, the mainproperties of which are summarized in Fig. 1 of the current paper,but we suggested there that the replacement process could beself-perpetuating. Here we use a reaction–diffusion framework toexplicitly investigate the range expansion of modern humans intoregions occupied by Neanderthals. The spatially structured habitatmodeled here and the formof the diffusionwe assume require that,instead of tracking the culture levels, we focus on the densities ofskilled individuals and how these densities affect the dynamics ofcompetition between the two species.
Our ecocultural model Eq. (2) has parallels with the diffusive LVcompetition model (SI 5; Shigesada and Kawasaki, 1997; Hosono,1998), but differs in one important assumption. The divergentassumption is that the carrying capacity of each species is notarbitrarily fixed, but depends on the density of skilled individuals,which in turn depends on the population density. As a result, theecocultural model predicts a wave profile with an expanding re-gion of local overlap (i.e., the low symmetrical coexistence region,ELL; Fig. 2 lower panels) in which both species coexist at low con-stant densities until the dominating high density wave of modernhumans arrives. Replacement and assimilation are both possibleconsequences of the LV model – in fact, they can sometimes occurunder less stringent conditions (SI 5) – but such a wave profile isnot seen in the diffusive LV model. One implication is that two-way genetic exchange may occur in this region of local overlap,as opposed to unidirectional genetic transfer from the residentNeanderthals to the invading modern humans at a wave frontwhere the latter are increasing at the expense of the former (Curratand Excoffier, 2004). Another implication is that the bottleneckexperienced by out-of-Africa moderns (Kuhlwilm et al., 2016) mayhave been caused by interspecific competition.
Over the past fifteen years there have been many attempts torelate population size to culture level using dynamical models. Inmost of thesemodels, population size is considered as a parameter(Shennan, 2001; Henrich, 2004; Powell et al., 2009; Strimling etal., 2009; Mesoudi, 2011; Lehmann et al., 2011; Kobayashi andAoki, 2012; Fogarty et al., 2015, 2017), and larger population sizeis generally shown to predict a higher culture level. The modelsthat lead to this prediction have been criticized on two grounds:

J.Y. Wakano et al. / Theoretical Population Biology 119 (2018) 3–14 11
first, the assumptions of the models are implausible (Vaesen etal., 2016), and second, the prediction that cultural complexity isgoverned by population size is not supported by ethnographic orarchaeological evidence (Vaesen et al., 2016; Collard et al., 2016).Our analysis can be viewed as an investigation of how populationsize differences between Neanderthals and modern humans mayhave arisen and, in particular, how the two-way interaction be-tween culture level or prevalence of culturally transmitted skillscould have produced demographic differences (see also Lee, 1986;Ghirlanda and Enquist, 2007; Aoki, 2015; Gilpin et al., 2016). Socialfactors (rather than cognitive or ecological ones) have also beeninvoked to explain the eventual dominance of modern humans(Horan et al., 2005).
The replacement scenario of our model predicts a first waveof invading modern humans with low population and skilleddensities, which is followed by a slower second wave with highpopulation and skilled densities. When the skilled density is low,any artefacts that rely on this skill for their manufacture anduse would arguably be made in small quantities and may not bearchaeologically visible. In light of these predictions, it is note-worthy that several archaeologists have suggested a scenario ofNeanderthal extinction in the face of two major waves of modernhuman expansion into Europe, which differ from each other incultural/behavioral patterns (Bar-Yosef, 2007; Hoffecker, 2009;Hublin, 2015).
The first wave is represented by lithic assemblages grouped asthe Bohunician and Bachokirian industries in central and easternEurope, which are considered to have been produced by mod-ern humans who expanded their range from the Levant, wherea similar cultural entity, the Emiran, occurred coevally (Škrdra,2003; Bar-Yosef and Belfer-Cohen, 2013). These cultural entitiesare chrono-culturally termed the Initial Upper Palaeolithic (IUP),which is characterized by Upper Palaeolithic tool types, such asend scrapers and burins. However, it is widely known that the IUPcore-reduction technology retains some elements of the Levalloismethod that was prevalent, along with the use of hard hammers,in theMiddle Paleolithic, yielding robust blades with large, facetedstriking platforms. In addition, only a few IUP sites in Europe andthe Levant have yielded bone artifacts and ornaments (Kuhn etal., 2009), leading Hoffecker (2009) to point out ‘‘the scarcity ofevidence for innovative technology’’ as ‘‘one of the striking char-acteristics’’ of the Bohunician industry.
Similar lithic assemblages are also distributed in the southernAltai and Mongolia (Kuhn and Zwyns, 2014). Although the IUPsites discovered so far have not yielded unambiguous modernhuman fossils, the presence of a contemporaneous 45,000-year-old modern human at Ust’-Ishim in western Siberia suggests thatthe IUP in southern Siberia can be attributed to modern humans(Fu et al., 2014). During the IUP, Neanderthals were still present inwestern Europe, where numerousMousterian sites are distributedcoevally (Higham et al., 2014). Hublin (2015) has characterized theIUP of ‘‘southwest Asia, eastern and central Europe, and . . . centralAsia’’ as ‘‘a first expansion ofmodern humans into Eurasia thatmayhave been partly unsuccessful’’.
A second wave of modern humans has been suggested forthe occurrences of the Protoaurignacian industry in Europe andthe Early Ahmarian in the Levant, assuming the derivation of theformer from the latter by the range expansion of modern humansfrom the Levant to Europe (Bar-Yosef, 2007; Zilhão, 2007; Hof-fecker, 2009; Hublin, 2015; but see Kadowaki et al., 2015). Bothindustries are characterized by abundant bladelets produced fromprismatic coreswith soft hammers that create small butts,markinga fully Upper Palaeolithic technology, i.e., the Early Upper Palae-olithic (EUP). Similar bladelet assemblages are also known fromthe Zagros and the Caucasus regions (Hublin, 2015). These bladeletassemblages are often associated with bone/antler implements
and ornaments, which are also typical of the Upper Palaeolithic.Regarding the makers of the Protoaurignacian and the Ahmarian,there are cases in which modern human fossils have been recov-ered in association with artefact remains (Bergman and Stringer,1989; Benazzi et al., 2015). In addition, the greater number of sitesof the Protoaurignacian and Early Ahmarian in comparison withthe IUP sites may indicate an increase in population (Zilhão, 2007;Kadowaki, 2013). In Europe, the Protoaurignacian overlaps in timewith the last Mousterian sites (Banks et al., 2013; Higham et al.,2014) and is considered to represent ‘‘a cause (either directly orindirectly) of the extinction of the Neanderthals’’ (Benazzi et al.,2015).
We argue that these two waves of modern human range ex-pansions, empirically observed in fossil and artifact records, could,to a first approximation, correspond to the two waves predictedby our theoretical model. However, our ecocultural model doesnot equate the skill with any specific lithic industry. We suggestthat a possible candidate for the skill may be the know-how andability to manufacture bladelets/microliths, which requires us toaddress two questions: (1) what are the advantages associatedwith bladelets/microliths as opposed to other, larger, tools, and(2) does the spatial/temporal distribution of bladelets/microlithsin the archaeological record agree with the proposed routes andtiming of modern human dispersal(s)? The first question canonly be answered speculatively. Smaller cutting tools, such asbladelets/microliths, may have permitted more economical useof stone (Eren et al., 2008) and may have increased huntingefficiency as armatures of composite projectiles (Shea, 2006). Theuse of bladelets/microliths as components may have allowed theproduction of diverse composite tools that aided the exploitation ofbroader resources (Kuhn, 2002), particularly when the availabilityof resources was uncertain due to environmental variability (His-cock et al., 2011).
With regard to the second question, the spread of geometricmicroliths from their origin in Africa to India and Sri Lanka viathe coastal route, as argued by Mellars et al. (2013), may be anexemplary case (but see Petraglia et al., 2007). According toMellarset al. (2013), the geometric microliths that first appear in southernAsia 40–35 kya are homologous to the Howiesons Poort geometricmicroliths and were introduced by modern humans dispersingout-of-Africa 60–50 kya. The apparent delay in reaching southernAsia is plausibly attributed to the subsequent rise in sea level thathas submerged the earlier archaeological sites (the same explana-tion may apply to their absence in the intermediate regions alongthe coastal route). The prediction from our model that the firstwave of incoming modern humans would be characterized by lowpopulation and skilled densities, with implications for archaeolog-ical visibility, may also be relevant.
The case for the rest of Eurasia is more complicated. Unfortu-nately, Brown et al. (2012) may have over-simplified the situationwhen they stated that ‘‘[m]icrolith-tipped projectile weapons in-creased hunting success . . . and would have conferred substantiveadvantages on modern humans as they left Africa and encoun-tered Neanderthals equipped with only hand-cast spears’’. Mostnotably, an African influence has not been demonstrated on thebladelets/microliths found in the Levant (e.g., Marks, 2003; Belfer-Cohen andGoring-Morris, 2007;Mellars et al., 2013;Hublin, 2015).In other words, the modern human dispersal out-of-Africa intothe Levant likely occurredwithout the help of bladelets/microliths.Although bladelets have recently been reported at some IUP sitesin the Levant (Boëda et al., 2015; Kadowaki, 2017) and southernSiberia (Zwyns et al., 2012), their occurrences are still limited incomparison with the later EUP assemblages, such as the EarlyAhmarian. In Europe, intentional production or use of bladelets areunknown in the Bachokirian or the Bohunician (Hoffecker, 2009;Hublin, 2015). On the other hand, production of bladelets by Ne-anderthals is attested in several French Mousterian assemblages,
12 J.Y. Wakano et al. / Theoretical Population Biology 119 (2018) 3–14
although their frequencies are lower than in Protoaurignacianassemblages (Villa and Roebroeks, 2014). In this way, we suggestthat the increase in the frequency of bladelets from the IUP (andpossibly the Middle Palaeolithic) to the EUP can be regarded as apotential archaeological correlate of the changing density of skilledindividuals predicted by our model.
To reiterate, the replacement scenario of our model predicts afirst wave of invading modern humans with low population andskilled densities, which is followed by a slower second wave withhigh population and skilled densities. Hence,whenwe focus on oneregion, we expect the IUP to precede the EUP, which is apparentlynot the case in western Europe or the Zagros/Caucasus regions.However, when the skilled density is low, any artefacts that rely onthis skill for theirmanufacture, namely bladelets/microliths,wouldlikely bemade in quantities too small to be archaeologically visible.In addition, the model ignores the Allee effect (e.g., Roques et al.,2012) and demographic stochasticity, which if incorporated mayaffect our predictions where the population density is low. Thus,we submit that the empirically observed spread of the IUP and theEUP may, to a first approximation, correspond to the theoreticallypredicted first and second waves, respectively.
The relative sizes of Neanderthals and moderns both priorand subsequent to the expansion of the latter from Africa havebeen investigated using archaeological and genomic techniques.Advanced tools in Africa may have enabled expansion of numbersthere prior to 70 kya (Brown et al., 2012), and analysis ofmitochon-drial DNA suggests that the expansion out of Africa was ‘‘prefacedby a major [demographic] expansion in Africa’’ (Atkinson et al.,2009). There is considerable agreement that the Neanderthal-to-modern transition was accompanied by rapid population growth(Mellars and French, 2011; Villa and Roebroeks, 2014). For thesereasons we first conducted our numerical analysis assuming in Eq.(11) that the initial density N2(x, 0) in the left half of space, repre-senting moderns in Africa, was uniformly greater than N1(x, 0) inthe right half, representing Neanderthals in Eurasia.
However, the results presented here may even apply to sit-uations in which modern humans lack an initial demographicadvantage (e.g., Eq. (15)). Modern humans, who start out with acultural advantage, will rapidly reach a demographic advantage,as shown in our previous work (Gilpin et al., 2016), if the timescaleof demographic change is faster than that of cultural change (Rich-erson et al., 2009). When the size of the intrinsic growth rate, r ,relative to the cultural transmission parameters, γ and δ, is largeenough that r > γ + δ, then any permissible Z2(x, 0) > Z∗ issufficient for invasion by the moderns as long as the other criteriafor Z∗ discussed above are also satisfied. However, if r is sufficientlysmall compared to γ + δ, there exists a minimum value of Z2(x, 0)below which the skilled density of the moderns will decrease tothat of the Neanderthals, precluding invasion. Thus Z2(x, 0) > Z∗
is a necessary but not sufficient condition for moderns to invade.These and other details concerning how the initial skilled densityand the key parameters r, γ , δ, affect the success of the modernsare provided in SI 1. It should be emphasized that the converseis also true: an initial demographic advantage does not guaranteereplacement or assimilation.
Throughout our analysis, we have assumed that inequalities(1f) hold; these entail that each species in isolation can existstably at either the high carrying capacity,MH , or the low carryingcapacity, ML. Our main numerical results assume that initially inEq. (2) the population sizes are given by Eqs. (11a) and (11b) inthe left and right halves of the finite spatial domain. Depending onwhether the competition coefficient, b, is less than or greater thanML/MH , either three waves (Fig. 2A) or two (Fig. 2B), respectively,form. In the former case, one monostable wave takes a smallnumber ofmoderns to coexistence of both species at low densities.However, the bistable wave, in this case, continues the expansion
of moderns to asymmetric coexistence, with a higher density ofmoderns and a lower density of archaics. This is the assimilationscenario, which is not supported by current genetic studies, as itentails that Neanderthals would have contributed to the geneticancestry of Africans as well as Eurasians. In the latter case wherecompetition is stronger (Fig. 2B), the bistable wave allows themoderns to completely replace the archaics, although there is aperiod of coexistence, which is longer near the right boundary(x = L) of the spatial domain. Additional numerical work showsthat as b approaches 1 – i.e., when competition becomes evenstronger due to further niche overlap – the duration of coexistenceof the two species becomes very short (Supporting Fig. 3). It shouldbe emphasized that assimilation or replacement may occur onlywhen the speed of the bistable wave is positive; this places anupper bound on Z∗/θ , the ratio of the threshold skilled density tocognitive ability (or ease of acquisition of the skills) (see Eqs. (10a)and (10b); Fig. 3).
Our numerical analysis demonstrates transient periods of lowcoexistence between the arrivals of the monostable wave frontand the bistable wave front. The duration and spatial extent ofthe Neanderthal-modern coexistence have been addressed in thearchaeological literature. Archaeological opinions vary between‘‘quite long on a continental scale’’ (Hublin, 2015) to ‘‘atmost about6000 yr . . .with periods of overlap within the individual regions ofEurope (such as western France) of perhaps only 1000–2000 yr’’(Mellars 2006) and ‘‘an overlap ofminimally 2000 yrwithin Europecan be inferred’’ (Roebroeks and Soressi, 2016). In Europe, at least,there seems to be a consensus building that the overlap occurredbetween about 40 and 45 kya, but may not have lasted for thiswhole period. It may be conjectured that data from theManot cave(Hershkovitz et al., 2015) and other as yet unexploredMiddle East-ern locations, may extend the beginning of the period of overlap to55 kya or earlier. The period of overlap inferred from archaeologyprovides real-world timescales for features of our model, but thequalitative properties of ourmodel do not depend on the exact em-pirical values—rather, our model provides insight into the mannerin which the relative magnitudes of different effects (competition,learning, etc.) contribute to different outcomes. It is comforting,however, to see that the reaction–diffusion approach does allowfor coexistence in non-trivial parametric geographic and temporalranges.
Our analyses highlight the importance of local geographic aswell as temporal overlap between Neanderthals and modern hu-mans. This overlap must have been essential for genetic introgres-sion to occur. Our results suggest three predictions. (i) We predictthat the period of local overlap, inferred either from archaeolog-ical records or from studies of (two-way) genetic introgression(Kuhlwilm et al., 2016), should be larger in regions of Europedistant from the first modern human entry site (presumably inthe Levant, as in Hershkovitz et al., 2015). (ii) We predict that thestrength of the dependence of local overlap period on distancefromentry site (the slope of the trend lines in Fig. 4) should increaseas the difficulty of the skills determining carrying capacity (asmea-sured by θ−1) increases. A very strong dependence of overlap dura-tion on distance from the Levantwould suggest that the skills wererelatively difficult because the second wave must have travelledslowly relative to the first wave (Fig. 3). (iii) During the overlapof Neanderthals and modern humans, the saturation density ofthe latter would be lower than after Neanderthal extinction. Thiscould appear as a decreased estimated effective population size forancestral modern humans. Similarly, our model might be used as abaseline model for population genetic analysis such as those esti-mating the level of genetic exchange. The spatial extension of ourearlier ecocultural analysis (Gilpin et al., 2016) focuses attention ongeographical variation in both archaeological findings and degreeof genetic exchange across the Levant and western Eurasia.

J.Y. Wakano et al. / Theoretical Population Biology 119 (2018) 3–14 13
Acknowledgments
We thank H. Matano, K. Sano, T. Akazawa, and O. Kolodnyfor valuable comments. This research was supported in part byMonbukagakusho Grant 16H06412 to JYW and SK, by the StanfordCenter for Computational, Evolutionary andHumanGenomics, andby the Morrison Institute for Population and Resource Studies atStanford University.
Appendix A. Supplementary data
Supplementary material related to this article can be foundonline at https://doi.org/10.1016/j.tpb.2017.09.004.
References
Ammerman, A.J., Cavalli-Sforza, L.L., 1971. Measuring the rate of spread of earlyfarming in Europe. Man 6, 674–688.
Ammerman, A.J., Cavalli-Sforza, L.L., 1973. A population model for the diffusionof early farming in Europe. In: Renfrew, C. (Ed.), The Explanation of CultureChange. Duckworth, London, pp. 343–357.
Ammerman, A.J., Cavalli-Sforza, L.L., 1984. TheNeolithic Transition and the Geneticsof Populations in Europe. Princeton University Press, Princeton, NJ.
Aoki, K., 1998. Modeling the spread of early farming and of the Early UpperPaleolithic in Europe. In: Omoto, K., Tobias, P. (Eds.), The Origins and Past ofModern Humans: Towards Reconciliation. World Scientific Press, Singapore,pp. 161–182.
Aoki, K., 2015. Modeling abrupt cultural regime shifts during the Palaeolithic andstone age. Theor. Popul. Biol. 100, 6–12.
Aoki, K., Lehmann, L., Feldman, M.W., 2011. Rates of cultural change and patterns ofcultural accumulation in stochastic models of social transmission. Theor. Popul.Biol. 79, 192–202.
Aoki, K., Shida, M., Shigesada, N., 1996. Travelling wave solutions for the spread offarmers into a region occupied byhunter-gatherers. Theor. Popul. Biol. 50, 1–17.
Atkinson, Q.D., Gray, R.D., Drummond, A.J., 2009. Bayesian coalescent inference ofmajor human Mitochondria DNA haplogroup expansions in africa. Proc. R. Soc.B 276, 367–373.
Banks, W.E., et al., 2008. Neandertal extinction by competitive exclusion. PLoS one3 (12), e3972.
Banks, W.E., d’Errico, F., Zilhão, J., 2013. Revisiting the chronology of the proto-aurignacian the Early Aurignacian in Europe: a reply to higham et al.’s com-ments on Banks, et al. 2013. J. Hum. Evol. 65, 810–817.
Bar-Yosef, O., 2007. The archaeological framework of the Upper Paleolithic revolu-tion. Diogenes 54, 3–18.
Bar-Yosef, O., 2013. Neanderthals andmodern humans across Eurasia. In: Akazawa,T., Nishiaki, Y., Aoki, K. (Eds.), Dynamics of Learning inNeandErthals andModernHumans Vol. 1 Cultural Perspectives. Springer, Japan, Tokyo, pp. 7–20.
Bar-Yosef, O., Belfer-Cohen, A., 2013. Following pleistocene road signs of humandispersals across Eurasia. Quat. Int. 285, 30–43.
Bar-Yosef, O., Kuhn, S.L., 1999. The big deal about blades: laminar technologies andhuman evolution. Am. Anthropol. 101, 322–338.
Bar-Yosef, O., Pilbeam,D., 2000. TheGeography ofNeandErtals andModernHumansin Europe and theGreaterMediterranean. PeabodyMuseumof Archaeology andEthnology and Harvard University, Cambridge MA.
Belfer-Cohen, A., Goring-Morris, N., 2007. From the beginning: levantine UpperPalaeolithic cultural change and continuity. In: Mellars, P., Boyle, K., Bar-Yosef,O., Stringer, C. (Eds.), Rethinking the Human Revolution: New Behaviouraland Biological Perspectives on the Origin and Dispersal of Modern Humans.McDonald Institute for Archaeological Research, Cambridge, pp. 199–206.
Benazzi, S., et al., 2011. Early dispersal of modern humans in Europe and implica-tions for neanderthal behaviour. Nature 479, 525–528.
Benazzi, S., et al., 2015. The makers of the protoaurignacian and implications forneandertal extinction. Science 348, 793–796.
Bergman, C.A., Stringer, C., 1989. Fifty years after: Egbert, and early Upper Palae-olithic juvenile from Ksar Akil, Lebanon. Paléorient 15, 99–111.
Bocquet-Appel, J.-P., Degioanni, A., 2013. Neanderthal demographic estimates. Curr.Anthropol. 54, S202–S213.
Bocquet-Appel, J.-P., Demars, P.-Y., Noiret, L., Dobrowsky, D., 2005. Estimates ofUpper Palaeolithic meta-population size in Europe from archaeological data. J.Archaeol. Sci. 32, 1656–1668.
Boëda, E., et al., 2015. Un débitage lamellaire au proche-orient vers 40,000 ans calBP le site d’umm el tlel, Syrie Centrale. L’Anthropologi 119, 141–169.
Brown, K.S., et al., 2012. An early and enduring advance technology originating71,000 years ago in south africa. Nature 491 (7425), 590–593.
Caldwell, C.A., Millen, A.E., 2010. Human cumulative culture in the laboratory:effects of (micro) population size. Learn. Behav. 38, 310–318.
Cavalli Sforza, L.L., Feldman, M.W., 1981. Cultural Transmission and Evolution: AQuantitative Approach. Princeton University Press, Princeton N.J.
Clark, J.L., 2011. The evolution of human culture during the later pleistocene:Using fauna to test models on the emergence and nature of ‘‘modern’’ humanbehavior. J. Anthropol. Archaeol. 30, 273–291.
Collard, M., Vaesen, K., Cosgrove, R., Roebroeks,W., 2016. The empirical case againstthe ‘demographic turn’ in palaeolithic archaeology. Philos. Trans. R. Soc. Lond.B Biol. Sci. 371, 20150242.
Currat, M., Excoffier, L., 2004. Modern humans did not admix with Neanderthalsduring their range expansion into Europe. PLoS Biol. 2 (12), e421.
Currat, M., Excoffier, L., 2011. Strong reproductive isolation between humans andNeanderthals inferred from observed patterns of introgression. Proc. Natl. Acad.Sci. USA 108, 15129–15134.
Currat, M., Ruedi, M., Petit, R.J., Excoffier, L., 2008. The hidden side of invasions:Massive introgression by local genes. Evolution 62, 1908–1920.
Derex, M., Beugin, M.P., Godelle, B., Raymond, M., 2013. Experimental evidence forthe influence of group size on cultural complexity. Nature 503, 389–391.
Eren, M.I., Greenspan, A., Sampson, C.G., 2008. Are upper paleolithic blade coresmore productive than middle paleolithic discoidal cores? A replication experi-ment. J. Hum. Evol. 55, 952–961.
Fisher, R.A., 1937. The wave of advance of advantageous genes. Ann. Eugenics 7,355–369.
Flores, J.C., 1998. A mathematical model for Neanderthal extinction. J. Theoret. Biol.191, 295–298.
Flores, J.C., 2011. Diffusion coefficient of modern humans outcompeting Nean-derthals. J. Theoret. Biol. 280, 189–190.
Fogarty, L., Wakano, J.Y., Feldman, M.W., Aoki, K., 2015. Factors limiting the num-ber of independent cultural traits that can be maintained in a population.In: Mesoudi, A., Aoki, K. (Eds.), Learning Strategies and Cultural Evolution Dur-ing the Palaeolithic. Springer, Tokyo, pp. 9–21.
Fogarty, L.,Wakano, J.Y., Feldman,M.W., Aoki, K., 2017. The driving forces of culturalcomplexity: Neanderthals, modern humans, and the question of populationsize. Hum. Nat. 28, 39–52.
Fort, J., Pujol, T., Cavalli-Sforza, L.L., 2004. Palaeolithic populations and waves ofadvance. Camb. Archaeol. J. 14, 53–61.
Fu, Q., et al., 2014. Genome sequence of a 45,000-year-old modern human fromwestern Siberia. Nature 514, 445–450.
Ghirlanda, S., Enquist, M., 2007. Cumulative culture and explosive demographictransitions. Qual. Quant. 41, 591–600.
Gilpin, W., Feldman, M.W., Aoki, K., 2016. An ecocultural model predicts Nean-derthal extinction through competition with modern humans. Proc. Natl. Acad.Sci. USA 113, 2134–2139.
Green, R.E., et al., 2010. A draft sequence of the Neandertal genome. Science 328,710–722.
Henrich, J., 2004. Demography and cultural evolution: how adaptive cultural pro-cesses can produce maladaptive losses—the tasmanian case. Am. Antiq. 69,197–214.
Hershkovitz, I., et al., 2015. Levantine cranium from manot cave (Israel) foreshad-ows the first European humans. Nature 520, 216–219.
Higham, T., et al., 2014. The timing and spatiotemporal patterning of Neanderthaldisappearance. Nature 512, 306–309.
Hiscock, P., Clarkson, C., MacKay, A., 2011. Big debates over little tools: ongoingdisputes over microliths on three continents. World Archaeol. 43, 653–664.
Hoffecker, J.F., 2009. The spread of modern humans in Europe. Proc. Natl. Acad. Sci.USA 106, 16040–16045.
Horan, R.D., Bulte, E.H., Shogren, J.F., 2005. How trade saved humanity from bio-logical exclusion: the Neanderthal enigma revisited and revised. J. Econ. Behav.Organ. 58, 1–29.
Hosono, Y., 1998. The minimal speed of traveling fronts for a diffusive Lotka–Volterra competition model: dedicated to the memory of Akira Okubo. Bull.Math. Biol. 60, 435–438.
Hublin, J.-J., 2015. The modern human colonization of western Eurasia: when andwhere? Quat. Sci. Rev. 118, 194–210.
Hublin, J.-J., Roebroeks, W., 2009. Ebb and flow or regional extinctions? On thecharacter of Neandertal occupation of northern environments. C. R. Palevol. 8,503–509.
Kadowaki, S., 2013. Issues of chronological and geographical distributions ofmiddle and upper palaeolithic cultural variability in the levant and im-plications for the learning behavior of Neanderthals and Homo Sapiens.In: Akazawa, T., Nishiaki, Y., Aoki, K. (Eds.), Dynamics of Learning in Nean-dErthals and Modern Humans Volume 1 Cultural Perspectives. Springer, Tokyopp. 59–91.
Kadowaki, S., 2017. Technology of striking platform preparation on lithic debitagefrom Wadi Aghar, Southern Jordan, and its relevance to the initial UpperPalaeolithic technology in the levant. Al-Rafidan 38, 23–32.
Kadowaki, S., Omori, T., Nishiaki, Y., 2015. Variability in early ahmarian lithictechnology and its implications for the model of levantine origin of the pro-toaurignacian. J. Hum. Evol. 82, 67–87.
Klein, R.G., 2008. Out of Africa and the evolution of humanbehavior. Evol. Anthropol.17, 267–281.

14 J.Y. Wakano et al. / Theoretical Population Biology 119 (2018) 3–14
Klein, R.G., Steele, T.E., 2013. Archaeological shellfish size and later human evolutionin Africa. Proc. Natl. Acad. Sci. USA 110, 10910–10915.
Kline, M.A., Boyd, R., 2010. Population size predicts technological complexity inOceania. Proc. R. Soc. Lond. B Biol. Sci. 277, 2559–2564.
Kobayashi, Y., Aoki, K., 2012. Innovativeness, population size and cumulative cul-tural evolution. Theor. Popul. Biol. 82, 38–47.
Kolmogoroff, A., Petrovsky, I., Piscounoff, N., 1937. Étude de l’équation de la diffu-sion avec croisssance de la quantité dematière et son application a un problèmebiologique. Bull. Univ. D’état. Moscou Ser. Internat. Sect. A 1, 1–25.
Kuhlwilm,M., et al., 2016. Ancient gene flow from earlymodern humans into esternNeanderthals. Nature 530, 429–433.
Kuhn, S.L., 2002. Pioneers of microlithization: the proto-aurignacian of southernEurope. In: Elston, R.G., Kuhn, S.L. (Eds.), Thinking Small: Global Perspectiveson Microlithization. pp. 83–93 (Archaeological Papers of the American Anthro-pological Association12).
Kuhn, S.L., et al., 2009. The Early Upper Paleolithic occupations at ÜçağızlıCave(Hatay, Turkey). J. Hum. Evol. 56, 87–113.
Kuhn, S.L., Zwyns, N., 2014. Rethinking the Initial Upper Paleolithic. Quat. Int. 347,29–38.
Lee, R.D., 1986. Malthus and boserup: A dynamic synthesis. In: Coleman, D.,Schofield, R. (Eds.), The State of Population Theory. Basil Blackwell, Oxford,pp. 96–130.
Lehmann, L., Aoki, K., Feldman, M.W., 2011. On the number of independent culturaltraits carried by individuals and populations. Philos. Trans. R. Soc. Lond. B Biol.Sci. 366, 424–435.
Marks, A., 2003. Reflections on levantine upper palaeolithic studies: past andpresent. In: Goring Morris, A.N., Belfer-Cohen, A. (Eds.), More than Meets theEye: Studies on Upper Palaeolithic Diversity in the Near East. Oxbow Books,Oxford, pp. 249–264.
Mellars, P., 2006a. A new radiocarbon revolution and the dispersal of modernhumans into Eurasia. Nature 439, 931–935.
Mellars, P., 2006b. Going east: new genetic and archaeological perspectives on themodern human colonization of Eurasia. Science 313, 796–800.
Mellars, P., 2006c. Why did modern human populations disperse from Africa ca.60,000 years ago? A new model. Proc. Natl. Acad. Sci. USA 103,9381–9386.
Mellars, P., French, J.C., 2011. Tenfold population increase in western Europe at theNeandertal-to-modern human transition. Science 333, 623–627.
Mellars, P., et al., 2013. Genetic and Archaeological perspectives on the initialmodern human colonization of Southern Asia. Proc. Natl. Acad. Sci. USA 110,10699–10704.
Mesoudi, A., 2011. Variable cultural acquisition costs constrain cumulative culturalevolution. PLoS one 6 (3), e18239.
Muthukrishna, M., Shulman, B.W., Vasilescu, V., Henrich, J., 2014. Sociality influ-ences cultural complexity. Proc. R. Soc. Lond. B Biol. Sci. 281, 20132511.
Nigst, P.R., et al., 2014. Early modern human settlement of Europe north of the Alpsoccurred 43,500 years ago in a cold steppe-type environment. Proc. Natl. Acad.Sci. USA 111, 14394–14399.
Petraglia, M., et al., 2007. Middle Paleolithic assemblages from the indian subconti-nent before and after the toba super-eruption. Science 317, 114–116.
Powell, A., Shennan, S., Thomas, M.G., 2009. Late Pleistocene demography and theappearance of modern human behavior. Science 324 (5932), 1298–1301.
Prüfer, K., et al., 2014. The complete genome sequence of a Neanderthal from thealtai mountains. Nature 505, 43–49.
Read, D., 2006. Tasmanian knowledge and skill: maladaptive imitation or adequatetechnology. Am. Antiq. 71, 164–184.
Reich, D., et al., 2010. Genetic history of an archaic hominin group from denisovacave in Siberia. Nature 468, 1053–1060.
Richerson, P.J., Boyd, R., Bettinger, R.L., 2009. Cultural innovations and demographicchange. Hum. Biol. 81, 211–235.
Richter, J., 2016. Leave at the height of the party: a critical review of the MiddlePaleolithic in Western Central Europe from its beginnings to its rapid decline.Quat. Int. 411, 107–128.
Roebroeks,W., Soressi, M., 2016. Neandertals revised. Proc. Natl. Acad. Sci. USA 113,6372–6379.
Roques, L., Garnier, J., Hamel, F., Klein, E.K., 2012. Allee effect promotes diversity intraveling waves of colonization. Proc. Natl. Acad. Sci. USA 109, 8828–8833.
Roussel, M., Soressi, M., Hublin, J.-J., 2016. The Châtelperronian conundrum: bladeand bladelet lithic technologies from quinçay, France. J. Hum. Evol. 95, 13–32.
Shea, J., 2006. The origins of lithic projectile point technology: evidence fromAfrica,the Levant, and Europe. J. Archaeol. Sci. 33, 823–846.
Shennan, S., 2001. Demography and cultural innovation: a model and its implica-tions for the emergence of modern human culture. Camb. Archaeol. J. 11, 5–16.
Shigesada, N., Kawasaki, K., 1997. Biological Invasions: Theory and Practice. OxfordUniv. Press, Oxford.
Škrdra, P., 2003. Comparison of Boker Tachtit and Stránská skálaMP/UP transitionalindustries. J. Israel Prehist Soc. 33, 37–73.
Strimling, P., Sjöstrand, J., Enquist, M., Eriksson, K., 2009. Accumulation of indepen-dent cultural traits. Theor. Popul. Biol. 76, 77–83.
Stringer, C.C., Barton, R.N.E., Finlayson, J.C. (Eds.), 2000. NeandErthals on theEdge: 10th Anniversary Conference of the Forber’S Quarry Discovery, Gibraltar.Oxbow Books, Oxford.
Vaesen, K., Collard, M., Cosgrove, R., Roebroeks, W., 2016. Reply to Henrich et al:The Tasmanian effect and other red herrings. Proc. Natl. Acad. Sci. USA 113 (44),E6726–E6727.
Villa, P., Roebroeks,W., 2014. Neanderthal demise: an Archaeological analysis of themodern human superiority complex. PLoS one 9 (4), e96424.
Wakano, J.Y., 2006. A mathematical analysis of public goods games in the continu-ous space. Math. Biosci. 201, 72–89.
Wakano, J.Y., Kawasaki, K., Shigesada, N., Aoki, K., 2011. Coexistence of individualand social learners during range expansion. Theor. Popul. Biol. 80, 132–140.
Wang,M.-X., Lai, P.-Y., 2012. Population dynamics andwave propagation in a Lotka–Volterra system with wave propagation. Phys. Rev. E 86, 051908.
Welker, F., et al., 2016. Palaeoproteomic evidence identifies archaic hominins asso-ciatedwith the Châtelperronian at the grotte du renne. Proc. Natl. Acad. Sci. USA113 (40), 11162–11167.
Wynn, T., Overmann, K.A., Coolidge, F.L., 2016. The false dichotomy: a refutation ofthe Neandertal indistinguishability claim. J. Anthropol. Sci. 94, 1–22.
Zilhão, J., 2007. The emergence of ornaments and art: an archaeological perspectiveon the origins of ‘‘behavioral modernity’’. J. Archaeol. Res. 15, 1–54.
Zilhão, J., et al., 2010. Symbolic use ofmarine shells andmineral pigments by IberianNeandertals. Proc. Natl. Acad. Sci. USA 107, 1023–1028.
Zwyns, N., et al., 2012. Burin-core technology and laminar reduction sequences inthe Initial Upper Paleolithic from Kara-Bom (Gorny-Altai, Siberia). Quat. Int.259, 33–47.