ecl 222 measuring motor torque speed curves
DESCRIPTION
To a motor manufacturer exact information aboutthe Torque-Speed characteristics of his motormeans money. The more exactly he can measure itunder all conditions, the more exactly he candesign his product. Bill Tyler, Chief Engineerof the Rotating Electrical Machinery Departmentof Tamper Ltd. , wanted more information. To getit he undertook the development of an instrumentwhich would measure the transient torque-speedcharacteristics of his line of motors.TRANSCRIPT

Engineering Case Library
ECL 222
MEASURING MOTOR TORQUE-SPEED CURVES (A)
To a motor manufacturer exact information aboutthe Torque-Speed characteristics of his motormeans money. The more exactly he can measure itunder all conditions, the more exactly he candesign his product. Bill Tyler, Chief Engineerof the Rotating Electrical Machinery Departmentof Tamper Ltd. , wanted more information. To getit he undertook the development of an instrumentwhich would measure the transient torque-speedcharacteristics of his line of motors.
The author gratefully acknowledges the assistance ofW. Tyler and 0. Bencsics.
(c) 1976 by G. Kardos , Carleton University, Ottawa, Canada.Prepared by G. Kardos and A. Chumak. Printed and distributedwith support from the sponsors of the ASEE-Stanford Engin-eering Case Program:
E.I. duPont de Nemour and CompanyThe General Electric FoundationIBMOlin Corporation Charitable TrustUnion Carbide Corporation

2 ECL 222A
T- Torque
Fig. 1: T-N CURVE FOR INDUCTION MOTOR
horsepower is delivered at rated speed which is something lessthan synchronous speed. Industry standards define minimumvalues for required breakdown torque, locked rotor torque andpull up torque.
The motor design is based upon the torque requirements atrated speed and horsepower. Theory can be used to determinepull up torque to within 10% and breakdown torque to 2 0%.The errors are mainly due to the reactances which presenttheory cannot predict.
To evaluate a finished motor a dynamometer is used to measurethe T-N curve. The determination of the complete T-N curveis very tedious. The standard check points, such as lockedrotor torque etc. , can be found quickly and accurately. Butexact values are very difficult to obtain in the region ofnegative acceleration. Things change too quickly. OnceTamper tried to use 12 technicians to make accurate measure-ments in this region, but they still couldn't reduce theerror to less than 2 0%.
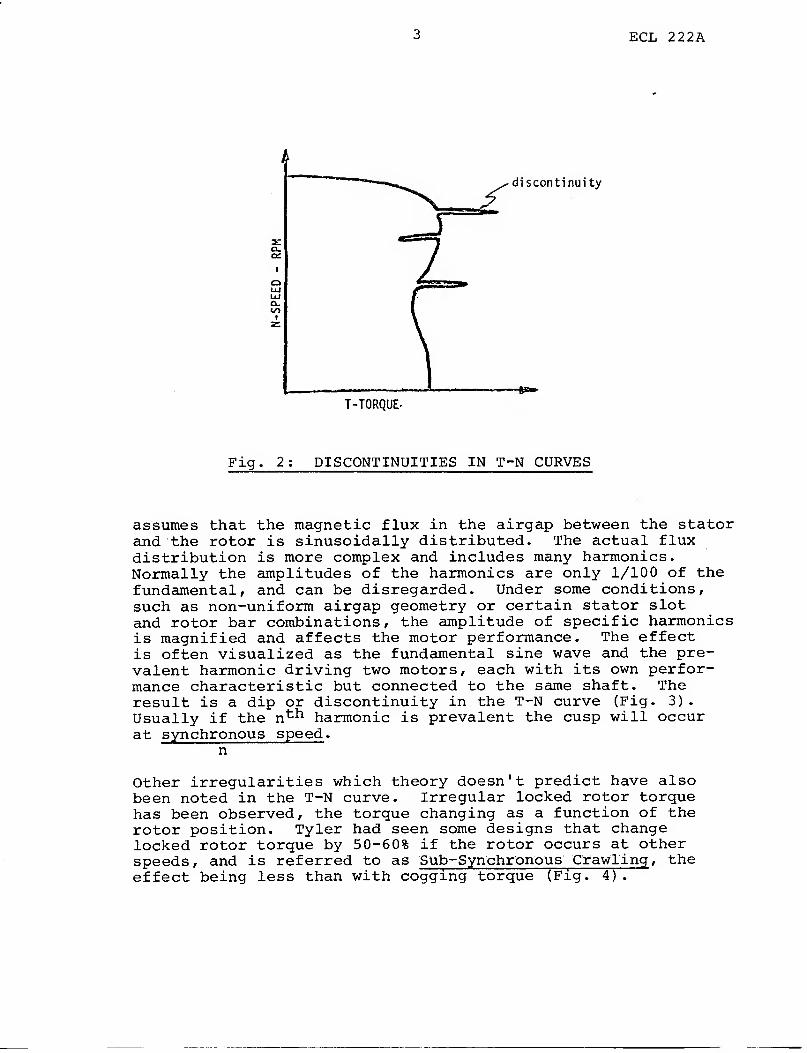
An important feature of the Torque-Speed characteristic whichcannot be predicted from theory nor easily measured on adynamometer is the cusps or discontinuities in the curve(Fig. 2) . Theory only predicts a smooth curve because it

ECL 222A
MEASURING MOTOR TORQUE-SPEED CURVES (A)
Tamper Ltd. , the electrical division of Canron Ltd. , wasfounded in Montreal, Quebec, in 1934 as Electric Tamper andEquipment Co. of Canada Ltd. During World War II it became amajor supplier of electric motors to the Canadian Navy. Sincethen it has continued to grow so that now it is the secondlargest motor manufacturer in Canada. The Montreal plant,employing 800 people, is responsible for the design and manu-facture of a full line of integral horsepower motors from 1 HPto 5300 HP.
Bill Tyler is the chief engineer of the Rotating ElectricalMachinery Department. He graduated in electrical engineeringfrom McGill University in 1948. After graduation he workedfor Tamper for six years on the mechanical design of electricmotors. He left Tamper to work for several different compan-ies. He has experience in the development of gyroscopes, air-craft navigation equipment, gunfire control systems, dieselsimulators, and combustion systems. He considers the threeyears spent doing marketing studies a most important part ofhis career. To him, marketing is essential to the trainingof any engineer.
Tyler returned to Tamper to become corporate manager of Re-search and Development. Tamper has diversified interests,and the work carried out by his division was also diversified.Tyler supervised development projects ranging from hydraulicrock drills to railway alignment equipment.
Eventually the company found it was too diversified to operateefficiently with Central Research and Development. To shortenresponse time, each department was made responsible for itsown research. As a result of reorganization Tyler becamechief engineer of the Rotating Electrical Machinery branch,with a staff of 25.
Indeed it was on Tyler's recommendation that the Central Re-search and Development Division of the company was split.Tyler had concluded that a central research division was justsomething which Tamper could not afford. "Unless you are asbig as Bell Telephone or General Electric, your research mustbe heavily guided by marketing."
One problem constantly confronting the designers of inductionmotors is the need for accurate Torque-Speed Curves.
The performance characteristic of an induction motor is sum-marized by its Torque-Speed (T-N) curve (Fig. 1). The rated
3 ECL 222A
T -TORQUE-
Fig. 2: DISCONTINUITIES IN T-N CURVES
assumes that the magnetic flux in the airgap between the statorand the rotor is sinusoidally distributed. The actual fluxdistribution is more complex and includes many harmonics.Normally the amplitudes of the harmonics are only 1/100 of thefundamental, and can be disregarded. Under some conditions,such as non-uniform airgap geometry or certain stator slotand rotor bar combinations, the amplitude of specific harmonicsis magnified and affects the motor performance. The effectis often visualized as the fundamental sine wave and the pre-valent harmonic driving two motors, each with its own perfor-mance characteristic but connected to the same shaft. Theresult is a dip or discontinuity in the T-N curve (Fig. 3)
.
Usually if the nth harmonic is prevalent the cusp will occurat synchronous speed ,
n
Other irregularities which theory doesn't predict have alsobeen noted in the T-N curve. Irregular locked rotor torquehas been observed, the torque changing as a function of therotor position. Tyler had seen some designs that changelocked rotor torque by 5 0-60% if the rotor occurs at otherspeeds, and is referred to as Sub-Synchronous Crawling , theeffect being less than with cogging torque (Fig. 4)
.

4 ECL 222A
Fig. 3: EFFECT ON N-TH HARMONIC
synchronouscrawling
T-TORQUE
Fig. 4: VARYING TORQUES AT ONE SPEED
5 ECL 222A
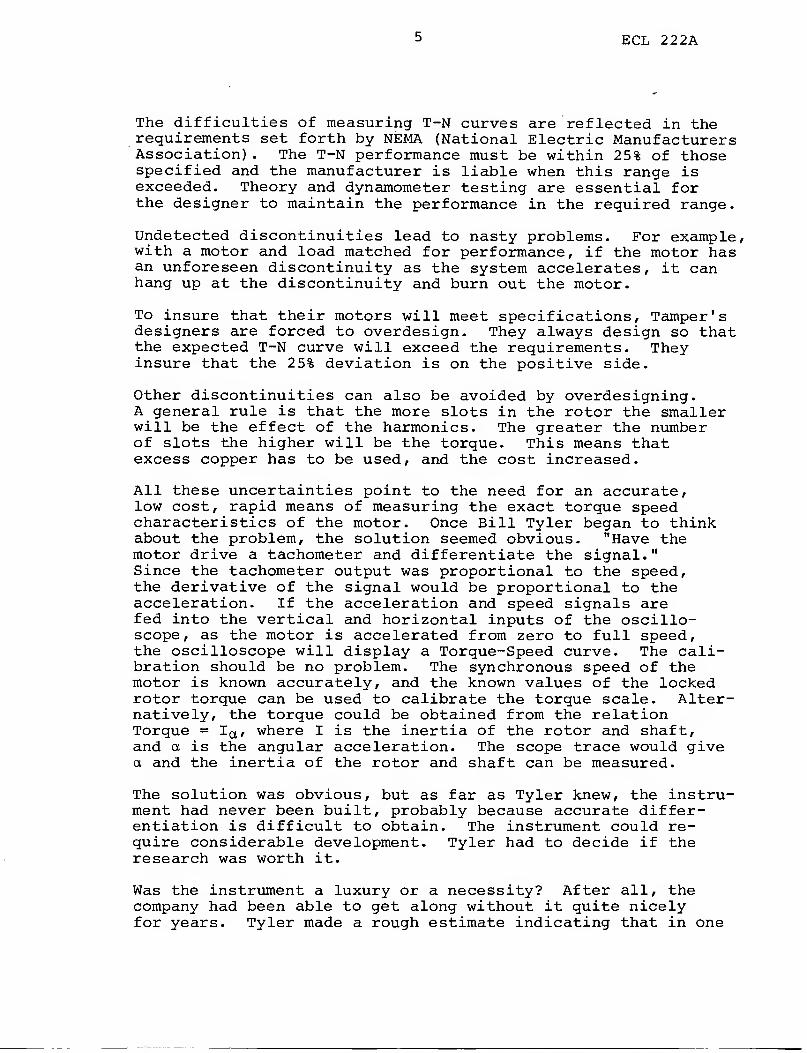
The difficulties of measuring T-N curves are reflected in therequirements set forth by NEMA (National Electric ManufacturersAssociation). The T-N performance must be within 25% of thosespecified and the manufacturer is liable when this range isexceeded. Theory and dynamometer testing are essential forthe designer to maintain the performance in the required range.
Undetected discontinuities lead to nasty problems. For example,with a motor and load matched for performance, if the motor hasan unforeseen discontinuity as the system accelerates, it canhang up at the discontinuity and burn out the motor.
To insure that their motors will meet specifications, Tamper'sdesigners are forced to overdesign. They always design so thatthe expected T-N curve will exceed the requirements. Theyinsure that the 2 5% deviation is on the positive side.
Other discontinuities can also be avoided by overdesigning.A general rule is that the more slots in the rotor the smallerwill be the effect of the harmonics. The greater the numberof slots the higher will be the torque. This means thatexcess copper has to be used, and the cost increased.
All these uncertainties point to the need for an accurate,low cost, rapid means of measuring the exact torque speedcharacteristics of the motor. Once Bill Tyler began to thinkabout the problem, the solution seemed obvious. "Have themotor drive a tachometer and differentiate the signal."Since the tachometer output was proportional to the speed,the derivative of the signal would be proportional to theacceleration. If the acceleration and speed signals arefed into the vertical and horizontal inputs of the oscillo-scope, as the motor is accelerated from zero to full speed,the oscilloscope will display a Torque-Speed curve. The cali-bration should be no problem. The synchronous speed of themotor is known accurately, and the known values of the lockedrotor torque can be used to calibrate the torque scale. Alter-natively, the torque could be obtained from the relationTorque = I a , where I is the inertia of the rotor and shaft,and a is the angular acceleration. The scope trace would givea and the inertia of the rotor and shaft can be measured.
The solution was obvious, but as far as Tyler knew, the instru-ment had never been built, probably because accurate differ-entiation is difficult to obtain. The instrument could re-quire considerable development. Tyler had to decide if theresearch was worth it.
Was the instrument a luxury or a necessity? After all, thecompany had been able to get along without it quite nicelyfor years. Tyler made a rough estimate indicating that in one
6 ECL 222A
year the instrument could save the company from 75 to 100
thousand dollars.
These savings would come from reduced overdesign. Accurate
T-N curves of existing designs would give the designers better
information. Designers would no longer need to overdesign for
safety's sake. Overdesigns usually involve excess copper and
copper is expensive. In a $50,000 motor the cost of the
excess copper could be as much as $1,000.
Such an instrument would also be useful for new research which
Tyler was anxious to undertake. Tyler is constantly comparing
his motors with those of the competition. In the large 1200 -
1400 Horsepower motors, Tamper uses 15% less active iron in
the laminations than the competition, a substantial saving.
To do this, Tamper uses 100% more copper. However, withcopper a small portion of the overall weight and a net saving
is realized. Tamper's design has 96 stator slots. Some com-
petitors successfully use 48 or 72 slots and group their copper
together in a larger coil. The result is a savings in insula-
tion and installation labor. But the smaller number of slots
requires a very wide coil, which isn't desirable. Ideally,
it is desirable to design for as high and uniform a flux
density as possible. The competition actually ends up with a
very uneven flux density distribution which should result in
unwanted T-N discontinuities. They have been able to overcome
this by using magnetic wedges. Tamper has not been able to
apply magnetic wedges successfully. Development of this tech-
nique is very high on Tyler's list of priorities. To spend
time and money on the development of magnetic wedges, Tamper
will have to know what the effects of the wedges are. This
is where this instrument would become invaluable.
Tyler has hopes that the instrument could become a production
test tool. With luck the instrument might be portable with
the tachometer hand held against the motor shaft. As a
production test instrument it could reveal errors in con-
struction such as a misplaced coil or a cavity in a die cast
rotor bar.
At Tamper the work is continual design and redesign. The
split between work on established product lines and new designs
is approximately even. In Tyler's words, "This is where we
carry on any research - in the new design work." Thus the
research is tightly controlled by marketing needs.
Tyler decided that the development of the instrument was
economically justified. The financing of the project posed
no major problems. The departmental operating budget is 1/3
million dollars per year. He also has a little "catch-all

7 ECL 222A
budget" of $2 000 for each of his five product lines. Heestimated that the cost of development would be about $10,000.He decided to simply distribute the cost over his large motorproduct line. Normally all projects running over $1000 shouldbe written up as separate proposals with a cost benefit analy-sis. Such projects would then stand or fall on their ownmerits. "But not in this case" Tyler decided. "Sometimes thebest way to get things done is to break some rules here andthere. You can accommodate bureaucracy too far. As long asmy department shows a suitable profit there shouldn't be toomany questions asked."
Tyler developed his concept to the point at which he thoughtit was suitable to pass it on to one of his designers. Heestablished the functional black boxes of the instruments andbroadly specified the performance parameters.
A survey of the motors that Tamper produced established thatusually the torque to inertia ratio was about 8:1 and therise time varied from . 6 to 4 sees. He concluded that oneinstrument could be made suitable for all motors from 400 RPMto 3600 RPM and 1/4 horsepower to 5000 horsepower. Motorsoutside this range would have to be tested either by addingadditional inertia or by lowering the line voltage of thelarger motors.
To define the type of cusp they should be testing for, he usedthe concept of equivalent frequency. The frequency of thecusp can be defined by its period, frequency being the inverseof the period (Fig. 5). A small calculation established thatthe discontinuities of interest were at 0-15 cycles per second.Signal frequencies outside this range could be considered asnoise and filtered out.
Tyler decided that the instrument should be accurate to within2.5%. NEMA specifications are worded to require generally notmore than 25% accuracy and since this was a measuring instru-ment, it should be ten times as accurate.

8 ECL 222A
Fig. 5; EQUIVALENT FREQUENCY OF DISCONTINUITY

9 ECL 222B
MEASURING MOTOR TORQUE-SPEED CURVES (B)
Once he had established the performance requirements,Tyler turned the project over to one of his best electronicsdesigners, Odon Bencsics. After Tyler discussed his ideaswith Odon, he asked Odon to conduct a feasibility study andto verify the concepts, to design the detail circuitry, tobuild a prototype and to produce typical torque-speed curves.Once this was accomplished the instrument could be redesignedto make it a production instrument.
Odon Bencsics describes himself as a man of many interests whoworks at engineering because of circumstances. Bencsicsstarted with Tamper in the late 1950' s and at present is asystems designer. Tyler anticipated that Bencsics would de-velop the prototype instrument without much trouble. He wouldthen have someone else take over the job of productionizingit. Bencsics was too valuable to waste on the final stages.
Bencsics carried out a brief analysis of the requirements.All of Tyler's concepts looked reasonable and he could see noobvious difficulties. He was sure that there were other waysof achieving the same result, but this looked simple enough.
Bencsics started work on the project in May of 1973, while hewas still involved in several other projects. The preliminarydesign was done in about one and a half weeks. This includedcompleting the feasibility study, the initial design of theinstrument, and the design of the power supply.
Odon Bencsics describes his development of the circuits asfollows
:
"Once feasibility had been established I attacked the heart oi the problem
the diiierentiator. I first considered using a simple dii ierentiating
operational amplifier circuit {fig. 6).
AfteA. careiul consideration it became, evident that this circuit would not
be satisfactory. Accurate diUerentiation oven, the requ.in.ed frequency
range oi the discontinuities could not be. obtained.

10 ECL 222B
WexX I conAldzh-dd what could be. called a di^eAtntlcuting
i.vitzQh.aZlna caJicuaJ:. {Fig. 7).
CD
1
-<ww\~4
"out
'out
de 4„
Fig. 6: SIMPLE DIFFERENTIATOR
, ( 1—/VWS* II
->3
t
T
Fig. 7: DIFFERENTIATOR-INTEGRATOR

11 ECL 222B
a£io l^ = ^A^eA a lot 0(5 a£getVuu.c manipulation
and e, = xnde
2 /
3 v~St JuT^Ti
CIacuaX operate* at> faolZom:
ioh. uj = a>
c- faanrf pai4 fillteA
m « - (tc^eAeaiXctto^
uj >> oi^ - Integrator
It lJ> convenient to expand thu> equation at, fallow
CO
m = - Ncte: to - aj> the equivalent frequency of, the signalc
to be differentiated In rad&/&ec.
J]i = jus_ T 6 = jo} = /y(0 a)C C
Rationalizing the denominator give*
Magnitude and Phase Errors
12 ECL 222B
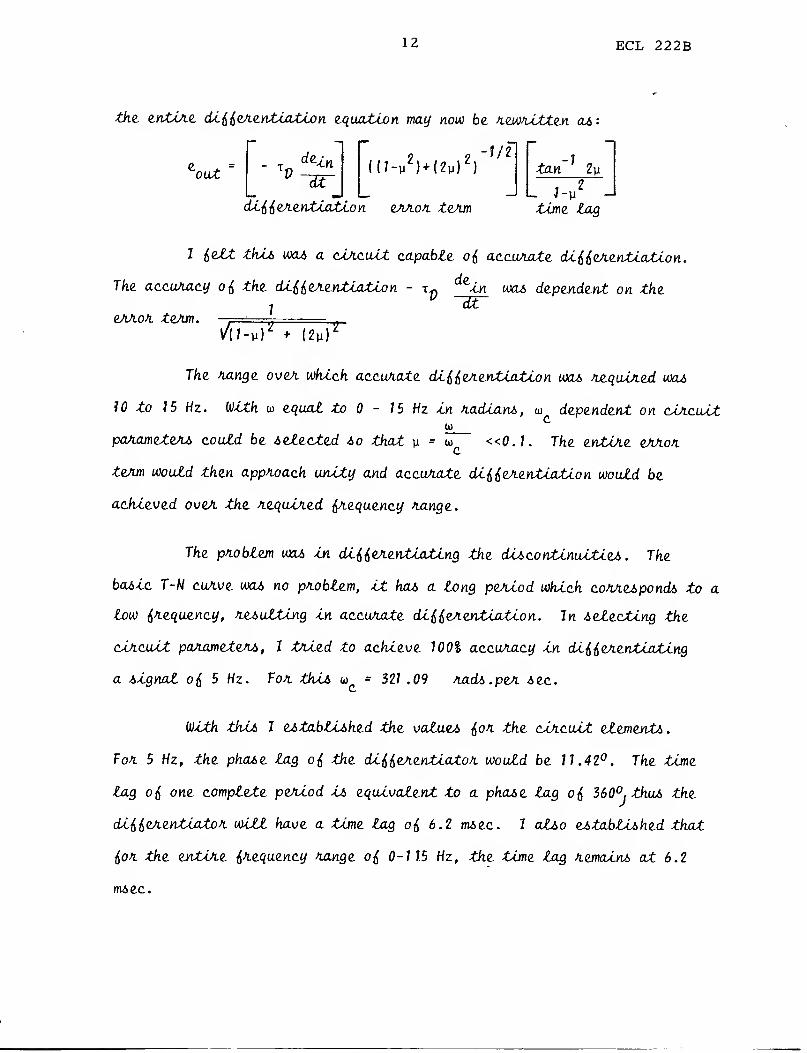
the entlAe dlHeAentlatlon equation may now be Aewnltten as
Ml'out
de
dt((7-y
2)+(2y)
2)
dlHeAentlatlon eAAoA teJun
tan[
2\i
L ,V --tone lag
I tfe&t wo4 a clAcuil capable, oi accuAate diiieAentlatlon.
The accunacy oi the. diUeAentiatlon - Tpi<Lln was dependent on the
i" dt
qaaoa tern. ,.
Vil-v)* * (2y)Z
The Aange oven, which accuAate diiieAentlatlon was Aequlned was
10 to 15 Hz. With equal to 0 - 15 Hz In Aadians, u dependent on clAcuilw
panameteAS could be selected so that y = to «0.1. The entlAe eAAoAc
teAm would then approach unity and accuAate diiieAentlatlon would be
achieved oveA the Atquln.ed iAequency Aange.
The problem was In dliitAentlatlng the discontinuities . The
basic T-N cuAve was no pAoblem, It has a long penlod which conAesponds to a
low iAequency, nesuttlng in accuAate diiieAentlatlon. In selecting the
clncuil panameteAS, I tAled to achieve 100% accuracy in dliieAentiatlng
a signal oi 5 Hz. Fon this u>
c= 327 .09 nads.peA sec.
With thli I established the values ion the clAcuil element*.
Foa 5 Hz, the phase lag oi the dlUeAentlatoA would be 11.42°. The tone
lag oi one complete penlod is equivalent to a phase lag oi 360°jthus the
aliieAentlatoA will have a time lag oi 6.2 msec. I also established that
ion. the entiAe inequency nange oi 0-1 1.5 Hz, the tune lag Aemalns at 6.2
msec.

13 ECL 222B
I then performed a complete error analysis*. There are two
possible SOUTceS 0& ZAAOtl.
This error could be held to ± 1 .45% by using precision components, £7.7%
resistors and 1% capacitors
.
However, the circuit, tike. the. Tp circuit could have an error ojj 1.5%
due to components tolerances. Therefore ip would have, a value equal to
± 3.1148 x 10 + 1.5% inom which maximum and minimum error terms can be
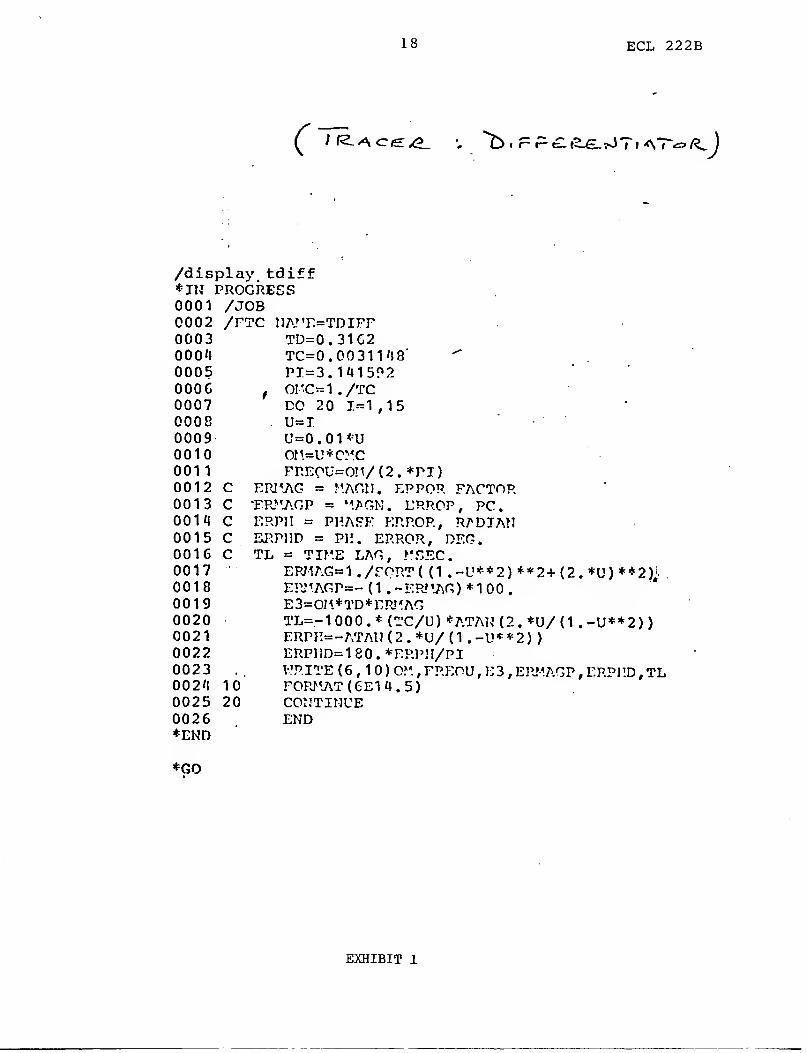
computed. The. error analysis was carried out on a computer {Exhibit #/)
. At 5 Hz the. net error was + 0.47 to - 2.371. This Is a ± 1.9%
error and therefore the. elective accuracy Is .95%. This 16 called nor-
malizing the error.
the. other components necessary to support the dlHerentiator. The velocity
signal required a lag circuit ion l& the. velocity signal were <$ed directly
to the oscilloscope. it will be ahead oj$ the. acceleration signal due. to
the. phase lag In the. dl^erentiator. The. tachometer output also fiequln.es
an attenuator to normalize the wide range orf voltages generated at the
test speeds which varied irom 400 rpm to 3600 rpm. The Input Into the
dliierentiator should not exceed 15 volts to avoid saturation o{> the
operational amplifier. The resultant system is shown In Fig. i.
The second source o£ error was the error term.
Once the design orf the dl^erentlator was completed I considered

14 ECL 222B
Motor Tachometer Attenuator
Differentiator
Lag
Circuit
Vertical
Scope Input
Horizontal
Scope Input
Fig. 8: INSTRUMENT BLOCK DIAGRAM
The, lag caAcuUX woa e^tabti&hzd by noting that In the. Vi.Hex.en-
tAjatoK-lntzgfiatoK analytic the. tenm w, which define* the. lag(J + t 4
)
c
0({ the. dliieJientiated signal, aj> 6.2 m&tc. oveA the tntJjie. in.tqu.ency
tvxnge 0 - 15 Hz. The lde.al lag caAcwU. ion. the. velocity signal ihould
also have, a tnan&ieA function od
cincult wo6 t> elected [ftg. 9).
(I + tla)
2voheAe. = t^. Such a
i
—WVVV-Nominally
RA
= RB
= RC
CA
= CB
xL
= RC
'out
Fig. 9: LAG CIRCUIT

15 ECL 222B
Knowing the components to produce can be easily determined.
As with the. error term, the gain oh the. lag circuit will be dote, to one
oven, the entire hn.equ.ency range. It can also be shown that the phase lag
oh this circuit will equal the phase lag oh the diihen.entiatofi to within
41. To perhorm the error analysis It must be remembered that the lag
circuit has a positive and a negative error because can have an error
oh ± 2.5$ due to the tolerances oh the circuit components . Unlike the
di-hh^vKtiAto*1 there lb also an error associated with the dc gain oh the
circuit. The dc gain is simply _A which) due to choice oh componentsi
should equal one^but the associated error Is two times the tolerance oh
each resistor.
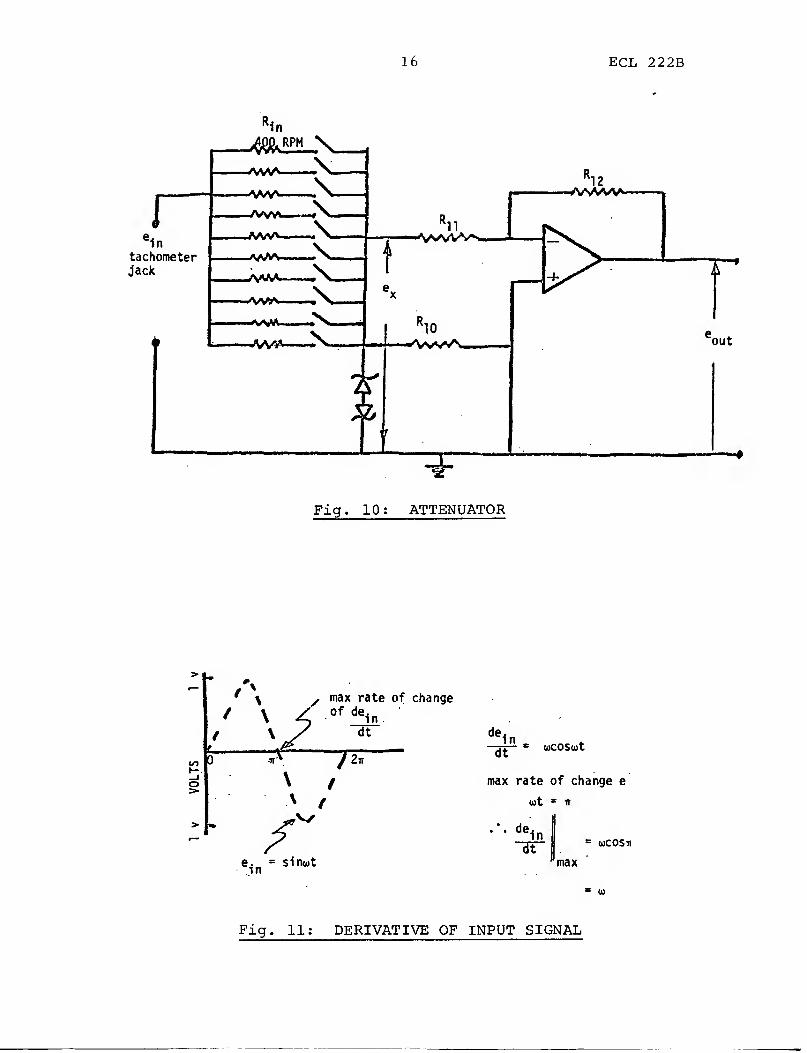
The attenuator design was dependent on the tachometer, used, In
this case a Standee BB-2-40 {Exhibit H) . Von. a nange oh 400 RPM - 3600 RPM,
the tachometer output voltage would vary h^om 1 6 volts dc to 144 volts
dc. To prevent saturation, the attenuator had to normalize the maximum
output to less than 1 5 volts regardless oh the RPM. The attenuator
circuit [Fig. 10) consisted oh a voltage divider and an operational
amplifier. The op-amp ensured a low Input impedance to the succeeding
dthheA-entAJxting circuit.
The constant output oh the attenuator was set to protect the circuit
hrom a h<u>t rising signal which could drive the op-amp into saturation.
Jh the Input Id a 1 volts zero-peak sine wave, with u the equivalent hre-
quency oh the Input, it can be shown that the maximum rate oh change oh
the input signal is u [Fig. 11).
16 ECL 222B
Fig. 10: ATTENUATOR
/ \ 4 0fde1n
/ \7 dt
0 / 2tt
/ max rate of change
o X /
re. = si nutin
dein
—g^— c uCOSut
max rate of change e
wt = It
dein
dtuCOSti
max
Fig. 11: DERIVATIVE OF INPUT SIGNAL

17 ECL 222B
Designing the circuit far an Input iA.eqae.ncy o& 5 Hz, the maximum
allowable note oi change o& the Input ilgnal which I* equal to u would be
32.1 volt*/*ec. Any Input with gaiter rise characteristic* would *aturate
the op amp*, therefore I selected ex far an average note o^ acceleration.
The *horte*t rl*e time wat> 300 msec; therefore the average acceleration
wa* equivalent to ex/0.3.
Surveying previous motor torque *peed curve* 7 hound that the
largest ratio between maximum acceleration and average acceleration wa* 2.1
.
* ' -# = 32 ' J volt*/*ec = 2.1 (4)' I max - 3
. \ ex
= 4.58 volt*
The resistor* R^nwere then cho&en *o that the voltage divider
would give an Input voltage o<{ 4.58 volt*.
I considered u*lng an automatic attenuator which would select
the proper re*l*tor R^. This was rejected because the circuit would
Introduce ia*t twitching tran*lent* which could farce the op-amp* to
saturate, be*lde* it wa* a complex digital circuit and there wa*n*t
enough room on the circuit board*.
18 ECL 222B
C
/display tdiff*IN PROGRESS0001 /JOB0002 /FTC 1IA"E=TDIFF0003 TD=0.3162OOO'l TC=0.00311'l8'0005 PI=3.1U15920006
, OMC=1./TC0007 DO 20 I--=1 ,150000 U=I0009 U=0.01*U0010 om=u*omc0011 FREpU=OM/(2.*PI)0012 C EPJ1AG = MAGH. EPPOR FACTOR0013 C "ERMAGP = **.*GN. ERROR, PC.0011 C F.RPH = PHASE ERROR, RADIAN0015 C ERPHD = PH. ERROR, DEG.0016 C TL * TIME LAG, MSEC
.
0017 ERMAG=1 ,/SORT( (1 .-U**2) **2+(2. *U) **2);- .
001 8 ERMAGP=- (1 . -EPJ'AG) * 1 00 .
0019 E3=OH*TD*rPJ*AG0020 TL=-1000.*(TC/U)*ATAH(2.*U/(1.-U**2))0021 ERPH=-ATA1I(2.*U/(1 .-U**2) )
0022 ERP1ID=1 80. +F.RPH/PI0023 . V'RITE ( 6 , 1 0 ) OM , FREOU , E 3 , EP-MAGP , ERPFD , TL00 2 'I 10 FORMAT (GEHl. 5)0025 20 CONTINUE0026 ENDEND
*GO
EXHIBIT 1

19 ECL 222B
Table 1. MODEL B GENERATOR RATINGS
Type
•
Mounting
NominalVoltageRating at
1000 RPM
MaximumPermis-aableSpeedRPM
1
MaximumCurrent
Permis-misabteLoad at
1000 RPM*
ArmatureResis-tanceAt70°F
Actual Voltaga OutputAt 1000 RPM
With WithHo Load 4 Watt Load
Connected. ConnectedL.I i
BB-2-100 Base Mounted 100V D.C. 5400 40 MA 4 Watts 205 Ohms 110V D.C, ioov D.C.;
BF-1-100 Flange Mounteo 100V D.C. 5400 40 MA 4 Watts 205 Ohms 110V D.C. 100V D.C. \
BB-2-4C Base Mounted 40V D.C. 9000 100 MA 4 Watts 30 Ohms 44V D.C. 40V D.C. f
BF-1-40 Flange Mounted 40V D.C. 9000 100 MA 4 Watts 30 Ohms 44V D.C. 40V D.C.j
'Maximum Load is 12 V/atts at 3000 RPM. It generators are driven at higher speeds (up to maximum permissible speeds)the external load resistance must be sufficient so that the maximum load is not exceeded.
SPECIFICATIONSType B9-2-100
Type BF-1-100
Base MountedFlange Mounted
Vollage Output
Maximum PermissibleSpeed Range
MaximumLoad Rating
Lead Connections- .
.
Bearing* •»
Enclosure
Internal Resistance .
.
Temperature
Coelliclent
Ripple
Sialic or
Breakaway Torque .
.
Reversing Error
Field
Armature
Number of Poles
Brushes
Mounting
Shaft Extension
Shaft Diameter
Approx.
Overall Length
Net Weight
6.88"
5 lbs. 2 oz.
Type BB-2-40 - Base MountedType BF-1-40 - Flange Mounted
100V DC per 1000 RPM
5400 RPM
40 milliamperes DC
Under terminal cover box
Ball Bearings
Totally enclosed
205 ohms
0.03°/o per degree C
Less than 0.5%
1.95 oz. in.
Less than 0.5°/o
Alnico
15 slots. 45 bars
2
2
BB-2-100 - base
BF-1-100 - flange,
1.18"
.276" flange. .433 base
iri Voltage Output
Maximum PermissibleSpeed Range
IMaximum
\Load Rating
Lead Connections .
Bearings
Enclosure
Internal Resistance
Temperature
Coefficient
Ripple
Static or
Breakaway Torque
Reversing Error . .
.
Field ..."
Armature
Number of Poles .
.
Brushes
Mounting
40V DC per 1000 RPM
9000 RPM
. 100 milliamperes DC
. Under terminal cover box
. Ball Bearings
.Totally enclosed
.30 ohms
• 0.03%> per degree C- Less than O.SVo
Shaft Extension
Shaft Dl. meter .
Approx.
Overall Length .
Net Weight
1.95 oz. in.
. Less than 0.5°/o
.Alnico
. 15 slots, 45 bars
.2
.2
. BB-2-40 - baseBF-1-40 -flange.
. 1.18"
.276" flange. .433
6.88"
. 5 lbs. 2 oz.
base
HERMAN H. STICHT CO., INC. - 27 PARK PLACE • NEW YORK, N.Y. 1 0007
EXHIBIT 2

20 ECL 222C
MEASURING MOTOR TORQUE-SPEED CURVES (C)
Within 1-1/2 weeks Bencsics had completed a suitabledesign and the instrument was ready for construction. Unfor-tunately, because of other commitments, a technician couldn'tbe made available. He therefore undertook to build theinstrument himself.
His principal concern in building such an instrument was theaccuracy of the components. He started by choosing hisoperational amplifiers. From the specification sheet (Exhibit3) , he concluded that because of the extremely low offset voltage, with offset and bias currents of only few pico-amps, andalmost non-existent drift, for his purposes he could considerthem as ideal units. The remaining components were highprecision components, 0.1% and 1.0% capacitors. Wheneverseries or parallel combinations of the components were used,he would set their values by trimming. For capacitors heused the following circuit (Fig. 12)
.
Fig. 12; TRIMMING CIRCUIT
The first op-amp was used to provide the circuit with a lowinput impedance. If the precise values of Rlf R2 , and C± areknown and a null is obtained at Vout with C2 , then the exactvalue of C 2 maY be determined. After some manipulation it

21 ECL 222C
may be shown that ZC2Ri
= zCiR2 where ZC is the impedance of
a capacitor. The exact values of resistors were determinedwith a wheatstone bridge.
The greatest problem in construction was the limited supplyof precision components. To establish his time constants andcircuit parameters, Odon was restricted to those high precisioncomponents that were available in the lab. There were 25 0.1%
resistors and 12 1% capacitors. He didn't want to orderspecial components to suit his specifications because theywere not available locally and they cost about thirty timesmore than components of standard precision. When he built thecircuits the first time he found that towards the end he didn'thave the correct components left to finish his circuit becauseof the combination of components previously used. Keeping in
mind what he had learned from his first attempt he redid the
design using different combinations of components to buildhis circuits.
Motor
couple shaft
Jffl
JTS-f IHJtHot./Ih.fl
Screw/ ^__nK
Atchometer
7
exible plates to allowfor misalignment
Fig. 13: TACHOMETER COUPLING
When the instrument was tested, the T-N trace on the oscillo-scope revealed a great deal of noise which exceeded tachometerspecification by a factor 10. Odon was certain that theproblem was one of alignment, (Fig. 13) , that the instrumentcould be improved if additional filters were set between the
acceleration and velocity outputs and the scope.

22 ECL 222C
Another problem also emerged in testing. Before recording a
test trace, Odon made several runs which he used to adjustthe scope controls so that the trace would cover the entireface of the oscilloscope. He would first adjust the zero
point at the left of the screen, then run the motor at full
speed and attempt to locate the signal at the far right of
the screen by adjusting the horizontal gain. In doing this
he constantly lost his initial zero position and it took manyattempts to get a suitable trace. This could be simplified if
if the lag circuit had a built-in adjustable gain.
With these changes in mind, Odon went back to his desk to
redesign the circuit. The redesign of the filters and lag
circuit took approximately one week to complete. The new lag
circuit incorporating the adjustable gain is shown in Fig. 14.
STAGE. 1. Original STAGE 2. Addition
Fig. 14; MODIFIED LAG CIRCUIT
By the addition of a second stage the time lag of the transfer
function was not altered but the gain was changed to Rj+Rg.~^2

23 ECL 222C
It should be noted that stage two is used as a non-invertingamplifier and that the gain can be adjusted from 1 to Rj_ + R
2 .
R2
Odon expected that his design would eliminate any noise becauseit integrated the higher frequencies and the integral of a
short cusp would be very close to zero. But to achieve accu-rate differentiation of a 5Hz signal coc had to be set at 55 Hz
or 321.09 rads/sec. The tachometer specifications howeverstated that inherent noise would be in the 50 Hz range andfor this the differentiator acted as a bandpass filter. Tosolve this, Odon decided on a filter to block out the tacho-meter noise. He knew that no relevant cusps on the T-N curvewould be above a frequency equivalent to 15 cps. From this hedetermined the desired bandpass.
1.0 1 -x
\\Y
10 20 30 40 50
Frequency Hz
BANDPASS OF FILTER
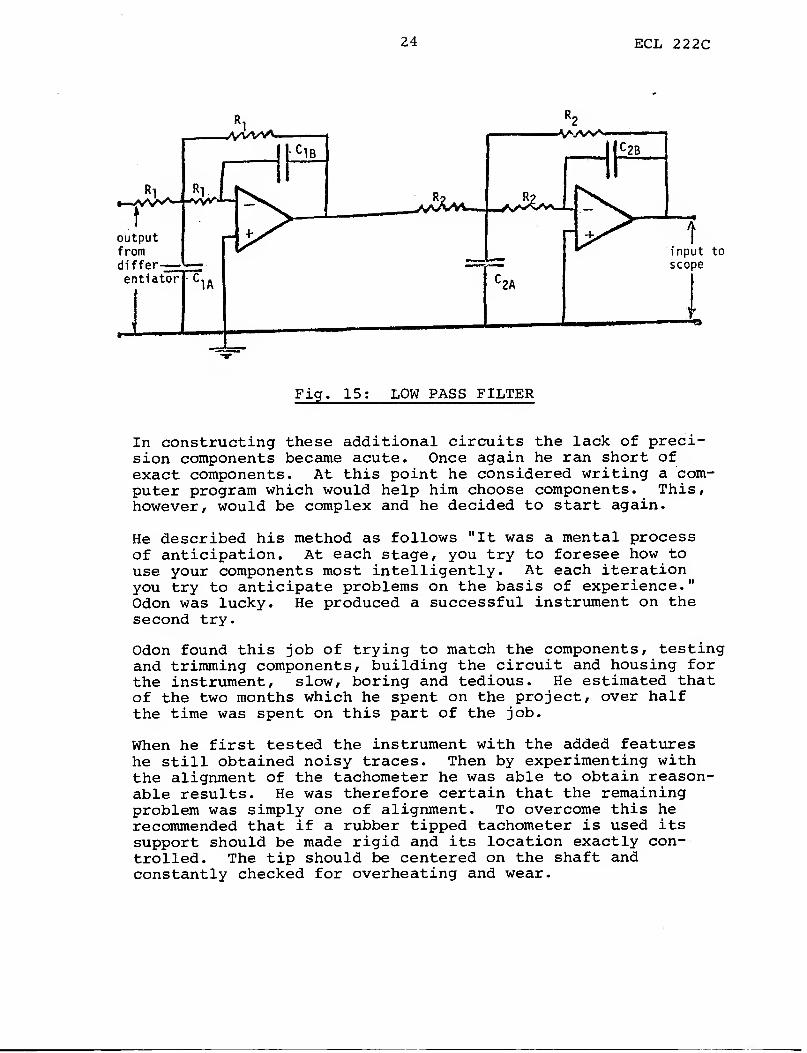
This filter need only have been added to the accelerationsignal. To compensate for phase lag, however, an additionalidentical filter was added to the velocity signal. Time lagequalization is thus within 2 msec. To accomplish this, heused a Butterworth filter (Fig. 15)
.
The addition of these low pass filters, however, involves a
compromise. Because of the tolerances on the components, thegain of the filter could never be exactly equal to one, re-sulting in an inherent error of 1%. For the specific appli-cation, a decision has to be made as to whether to have anaccurate noisy output or a noise free curve with the subse-quent reduction in accuracy. The net errors of the instrumentwith and without the low pass filter are tabulated inExhibit 4.
24 ECL 222C
Fig. 15; LOW PASS FILTER
In constructing these additional circuits the lack of preci-sion components became acute. Once again he ran short ofexact components. At this point he considered writing a com-puter program which would help him choose components. This,however, would be complex and he decided to start again.
He described his method as follows "It was a mental processof anticipation. At each stage, you try to foresee how touse your components most intelligently. At each iterationyou try to anticipate problems on the basis of experience."Odon was lucky. He produced a successful instrument on thesecond try.
Odon found this job of trying to match the components, testingand trimming components, building the circuit and housing forthe instrument, slow, boring and tedious. He estimated thatof the two months which he spent on the project, over halfthe time was spent on this part of the job.
When he first tested the instrument with the added featureshe still obtained noisy traces. Then by experimenting withthe alignment of the tachometer he was able to obtain reason-able results. He was therefore certain that the remainingproblem was simply one of alignment. To overcome this herecommended that if a rubber tipped tachometer is used itssupport should be made rigid and its location exactly con-trolled. The tip should be centered on the shaft andconstantly checked for overheating and wear.

25 ECL 222C
The kind of results that can be obtained are shown in Fig. 16.The acceleration versus time output is used to measure theperiod of the cusps and thereby determine the equivalent fre-quency. Differentiating between cusps is no problem sincethey occur sequentially. The trace is produced with the motoraccelerating and starting from reverse rotation. This avoidsany switching transients affecting the T-N curve.
Fig. 16: SCOPE TRACES

26 ECL 222C
Exhibit 5 is a sketch of the finished instrument. It isapproximately 9 inches by 9 inches. Three circuit boards areused with the remaining three left for planned future addi-tional functions. The circuit diagram for board No. 2, thelow pass filters, is shown in Exhibit 6. The 15 Volt D.C.power supply circuit is shown in Exhibit 7. This makesavailable 250 milliamps of which only 100 milliamps is cur-rently used.
Odon Bencsics described this project as very problem free.It took two months to complete because of many interruptionsfrom other projects and summer holidays. The only real prob-lem was juggling for the appropriate precise component values.He estimates the total cost of components was about $250.Odon finds it very strange that such an instrument hadn't beendeveloped before. As to patents, he doesn't feel that any ofthis work is suitable for patent. "After all, the ideas areknown and the components are known, so what is there leftto patent?"

27 ECL 222C
FET-INPUT GENERAL PURPOSE OP AMPSAD50I, ADM50I, ADP50IPIN CONFIGURATIONS
Bottom View
ADM501
KM 1. IKVI«TI«fl INPUT
HUT NONINVKTUIOIWUTfINJ: «UVOCHit 4: -liVOCUN 6: OOIfUT
AD501
w
ADP501
GENERAL DESCRIPTIONThe Antloe Devices Model AD501 is a microcircuit FETinput operational amplifier that is supplied in the industry-
standard axial-lead and plug-in molded packages, and in the
hermetically sealed TO- 8 type of package. The AD501features offset voltages of less than lmV, offset voltage
drifts below 25/iV/iC and bias currents of less than 5pA.
The circuits are manufactured with strictly controlled
hybrid assembly techniques, which have proven their
high reliability and fault-free performance through three
years of system usage. The ADS01 is supplied in the
end-lead mini-package; the ADP501 in the bottom-lead
mini-package; and the ADM501 in the TO-8-type
package.
ELECTRICAL CHARACTERISTICS <VS = ±15V, TA ' +2S°C,* unless otherwise noted)
Parameter Conditions S01A 501B 501C Units
P501A P501B P501CM501A M501B MS01C
Initial Input Offset Voltage rs< iookn 2.0 1.0 1.0 mV
(max)MV/*CAverage Temp Coef of Input TA «-25*Cto 75 25 25
Offset Voltage (max) +85*C
Initial Input Bias Current 25 10 5.0 PA(max)" (lOpAMSOl)
pA/CAverage Temp Coef of Input TA - 25*C 2.5 1.0 0.5
Bias Current (typ)' * (lpA/*CM501)
ALL DEVICES•
1
Parameter Conditions MIN TYP MAX Units
Large Signal Voltage Gain RL > 2k« 25,000 100,000 V/VVQ - ±10V
10"Input Resistance Differential nCommon Mode 10" a
Input Capacitance 4 pF
Input Noise Voltage (rms) 5 Hz. to 50kHz ' 6 MVInput Voltage Range ±10 ±12 VCommon Mode Rejection VlN -±5V 80. dB
Supply Voltage Rejection 50 ltV/%
Output Voltage Swing RL > lOkll ±12 ±14 VRL > 2kfl ±10 ±15 V
Output Short Circuit Current 25 mASupply Current 9 mASlew Rate i 5 Vlfis
Unity Gain Bandwidth 4 MHzFull Power Response RL > 2kn, 70 kHz
V0 > 10V
Price (1-9) 501 59.00 45.50 52.00 $
P501 59.00 45.50 52.00 $
M501 45.50 52.00 58.50 S
'Typical Junction Temperature (Tj)
'Doubles every 10 C.
U 10 C above Ambient Temperature (TA ) afttr 15 minutes warm-up at V$ • ±1SV.
EXHIBIT 3

28 ECL 222C
RANGE OF MAX. (MAGNITUDE) ERROR IN ACCELERATION OUTPUTS
PREQU.Hz
DifferentiatorError
ACCEL. 1:e3 vs.(de2/dt).Kd
%
FilterError
e5 vs. e3• %
ACCELV'2:'e5 vs. (de2/dt).Kd
%
1 + 1.41 - 1.49 4- 0.0 — 0.0 f 1.41 - 1.49
2 '+ 1.29 - 1.60 0.0 — 0.0 + 1.29 - 1.60
3 + 1.09 - i.78 + 0.1 — 0.1 + 1.19 - 1.88
. 4 t 0.82 - 2.04 4- 0.2 — 0.2 + 1.02 - 2.24
5 * 0.47 - 2.37 4- 0.3 — 0.3 4-0.77 - 2.67
6 + 0.05 - 2.77 4- 0.4 0.4 4- 0.45 - 3.17
7 - 0.44 - 3.23 4- 0.5 0.5 4- 0.06 - 3.73
8 - 1.01 - 3.77 4- 0.7 0.7. - 0.31 - 4.47
9 - 1.64 - 4.37 0.8 0.9 - 0.84 - 5.27
10 - 2.34 - 5.03 + 1.1 1.0 - 1.24 - 6.03
11 - 3.10 - 5.75 + 1.3 1.2 - 1.80r. 6 *? 5
12 - 3.92 - 6.53 f 1.5 1.4 - 2.42 - 7.93
13 - 4.80 - 7.36 + 1.7 1.7 - 3.10 - 9.06
14 - 5.73 - 8.24 + 1.9 1.9 - 3.83 -10.14
15 - 6.70 - 9.16 • 2.2 2.2 - 4.50 -11.36
16 - 7.72 -10.14 4- 2.3 2.5 - 5.42 ^-12. 64
17 - 8.78 -11.15 4- 2.5 2.9 - 6.28 -14.05
18 - 9.88 -12.19 4- 2.6 3.3 - 7.28 -15.49
19 -11.02 -13.27 + 2.5 3.8 - 8.52 -17.07
20 ' -12.18 -14.35 4- 2.4 4.3 - 9 .78 -18.65
25 -18.33 -20.30 4- 0.0 9^9 -18.33 -30 . 20
30 -24.75 -26.51 + 0.0 -25.1
•
.
-24. 75 -51.61
EXHIBIT It

29 ECL 222C
L OcAttOh} op Compos S./J rs ^70j0 y/ifB.oo)
Vol. . 4- A, rJ
Pa" .
3 SP/\G-€_ fi>r5/9,ft. J>£
r t t
Cm<LcO/ T*3 * Z
.*
Fwj€
2_j[
1(/V. 367-TZ^-<»o?»-a() f
JI
I J
EXHIBIT 5

30 ECL 222C
ww
—
—W\
*l.K H%11
S"o'l7K
(7^ <£_AVU-4—W_
56-17 K1%
«-2 '/»
-W>—e—\W;»•/.
-HI—
~T""JL 1 r'
—II
-® (14) TtlV PoIkj?
-€) (<s^acc£u z" (es)
-® Or) +• 'ffv
comm.
PltJ N/ 2 S 1 To i$Tf-F(LoM LZFT To Qjc^HT
AS S£€*J <OM CDMf>o*j/£.ri7- S~iOG.
p (fJ 1 —
_
5>,*
7
IS"
ToVccei < " Men (Fdeur Pam£.i-)
V<=C. CjAlfi Per. fF«.o*)7 PA/J££.)
"Accei.Z* Jack (fflonT PA^Eu)
all es-s. : ul'
EXHIBIT 6

31 ECL 222C
PoW£C 5c>PPt,V d/gciO/r
4*
/
fust
i
:— i
2oV •
1
1*2£To ^SO J
2?©
i—KH
'
17 67'
<
i 1
-*» comm.
I
I
EXHIBIT 7

32 ECL 222D
MEASURING MOTOR TORQUE-SPEED CURVES (D)
Tyler summed up the work by saying "The accuracy of theinstrument was simply incredible." Tyler was anxious to getthe torque speed measuring instrument onto the motor pro-duction line, but was delayed by a manpower shortage. He wasfinally able to assign a man to the task of productionizingthe instrument. The task was to detect any difficultieswith the instrument, and to develop simple operating proced-ures. "You can't give a production test man 15 wires toconnect; you have to reduce the operation down to one buttonand one plug." Tyler also wanted the T-N curve to be as noisefree as possible so as not to confuse the test men.
The use of the instrument almost immediately became stalledbecause of two very important problems: the required align-ment between motor and tachometer, and the instrument wastoo accurate.
As more traces of test motors were taken, an unexpected re-sult appeared. An induction motor usually runs at a ratedspeed of 3% to 4% below the synchronous speed. The testtraces showed that when the motor accelerates it overshootsthe synchronous speed into the negative torque region. Aftera period of oscillation, the motor settles down to ratedspeed (Fig. 17) .
3-4% - difference
T-TORQUE
Fig. 17: OSCILLATION AT RATED SPEED

33 ECL 222D
Tyler's first reaction was, "I don't believe it. No one hadever predicted this." For confirmation a check was madeusing a strobe light. Here too, careful observation showedthe motor temporarily shoot past synchronous speed. "Itmay seem that by worrying about this effect we are startingto split hairs but we will have to do more investigationbefore we decide to ignore it," was Tyler's comment.
The solution to the alignment problem could involve theovershoot problem. To make the instrument portable, addi-tional filters will have to be added, but these filterscould also block out the overshoot effects. It seems that arigid mount with a mechanical alignment adjustment betweenmotor and tachometer will have to be designed. Althoughthis may no longer be portable, the instrument will stillbe extremely useful as a production tool.
To serve as a design tool, a third trace will have to beincorporated into the instrument: line voltage vs. time.If there is a discontinuity in that T-N curve, the additonwill distinguish if the discontinuity is caused by a drop inline voltage. Line voltage is prone to many irregularitiesespecially at start-up when the motor is drawing 6 00-700%normal current. The test procedure would be to first testat rated voltage. If an unexplained discontinuity is ob-served, then another test would be run at a lower voltage tosee if the discontinuity was due to saturation. If not,then other reasons would be looked for.
The reasons for the discontinuities could be many: toothtip saturation, unequal current in rotor bars, poor mathema-tical design. For design, it is much more important to knowthe speed at which a discontinuity exists than to know itsmagnitude.
Up to this point the project has cost $7,000. The finishedinstrument is expected to cost about $10,000. Tyler admitsthat there have been questions asked about these expenditures."But I've been too busy to answer them. The real answer iswe're going to get the damn thing working." He expects thatthe instrument will be on the production line in aboutthree months.
If the instrument proves its value on the production line,the department will then ask the company for funds to developthe instrument further. For example, instead of the presentmethod of photographing the oscilloscope traces, they wouldlike a $12,000 storage oscilloscope with reproduction facili-ties. Such an instrument would automatically draw the traceon a piece of paper.

34 ECL 222D
Another possible alternative is digital sample and hold units.In this case the acceleration signal would simply be differ-entiated once more and when the second derivative is zero,the coordinates of the point would be recorded by digitalsample and hold units for storage. This could increase theaccuracy of measurement. The present instrument is so accu-rate on most parts of the curve that the principle error isdue to parallax in reading the scope. Digital recording ofthese points would eliminate this.
Tyler remarked, "This approach would fit into our overalltest philosophy for the future. Whenever we have to replacean analog meter we do so with a digital unit. Eventually,I can see all our test results being read by remote digitalmeters. The readings would be automatically wired into ourcomputers where programs will reduce them to meaningfulmeasures such as horsepower for power factor."
The development of this instrument may be characterized as asearch for information. The company is always in need ofinformation that is useful and accurate. Tyler admits,"We're not proud. We'll go to any lengths to get information.It is only by having the latest information that we can keepahead in this continuous rat-race." It's the informationwhich the instrument will produce which will be of value toTamper in the competitive market and not the instrument it-self. Tamper has no intention of producing the instrumentfor sale because it isn't their type of product.
The instrument will be valuable on another special sort ofmarket — the information market. Tamper works very closelywith some of its competitors. The designers know each otherand will often get together to exchange "equal amounts" ofinformation so that both will benefit. It is on such aninformation market that the instrument takes on a sepcialvalue.