echocardiography in acute chest pain - his-files.comhis-files.com/pdf/acc/17_mon/hall...
TRANSCRIPT

Echocardiography in acute chest pain
Noah Liel – Cohen
Soroka University Medical Center
Ben Gurion University of the Negev
Beer Sheva
Israel

Lots of options:
Talk to the patient
Examine the patient
ECG
Chest X ray
Biomarkers
Stress tests
CTA
Lots of constraints:
Time to diagnosis
Costs
Radiation
Availability

So why echo:
Availability
Inexpensive
Bedside
No irradiation
Will answer many questions

What is the question:
Is their a cardiac reasons for the patients complaint:
chest pain Cardiovascular:
Ischemic Heart Disease – Acute Coronary Syndromes
Valvular Heart Disease
Aortic Dissection
Pericarditis, Pericardial Effusion, Tamponade
Myocarditis
Stress Induced Cardiomyopathy
Pulmonary:
Pulmonary Embolism
Lung Disease
Pulmonary Hypertenstion
Pneumothorax
Others:
Gastrointestinal
Mediastinal
Psychiatric
MOST CAN BE DIAGNOSED
BY ECHOCARDIOGRAPHY

So I am sure you are all convinced now to use echo!
But the real question is:
how can echo help in the diagnosis of acute coronary syndrome
Go to: ICCU + Cath Lab vs. HOME
Can echo contribute? HOW?
Transthoracic echocardiography: Left Ventricular function: Global and Segmental
We need more!
Is it possible to detect subtle changes
implicating coronary artery disease?

Stress Echocardiography
• Change in segmental LV contraction during stress;
Implicating limited blood flow caused by coronary artery stenosis.
• Stress echo can distinguish between high risk patients who
will probably need hospitalization and further evaluation and those
with low risk and good prognosis.
• Sensitivity and specificity of stress echo for obstructive CAD:
86 and 81%, respectively.
• DSE: excellent negative predictive value for obstructive
CAD in CPU patients, 6-month follow-up, between 91 - 96%.
Sechtem U, …Zamorano JL Non-invasive imaging in acute chest pain syndromes EJE 2011
Sicari R, et al. Stress Echocardiography Expert Consensus Statement EAE, Eur Heart J 2009;278
Amsterdam EA,et al Immediate exercise testing to evaluate low-risk patients presenting to the
emergency department with chest pain. JACC 2002;251

Incremental Diagnostic and Prognostic Value of Contemporary
Stress Echocardiography in a Chest Pain Unit
Mortality and Morbidity Outcomes From a Real-World Setting
Shah, … Senior, Circ Cardiovasc Imaging. 2013;6:202-209
Among all prognostic variables, only
abnormal stress echo and
advanced age predicted hard events
in multivariable regression analysis.
Conclusions:
Stress echo incorporated into chest pain
unit has excellent feasibility, provides
rapid assessment and discharge with
accurate risk stratification of patients
with suspected acute coronary
syndrome, non diagnostic ECG and
negative 12-hour troponin.
839 patients assessed for feasibility, safety, impact on triaging, discharge,
30-day readmission, followed for all-cause mortality and acute MI.
Kaplan-Meier survival estimate
of time to any hard event in first
365 days for patients with
normal and abnormal
stress echocardiography
results.
Normal
Abnormal

Contrast Echocardiography:
enhance borders + myocardial perfusion
Sensitivity for diagnosis of ACS:
MCE 72% MPI 61%. Significantly higher than ST segment change
and troponin I.
Similar specificities 90% - 100%.
MCE is more accurate than MPI for diagnosis of ACS in ER
MCE
MPI 98 pts: chest pain suggestive of acute ischemia.
Early MCE and Sestamibi MPI obtained.
32 patients - acute MI, 35 - unstable angina. area under the curve:
MCE >> MPI
(0.86 vs. 0.77, p=0.019)
Conclusion: MCE and MPI overcome the low sensitivity of
routine triage tests for detecting ACS.
Comparison of Myocardial Contrast Echocardiography vs
Rest Sestamibi Myocardial Perfusion Imaging in Early
Diagnosis of Acute Coronary Syndrome Kang …. Park, J Cardiovasc Ultrasound 2010;18:45
Left Ventricular Muscle Structure
CONTRACTION – DEFORMATION
Deformation in Ischemia

Left Ventricular Muscle
Structure + Contraction
E. Griffith. Simulating the blood-muscle-valve mechanics of the heart by an adaptive and parallel
version of the immersed boundary method. PhD Thesis, Courant Institute of Mathematical
Sciences, New York University, 2005
• During morphogenesis, the myocardial
wall matures from a single-layered
epithelium to a complex, multi-layered
structure.
• LV wall is not homogenous,
is composed of 3 layers of fibers.
• Subendocardial and subepicardial
layers have opposite fiber orientation.
• This is important for equal redistribution
of stress and strain in the heart.
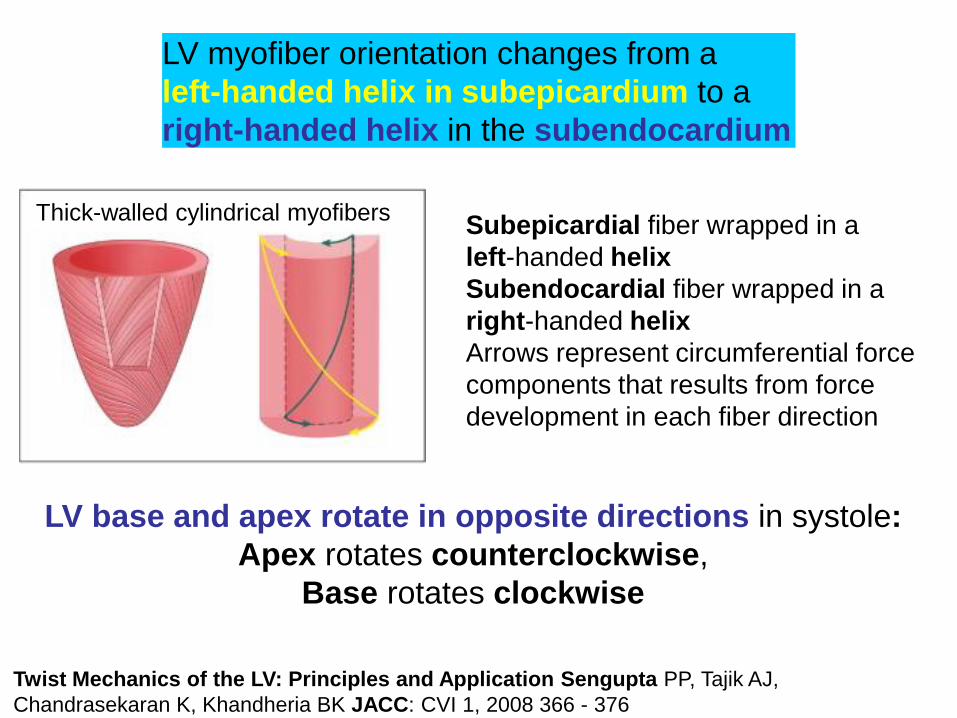
Twist Mechanics of the LV: Principles and Application Sengupta PP, Tajik AJ,
Chandrasekaran K, Khandheria BK JACC: CVI 1, 2008 366 - 376
LV myofiber orientation changes from a
left-handed helix in subepicardium to a
right-handed helix in the subendocardium
Subepicardial fiber wrapped in a
left-handed helix
Subendocardial fiber wrapped in a
right-handed helix
Arrows represent circumferential force
components that results from force
development in each fiber direction
LV base and apex rotate in opposite directions in systole:
Apex rotates counterclockwise,
Base rotates clockwise
Thick-walled cylindrical myofibers

directed from
apex to base
perpendicular to
epicardium away
from cavity
counterclockwise
around short-axis
Radial Circumferential Longitudinal

Dynamic 3-D strain-line patterns over the myocardium during the cardiac cycle
Mangual J O et al. Circ CVI 2012;5:808
epicardial layer - blue
endocardial layer - red stream lines short axial view of 3 planes
(basal, mid and apical), with stream lines
color pattern changing from
blue at sub-epicardium to
red at the sub-endocardium.

CONTRACTION – DEFORMATION
Can be evaluated by echocardiography
2 Dimensional Strain = 2DS
Speckle Tracking Echocardiography
Automated Function Imaging = AFI

Courtesy of Z Friedman, P Lysyansky (GE Israel)
Speckle Tracking Echocardiography
Time (sequential frames)

Echocardiographic Assessment of Myocardial Strain, John Gorcsan III , Hidekazu
Tanaka Journal of the American College of Cardiology Volume 58, 2011 1401 - 1413
Figure 4
Strain is calculated as the change in length (ΔL) divided by the
original length (L0) and expressed as a percentage.
Speckle Tracking Strain by Echocardiography

Apical to basal gradient: high at apex, lower at base
Endocardial strain is highest, epicardial lowest
Circumferential and Longitudinal Strain in 3 Myocardial Layers in Normal Subjects and in Patients
with Regional Left Ventricular Dysfunction, Leitman M, Lysiansky M, Lysyansky P, Friedman Z,
Tyomkin V, FuchsT, Adam Dan, Krakover R and Vered Zvi. JASE Vol 23, 2010
Three-layer longitudinal and circumferential strain: normal subject
Apical 4-chamber view
Short-axis views
Endocardial Mid Epicardial
Base
Mid
Apex

Liel-Cohen et al, Circ Cardiovasc Imaging 2010
Longitudinal 2D strain echo using AFI
(Automated Function Imaging)
is highly accurate and reproducible for detection
of Left Ventricular Wall Motion Abnormalities

Deformation in Ischemia
Use of 2D strain

Peak systolic strain (PSS) values:
Reduced in the lateral wall (red, blue, and purple traces) −5 to −10%,
Normal in the septum (yellow, cyan, and green traces) −16 to −20%.
Figure 1
Strain echocardiography predicts acute coronary occlusion
Region of interest drawn in apical 4-Ch view and corresponding strain curves
Eek C et al. EJE 2010;11:501
Bull's eye plot of strain values:
functional risk area of nine adjacent segments
with strain greater than or equal to −14% .

Strain echocardiography predicts acute coronary occlusion Eek C et al. EJE 2010;11:501
• By multivariate logistic regression, only functional risk area by strain
analysis remained an independent predictor of acute coronary occlusion.
• ROC analysis demonstrated that functional risk area by strain analyses had
the best ability to identify patients with acute coronary occlusion.
• Functional risk area by strain of minimum 4 segments yields:
sensitivity of 85% and a specificity of 70% for predicting occlusion.
150 patients enrolled from 2007-2008, clinical diagnosis of NSTE-ACS,
and planned coronary angiography within 3 days of index admission.

Sarvari SI, Haugaa KH, Zahid W, Bendz B, MD, Aakhus S, Aaberge L, Edvardsen T, JACC CVI, In Press 2013
Normal strain (–19%) in healthy person Reduced endocardial strain in segments supplied by the CX artery
–15% to –17% (white arrow) in a
patient with non ST-elevation ACS with
occluded circumflex artery.
Endocardial global longitudinal strain
was reduced to –15%.
Color-coded automatic endocardial
longitudinal strain in apical 4-ch view.
Yellow indicates preserved strain.
Brown indicates reduced strain.
The red line and arrowheads depict
epicardial border. Strain curves for 6
endocardial segments are displayed.
Layer-Specific Quantification of Myocardial Deformation by Strain
May Reveal Significant CAD in Pts With Non ST Elevation ACS
No Significant CAD Significant CAD
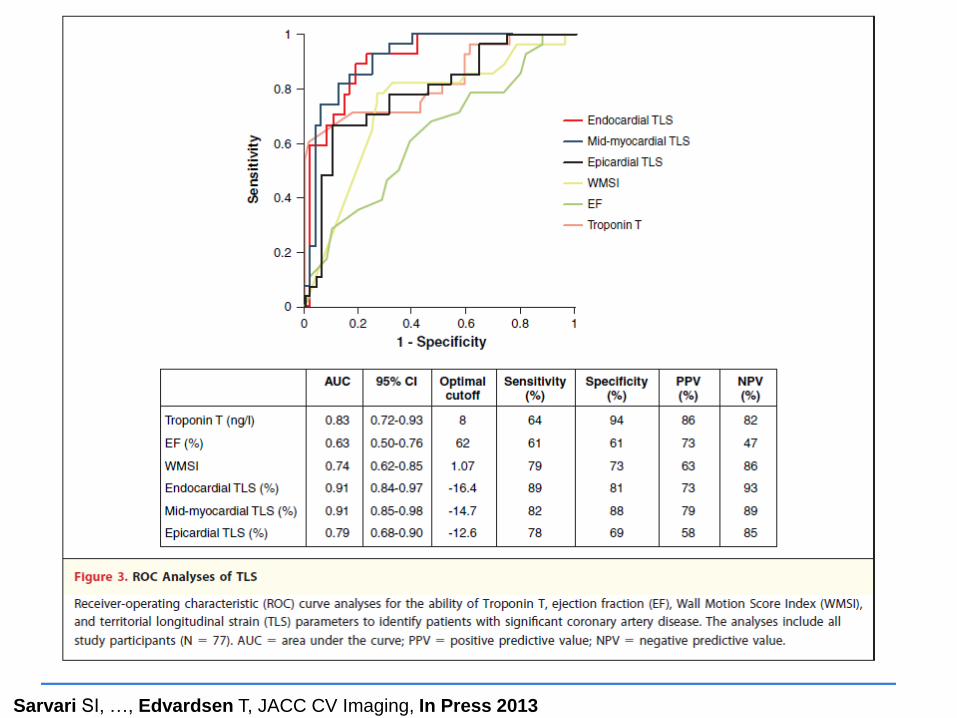
Territorial longitudinal strain = TLS

Sarvari SI, , Edvardsen T, JACC CV Imaging, In Press 2013
Conclusions:
Assessment of endocardial and mid-myocardial TLS by layer-specific
strain echo provided higher accuracy than epicardial strain, WMSI, EF in
identification of pts with NSTE-ACS and significant CAD.
Endocardial function was more affected than epicardial function in
patients with significant CAD.
Multivariate regression analysis showed that (including parameters influencing
myocardial function): the only predictor of the presence of significant CAD
was reduced myocardial function by endocardial TLS (per 1% change), independently of the variables included in the model in addition to endocardial TLS.
72 pts referred to coronary angiography for suspected NSTE ACS:
28 with coronary occlusion, 21 significant stenosis, 28 no stenosis. Echo performed 1 - 2 h before angiography.
Teritorial longitudinal strain = TLS

108p referred to coronary angio & echo
(96p adequate speckle tracking)
Stable & unstable AP
Normal LV on 2D echo
599y, 71% males
High risk 38p, low risk=28p normal=30p

Choi J et al. Eur J Echocardiogr 2009;10:695-701 Fig 3
Resting PSLS is significantly reduced in patients with severe CAD including LM or 3 vessel CAD, even when resting wall motion and LV ejection fraction are normal. Therefore, PSLS measured by 2D strain may be a more sensitive marker than wall motion abnormality for severe ischaemic disease.
Global PSLS -19.4%
Sens=76.3%, Spec=74.1%
Mid-basal PSLS -17.9%
Sens=78.9%, Spec=79.3%

Differential Effects of Coronary Artery Stenosis
on Myocardial Function:
The Value of Myocardial Strain Analysis for the Detection of
Coronary Artery Disease Shimoni S, Gendelman G, Ayzenberg O, Smirin N, Lysyansky P, Edri O,
Deutsch L, Caspi A and Friedman Z, Israel
J Am Soc Echocardiogr 2011;24:748-57
Aim: assess predictive value of 2D longitudinal strain in
detection of LV dysfunction and identification of coronary
artery disease in patients hospitalized with angina with normal
LV function on 2D echo
• 97 patients hospitalized with stable and unstable angina
• Normal LVEF and regional function
• Echo performed within 5 days of hospitalization and before cath
Shimoni et al. JASE 2011;24:748

Example: histograms and parameters for
PSS10%, in patients with and without CAD.
Blue histogram: longitudinal PSS
distribution from entire LV of a patient with
no CAD. PSS10% in this patient was 15%.
Red histogram shows the longitudinal PSS
traces of a patient with CAD. PSS10% in
this patient was 7%.
Figure 1
An example of 2D longitudinal strain deformation analysis: knots and segments
Shimoni et al. JASE 2011;24:748
No
CAD With
CAD
Segmental analysis: longitudinal strain
traces in each segment are averaged to
a single segmental strain trace.
Knots are elements of 1-2 mm in length.
2D strain software generates strain
traces of all 150 - 200 knots in 3 apical
views and generates a histogram.

Conclusions:
Global and regional longitudinal systolic
function is impaired in patients
hospitalized with stable and unstable
angina who have significant CAD.
Histogram analysis improved the accuracy
of longitudinal strain analysis in detecting
global and regional impaired function.
The test is noninvasive and can be
performed at the bedside, and the analysis
can be fast and quantitative.
Further studies needed to prospectively
evaluate the use of longitudinal LV
systolic function in patients admitted to
chest pain units or hospitalized for the
evaluation of chest pain.
The AUC for PSS10% significantly
higher than AUC for SegPSS
(0.86, 0.76, resp;P=.004).
Figure 3
Shimoni et al. JASE 2011;24:748

Hypothesis:
Normal longitudinal strain from a bedside echo,
performed in patients with chest pain and medium
risk for ACS,
will safely and effectively rule out ACS.
>700 patients, 10% positive for CAD
2D Strain Echocardiography for Diagnosing
Chest Pain in the Emergency Room (2DSPER):
A multicenter prospective observational study
by the Israeli Echocardiography Research Group
Participating 11 Israeli Medical Centers
Avinoam Shiran MD, Lady Davis Carmel Medical Center

Longitudinal 2D strain for suspected ACS
• Noninvasive, bedside
• Immediate and quantitative results
• Automated and objective (inexperienced operator)
• Reproducible
• Sensitive for ischemia (more than visual assessment)
• “Memory” effect
• Depends on 2D echo quality and frame rate

Decision-making algorithm in ACS. Echocardiography is mandatory in each patient,
whereas other forms of imaging are optional (framed green in the validation box).
Sechtem U et al. Eur J Echocardiogr 2012
Hamm C W et al. Eur Heart J 2011;32:2999-3054

Thank you
Clearly echocardiography has a
multitude of options
which contribute to the
risk stratification,
diagnosis and
better patient care
for patients with acute chest pain.

Strain echocardiography predicts acute coronary occlusion Eek C et al. EJE 2010;11:501
Sarvari SI, …, Edvardsen T, JACC CV Imaging, In Press 2013

Comparison of global and segmental peak systolic longitudinal strains
Choi J et al. Eur J Echocardiogr 2009;10:695-701 Fig 2
Global + segmental PSLSs were greater in normal than in high-risk
High risk 38p, low risk=28p normal=30p
basal mid apical
Global strain LV EF

Pioneering estimates of
ventricular wall stress were
based on “Law of Laplace”
for thin-walled spheres a
simplification of equations
(10) and (11).
Coupling multi-physics models to cardiac mechanics D.A. Nordsletten et al,
Progress in Biophysics and Molecular Biology 2011
Coordinated contraction and relaxation of LV myocardium
produces several fundamental movements of the left ventricle:
nonhomogenous deformation of the basal, mid, and apical
ventricular segments.