ecb/eurostat work on pensions in the context of the sna update the 2008 world congress on national...
Post on 19-Dec-2015
215 views
TRANSCRIPT

ECB/Eurostat Work on Pensions in the Context of the
SNA Update
The 2008 World Congress on National Accounts and Economic Performance Measures for Nations
Key Bridge Marriott, Arlington, Virginia12 to 17 May 2008
Reimund Mink
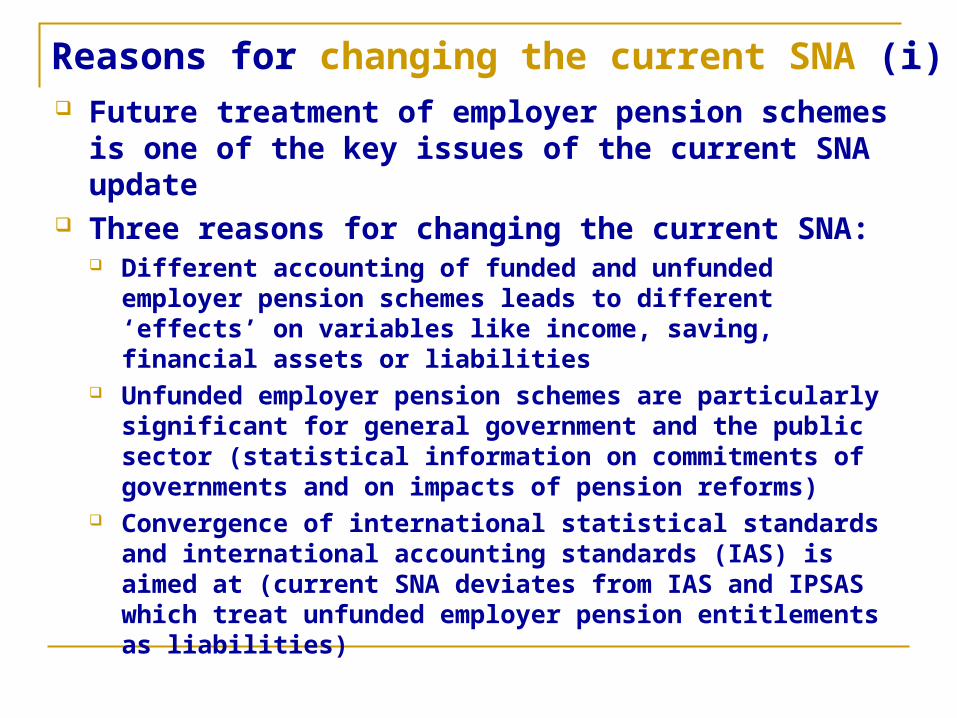
Reasons for changing the current SNA (i) Future treatment of employer pension
schemes is one of the key issues of the current SNA update
Three reasons for changing the current SNA: Different accounting of funded and unfunded
employer pension schemes leads to different ‘effects’ on variables like income, saving, financial assets or liabilities
Unfunded employer pension schemes are particularly significant for general government and the public sector (statistical information on commitments of governments and on impacts of pension reforms)
Convergence of international statistical standards and international accounting standards (IAS) is aimed at (current SNA deviates from IAS and IPSAS which treat unfunded employer pension entitlements as liabilities)
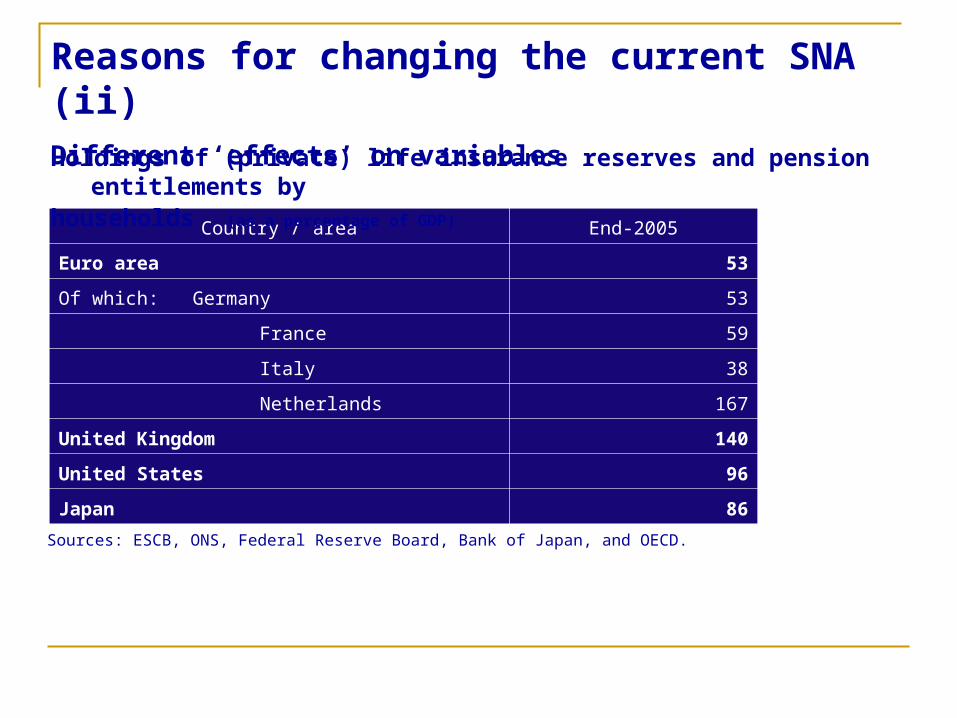
Reasons for changing the current SNA (ii)Different ‘effects’ on variables
Country / area End-2005
Euro area 53
Of which: Germany 53
France 59
Italy 38
Netherlands 167
United Kingdom 140
United States 96
Japan 86
Holdings of (private) life insurance reserves and pension entitlements by
households (as a percentage of GDP)
Sources: ESCB, ONS, Federal Reserve Board, Bank of Japan, and OECD.
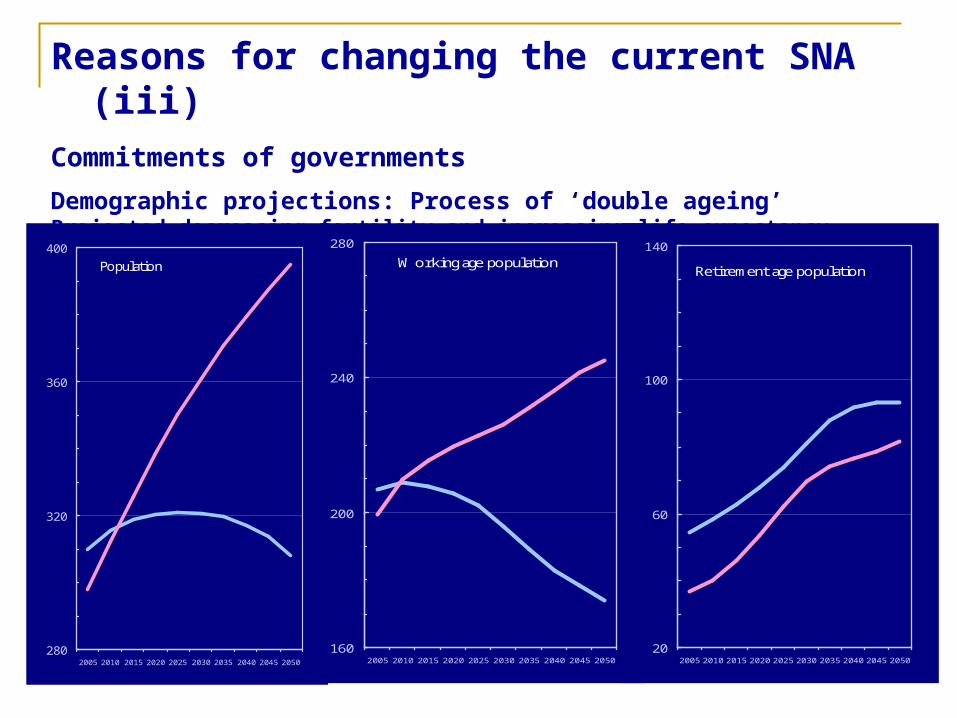
Reasons for changing the current SNA (iii) Commitments of governments
Demographic projections: Process of ‘double ageing’ Projected decreasing fertility and increasing life expectancyEuro area and in the US (in Mio)
Retirement age population
20
60
100
140
2005 2010 2015 2020 2025 2030 2035 2040 2045 2050
Working age population
160
200
240
280
2005 2010 2015 2020 2025 2030 2035 2040 2045 2050
Population
280
320
360
400
2005 2010 2015 2020 2025 2030 2035 2040 2045 2050

Recording of pension schemes in the new SNA (i) Work done since 2002
IMF electronic discussion group (2002 – 2005) Eurostat’s Task Force on pensions (December
2004) IMF/BEA Task Force on pensions (September 2005) AEG recommendations (Frankfurt 2006 meeting) to
treat all employer pension schemes in the same way
Conclusions of the UN Statistical Commission (February 2006) and follow-up
Compromise (summer 2006) Flexibility of recording (refers to the treatment of
unfunded government employer pension schemes) Supplementary table on pensions

Recording of pension schemes (ii) Households hold
pension entitlements as financial assets
Change in stock of pension entitlements between balance sheets arises from: Social contributions (actual
and imputed) Pension benefits Financial services Other economic flows
Revaluations Other changes in the
volume of assets
Transfers between pension schemes
Pension reforms
Social contributio
ns Actual
Imputed (of which:
property income)
Pension benefits
Financial services
Other economic
flows
Revaluations
Other changes
Increase in pension
entitlements
Pension entitlements at the end of
the period
Pension entitlements
at the beginning of the period
Opening balance sheet + incoming flows - outgoing flows = Closing balance sheet

Recording of stocks and flows of government pension schemes in the updated SNA will be formally identical to the recording of non-government pension schemes
Opening balance sheet + incoming flows - outgoing flows = Closing balance sheet
Based on model
estimations
Recording of government pension schemes (iii)
Opening balance sheet + incoming flows - outgoing flows = Closing balance sheet
Social contribution
s Actual
Imputed (of which:
property income)
Pension benefits
Financial services
Other economic
flows
Revaluations
Other changes
Increase in pension
entitlements
Pension entitlements at the end of
the period
Pension entitlements
at the beginning of the period

Pension schemes in Europe (iv) Challenges identified in Europe to implement the compromise for government employer (unfunded)
pension schemes (borderline with social security pension schemes) The predominant types of pension schemes in European countries are social security pension
schemes and defined benefit (unfunded) government employer pension schemes
Social insurance
Individual insurance(third pillar)
Social security schemes, (unfunded) general government
employee defined benefit schemes(first pillar)
Defined contribution schemes, private defined benefit schemes, (funded)
general government employee defined benefit schemes(second pillar)
Belgium
Germany
Greece
Spain
France
Ireland
Italy
Luxembourg
Netherlands
Austria
Portugal
Finland
United Kingdom
United States

The Eurostat/ECB Task Force (v) Mandate agreed by Committee on Monetary,
Financial and Balance of Payments Statistics (CMFB) in June 2006 Methodological work (supplementary table) Modelling work
Six Task Force meetings Participants from ten European countries, the
European Commission (ECFIN), OECD, IMF, SNA Editor
Report presented to the CMFB in January 2008 (www.cmfb.org)
Compilation Guide

The supplementary table (i) Standard table for the new SNA (new
chapter 17) Covers all pension schemes in social
insurance, including social security pension schemes (thus boundary of social insurance/social assistance important)
Shows pension schemes data together and helps to compile comparable national accounts
Follows stock-flow relationship and covers transaction and other flow data as economic events for changes in pension entitlements
Includes survivors and disability pensions which are part of pension schemes

The supplementary table (ii)Core / non-core national accounts
To-tal
Core Non-core
Counter-parts: Of which:
Resident households
Sponsor Non-general government General government
Scheme
Position / transaction /other flowTo-tal
DC sche-mes
DB schemes
and other
non-DC schemes
DC sche-mes
General government employer DB schemes
Social security pension scheme
s
Of which:
Schemes
classified in
general govern-ment
Row number / column number A B C D E F G H I J
Opening balance sheet
1 Pension entitlements
Transactions
2Social contributions relating to pension schemes
Employer actual social contributions
Employer imputed social contributions
Employee actual social contributions
Employee imputed social contributions/ property income
Self employed and non-employed social contributions
3
Other (actuarial) accumulation of pension entitlements in social security pension schemes
4 Pension benefits
5 Change in pension entitlements (rows 2+3-4)
6Changes in pension entitlements due to transfers of entitlements
Other economic flows
7 Revaluations
8 Other changes in volume
Closing balance sheet
9 Pension entitlements (rows 1+5+6+7+8)
Related indicators

The supplementary table – columns (iii)
Core-non-core… Core schemes’ entitlements recorded in core national
accounts Task Force found a basket of criteria:
Degree of integration within the government structure (autonomous versus non-autonomous)
Risk exposure/ability to change the benefit formula (government does not have discretion to change unilaterally the benefit formula at any point in time and thereby partially default on its obligations)
Nature of the contract (generally not forced by law to participate) Legal framework close to social security pension schemes Funding (funding versus no funding)
To be developed further in the European System of Accounts (ESA) revision
Government or non-government sector Sponsored by government or not (concept of
sponsor) Defined contribution or defined benefit
(including hybrid) schemes

The supplementary table – rows (iv)
Pension entitlements at the beginning and the end of the period and flows in between
Social contributions Employer imputed social contributions are
commonly calculated as a residual Social security pension schemes have specific row to
reflect lack of employer imputed social contributions Household social contribution supplements =
imputed property income on all pension schemes Pension reforms
If affecting accrued entitlements, generally treated as transactions (other economic flows if imposed by third party)
Treatment of payments for financial services / output
Assets of pension schemes held for sole purpose of paying pensions

Modelling of government pension schemes (i) Lack of significant expertise amongst statisticians,
thus… rely on experts and existing data, and develop knowledge and modelling skills
Accrued-to-date liabilities concept
Use the actuarial approach Need to give guidance on assumptions to improve
comparability of data, but accept that sometimes data is available with assumptions already in place

Accrued-to-date liabilities (ADL) of a pension scheme are calculated as the present value of the current pension benefits and of the projected future pension benefits paid to all pensioners and to current workers living in the base year b:
, ,
,
( )(1 )
exis futb D bt k t k
b t kt bt b k b D
p pADL D
r
The pension entitlements of the existing retirees ( ) and the pension entitlement of the current workers (future retirees) are accrued to the base year ( ) and discounted by (1+r) for each future year (t-b) and multiplied with the corresponding number of members of the age cohort Dt,k.
,
exis
t kp
,
fut
t kp
Modelling of government pension
schemes (ii)

Modelling - key assumptions (iii)
Discount rate Favour government bond yields (suitable
maturity) But corporate bond yields could be used
Treatment of real wage changes Take account of future wage changes (ABO
versus PBO) Experience effects are transactions
Demographic data Other assumptions in some schemes
(diversity across Europe)

Modelling work (iv) Task Force looked at three approaches:
National models Pension Reform Options Simulation Toolkit (PROST)
developed by the World Bank Intergenerational accounting-based model
developed by the Research Center for Generational Contracts of the Freiburg University
Results of data show: Pensions entitlements very large, especially for
social security Models allow to carry out sensitivity analyses (by
varying key assumptions) Putting the data together is time-consuming Developing national models requires close
cooperation between the national statistical institutes, central banks and other national institutions like ministries and other government entities

Modelling of government pension
schemes (v) Pension entitlements Government employer pension schemes (column H of the supplementary table)
Country Year Model ABO/PBO
Pension entitlements (in national currency)
Pension entitlements
(in % of GDP)
2006 ABO 942 41
2006 PBO 1,129 49
2006 ABO 1,149 64
2006 PBO 902 50
2006 ABO 20 4
2006 PBO 24 5
2006 ABO 260 25
2006 PBO 303 29PL Freiburg
NL Freiburg
DE Freiburg
FR Freiburg
Social security pension schemes (column I of the supplementary table)
* FUS: Social Insurance Fund; ** FER: Disability and pension Fund (farmers)
Country Year Model Wage growth
Pension entitlements
in national currency
as a percentage
of GDP
Germany 2006 Freiburg ABO 942 41
PBO 1,129 49
Spain 2006 National PBO 223 23
France 2006 National PBO 941 53
Freiburg ABO 902 50
PBO 1,093 61
Netherlands
2006 Freiburg ABO 20 4
PBO 24 5
Poland 2006 Freiburg ABO 260 25
PBO 303 29
Country Year Model Wage growth Pension entitlements
in national currency
as a percentage of GDP
Czech Republic
2006 Freiburg ABO 5,231 162
PBO 6,474 200
Germany 2004 National ABO 4,169 186
PBO 5,669 253
2005 ABO 4,136 185
PBO 5,268 235
2006 Freiburg ABO 5,386 232
PBO 6,464 278
2005 World Bank PBO 6,710 289
Spain 2006 National PBO 2,349 240
Freiburg ABO 1,969 201
PBO 2,333 238
France 2005 National PBO 5,623 327
2006 Freiburg ABO 4,225 247
PBO 5,248 293
World Bank PBO 5,721 319
Hungary 2006 Freiburg ABO 54,272 228
PBO 65,220 275
Netherlands 2006 Freiburg ABO 690 129
PBO 872 163
Poland 2006 Freiburg ABO 2,695 255
PBO 3,037 287
World Bank PBO* 2,579 243
PBO** 464 44
Sweden 2002 National ABO 5,729 242
2003 5,984 243
2004 6,244 243
2005 6,461 242
2006 6,703 236
Freiburg ABO 4,760 168
PBO 5,620 198
* FUS: Social Insurance Fund** FER: Disability and Pension Fund (farmers)

Modelling of government pension
schemes (vi)
Source: Freiburg University

Modelling of government pension
schemes (vii)
Source: Freiburg University
Next steps Follow-up
Draft Chapter 17 of updated SNA Revised ESA will draw on Task Force work Questionnaire in the first half of 2008 Eurostat/ECB seminar in early 2009 Contact Group established for country experts Feedback to CMFB in January 2009
Since work on pensions is complex, countries should start work early on implementation
Support by: Compilation Guide Further modelling work on pensions