ecbc-tr-1443 vapor pressure data and analysis … · vapor pressure data and analysis for selected...
TRANSCRIPT

VAPOR PRESSURE DATA AND ANALYSIS FOR SELECTED ORGANOPHOSPHORUS COMPOUNDS: DIBMP, DCMP, IMMP,
IMPA, EMPA, AND MPFA
ECBC-TR-1443
Ann Brozena James H. Buchanan
Patrice L. Abercrombie-Thomas Kenneth B. Sumpter
RESEARCH AND TECHNOLOGY DIRECTORATE
Barry R. Williams
LEIDOS, INC. Gunpowder, MD 21010-0068
David E. Tevault
JOINT RESEARCH AND DEVELOPMENT, INC. Belcamp, MD 21017-1552
April 2017
Approved for public release; distribution unlimited.

Disclaimer
The findings in this report are not to be construed as an official Department of the Army position unless so designated by other authorizing documents.

REPORT DOCUMENTATION PAGE Form Approved
OMB No. 0704-0188 Public reporting burden for this collection of information is estimated to average 1 h per response, including the time for reviewing instructions, searching existing data sources, gathering and maintaining the data needed, and completing and reviewing this collection of information. Send comments regarding this burden estimate or any other aspect of this collection of information, including suggestions for reducing this burden to Department of Defense, Washington Headquarters Services, Directorate for Information Operations and Reports (0704-0188), 1215 Jefferson Davis Highway, Suite 1204, Arlington, VA 22202-4302. Respondents should be aware that notwithstanding any other provision of law, no person shall be subject to any penalty for failing to comply with a collection of information if it does not display a currently valid OMB control number. PLEASE DO NOT RETURN YOUR FORM TO THE ABOVE ADDRESS. 1. REPORT DATE (DD-MM-YYYY) XX-04-2017
2. REPORT TYPE Final
3. DATES COVERED (From - To) Dec 2015 – Oct 2016
4. TITLE AND SUBTITLE Vapor Pressure Data and Analysis for Selected Organophosphorus Compounds: DIBMP, DCMP, IMMP, IMPA, EMPA, and MPFA
5a. CONTRACT NUMBER
5b. GRANT NUMBER
5c. PROGRAM ELEMENT NUMBER
6. AUTHOR(S) Brozena, Ann; Buchanan, James H.; Abercrombie-Thomas, Patrice L.; Sumpter, Kenneth B. (ECBC); Williams, Barry R. (Leidos); Tevault, David E. (JRAD, Inc.)
5d. PROJECT NUMBER CB Defense Technology Base Program 5e. TASK NUMBER
5f. WORK UNIT NUMBER
7. PERFORMING ORGANIZATION NAME(S) AND ADDRESS(ES) Director, ECBC, ATTN: RDCB-DRC-P, APG, MD 21010-5424 Leidos, Inc.; P.O. Box 68; Gunpowder, MD 21010-0068 JRAD, Inc.; 4694 Millennium Drive, Suite 105, Belcamp, MD 21017-1552
8. PERFORMING ORGANIZATION REPORT NUMBER ECBC-TR-1443
9. SPONSORING / MONITORING AGENCY NAME(S) AND ADDRESS(ES) Defense Threat Reduction Agency, 8725 John J. Kingman Road, MSC 6201, Fort Belvoir, VA 22060-6201
10. SPONSOR/MONITOR’S ACRONYM(S) DTRA 11. SPONSOR/MONITOR’S REPORT NUMBER(S)
12. DISTRIBUTION / AVAILABILITY STATEMENT Approved for public release; distribution unlimited. 13. SUPPLEMENTARY NOTES 14. ABSTRACT: Recent work from our laboratory has focused on chemical warfare agents (CWAs), simulants, precursors, and degradation products. This report documents the vapor pressure data for three organophosphonate ester compounds and three phosphonic acids, all of which are related to CWAs. Due to structural similarities, these materials may also be considered to be CWA simulants and can be used to evaluate the performance of defensive equipment, which requires accurate knowledge of the thermophysical properties of these materials. Vapor pressure data were measured using two ASTM International methods that are based on differential scanning calorimetry (DSC) and vapor saturation. The data presented herein have been used to determine temperature–pressure correlations, and the fit constants have been used to determine temperature-dependent thermodynamic properties and to enable interpolation and limited extrapolation of the data. The criteria for assessing vapor pressure data quality are presented herein.
15. SUBJECT TERMS Vapor pressure Antoine equation Clausius–Clapeyron equation Enthalpy of vaporization Volatility Differential scanning calorimetry (DSC) Vapor saturation Boiling point Diisobutyl methylphosphonate (DIBMP), Chemical Abstracts Service (CAS) no. 7242-56-0 Dicyclohexyl methylphosphonate (DCMP), CAS no. 7040-53-1 Isopropyl methyl methylphosphonate (IMMP), CAS no. 690-64-2 Isopropyl methylphosphonic acid (IMPA), CAS no. 1832-54-8 Ethyl methylphosphonic acid (EMPA), CAS no. 1832-53-7 Methyl phosphonofluoridic acid (MPFA), CAS no. 1511-67-7
16. SECURITY CLASSIFICATION OF:
17. LIMITATION OF ABSTRACT
18. NUMBER OF PAGES
19a. NAME OF RESPONSIBLE PERSON Renu B. Rastogi
a. REPORT b. ABSTRACT c. THIS PAGE 19b. TELEPHONE NUMBER (include area code)
U U U UU 42 (410) 436-7545 Standard Form 298 (Rev. 8-98)
Prescribed by ANSI Std. Z39.18

ii
Blank

iii
PREFACE
The work described in this report was authorized under the Chemical and
Biological Technology Base Program. This work was started in December 2015 and completed in October 2016. The data reported herein are contained in U.S. Army Edgewood Chemical Biological Center (ECBC) notebooks 97-0108, 99-0095, 11-0066, 02-0091, 07-0072, and 08-0085.
The use of either trade or manufacturers’ names in this report does not constitute
an official endorsement of any commercial products. This report may not be cited for purposes of advertisement.
This report has been approved for public release.
Acknowledgments
The authors would like to express their appreciation to Mrs. Suzanne Foppiano
(ECBC Technical Library) and Ms. Janett Stein (Hendall, Inc.; Rockville, MD) for their assistance in obtaining several references cited in this report. We also thank Ms. Diane Wylie (Battelle Memorial Institute; Columbus, OH) for editorial assistance.

iv
Blank

v
CONTENTS
1. INTRODUCTION ...................................................................................................1 2. EXPERIMENTAL PROCEDURES ........................................................................2 3. RESULTS ................................................................................................................4 3.1 DIBMP ...............................................................................................................4 3.2 DCMP ................................................................................................................7 3.3 IMMP ...............................................................................................................10 3.4 IMPA................................................................................................................13 3.5 EMPA ..............................................................................................................18 3.6 MPFA ...............................................................................................................19 4. DISCUSSION ........................................................................................................19 5. CONCLUSIONS....................................................................................................23 LITERATURE CITED ..........................................................................................25 ACRONYMS AND ABBREVIATIONS ..............................................................29

vi
FIGURES
1. Structures and chemical names of title compounds .............................................................2
2. DIBMP vapor pressure data and Antoine equations based on all data and DSC data only, and the Clausius–Clapeyron equation based on DSC data only ..........6
3. DCMP vapor pressure data and Antoine correlations based on all data and DSC data only, and the Clausius–Clapeyron equation based on DSC data only ..........9
4. IMMP vapor pressure data and Antoine correlations based on all data and DSC data only, and the Clausius–Clapeyron correlation based on DSC data only ...........12
5. Superposition of inferred IMPA data (shown in red, IMPA data in upper right) onto a photocopy of Neale’s Figure 3 (shown in black, IMPA data identified as ) ................16
6. IMPA vapor pressure data and Clausius–Clapeyron correlations .....................................17 7. EMPA experimental vapor pressure data and literature values .........................................19 8. Vapor pressure comparison for title compounds and selected CWAs ...............................23

vii
TABLES
1. Sample Information for Title Compounds ...........................................................................2
2. Experimental Data and Calculated Vapor Pressure Values for DIBMP..............................5
3. Calculated Vapor Pressure, Volatility, and Enthalpy of Vaporization for DIBMP at Selected Temperatures .....................................................................................................7
4. Experimental Data and Calculated Vapor Pressure Values for DCMP ...............................8
5. Calculated Vapor Pressure, Volatility, and Enthalpy of Vaporization for DCMP at Selected Temperatures ...................................................................................................10
6. Experimental Data and Calculated Vapor Pressure Values for IMMP..............................11
7. Calculated Vapor Pressure, Volatility, and Enthalpy of Vaporization for IMMP at Selected Temperatures ...................................................................................................13
8. Experimental and Calculated Vapor Pressure Values for IMPA .......................................15
9. Calculated Vapor Pressure, Volatility, and Enthalpy of Vaporization for IMPA at Selected Temperatures ...................................................................................................18

viii
Blank

1
VAPOR PRESSURE DATA AND ANALYSIS FOR SELECTED ORGANOPHOSPHORUS COMPOUNDS: DIBMP, DCMP, IMMP, IMPA, EMPA, AND MPFA
1. INTRODUCTION
Knowledge of the physical properties of materials is critical for understanding their behavior in the environment as well as in the laboratory. Vapor pressure is an important physical property for a wide variety of chemical defense-related applications, including estimation of persistence, prediction of downwind time–concentration profiles after dissemination, generation of controlled challenge concentrations for detector testing, evaluation of toxicological properties, and assessment of the efficiency of air filtration systems.
The U.S. Army Edgewood Chemical Biological Center (Aberdeen Proving
Ground, MD) has a long history of interest in quantification of the physical properties of chemical warfare agents (CWAs) and related materials,1–10 including the development of correlations to enable the accurate prediction of values at untested temperatures. Recent efforts have focused on investigation and documentation of vapor pressure and properties that were derived from such data, including temperature correlations, volatility, and temperature-dependent enthalpy of volatilization (vaporization for liquids and sublimation for solids) for CWAs and related compounds.11–19
In addition to agents, recent work has focused on determination of the vapor
pressure of agent precursors, degradation products, and simulants using two different ASTM International methods that are based on the differential scanning calorimetry (DSC) “pinhole” technique20,21 and vapor saturation (or transpiration).22 This report documents vapor pressure measurements, correlations, and derived properties for the organophosphorus G- and V-agent-related degradation products and simulants, whose structures, chemical names, Chemical Abstract Services (CAS) Registry Numbers, chemical formulas, and molecular weights are shown in Figure 1.

2
Figure 1. Structures and chemical names of title compounds.
2. EXPERIMENTAL PROCEDURES Table 1 lists the sources and mole fraction purities of the materials studied and the
experimental vapor pressure method(s) used in this work. Not all samples were investigated using both methods.
The two different methods used in this work closely follow ASTM International
standards and have been described in detail in previous publications.12,15
Table 1. Sample Information for Title Compounds
Compound Vapor Pressure Method Source Purity
(%)
DIBMP DSC In-house 99 Saturator Alfa Aesar (Ward Hill, MA) 97
DCMP DSC In-house 98
Saturator Hestia Laboratories (Milwaukee, WI) 99
IMMP DSC In-house 95 Saturator In-house 95
IMPA DSC Sigma-Aldrich (Milwaukee, WI) 98 EMPA DSC In-house 98 MFPA DSC In-house 98
P
O
OOP
O
O
O
P
O
O
O
Diisobutyl Methyl-phosphonate (DIBMP)
CAS No. 7242-56-0C9H21O3P, MW = 208.23 g/mol
Dicyclohexyl Methyl-phosphonate (DCMP)
CAS No. 7040-53-1C13H25O3P, MW = 260.31 g/mol
Isopropyl Methyl Methyl-phosphonate (IMMP)
CAS No. 690-64-2C5H13O3P, MW = 152.13 g/mol
P
O
O OH
Isopropyl Methyl-phosphonic Acid (IMPA)
CAS No. 1832-54-8C4H11O3P, MW = 138.10 g/mol
Ethyl Methyl-phosphonic Acid (EMPA)
CAS No. 1832-53-7C3H9O3P, MW = 124.08 g/mol
P
O
O OH
O
OHPF
Methyl PhosphonofluoridicAcid (MPFA)
CAS No. 1511-67-7CH4O2PF, MW = 98.01 g/mol
3
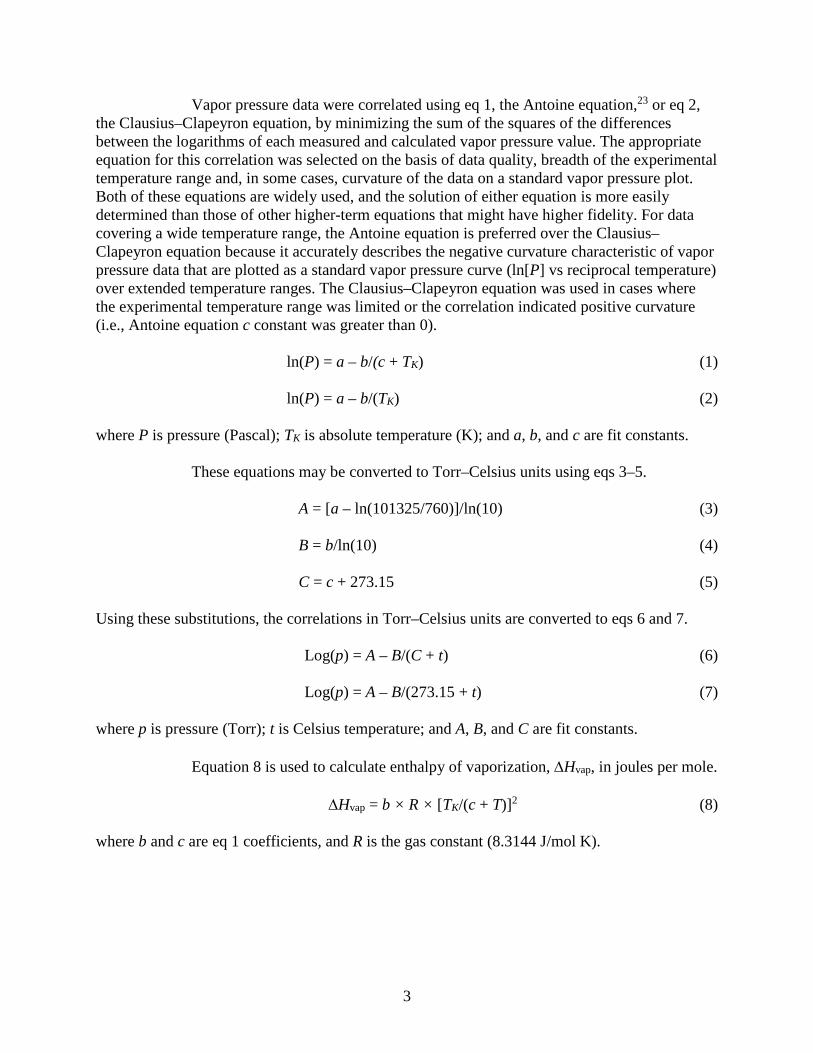
Vapor pressure data were correlated using eq 1, the Antoine equation,23 or eq 2, the Clausius–Clapeyron equation, by minimizing the sum of the squares of the differences between the logarithms of each measured and calculated vapor pressure value. The appropriate equation for this correlation was selected on the basis of data quality, breadth of the experimental temperature range and, in some cases, curvature of the data on a standard vapor pressure plot. Both of these equations are widely used, and the solution of either equation is more easily determined than those of other higher-term equations that might have higher fidelity. For data covering a wide temperature range, the Antoine equation is preferred over the Clausius–Clapeyron equation because it accurately describes the negative curvature characteristic of vapor pressure data that are plotted as a standard vapor pressure curve (ln[P] vs reciprocal temperature) over extended temperature ranges. The Clausius–Clapeyron equation was used in cases where the experimental temperature range was limited or the correlation indicated positive curvature (i.e., Antoine equation c constant was greater than 0).
ln(P) = a – b/(c + TK) (1)
ln(P) = a – b/(TK) (2)
where P is pressure (Pascal); TK is absolute temperature (K); and a, b, and c are fit constants.
These equations may be converted to Torr–Celsius units using eqs 3–5.
A = [a – ln(101325/760)]/ln(10) (3)
B = b/ln(10) (4)
C = c + 273.15 (5) Using these substitutions, the correlations in Torr–Celsius units are converted to eqs 6 and 7.
Log(p) = A – B/(C + t) (6)
Log(p) = A – B/(273.15 + t) (7)
where p is pressure (Torr); t is Celsius temperature; and A, B, and C are fit constants.
Equation 8 is used to calculate enthalpy of vaporization, ∆Hvap, in joules per mole.
∆Hvap = b × R × [TK/(c + T)]2 (8)
where b and c are eq 1 coefficients, and R is the gas constant (8.3144 J/mol K).

4
The saturation concentration, Csat, which is often referred to as volatility, at each temperature in milligrams per cubic meter is calculated from the vapor pressure, molecular weight, gas constant, and temperature according to eq 9
Csat = P × MW/R × TK (9)
where MW is molecular weight. 3. RESULTS
The vapor pressure data, pressure–temperature correlation, comparison to
literature data (where available), and calculated properties for each of the title compounds are detailed in this section. Data were measured over extended pressure ranges using the DSC and vapor saturator methods for the three organophosphorus esters: DIBMP, DCMP, and IMMP.
For comparison, measurements on the three phosphonic acids: IMPA, EMPA, and
MPFA were carried out using DSC only and covered limited temperature ranges because of the thermal instability of these compounds. Literature data that were obtained in the ambient temperature range for IMPA using the Knudsen effusion method were combined and correlated with the DSC data. For EMPA and MPFA, literature data consists of limited, reduced-pressure boiling points that resulted from distillation, which we have typically found to be unreliable, especially at pressures below 1 Torr. It has been our experience that data resulting from the use of methodologies that are not specifically designed to measure vapor pressure are less accurate than data measured using standard vapor pressure methods. None of the reduced boiling points cited in the literature have been correlated with our measurements described herein.
3.1 DIBMP
Our experimental data for DIBMP consist of 14 points that were measured using
DSC at 115.69 to 237.58 °C, and five points that were measured using the vapor saturation method at –20.0 to 20.0 °C. These DIBMP vapor pressure data extend over more than 6 orders of magnitude and are listed in Table 2 and shown graphically in Figure 2. Analysis of the data produced an Antoine equation that is also shown in Table 2 and plotted in Figure 2. Calculated values for vapor pressure, volatility, and enthalpy of vaporization at selected temperatures within the range of measured data are provided in Table 3. The calculated normal boiling point for DIBMP is 235.98 °C.
Three reduced boiling-point values from the literature were located for DIBMP:
119 to 120 °C at 15 Torr,24 115 to 116 °C at 10 to 12 Torr,25 and 72 °C at 3 Torr.26 These values are also plotted in Figure 2 but were not used for calculation of the Antoine equation.
For comparison, an Antoine fit and a Clausius–Clapeyron fit, both based on the
DSC data only, are also shown in Figure 2 to illustrate the difficulties associated with the extrapolation of high-temperature data to ambient temperatures. As expected with extrapolations over a wide temperature range, the Antoine fit introduces excessive curvature and underestimates

5
the vapor pressure at ambient temperature. In contrast, the Clausius–Clapeyron fit, which assumes a constant enthalpy of vaporization, overestimates ambient-temperature vapor pressure. In addition, due to a small systematic error in the DSC calibration at the time these measurements were performed, the low ends of those data sets were often skewed to lower pressures.16 This error exacerbated the excessive Antoine curvature and resulted in extrapolations that were even lower than was indicated by complementary data. As seen in Figure 2, the extrapolated value at 0 °C is approximately 1 order of magnitude lower than the value calculated using the fit based on both data sets. The uncertainties associated with the extrapolations demonstrate the value of generating data by complementary methods to minimize extrapolation beyond the experimental range.
Table 2. Experimental Data and Calculated Vapor Pressure Values for DIBMP
Temperature (°C)
Experimental Vapor Pressure Calculated Vapor Pressure Difference
(%)b (Torr) (Pa)a (Torr) (Pa) Vapor Saturation
–20.0 2.36 × 10⁻⁴ 3.15 × 10⁻² 2.289 × 10⁻⁴ 3.052 × 10⁻² 3.09 –10.0 8.34 × 10⁻⁴ 1.11 × 10⁻¹ 8.379 × 10⁻⁴ 1.117 × 10⁻¹ –0.47
0.0 2.69 × 10⁻³ 3.58 × 10⁻¹ 2.715 × 10⁻³ 3.620 × 10⁻¹ –0.99 10.0 7.72 × 10⁻³ 1.03 × 100 7.917 × 10⁻³ 1.055 × 100 –2.46 20.0 2.09 × 10⁻² 2.79 × 100 2.106 × 10⁻² 2.808 × 100 –0.64
DSC 115.69 11.5 1533 12.07 1609 –4.70 120.92 14.8 1973 15.37 2050 –3.73 124.07 18.1 2413 17.72 2363 2.12 132.04 25.0 3333 25.11 3348 –0.44 139.82 35.1 4680 34.75 4632 1.02 145.38 45.1 6013 43.45 5792 3.80 153.17 60.2 8026 58.75 7832 2.47 158.94 75.1 10010 72.86 9714 3.07 166.64 98.8 13170 96.14 12820 2.77 179.77 150.0 20000 150.4 20050 –0.27 189.48 209.0 27860 205.5 27400 1.70 194.80 250.3 33370 242.3 32310 3.30 237.48 755.7 100800 789.2 105200 –4.25 237.58 755.7 100800 791.2 105500 –4.49
log(p) = 7.796595 – 2206.905/(t + 212.9636) ln(P) = 22.84509 – 5081.587/(TK – 60.1864)
aExperimental DSC values were calculated from Torr values. b100 × (Pexpt – Pcalc)/Pcalc, where Pexpt is the experimental vapor pressure, and Pcalc is the calculated vapor pressure.

6
Figure 2. DIBMP vapor pressure data and Antoine equations based on all data and DSC data
only, and the Clausius–Clapeyron equation based on DSC data only.
0.0001
0.001
0.01
0.1
1
10
100
1000
18 20 22 24 26 28 30 32 34 36 38 40
P/To
rr
10000/TK
DSC Data
Saturator Data
Literature Data
Antoine Eqn, All Data
Clausius-Clapeyron Eqn, DSC Only
Antoine Eqn, DSC Only
250ºC 200ºC 150ºC 100ºC 75ºC 50ºC 25ºC 0ºC
7
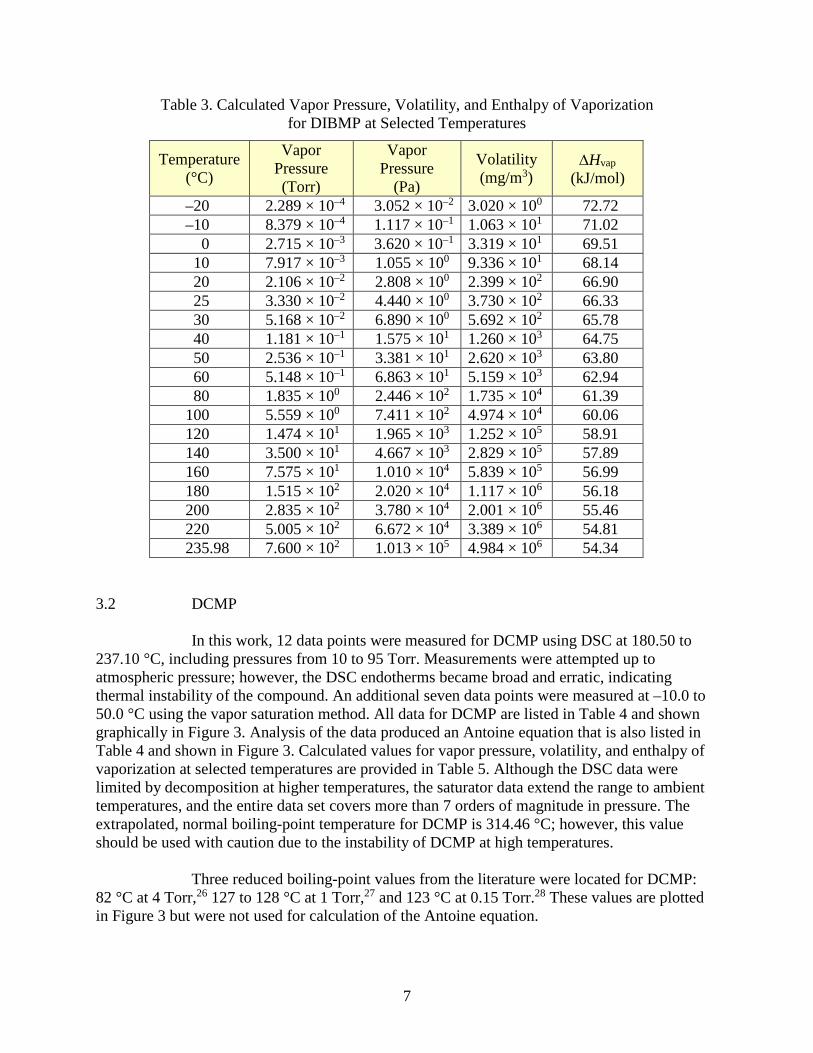
Table 3. Calculated Vapor Pressure, Volatility, and Enthalpy of Vaporization for DIBMP at Selected Temperatures
Temperature (°C)
Vapor Pressure (Torr)
Vapor Pressure
(Pa)
Volatility (mg/m3)
∆Hvap (kJ/mol)
–20 2.289 × 10⁻⁴ 3.052 × 10⁻² 3.020 × 100 72.72 –10 8.379 × 10⁻⁴ 1.117 × 10⁻¹ 1.063 × 101 71.02
0 2.715 × 10⁻³ 3.620 × 10⁻¹ 3.319 × 101 69.51 10 7.917 × 10⁻³ 1.055 × 100 9.336 × 101 68.14 20 2.106 × 10⁻² 2.808 × 100 2.399 × 10² 66.90 25 3.330 × 10⁻² 4.440 × 100 3.730 × 10² 66.33 30 5.168 × 10⁻² 6.890 × 100 5.692 × 10² 65.78 40 1.181 × 10⁻¹ 1.575 × 101 1.260 × 10³ 64.75 50 2.536 × 10⁻¹ 3.381 × 101 2.620 × 10³ 63.80 60 5.148 × 10⁻¹ 6.863 × 101 5.159 × 10³ 62.94 80 1.835 × 100 2.446 × 10² 1.735 × 10⁴ 61.39
100 5.559 × 100 7.411 × 10² 4.974 × 10⁴ 60.06 120 1.474 × 101 1.965 × 10³ 1.252 × 10⁵ 58.91 140 3.500 × 101 4.667 × 10³ 2.829 × 10⁵ 57.89 160 7.575 × 101 1.010 × 10⁴ 5.839 × 10⁵ 56.99 180 1.515 × 10² 2.020 × 10⁴ 1.117 × 10⁶ 56.18 200 2.835 × 10² 3.780 × 10⁴ 2.001 × 10⁶ 55.46 220 5.005 × 10² 6.672 × 10⁴ 3.389 × 10⁶ 54.81 235.98 7.600 × 10² 1.013 × 10⁵ 4.984 × 10⁶ 54.34
3.2 DCMP
In this work, 12 data points were measured for DCMP using DSC at 180.50 to 237.10 °C, including pressures from 10 to 95 Torr. Measurements were attempted up to atmospheric pressure; however, the DSC endotherms became broad and erratic, indicating thermal instability of the compound. An additional seven data points were measured at –10.0 to 50.0 °C using the vapor saturation method. All data for DCMP are listed in Table 4 and shown graphically in Figure 3. Analysis of the data produced an Antoine equation that is also listed in Table 4 and shown in Figure 3. Calculated values for vapor pressure, volatility, and enthalpy of vaporization at selected temperatures are provided in Table 5. Although the DSC data were limited by decomposition at higher temperatures, the saturator data extend the range to ambient temperatures, and the entire data set covers more than 7 orders of magnitude in pressure. The extrapolated, normal boiling-point temperature for DCMP is 314.46 °C; however, this value should be used with caution due to the instability of DCMP at high temperatures.
Three reduced boiling-point values from the literature were located for DCMP:
82 °C at 4 Torr,26 127 to 128 °C at 1 Torr,27 and 123 °C at 0.15 Torr.28 These values are plotted in Figure 3 but were not used for calculation of the Antoine equation.

8
An Antoine fit and a Clausius–Clapeyron fit, both based on the DSC data only, are also shown in Figure 3. Extrapolating the Antoine fit resulted in estimated values at 25 and 0 °C that are more than 4 and 8 orders of magnitude, respectively, lower than the values calculated using the fit based on both data sets. This difference increased as temperature decreased. This effect is due to the narrow temperature range of the DCMP DSC data and its lengthy extrapolation to ambient temperatures. In contrast, the Clausius–Clapeyron fit of the DSC data alone approximates the ambient temperature data more accurately than does the Antoine equation.
Table 4. Experimental Data and Calculated Vapor Pressure Values for DCMP
Temperature (°C)
Experimental Vapor Pressure
Calculated Vapor Pressure Difference
(%)b (Torr) (Pa)a (Torr) (Pa) Vapor Saturation Method
–10.0 2.25 × 10⁻⁶ 3.00 × 10⁻⁴ 2.392 × 10⁻⁶ 3.188 × 10⁻⁴ –5.88 0.0 1.06 × 10⁻⁵ 1.41 × 10⁻³ 1.063 × 10⁻⁵ 1.418 × 10⁻³ –0.49
10.0 4.35 × 10⁻⁵ 5.80 × 10⁻³ 4.136 × 10⁻⁵ 5.515 × 10⁻³ 5.14 20.0 1.52 × 10⁻⁴ 2.03 × 10⁻² 1.432 × 10⁻⁴ 1.910 × 10⁻² 6.12 30.0 4.47 × 10⁻⁴ 5.96 × 10⁻² 4.479 × 10⁻⁴ 5.972 × 10⁻² –0.14 40.0 1.27 × 10⁻³ 1.70 × 10⁻¹ 1.280 × 10⁻³ 1.707 × 10⁻¹ –0.48 50.0 3.38 × 10⁻³ 4.50 × 10⁻¹ 3.379 × 10⁻³ 4.505 × 10⁻¹ –0.05
DSC 180.50 10.4 1387 11.69 1558 –11.00 187.51 14.4 1920 15.58 2077 –7.58 194.19 19.5 2600 20.31 2707 –3.97 195.08 20.2 2693 21.02 2803 –3.91 198.40 25.2 3360 23.89 3185 5.49 204.40 30.3 4040 29.95 3992 1.18 211.35 40.1 5346 38.60 5146 3.90 216.15 49.8 6639 45.77 6102 8.80 223.62 60.3 8039 59.23 7897 1.80 230.64 75.4 10050 74.88 9983 0.69 230.85 75.1 10010 75.40 10050 –0.40 237.10 95.1 12680 92.31 12310 3.02
log(p) = 8.213878 – 2815.767/(t + 213.5220) ln(P) = 23.80592 – 6483.544/(TK – 59.6280)
aExperimental DSC values were calculated from Torr values. b100 × (Pexpt – Pcalc)/Pcalc, where Pexpt is the experimental vapor pressure, and Pcalc is the calculated vapor pressure.

9
Figure 3. DCMP vapor pressure data and Antoine correlations based on all data and
DSC data only, and the Clausius–Clapeyron equation based on DSC data only.
0.000001
0.00001
0.0001
0.001
0.01
0.1
1
10
100
18 20 22 24 26 28 30 32 34 36 38 40
P/To
rr
10000/TK
DSC Data
Saturator Data
Literature Data
Antoine Eqn, All Data
Clausius-Clapeyron Eqn, DSC Only
Antoine Eqn, DSC Only
250 °C 200 °C 150 °C 100 °C 75 °C 50 °C 25 °C 0 °C

10
Table 5. Calculated Vapor Pressure, Volatility, and Enthalpy of Vaporization for DCMP at Selected Temperatures
Temperature (°C)
Vapor Pressure (Torr)
Vapor Pressure (Pa)
Volatility (mg/m3)
∆Hvap (kJ/mol)
–20* 4.611 × 10–7 6.147 × 10⁻⁵ 7.602 × 10⁻³ 92.24 –10 2.392 × 10⁻⁶ 3.188 × 10⁻⁴ 3.793 × 10⁻² 90.12
0 1.063 × 10⁻⁵ 1.418 × 10⁻³ 1.625 × 10⁻¹ 88.22 10 4.136 × 10⁻⁵ 5.515 × 10⁻³ 6.097 × 10⁻¹ 86.50 20 1.432 × 10⁻⁴ 1.910 × 10⁻² 2.039 × 100 84.95 25 2.563 × 10⁻⁴ 3.418 × 10⁻² 3.589 × 100 84.23 30 4.479 × 10⁻⁴ 5.972 × 10⁻² 6.167 × 100 83.54 40 1.280 × 10⁻³ 1.707 × 10⁻¹ 1.706 × 101 82.25 50 3.379 × 10⁻³ 4.504 × 10⁻¹ 4.364 × 101 81.06 60 8.306 × 10⁻³ 1.107 × 100 1.041 × 10² 79.97 80 4.177 × 10⁻² 5.569 × 100 4.937 × 10² 78.03
100 1.709 × 10⁻¹ 2.279 × 101 1.912 × 10³ 76.36 120 5.907 × 10⁻¹ 7.875 × 101 6.271 × 10³ 74.91 140 1.774 × 100 2.365 × 10² 1.792 × 10⁴ 73.63 160 4.736 × 100 6.315 × 10² 4.564 × 10⁴ 72.49 180 1.144 × 101 1.526 × 10³ 1.054 × 10⁵ 71.48 200* 2.539 × 101 3.385 × 10³ 2.240 × 10⁵ 70.57 220* 5.233 × 101 6.977 × 10³ 4.430 × 10⁵ 69.76 240* 1.012 × 102 1.349 × 10⁴ 8.232 × 10⁵ 69.01 260* 1.851 × 102 2.468 × 10⁴ 1.449 × 10⁶ 68.34 280* 3.224 × 102 4.299 × 10⁴ 2.433 × 10⁶ 67.72 300* 5.378 × 102 7.170 × 10⁴ 3.917 × 10⁶ 67.15 314.46* 7.600 × 102 1.013 × 10⁵ 5.399 × 10⁶ 66.77
*Extrapolated.
3.3 IMMP
In this work, 13 IMMP data points were measured using DSC at 77.33 to
188.43 °C. These data were measured over a comparatively broad range of temperatures, and no evidence of decomposition was observed in the thermal curves over the full range of the measurements up to 1 atm. Data have also been measured at 5 to 23 °C using the vapor saturation method. The experimental data for IMMP are listed in Table 6 and shown graphically in Figure 4.
Analysis of the data produced an Antoine equation fit that is listed in Table 6 and
plotted in Figure 4. Calculated values for vapor pressure, volatility, and enthalpy of vaporization at selected temperatures are provided in Table 7. The calculated normal boiling point temperature for IMMP is 186.62 °C.

11
The single literature data point for IMMP, a reduced-pressure boiling point (69 °C at 13 Torr)29 shown in Figure 4, is in poor agreement with the value extrapolated using the current correlation.
Figure 4 includes Antoine and Clausius–Clapeyron fits based on the DSC data
only. The DSC-only Antoine fit resulted in an estimated value at 25 °C that is nearly an order of magnitude lower than the value calculated using the Antoine fit based on both data sets; however, the Clausius–Clapeyron correlation closely matches the Antoine fit based on both data sets.
Table 6. Experimental Data and Calculated Vapor Pressure Values for IMMP
Temperature (°C)
Experimental Vapor Pressure Calculated Vapor Pressure Difference
(%)b (Torr) (Pa)a (Torr) (Pa) Vapor Saturation
5.0 0.120 16.0 0.1259 16.78 –4.67 11.0 0.202 26.9 0.2027 27.02 –0.34 17.0 0.331 44.1 0.3196 42.61 3.56 23.0 0.533 71.1 0.4943 65.90 7.84
DSC 77.33 11.4 1519 12.54 1672 –9.12 82.08 14.5 1933 15.84 2112 –8.48 85.28 17.5 2333 18.47 2463 –5.27 88.96 22.2 2960 21.96 2928 1.07 96.66 29.6 3946 31.19 4158 –5.09
100.52 40.1 5346 36.97 4929 8.47 106.70 49.0 6533 48.17 6422 1.72 113.43 69.8 9306 63.62 8482 9.71 123.19 99.6 13280 93.59 12480 6.42 134.67 147.8 19700 143.8 19170 2.79 148.03 224.9 29980 229.8 30640 –2.14 155.72 300.0 40000 296.9 39590 1.04 188.43 761.7 101600 799.7 106600 –4.75
log(p) = 8.326556 – 2413.702/(t + 256.6031) ln(P) = 24.06537 – 5557.754/(TK – 16.5469)
aExperimental DSC values were calculated from Torr values. b100 × (Pexpt – Pcalc)/Pcalc, where Pexpt is the experimental vapor pressure, and Pcalc is the calculated vapor pressure.

12
Figure 4. IMMP vapor pressure data and Antoine correlations based on all data and DSC data
only, and the Clausius–Clapeyron correlation based on DSC data only.
0.01
0.1
1
10
100
1000
20 22 24 26 28 30 32 34 36 38
P/To
rr
10000/TK
DSC Data
Saturator Data
Literature Data
Antoine Equation, All Data
Antoine Equation, DSC Only
Clausius-Clapeyron Equation, DSC Only
200ºC 150ºC 100ºC 50ºC 25ºC 0ºC

13
Table 7. Calculated Vapor Pressure, Volatility, and Enthalpy of Vaporization for IMMP at Selected Temperatures
Temperature (°C)
Vapor Pressure Volatility (mg/m3)
∆Hvap (kJ/mol) (Torr) (Pa)
–20* 1.334 × 10–2 1.778 × 100 1.285 × 10² 52.90 –10* 3.457 × 10–2 4.610 × 100 3.205 × 10² 52.62
0* 8.321 × 10–2 1.109 × 101 7.431 × 10² 52.36 10 1.875 × 10⁻¹ 2.500 × 101 1.615 × 10² 52.12 20 3.984 × 10⁻¹ 5.312 × 101 3.315 × 10³ 51.90 25 5.692 × 10⁻¹ 7.589 × 101 4.657 × 10³ 51.80 30 8.032 × 10⁻¹ 1.071 × 10² 6.463 × 10³ 51.70 40 1.545 × 100 2.059 × 10² 1.203 × 10⁴ 51.51 50 2.845 × 100 3.794 × 10² 2.148 × 10⁴ 51.33 60 5.044 × 100 6.725 × 10² 3.694 × 10⁴ 51.17 80 1.431 × 101 1.909 × 10³ 9.888 × 10⁴ 50.86
100 3.614 × 101 4.818 × 10³ 2.362 × 10⁵ 50.60 120 8.268 × 101 1.102 × 10⁴ 5.130 × 10⁵ 50.36 140 1.740 × 10² 2.320 × 10⁴ 1.028 × 10⁶ 50.15 160 3.410 × 10² 4.547 × 10⁴ 1.921 × 10⁶ 49.95 180 6.283 × 10² 8.377 × 10⁴ 3.382 × 10⁶ 49.78 186.62 7.600 × 10² 1.013 × 10⁵ 4.032 × 10⁶ 49.72
*Extrapolated.
3.4 IMPA
In this work, six data points were measured for IMPA using DSC at 115.8 to 156.9 °C and are listed in Table 8. The experimental range was severely limited by decomposition at higher pressures. We were unable to measure IMPA data in the ambient range due to its low vapor pressure, which precludes measurement by mass loss, and thermal instability, which makes measurement using thermal desorption methods impossible.
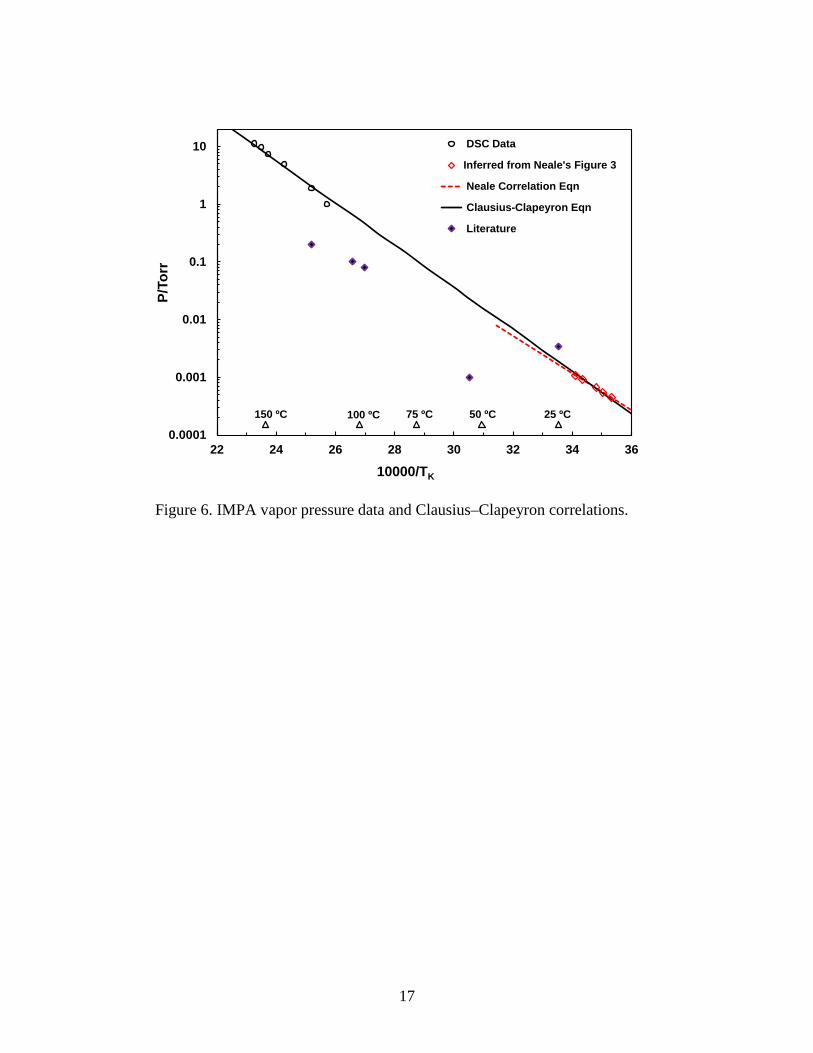
Fortunately, IMPA vapor pressure data, measured using the Knudsen effusion
method in the ambient temperature range, have been reported by Neale,30 who did not include a table of measured data but did provide four values calculated from the experimental data. Also included in Neale’s report was a plot that appears to be the experimental data. We have inferred those five values for Neale’s experimental data points by superimposing estimated values directly onto a photocopy of Neale’s plot and adjusting our values until they overlapped as shown in Figure 5. The inferred values are listed in Table 8 and plotted in Figure 6 with Neale’s correlation. Our DSC data and the new correlation, based on the inferred values and the DSC data, are also shown in Figure 6. Table 8 also lists the four calculated points that were reported by Neale.

14
The new correlation determined using the DSC data and Neale’s inferred values has an unconventional positive curvature (C > 273.15). This suggests that the data sets are not in good agreement, which is likely due to a problem with one or both data sets. As a result, the fit was constrained to a Clausius–Clapeyron equation (no curvature, C = 273.15) that is provided in Table 8.
Table 9 provides the calculated values for vapor pressure, volatility, and enthalpy
of vaporization at selected temperatures that are based on our Clausius–Clapeyron equation. The calculated normal boiling point temperature for IMPA is 277.25 °C. This value should be used with caution due to the instability of IMPA at high temperature and the modest agreement between DSC and effusion data.
Neale’s Figure 3 deserves special attention. A rather obvious typographical error
was discovered when we attempted to superimpose inferred values onto Neale’s figure. It appears to us that 103/T = 3.5 was mislabeled and should actually be 3.6. When corrected, it was found that the values inferred from Neale’s figure closely matched the values calculated using the correlation in Neale’s report.
Four distillation values from the literature, 103 to 104 °C at 0.1 Torr,31 54 to
55 °C at 0.001 Torr,32 97 to 98 °C at 0.08 Torr, 33 and 123 to 125 °C at 0.2 Torr,34 and a value extrapolated to 25 °C using reduced boiling points35 cited by Rosenblatt et al. 36 are shown in Figure 6. None of these values were used for the calculation of the Clausius–Clapeyron correlation.

15
Table 8. Experimental and Calculated Vapor Pressure Values for IMPA
Temperature (°C)
Experimental Vapor Pressure Calculated Vapor Pressure
Difference (%)b (Torr) (Pa)a (Torr) (Pa)
(Calculated) Values in Neale’s Table 1c
Calculated from Clausius–Clapeyron Equation in this Report
15.0 7.0 × 10⁻⁴ 9.33 × 10⁻² 6.951 × 10⁻⁴ 9.267 × 10⁻² 0.71 20.0 1.09 × 10⁻³ 1.45 × 10⁻¹ 1.143 × 10⁻³ 1.524 × 10⁻¹ –4.68 25.0 1.67 × 10⁻³ 2.23 × 10⁻¹ 1.850 × 10⁻³ 2.466 × 10⁻¹ –9.23 30.0 2.52 × 10⁻³ 3.36 × 10⁻¹ 2.946 × 10⁻³ 3.927 × 10⁻¹ –14.46
Values Inferred From Neale’s Figure 3 9.90 4.436 × 10⁻⁴ 5.914 × 10⁻² 4.108 × 10⁻⁴ 5.477 × 10⁻² 7.98
12.32 5.495 × 10⁻⁴ 7.326 × 10⁻² 5.285 × 10⁻⁴ 7.046 × 10⁻² 3.98 14.21 6.622 × 10⁻⁴ 8.829 × 10⁻² 6.415 × 10⁻⁴ 8.552 × 10⁻² 3.23 18.06 9.226 × 10⁻⁴ 1.230 × 10⁻¹ 9.445 × 10⁻⁴ 1.259 × 10⁻¹ –2.32 20.11 1.079 × 10⁻³ 1.439 × 10⁻¹ 1.156 × 10⁻³ 1.541 × 10⁻¹ –6.65
DSC 115.8 1.0 133.3 1.339 178.6 –25.34 123.8 1.9 253.3 2.071 276.1 –8.26 138.9 4.9 653.3 4.502 600.2 8.85 148.2 7.4 986.6 7.063 941.7 4.76 152.5 9.8 1307 8.641 1152 13.41 156.9 11.3 1507 10.58 1410 6.83
log(p) = 9.517280 – 3652.373/(t + 273.15) ln(P) = 26.80712 – 8409.900/TK
aCalculated from Torr values. b100 × (Pexpt – Pcalc)/Pcalc, where Pexpt is the experimental vapor pressure, and Pcalc is the calculated vapor pressure. cValues calculated by Neale were not used for calculation of new correlation equation.

16
Figure 5. Superposition of inferred IMPA data (shown in red, IMPA data in upper right) onto a photocopy of Neale’s Figure 3 (shown in
black, IMPA data identified as ).
0
0.1
0.2
0.3
0.4
0.5
0.6
3 3.2 3.4 3.6
17
Figure 6. IMPA vapor pressure data and Clausius–Clapeyron correlations.
0.0001
0.001
0.01
0.1
1
10
22 24 26 28 30 32 34 36
P/To
rr
10000/TK
DSC Data
Inferred from Neale's Figure 3
Neale Correlation Eqn
Clausius-Clapeyron Eqn
Literature
25 ºC150 ºC 100 ºC 75 ºC 50 ºC
18
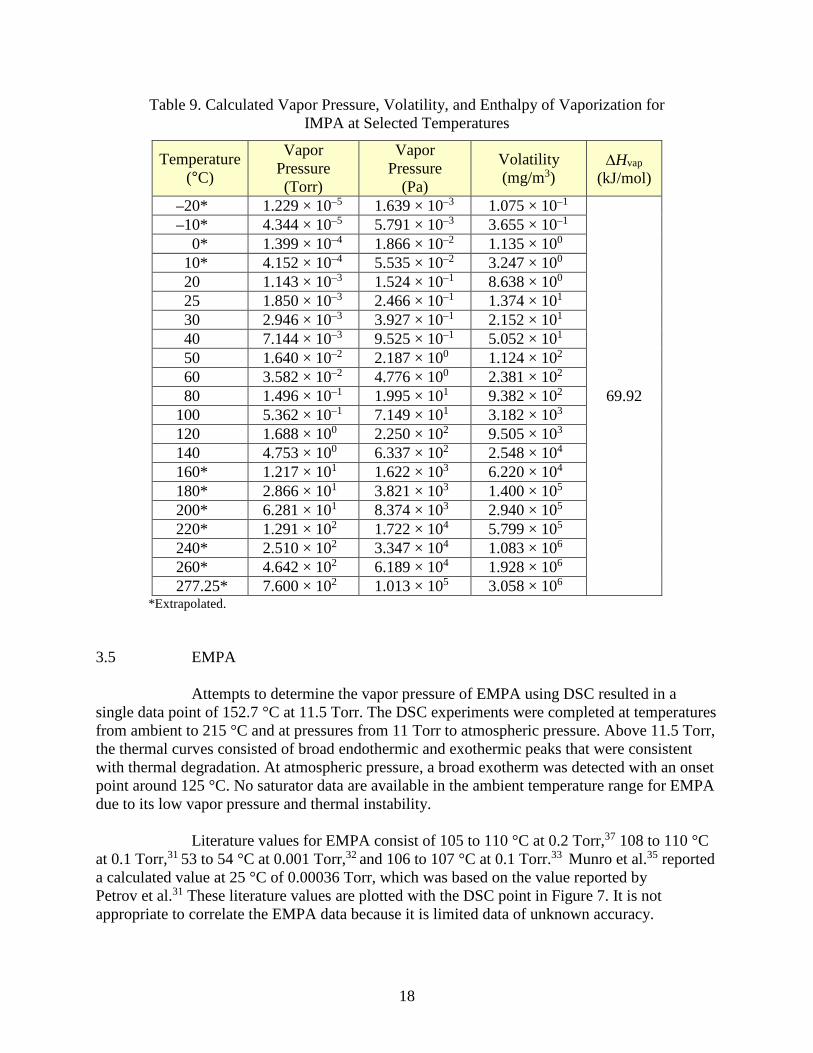
Table 9. Calculated Vapor Pressure, Volatility, and Enthalpy of Vaporization for IMPA at Selected Temperatures
Temperature (°C)
Vapor Pressure (Torr)
Vapor Pressure
(Pa)
Volatility (mg/m3)
∆Hvap (kJ/mol)
–20* 1.229 × 10–5 1.639 × 10⁻³ 1.075 × 10⁻¹
69.92
–10* 4.344 × 10–5 5.791 × 10⁻³ 3.655 × 10⁻¹ 0* 1.399 × 10–4 1.866 × 10⁻² 1.135 × 100
10* 4.152 × 10–4 5.535 × 10⁻² 3.247 × 100 20 1.143 × 10⁻³ 1.524 × 10⁻¹ 8.638 × 100 25 1.850 × 10⁻³ 2.466 × 10⁻¹ 1.374 × 101 30 2.946 × 10⁻³ 3.927 × 10⁻¹ 2.152 × 101 40 7.144 × 10⁻³ 9.525 × 10⁻¹ 5.052 × 101 50 1.640 × 10⁻² 2.187 × 100 1.124 × 10² 60 3.582 × 10⁻² 4.776 × 100 2.381 × 10² 80 1.496 × 10⁻¹ 1.995 × 101 9.382 × 10²
100 5.362 × 10⁻¹ 7.149 × 101 3.182 × 10³ 120 1.688 × 100 2.250 × 10² 9.505 × 10³ 140 4.753 × 100 6.337 × 10² 2.548 × 10⁴ 160* 1.217 × 101 1.622 × 10³ 6.220 × 10⁴ 180* 2.866 × 101 3.821 × 10³ 1.400 × 10⁵ 200* 6.281 × 101 8.374 × 10³ 2.940 × 10⁵ 220* 1.291 × 102 1.722 × 10⁴ 5.799 × 10⁵ 240* 2.510 × 102 3.347 × 10⁴ 1.083 × 10⁶ 260* 4.642 × 102 6.189 × 10⁴ 1.928 × 10⁶ 277.25* 7.600 × 102 1.013 × 10⁵ 3.058 × 10⁶
*Extrapolated. 3.5 EMPA
Attempts to determine the vapor pressure of EMPA using DSC resulted in a single data point of 152.7 °C at 11.5 Torr. The DSC experiments were completed at temperatures from ambient to 215 °C and at pressures from 11 Torr to atmospheric pressure. Above 11.5 Torr, the thermal curves consisted of broad endothermic and exothermic peaks that were consistent with thermal degradation. At atmospheric pressure, a broad exotherm was detected with an onset point around 125 °C. No saturator data are available in the ambient temperature range for EMPA due to its low vapor pressure and thermal instability.
Literature values for EMPA consist of 105 to 110 °C at 0.2 Torr,37 108 to 110 °C
at 0.1 Torr,31 53 to 54 °C at 0.001 Torr,32 and 106 to 107 °C at 0.1 Torr.33 Munro et al.35 reported a calculated value at 25 °C of 0.00036 Torr, which was based on the value reported by Petrov et al.31 These literature values are plotted with the DSC point in Figure 7. It is not appropriate to correlate the EMPA data because it is limited data of unknown accuracy.

19
Figure 7. EMPA experimental vapor pressure data and literature values.
3.6 MPFA
Attempts to determine the vapor pressure of MPFA using DSC were unsuccessful. The DSC experiments were completed at pressures from 10 Torr to atmospheric pressure and covered temperatures from ambient to 240 °C. The thermal curves consisted of erratic endothermic and exothermic peaks, which indicated that the material was undergoing thermal degradation over the entire range studied. Literature values for MPFA include 70 to 72 °C at 2.5 Torr,38 69 to 72 °C at 2 Torr,39 and 60 to 61 °C at 0.5 Torr.32
4. DISCUSSION
The primary purpose of this report was to document vapor pressure measurements for the six title compounds. Complementary data were measured at high temperatures using DSC and in the ambient temperature range using the vapor saturation method for DIBMP, DCMP, and IMMP. These data provide the basis for correlations that were used to estimate values within and beyond the experimental range. The data analysis method used in this report40 enables a detailed
0.0001
0.001
0.01
0.1
1
10
22 24 26 28 30 32 34 36
P/To
rr
10000/TK
DSC Data
Literature
25ºC150ºC 100ºC 75ºC 50ºC

20
assessment of data quality for compounds, even though there may be varying degrees of confidence in those data.
Although low volatility and thermal instability hindered our measurements using
both DSC and vapor saturation methods for IMPA, EMPA, and MPFA, literature data were reported on IMPA by Neale, who used Knudsen effusion at ambient temperatures. We combined Neale’s results with our limited-range DSC data for IMPA, but we were unable to measure meaningful data for EMPA and MPFA. Our unsuccessful efforts with those two compounds are documented herein to inform future efforts, possibly with other methods, in the event they are pursued.
A fundamental principle that guides our vapor pressure work is to measure data
over as wide a range as possible using complementary methods to enhance confidence in the experimental data and to minimize extrapolation beyond the experimental range due to unknown errors associated with predicted values. The data reported herein document valuable examples of three distinct degrees of agreement between experimental data sets. The data also illustrate several common challenges that are associated with handling vapor pressure data including, interpolation within and extrapolation beyond the experimental range, correlation of data as a function of temperature using different equations, correlation of single or complementary data sets, and assessment of literature values.
The vapor pressure of DIBMP was measured over a wide range using
complementary methods. All of the differences between the experimental data and calculated values for DIBMP are less than 5%, which makes the data for this compound among the most precise measured in our laboratory. The Antoine equation C constant for DIBMP of 212.96 indicates that the two data sets align well and produce the expected negative curvature that is characteristic of a wide range of compounds that were studied over the past 3 decades in our laboratory (C = 180 to 230). We feel that interpolation and limited extrapolation of the data, using the correlation presented herein, will produce highly accurate estimates.
The Antoine C constant for DCMP of 213.52 was comparable to that for DIBMP,
which also reflects the expected negative curvature and the good agreement between data measured using complementary methods. Although the DCMP and DIBMP data sets cover comparable ranges, the precision of the DCMP is not as high as that of DIBMP, as judged by the larger differences between the experimental and calculated values. As a result, our confidence in the DCMP data is not as great as that for DIBMP, and extrapolated values may have greater uncertainty.
The next category of data agreement is demonstrated by the correlation for
IMMP. With an Antoine C constant of 256.63, which approaches that of a linear Clausius–Clapeyron equation (C = 273.15), the agreement between the IMMP data sets was judged to be not as good as those of DCMP or DIBMP. This result was unexpected for data covering such a wide pressure range, reflects a greater uncertainty in the IMMP data as compared with DCMP and DIBMP, and suggests that one or both of the IMMP data sets may contain minor errors. It is likely that the errors are systematic in nature because each data set is internally consistent. As a result, extrapolation for IMMP should be performed with caution. The precision of the IMMP

21
data is comparable to that of DCMP, as seen in the percent differences between experimental data and calculated values in Tables 4 and 6.
Analysis of the IMPA data produced a correlation with positive curvature
(C > 273.15), which represents a third case that is thermodynamically prohibited and suggests that the two data sets are not in good agreement. As a result, our fit was constrained to a Clausius–Clapeyron equation (C = 273.15). Due to thermal instability, we were unable to confidently expand the pressure range above 12 Torr for IMPA. It should be noted that the DSC data for IMPA were measured below the recommended low-pressure limit of the method at the time the work was completed. It should also be noted that Neale’s Knudsen IMPA data appear to be in reasonable agreement with three of the reduced-pressure boiling points; agreement with the remaining two distillation points is poor. We assess that more data are needed to provide the basis for accurate estimations of IMPA vapor pressure. Future work may demonstrate that one or both of the existing data sets is flawed. Extrapolation or even interpolation between DSC and literature data should be done with caution for IMPA.
Recent work in our laboratory has significantly expanded the range and accuracy
of the DSC method to lower pressures41 and measurably reduced the uncertainty associated with the low end of the DSC data. However, this improvement does not eliminate the problems associated with data extrapolation. The best practice to minimize extrapolation uncertainty is to measure data over wide temperature ranges, using complementary methods to enhance confidence in both data sets. We recommend this approach for future work.
The thermal instability of EMPA limited DSC measurements to a single data
point (152.7 °C at 11.5 Torr). That value is consistent with literature distillation data and may provide the basis for an order-of-magnitude estimate of vapor pressure in the ambient temperature range.
A compilation by Munro et al.35 cites values at 25 °C for IMPA (0.0034 Torr) and
EMPA (0.00036 Torr) that were extrapolated from higher temperature distillation data; however, no indication was provided that the cited values were extrapolated. The value for IMPA was extrapolated using reduced boiling points of 97 to 98 °C at 0.08 Torr33 and 123 to 125 °C at 0.2 Torr,34 and the value for EMPA was based on a single distillation point of 108 to 110 °C at 0.1 Torr.31 These are significant extrapolations of data with unknown certainty. We believe that the interpolated value for IMPA at 25 °C, presented in this report (0.0018 Torr), is more reliable than the extrapolated value given by Munro et al. because the former is based on experimental methodology that was designed to measure vapor pressure, and the interpolated value is less than 5 °C from what we believe to be the experimental range provided by Neale. It is surprising that the vapor pressure value for the higher molecular weight IMPA (isopropyl moiety) that appears in the Munro document is about an order of magnitude higher than the vapor pressure value of the lower molecular weight EMPA (ethyl moiety). Extrapolated values, based on meager data that are not clearly identified as such, can be misleading if cited sources are not investigated or do not address their experimental uncertainty.
We were unable to measure any usable data for MPFA. The literature distillation data are reasonably consistent but only cover a very narrow range.
22
The principal advantage of measuring data in different temperature ranges using complementary methods is that agreement of the data provides strong evidence that both data sets are accurate. Measuring data over a wide range of temperatures may also eliminate the need to extrapolate to the temperature of interest. The correlations derived in this report for DIBMP, DCMP, and IMMP, with and without ambient temperature data, illustrate the problems associated with extrapolating single-method data beyond the experimental range. It is apparent from close examination of Figures 2, 3, and 4 that relatively small errors in the lower end of the DSC data may lead to significant differences in the extrapolated values when compared with extrapolations that were based on both data sets. This was especially evident when correlation of the DSC data alone was performed with an Antoine versus a Clausius–Clapeyron equation.
The temperature range over which an extrapolation is performed also affects the
accuracy of the predicted value. The lower limit of the DSC data for DCMP is more than 150 °C above ambient, and the values extrapolated to ambient temperature on the basis of DSC data alone are several orders of magnitude lower than the estimate determined using a combination of DSC and saturator data. Although a similar deviation was observed for DIBMP, the extrapolation to ambient temperature is much shorter, and the estimated value is within a factor of 2 of the value estimated using data from both DSC and vapor saturation methods.
Vapor pressure values presented in the literature should be investigated to assess
methodology, sample purity, adequacy of documentation, and data consistency to determine uncertainty. We deem the values presented in literature without identification of the source to be unreliable.
Selection of vapor pressure simulants for testing of developmental CWA
detection and protection equipment relies on accurate knowledge of the vapor pressures of the proposed simulants. Figure 8 shows a plot of the vapor pressures of the compounds in this report compared with the vapor pressures of several standard CWAs. The vapor pressures of the title compounds span the range from the high-volatility G agents to below that of the low-volatility V agents.

23
Figure 8. Vapor pressure comparison for title compounds
and selected CWAs.
5. CONCLUSIONS
This report documents vapor pressure information for DIBMP, DCMP, and IMMP using the DSC method at high temperatures and the vapor saturation method at ambient temperatures. DSC data, accompanied by literature data for IMPA, are also presented. The experimental data were used to determine correlations that enable interpolation, limited extrapolation, and estimation of thermodynamic properties, including the temperature-dependent enthalpy of vaporization and volatility. Agreement between the data, which were measured in different ranges by different methods, provides confidence in the data and suggests that the values extrapolated to untested conditions should be reasonably reliable. Data agreement, which was assessed using correlation methods that were developed in our laboratory, was used to determine data quality and the degree of confidence in extrapolation.
The thermal instability of EMPA limited DSC measurements to a single data
point. DSC measurements for MFPA were unsuccessful. The vapor pressures of the chemicals investigated in this report span the range of
standard CWAs and may be considered as potential vapor pressure simulants, depending on testing criteria and operational requirements.
0.000001
0.00001
0.0001
0.001
0.01
0.1
1
10
100
1000
16 18 20 22 24 26 28 30 32 34 36 38 40 42
P/To
rr
10000/TK
IMMP DSC Data
IMMP Saturator Data
IMMP Antoine Eqn
DIBMP DSC Data
DIBMP Saturator Data
DIBMP Antoine Eqn
IMPA DSC Data
IMPA Literature Data
IMPA Clausius-Clapeyron Eqn
DCMP DSC Data
DCMP Saturator Data
DCMP Antoine Eqn
300°C 250°C 200°C 150°C 100°C 75°C 50°C 25°C 0°C VX
GD
GB
GF

24
As clearly demonstrated by the data herein, lengthy extrapolations on the basis of high-temperature thermal data only may lead to large errors in estimates of values in the ambient temperature range. Although recent work in our laboratory has significantly expanded the range and improved the accuracy of the DSC method at lower pressures, we recommend that future work should include data measured by complementary methods in different temperature ranges whenever possible.

25
LITERATURE CITED 1. Zeffert, B.M.; Coulter, P.B.; Tannenbaum, H. Properties, Interaction and Esterification of
Methylphosphonic Dihalides. J. Am. Chem. Soc. 1960, 82 (15), 3843–3847.
2. Rosenthal, R.W.; Proper, R.; Epstein, J. The Distribution of Some Phosphonofluoridates between Organic Solvents and Water. J. Am. Chem. Soc. 1956, 60, 1596–1598.
3. Harris, B.L. Physical Constants of MCE; Technical Data Memorandum Report 1094; Chemical Warfare Service: Edgewood Arsenal, MD, 1945; UNCLASSIFIED Report (ADB964103).
4. Belkin, F.; Brown, H.A., Jr. Vapor Pressure Measurements of Some Chemical Agents Using
Differential Thermal Analysis, Part I; EATR 4710; Chemical Laboratory, Edgewood Arsenal: Aberdeen Proving Ground, MD, 1973; UNCLASSIFIED Report (AD0525359).
5. Belkin, F.; Brown, H.A., Jr. Vapor Pressure Measurement of Some Chemical Agents Using
Differential Thermal Analysis, Part III; EC-TR-75032; Edgewood Arsenal: Aberdeen Proving Ground, MD, 1975; UNCLASSIFIED Report (ADA010666).
6. Penski, E.C. Vapor Pressure Data Analysis Methodology, Statistics, and Applications; CRDEC-TR-386; U.S. Army Chemical Research, Development and Engineering Center: Aberdeen Proving Ground, MD, 1992; UNCLASSIFIED Report (ADA255090).
7. Brozena, A.; Fielder, D. Vapor Pressure of Methylphosphonic Dichloride: A Compendium; CRDC-SP-85012; U.S. Army Armament, Munitions and Chemical Command: Aberdeen Proving Ground, MD, 1985; UNCLASSIFIED Report (ADA160613).
8. Butrow, A.B.; Fielder, D. Solubility Studies in Support of HD Neutralization; ERDEC-TR-211; Edgewood Research, Development and Engineering Center: Aberdeen Proving Ground, MD, 1994; UNCLASSIFIED Report (ADA285927).
9. Report on Properties of War Gases, Volume 1, G Agents; Chemical Corps Board: Army Chemical Center, MD, 1956; UNCLASSIFIED Report (AD0108456).
10. Samuel, J.B.; Penski, E.C.; Callahan, J.J. Physical Properties of Standard Agents, Candidate Agents, and Related Compounds at Several Temperatures; ARCSL-SP-83015; U.S. Army Chemical Systems Laboratory: Aberdeen Proving Ground, MD, 1983; UNCLASSIFIED Report (ADC033491).
11. Buchanan, J.H.; Buettner, L.C.; Tevault, D.E. Vapor Pressure of Solid Bis(2-chloroethyl) Sulfide. J. Chem. Eng. Data 2006, 51 (4), 1331–1334.
12. Butrow, A.B.; Buchanan, J.H.; Tevault, D.E. Vapor Pressure of Organophosphorus Nerve Agent Simulant Compounds. J. Chem. Eng. Data 2009, 54 (6), 1876–1883.

26
13. Tevault, D.E.; Buchanan, J.H.; Buettner, L.C.; Matson, K.L. Vapor Pressure of Cyclohexyl Methylphosphonofluoridate (GF); ECBC-TR-304; U.S. Army Edgewood Chemical Biological Center: Aberdeen Proving Ground, MD, 2009; UNCLASSIFIED Report (ADA503835).
14. Abercrombie-Thomas, P.L.; Butrow, A.B.; Buchanan, J.H. Selected Physical Properties of 2-Chloroethyl-3-chloropropyl Sulfide (CECPRS); ECBC-TR-804; U.S. Army Edgewood Chemical Biological Center: Aberdeen Proving Ground, MD, 2010; UNCLASSIFIED Report (ADA531948).
15. Tevault, D.E.; Brozena, A.; Buchanan, J.H.; Abercrombie-Thomas, P.L.; Buettner, L.C. Thermophysical Properties of VX and RVX. J. Chem. Eng. Data 2012, 57 (7), 1970−1977.
16. Brozena, A.; Buchanan, J.H.; Miles, R.W., Jr.; Williams, B.R.; Hulet, M.S. Vapor Pressure of Triethyl and Tri-n-propyl Phosphates and Diethyl Malonate. J. Chem. Eng. Data 2014, 59 (8), 2649−2659.
17. Tevault, D.E.; Buettner, L.C.; Crouse, K.L. Vapor Pressure of Methyl Salicylate and n-Hexadecane; ECBC-TR-1184; U.S. Army Edgewood Chemical Biological Center: Aberdeen Proving Ground, MD, 2014; UNCLASSIFIED Report (ADA592343).
18. Abercrombie-Thomas, P.L.; Brozena, A.; Buchanan, J.H.; Ellzy, M.W.; Berg, F.J.; Sumpter, K.B.; Wilcox, P.G.; Tevault, D.E.; Buettner, L.C.; Pardoe, I.J.; Williams, B.R.; Hulet, M.S.; Emmons, E.D. Thermophysical Properties and Spectral Characterization of EA 6043; ECBC-TR-1269; U.S. Army Edgewood Chemical Biological Center: Aberdeen Proving Ground, MD, 2014; UNCLASSIFIED Report (ADA610760).
19. Brozena, A.; Tevault, D.E.; Irwin, K. Vapor Pressure of Thiodiglycol. J. Chem. Eng. Data 2014, 59 (2), 307–311.
20. ASTM International. Standard Test Method for Vapor Pressure by Thermal Analysis; ASTM E 1782; West Conshohocken, PA, 2014.
21. ASTM International. Standard Test Method for Temperature Calibration of Differential Scanning Calorimeters and Differential Thermal Analyzers; ASTM E 967; West Conshohocken, PA, 2014.
22. ASTM International. Standard Test Method for Vapor Pressure; ASTM E 1194; West Conshohocken, PA, 2017.
23. Thomson, G.W. The Antoine Equation for Vapor-Pressure Data. Chem. Rev. 1946, 38 (1), 1–39.
24. Petrov, K.A.; Bliznyuk, N.K. Dialkyl Phosphonates. Soviet Union Patent 129198; 1960.
25. Kamai, G. Esters of Phosphonic Acid. Trudy Kazan. Khim.-Tekhnol. Inst. im. S. M. Kirova 1946, (10), 29–32.
27
26. Acharya, J.; Shakya, P.D.; Pardasani, D.; Palit, M.; Dubey, D.K.; Gupta, A.K. Surface-Mediated Solid Phase Reactions: a Simple, Efficient and Base-Free Synthesis of Phosphonates and Phosphates on Al2O3. J. Chem. Res. 2005, (3), 194–196.
27. Arbuzov, A.E.; Valitova, F.G. Derivatives of Phosphorus Acid that Contain the Cyclohexyl Radical. Izvestiya Akademii Nauk SSSR, Seriya Khimicheskaya 1952, 801–808.
28. Christol, H.; Marty, C. Transesterification de phosphonates par le cyclohexanol et l’alcool pinacolique. Ecole Natl. Super., Montpellier, Fr, Comptes Rendus des Séances de l’Academie des Sciences, Série C; Sciences Chimiques 1966, 262 (21), 1546–1548.
29. Chabrier, P.; Thuong, N.T.; Convert, F. New Method for the Preparation of Asymmetric Diesters of Alkyl and Aralkylphosphonic Acids. Comptes Rendus Hebdomadaires des Séances de l’Academie des Sciences 1964, 259 (14), 2244–2247.
30. Neale, E. The Vapour Pressures of Some Organic Phosphorus Compounds; Porton Technical Paper 341; Porton Down: Wiltshire, England, 1953 (WO 189/679).
31. Petrov, K.A.; Baksova, R.A.; Korkhoyanu, L.V.; Sinogeikina, L.P.; Skudina, T.V. Properties of Phosphonic Anhydrides. I. Alkyl (or Aryl) Hydrogen Methylphosphonates. Journal of General Chemistry USSR (Zhurnal Obshchei Khimii) 1965, 35 (4), 723–728.
32. Neimysheva, A.A.; Savchuk, V.I.; Knunyants, I.L. S-Alkyl Hydrogen Alkyl- and Aryl-Phosphonothioates and Their Derivatives. I. Effect of Induction and Conjugation on Dissociation Constants of Acid Esters. Journal of General Chemistry USSR (Zhurnal Obshchei Khimii) 1966, 36 (3), 520–526.
33. Gryszkiewicz-Trochimowski, E.; Quinchon, J.; Bousquet, M. Note sur la preparation et les propriétés des monoesters de l’acide methylphosphonique. Bulletin de la Societe Chimique de France 1962, 1645–1648.
34. Keay, L. The Preparation and Hydrolysis of Alkyl Hydrogen Methylphosphonates. Can. J. Chem. 1965, 43 (9), 2637–2640.
35. Munro, N.B.; Talmage, S.S.; Griffin, G.D.; Waters, L.C.; Watson, A.P.; King, J.F.; Hauschild, V. The Sources, Fate, and Toxicity of Chemical Warfare Agent Degradation Products. Environ. Health Perspect. 1999, 107 (12), 933–974.
36. Rosenblatt, D.H.; Miller, T.A.; Dacre, J.C.; Muul, I.; Cogley, D.R. Problem Definition
Studies on Potential Environmental Pollutants. II. Physical, Chemical, Toxicological, and Biological Properties of 16 Substances; TR-7509; U.S. Army Medical Bioengineering Research and Development Laboratory, Fort Detrick: Frederick, MD, 1975; UNCLASSIFIED Report (ADA030428).
37. Hudson, R.F.; Keay, L. The Mechanism of Hydrolysis of Phosphonochloridates and Related Compounds. Part II. The Effect of the Solvent. J. Chem. Soc. 1960, 1865–1868.

28
38. Drodz, G.I. Reaction of Alkylfluorophosphinic Acid Esters with Bromine. Journal of General Chemistry USSR (Zhurnal Obshchei Khimii) 1969, 39 (6), 1418.
39. Hoffmann, F.W.; Reeves, A.M. Organic Phosphorus Compounds. VII. The Preparation of Methylphosphonic Chlorofluoride. J. Org. Chem. 1961, 26 (8), 3040–3041.
40. Brozena, A.; Davidson, C.E.; Ben-David, A.; Schindler, B.J.; Tevault, D.E. Vapor Pressure Data Analysis and Statistics; ECBC-TR-1422, U.S. Army Edgewood Chemical Biological Center: Aberdeen Proving Ground, MD, 2016; UNCLASSIFIED Report (AD1022530).
41. Brozena, A. Vapor Pressure of 1-Octanol below 5 kPa Using DSC. Thermochim. Acta 2013, 561, 72−76.
29
ACRONYMS AND ABBREVIATIONS
∆Hvap enthalpy of vaporization CAS Chemical Abstracts Service Csat saturation concentration or volatility CWA chemical warfare agent DCMP dicyclohexyl methylphosphonate DIBMP diisobutyl methylphosphonate DSC differential scanning calorimetry EMPA ethyl methylphosphonic acid IMMP isopropyl methyl methylphosphonate IMPA isopropyl methylphosphonic acid MPFA methyl phosphonofluoridic acid MW molecular weight P pressure (Pa) p pressure (Torr) Pcalc calculated vapor pressure Pexpt experimental vapor pressure R gas constant TK temperature (Kelvin) t temperature (Celsius)

DISTRIBUTION LIST The following individuals and organizations were provided with one Adobe portable document format electronic version of this report: U.S. Army Edgewood Chemical Biological Center (ECBC) Chemical Analysis and Physical Properties Branch RDBC-DRC-P ATTN: Ellzy, M.
Brozena, A. Defense Threat Reduction Agency J9-CBS ATTN: Graziano, A. Peacock-Clark, S. Department of Homeland Security DHS-S&T-RDP-CSAC ATTN: Strang, P. RDCB-PI-CSAC ATTN: Negron, A.
G-3 History Office U.S. Army RDECOM ATTN: Smart, J. ECBC Technical Library RDCB-DRB-BL ATTN: Foppiano, S.
Stein, J. Office of the Chief Counsel AMSRD-CC ATTN: Upchurch, V. Defense Technical Information Center ATTN: DTIC OA ECBC Rock Island RDCB-DES ATTN: Lee, K. RDCB-DEM ATTN: Grodecki, J.