ecasa wp5 workshop outline of the 2 days. outline of workshop general quality assurance matching...
TRANSCRIPT

ECASA WP5 workshop
outline of the 2 days

Outline of workshop
• General quality assurance
• Matching indicators and sites
• Station selection criteria
• Protocols for sampling and sample analyses (book of protocols)
• Study site report (deliverable)
• Anticipated timetable for WP5 work
Review of Procedures
Rather than go through a separate and somewhat redundant review of:
– Sampling for each type of variable,
– Sample Processing for each type of variable,
– Sample Analysis for each type of variable
it's probably more efficient to go through all three aspects together for each variable
→ so I suggest we revise the schedule.........

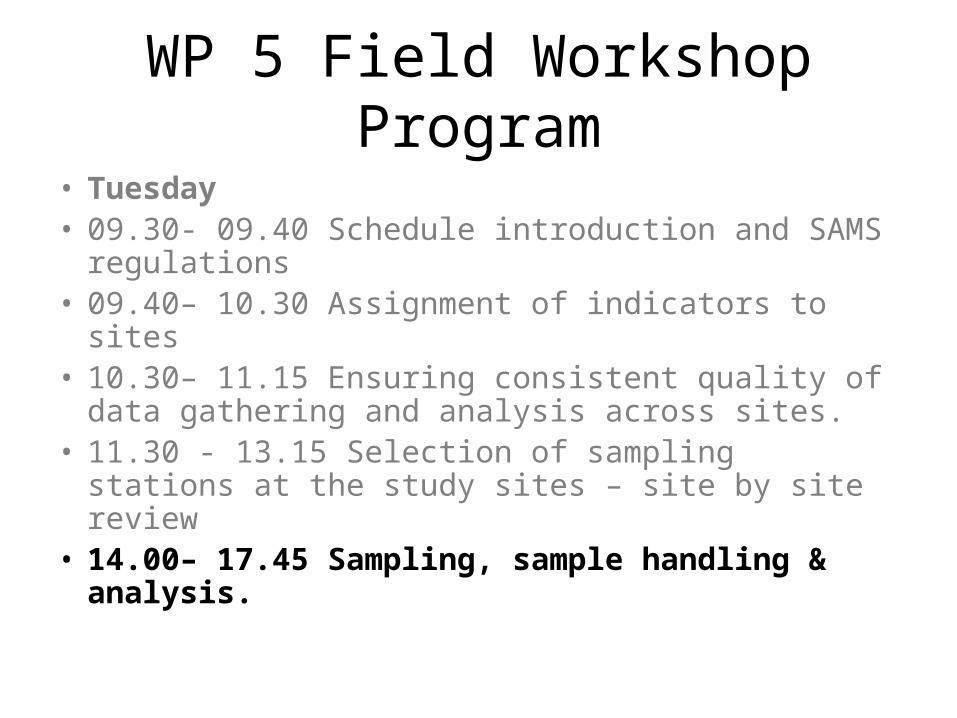
WP 5 Field Workshop Program
• Tuesday• 09.30- 09.40 Schedule introduction and SAMS
regulations• 09.40– 10.30 Assignment of indicators to sites • 10.30– 11.15 Ensuring consistent quality of data
gathering and analysis across sites. • 11.30 - 13.15 Selection of sampling stations at
the study sites – site by site review • 14.00– 17.45 Sampling, sample handling &
analysis.

WP 5 Field Workshop Program
• Wednesday• 09.30 - 11.15 Sampling, sample handling &
analysis, cont. • 11.30 - 13:15 Quality Assurance in sampling and
sample processing• 14.00 - 15.30 Analysis of samples and data • 15.45 - 16.30 Study site report• 16.45 - 17.30 Fieldwork time table & workshop
wrapup

Decisions we need to make
• how to manage quality assurance across sites?
• consistent strategy for selection of stations
• which variables to measure at each station
• acceptable & consistent SOP for each variable
• others...?

WP 5 Field Workshop Program
• Tuesday• 09.30- 09.40 Schedule introduction and SAMS
regulations• 09.40– 10.30 Assignment of indicators to
sites • 10.30– 11.15 Ensuring consistent quality of data
gathering and analysis across sites. • 11.30 - 13.15 Selection of sampling stations at
the study sites – site by site review • 14.00– 17.45 Sampling, sample handling &
analysis.

Selection of Indicators:top-down approach
1. Selection of models to be tested
2. Models describe relationship between drivers, pressures and environmental effects, using indicators of the effects
3. Indicators are selected on basis of their suitability across a variety of environments and aquaculture types
4. Environmental variables are quantified in the field/lab and provide raw data for indicators

Measuring the indicators
• problem: we have not yet selected which models we will use, so the process is not really top-down...
• nonetheless, we will address those indicators that the various subgroups have identified

Indicator categories (& subgroups)
• Water quality
• Sediment geochemistry
• Benthos• (Coastal zone management)• (Genetics)• (Escapees)
• Socio-economic indicators
Suitability of indicators
• Some indicators should be measured at all sites - e.g. secchi, macrobenthos
• Some indicators are suitable/relevant at some, but not all sites - e.g. seagrasses
• Q: Out of the pool of indicators, which should we measure at each: – a) finfish site? – b) shellfish site?

Water Quality Indicators
• Minimum O2 in bottom water ***
• Maximal production with respect to water quality in farm ***
• Fish growth ***
• chl a ***
• Secchi depth **
• Particulate organic carbon (POC) **
• Winter nutrient concentration (DIN & DIP)*

Water Quality Indicatorswhat we'll discuss
• hydrography
• water column profiling - CTD or bottle casts– depth
– temperature
– salinity
– turbidity
– dissolved oxygen
– chl a
• secchi disk depth
• nutrients (N,P)
• suspended particulate matter (SPM)
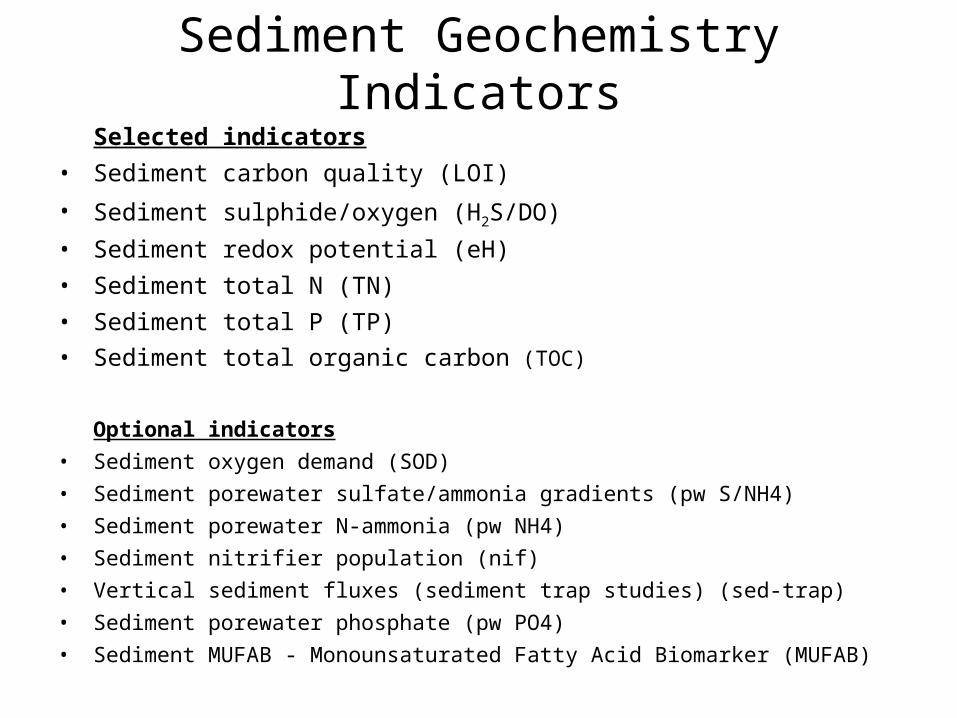
Sediment Geochemistry IndicatorsSelected indicators
• Sediment carbon quality (LOI)
• Sediment sulphide/oxygen (H2S/DO)
• Sediment redox potential (eH)
• Sediment total N (TN)
• Sediment total P (TP)
• Sediment total organic carbon (TOC)
Optional indicators
• Sediment oxygen demand (SOD)
• Sediment porewater sulfate/ammonia gradients (pw S/NH4)
• Sediment porewater N-ammonia (pw NH4)
• Sediment nitrifier population (nif)
• Vertical sediment fluxes (sediment trap studies) (sed-trap)
• Sediment porewater phosphate (pw PO4)
• Sediment MUFAB - Monounsaturated Fatty Acid Biomarker (MUFAB)

Benthos Indicators
• Macrofauna (Univariates) ***
• AMBI and BFI ***
• Existence of macrofauna **
• Meiofauna (Univariates) **
• Multivariates **
• ITI *
• Meiofauna/sediment *
• Trophic groups *

Water Quality Variables
site hydrography CTD chl a Secchi nutrients SPM other
Venice
L. Creran
Vidlin voe
Murcia
Formosa
Bisceglie
Portoroz
Breton
Krka
Saxony
Rhodos
Siteia
Troms
Thau
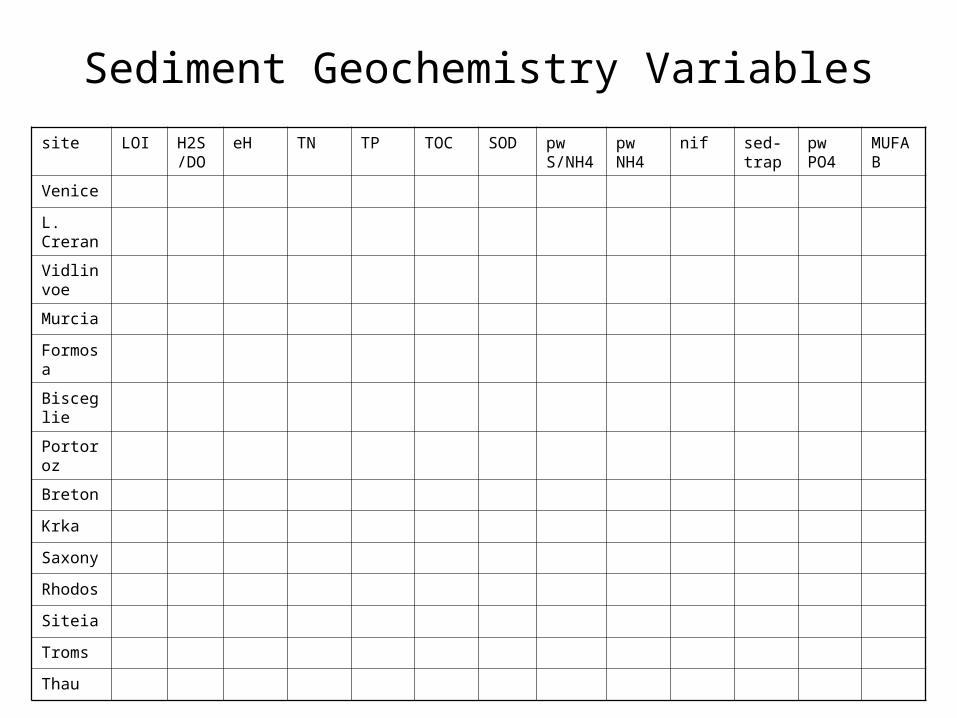
Sediment Geochemistry Variables
site LOI H2S/DO
eH TN TP TOC SOD pw S/NH4
pw NH4
nif sed-trap
pw PO4
MUFAB
Venice
L. Creran
Vidlin voe
Murcia
Formosa
Bisceglie
Portoroz
Breton
Krka
Saxony
Rhodos
Siteia
Troms
Thau

Benthos & Seafloor variables
site macrofauna meiofauna video photo acoustic other
Venice
L. Creran
Vidlin voe
Murcia
Formosa
Bisceglie
Portoroz
Breton
Krka
Saxony
Rhodos
Siteia
Troms
Thau

WP 5 Field Workshop Program
• Tuesday• 09.30- 09.40 Schedule introduction and SAMS
regulations• 09.40– 10.30 Assignment of indicators to sites • 10.30– 11.15 Ensuring consistent quality of
data gathering and analysis across sites. • 11.30 - 13.15 Selection of sampling stations at
the study sites – site by site review • 14.00– 17.45 Sampling, sample handling &
analysis.
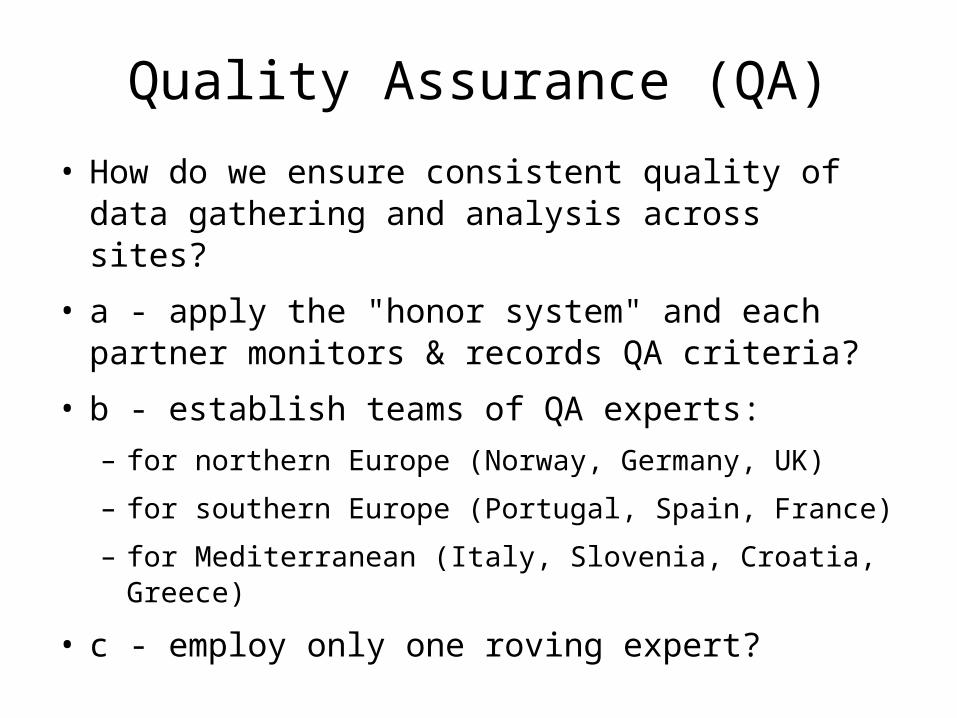
Quality Assurance (QA)
• How do we ensure consistent quality of data gathering and analysis across sites?
• a - apply the "honor system" and each partner monitors & records QA criteria?
• b - establish teams of QA experts:
– for northern Europe (Norway, Germany, UK)
– for southern Europe (Portugal, Spain, France)
– for Mediterranean (Italy, Slovenia, Croatia, Greece)
• c - employ only one roving expert?

WP 5 Field Workshop Program
• Tuesday• 09.30- 09.40 Schedule introduction and SAMS
regulations• 09.40– 10.30 Assignment of indicators to sites • 10.30– 11.15 Ensuring consistent quality of data
gathering and analysis across sites. • 11.30 - 13.15 Selection of sampling stations
at the study sites – site by site review • 14.00– 17.45 Sampling, sample handling &
analysis.
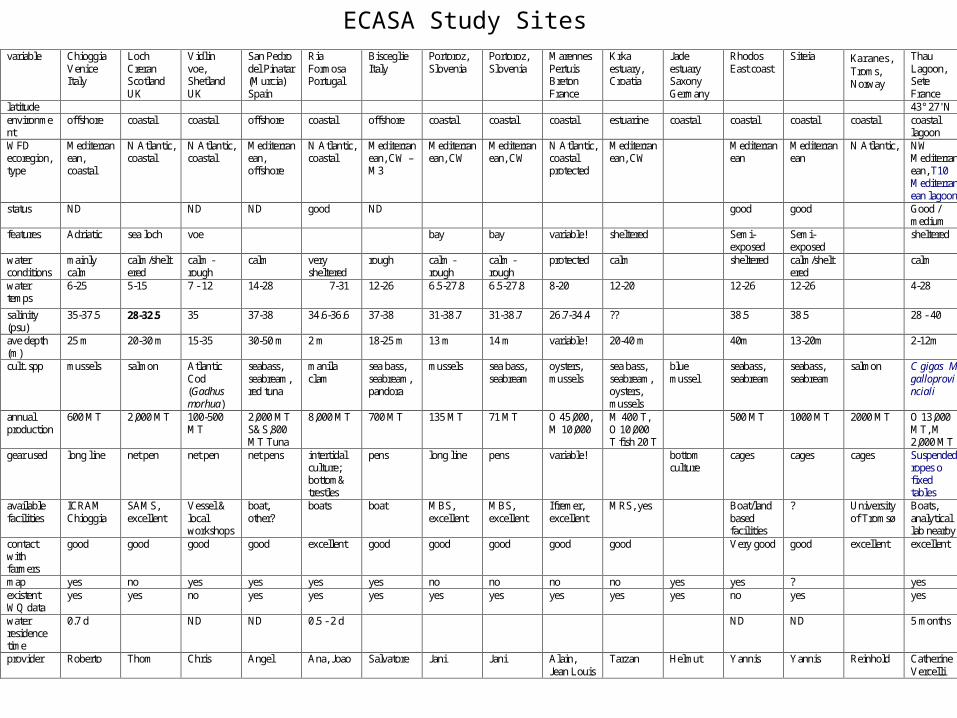
variable Chioggia Venice Italy
Loch Creran Scotland UK
Vidlin voe, Shetland UK
San Pedro del Pinatar (Murcia) Spain
Ria Formosa Portugal
Bisceglie Italy
Portoroz, Slovenia
Portoroz, Slovenia
Marennes Pertuis Breton France
Krka estuary, Croatia
Jade estuary Saxony Germany
Rhodos East coast
Siteia Karanes, Troms, Norway
Thau Lagoon, Sete France
latitude 43° 27' N environment
offshore coastal coastal offshore coastal offshore coastal coastal coastal estuarine coastal coastal coastal coastal coastal lagoon
WFD ecoregion, type
Mediterranean, coastal
N Atlantic, coastal
N Atlantic, coastal
Mediterranean, offshore
N Atlantic, coastal
Mediterranean, CW – M3
Mediterranean, CW
Mediterranean, CW
N Atlantic, coastal protected
Mediterranean, CW
Mediterranean
Mediterranean
N Atlantic, NW Mediterranean, T10 Mediterranean lagoon
status ND ND ND good ND good good Good / medium
features Adriatic sea loch voe bay bay variable! sheltered Semi-exposed
Semi-exposed
sheltered
water conditions
mainly calm
calm/sheltered
calm - rough
calm very sheltered
rough calm - rough
calm - rough
protected calm sheltered calm/sheltered
calm
water temps
6-25 5-15 7 - 12 14-28 7-31
12-26 6.5-27.8 6.5-27.8 8-20 12-20 12-26 12-26 4-28
salinity (psu)
35-37.5 28-32.5 35 37-38 34.6-36.6 37-38 31-38.7 31-38.7 26.7-34.4 ?? 38.5 38.5 28 - 40
ave depth (m)
25 m 20-30 m 15-35 30-50 m 2 m 18-25 m 13 m 14 m variable! 20-40 m 40m 13-20m 2-12m
cult. spp mussels salmon Atlantic Cod (Gadhus morhua)
seabass, seabream, red tuna
manila clam
sea bass, seabream, pandora
mussels sea bass, seabream
oysters, mussels
sea bass, seabream, oysters, mussels
blue mussel
seabass, seabream
seabass, seabream
salmon C gigas M galloprovinciali
annual production
600 MT 2,000 MT 100-500 MT
2,000 MT S&S,800MT Tuna
8,000 MT 700 MT 135 MT 71 MT O 45,000, M 10,000
M 400 T, O 10,000 T fish 20 T
500 MT 1000 MT 2000 MT O 13,000 MT, M 2,000 MT
gear used long line net pen net pen net pens intertidal culture; bottom& trestles
pens long line pens variable! bottom culture
cages cages cages Suspended ropes o fixed tables
available facilities
ICRAM Chioggia
SAMS, excellent
Vessel & local workshops
boat, other?
boats boat MBS, excellent
MBS, excellent
Ifremer, excellent
MRS, yes Boat/land based facilities
? University of Tromsø
Boats, analytical lab nearby
contact with farmers
good good good good excellent good good good good good Very good good excellent excellent
map yes no yes yes yes yes no no no no yes yes ? yes existent WQ data
yes yes no yes yes yes yes yes yes yes yes no yes yes
water residence time
0.7 d ND ND 0.5 - 2 d ND ND 5 months
provider Roberto Thom Chris Angel Ana, Joao Salvatore Jani Jani Alain, Jean Louis
Tarzan Helmut Yannis Yannis Reinhold Catherine Vercelli
ECASA Study Sites

Selection of sampling stations at study sites – site by site review
• Once hydrographical features have been determined, sampling stations are determined on basis of current direction and intensity. Need to account for seasonal variations in dominant current direction and velocity when planning where to sample.
• Transect will be established along prevailing direction of water currents.
• Samples will be taken at station directly below the edge of the cages (station "0") and at 25 and 50m from the edge of the cages along the transect line.
• Control (reference) station will be chosen 1 km upstream from the cages at similar depth and sediment type.

Sampling stations (cont)
• Station "0" will be at the edge of the cages to allow deployment of sampling gear from there or from a boat tied up next to the cages.
• Other stations are distance from the cage edge (0m station).
• Station below center of the cages is not good because it may only be accessed by divers and becomes unusable in future surveys if divers are not available.

Sampling stations (cont)
• In addition to stations 0, 25 and 50m downstream from the edge of the cages, may add additional stations depending on "dispersiveness" of their environment.
• In depositional environments, should sample at 0, 5, 10, 25 & 50m
• At deep dispersive environments should sample at 0, 25, 50 & 75 m or AZE edge stations.
• AZE = "allowable zone of effect "
WP 5 Field Workshop Program
• Tuesday• 09.30- 09.40 Schedule introduction and SAMS
regulations• 09.40– 10.30 Assignment of indicators to sites • 10.30– 11.15 Ensuring consistent quality of data
gathering and analysis across sites. • 11.30 - 13.15 Selection of sampling stations at
the study sites – site by site review • 14.00– 17.45 Sampling, sample handling &
analysis.

Review of Procedures
Rather than go through a separate and somewhat redundant review of:
– Sampling for each type of variable,
– Sample Processing for each type of variable,
– Sample Analysis for each type of variable
it's probably more efficient to go through all three aspects together for each variable
→ so I suggest we revise the schedule.........
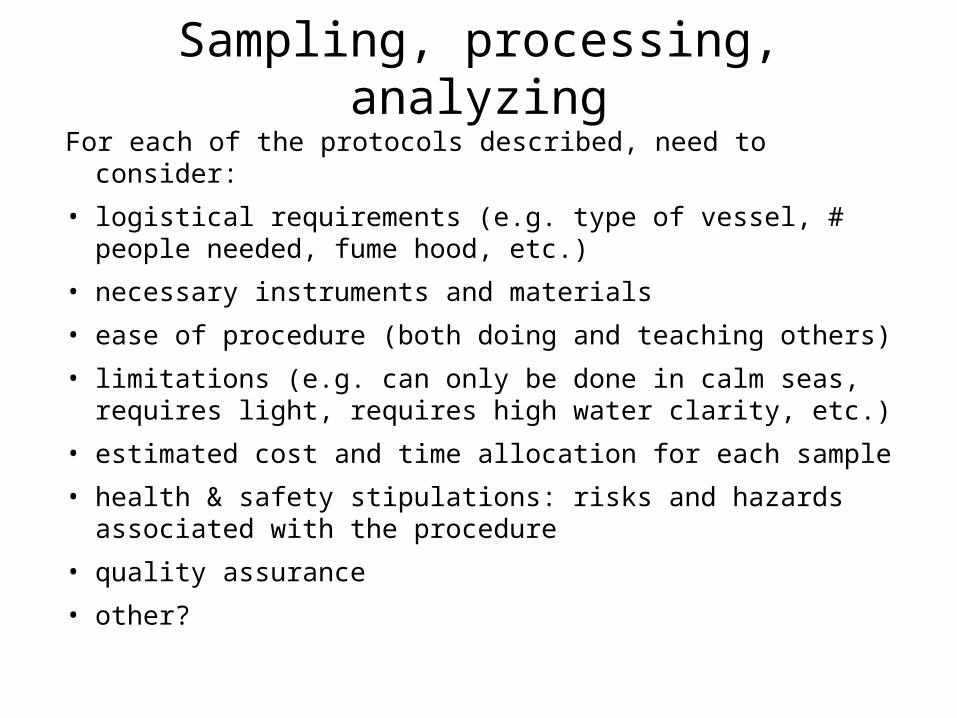
Sampling, processing, analyzing
For each of the protocols described, need to consider:
• logistical requirements (e.g. type of vessel, # people needed, fume hood, etc.)
• necessary instruments and materials
• ease of procedure (both doing and teaching others)
• limitations (e.g. can only be done in calm seas, requires light, requires high water clarity, etc.)
• estimated cost and time allocation for each sample
• health & safety stipulations: risks and hazards associated with the procedure
• quality assurance
• other?
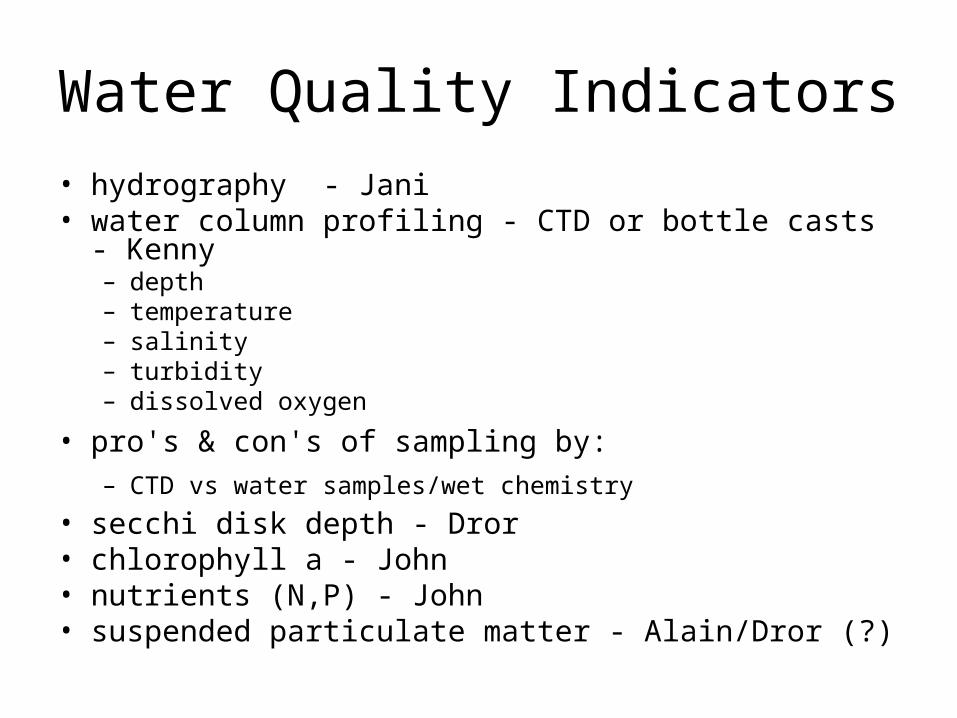
Water Quality Indicators
• hydrography - Jani• water column profiling - CTD or bottle casts - Kenny
– depth– temperature– salinity– turbidity– dissolved oxygen
• pro's & con's of sampling by: – CTD vs water samples/wet chemistry
• secchi disk depth - Dror• chlorophyll a - John• nutrients (N,P) - John• suspended particulate matter - Alain/Dror (?)
Assessing extent of aquaculture effect
• Phytoplankton bioassay - Katerina

Sediments• discuss pro's & con's of sampling by:
– divers or remotely, from boats
– cores vs grabs or box corers
• macrobenthos - Angel
• meiofauna - Katerina
• Sediment carbon quality (LOI) - Thom
• Sediment sulphide/oxygen (H2S/DO) - Thom
• Sediment redox potential (eH) - Roberto
• Sediment total N (TN) - Salvatore
• Sediment total P (TP) - Daniele
• Sediment total organic carbon (TOC) - Roberto

Seafloor surveying
• Visual techniques - Helmut
• photography - Helmut
• acoustic methods - Helmut

WP5 Timetable
site water column work benthos and sediments
Venice
L. Creran
Vidlin voe
Murcia
Formosa
Bisceglie
Portoroz
Breton
Krka
Saxony
Rhodos
Siteia
Troms
Thau
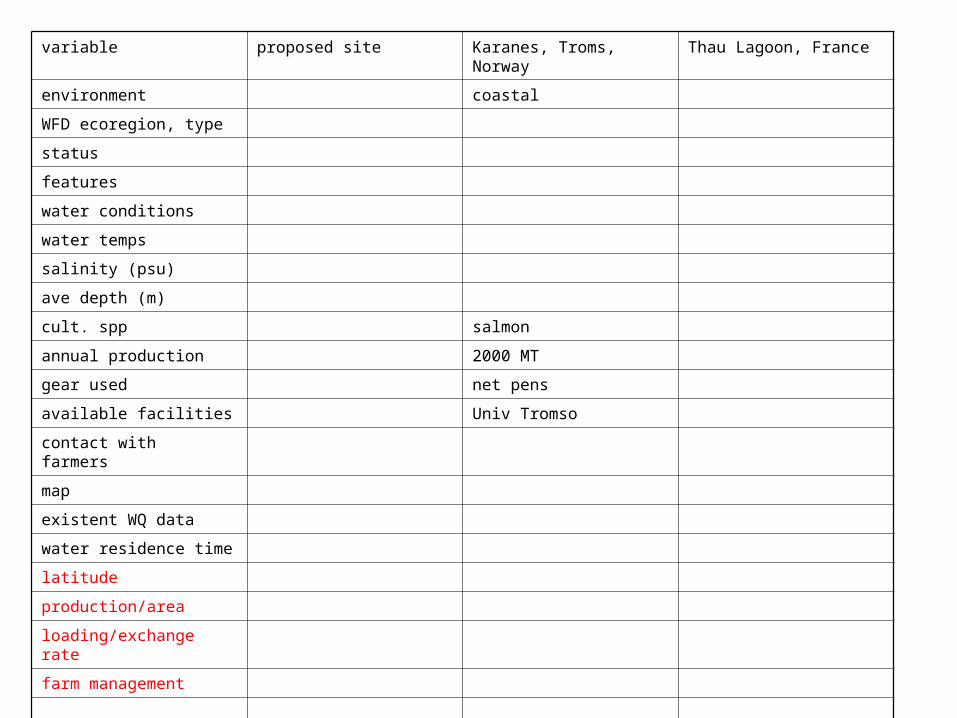
variable proposed site Karanes, Troms, Norway Thau Lagoon, France
environment coastal
WFD ecoregion, type
status
features
water conditions
water temps
salinity (psu)
ave depth (m)
cult. spp salmon
annual production 2000 MT
gear used net pens
available facilities Univ Tromso
contact with farmers
map
existent WQ data
water residence time
latitude
production/area
loading/exchange rate
farm management
provider Reinhold

Angel's task list (10.05)
• Revise the (biological) benthic indicators currently proposed in ECASA (30th September)
• Deselect only indicators that seem to have little utility (30th September).
• Provide WP4 with the remainder of the indicators which will be evaluated against data (in next year surveys)(30th September).
• Collate historical field data (from farm monitoring), from different geographical areas (30th November).
• Check the selected indicators in these areas, comparing the results under different circumstances (production, current velocity, pollutants&), when available (30th January)
• Discuss the results, taking into account the ECASA objectives, trying to propose some indicators which can help in the modelling process for environmental impact assessment (30th January).

Secchi depth• Water clarity is a measurement of how far down light penetrates into
the water column.
• This indicates the amount of suspended particles such as plankton and/or silt in the water.
• Need: Secchi disk (weighted) with rope marked to 5cm resolution . Clothespins
• In the Field
• Record the cloud cover (see Cloud Cover Field Guide).
• Stand so that the sun is to your back (to avoid glare) and so it will be easy to see the Secchi disk where the measurement will be made.
• If you cannot reach the water surface, establish a reference height. This can be a railing, a person’s hip, or the edge of a dock. All measurements should be taken from this point.

Cloud Cover Field Guide

Secchi depth
• Remove sunglasses. Lower the disk slowly into the water until it just disappears.
• Mark the rope with a clothespin at the water surface or at the reference height.
• Raise the disk until it reappears and mark the rope with a clothespin at the water surface or at your reference height.
• The Secchi depth is the average of these two depths. Should repeat this test yourself or have a second viewer replicate the measurement.
• Record depth of Secchi disk disappearance and reappearance, time of day, tide, current condition (strong, mild, or none), wind/wave condition (ripples, small waves, whitecaps), viewer’s initials and any other significant notes.

Suspended Particulate MatterPlymouth Marine Laboratory
• Required - pre-washed, ashed and weighed GF/F 47mm filters prepared as below, stored in clean petri slides, clean forceps, 100% acetone in wash bottle.
• Filter-preparation:
• a. To remove fine loose particles of filter, separate and soak in distilled water for > 1h; agitate and rinse 3-4 times in distilled water.
• b. Partially dry each filter on suction head to remove excess water (this prevents sticking to foil in the next step).
• c. Place filters individually into foil envelope/fan and oven dry overnight.
• d. Carefully number each filter on the exposed margin (soft lead pencil or pre-tested pen) and lay out (slightly overlapping) on foil tray, fit a lid and ash in muffle furnace at 450°C for >4h.
• e. Cool in dessicator; all handling of filters, from this point on, using clean (acetone) forceps only to avoid contamination.
• f. Remove individually and weigh to 5 places, standardising the time it takes to weigh (filters increase in weight as they take up atmopheric moisture), and store place in numbered petri-slides.

Part Org Matt & Tot Part Matt
• Processing of filters for POM and TPM:
• a. Filter through required volume of homogenised material.
• b. Rinse with 0.5M Ammonium formate (31.5 g/l) to remove salt; 10 ml twice through filtered sample and also with water bottle around margin having removed filter head (all with pump running), and return to petrislide.
• c. Oven dry (60°C for 2 days, 40°C for 1 week).
• d. Weigh (from dessicator to 5 places, as above, preferably with the same balance) for total particulates (TPM).
• e. Ash at 450°C in muffle furnace for > 4h
• f. Weigh (from dessicator to 5 places, as above, preferably with the same balance) for for inorganic particulates (PIM).
• g. Do all of the above using at least 10 blank filters (prepared and processed as above, but without sample) for each experimental day (changes in weight before and after experimentation are used to correct for changes in balance calibration and/or filter water content).
• Absolute care in the preparation and processing of these filters as described is essential, for small errors in weight at these stages will significantly bias ratios and other results calculated later. Many experiments have been ruined by lack of attention to the above details!

CHN of Susp Part Matt
• 25mm filters prepared as below, stored in acid-washed petrislides.
• It is necessary to remove all organics and keep free from contamination using gloves and covers etc.
• Filter-preparation:
• Ash at 450°C for >4h, laid out in foil tray with foil cover.
• Cool in dessicator.
• Store in box until required.
• When using: filter material through, then wave filter in HCl vapour for 15 secs to destroy inorganic material (do not rinse filter), then place in numbered acid-washed petri-slide and oven dry at < 40 C.
• Upon removal from oven, seal petri-slide with cover.
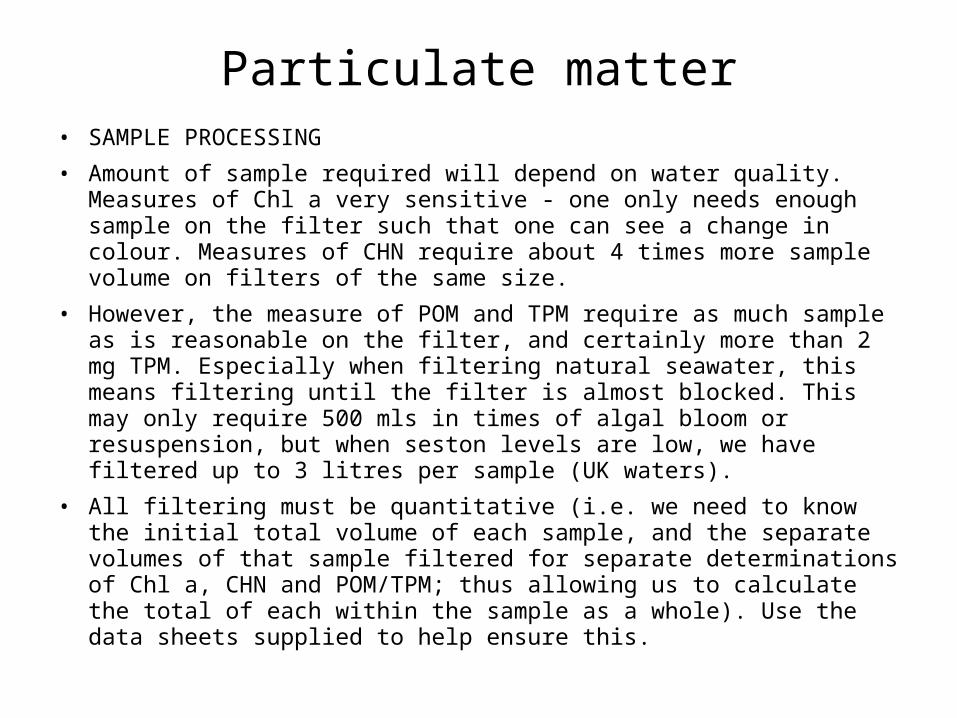
Particulate matter• SAMPLE PROCESSING
• Amount of sample required will depend on water quality. Measures of Chl a very sensitive - one only needs enough sample on the filter such that one can see a change in colour. Measures of CHN require about 4 times more sample volume on filters of the same size.
• However, the measure of POM and TPM require as much sample as is reasonable on the filter, and certainly more than 2 mg TPM. Especially when filtering natural seawater, this means filtering until the filter is almost blocked. This may only require 500 mls in times of algal bloom or resuspension, but when seston levels are low, we have filtered up to 3 litres per sample (UK waters).
• All filtering must be quantitative (i.e. we need to know the initial total volume of each sample, and the separate volumes of that sample filtered for separate determinations of Chl a, CHN and POM/TPM; thus allowing us to calculate the total of each within the sample as a whole). Use the data sheets supplied to help ensure this.

Examples under conditions of average food availability for shellfish
• 1 litre bottle (shake well)
• for TPM, PIM, POM for CHN for Chl a
• 300ml on 47mm GF/F 50ml on 25mm GF/F 10ml on 25mm GF/F
• (rinse w/ NH4 formate) (acid fumes) (no rinse)
• 2 dupl filters 2 dupl filters 2 dupl filters
• Therefore, for each sample, require:
• 2 47mm GFFs (washed, ashed, weighed)
• 2 25mm GFFs (ashed only)
• 2 25mm GFFs (no pretreatment)

Analysis of shellfish faeces
• Each sample may be adjusted to a standard volume (say 22 ml) using filtered seawater. From this:
• 1 animal: 22ml (mix well)
• for TPM, PIM, POM for CHN for Chl a
• 15ml on 47mm GFF 2ml on 25mm GFF 0.5ml on 25mm GFF
• (rinse with NH4 formate) (acid fumes) (no rinse)
• 1 filter only 1 filter only 1 filter only
• Therefore, for each sample of either true or pseudofaeces, need:
• 1x 47mm GFFs (washed, ashed, weighed)
• 1x 25mm GFFs (ashed only)
• 1x 25mm GFFs (no pretreatment)
• After filtering, place all CHN and POM/TPM filters in the low temperature (< 40 C) oven to dry (more than 40 oC will result in loss of lipids). Chl a samples must not be dried; instead, fold in half with material on inner side, and stored in freezer.