ebs/bscr trial run presentation 16 th april 2015
TRANSCRIPT

EBS/BSCR Trial Run Presentation
16th April 2015

Agenda
• Trial Run Timetable• Economic Balance Sheet (EBS)
– Assets / Other liabilities– Technical Provisions
• Best Estimate• Risk Margin
– Discount Rates• BSCR
– EBS as basis for BSCR– Other changes proposed in 2nd April Consultation Paper
2

Timetable
• Trial Run– Launched: 2nd April– Industry meetings: 14th –16th April– Responses due by: Friday, 29th May– BMA analysis of results in: June
• Prudential Standards Rules changes completed by: end June• European Commission ‘Equivalence’ recommendation
expected in: September
• Email all questions to [email protected]– Answers to Frequently Asked Questions posted on website– http://www.bma.bm/market-trial-runs/SitePages/Insurance.
aspx
3

EBS – Basic Principles
• Based on audited GAAP balance sheet– Using ‘fair value’ options wherever possible– Certain Intangible Assets disallowed– Produced on a Consolidated Basis
• Change from existing SFR basis– Technical Provisions on a new ‘EBS’ approach
• See EBS Framework document for more details– and additional Guidance material
4

Legislative approach
• Currently Statutory Financial Statements in the Insurance Accounts Regulations (or Insurance (Group Supervision) Rules)
• The existing SFR basis will be amended to GAAP from end 2016– Project due to commence shortly– May be some adjustments (e.g. eliminate Goodwill etc)– Results in reduced audit costs for many insurers
• EBS is Schedule XIV in the Prudential Rules– Draft legislation issued 22nd January
5

Assets and Other Liabilities- EBS Valuation Hierarchy
• Use of GAAP fair values for Assets and Liabilities other than Technical Provisions :– Assets and liabilities (except Technical Provisions) valued at
‘fair value’ under GAAP (not any non-economic valuation option)
– Consolidation approach• When GAAP does not require an economic valuation approach:
– Use quoted market pries in active markets for the same or similar assets or liabilities;
– Where not possible use quoted market prices in active markets for similar items with adjustments to reflect differences;
– If no quoted market prices use mark-to-model techniques ;– Make maximum use of observable inputs;– No account of own credit standing when valuing liabilities
6

Guidance for selected Balance Sheet Lines
• Intangible Assets and prepayments– Goodwill to be valued at nil– Other intangibles to be measured at a value other than zero
only if they can be sold separately and expected economic value will flow to the insurer
– If the value cannot be measured reliably should be valued at nil
• Contingent Liabilities – To be recognised and valued based on expected present
value of future cash flows– Use option pricing models or other models for cases with
asymmetrical expected outcomes
7

Guidance for selected Balance Sheet Lines
• Income Taxes– Deferred tax assets and liabilities valued on the basis of
differences between tax values and EBS values– Deferred tax assets only recognised where it is probable that
future taxable profits will be available against which the deferred tax asset can be utilised
• Investment in affiliates– Apply GAAP consolidation principles– Apply EBS valuation principles to consolidated and equity
method affiliates– Quoted market price or EBS valuation hierarchy for affiliates
where insurer has neither control nor significant influence
8

Guidance for selected Balance Sheet Lines
• Insurance Risk Transfer– Insurers allowed to apply deposit accounting in line with GAAP• Deferred Acquisition Costs– DAC now implicitly included in technical provisions• Contractual Liabilities treated as Capital in SFR under sections
6C and 56 – Similar treatment may be adopted for the EBS.• Supplementary Notes– Some of the disclosure is for information required for the
eligible capital schedule– Some require more detailed explanation as an attachment– Reconciliation of GAAP equity to Economic capital and surplus
to be done under schedule V(e)
9

Schedule V (e)
• More details??
10

EBS Technical Provisions
• Best Estimate + Risk Margin
• Best Estimate – based on assessment of cash flows required to satisfy the
insurance obligations:– No margins for prudence– Discounted using the relevant risk-free discount curve– Gross of reinsurance with separate assessment of
reinsurance recoveries on a consistent basis
• Risk Margin – Reflects uncertainty associated with Best Estimate– To be based on ‘Cost of Capital’ approach
11
What is a Best Estimate?
• Probability weighted average of future cash flows:– Reflect the full range of potential outcomes
• Allow for Events Not In Data (ENID)– Does not REQUIRE the use of stochastic techniques– Uses unbiased, current assumptions
• Assessed gross of reinsurance• Reinsurance effects considered separately
• Does not include any allowance for prudence
12

Cash Flows
Cash flows to be taken into account until the insurer:•is no longer required to provide coverage•has the right to reassess the risk and set a price that fully reflects the risk, either at individual policy level, or at portfolio level
•Cash flows to be included:– Benefit payments / claims costs– Expenses, including investment costs– Premiums– Reinsurance (both to and from reinsurer)– Other items
•Split by Currency
13

Risk Margin
• Reflects the uncertainty inherent in the best estimate– Business with more uncertainty attracts a higher risk
margin– Longer tailed lines will tend to attract a higher risk
margin than shorter tailed lines• Cost of Capital approach to be used
– Assess how much capital needs to be held each year (on an expected basis) until the business runs off
• Capital is the ECR capital requirement for insurance risk, credit risk and operational risk
– Apply a 6% ‘cost’ to this capital– Discount the costs back to the valuation date at the risk
free discount rate
14

Risk Margin – Example
• Suppose ECR assessed at:– Valuation date : 1,000– Valuation date + 1 year : 300– Valuation date + 2 year : 100
• Cost of Capital (6%) is – 60 for year 1; – 18 for year 2; – 6 for year 3
• If the risk free discount rate is 2% per year, the risk margin would be:– 60 + 18 / (1.02) + 6 / (1.02)2 – = 83.4
15

Risk Margin - 2
• Separate amounts required for P&C and LT business
• Within these levels, no need to further subdivide– Not split between Gross and Net– Not split between Premium and Outstanding Claims
(P&C)– Not split between lines of business
• Takes full account of diversification benefits included in the ECR calculations
• No allowance made for any Market Risks
16

Long-term Risk Margin Calculator
• EBS reporting requires insurers to include a risk margin in addition to the best estimate technical provisions
• The required risk margin is to be determined using the Cost of Capital approach and a cost of capital of 6%.
• Some insurers are unfamiliar with this method. The Risk Margin Calculator is provided as a demonstration of how an insurer might determine an appropriate risk margin.
17

Long-term Risk Margin Calculator
• Summary of Approach– Step 1: For each relevant capital risk, the current and future
base amounts are projected (i.e. reserves for longevity risk).• Future capital requirements for each risk component are
proportionate to the current capital requirement for that component.
– Step 2: For each future year, the total required capital is the sum of the individual components recognizing diversification credit (i.e. using the square root of the sum of the squares approach).
– Step 3: For each year, the cost of capital for that year is 6% of total required capital. The risk margin is the cost of capital for each year discounted at the appropriate risk-free rate.
18

Long-term Risk Margin Calculator
• Required Components– Counterparty Credit Risk– Insurance Risk – Mortality– Insurance Risk – Stop Loss– Insurance Risk – Riders– Insurance Risk – Morbidity and Disability– Insurance Risk – Longevity– Insurance Risk – Variable Annuities– Insurance Risk – Other– Operational Risk
• All other capital requirement components are omitted
19
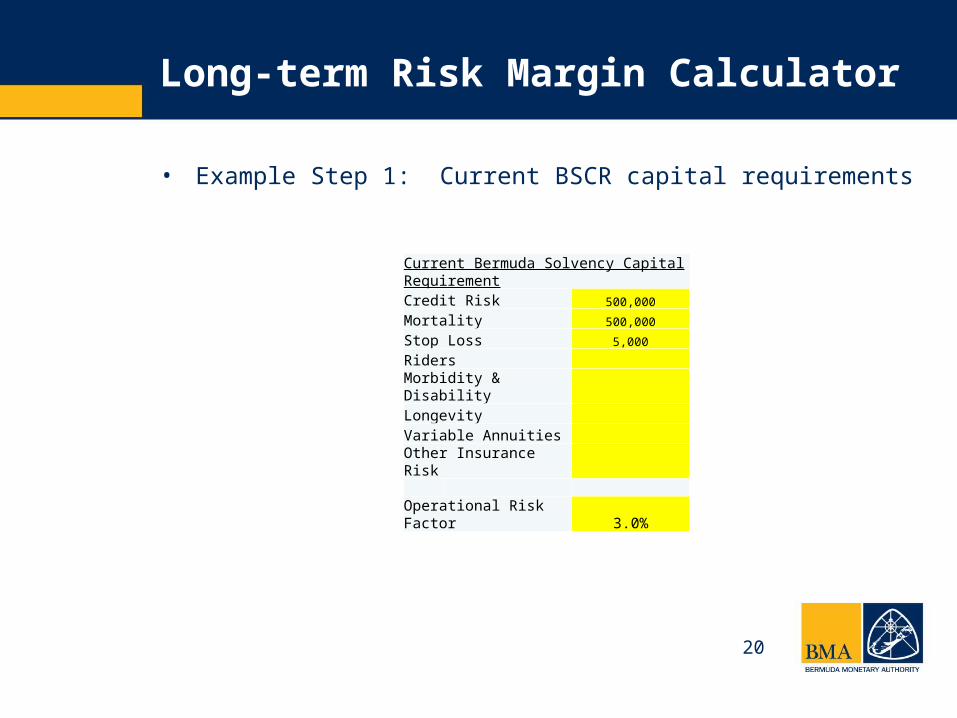
Long-term Risk Margin Calculator
• Example Step 1: Current BSCR capital requirements
Current Bermuda Solvency Capital RequirementCredit Risk 500,000
Mortality 500,000
Stop Loss 5,000
RidersMorbidity & DisabilityLongevityVariable AnnuitiesOther Insurance Risk
Operational Risk Factor 3.0%
20

Long-term Risk Margin Calculator
• Example Step 1: Project Future Base AmountsCredit Risk Mortality Risk Stop Loss
t
Future Credit Risk Amounts
Credit Risk capital
requirement T
Future Net Amount At
Risk
Mortality capital requirement
t
Future Stop Loss Annual Premiums
Stop Loss capital requirement
0 10,000,000 500,000 0 25,000,000 500,000 0 20,000 5,000
1 8,000,000 400,000 1 22,500,000 450,000 1 16,000 4,000
2 6,000,000 300,000 2 20,000,000 400,000 2 12,000 3,000
3 4,000,000 200,000 3 17,500,000 350,000 3 8,000 2,000
4 2,000,000 100,000 4 15,000,000 300,000 4 4,000 1,000
5 0 5 12,500,000 250,000 5 0
6 0 6 10,000,000 200,000 6 0
7 0 7 7,500,000 150,000 7 0
8 0 8 5,000,000 100,000 8 0
9 0 9 2,500,000 50,000 9 0
10 0 10 0 10 0
11 0 11 0 11 0
12 0 12 0 12 0
13 0 13 0 13 0
21

Long-term Risk Margin Calculator
• Example – Step 2 Total Required Capital in Future Years
t Total BSCRBSCR (excl adj and OR)
BMA Approved
Adjustments
Operational Risk
Counterparty Credit
Risk
Insurance Risk -
Mortality
Insurance Risk - Stop
Loss
0 731,971 710,651 21,320 500,000 500,000 5,0001 623,227 605,075 18,152 400,000 450,000 4,0002 517,475 502,403 15,072 300,000 400,000 3,0003 416,996 404,851 12,146 200,000 350,000 2,0004 326,692 317,177 9,515 100,000 300,000 1,0005 257,500 250,000 7,500 0 250,000 06 206,000 200,000 6,000 0 200,000 07 154,500 150,000 4,500 0 150,000 08 103,000 100,000 3,000 0 100,000 09 51,500 50,000 1,500 0 50,000 010 0 0 0 0 0 011 0 0 0 0 0 0
22

Long-term Risk Margin Calculator
• Example Step 3: Determine Cost of Capital and Discount
Risk Margin 189,664.0
Cost of Capital 6.00%
CurrencyUSD
tYield curve
Discounted CoC
Total BSCR
0 N/A N/A 731,971
1 0.465% 43,715 623,227
2 0.989% 36,665 517,475
3 1.460% 29,727 416,996
4 1.815% 23,283 326,692
5 2.076% 17,688 257,500
6 2.293% 13,485 206,000
7 2.471% 10,419 154,500
8 2.636% 7,528 103,000
9 2.774% 4,831 51,500
10 2.896% 2,323 0
11 2.965% 0 0
23

Long-term Risk Margin Calculator
• Additional Considerations
– The Risk Margin Calculator is intended as a demonstration of an approach that might be used by long-term insurers to determine risk margins by the cost of capital method. (i.e. it is a tool to help understand and get comfortable with the CoC method).
– Insurers may to use the tool directly, use their own processes to determine components of the future risk margins and enter them into the model or determine risk margins using their own processes entirely.
24

Interest Rates and Scenarios
25
Discount Rates
• Current practice:– Long-Term reserves are typically calculated by
discounting future cash flows at a single interest rate – perhaps specified by regulation or loosely tied to the assets supporting the liabilities.
– P&C claims reserves typically are not discounted• Economic Balance Sheet:
– Discounting will be used for all best estimate liabilities– A full yield curve will be used that is based on risk-free
interest rates in the appropriate currency– Thus, the one year spot rate will be used to discount
cash-flows one year hence, the two year spot rate for cash-flows two years hence, etc.
26
Risk-free Rates
• We have developed risk-free yield curves for eight major currencies (USD, EUR, GBP, CAD, CHF, JPY, AUD, NZD)– The rates have been built using interest rate swaps of various
durations up to 30 years– We have targeted an Ultimate Forward Rate (UFR) of 4.2% at
year 60 with spot rates then extended to year 100– The results have been calibrated against EIOPA rates for USD
at 12.31.2014 and are generally within 1bp over the first 30 years
– Our approach is technical, highly automated and consistent across all currencies; as a consequence, it makes use of sovereign bond information where swap data is thin;
– We do not expect it to be replicated; companies needing to use risk-free yield curves in other currencies may use other approaches (subject to disclosure / BMA approval)
27

Sample Yield Curve
28

Liquidity Adjustment
• Long-term insurer liabilities are in practice fairly illiquid.• As a result, insurers invest in a variety of corporate bonds
and other higher yielding instruments. – Over time, the spreads should exceed the costs of
defaults and ratings class transitions • Therefore, we have included a liquidity adjustment as an
increment to the risk-free yield curve.– This is based on a portfolio of high grade bonds that
broadly reflects the Bermuda market• Liquidity adjustments for eight currencies have been
provided that reflect yields as 31st December, 2014 and historical default costs (increased by an uncertainty factor)
29

Reserves - Standard Approach
• Under this approach, companies would determine their best-estimate liabilities using: (i) best-estimate assumptions and (ii) cash flows discounted at the risk free rate plus a liquidity adjustment
• For purposes of the Trial Run, default costs are based on EIOPA statistics increased by a 35% uncertainty factor:– The EIOPA default statistics are significantly higher than
the raw data provided by S&P, and there have been claims that the EIOPA method appears to contain some double counting of ratings transitions; we are continuing to study the statistics and may refine our approach.
30

Reserves – Scenario-based Approach
• Many Bermuda reinsurers have highly sophisticated models for managing asset and liability cash-flows.
• The scenario-based approach has been designed to recognize the degree to which assets and liabilities have been matched.
• Under this approach, companies would first estimate their base-case best-estimate liability by determining the amount of assets that provide cash flows to meet the insurance obligation in each future year– For this purpose, asset sales and reinvestments are assumed
in accordance with the company’s investment guidelines– This exercise is repeated under eight alternative scenarios– The reserve is the highest measure among the scenarios
• The effective spread under the discount rate is then easily determined
31

Reserves – Scenario-based Approach(continued)
• The eight alternative scenarios cover a range of yield curve movements (up, down, reverting to normal, various twists, etc.), and have been calibrated at approximately one standard deviation from the base scenario using an economic scenario generator.
• The scenarios are designed so that the reserve will reflect the degree to which liability and asset cash-flows are matched:– To the extent that the assets and liabilities are less than
perfectly matched, future asset sales or reinvestments will be required
– Under certain scenarios, this will prove more costly than under the base case
• It is easily seen that a perfectly matched block of business would generate the same reserve under all scenarios
• Under this approach, companies will be responsible for estimating the default costs for each class of assets
32

Reserves – Which Approach?
• The standard approach is fairly straightforward, and will be appropriate for companies with general business and for smaller blocks.
• The scenario-based approach will be generally appropriate for companies that already have an asset-liability modeling and cash-flow testing capability.
• Because the standard approach is one-size-fits-all, it is by necessity somewhat conservative. We anticipate that the scenario-based approach would generally generate lower (and more accurate) reserves for liabilities that are substantially matched.
• The choice of approach is with the company and can be varied by block of business.– However, for business with significant optionality, we may
require use of the scenario-based approach.
33

Implications for BSCR
34
BSCR
• ECR capital requirement will be calculated based on the EBS• Eligible Capital will be based on the EBS
• The Trial Run is important to assess the implications of this change on the industry
• … and on the BSCR itself– May be necessary to consider recalibration of some risks
in future
• Certain premium / reserves / asset information will continue to requested on the existing unconsolidated basis (except for Groups)
35

Examples
36

Form 4EBS
• Form 4 & Unconsolidated schedules 1. Regular method of reporting2. No Capital Charge
• Form 4EBS and Consolidated schedules 1. Forms include new accounts for EBS reporting2. Capital Charge is applied
37

BSCR
• ECR capital requirement will be calculated based on the EBS
• Eligible Capital will be based on the EBS
• The Trial Run is important to assess the implications of this change on the industry
• … and on the BSCR itself– May be necessary to consider recalibration of some risks
in future
• Certain premium / reserves / asset information will continue to requested on the existing unconsolidated basis (except for Groups)
38

Form 4EBS Example
Regular Schedules New EBS Schedules
New EBS Accounts
39

BSCR New Risk Charges
• There new risk charges for:
• Currency Risk
• Concentration Risk
• Cash and Cash Equivalents
40

Currency Risk
• New Risk charge for assessing the risk an insurer’s liabilities may exceed its assets if currency exchange rates move adversely
• Required to report at least 95% of Form 4EBS total of Assets & Liabilities and split by currency
• Provide Liability and ECR Charge for previous last three years
Note: Liability to ECR Charge is based on the greater of prior year value and average of last three years
41

Currency Risk Example
Liability to ECR Charge / “BSCR Proxy”
95% Threshold
42

Concentration Risk
• New Risk Charge to identify largest ten independent exposures to all instruments
• Cash & Cash Equivalents and Bonds & Debentures are allocated by BSCR Rating 0-8, remaining balances will be applied BSCR factor charge
• For exposures that have more than one BSCR rating, report each BSCR rating separately
43

Concentration Risk Example
44

Cash and Cash Equivalents
• Provide more risk sensitive charge that is similar to the methodology used for the Particulars of Ceded Reinsurance
• Required to report at least ten largest counterparty exposure and apply a BSCR Rating 0-8
• Remaining balance to be consolidated by BSCR Rating
• 40% diversification factor charge
45

Cash and Cash Equivalents Example
Largest ten exposures
Consolidated Exposures
Diversification Adj.
46

QUESTIONS?
47