ebru burcu doĞan - middle east technical...
TRANSCRIPT

ILLUSION OF CONTROL, OPTIMISM BIAS AND THEIR RELATIONSHIP TO RISK-TAKING BEHAVIORS OF TURKISH DRIVERS
EBRU BURCU DOĞAN
SEPTEMBER 2006
E. B. D
OĞ
AN
METU
2006

ILLUSION OF CONTROL, OPTIMISM BIAS AND THEIR RELATIONSHIP TO RISK-TAKING BEHAVIORS OF TURKISH DRIVERS
A THESIS SUBMITTED TO THE GRADUATE SCHOOL OF SOCIAL SCIENCES
OF THE MIDDLE EAST TECHNICAL UNIVERSITY
BY
EBRU BURCU DOĞAN
IN PARTIAL FULFILLMENT OF THE REQUIREMENTS FOR
THE DEGREE OF MASTER OF SCIENCE IN
THE DEPARTMENT OF PSYCHOLOGY
SEPTEMBER 2006

Approval of the Graduate School of Social Sciences Prof. Dr. Sencer Ayata Director I certify that this thesis satisfies all the requirements as a thesis for the degree of Master of Science. Prof. Dr. Nebi Sümer
Head of Department This is to certify that we have read this thesis and that in our opinion it is fully adequate, in scope and quality, as a thesis for the degree of Master of Science. Assoc. Prof. Dr. Timo Lajunen Supervisor Examining Committee Members Assoc. Prof. Dr. Bengi Öner-Özkan (METU, PSY)
Assoc. Prof. Dr. Timo Lajunen (METU, PSY)
Assoc. Prof. Dr. Yeşim Yasak (Gazi Ü., Fen Bilimleri Ens.)
iii
I hereby declare that all information in this document has been obtained and presented in accordance with academic rules and ethical conduct. I also declare that, as required by these rules and conduct, I have fully cited and referenced all material and results that are not original to this work. Name, Last name: Ebru Burcu Doğan
Signature :

iv
ABSTRACT
ILLUSION OF CONTROL, OPTIMISM BIAS AND THEIR RELATION TO
RISK-TAKING BEHAVIORS OF TURKISH DRIVERS
Doğan, Ebru Burcu
M.S., Department of Psychology
Supervisor: Assoc. Prof. Dr. Timo Lajunen
September 2006, 90 pages
The aim of the represent research was to investigate the relationship between
illusion of control, optimism bias, locus of control, and drivers’ risk-taking behavior
among Turkish drivers. A total of 307 drivers completed the Driver Behavior
Questionnaire, the Driver Skills Inventory, the Optimism Bias Scale, the
Multidimensional Traffic Locus of Control Scale, and Rotter’s Internality
Externality Scale. In chapter one, comparison between perceived risk as driver and
perceived risk as passenger demonstrated existence of illusion f control among
drivers. Drivers’ risk assignments were different when imagining themselves as
drivers and passenger. Illusion of control was found to be related to the total
number of accidents, especially involvement in active accidents. This indicates a
positive relationship between illusion of control and risk-taking behavior. In the
second chapter, optimism bias was found in drivers’ risk likelihood estimations for
accident involvement in the future. Drivers estimated their risk of being involved in
four types of accidents as less than an average driver. Optimism bias was related to
self-reported violations and strong evaluation of driving and safety skills as strong.
Young and novice drivers were more realistic in their risk estimations. In the third
chapter, relationship between locus of control and risk-taking was investigated.
Only fate scale correlated with violations. Drivers who attribute accident causes to

v
fate were more likely to commit violations. The limitations of the current research
and implications for further research were discussed.
Keywords: Illusion of control, Optimism bias, Locus of control, Risk-taking
behavior.
vi
ÖZ
KONTROL İLLÜZYONU, İYİMSERLİK YANLILIĞI VE BUNLARIN
SÜRÜCÜLERİN RİSK ALMA DAVRANIŞLARINA ETKİLERİ
Doğan, Ebru Burcu
Yüksek Lisans, Psikoloji Bölümü
Tez Yöneticisi: Doç. Dr. Timo Lajunen
Eylül 2006, 90 sayfa
Bu çalışmanın amacı, Türk sürücülerinde kontrol illüzyonu, iyimserlik
yanlılığı, kontrol odağı ve sürücülerin risk alma davranışları arasındaki ilişkiyi
incelemektir. Toplam 307 sürücü Sürücü Davranışlası Ölçeği (SDÖ), SDÖ-
algılanan control, SDÖ-algılanan risk, Sürücü Becerileri Envanteri,
Çokboyutlu Trafik Kontrol Odağı Ölçeği ve Rotter İç Dış Kontrol Odağı
Ölçeği’ni doldurdu. Birinci bölümde, SDÖ-algılanan risk ölçeğine uygulanan
t-testi analizleri sürücülerde kontrol illüzyonunun varlığını gösterdi.
Sürücülerin risk değerlendirmeleri kendilerini sürücü ve ön koltuk yolcusu
olarak düşündüklerinde farklılaştı. Kontrol illüzyonu toplam kaza sayısıyla,
özellikle aktif kaza sayısıyla, ilişkili bulundu. Bu, kontrol illüzyonu ve risk
alma davranışı arasında olumlu ilişki olduğunu gösterir. İkinci bölümde, t-testi
analizleri sürücülerin gelecekte kaza geçirme olasılıkları tahminlerinde
iyimserlik yanlılığı gösterdiklerini ortaya koydu. Sürücüler, verilen dört kaza
çeşidini geçirme olasılıklarını ortalam bir sürücününkinden daha düşük tahmin
ettiler. İyimserlik yanlılığı, yüksek ihlal davranışıyla ve sürüş ve güvenlik
becerilerinin güçlü olarak değerlendirmesiyle ilişkili bulundu. Genç ve
deneyimsiz sürücülerin risk tahminlerinde daha gerçekçi değerlendirmeler

vii
yaptığı bulundu. Üçüncü bölümde, kontrol odağı ve risk alma davranışı
arasındaki ilişki incelendi. Sadece kadercilik ölçeği ihlal davranışlarıyla ilişkili
bulundu. Kaza sebeplerini kadere atfeden sürücüler güvenli sürüşü ihlal
etmeye daha yatkın bulundular. Bu araştırmanın sınırlılıkları tartışılarak ileriki
araştırmalar için doğurguları ele alınmıştır.
Anahtar Sözcükler: Kontrol illüzyonu, İyimserlik yanlılığı, Kontrol odağı, Riak
alma davranışı

viii
To Life

ix
ACKNOWLEDGMENTS
I would like to offer my gratitude to my dear supervisor Associate Professor Timo
Lajunen, without whose academic and social support this thesis could not have been
completed. You have been a model of hardiness and of progress for me. I am
indebted to your constructive criticism and supportive attitude in every phase of my
work. I believe that I will not frustrate you about your opinion of me.
To Associate Professor Bengi Öner-Özkan and Associate Professor Yeşim Yasak, I
would like to thank for their valuable comments and feedback on my thesis. It has
been honor to work with you.
I would like to thank to Türker Özkan, who has been guiding me from the very first
day I met Traffic Psychology. You have been beside me for three years with your
motivating words and encouraging manner whenever I felt sinking. I hope I will be
able to guide prospective students as excellent as you did me.
I would like to offer my special thanks to Jolieke Mesken for her comments and
corrections in English text. It was kindness of you to invest your time on me, when
you did not have to do it. As the first Dutch I have ever met, I am impressed by
your friendly attitude.
I would like to thank to my friends for their unlimited and unconditional support
through out the thesis process. They have been beside whenever I was in need.
I would like to offer my special thanks to my family for their unconditional support
and reassurance, which enabled me to sail the larger and the farther seas than I have
been playing through my childhood.

x
TABLE OF CONTENTS
PLAGIARISM.......................................................................... iii ABSTRACT.................................................................................................... iv
ÖZ....................…………......................................................................…..... vi
DEDICATION.………........................................................................…..... viii
ACKNOWLEDGMENTS……………………………………………........... ix
TABLE OF CONTENTS................................................................................. x
LIST OF TABLES........................................................................................ xiv
GENERAL INTRODUCTION........................................................................ 1
1. Risk and Risk Theories................................................................................. 1
2. Illusion of Control........................................................................................ 6
2.1. Illusion of Control and Risk Taking......................................……... 8
3. Optimism Bias..…...................................................................................... 12
3.1. Optimism Bias and Risk Taking.......…...........…........................... 14
4. Adaptive Importance of Positive Illusions................................................. 16
5. Locus of Control..….................................................….............................. 17
5.1. Locus of Control and Risk Taking............................….................. 18
6. Aims and Hypotheses..…………………………………………………... 21
1. ILLUSION OF CONTROL...............……................................................. 22
1.1. INTRODUCTION........……................................................................... 22
1.2. METHOD................................................................................................ 22
1.2.1. Measures...................................................................................... 22
1.2.1.1. Driver Behaviour Questionnaire………………………..... 22
1.2.2.2. Driver Skill Inventory......................................................... 23
1.2.1.3. Illusion of control...………………………………….…… 24
1.2.1.4. Perceived control………………………………...……….. 26

xi
1.2.1.5. Risk-taking…..…..……………………………………….. 26
1.2.2. Participants…………………………………………………...... 26
1.3. RESULTS................................................................................................ 27
1.3.1. Factor Analysis…….................................................................... 27
1.3.1.1. Factor Structure of DBQ……............................................. 27
1.3.1.2. Factor Structure of DBQ-Perceived control…………....... 28
1.3.1.3. Factor Structure of DBQ-Perceived risk as driver.............. 30
1.3.1.4. Factor Structure of DBQ-Perceived risk as passenger........ 31
1.3.1.5. Factor Structure of Driver Skill Inventory.......................... 33
1.3.2. Comparisons between perceived risk as driver and as
passenger................................................................................................ 34
1.3.3. Correlation Analysis.................................................................... 35
1.3.4. Frequency Analyses..................................................................... 37
1.4. DISCUSSION.......................................................................................... 38
2. OPTIMISM BIAS...............................……................................................ 40
2.1. INTRODUCTION…........................……............................................... 40
2.2. METHOD................................................................................................ 40
2.2.1. Measures...................................................................................... 40
2.2.1.1. Direct Optimism Bias Measure........................................... 40
2.2.1.2. Indirect Optimism Bias Measure........................................ 41
2.2.2. Participants…………………………………………………...... 42
2.3. RESULTS................................................................................................ 42
2.3.1. Descriptive Statistics and comparison between self-risk ratings
and other-risk ratings....................................................................... 42
2.3.2. Analysis of Variance…………………………............................ 43
2.3.3. Correlation Analysis………………………………………….... 44
2.4. DISCUSSION.......................................................................................... 45

xii
3. CHAPTER THREE..........................……….............................................. 47
3.1. INTRODUCTION..........................………............................................. 47
3.2. METHOD................................................................................................ 47
3.2.1. Measures ..................................................................................... 47
3.2.1.1. Rotter’s internality externality scale……..….................. 47
3.2.1.2. Multidimensional traffic locus of control scale............... 48
2.2. Participants.…………………………………………………........ 48
3.3. RESULTS................................................................................................ 49
3.3.1. Factor Analysis............................................................................ 49
3.3.1.1. Multidimensional traffic locus of control scale................ 49
3.3.2. Correlation Analysis.................................................................... 50
3.4. DISCUSSION......................................................................................... 51
4. GENERAL RESULTS.........................…….............................................. 54
4.1. INTRODUCTION...........................……................................................ 54
4.2. METHOD................................................................................................ 54
4.2.1. Measures...................................................................................... 54
4.2.2. Participants.................................................................................. 54
4.3. RESULTS................................................................................................ 55
4.3.1. Correlation Analysis.................................................................... 55
4.3.2. Logistic Regression Analysis...................................................... 56
4.4. DISCUSSION......................................................................................... 59
4.5. GENERAL DISCUSSION..................................................................... 62
REFERENCES............................................................................................... 64
APPENDICES................................................................................................ 75
A. Demographic Information Sheet...................................................... 75
B Driver Behavior Questionnaire original and perceived contro.l........ 77
C. Driver Behavior Questionnaire- perceived risk................................ 80

xiii
D. Driver Skill Inventory....................................................................... 82
E. Direct Optimism Bias Measure......................................................... 83
F. Indirect Optimism Bias Measure....................................................... 84
G. Multidimensional Traffic Locus of Control Scale............................ 86
H. Rotter’s Internality Externality Scale................................................ 88

xiv
LIST OF TABLES
1. ILLUSION OF CONTROL
Table 1.3.1.1. Factor loadings, communalities (h2), percents of variance for
principal axis factoring and varimax rotation on DBQ items................ 28
Table 1.3.1.2. Factor loadings, communalities (h2), percents of variance for
principal axis factoring and varimax rotation on DBQ-perceived control
items....................................................................................................... 29
Table 1.3.1.3. Factor loadings, communalities (h2), percents of variance for
principal axis factoring and varimax rotation on DBQ-perceived risk as
driver items.…………………………………………………………... 30
Table 1.3.1.4. Factor loadings, communalities (h2), percents of variance for
principal axis factoring and varimax rotation on DBQ-perceived risk as
passenger items……………………………………………………….. 32
Table 1.3.1.5. Factor loadings, communalities (h2), percents of variance for
principal axis factoring and varimax rotation on DSI items….............. 33
Table 1.3.3.1. Correlations among illusion of control, perceived control, and
background variables...……………………………………………...... 36
Table 1.3.3.2. Correlations among illusion of control, perceived control on
violations, driving skills, and safety skills........................…..………... 37
OPTIMISM BIAS
Table 2.3.1.1. Means (SDs) of the D and ID measures of optimism bias for accident
types…………………………………………………………………... 43
Table 2.3.3.1. Correlation analysis between optimism bias variables, background
variables, and violations ……………………………………….…….. 44

xv
Table 2.3.3.2. Correlation analysis among optimism bias variables and driving and
safety skills…….…………………………………………….….......... 45
LOCUS OF CONTROL
Table 3.3.1.1. Factor loadings, communalities (h2), percents of variance for
principal axis factoring and varimax rotation on T-LOC items....……. 50
Table 3.3.2. Correlations among locus of control variables, background variables,
and violations…………………………………………………………. 51
GENERAL RESULTS
Table 4.3.1. Correlations among illusion of control, perceived control, optimism
bias variables, locus of control scales……………………………….... 55
Table 4.3.2.1. Direct logistic regression analysis on total number of total
accidents................................................................................................. 57
Table 4.3.2.2. Direct logistic regression analysis on total number of total tickets.. 58
1
* In Turkey fatality statistics are based on on-spot rule. Traffic accident victims dying in hospitals are not considered to die due to traffic accident.
GENERAL INTRODUCTION
1. Risk and Risk Theories
According to World Health Organization’s (WHO) statistics, more than 1.2 million
people die in road traffic accidents per year in the world, while around 50 million of
them are injured or disabled. Almost half of the victims are pedestrians, cyclists,
and motorcyclists.
In Turkey, 407,103 accidents occurred in 2002. Two thousand and nine hundred
people died in consequence of these accidents and 94,225 people were injured
(Trafik İstatistik Yıllığı, 2002)*. Turkey was the third country in the annual number
of traffic accidents among other European countries (IRTAD, 2001; in Annual
Traffic Statistics, 2002). Besides their immediate results for the victim, traffic
crashes have distal consequences for society. Traffic crashes damage public
property, result in loss of educated labor force, and most of the time families of the
victims are influenced both psychologically and financially. According to WHO
statistics, traffic crashes cost up to 4 % of their countries Gross National Product
(GNP).
Traffic accidents might be due to several factors; such as vehicle characteristics,
environment, and driver or the interaction of these. Yet, driver characteristics
constitute the highest proportion. According to analyses of Lewin (1982), the
human factor contributes to traffic accidents up to 90 %. Not all of these accidents
are due to errors. Sometimes drivers deliberately deviate from safe driving (Reason,
Manstead, Stradling, Baxter, & Campbell, 1990). Deviation might be due to several
factors; such as daily necessities (e.g. trying to catch an appointment) to personality
2
characteristics (e.g. sensation seeking), motivation, and cognitive biases. In any
case, deviation from safe driving increase risk beyond that can be expected due to
natural components of an event.
Risk and subsequent behavioral change has been a central concept in safety
research. Risk can be defined as any situation that might end up with negative
consequence. Risk involves two components: likelihood and severity of negative
outcome (van der Pligt, 1996). Risk is approached as a multidimensional subjective
construct. Psychometric studies in the end of 1970s (Fischoff, Slovic, Lichtenstein,
Read, & Combs, 1978; cited in Kobbeltvedt, Brun, & Laberg, 2004) proved nine
dimensions as primary for risk perception: (1) involuntariness of exposure, (2)
immediacy of effects, (3) lack of precise knowledge about risk levels, (4) lack of
scientific knowledge, (5) uncontrollability, (6) newness, (7) catastrophic potential,
(8) feelings of dread, and (9) fatal consequences. Nine dimensions revealed two
higher order factors: dread risk and unknown risk. Dread risk is characterized by
perceived lack of control, catastrophic potential, fatal consequences, and feelings of
dread. Unknown risk is characterized by unobservable, unknown, and new hazards.
The dread factor, compared to the unknown factor, was found to be highly
correlated with perceived risk.
Early approaches to reduce accidents were mainly focused on engineering
measures. Improving infrastructure, designing safer roads, and the introduction of
seatbelts reduced fatality rates to some extent. Furthermore, legislative actions were
also taken by making wearing seatbelt mandatory, limiting the amount of alcohol
permissible while driving, and limiting speed limit. However, neither engineering
interventions nor legal arrangements could interfere with the effect of driver’s
personal choices and unintentional choices on his/her behavior (Rothengatter,
2002). In other words, the human factor could not be get under control without an
attempt to understand psychological factors influencing driver behavior and driver’s
3
perceptions. Drivers adapt their behaviors according to necessities of the situation
with respect to perceived risk and perceived task demands (see Rothengatter &
Huguenin, 2004). Three theories rose to account for drivers’ compensatory
behavior: Wilde’s risk homeostasis theory (RHT) (1982), Summala’s zero risk
theory (1974), which later evolved into hierarchical model of behavioral adaptation
(1997), and Fuller’s task capability model (2000).
Risk compensation is adjusting behavior in response to perceived changes in risk. If
we believe our risk is increased, we will take additional precautions to reduce
negative effects of risk involving situation. On the contrary, if we perceive risk as
low and feel safe, we will behave less cautiously and confront dangerous situation.
Key issue in risk compensation is perceiving change in risk level, which will
produce behavioral change (Hedlund, 2000). When do drivers feel in need of
adjusting their behavior?
Wilde hypothesizes that we all have a “target risk level” and measure risk like a risk
thermostat and overall accident rate remains stable at societal level (1982). Risk
behavior involves costs and benefits. Target level of risk is the net benefit of
intended risk. The theory assumes that people make continuous risk assessment. If
perceived risk is not in congruence with target level risk, than they will adjust their
behavior to eliminate the discrepancy between the two. Wilde’s theory includes a
feedback loop between behavior and outcome. A cautionary behavior reflects upon
injury rate, while injury rate also reflects upon behavior. Target risk is seen as the
key concept in this circular causality. There will be fluctuations in accident rate but
overall increments and decrements will be averaged, and will remain stable unless
target risk level is changed. RHT asserts that in order to reduce injury rate, the
target level risk people are willing to take should be reduced (Wilde, 1998).
However, in doing so RHT ignores environmental safety regulations, such as road
and vehicle designs (Rothengatter, 2002; Hedlund, 2000). Furthermore, Evans

4
challenged RHT by investigating traffic accident data (1986). Data was
incompatible with RHT’s basic proposition that number of accidents per unit of
time of driving remains constant. The debate on RHT still continues.
Zero-risk theory focuses on motivational determinants, basically drivers’ subjective
risk assessments and compensatory behavior they are willing to take (Naatanen &
Summala, 1974). Summala extended zero-risk theory approaching driver’s task
from multiple aspects.
Summala’s hierarchical model of behavioral adaptation of driver’s task takes into
account changes in the traffic system in examining driver’s reaction. It is a three-
dimensional task cube (1997). It considers the driving task as an interaction of
functional hierarchy, level of processing, and functional taxonomy. The functional
hierarchy dimension ranges from vehicle control level up to trip decisions and
vehicle choice. The functional taxonomy of behavior dimension includes driving
skills such as lane keeping, crossing management, and maneuvering. The
psychological processing level distinguishes between perceptual-motor control and
decision-making and supervisory monitoring level. The model posits that “the
higher the task in a functional taxonomy, the more often conscious decision-making
and supervisory monitoring is applied”. Attention control is in between two
processes and it is applied both top-down and bottom-up. Speed and time control
lies in the centre of the cube because these two factors determine mobility and they
are major motivational aim of driving.
Fuller’s task capability model differentiates between driver competence and driver
capability (2000). Competence is driver’s skill accomplishment including control
skills, hazard perception skills, and anticipatory and defensive skills. Capability is
the driver’s ability to transfer his/her level of competence in a given situation. The
model asserts that task difficulty emerges from the discrepancy between driver’s

5
attempts to respond to task demands and the available level of capability. If the
demands of the task exceed driver capability, the task is perceived as difficult and
risky. The result of this mismatch can be expected to be a crash. In order to manage
task difficulty, the driver can either modify task demand or capability.
The three risk theories mentioned above try to explain driver behavior and how they
handle risks in traffic. They do not consider whether drivers’ risk estimations are
accurate or not. The fact that drivers keep on having accidents, despite laws and
regulations and engineering improvements indicates that they fail to accurately
estimate risk. There is a discrepancy between perceived risk and objective risk.
Estimation of risk is biased by cognitive processes, context, personal and cultural
characteristics. Although drivers seem to be aware of relative risk related to specific
behavior, they fail to accurately estimate the magnitude of risk for themselves.
Attribution theory can help to understand why drivers have that tendency to have
biased estimations. Attribution research suggests that the attribution process, which
is an umbrella term for individual’s effort to find causal relationships for the events
occurring around them, is colored by a number of systematic errors and biases.
These errors and biases might be due to limitations on cognitive system,
motivational factors, or both. One of these biases is self-serving bias, which refers
to the tendency of interpreting and explaining outcomes in ways that are favorable
for the self. Self-serving bias has two facets: self-enhancement bias and self-
protective bias. Self-enhancement bias is taking credit for successful outcomes.
Self-protective bias, on the other hand, is denying responsibility for negative
outcomes (Blaine & Crocker, 1993). Applying self-serving biases to risk appraisal
states that people might have a tendency to make attribution to their dispositions, if
they get a positive outcome as a result of risk-involving event. On the contrary, they
will not like to make dispositional attributions for negative outcomes of risky
events. Failure in associating behavior and risk will lead to persistence in that
specific risky behavior without noticing causal relationship especially when the
6
outcome is not negative. Taylor and Brown (1988) argued that self-serving nature
of risk estimation for self might be due to exaggerated control and optimism beliefs.
In other words, overestimated control and optimism leads to a reduction in
perceived risk and an increased tendency of risk taking behavior.
The current study investigates how risk-taking behavior is influenced by illusion of
control, optimism bias, and locus of control.
2. Illusion of Control
The importance of control in psychological functioning has been emphasized for a
long time. Sense of control is related to positive outcomes in diverse aspects of life;
such as health, coping, self-esteem, work success, school performance, information
seeking and processing, and risk-taking (Seeman & Seeman, 1983; Ross & Broh,
2000).
The control phenomenon is approached from different perspectives. However,
almost every researcher conceptualized and called the control construct she/he has
been studying on differently. This is a disadvantage for accumulation of research
findings (Skinner, 1996). While Bandura (1989) stressed on self-efficacy as an
execution of control, Rotter (1966) emphasized beliefs about locus of control, that
is, whether control is internal to the person or related to external factors. Weiner
approached control from an attribution perspective by adding stability to previous
internal/external distinction (Weiner, Nierenberg, & Goldstein, 1976). Langer drew
attention to the illusory nature of control especially in skill situations (1975).
Although defined differently by various researchers, control research revealed a
discrepancy between objective and subjective control. Further research on

7
perceived control demonstrated that inaccurate estimations of control are more
adaptive for psychological well-being (Taylor & Brown, 1988 for review).
Success in skill situations is related to behavioral capacity of the agent. Therefore,
success in a skill situation is controllable. Chance situations, on the other hand, are
fortuitous occasions, which make chance situations uncontrollable. However,
human mind is liable to relate skill situations to chance situations (Langer, 1975). In
other words, people fail to judge absence of contingency between chance and
outcome, while, they appreciate contingency relationship between skill and
outcome. Langer demonstrated that chance situations involving skill elements
induce illusion of control to a great extent (1975). In a series of experiments about
gambling, she introduced elements of skill situations- competition, choice,
familiarity, and involvement to chance situations. Results indicated that belief in
illusory control increased as subjects perceived their opponents as less competent,
as subjects chose lottery tickets themselves, as both stimulus and response
familiarity increased, and as subjects actively or passively involved in chance
situations. Elements of skill situations embedded in chance situations induced
exaggerated perceived control over chance situations and inappropriately higher
feelings of confidence. Moreover, people misjudge their control in skill and chance
situations. Illusion of control is exaggerated beliefs in one’s success due to
overestimated control over situations.
Illusion of control has two components: (1) expecting the chance of successful
outcome higher than objective probability estimates would assert and (2) expecting
success in chance situations, which are indeed beyond personal control. It can be
inferred from the concept of illusion of control that individuals might be more
likely to engage in risk-taking behavior when they are actually the control agent of
situations, because of their exaggerated belief in their own control.

8
2.1. Illusion of control and risk-taking
Studies from different literature established that risk-taking behavior is influenced
by illusion of control and perceived control. The studies cited below investigate
different types of control construct; e.g. illusion of control, perceived control,
illusory control, and desire of control. There is not an accumulated illusion of
control literature. Therefore, research on subjective control constructs is presented.
Langer’s study conceptualized illusion of control. Later studies demonstrated that
the individual’s need for a specific outcome in a chance situation has a determinant
role on illusory control (Biner, Huffman, Curran, & Long, 1998, Studies 1 and 2).
Biner et al. created feeling of need in subjects by manipulating food level, food-
deprived and food-saturated groups. Subjects were provided the opportunity to win
food by participating in a chance-based-card-drawing game. Subjects were assigned
either to high-need group (high-deprivation group) or low-need group (low-
deprivation group). A second assignment was made for skill-cues condition and no-
skills cues condition. Participants in the first group picked their own cards to
determine winning food. Experimenter picked cards for those in the latter group.
After the procedure they were asked to rate their degree of skill in card-drawing
game and to indicate how confident they were in drawing the winning card. Results
demonstrated that those in high-need group had higher scores on skill and
confidence-in-winning ratings. Furthermore, subjects in high-need group showed
greater inclination to be involved in playing game. Biner et al. concluded that
illusion of control was a function of motivation for a specific outcome. Consistent
with Biner et al.’s study, Moore and Ohtsuka (1999) assessed relationship between
illusion of control, internal locus of control, and problem gambling among young
people. They found that young problem gamblers had less rational control beliefs,
i.e. greater illusion of control, but believed that they had rational control over
gambling. Furthermore, they believed that they were strongly in need of winning

9
money from gambling. This group showed persistence despite of inevitable failure
presumably due to belief in skill rather than chance.
Burger (1986) examined individual differences in illusion of control and general
desire for control. In two experiments, high desire for control subjects bet more
than low desire for control subjects when they were playing with familiar cards, but
not when playing with unfamiliar cards. Burger also investigated the effect of a
loss-win sequence on illusion of control. One group was given feedback as their
guesses were true during first few trials, while another group was told that their
guess during later trials were true. It was expected that those who win in the
beginning will attribute this to their anticipatory abilities, while those who lose in
the beginning will attribute this to their lack of control over the game. Results
confirmed Burger’s expectations. High desire for control subjects who won in the
beginning showed the greatest illusion of control. Burger’s results support the
motivational roots in systematic distortions in perceived causality.
McKenna (1993) investigated the illusion of control phenomena in a traffic setting.
He investigated drivers’ expectations about perceived accident involvement.
Participants in the experimental group were asked to judge their likelihood of
accident involvement when they were driving (control condition). Control subjects
were asked to make judgments about their probability of accident involvement
when they were passenger (no-control condition). Results of the study showed that
participants considered themselves less likely to be involved in an accident when
they were in driver condition (control condition) compared to passenger condition
(no control condition). These results indicate the importance of control while
driving. Participants probably thought that they will be able to handle a probable
risk situation if they are the driver, i.e. if they have control. However, they do not
trust in other persons’ ability to overcome risk situation, thus; rate accident
likelihood similar to average person, i.e. when they are not in control. McKenna

10
concluded that “it won’t happen to me” effect is not due to self-other comparison.
On the contrary, he found that illusory self-assessments are consistent with positive-
self bias (McKenna, 1991). Drivers do not see other drivers’ skills as negative but
see their own skills as more positive.
In order to see how perceived control is related to risk-taking behavior, Horswill
and McKenna conducted another study (1999b). The experiment investigated the
effect of perceived control on a range of risk-involving driving activities (speed
choice, following distance, gap acceptance, and overtaking). They used validated
video simulation techniques to assess drivers’ behavior on four driving activities
cited above. The same manipulation with McKenna (1993) was used to create
control and no-control groups. Results indicated significant effects for speed choice,
but not for other activities. Drivers tolerated higher speeds when they thought they
are driving the car. Although there were not significant results for other tasks, it can
be inferred that driving at high speed and motive to maintain it might lead to other
risk-taking behaviors. Hammond and Horswill (2002) investigated whether
individual differences in terms of desire for control influence illusion of control of
drivers. Considering findings that people in control position tolerate higher risks
(Horswill & McKenna, 1999b) and that those with high desire for control are more
prone to illusion of control (Burger, 1986), it was expected that drivers with high
desire for control might be more prone to illusion of control and might be willing to
take more risks. A video simulation technique was used to measure risk-taking
preferences of drivers. It was found that drivers with high desire for control were
more likely to engage in risk-taking behavior, specifically, driving at higher speed
and pulling into smaller gaps. It is clear that higher perceived control prompts
driving at high speed. Taking into account the role of high speed in other risk-
taking behaviors such as gap acceptance, close following (Horswill & McKenna,
1999b), and overtaking, it can be concluded that the situation is severe in terms of
accidents related to speeding. This situation makes understanding drivers’ speed

11
perception essential. Walton and Bathurst (1998) asked drivers’ their perceptions of
their own speed and other drivers’ speed. Drivers overestimated speed of both
themselves and others’; however, they estimated other drivers’ speed even higher
than their speed. Walton and Bathurst expected drivers who perceived themselves
slower to consider themselves safer compared to other drivers. Although their
expectations were reasonable, they failed to demonstrate the expected relationship,
due to methodological problems. Their methodology was able to predict the
relationship between perception of others’ peed and overconfidence in safety and
skill; but not able to highlight the differences in respondents’ beliefs about their
own safety and skill.
Illusion of superiority in skill-ratings was demonstrated in another study (Horswill,
Waylen, & Tofield, 2004). Drivers were asked to rate different components of
driving skills: hazard perception skills and vehicle-control skills. The aim of the
study was to find out how drivers’ assessments of driving skills reflected in their
risk-taking intentions. They found that drivers rated themselves as superior on both
types of skills; however, they showed greater illusion of superiority for hazard-
perception skills compared to vehicle-control skills and overall driving skills.
Additionally, hazard-perception skills were found to predict accident involvement
rather than vehicle-control skills. Even though drivers seem to appreciate the role of
hazard perception skills in safe driving, they are vulnerable to biased evaluations.
Drivers who evaluated themselves as more skillful compared to their peers also
evaluated themselves safer and those who considered their vehicle-control skills
higher tended to consider their hazard-perception skills also high. Overall, hazard-
perception skills explained variance in safety bias, drivers’ ratings of safety
compared with UK drivers, beyond general driving skills. Horswill et al. argue that
drivers may not benefit from acknowledging importance of hazard-perception skills
for safety because of their inflated beliefs in their own hazard-perception skills.
12
Combining findings of several studies it can be concluded that drivers regard
themselves as more skillful (Horswill et al., 2004; Svenson, 1981), slower (Walton
& Bathurst, 1998), and less likely to be involved in accidents (McKenna, 1993)
compared to other drivers. Such beliefs might encourage feelings of invulnerability,
while increasing drivers’ tendency to take risks. Moreover, this belief pattern was
found to be conflicting with aims of safety campaigns. Walton and McKeown
(2001) found that drivers subject to such self-enhancement bias are less likely to
perceive safety messages as targeted to them.
3. Optimism Bias
Optimism bias refers to the tendency of people to believe that they are less likely to
experience negative events and more likely to experience positive events
(Weinstein, 1980; 1987). Optimism bias is not limited to any particular age, sex,
education, and occupation group (Weinstein, 1987). It assumes that the difference
between self and other risk judgments arise from a distortion of personal risk
judgments. Indeed, the distortion might be for both personal and other risk
judgments. Perloff and Fetzer (1986) suggest that optimism bias might be due to a
distortion of other’s judgments of risk rather than personal judgment of risk to
maintain cognitive consistency. Optimism bias seems to have cognitive and
motivational roots. Motivational factors might help to supply desired end-states,
while cognitive factors might supply means to achieve the end-states (Kunda, 1990;
Shepherd, Carroll, Grace, & Terry, 2002).
Weinstein (1980) hypothesized that degree of desirability, perceived probability,
perceived experience, perceived controllability, and stereotype salience of an event
might influence the experienced amount of optimism bias experienced.
13
Shepperd et al. (2002) reviewed motivational and cognitive causes of optimism
bias. They reviewed three motivational causes: self-enhancement, self-presentation,
and personal control. Optimistic predictions about the self are gratifying. How
people feel about themselves, how they perceive self-esteem is judged in terms of
one’s standing on personally relevant dimensions relative to other individuals.
People generally hold positive self-perceptions. Research comparing individuals’
own self-ratings with ratings of observers revealed that people make more positive
judgments for themselves (Lewinshon, Mischel, Chaplin, & Barton, 1980).
Moreover, people have a tendency to maintain positive self-conceptions (Tesser,
1988). Thus, people are more willing to make favorable comparisons. Estimating
personal risk to be lower than other’s risk might provide people with the
satisfaction of favorable comparisons and it might make people feel better than
average (Alicke, Klotz, Breitenbecher, Yurak, & Vredenburg, 1995). Self-
enhancement concerns are thought to be reflections of self-presentational concerns
(Shepperd, 2002). Self-presentational concerns imply an effort to establish and
maintain desired and self-congruent impression on other people’s mind (Goffmann,
1969). Inducing desirability concerns in individuals would result in unrealistic
optimism due to operation of need to present oneself better off than others are. The
third and last motivational account posits that optimism bias arise from perceived
control. When people feel in control, they also perceive less risk (Klein & Kunda,
1994; McKenna, 1993; Weinstein, 1980). Belief in personal control prompts
individuals’ role as control agent in achieving desired outcomes and avoiding
negative outcomes.
Shepperd et al. reviewed three cognitive mechanisms that guide optimism bias:
representativeness heuristic, singular-target focus, and transforming interpersonal
distance into a perception of risk differences. Representativeness heuristic is a
cognitive shortcut in which decisions are based on relevancy judgment that
produces a likelihood estimate. The more the A represents category B, the more

14
people will assume that A is a member of category B. Optimism bias is measured
by asking subjects to make comparative judgments with an average person, the
definition of which is vague in people’s mind. Weinstein (1980) suggests that this
measurement might cause subjects to choose a prototypical comparison target
representing risk-category. Perloff and Fetzer (1986) demonstrated that for different
events subjects pick different comparison targets, which are indeed vulnerable to
that specific event, and judge their own likelihood of experiencing negative events
less than comparison target. Representativeness heuristic specifies a dissimilar,
worse-off comparison target in peoples’ mind. The second cognitive factor is
singular-target focus, which states that people focus on a single target rather than
generalized population when making comparative judgments. The third cognitive
factor is transforming interpersonal distance into a perception of risk differences. It
suggests that as people perceive interpersonal distance with comparison target, they
will perceive risk difference. As interpersonal distance increases, optimism bias
also increases.
3.1. Optimism Bias and Risk-taking
People are prone to optimism bias in a wide range of events including automobile
accidents, alcoholism, divorce, being a crime victim, getting HIV, anorexia, and
heart attack (Harris & Middleton, 1994; Perloff & Fetzer, 1986). Therefore, people
are likely to make inaccurate risk judgments, to underestimate risk and to take risk.
Svenson (1981) found that drivers regarded themselves more skillful and at less risk
than other drivers. A later study replicated these results (Svenson, Fischhoff, &
MacGregor, 1985). Furthermore, they found that subjects attributed accidents to
human factor and those drivers who believed in human factor considered
themselves as safer than the average driver. DeJoy (1989) investigated the role of

15
optimism bias in traffic accident risk perception. He asked subjects to compare their
risk of being involved in a variety of given traffic accidents relative to their peers.
Subjects also provided global estimates of their accident likelihood and driving
safety and skill. Traffic accidents presented to participants varied in controllability
and outcome severity. Results indicated that drivers were more optimistic when
they perceived the event as more controllable. Consistent with other studies,
subjects regarded themselves as safer, more skillful, and less likely to be involved
in a traffic accident compared to their peers. Ratings of driving skills and driving
safety were subject to more optimism bias than ratings of accident likelihood. Moen
and Rundmo (2005) found similar results. In their study among risk-takers, safety
attitudes were found to be most important predictor of unrealistic optimism.
The three studies cited above confirmed the effect of event controllability on risk
perception. McKenna (1993) also found that when perceived control was taken into
account, optimism bias disappears. He concluded that the basic mechanism is
illusion of control, and not optimism bias. Harris and Middleton (1994) challenged
McKenna’s conclusion regarding optimistic bias as a display of illusion of control.
They found that likelihood ratings changed for different comparison target groups.
The likelihood of experiencing given events was least for self, higher for
acquaintance, even higher for friend’s friend, and highest for a typical university
student. This pattern is consistent with transformation of interpersonal distance into
a perception of risk differences; as interpersonal distance increases, the likelihood
estimation for the other person also increases. Harris and Middleton could not get
the same pattern for ratings of control. Target had an effect on likelihood ratings but
not on control ratings. They concluded that risk and likelihood estimations are
independent of control ratings.
Kos and Clarke (2001) dealt with the relation between optimism bias and control as
well. They asked subjects their own risk and average person’s risk of experiencing

16
four events varying in controllability and perceived delay of event. They found that
people showed optimism bias for controllable events. This implies that individuals
do not consider, or fail to consider immediacy of results in their risk evaluations.
To sum up, the previous research demonstrated that biased risk estimations result in
an optimistic view of world and future, which in turn promotes risk-taking behavior
and prevents self-protective practices.
4. Adaptive Importance of Positive Illusions
It is essential to consider whether positive illusions are adaptive or maladaptive.
Taylor and Brown (1988) suggest that positive illusions promote mental health.
Their review states that positive illusions are related to reports of happiness.
Furthermore, positive illusions facilitate cognitive functioning by enhancing the
association of multiple cues with encoded information and by means of providing a
more complex cognitive ground for decisions and judgments. Positive illusions also
motivate people to persist in what they are doing, since they create high
expectations about success. As a result, individuals produce more effective
performance.
Is everyone prone to positive illusions? It seems this is not the case. Depressed,
distressed, and low self-esteem individuals are accurate in their evaluations of
control and estimations of risk likelihood (see Taylor & Brown, 1988).
Although positive effects of illusion of control and optimism bias are mentioned,
risk-taking perspective muddles this positive picture. As noted earlier, if drivers
believe they have control over the environment, if they overestimate their skills to
handle problems, and if they overestimate experiencing positive outcomes; then

17
they will underestimate risks and fail to engage in self-protective behavior.
Paradoxically risky behavior may even reinforce itself. For instance, driving fast or
overtaking, relatively risky behaviors reduce travel time and provide more
continuous driving. It is not always the case that risky behaviors lead to accident.
Thus, the absence of contingency between negative consequences and risky
behaviors might present risky behaviors to be even beneficial.
Positive illusions bias drivers’ perception of safety campaign messages. Drivers
who believe that they are invulnerable to negative outcomes fail to appreciate safety
messages directed at them; on the contrary, they believe that these messages are for
other drivers, who are less skilled and more likely to confront negative events
(Walton & McKeown, 2001).
In the previous two sections studies of illusion of control and optimism bias from
traffic, gambling, and health literature were reviewed. However, it is worth noting
that the result of a risky behavior in one area is not identical to another. Besides the
fact that not every risky behavior leads to negative outcomes, immediacy of
outcomes are different. Risk-taking behaviors in traffic have immediate results and
effects, such as accident, injury or death. Yet risk-taking behaviors in health display
their effects in the long-run. Although this difference is clear, other literature is
used to explain the phenomenon.
5. Locus of control
Locus of control refers to an individuals’ belief in his/her influence over situations
in his/her life (Rotter, 1966). Rotter approached locus of control as a
unidimensional construct with internal and external ends. Where the control resides
is determined by perceived reinforcement. If the reinforcement is not perceived
18
contingent upon one’s own behavior, but rather on environmental influences, it is
termed as external locus of control. In contrast, if the reinforcement is perceived
contingent on one’s own behavior, this is termed as internal locus of control.
Levenson (1981) offered an alternative model to Rotter’s unidimensional construct.
She conceptualized locus of control as consisting of three orthogonal dimensions:
internality, chance, and powerful others.
5.1. Locus of control and risk-taking
Locus of control was found to be related to risk-taking behavior in different areas,
such as driving, occupational hazards, and sex-practices.
Research on safe-sex and accident involvement in workplace supports the
relationship between locus of control and safety. Janicak (1996) found locus of
control and job hazards as reliable predictors of being involved in job accidents.
Externals were more likely to have job accidents. Internals were more likely to
avoid risk. Jones and Wuebker (1993) investigated safety locus of control, the
individual’s belief about the contingency of his/her behavior on accident outcome,
among health employees. Individuals with internal safety locus of control are
expected to have high safety consciousness and behave less risky; while the
opposite is expected for individuals with external safety locus of control. Jones and
Wuebker found that hospital employees with external safety locus of control
reported more occupational accidents, as well as more severe accidents compared to
employees with internal safety locus of control. Terry, Galligan, Conway (1993)
investigated predictors of safe-sex behavior. They found that externals were more
likely to engage in unsafe sex practices.

19
Locus of control was assumed to be related to safe driving. Internals and externals
were expected to differentiate with respect to their behaviors in risky situations.
Internals believe their behaviors to be instrumental on outcomes, and might be more
prone to accidents because they overestimate their abilities to handle dangerous
traffic-related events. Externals, on the other hand, might be prone to accidents
because they are dependent on situational factors or other people to handle traffic-
related events (Garrity & Demick, 2001). Despite ambiguous results in the
literature, empirical data seem to support the first thesis. The theoretical rationale
behind this assumption came from a study by Hoyt (1973). Hoyt measured drivers’
self-reported seatbelt wearing behavior, attributions of accident causes, anxiety felt
while driving, and travel interest. He found that internals were more likely to
attribute causes of accidents to controllable, internal factors. Furthermore, they
reported wearing seatbelts more often compared to externals. Internals also reported
less anxiety while driving and experienced driving as interesting and involving.
Hoyt concluded that internals, who believe their actions influence outcomes, were
more cautious and more likely to engage in safe practices while driving. Externals,
on the other hand, were less cautious and less likely to take precautionary behavior.
Lefcourt (1982) suggests that to get accurate results with locus of control it’s better
to use behavior-specific measures rather than general locus of control measure like
Rotter’s IE. Montag and Comrey (1987) developed a driving-specific locus of
control scale to measure Driving Internality (DI) and Driving Externality (DE).
They approached DI and DE as separate scales rather than a bipolar scale. They
found driving internality, rather than driving externality, to be negatively correlated
with involvement in fatal accidents. In their meta-analysis, Arthur, Barrett, and
Alexander (1991) obtained a correlation of .20, accounting for around 50% of
variance, for the relationship between locus of control and accident involvement.
Results of meta-analysis indicated that internal locus of control was associated with
20
lower levels of accident involvement. However, I should note studies that did not
find a relationship between locus of control and risky driving.
Iversen and Rundmo (2002) investigated determinants of risky driving and accident
involvement. They used Montag Driving Internality and Driving Externality scales
to measure locus of control. Externals reported more risk taking but the tendency
did not reach significance. In their model locus of control influenced neither risky
driving nor accident involvement. Arthur and Doverspike’s (1992) study
investigating the predictive power of locus of control and auditory selective
attention on driving accident involvement did not reveal significant results for locus
of control. Guastello and Guastello (1986) also did not find a relationship between
locus of control and accident involvement. However, in their study, the lack of a
relationship might be due to transformation of Rotter’s concept into specific beliefs
about accidents and driving behaviors.
The previous studies either found no relationship between locus of control and risk
taking or found externality to be related to risky and less cautious behaviors. There
is a distinction between internals and externals in terms of the nature of the risk
they are likely to take. Cohen, Sheposh, and Hillix (1979) found that internals took
more risks on skill tasks, while externals took more risks on chance tasks. Internals
were likely to believe what happened to them were result of their own behavior.
Externals, on the other hand, were likely to believe that it was due to chance rather
than their behaviors.
To summarize, external locus of control and internal locus of control orientations
result in differential risk taking behavior. Yet the previous research is not
conclusive.

21
6. Aims and hypotheses
The aims of the current study were to investigate the relationship between illusion
of control, optimism bias and locus of control among Turkish drivers and their
relationship to risky driving, i.e. violations, accidents, and penalties.
It was hypothesized that; (1) Turkish drivers were prone to illusion of control; (2)
illusion of control was expected to promote risk-taking behavior among Turkish
drivers; (3) Turkish drivers would suffer from optimism bias in their risk
estimations of being involved in an accident; (4) the optimism bias in drivers’
accident involvement estimations were expected to increase their risk-taking
behaviors; (5) external locus of control was expected to be related with risk-taking
behavior.

22
1
ILLUSION OF CONTROL
1.1. Introduction
The aims of the current chapter were 1) to study if illusion of control can be found
in self-reports (of driving) among Turkish drivers, 2) to investigate the relationship
between illusion of control and age, sex, years since getting the license, annual
mileage, lifetime mileage, total number of tickets, active accidents, passive
accidents, and total number of accidents, and 3) to investigate the relationship
between illusion of control and self-reported traffic accidents and penalties.
1.2. Method
1.2.1. Measures
1.2.1.1. Driver Behaviour Questionnaire (DBQ)
The Driver Behavior Questionnaire measures three kinds of aberrant behaviors:
violations, errors, and lapses (Reason, Manstead, Stradling, Baxter, Campbell,
1990). Violations are defined as “deliberate deviations from those practices
believed necessary to maintain the safe operation of a potentially hazardous
system”. Errors are defined as “the failure of planned actions to achieve this
intended consequences and can involve the unwitting deviation of action from
intention (slips or lapses); and the departure of planned actions from some
satisfactory path towards a desired goal (mistakes)”. The main distinction between

23
violations and other categories is the intention to do behavior. The violation scale of
DBQ includes such behaviors as ignoring the speed limit, driving although being
aware of above legal blood-alcohol limit, close-following. Examples of errors
include forgetting your way to travel, hitting something while reversing, and not
recognizing pedestrians while turning from main road. Reason et al. propose that
violations and errors are products of different psychological processes. Violations
are result of social factors. Errors, on the other hand, are a result of the information–
processing system.
The original version of DBQ consists of 50 items and it was meant to include five
subscales: slips, lapses, mistakes, unintended violations, and deliberate violations
(Reason, et al., 1990). Factor analysis; however, revealed three factors: violations,
dangerous errors, and harmless lapses. The three-factor structure of DBQ is found
to be robust in further studies.
The violation score of DBQ, rather error and lapses score, predicts accident liability
(Parker, Manstead, Stradling, & Reason, 1992; Parker, West, Stradling, &
Manstead, 1995). Drivers who violate safety codes are doing this intentionally and
they are more likely to be involved in accidents. Therefore, in the current study the
28-item extended version of DBQ was used as an indicator of risk-taking behavior
(Lawton, Parker, Manstead, & Stradling, 1997). DBQ’s Turkish translation and
factor structure was validated by Lajunen & Özkan (2004). Participants were asked
to report how often they committed each of 28 behaviors on a six-point scale (1=
never, 6= very often).
1.2.1.2. Driver Skill Inventory (DSI)
Driver skill inventory measures driving skills and safety skills (Lajunen &
Summala, 1995). Two subscales represent motive-skill dimensions. Naatanen &

24
Summala (1974) stated that drivers’ cognitive and motor skills do not necessarily
predict their accident involvement. Motivational factors determine what they will
do in a given situation. Evans (1991) made a similar distinction between driver
performance and driver behavior. Driver performance is what the driver can do and
it is related to driver’s skills, perceptual-motor abilities, and knowledge. Driver
behavior is what the driver actually does. It is the driver’s choice to display
performance.
The DSI consists of 20 items. The reliabilities of the two scales were .89 and .84 for
driving skills and safety skills (Lajunen & Summala, 1995). It was translated and
validated in Turkish by Sümer and Özkan (2002). The DSI asks drivers to rate how
weak or strong they were on given skills on a five-point scale (1= very weak, 2=
very strong). Recent research accounted for the asymmetric relationship between
driving skills and safety skills (Sümer, Özkan, & Lajunen, 2006). The results
revealed that high levels of safety skills buffer negative effects of high levels of
driving skills, i.e. overconfidence in one’s skills.
1.2.1.3. Illusion of control
Illusion of control is measured by asking drivers to judge their likelihood of
involvement in an accident when they are driving versus when they are passengers
(McKenna, 1993). The comparison between these two conditions is a measure of
illusion of control. In other words, if an individual’s accident likelihood judgments
are lower when they are driving than when they are passenger, they are assumed to
be prone to illusion of control. Although comparing these two conditions is
common measurement of illusion of control, there is a point that I disagree with.
Driving, in its nature, is under the control of the driver. The driver has control over
the car, equipment, in his/her reactions, and decisions. The passenger, on the other

25
hand, just sits on the front seat of the car and travels. Comparing almost full control
with no control naturally gives significant results. However, this is not due to
measurement method or manipulation.
Illusion of control was measured in its relation to perceived risk in the current
study. Controllability was one of nine dimensions in Fischoff et al.’s
conceptualization of risk as a multi dimensional construct. This implies that if
something is not controllable, then it is risk-involving. Control is one of the basic
needs of human beings for prediction and survival. Asking control directly would
yield obviously high estimations. Therefore, I tried to infer drivers’ control ratings
from their risk ratings. Although driver’s and front seat passenger’s control over
automobile and risk situation is not equal, the risks they are subjected to are same
most of the time. Therefore, drivers should rate risky outcome of behavior as
similar when imagining themselves as driving and when imagining themselves as
passenger. The discrepancy between the two conditions would mean biased risk
evaluations. Based on Fischoff et al.’s conceptualization, I would infer biased
control beliefs, i.e. illusion of control, from biased risk estimations.
Participants were asked how risky they evaluated each behavior in DBQ. They were
asked to rate DBQ items twice; first considering themselves as a driver and second
considering themselves as a passenger. The question was “How risky do you think
each behavior is when you are driving the car/ when you are front-seat passenger?”.
Questions were presented separately in two columns. Illusion of control score was
derived from the difference between risk rating as a driver and risk rating as a
passenger. Negative scores indicated illusion of control.
26
1.2.1.4. Perceived control
Besides investigating the effects of illusion of control on the risk-taking behavior, I
wanted to see whether the effect of the perceived control differs from illusory
control. DBQ items were used to measure perceived control. Drivers were asked to
estimate their control on each item of DBQ on a six point scale (1 = not at all under
my control, 6 = certainly under my control). Increasing scores indicated high
perceived control.
1.2.1.5. Risk-taking
Risk-taking was measured by the violation score of DBQ original, the total number
of accidents, and the total number of tickets.
1.2.2. Participants
Two-hundred and one drivers participated in the study. The sample consisted of 192
males (66 % of sample) and 97 females (33.6 % of sample). Two respondents did
not report their sex. The mean age was 29.82 years (SD= 11.16). The average time
drivers had their license was 8.62 years (SD = 8.24). Respondents’ average mileage
in last year was 8.973 km (SD= 18.427). Their lifetime mileage was 91.299 km
(SD= 209.789).

27
1.3. Results
1.3.1. Factor analysis
1.3.1.1. Factor structure of DBQ
Twenty eight DBQ items were subjected to principal axis factoring with varimax
rotation. The criteria for determining number of the factors were Kaiser’s criterion
of eigenvalues over 1.0, Cattell’s scree plot, interpretability of the factors, and the
consistency of factor structure with those in previous studies.
Initial factor analysis revealed three factors with eigenvalues over 1.0 and
interpretation of scree plot supported the three-factor structure. However, factor
analysis for other versions of DBQ did not reveal three clear factors. Therefore, two
factors were forced to the original version of DBQ, which was found to be the most
interpretable solution in a longitudinal study (Özkan, Lajunen, & Summala, 2006).
Item number eight (Fail to check your mirror before pulling out or changing lanes)
did not load on any of the factors in two-factor solution; therefore, it was excluded.
The first factor consisted of eleven items tapping violations in traffic and accounted
for 12 % of the total variance. Item loadings on the first factor ranged from .74 to
.33. The second factor consisted of sixteen items tapping errors made while driving
and accounted for 11 % of the total variance. Item loadings on the second factor
ranged from .59 to .31. Two factors together accounted for 23 % of the total
variance. Reliability coefficients of the two factors were .80 and .79; respectively.
Results of the factor analysis for DBQ original are presented in Table 1.3.1.1.

28
Table 1.3.1.1. Factor loadings, communalities (h2), percents of variance for principal axis factoring and varimax rotation on DBQ items DBQ-original scales F1 F2 h2 Factor 1: Violations (accounts for 12 % of the variance) 11. Violate speed limit in city roads .740 .013 .54720. Overtake on right on motorway .684 .068 .47421. Race in traffic lights .589 -.008 .34728. Violate speed limit on motorway .577 .057 .33717. Angry, give chase .543 .085 .30225. Have an aversion to a particular type of road user .467 .078 .22523. Close follow .454 .359 .33524. Shoot lights .443 .361 .3293. Drink and drive .418 .067 .17918. Drive on an about-to-close lane on a motorway .347 .172 .1497. Angry, horn .327 .067 .112Factor 2: Errors (accounts for 11 % of the variance) 14. Ignore give-way signs .056 .587 .3485. Queuing, nearly hit the car in front .155 .503 .27622. Wrong exit from roundabout .001 .474 .22510. Speed in roundabout .332 .471 .3319. Brake too quickly .249 .461 .27426. No recollection of recent road .163 .443 .22227. Misjudge speed of oncoming vehicle .066 .430 .18913. Turning left, nearly hit cyclist .105 .413 .1811. Hit something when reversing -.051 .403 .1654. Get into wrong lane at roundabout .343 .394 .2726. Fail to see pedestrians crossing .194 .387 .18716. Try to pass vehicle turning left .234 .379 .19719. Forget where car is .166 .359 .15612. Intend lights, but switch on wipers -.108 .353 .13715. Attempt driving off in third gear .016 .313 .0982. On usual route by mistake .056 .315 .102
1.3.1.2. Factor structure of DBQ-perceived control
The twenty items of DBQ-perceived control version were subjected to principal
factor analysis with varimax rotation. Initial factor analysis produced two factors,
items of which were consistent with original DBQ. The first factor consisted of

29
seventeen items measuring errors and accounted for 22 % of total variance. It was
named as “perceived control on errors”. Item loadings on the first factor ranged
from .71 to .39. The second factor consisted of eleven items measuring violations
and accounted for 14 % of the total variance. The second factor was named as
“perceived control on violations”. Item loadings on the second factor ranged from
.60 to .35. Two factors accounted for 36 % of the variance. Reliability coefficients
for the two factors were .91 and .82, respectively. Results of the factor analysis for
DBQ-perceived control are presented in Table 1.3.1.2.
Table 1.3.1.2. Factor loadings, communalities (h2), percents of variance for principal axis factoring and varimax rotation on DBQ-perceived control items DBQ-perceived control scales F1 F2 h2 Factor 1: Perceived control on errors (accounts for 22% of the variance) 14. Ignore give-way signs .713 .253 .57215. Attempt driving off in third gear .685 .103 .48016. Try to pass vehicle turning left .666 .217 .4916. Fail to see pedestrians crossing .656 .226 .48122. Wrong exit from roundabout .618 .303 .47427. Misjudge speed of oncoming vehicle .618 .274 .45712. Intend lights, but switch on wipers .617 .140 .4018. Maneuver without checking mirror .617 .250 .44413. Turning left, nearly hit cyclist .600 .218 .4085. Queuing, nearly hit the car in front .570 .344 .44410. Speed in roundabout .568 .398 .48123. Close follow .500 .418 .42519. Forget where car is .473 .319 .32526. No recollection of recent road .421 .358 .3059. Brake too quickly .403 .187 .1971. Hit something when reversing .396 .179 .1892. On usual route by mistake .388 .331 .260Factor 2: Perceived control on violations (accounts for 14% of the variance) 20. Overtake on right on motorway .141 .601 .38111. Violate speed limit in city roads .178 .592 .38224. Shoot lights .274 .566 .39521. Race in traffic lights .260 .544 .36325. Have an aversion to a particular type of road user .183 .519 .3037. Angry, horn .051 .480 .23328. Violate speed limit on motorway .329 .439 .300

30
Table 1.3.1.2. continued 18. Drive on an about-to-close lane on a motorway .405 .405 .3284. Get into wrong lane at roundabout .270 .400 .23317. Angry, give chase .358 .381 .2733. Drink and drive .257 .348 .187
1.3.1.3. Factor structure of DBQ-perceived risk as driver
The twenty eight items of DBQ-perceived risk as driver version were subjected to
principal factor analysis with varimax rotation. Initial factor analysis produced two
factors, items of which were consistent with original DBQ. The first factor
consisted of eighteen items. These were violation items and error items that would
result in immediate accident. In other words, the first factor included high accident
risk items whether the behavior is a violation or an error. Item loadings in the first
factor ranged from .82 to .50 and accounted for 32 % of the total variance. The first
factor was named as “high risk as driver”. The second factor consisted of ten items.
These items involved remaining six error items and four violation items of the
original DBQ those would not result in accident. The second factor of DBQ-
perceived risk as driver version consisted of relatively low accident risk items. Item
loadings for the second factor ranged from .71 to .38 and accounted for the 15% of
the total variance. The two factors together accounted for 47% of total variance.
The second factor was named as “low risk as driver”. Reliabilities for these scales
were .94 and .85; respectively. Results can be seen in Table 1.3.1.3.
Table 1.3.1.3. Factor loadings, communalities (h2), percents of variance for principal axis factoring and varimax rotation on DBQ-perceived risk as driver items DBQ-perceived risk as driver scales F1 F2 h2 Factor 1: High risk as driver (accounts for 32 % of the variance) 14. Ignore give-way signs .820 .098 .682 23. Close follow .795 .214 .678

31
Table 1.3.1.3. continued 24. Shoot lights .773 .109 .610 16. Try to pass vehicle turning left .755 .184 .604 11. Violate speed limit in city roads .701 .269 .563 8. Maneuver without checking mirror .695 .101 .493 22. Wrong exit from roundabout .680 .265 .533 10. Speed in roundabout .678 .242 .518 9. Brake too quickly .676 .202 .498 13. Turning left, nearly hit cyclist .660 .242 .494 27. Misjudge speed of oncoming vehicle .656 .157 .455 28. Violate speed limit on motorway .616 .327 .487 6. Fail to see pedestrians crossing .612 .186 .409 17. Angry, give chase .592 .354 .476 5. Queuing, nearly hit the car in front .592 .273 .425 4. Get into wrong lane at roundabout .541 .363 .424 3. Drink and drive .526 .087 .284 21. Race in traffic lights .503 .373 .393 Factor 2: Low risk as driver (accounts for 15 % of the variance) 19. Forget where car is .061 .711 .509 26. No recollection of recent road .197 .669 .486 15. Attempt driving off in third gear .218 .650 .471 12. Intend lights, but switch on wipers .317 .634 .503 2. On usual route by mistake -.032 .546 .299 20. Overtake on right on motorway .486 .512 .498 7. Angry, horn .145 .508 .279 25. Have an aversion to a particular type of road user .440 .478 .422 18. Drive on an about-to-close lane on a motorway .434 .470 .409 1. Hit something when reversing .333 .381 .256
1.3.1.4. Factor structure of DBQ-perceived risk as passenger
The twenty eight items of DBQ-perceived risk as passenger version were subjected
to principal factor analysis with varimax rotation. Initial factor analysis produced
three-factor solution. However, this three-factor solution was not clear, items of
errors and violations were confused. Therefore, two factors were forced into the
analysis. The two-factor solution produced almost same pattern with DBQ-
perceived risk as driver. The first factor included seventeen items. The items were

32
the same as with those in the first factor of DBQ-perceived risk as driver scale
except for one item. This factor was named as “high risk as passenger” and it
accounted for 23 % of the total variance. Item loadings on first factor ranged from
.76 to .39. The second factor consisted of the same items in the second factor of
DBQ-perceived risk as driver scale and an additional item from the first factor of
DBQ-perceived risk as driver. This factor was named as “low risk as passenger”
and it accounted for 16 % of the total variance. Item loadings on the second factor
ranged from .68 to .43. The two factors together accounted for 39% of the total
variance. Reliabilities for these scales were .90 and .8; respectively. Results can be
seen on Table 1.3.1.4.
Table 1.3.1.4. Factor loadings, communalities (h2), percents of variance for principal axis factoring and varimax rotation on DBQ-perceived risk as passenger items DBQ-perceived risk as passenger scales F1 F2 h2 Factor 1: High risk as passenger (accounts for 23 % of the variance) 23. Close follow .760 .168 .606 16. Try to pass vehicle turning left .756 .134 .590 14. Ignore give-way signs .722 .130 .538 24. Shoot lights .710 .045 .506 10. Speed in roundabout .665 .241 .500 27. Misjudge speed of oncoming vehicle .615 .036 .380 8. Maneuver without checking mirror .598 .100 .367 9. Brake too quickly .591 .151 .372 11. Violate speed limit in city roads .573 .280 .406 22. Wrong exit from roundabout .547 .296 .386 28. Violate speed limit on motorway .490 .211 .284 13. Turning left, nearly hit cyclist .485 .375 .376 5. Queuing, nearly hit the car in front .459 .323 .315 17. Angry, give chase .425 .382 .327 3. Drink and drive .421 .020 .178 21. Race in traffic lights .414 .403 .334 4. Get into wrong lane at roundabout .389 .346 .315 Factor 2: Low risk as passenger (accounts for 16 % of the variance) 15. Attempt driving off in third gear .215 .685 .516

33
Table 1.3.1.4. continued 19. Forget where car is -.051 .682 .467 26. No recollection of recent road .157 .665 .467 12. Intend lights, but switch on wipers .179 .607 .401 7. Angry, horn .071 .566 .326 25. Have an aversion to a particular type of road user .374 .523 .414 20. Overtake on right on motorway .311 .521 .369 2. On usual route by mistake -.121 .499 .263 1. Hit something when reversing .235 .493 .298 18. Drive on an about-to-close lane on a motorway .353 .460 .335 6. Fail to see pedestrians crossing .306 .436 .284
1.3.1.5. Factor structure of DSI
The twenty items of DSI were subjected to principal factor analysis with varimax
rotation. Factor analysis produced two factors accounting for 42% of the total
variance, which was consistent with previous studies using DSI. The first factor,
which accounted for 28% of the total variance, consisted of thirteen items
measuring driving skills. Item loadings on driving skills factor ranged from .80 to
.40. The second factor involved seven items measuring safety skills and it
accounted for 14% of the total variance. Item loadings on the second factor ranged
from .72 to .43. The two factors accounted for 42% of the total variance.
Reliabilities of the scales were .90 and .78; respectively. Results can be seen in
Table 1.3.1.5.
Table 1.3.1.5. Factor loadings, communalities (h2), percents of variance for principal axis factoring and varimax rotation on DSI items DSI scales F1 F2 h2 Factor 1: Driving skills (accounts for 28 % of the variance) 14. Overtaking .758 000 .635 10. Controlling the vehicle .734 .208 .539 20. Reverse parking .695 .035 .518
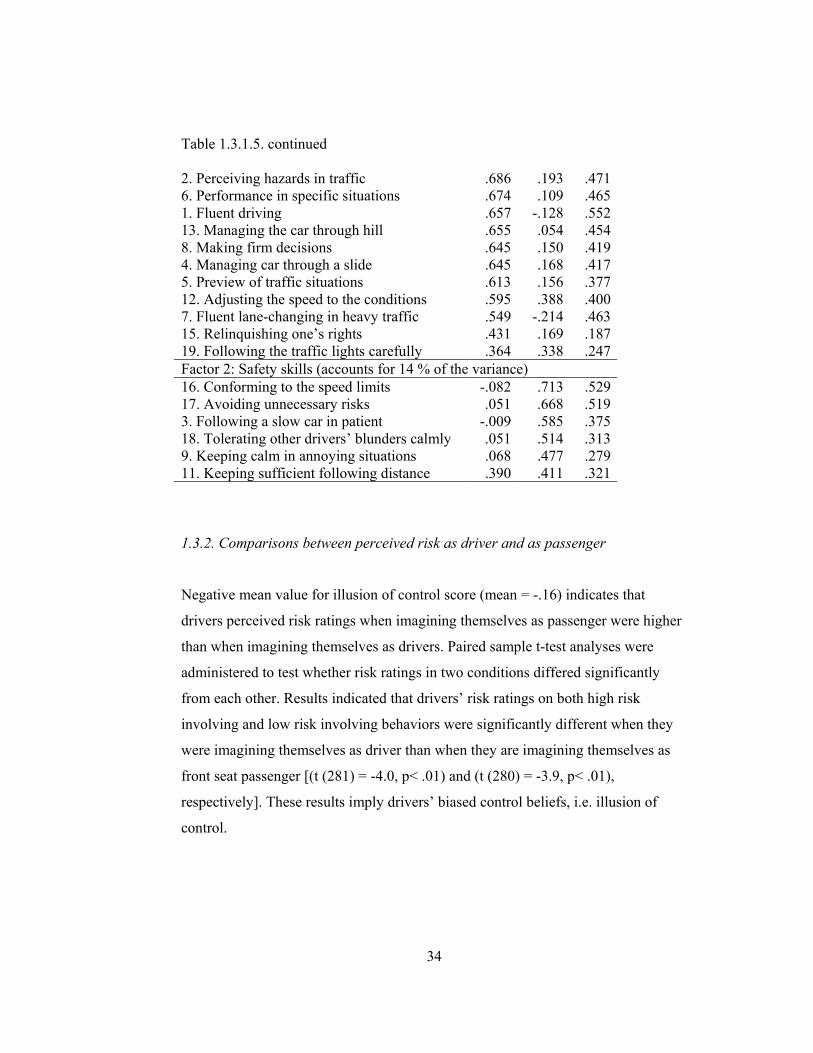
34
Table 1.3.1.5. continued 2. Perceiving hazards in traffic .686 .193 .471 6. Performance in specific situations .674 .109 .465 1. Fluent driving .657 -.128 .552 13. Managing the car through hill .655 .054 .454 8. Making firm decisions .645 .150 .419 4. Managing car through a slide .645 .168 .417 5. Preview of traffic situations .613 .156 .377 12. Adjusting the speed to the conditions .595 .388 .400 7. Fluent lane-changing in heavy traffic .549 -.214 .463 15. Relinquishing one’s rights .431 .169 .187 19. Following the traffic lights carefully .364 .338 .247 Factor 2: Safety skills (accounts for 14 % of the variance) 16. Conforming to the speed limits -.082 .713 .529 17. Avoiding unnecessary risks .051 .668 .519 3. Following a slow car in patient -.009 .585 .375 18. Tolerating other drivers’ blunders calmly .051 .514 .313 9. Keeping calm in annoying situations .068 .477 .279 11. Keeping sufficient following distance .390 .411 .321
1.3.2. Comparisons between perceived risk as driver and as passenger
Negative mean value for illusion of control score (mean = -.16) indicates that
drivers perceived risk ratings when imagining themselves as passenger were higher
than when imagining themselves as drivers. Paired sample t-test analyses were
administered to test whether risk ratings in two conditions differed significantly
from each other. Results indicated that drivers’ risk ratings on both high risk
involving and low risk involving behaviors were significantly different when they
were imagining themselves as driver than when they are imagining themselves as
front seat passenger [(t (281) = -4.0, p< .01) and (t (280) = -3.9, p< .01),
respectively]. These results imply drivers’ biased control beliefs, i.e. illusion of
control.

35
1.3.3. Correlation analysis
Table 1.3.3.1. lists correlations between illusion of control, perceived control on
violations, and background variables. Results indicate that illusion of control was
not related to age, gender, experience, offences, and number of total tickets. It was
only significantly negatively correlated with number of total accidents (r = -.16) and
active accidents (-.14). It should be kept in mind that negative scores on illusion of
control were indicative of the illusion. Therefore, the negative relationship between
illusion of control and total number of accidents indeed imply a positive
relationship. As drivers’ illusion of control beliefs increase, their number of total
accidents also increases. Considering the insignificant relationship of illusion of
control with passive accidents, the effect must be due to involvement in active
accidents.
Perceived control on violations was correlated with none of the background
variables except for the number of total tickets. As perceived control on violations
increased the number of total tickets decreased (r = -.14).

Table 1.3.3.1. Correlations among illusion of control, perceived control, and background variables
** p < .01 * p < .05 Note: Illusion of control score was measured on a negative scale. An increasing negative numeric value corresponds to higher scale value; i.e. higher illusion of control. Therefore, a negative correlation coefficient sign indicates a positive relationship.
1 2 3 4 5 6 7 8 9 10 11 12 1. Illusion of control
1
2. Perceived control on violations
.149* 1
3. Age .090 -.035 1 4. Sex .095 .079 -.020 1 5. Years since getting the license
.037 .021 .887** -.081 1
6. Annual mileage -.038 .091 .169 -.136 .234** 1 7. Lifetime mileage -.029 .023 .424** -.122* .506** .786** 1 8. Offences -.001 .020 .087 -.128* .115 .258** .243** 1 9. Total tickets -.086 -.141* .008 -.133* .046 .178** .169** .400** 1 10. Active accidents
-.143* .005 -.079 .003 -.048 .049 .078 .102 .272** 1
11. Passive accidents
-.108 .000 .094 -.009 .105 .134* .230** .128* .114 .302** 1
12. Total accidents -.157** .004 -.001 -.004 .027 .151* .227** .144* .253** .848** .761** 1
36

37
Another correlation analysis was carried out for the relationship between illusion of
control, perceived control on violations, and driving and safety skills. Illusion of
control was not correlated with self-evaluated driving and safety skills. Perceived
control on violations was significantly positively correlated with safety skills (r =
.29). As drivers’ perceived control on violations increased, they were more likely to
evaluate their safety skills as strong (Table 1.3.3.2.).
Table 1.3.3.2. Correlations among illusion of control, perceived control on violations, driving skills, and safety skills Variables 1 2 3 4 1. Illusion of control 1 2. Perceived control on violations .149* 1 3. Driving skills -.002 .093 1 4. Safety skills .103 .290** .218** 1 ** p < .01 * p < .05
1.3.4. Frequency analysis
Frequency analysis of the variables revealed an asymmetric pattern between
violations and perceived control on violations. Ninety percent of participants scored
below 3.0, which corresponds to “sometimes” on a 6-point scale, while, almost 99%
of participants scored above 3.0, which corresponds to “under my control to a little
extent”, in DBQ-perceived control scale. Drivers report very few violations and
great control.

38
1.4. Discussion
The aim of the current chapter was to present analysis of illusion of control. The
results of the current study revealed that drivers are prone to an illusion of control.
The control phenomenon was approached as an indicator of the risk concept in the
current study. Drivers’ risk assignments to the same behavior were different in
driver and in passenger conditions. This implies existence of a bias in their beliefs
about controllability of the risk. T-test analysis verified the existence of illusion of
control.
In the current study illusion of control was not found to be related with any of the
background variables. The previous research did not found illusion of control
differences for males and females and different age groups. Furthermore,
experience seems not to make a difference on drivers biased control ratings
(McKenna, 1993; Horswill et al., 2004; Waylen, Horswill, Alexander, & McKenna,
2004).
Results demonstrated that as drivers’ illusion of control increased, their number of
total accidents and involvement in active accidents also increased. Lajunen (1999)
defines safe driving as “lack of accidents in the past” and risky driving as “driver
with many accidents”. Accident frequency was treated as criteria for risky driving.
Furthermore, it is necessary to make distinction between accident types. While
passive accidents are mostly related to annual mileage of the driver; active
accidents are related to accident liability (Lajunen, 1999). The current results
support this distinction. Passive accidents were significantly positively correlated
with annual mileage. On the contrary, active accidents were not correlated with
either annual or lifetime mileage. Consequently, as drivers’ illusion of control
increase, their risky driving style increases as well.

39
Perceived control on violations was negatively related with number of total tickets.
As drivers’ perceived control on violations increase, they are more likely to avoid
violating traffic rules and taking extra tickets. Moreover, those drivers are more
likely to evaluate themselves as safe drivers. High perceived control was found to
result in toleration of higher risks in traffic (Horswill & McKenna, 1999b). The
current result should be approached cautiously because of the asymmetry between
self-reported violations and perceived control. The original DBQ and DBQ-
perceived control were presented on the same page. Participants answered two
different versions on adjoining columns. First reporting violations, and then, rating
their control on them might have resulted in underreporting of violations but
overrating of control.

40
2
OPTIMISM BIAS
2.1. Introduction
Optimism bias was found to influence individuals’ risk estimations through creating
a false overconfidence that results in underestimation of vulnerability (Weinstein,
1980). Biased risk estimations seem to encourage individuals’ risk-taking behavior
(Svenson, 1981) and to cause individuals’ failure to engage in self-protective
practices (Perloff & Fetzer, 1986).
The aims of the current chapter were 1) to study if optimism bias can be found in
self-reports (of driving) among Turkish drivers, 2) to investigate the relationship
between optimism bias and age, sex, years since getting the license, annual mileage,
lifetime mileage, total number of tickets, active accidents, passive accidents, and
total number of accidents, and 3) to investigate the relationship between optimism
bias and self-reported violations, traffic accidents, and penalties.
2.2. Method
2.2.1. Measures
2.2.1.1. Direct optimism bias (D measure)
Direct measurement of optimism bias is concerned with participant’s comparative
risk estimations for themselves. Drivers were asked “What is your likelihood of

41
being involved in accident types presented below compared to an average driver?”.
They were asked to answer on a seven point scale (1 = much below average, 7 =
much above average). The four accident types presented were: rear-end collision,
head-on collision, accident due to loss of control, and accident in an intersection.
Comparative risk estimations for four accident types were summed to obtain a
direct optimism bias score. It is important to highlight that optimism bias can be
determined only in group level. Individuals might have below-the-average risk for
special reasons. However, majority of the group cannot have less risk than the other
majority of the group. Group mean below the mid-point of the scale (4) means
sample has biased risk estimations for themselves (Weinstein, 1980). High scores
indicated less optimism bias.
2.2.1.2. Indirect optimism bias (ID measure)
Indirect measurement of optimism bias is concerned with participants’ absolute risk
estimations: one for themselves and one for comparison other. For self-risk rate
drivers were asked “How likely do you think it is that you personally will be
involved in accident types presented below within next ten years?”. For other-risk
rate drivers were asked “How likely do you think it is that an average driver will be
involved in accident types presented below within next ten years?” on an eleven
point scale (1 = no chance, 11 = certain). ID measure score was obtained from the
difference between self-risk and other-risk. Negative scores indicated optimism
bias.
Four accident types were rear-ending collision, head-on collision, having an
accident due to loss of control, and having an accident in an intersection. These four
accidents were chosen because they were most common types of accidents.

42
In addition to the optimism bias measures Driver Behavior Questionnaire (DBQ) -
original, Driver Skill Inventory, and demography questions were used in the current
analyses (see Method section, pg. 22).
2.2.2. Participants
Sample characteristics were presented in page 26.
2.3. Results
2.3.1. Descriptive statistics and comparison between self-risk ratings and other-risk
ratings
Table 2.3.1.1. shows means and standard deviations (SD) of individual items used
in D measure, item pairs used in ID measure, D measure, ID measure, self-risk, and
other risk. It can be seen that the mean D responses are below 4 and that all the
mean ID responses are negative. One-sample t-test analysis indicated that D
measure responses for all accident types were significantly different from zero [(t
(288) = 30.82, p< .01), (t (288) = 29.61, p< .01), (t (288) = 30.02, p< .01) and t
(287) = 32.74, p< .01), respectively for rear-end, head- on, loss of control, and
intersection accidents]. Paired-sample t-test analysis indicated that drivers’ self-risk
ratings and other-risk ratings were significantly different from each other [(t (288) =
-14.18, p< .01), (t (288) = -15.45, p< .01), (t (288) = -14.50, p< .01) and t (287) = -
14.28, p< .01), respectively for rear-end, head- on, loss of control, and intersection
accidents self-other comparison pairs]. Drivers made lower risk estimations for
themselves compared to the average driver. These results are consistent with
previous research demonstrating that drivers rate their own risk of being involved in

43
accident less than an average driver (Kos & Clarke, 2001; DeJoy, 1989; Svenson,
1981).
Table 2.3.1.1. Means (SDs) of the direct (D) and indirect (ID) measures of optimism bias for accident types Direct
measureIndirect measure
Self risk
Other risk
Rear-end 2.39(1.32)
-1.75(2.09)
4.19(2.15)
5.97(1.75)
Head-on 2.03 (1.17)
-1.92 (2.1)
3.57(1.89)
5.51(1.94)
Loss of control 2.46(1.40)
-1.92(2.24)
4.23(2.13)
6.18(1.84)
Intersection 2.57 (1.34)
-1.80(2.14)
4.43(2.04)
6.26(1.95)
2.3.2. Analysis of variance
The effect of gender on differential risk estimations was tested before continuing
with further analyses. One-way ANOVA with gender as independent variable and
four risk estimation item pairs (i.e. the difference score between self-risk and other-
risk estimation for rear-end, head-on, loss of control, intersection accidents) as
dependents was conducted. The only significant difference was for the first pair; F
(1, 284) = 7.52, p < .01; F (1, 284) = .004, p > .05; F (1, 284) = .18, p > .05; F (1,
283) = 1.29, p > .05, respectively. Men judged their risk of involving in rear-end
collision less compared to others than women did.
A second one-way ANOVA was run with gender as independent variable and self
risk, other risk, direct OB, and indirect OB as dependent variables. The aim was to
see whether significant gender difference in first item pair reflected on total scores,
which would necessitate separate analysis for men and women. Results of ANOVA

44
for all four items were insignificant; F (1, 287) = .52, p > .05; F (1, 284) = .10, p >
.05; F (1, 287) = 1.86, p >.05; F (1, 284) = 1.01, p > .05, respectively. Thus, data
were analyzed together for two sexes.
2.3.3. Correlation analysis
Table 2.3.3.1. lists correlations among optimism bias variables, background
variables, and violations. D measure was significantly negatively correlated with
age (r = -.25), years since getting the license (r = -.23), and positively with
violations (r = .18). Young drivers were less likely to make biased risk estimations.
In addition, drivers overestimating their risks were more likely to violate rules.
Self-risk rating was significantly positively correlated with offences (r = .14) and
violations (r = .17). ID measure and other-risk rating were not correlated with any
variable.
Table 2.3.3.1. Correlation analysis between optimism bias variables, background variables, and violations 1 2 3 4 1.Direct measure 1 2.Indirect measure .354** 1 3.Self risk .525** .546** 1 4.Other risk .140* -.529** .422** 1 5.Age -.255** -.072 -.099 -.009 6.Sex .080 .060 .042 -.019 7.Years since getting license -.227** -.063 -.042 .042 8.Annual mileage -.033 .003 .021 .034 9.Lifetime mileage -.108 .010 -.003 -.015 10.Offences .063 .081 .135* .047 11.Total tickets -.043 -.029 -.004 .024
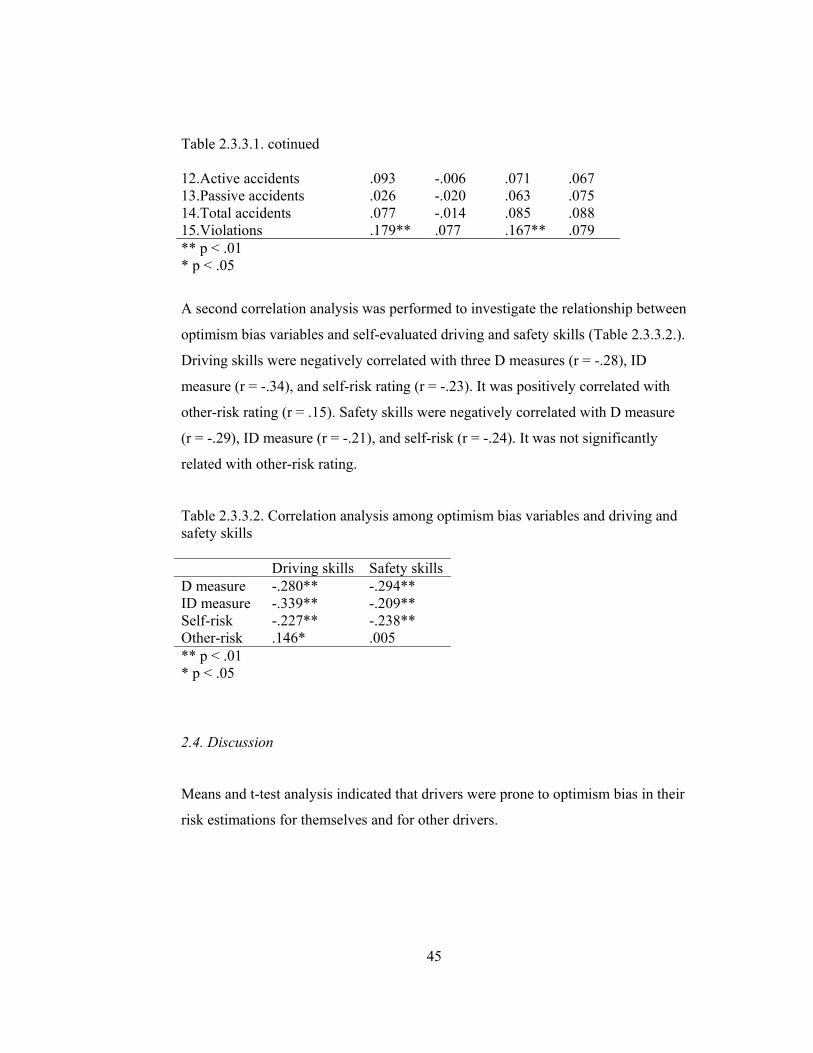
45
Table 2.3.3.1. cotinued 12.Active accidents .093 -.006 .071 .067 13.Passive accidents .026 -.020 .063 .075 14.Total accidents .077 -.014 .085 .088 15.Violations .179** .077 .167** .079 ** p < .01 * p < .05
A second correlation analysis was performed to investigate the relationship between
optimism bias variables and self-evaluated driving and safety skills (Table 2.3.3.2.).
Driving skills were negatively correlated with three D measures (r = -.28), ID
measure (r = -.34), and self-risk rating (r = -.23). It was positively correlated with
other-risk rating (r = .15). Safety skills were negatively correlated with D measure
(r = -.29), ID measure (r = -.21), and self-risk (r = -.24). It was not significantly
related with other-risk rating.
Table 2.3.3.2. Correlation analysis among optimism bias variables and driving and safety skills Driving skills Safety skills D measure -.280** -.294** ID measure -.339** -.209** Self-risk -.227** -.238** Other-risk .146* .005 ** p < .01 * p < .05
2.4. Discussion
Means and t-test analysis indicated that drivers were prone to optimism bias in their
risk estimations for themselves and for other drivers.

46
Among all risk ratings only D measure and self-risk rating was related with
background variables. Age and years since getting driving license were negatively
correlated with D measure, implying that older and experienced drivers were more
likely to make lower comparative risk estimations compared to young and novice
ones. In their study on risk perception in motorcyclists, Rutter, Quine, and Albery
(1998) found significant age and experience effects. Their results indicated that
young and less experienced drivers were less likely to overestimate their risk.
Among car drivers, DeJoy (1989) found a significant effect for experience and a
marginal effect for age. Young and novice drivers are assumed to be more biased in
their risk estimations. However, the present results demonstrate that young and
novice drivers are more realistic in their risk estimations.
Self-risk rating was positively related to offences. Additionally, self-risk was
positively related to violations. These results indicate that as drivers perceive their
risk of accident involvement high, they are more likely to violate traffic rules.
In addition, both indirect and direct measurements of OB were negatively correlated
with driving skills, which means that drivers who underestimate their own risk of
being involved in an accident evaluate themselves as skillful drivers. These results
together demonstrate a pattern consistent with findings from literature. Drivers who
underestimate their risk of crash involvement were more likely to believe in their
driving skills and to take risks (Svenson, 1981).

47
3
LOCUS OF CONTROL
3.1. Introduction
Previous research revealed external locus of control to be related to risk-taking
behavior and failure to take precautionary action. Yet, some studies found no
relationship between locus of control and risk-taking.
The aims of the current chapter were 1) to validate factor structure of
multidimensional traffic locus of control scale, 2) to investigate the relationship
locus of control and age, sex, years since getting the license, annual mileage,
lifetime mileage, total number of tickets, active accidents, passive accidents, and
total number of accidents, and 3) to investigate the relationship between locus of
control and self-reported violations, traffic accidents, and penalties.
3.2. Method
3.2.1. Measures
3.2.1.1. Rotter’s internality externaity scale (Rotter’s IE)
Rotter’s IE (1966) measures individual’s generalized control beliefs on an
internality-externality dimension. It consists of 29 forced-choice items, six of which
are used as filling items. Each item has a or b choice representing internal or
external control focus. “A” choice of twelve items and “B” choice of eleven items

48
get 1 point. Subjects might have a total score between 0-23. Rotter’s IE treats locus
of control as a continuous variable. An increasing total score indicates an increase
on the locus of control dimension going to externality.
Reliability and validity of the scale in a Turkish sample was tested by Dağ (1991).
Internal reliability of the scale was .71 in the adaptation study and .70 in the current
study.
3.2.1.2. Multidimensional traffic locus of control scale (T-LOC)
T-LOC (Özkan & Lajunen, 2005) approaches locus of control as a
multidimensional construct. The scale asks participants to indicate on a five-point
scale (1 = not at all possible, 5 = highly possible) how possible they thought the 16
causes presented had caused or would cause an accident when they think of their
driving style and internal and external conditions. The original scale consists of
sixteen items. In the current study a seventeen item version was used (Özkan,
Lajunen, & Kaistinen, 2005). The original study revealed four scales: other drivers,
self, vehicle and environment, and fate. Alpha reliabilities for scales were .79, .78,
.69, and .44.; respectively.
In addition to locus of control measures Driver Behavior Questionnaire- original,
Driver Skill Inventory, and demography questions were used in the current analyses
(see Method section, pg. 22).
3.2.2. Participants
Sample characteristics were presented in page 26.

49
3.3. Results
3.3.1. Factor Analysis
3.3.1.1. T-LOC
Principal axis factoring with varimax rotation was performed on T-LOC. The
criteria for determining the number of factors were Kaiser’s criterion of eigenvalues
over 1.0, Cattell’s scree plot, interpretability of factors, and consistency of factor
structure with those in previous studies.
The original factor structure of T-LOC is a four-factor structure. In the current
study, factor analysis produced three factors for T-LOC. Te first factor consisted of
nine items measuring other drivers-based causes and vehicle and environment based
causes. This factor was named as “external factors” and accounted for 18% of the
total variance. Item loadings on the first factor ranged from .68 to .38. Other driver-
based causes and vehicle and environment based causes resulted in two separate
factors in the original factor solution of T-LOC. However, in the current study these
two factors were combined. Forcing four factors in the factor analysis resulted in
scattered factor items. The second factor involved items measuring self-based
causes and accounted for 15 % of the total variance. This factor was named as
“self”, consistent with Özkan & Lajunen (2005). Item loadings on self factor ranged
from .74 to .58. The third factor consisted of three items measuring fate and chance
based causes and accounted for 9 % of the total variance. The third factor was
named as “fate”. Item loadings on this fate factor ranged from .71 to .65. The three
factors accounted for 42 % of the total variance. Reliabilities of the scales were .82,
.82, and .74, respectively. Results are presented in Table 3.3.1.1.

50
Table 3.3.1.1. Factor loadings, communalities (h2), percents of variance for principal axis factoring and varimax rotation on T-LOC items T-LOC scales F1 F2 F3 h2 Factor 1: External factors (accounts for 18 % of the variance) 14. Other drivers driving under influence of alcohol
.685 .000 -.093 .503
8. Other drivers drive often with too high speed
.676 .230 -.042 .492
15. Other drivers’ dangerous overtaking .665 .149 -.042 .4464. Other drivers’ risk-taking .592 -.038 -.103 .88810. Other drivers drive too closely to my car
.565 .217 .087 .370
12. Bad weather and lighting conditions .557 .154 .197 .4956. Dangerous roads .548 .212 .126 .38313. A mechanical failure in the car .457 .075 .196 .3383. Shortcomings in other drivers’ driving skills
.383 -.079 -.040 .426
Factor 2: Self (accounts for 15 % of the variance) 16. My own dangerous overtaking .162 .738 .061 .5642. My own risk-taking .038 .736 -.046 .6127. I drive often with too high speed .100 .708 .012 .5309. I drive too close to the other car in front .224 .659 .139 .5011. Shortcomings in my driving skills .051 .582 -.019 .336Factor 3: Fate (accounts for 9 % of the variance) 11. Fate .004 .061 .712 .48817. Coincidences .006 .020 .706 .5125. Bad luck .034 -.017 .651 .501
3.3.2. Correlation analysis
Correlational analysis was performed to investigate the relationship between T-
LOC scales, Rotter’s I E, background variables, driving and safety skills, and
violations (Table 3.3.2.). The external scale was positively correlated with age (r =
.12) and sex (r = .13). However, one-way ANOVA analysis did not reveal
significant effect for sex, F (1, 287) = .026, p > .05. Self scale was correlated with
none of the background variables. It was significantly negatively correlated with
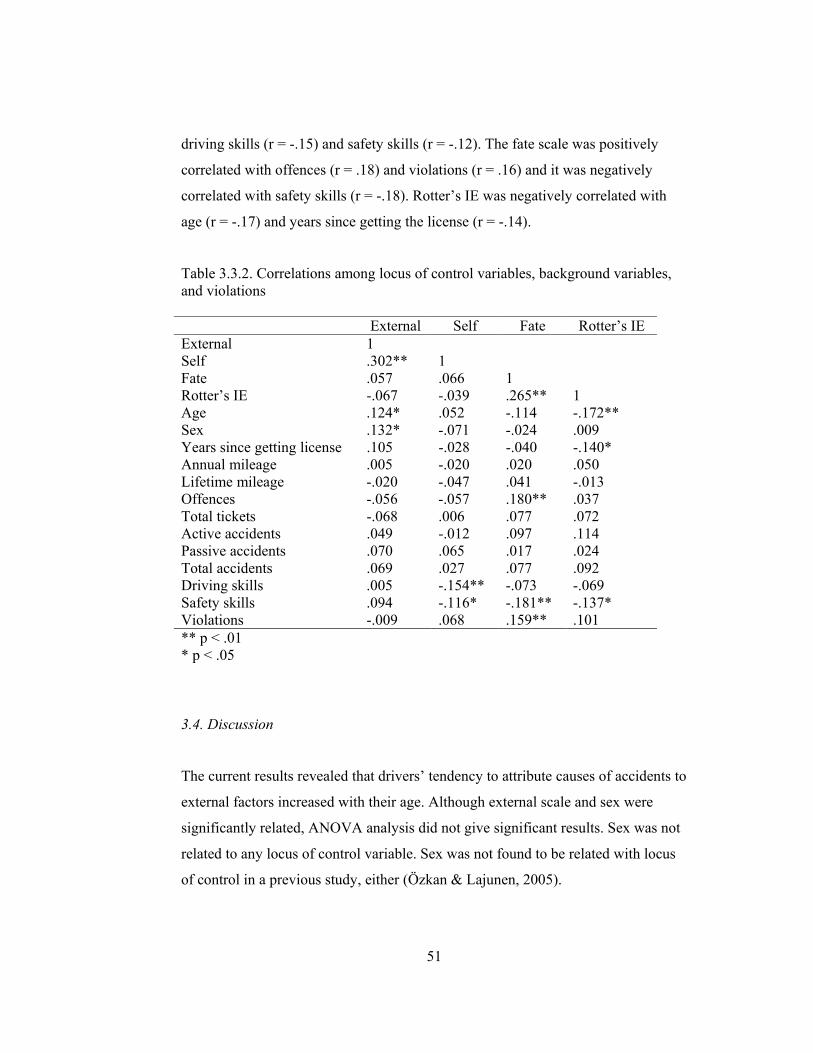
51
driving skills (r = -.15) and safety skills (r = -.12). The fate scale was positively
correlated with offences (r = .18) and violations (r = .16) and it was negatively
correlated with safety skills (r = -.18). Rotter’s IE was negatively correlated with
age (r = -.17) and years since getting the license (r = -.14).
Table 3.3.2. Correlations among locus of control variables, background variables, and violations External Self Fate Rotter’s IE External 1 Self .302** 1 Fate .057 .066 1 Rotter’s IE -.067 -.039 .265** 1 Age .124* .052 -.114 -.172** Sex .132* -.071 -.024 .009 Years since getting license .105 -.028 -.040 -.140* Annual mileage .005 -.020 .020 .050 Lifetime mileage -.020 -.047 .041 -.013 Offences -.056 -.057 .180** .037 Total tickets -.068 .006 .077 .072 Active accidents .049 -.012 .097 .114 Passive accidents .070 .065 .017 .024 Total accidents .069 .027 .077 .092 Driving skills .005 -.154** -.073 -.069 Safety skills .094 -.116* -.181** -.137* Violations -.009 .068 .159** .101 ** p < .01 * p < .05
3.4. Discussion
The current results revealed that drivers’ tendency to attribute causes of accidents to
external factors increased with their age. Although external scale and sex were
significantly related, ANOVA analysis did not give significant results. Sex was not
related to any locus of control variable. Sex was not found to be related with locus
of control in a previous study, either (Özkan & Lajunen, 2005).

52
The self scale was negatively correlated both with driving and safety skills. As
drivers think that accidents are caused by their own behaviors, they evaluate their
driving skills and safety skills as weak. In other words, drivers were aware of their
skill deficiencies and their role in accidents.
Additionally, as drivers attribute causes of accidents to fate, they were more likely
to engage in violations and to have a high number of offences. Nevertheless, they
report their safety skills as weak. Although drivers appreciate their weaknesses in
safe practices while driving, they keep violating safe driving. One reason for this
tendency might be drivers’ negative behavioral adaptation to technological
improvements in cars’ driver assistance systems. In other words, drivers might trust
in the technological equipment in the car and fail to take caution in case of danger.
General locus of control was negatively correlated with age, which means young
drivers were more likely to have external locus of control. The contradiction
between age and external scale of T-LOC and Rotter’s IE might be due to the
content of the constructs. External scale is a traffic-specific locus of control
construct; while Rotter’s IE is a general one. In addition, external drivers rated their
safety skills as weaker than internal drivers.
In the current study, risky driving indicators such as violations and offences were
related only to the fate scale of T-LOC. In Özkan & Lajunen (2005) fate was not
correlated with aggressive and ordinary violations and offences. What might have
caused these contradicting results? It should be kept in mind that the direction of
significant correlations between driver skills scales and locus of control scales were
all negative. Drivers in the current study do not believe either in their driving skills
or safety skills. This might be a reason for them to not to rely on fate locus of
control to the greatest extent: they do not trust in themselves but need an anchor for
trust, which is the fate.

53
To summarize, drivers were likely to rely on fate when driving unsafely.
Furthermore, driver assistance systems might have encouraged drivers to take risks
no matter how skilled or unskilled they perceived themselves to be.

54
4
GENERAL RESULTS
4.1. Introduction
The aim of the current chapter is to investigate relationship between illusion of
control, perceived control, optimism bias, and locus of control. Additionally,
predictive power of these variables on two risky driving indicators, total number of
accidents and total number of tickets, will be examined.
4.2. Method
4.2.1. Measures
Driver Behavior Questionnaire- original, Driver Skill Inventory, illusion of control
measure, direct and indirect optimism bias measures, Rotter’s Internality-
Externality Scale, Multidimensional Traffic Locus of Control Scale, and
demography questions were used in the current analyses.
4.2.2. Participants
Sample characteristics were presented in page 26.

55
4.3. Results
4.3.1. Correlation analysis
A correlational analysis was performed to investigate relationship between control
variables, optimism bias variables, and locus of control variables (Table 4.3.1.).
Illusion of control was negatively correlated with IE (r = -.12). Drivers who were
prone to illusion of control were more likely to have an external locus of control.
Perceived control was negatively correlated with self scale (r = -.13) and fate scale
(r = -.13). Drivers perceiving high control on violations were less likely to attribute
accident causes to self-based causes and fate.
D measure was positively correlated with self (r = .19) and fate scales (r = .16). As
drivers made biased risk estimations of accident involvement, they were more likely
to attribute accident causes to fate and self-based factors. Consistent with this, the
ID measure was positively correlated with fate (r = .23). ID measure was negatively
correlated with the external scale of T-LOC (r = -.13); while, it was positively
correlated with Rotter’s externality (r = .12).
Table 4.3.1. Correlations among illusion of control, perceived control, optimism bias variables, locus of control scales 1 2 3 4 5 6 7 8 1. Illusion of control
1
2. Perceived control on violations
.149* 1
3. Direct measure
.009 -.086 1
4. Indirect measure
-.002 -.076 .354** 1
5. External -.007 .025 -.015 -.127* 1 6. Self .004 -.127* .190** .060 .302** 1

56
Table 4.3.1. continued 7. Fate -.110 -.133* .156** .228** .057 .066 1 8.Internality-externality
-.119* -.069 .099 .118* -.067 -.039 .265** 1
** p < .01 * p < .05
4.3.2. Logistic regression analysis
Two direct logistic regression analyses were conducted to investigate predictors of
total number of accidents and total number of tickets. Total number of accidents
and total number of tickets were recoded into dichotomous variables. Having zero
accidents was coded as “0” and having accidents was coded as “1”. For total
number of tickets, having zero ticket was coded as “0”, having tickets “1”.
The first direct logistic regression analysis was performed on the total number of
accidents as outcome variable and eleven variables as predictors: illusion of control,
perceived control, driving skills, safety skills, external scale, self scale, fate scale,
general locus of control, indirect optimism bias, direct optimism bias, self-risk
rating, and other-risk rating. Other-risk rating was excluded from analysis by the
program (SPSS 11.0) as a redundant variable.
A test of the full model with eleven predictors against a constant-only model was
significant; χ2 (11, N = 291) = 26.82, p = .005, and χ2 (8, N = 291) = 14.87, p = .06,
indicating that the predictors distinguished between drivers with no accidents and
drivers with accidents. Prediction success was 48 % for drivers with no accidents
and it was 72 % for drivers having accidents. Overall correct classification rate was
61 %.

57
According to Wald criterion illusion of control, perceived control on violations, and
safety skills (Wald = 6.25, p < .05, Wald = 7.74, p < .01, and Wald = 3.99, p < .05;
respectively) were significant predictors able to distinguish drivers without
accidents and with accidents. A unit increase in illusion of control decreased total
number of accidents 42 %. A unit increase in perceived control on violations
increased the total number accidents 84 %. Additionally, a unit increase in safety
skills decreased total number of accidents 36 % (Table 4.3.2.1.).
Table 4.3.2.1. Direct logistic regression analysis on total number of total accidents 95 % Confidence
Interval for Exp (B) B Wald
TestSignificance Exp (B) Lower Upper
Illusion of control
-.539 6.250 .012 .583 .382 .890
Perceived control on violations
.612 7.737 .005 1.844 1.198 2.839
Driving skills
.438 3.479 .062 1.549 .978 2.454
Safety skills
-.446 3.988 .046 .640 .413 .992
External .194 .244 .631 1.214 .753 1.957Self -.033 .045 .831 .968 .718 1.305Fate .111 .538 .463 1.118 .830 1.506Internality-externality
.507 3.386 .066 1.660 .968 2.847
Indirect measure
-.007 .006 .938 .993 .822 1.198
Direct measure
.152 .825 .364 1.164 .839 1.616
Self-risk -.154 1.867 .172 .858 .688 1.069Constant -4.428 5.754 .016 .012
Note: Illusion of control score was measured on a negative scale. An increasing negative numeric value corresponds to higher scale value; i.e. higher illusion of control. Therefore, a negative correlation coefficient sign indicates a positive relationship.
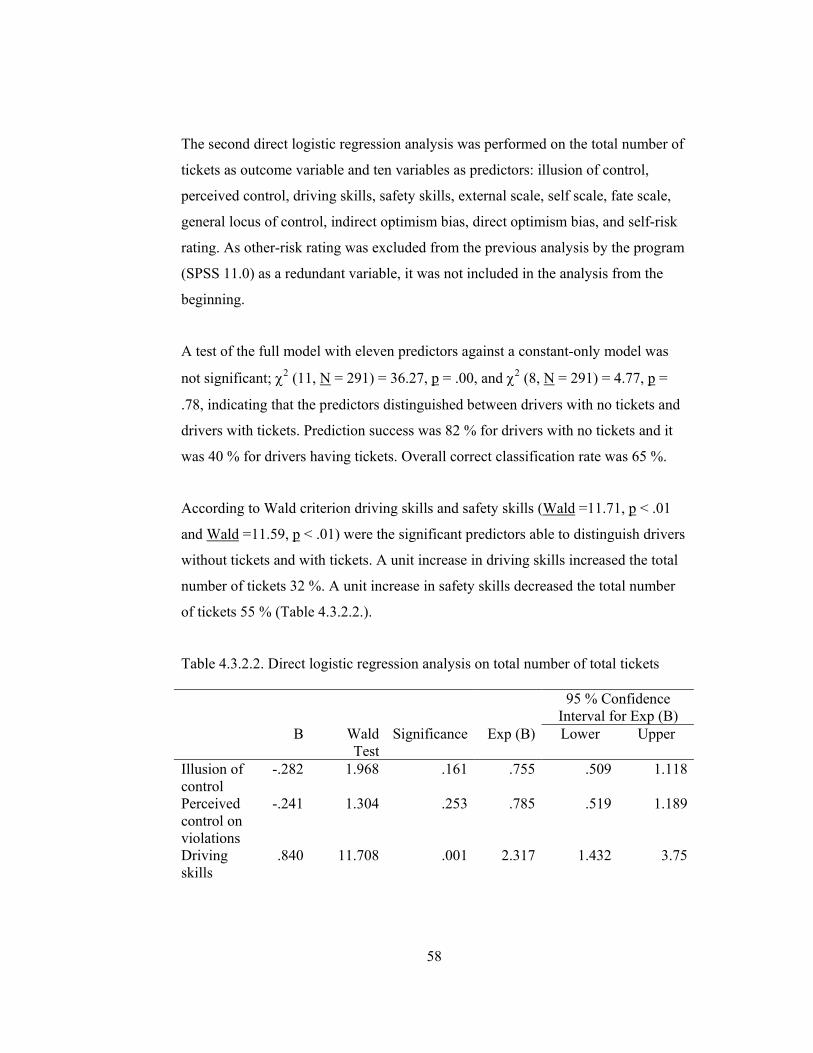
58
The second direct logistic regression analysis was performed on the total number of
tickets as outcome variable and ten variables as predictors: illusion of control,
perceived control, driving skills, safety skills, external scale, self scale, fate scale,
general locus of control, indirect optimism bias, direct optimism bias, and self-risk
rating. As other-risk rating was excluded from the previous analysis by the program
(SPSS 11.0) as a redundant variable, it was not included in the analysis from the
beginning.
A test of the full model with eleven predictors against a constant-only model was
not significant; χ2 (11, N = 291) = 36.27, p = .00, and χ2 (8, N = 291) = 4.77, p =
.78, indicating that the predictors distinguished between drivers with no tickets and
drivers with tickets. Prediction success was 82 % for drivers with no tickets and it
was 40 % for drivers having tickets. Overall correct classification rate was 65 %.
According to Wald criterion driving skills and safety skills (Wald =11.71, p < .01
and Wald =11.59, p < .01) were the significant predictors able to distinguish drivers
without tickets and with tickets. A unit increase in driving skills increased the total
number of tickets 32 %. A unit increase in safety skills decreased the total number
of tickets 55 % (Table 4.3.2.2.).
Table 4.3.2.2. Direct logistic regression analysis on total number of total tickets 95 % Confidence
Interval for Exp (B) B Wald
TestSignificance Exp (B) Lower Upper
Illusion of control
-.282 1.968 .161 .755 .509 1.118
Perceived control on violations
-.241 1.304 .253 .785 .519 1.189
Driving skills
.840 11.708 .001 2.317 1.432 3.75
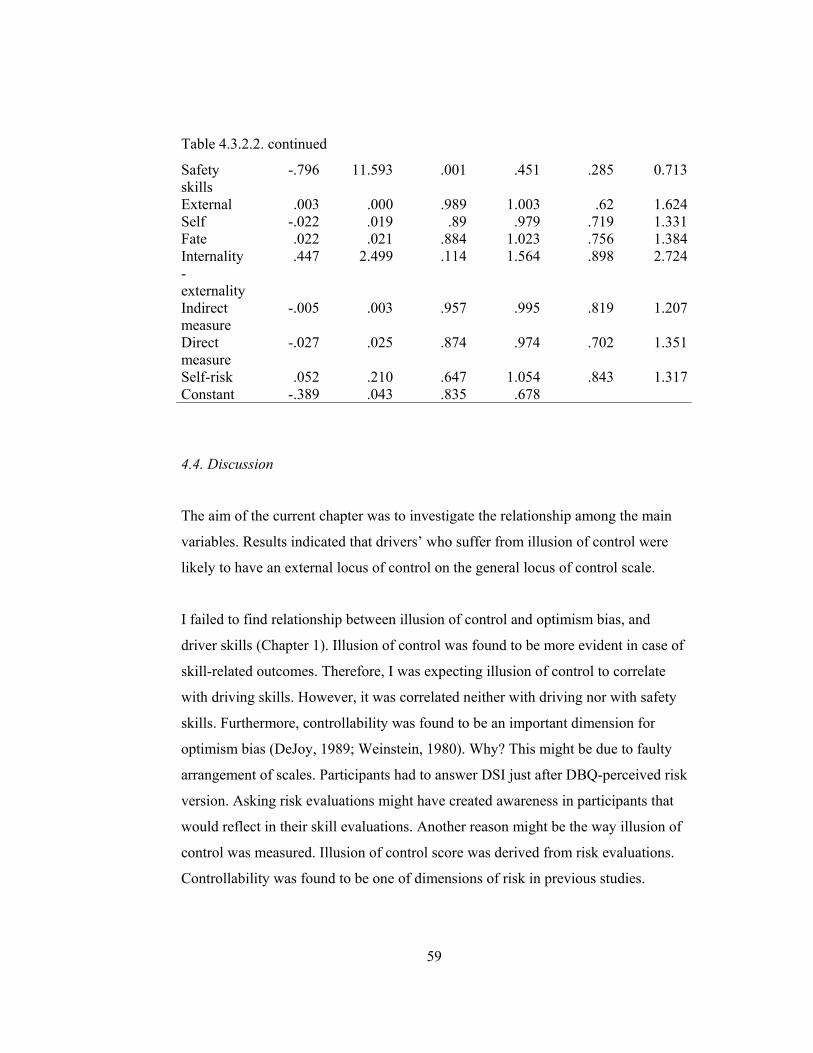
59
Table 4.3.2.2. continued
Safety skills
-.796 11.593 .001 .451 .285 0.713
External .003 .000 .989 1.003 .62 1.624Self -.022 .019 .89 .979 .719 1.331Fate .022 .021 .884 1.023 .756 1.384Internality-externality
.447 2.499 .114 1.564 .898 2.724
Indirect measure
-.005 .003 .957 .995 .819 1.207
Direct measure
-.027 .025 .874 .974 .702 1.351
Self-risk .052 .210 .647 1.054 .843 1.317Constant -.389 .043 .835 .678
4.4. Discussion
The aim of the current chapter was to investigate the relationship among the main
variables. Results indicated that drivers’ who suffer from illusion of control were
likely to have an external locus of control on the general locus of control scale.
I failed to find relationship between illusion of control and optimism bias, and
driver skills (Chapter 1). Illusion of control was found to be more evident in case of
skill-related outcomes. Therefore, I was expecting illusion of control to correlate
with driving skills. However, it was correlated neither with driving nor with safety
skills. Furthermore, controllability was found to be an important dimension for
optimism bias (DeJoy, 1989; Weinstein, 1980). Why? This might be due to faulty
arrangement of scales. Participants had to answer DSI just after DBQ-perceived risk
version. Asking risk evaluations might have created awareness in participants that
would reflect in their skill evaluations. Another reason might be the way illusion of
control was measured. Illusion of control score was derived from risk evaluations.
Controllability was found to be one of dimensions of risk in previous studies.

60
Although t-test analysis revealed significantly different risk evaluations for high
risk as a driver and high risk as a passenger versions of DBQ, mean differences
were small (∆ Mean = -.16). This might account for why the illusion of control
score did not yield expected relationships with optimism bias and driver skills.
Drivers who perceive their control on violations as high were less likely to attribute
causes of accidents to self-based and fate-related causes. The self scale of T-Loc
resembles internal locus of control, i.e. drivers attribute accidents to their own
behavior. Why do drivers perceive their control over driver behaviors high but fail
to appreciate their behaviors’ role on accident outcomes? It is possible that drivers
separate behaviors and outcomes. On the one hand, they believe they do not violate
frequently and have control on their violations (Chapter 1); on the other hand, they
are reluctant to accept that accidents, i.e. outcomes of their behaviors, are due to
their own behaviors. Drivers’ tendency to disregard self-based causes might have
defensive value (Kouabenan, 2002). Underestimating the responsibility of a
negative event might serve to protect self-esteem and might provide relieve from
feelings of blame.
Optimism bias in accident involvement estimations was positively related to fate as
loci of control and externality on the general locus of control construct. As drivers
perceived their personal risk to be involved in an accident as high, they were more
likely to attribute causes of accidents to fate and to general external factors.
Previous research revealed that externality was negatively correlated with
precautionary actions (e.g. Janicak, 1996; Montag & Comrey, 1987; Hoyt, 1973).
Why do drivers fail to make an attempt to take control of the situation, although
they perceive risk as high? This might be related to culture. Rothbaum, Weisz, and
Snyder (1982) approach control as a two process model and they make a distinction
between primary and secondary control. They argue that self is a more active agent
in primary control, while it is more passive and prefers going with the flow in

61
secondary control. They further argue that adaptation of primary or secondary
control is related to culture. Specifically, independent cultures are more likely to
adopt active, primary control, whereas dependent cultures are more likely to adopt
passive, secondary control. Accommodation to existing reality and circumstances is
more important for dependent and interdependent cultures (Weisz, Rothbaum, &
Blackburn, 1984). Therefore, it is reasonable for Turkish drivers to make external
attributions for accident causes. Continuing this tendency in high risk situations
might be related to defensive motives. Failure in a risky situation and confronting
negative outcomes, i.e. accidents, would be damaging for drivers’ self-esteem. It
would not be unexpected for them to attribute causes of accidents to external factors
rather than accepting their role in the situation, especially if the context is warning a
negative outcome, i.e. containing high risk.
Two results were contradictory with the above explanation. ID measure was
negatively correlated with the external scale of T-LOC. Furthermore, D measure
was positively correlated with the self scale. These results indicate that drivers who
estimate their personal risk to be involved in an accident as high were less likely to
attribute causes of accidents to external factors, but were more likely to make self-
based attributions. Furthermore, they were more likely to engage in violations
(Chapter 2). What might have caused these contradictory results? Indeed, this might
be reflection of admitting failure in safety practices. Although drivers continued
risky behavior, they were aware that their behaviors but not external factors were
the reason for accidents. On the one hand they accept being not perfect drivers; on
the other hand, they do not take an action to change the situation.
Logistic regression analyses indicated that illusion of control, perceived control on
violations, and safety skills were significant predictors of the total number of
accidents. A decrease in illusion of control decreased the total number of accidents.
Since the illusion of control was measured with negative values, a decreasing

62
negative numeric value has an increasing scale value. Thus, as the illusion of
control increased, the total number of accidents also increased. Perceived control on
violations had an incremental effect on the total number of accidents, either. It is
worth noting that the perceived control on violations was the most distinguishing
predictor among the three. This demonstrates how critical subjective control is for
the risk-taking behavior. Furthermore, as safety skills increased the total number of
accidents decreased. The safety skills scale was a consistent predictor in the two
direct logistic regression analyses. An increase in the safety skills led to a decrease
in the total number of tickets, either. Safety skills have a critical importance for
risky behavior. Driving skills promoted an increase in the total number of tickets.
These results are consistent with Sümer, Özkan, & Lajunen’s (2006) finding that
the safety skills buffer the negative effects of overconfidence in the driving skills on
risky behavior.
To summarize, the control variables were not related to the optimism bias variables.
Both of them were correlated with locus of control scales. The illusion of control,
perceived control on violations, and the safety skills were the significant predictors
of the total number of accidents, while driving and safety skills scale were the
predictors of the total number of tickets.
4.5. General Discussion
Drivers biased control estimations and risk assessments were found to influence
their skill evaluations and risk-taking in traffic. The current study aimed to
investigate the influence of cognitive biases among Turkish drivers.

63
The results established biased control and risk estimations of drivers. Nevertheless,
these constructs revealed inconsistent results with risk indicators, such as violations,
offences, and number of total accidents.
The limitations of the current study were related to measurement. Participants were
asked to answer DBQ for four times in two presentations. In one presentation they
were asked to report aberrant driver behavior and their control on the behavior. It is
plausible that participants were defensive in reporting frequency of behavior as high
but control on the behavior as low. Previous studies using DBQ yielded significant
results. However, in the current study DBQ scales were correlated only with two
variables of optimism bias.
A similar problem might have occurred in measurement of illusion of control.
Participants were asked to make risk evaluations in adjoining columns first thinking
themselves as drivers, second thinking themselves as passengers. Individuals strive
for consistency. Probably they were reluctant to give different scores for driver and
passenger conditions. Furthermore, feedback from four participants yielded that
they failed to read instruction about filling the questionnaire. Thus, it seemed they
were giving same answers twice. A small mean difference between two scales
implies that the majority of the participants experienced a similar situation.
An implication of the current study would be demonstrating the centrality of fate
among Turkish drivers. Previous research associated externality with risk-taking. In
the current sample a more specific external factor, fate, was found to be a consistent
determinant of risk estimations. Further research should investigate fate beliefs and
the concept of hope among drivers. It may be the case that belief in fate and hope
from the future promotes cognitive biases.
64
REFERENCES
Alicke, M. D., Klotz, M. L., Breitenbecher, D. L., Yurak, T. J., & Vredenburg, D.
S. (1995). Personal contact, individuation, and the better-than-average
effect. Journal of Personality and Social Psychology, 68 (5), 804-825.
Annual Traffic Statistics (2002). Ministry of Internal Affairs Security General
Directorate Traffic Education and Research Department, Ankara.
Arthur, W., Barrett, G. V., & Alexander, R. A. (1991). Prediction of vehicular
accident involvement: A meta-analysis. Human Performance, 4 (2), 89-
105.
Arthur, W. & Doverspike, D. (1992). Locus of control and auditory selective
attention as predictors of driving accident involvement: A comparative
longitudinal investigation. Journal of Safety Research, 23, 73-80.
Bandura, A. (1989). Human agency in social cognitive theory. American
Psychologist, 44 (9), 1175-1184.
Biner, P. M., Huffman, M. L., Curran, M. A., & Long, K. R. (1998). Illusory
control as a function of motivation for a specific outcome in a chance-
based situation. Motivation and Emotion, 22 (4), 277-291.
Blaine, B & Crocker J. (1993). Self-esteem and self-serving biases in reactions to
positive and negative events: An integrative review. In R. F. Baumeister
(Ed.). Self-esteem: The puzzle of low self-regard (pp 55-85). New York.
USA: Plenum Press.

65
Burger, J. M. (1986). Desire for control and illusion of control: The effects of
familiarity and sequence of outcomes. Journal of Research in Personality,
20 (1), 66-76.
Cohen, P. A., Sheposh, J. P., & Hillix, W. A. (1979). Situational and personality
influences on risk-taking behavior: Effects of task, sex, and locus of
control. Academic Psychology Bulletin, 1, 63-67.
Dağ, İ (1991). Rotter’ın iç-dış kontrol odağı ölçeği (RİDKOÖ)’nin üniversite
öğrencileir için güvenirliği ve geçerliği. Psikoloji Dergisi, 7 (26), 10-16.
DeJoy, D. M. (1989). The optimism bias and traffic accident risk perception.
Accident Analysis and Prevention, 21 (4), 333-340.
Evans, L. (1986). Risk homeostasis theory and traffic accident data. Risk Analysis,
6 (1), 81-94.
Evans, L. (1991). Traffic safety and the driver. New York: Van Nostrand Reinhold.
Fuller, R. (2000). The task-capability interface model of the driving process.
Recherche, Transports, Sécurité, 66, 47-59.
Garrity, R. D. & Demick, J. (2001). Relations among personality traits, mood states,
and driving behaviors. Journal of Adult Development, 8 (2), 109-118.
Goffmann, E. (1969). The presentation of self in everyday life. London: Penguin.

66
Guastello, S. J. & Guastello, D. D. (1986). The relation between locus of control
construct and involvement in traffic accidents. The Journal of Psychology,
120 (3), 293-297.
Hammond, T. B. & Horswill, M. S. (2002). The influence of desire for control on
drivers’ risk-taking behaviour. Transportation Research Part F, 4 (4),
271-277.
Harris, P. & Middleton, W. (1994). The illusion of control and optimism bias about
health: On being less at risk but no more in control than others. British
Journal of Social Psychology, 33, 369-386.
Hedlund, J. (2000). Risky business: Safety regulations, risk compensation, and
individual behavior. Injury Prevention, 6, 82-90.
Horswill, M. S. & McKenna, F. P. (1999b). the effect of perceived control on risk
taking. Journal of Applied Social Psychology, 29 (2), 377-391.
Horswill, M. S., Waylen, A. E., & Tofield, M. I. (2004). Drivers’ ratings of
different components of their own driving skill: A greater illusion of
superiority for skills that relate to accident involvement. Journal of
Applied Social Psychology, 34 (1), 177-195.
Hoyt, M. F. (1973). Internal-external control and beliefs about automobile travel.
Journal of Research in Personality, 7, 288-293.
Iversen, H. & Rundmo, T. (2002). Personality, risky driving and accident
involvement among Norwegian drivers. Personality and Individual
Differences, 33, 1251-1263.
67
Janicak, C. A. (1996). Predicting accidents at work with measures of locus of
control and job hazards. Psychological Reports, 78, 115-121.
Jones, J. W. & Wuebker, L. J. (1993). Safety locus of control and employees’
accidents. Journal of Business and Psychology, 7 (4), 449-457.
Klein, W. M. & Kunda, Z. (1994). Exaggerated self-assessments and the preference
for controllable risks. Organizational Behavior and Human Decision
Process, 59, 410-427.
Kobbeltvedt, T., Brun, W., & Laberg, J.C. (2004). Measuring and modelling risk in
a naturalistic setting. Journal of Risk Research, 7, 789-810.
Kos, J. M. & Clarke, V. A. (2001). Is optimistic bias influenced by control or
delay? Health Education Research, 16 (5), 533-540.
Kouabenan, D. R. (2002). Occupation, driving experience, and risk and accident
perception. Journal of Risk Research, 5 (1), 49-68.
Kunda, Z. (1990). The case for motivated reasoning. Psychological Bulletin, 108
(83), 480-498.
Lajunen, T. & Summala, H. (1995). Driver experience, personality, and skill and
safety motive dimensions in drivers’ self-assessments. Personality and
Individual Differences, 19, 307–318.
Lajunen, T. (1999). The role of personality characteristics in traffic accident
liability: Research findings and methodological considerations. Türk
Psikoloji Yazıları, 2 (4), 83-96.
68
Lajunen, T., &Özkan, T. (2004). Culture, safety culture, and traffic safety in Turkey
and in Europe. The Turkish Driver Behaviour Questionnaire (T-DBQ):
Validity and norms. Report no: SBB-3023. The Scientific and Technical
Research Council of Turkey (TÜBİTAK), June 2004, Ankara, Turkey.
Langer, E. J. (1975). The illusion of control. Journal of Personality and Social
Psychology, 32 (2), 311-328.
Lawton, R., Parker, D., Manstead, A.S.R., & Stradling, S. (1997). The role of affect
in predicting social behaviours: the case of road traffic violations. Journal
of Applied Social Psychology, 27, 1258-1276.
Lefcourt, H. M. (1982). Locus of control: Current trends in theory and research
(2nd ed.). Hillsdale, NJ: Erlbaum.
Levenson, H. (1981). Differentiating among internality, powerful others, and
chance. In H. M. Lefcourt (Ed.), Research with the locus of control
construct (pp. 15-63). New York: Academic Press.
Lewin, I. (1982). Driver training: A perceptual-motor skills approach. Ergonomics,
25, 917-924.
Lewinsohn, P. M., Mischel, W., Chaplin, W., & Barton, R. (1980). Social
competence and depression: The role of illusory self-perceptions. Journal
of Abnormal Psychology, 89, 203-212.
McKenna, F. P. (1993). It won’t happen to me: Unrealistic optimism or illusion of
control. British Journal of Psychology, 84 (1), 39-50.

69
McKenna, F. P., Stainer, R. A., Lewis, C. (1991). Factors underlying illusory self-
assessments of driving skill in males and females. Accident Analysis and
Prevention, 23 (1), 45-52.
Moen, B. E. & Rundmo, T. (2005). Predictors of unrealistic optimism: A study of
Norwegian risk takers. Journal of Risk Research, 8 (5), 363-382.
Montag, I. & Comrey, A. L. (1987). Internality and externality as correlates of
involvement in fatal driving accidents. Journal of Applied Psychology, 72
(3), 339-343.
Moore, S. M. & Ohtsuka, K. (1999). Beliefs about gambling among young people,
and their relation to problem gambling. Psychology of Addictive
Behaviors, 13, 339-347.
Naatanen, R. & Summala, H. (1974). A model for the role of motivational factors in
drivers’ decision-making. Accident Analysis and Prevention, 6, 243-261.
Özkan T. & Lajunen T. (2005). Multidimensional Traffic Locus of Control Scale
(T-LOC): Factor structure and relationship to risky driving. Personality
and Individual Differences, 38, 533-545.
Özkan, T., Lajunen, T. & KAistinen, J. (2005). Traffic locus of control, driving
skills, and attitudes towards in-vehicle technologies (ISA & ACC). 18th
ICTCT Workshop.
Özkan, T., Lajunen, T., & Summala, H. (2006). Driver Behaviour Questionnaire: A
follow-up study. Accident Analysis and Prevention, 38 (2), 386-395.

70
Parker, D., Manstead, S.R., Stradling, S.G., & Reason J.T. (1992). Determinants of
intention to commit driving violations. Accident Analysis and Prevention,
24 (2), 117-131.
Parker, D., West, R., Stradling, S.G, & Manstead, A.S.R. (1995). Behavioural
characteristics of and involvement in different types of traffic accident.
Accident Analysis and Prevention, 27 (4), 571-581.
Perloff, L. S. & Fetzer, B. K. (1986). Self-other judgments and perceived
vulnerability to victimization. Journal of Personality and Social
Psychology, 50 (3), 502-510.
Reason, J., Manstead, A, Stradling, S.G., Baxter, J., & Campbell, K. (1990). Errors
and violations on the roads: A real distinction? Ergonomics, 33 (10/11),
1315-1332.
Ross, C. E. & Broh, B. A. (2000). The roles of self-esteem and the sense of
personal control in the academic achievement process. Sociology of
Education, 73 (4), 270-284.
Rothbaum, F., Weisz, J. R., & Snyder, S. S. (1982). Changing the world and
changing the self: A two-process model of perceived control. Journal of
Personality and Social Psychology, 42 (1), 5-37.
Rothengatter, J. A. (2002). Drivers’ illusions- no more risk. Transportation
Research Part F, 5, 249-258.

71
Rothengatter, T. & Huguenin, R. D. (2004). Introduction. In T. Rothengatter & R.
D. Huguenin (Eds.). Traffic and transport Psychology (pp 3-7).
Amsterdam. Netherlands: Elsevier.
Rotter, J. B. (1966). Generalized expectancies for internal versus external control of
reinforcement. Psychological Monographs, 80, 1, whole no. 609.
Rutter, D.R., Quine L., & Albery I.P. (1998). Perceptions of risk in motorcyclists:
unrealistic optimism, relative realism and predictions of behaviour. British
Journal of Psychology, 89 (4), 681-696.
Seeman, M. & Seeman, T .E. (1983). Health behavior and personal autonomy: A
longitudinal study of sense of control in illness. Journal of Health and
Social Behavior, 24 (2), 144-160.
Shepperd, J. A., Carroll, P., Grace, J., & Terry, M. (2002). Exploring causes of
comparative optimism. Psychological Belgica, 42 (1), 65-98.
Skinner, E. A. (1996). A guide to constructs of control. Journal of Personality and
Social Psychology, 71 (3), 549-570.
Summala, H. (1997). Hierarchical model of behavioural adaptation and traffic
accidents. In J. A. Rothengatter & E. Carbonell Vaya (Eds.), Traffic and
Transport Psychology: Theory and application. Oxford: Pergamon.
Sümer, N. & Özkan, T. (2002). Sürücü davranışları, becerileri, bazı kişilik
özellikleri ve psikolojik belirtilerin trafik kazalarındaki rolleri. Türk
Psikoloji Dergisi, 50, 1-26.

72
Sümer, N., Özkan, T., & Lajunen, T. (2006). Asymmetric relationship between
driving and safety skills. Accident Analysis and Prevention, 38 (4), 703-
711.
Svenson, O. (1981). Are we all less risky and more skillful than our fellow drivers?
Acta Psychologica, 47, 143-148.
Svenson, O., Fischoff, B., & MacGregor, D. (1985). Perceived driving safety and
seatbelt usage. Accident Analysis and Prevention, 17 (2), 119-133.
Taylor, S. E. & Brown, J. D. (1988). Illusion and well-being: A social
psychological perspective on mental health. Psychological Bulletin, 103
(2), 193-210.
Terry, D. J., Galligan, R. F., & Conway, V. J. (1993). The prediction of safe sex
behavior: The role of intentions, attitudes, and control beliefs. Psychology
and Health, 8, 355-368.
Tesser, A. (1988). Toward a self-evaluation maintenance model of social behavior.
Advances in Experimental Psychology, 21, 181- 227.
Van der Pligt, J. (1996). Risk perception and self-protective behavior. European
Psychologist, 1 (1), 34-43.
Walton, D. & Bathurst, J. (1998). An exploration of the average driver’s speed
compared to perceived driver safety and driving skill. Accident Analysis
and Prevention, 30 (6), 821-830.

73
Walton, D. & McKeown, P. C. (2001). Drivers’ biased perceptions of speed and
safety campaign messages. Accident Analysis and Prevention, 33 (5), 629-
640.
Waylen, A. E., Horswill, M. S., Alexander, J. L., & McKenna, F. P. (2004). Do
expert drivers have a reduced illusion of superiority? Transportation
Research Part F, 7 (4-5), 323-331.
Weiner, B., Nierenberg, R., & Goldstein, M. (1976). Social learning (locus of
control) versus attributional (causal stability) interpretations of expectancy
of success. Journal of Personality, 44, 52-68.
Weinstein, N. D. (1980). Unrealistic optimism about future life events. Journal of
Personality and Social Psychology, 39 (5), 856-820.
Weinstein, N. D. (1987). Unrealistic optimism about susceptibility to health
problems: Conclusion from a community-wide sample. Journal of
Behavioral Medicine, 10 (5), 481-500.
Weisz, J. R., Rothbaum, F. M., & Blackburn, T. C. (1984). Standing out and
standing in: The psychology of control in America and Japan. American
Psychologist, 39 (9), 955-969.
Wilde, G. J. S. (1982). The theory of risk homeostasis: Implications for safety and
health. Risk Analysis, 2, 209-225.
Wilde, G. J. S. (1998). Risk homeostasis theory: An overview. Injury Prevention, 4,
89-91.

74
World Health Organization (WHO). Ten facts about road safety.
http://www.who.int/features /factfiles/roadsafety/01_en.html

75
APPENDICES
Appendix A- Demographic Information Sheet
SÜRÜŞ ANKETİ
Bu anket, Orta Doğu Teknik Üniversitesi Sosyal Psikoloji Yüksek Lisans
programını tamamlamak için yürütülen bir tez çalışmasına bilgi toplamak amacıyla
hazırlanmıştır. Ankette, trafikte karşılaşabileceğiniz bazı durumlardaki
davranışlarınız ile ilgili sorular yer almaktadır. Lütfen, soruları dikkatlice
okuyunuz. Size en uygun olduğunu düşündüğünüz tek bir seçeneği işaretleyiniz ve
gerektiğinde ilgili bölümü doldurunuz. Lütfen, bütün sorulara tek başınıza ve
içtenlikle cevap veriniz. Anket doldurma sırasında cevapları başkalarıyla
tartışmayınız. Bizim için önemli olan sizin bireysel olarak ne düşündüğünüz ve ne
yaşadığınızdır. Ankete isminizi veya herhangi bir kimlik bilginizi yazmayınız.
Verdiğiniz yanıtlar tamamen gizli tutulacak ve bireysel değerlendirme
yapılmayacaktır.
Değerli katkılarınız için teşekkür ederim.
Psk. Ebru Burcu DOĞAN
Akademik Danışman: Doç. Dr. Timo LAJUNEN
Orta Doğu Teknik Üniversitesi Psikoloji Bölümü
Güvenlik Araştırma Birimi
İletişim için: [email protected]
Telefon: 0312 2103154
1. Yaşınız: 2. Cinsiyetiniz: Erkek Kadın 3. En çok araç kullandığınız şehir: ___________________________
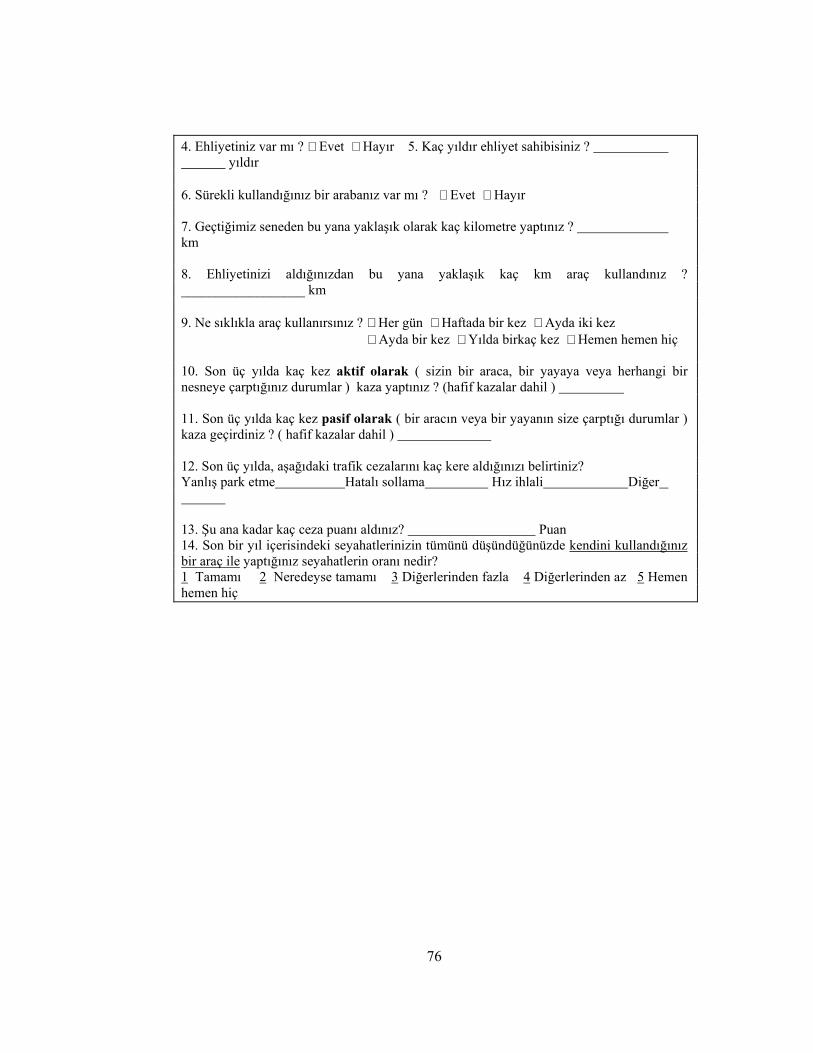
76
4. Ehliyetiniz var mı ? Evet Hayır 5. Kaç yıldır ehliyet sahibisiniz ? yıldır 6. Sürekli kullandığınız bir arabanız var mı ? Evet Hayır 7. Geçtiğimiz seneden bu yana yaklaşık olarak kaç kilometre yaptınız ? km 8. Ehliyetinizi aldığınızdan bu yana yaklaşık kaç km araç kullandınız ? __________________ km 9. Ne sıklıkla araç kullanırsınız ? Her gün Haftada bir kez Ayda iki kez Ayda bir kez Yılda birkaç kez Hemen hemen hiç 10. Son üç yılda kaç kez aktif olarak ( sizin bir araca, bir yayaya veya herhangi bir nesneye çarptığınız durumlar ) kaza yaptınız ? (hafif kazalar dahil ) 11. Son üç yılda kaç kez pasif olarak ( bir aracın veya bir yayanın size çarptığı durumlar ) kaza geçirdiniz ? ( hafif kazalar dahil ) 12. Son üç yılda, aşağıdaki trafik cezalarını kaç kere aldığınızı belirtiniz? Yanlış park etme Hatalı sollama Hız ihlali Diğer 13. Şu ana kadar kaç ceza puanı aldınız? Puan 14. Son bir yıl içerisindeki seyahatlerinizin tümünü düşündüğünüzde kendini kullandığınız bir araç ile yaptığınız seyahatlerin oranı nedir? 1 Tamamı 2 Neredeyse tamamı 3 Diğerlerinden fazla 4 Diğerlerinden az 5 Hemen hemen hiç
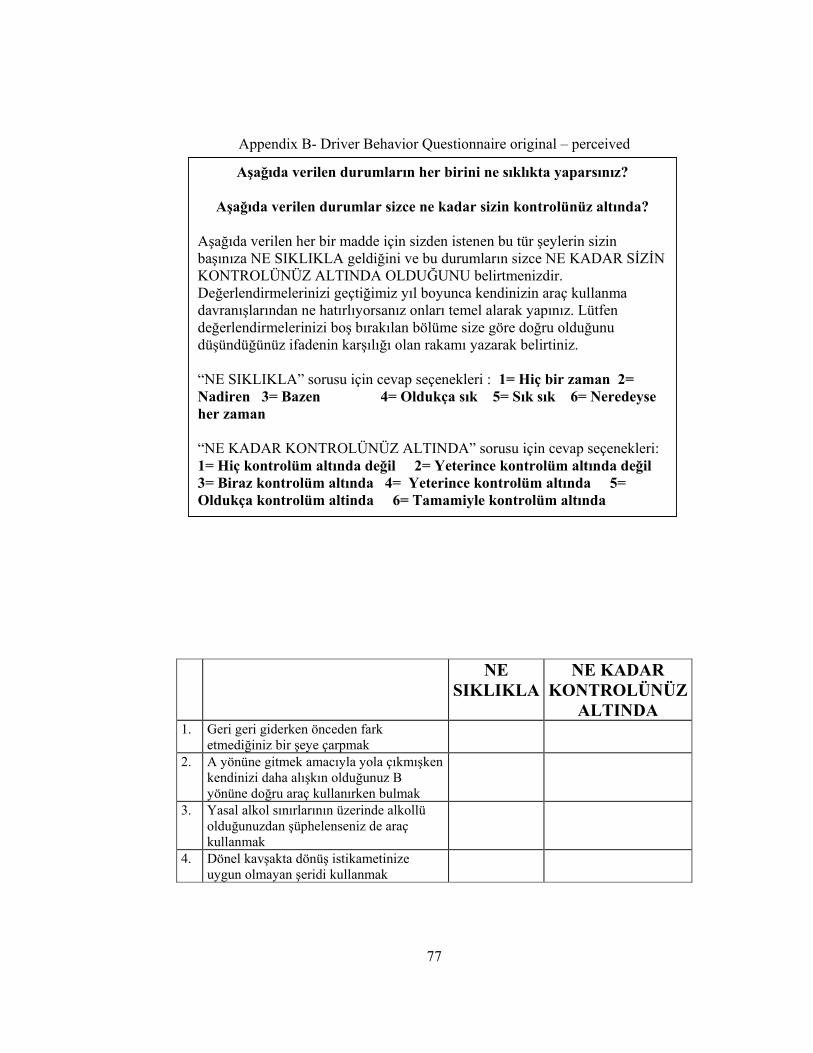
77
Appendix B- Driver Behavior Questionnaire original – perceived
control
NE SIKLIKLA
NE KADAR KONTROLÜNÜZ
ALTINDA 1. Geri geri giderken önceden fark
etmediğiniz bir şeye çarpmak
2. A yönüne gitmek amacıyla yola çıkmışken kendinizi daha alışkın olduğunuz B yönüne doğru araç kullanırken bulmak
3. Yasal alkol sınırlarının üzerinde alkollü olduğunuzdan şüphelenseniz de araç kullanmak
4. Dönel kavşakta dönüş istikametinize uygun olmayan şeridi kullanmak
Aşağıda verilen durumların her birini ne sıklıkta yaparsınız?
Aşağıda verilen durumlar sizce ne kadar sizin kontrolünüz altında?
Aşağıda verilen her bir madde için sizden istenen bu tür şeylerin sizin başınıza NE SIKLIKLA geldiğini ve bu durumların sizce NE KADAR SİZİN KONTROLÜNÜZ ALTINDA OLDUĞUNU belirtmenizdir. Değerlendirmelerinizi geçtiğimiz yıl boyunca kendinizin araç kullanma davranışlarından ne hatırlıyorsanız onları temel alarak yapınız. Lütfen değerlendirmelerinizi boş bırakılan bölüme size göre doğru olduğunu düşündüğünüz ifadenin karşılığı olan rakamı yazarak belirtiniz. “NE SIKLIKLA” sorusu için cevap seçenekleri : 1= Hiç bir zaman 2= Nadiren 3= Bazen 4= Oldukça sık 5= Sık sık 6= Neredeyse her zaman “NE KADAR KONTROLÜNÜZ ALTINDA” sorusu için cevap seçenekleri: 1= Hiç kontrolüm altında değil 2= Yeterince kontrolüm altında değil 3= Biraz kontrolüm altında 4= Yeterince kontrolüm altında 5= Oldukça kontrolüm altinda 6= Tamamiyle kontrolüm altında
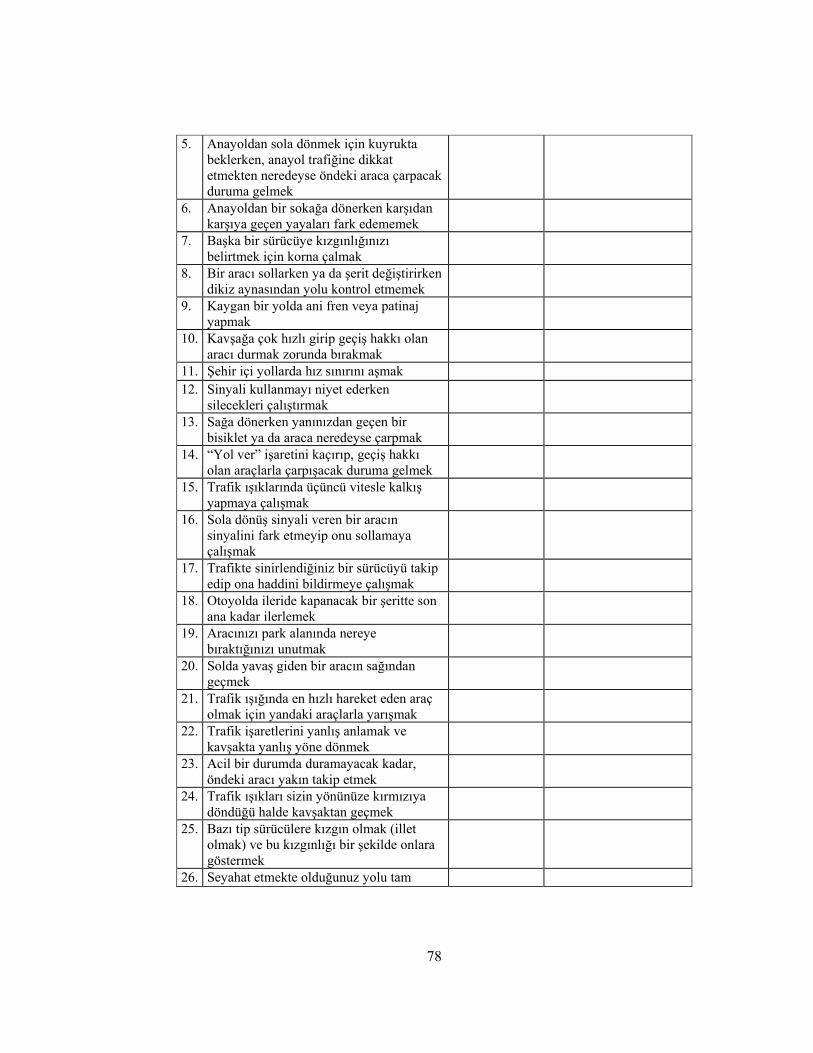
78
5. Anayoldan sola dönmek için kuyrukta beklerken, anayol trafiğine dikkat etmekten neredeyse öndeki araca çarpacak duruma gelmek
6. Anayoldan bir sokağa dönerken karşıdan karşıya geçen yayaları fark edememek
7. Başka bir sürücüye kızgınlığınızı belirtmek için korna çalmak
8. Bir aracı sollarken ya da şerit değiştirirken dikiz aynasından yolu kontrol etmemek
9. Kaygan bir yolda ani fren veya patinaj yapmak
10. Kavşağa çok hızlı girip geçiş hakkı olan aracı durmak zorunda bırakmak
11. Şehir içi yollarda hız sınırını aşmak 12. Sinyali kullanmayı niyet ederken
silecekleri çalıştırmak
13. Sağa dönerken yanınızdan geçen bir bisiklet ya da araca neredeyse çarpmak
14. “Yol ver” işaretini kaçırıp, geçiş hakkı olan araçlarla çarpışacak duruma gelmek
15. Trafik ışıklarında üçüncü vitesle kalkış yapmaya çalışmak
16. Sola dönüş sinyali veren bir aracın sinyalini fark etmeyip onu sollamaya çalışmak
17. Trafikte sinirlendiğiniz bir sürücüyü takip edip ona haddini bildirmeye çalışmak
18. Otoyolda ileride kapanacak bir şeritte son ana kadar ilerlemek
19. Aracınızı park alanında nereye bıraktığınızı unutmak
20. Solda yavaş giden bir aracın sağından geçmek
21. Trafik ışığında en hızlı hareket eden araç olmak için yandaki araçlarla yarışmak
22. Trafik işaretlerini yanlış anlamak ve kavşakta yanlış yöne dönmek
23. Acil bir durumda duramayacak kadar, öndeki aracı yakın takip etmek
24. Trafik ışıkları sizin yönünüze kırmızıya döndüğü halde kavşaktan geçmek
25. Bazı tip sürücülere kızgın olmak (illet olmak) ve bu kızgınlığı bir şekilde onlara göstermek
26. Seyahat etmekte olduğunuz yolu tam

79
olarak hatırlamadığınızı fark etmek 27. Sollama yaparken karşıdan gelen aracın
hızını olduğundan daha yavaş tahmin etmek
28. Otobanda hız limitlerini dikkate almamak

80
Appendix C- Driver Behavior Questionnaire-perceived risk
NE DERECE RİSKLİ SÜRÜCÜ
OLARAK ÖN KOLTUK
YOLCUSU OLARAK
1. Geri geri giderken önceden fark etmediğiniz bir şeye çarpmak
2. A yönüne gitmek amacıyla yola çıkmışken kendinizi daha alışkın olduğunuz B yönüne doğru araç kullanırken bulmak
3. Yasal alkol sınırlarının üzerinde alkollü olduğunuzdan şüphelenseniz de araç kullanmak
4. Dönel kavşakta dönüş istikametinize uygun olmayan şeridi kullanmak
5. Anayoldan sola dönmek için kuyrukta beklerken, anayol trafiğine dikkat etmekten neredeyse öndeki araca çarpacak duruma gelmek
6. Anayoldan bir sokağa dönerken karşıdan karşıya geçen yayaları fark edememek
Aşağıda verilen durumlar sizce ne derece riskli?
Aşağıda verilen her bir madde için sizden istenen bu tür şeylerin sizce NE DERECE RİSKLİ olduğunu kendinizi SÜRÜCÜ ve ÖN KOLTUK YOLCUSU olarak düşünüp AYRI AYRI belirtmenizdir. Değerlendirmelerinizi geçtiğimiz yıl boyunca kendinizin araç kullanma davranışlarından ne hatırlıyorsanız onları temel alarak yapınız. Lütfen değerlendirmelerinizi boş bırakılan bölüme size göre doğru olduğunu düşündüğünüz ifadenin karşılığı olan rakamı yazarak belirtiniz. “NE DERECE RİSKLİ” sorusu için cevap seçenekleri : 1= Hiç riskli değil 2= Çok az riskli 3= Biraz riskli 4= Riskli 5= Oldukça riskli 6= Çok riskli

81
7. Başka bir sürücüye kızgınlığınızı belirtmek için korna çalmak
8. Bir aracı sollarken ya da şerit değiştirirken dikiz aynasından yolu kontrol etmemek
9. Kaygan bir yolda ani fren veya patinaj yapmak
10. Kavşağa çok hızlı girip geçiş hakkı olan aracı durmak zorunda bırakmak
11. Şehir içi yollarda hız sınırını aşmak 12. Sinyali kullanmayı niyet ederken silecekleri
çalıştırmak
13. Sağa dönerken yanınızdan geçen bir bisiklet ya da araca neredeyse çarpmak
14. “Yol ver” işaretini kaçırıp, geçiş hakkı olan araçlarla çarpışacak duruma gelmek
15. Trafik ışıklarında üçüncü vitesle kalkış yapmaya çalışmak
16. Sola dönüş sinyali veren bir aracın sinyalini fark etmeyip onu sollamaya çalışmak
17. Trafikte sinirlendiğiniz bir sürücüyü takip edip ona haddini bildirmeye çalışmak
18. Otoyolda ileride kapanacak bir şeritte son ana kadar ilerlemek
19. Aracınızı park alanında nereye bıraktığınızı unutmak
20. Solda yavaş giden bir aracın sağından geçmek 21. Trafik ışığında en hızlı hareket eden araç
olmak için yandaki araçlarla yarışmak
22. Trafik işaretlerini yanlış anlamak ve kavşakta yanlış yöne dönmek
23. Acil bir durumda duramayacak kadar, öndeki aracı yakın takip etmek
24. Trafik ışıkları sizin yönünüze kırmızıya döndüğü halde kavşaktan geçmek
25. Bazı tip sürücülere kızgın olmak (illet olmak) ve bu kızgınlığı bir şekilde onlara göstermek
26. Seyahat etmekte olduğunuz yolu tam olarak hatırlamadığınızı fark etmek
27. Sollama yaparken karşıdan gelen aracın hızını olduğundan daha yavaş tahmin etmek
28. Otobanda hız limitlerini dikkate almamak

82
Appendix D- Driver Skill Inventory
1 2 3 4 5 1. Seri araç kullanma O O O O O 2. Trafikte tehlikeleri görme O O O O O 3. Sabırsızlanmadan yavaş bir aracın arkasından sürme O O O O O 4. Kaygan yolda araç hakimiyeti O O O O O 5. İlerideki trafik durumlarını önceden kestirme O O O O O 6. Belirli trafik ortamlarında nasıl hareket edileceğini
bilme O O O O O
7. Yoğun trafikte kolaylıkla şerit değiştirme O O O O O 8. Kesin kararlar alma O O O O O 9. Sinir bozucu durumlarda sakin davranma O O O O O 10. Aracı kontrol etme O O O O O 11. Yeterli takip mesafesi bırakma O O O O O 12. Koşullara göre hızı ayarlama O O O O O 13. Geriye kaçırmadan aracı yokuşta kaldırma O O O O O 14. Sollama O O O O O 15. Gerektiğinde (örn., tehlikelerden kaçınmak için) yasal
haklarınızdan “feragat etme” O O O O O
16. Hız sınırlarına uyma O O O O O 17. Gereksiz risklerden kaçınma O O O O O 18. Diğer sürücülerin hatalarını sükûnetle karşılamak O O O O O 19. Trafik ışıklarına dikkatle uyma O O O O O 20. Dar bir yere geri geri park edebilme O O O O O
Araç kullanırken güçlü ve zayıf yönleriniz nelerdir?
Özellikle araç kullanmanın farklı yönlerinde olmak üzere sürücüler arasında pek çok farklılıklar vardır. Hepimizin güçlü ve zayıf yönleri vardır. Lütfen, sizin güçlü ve zayıf yönlerinizi size göre doğru olan seçeneği işaretleyerek belirtiniz. Her bir soru için cevap seçenekleri: 1= Kesinlikle zayıf 2= Zayıf 3= Ne zayıf ne de güçlü 4= Güçlü 5= Kesinlikle güçlü

83
Appendix E- Direct Optimism Bias Measure
Ortalama bir sürücüye kıyasla, aşağıda belirtilen kaza türlerini geçirme
olasılığınız sizce nedir?
1 2 3 4 5 6 7 Ortalamanın çok altında
Ortalamanın altında
Ortalamanınbiraz altında
Ortalama Ortalamanınbiraz
üstünde
Ortalamanın üstünde
Ortalamanın çok üstünde
1 2 3 4 5 6 7 Önünüzdeki araca arkadan çarpma O O O O O O O Karşıdan gelen araçla kafa kafaya çarpışma O O O O O O O Aracınızın kontrolünü kaybettiğiniz için kaza yapma
O O O O O O O
Kavşakta kaza geçirme O O O O O O O
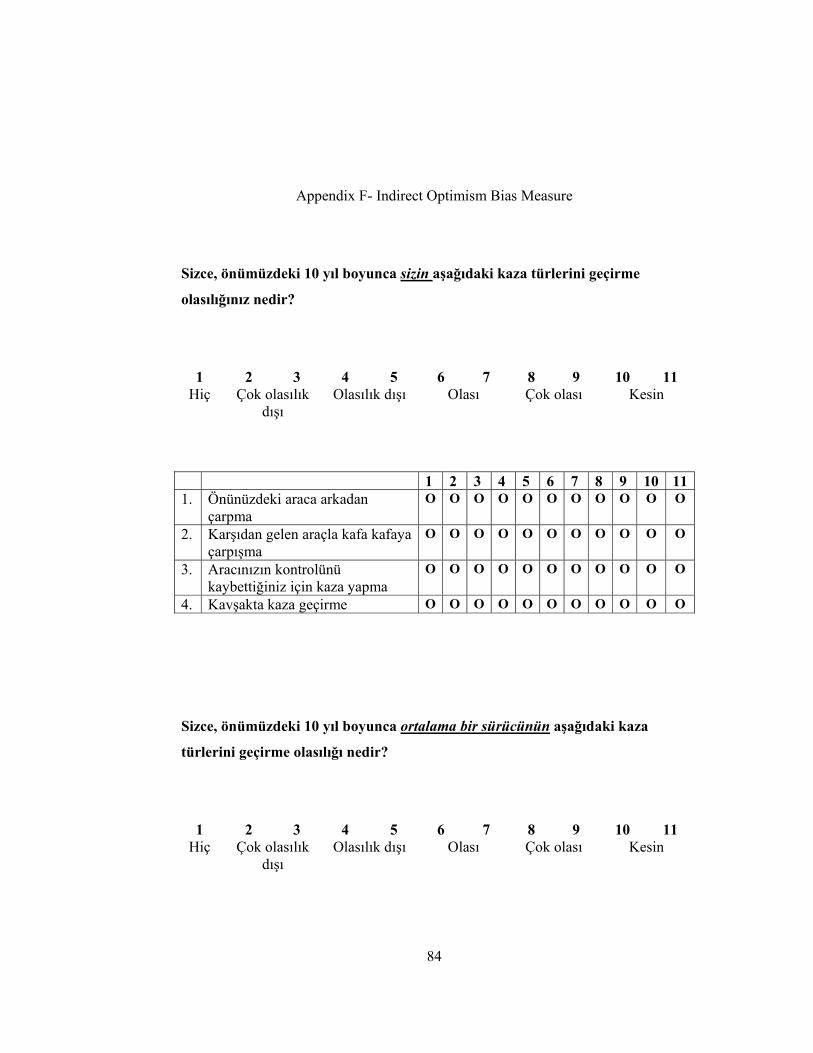
84
Appendix F- Indirect Optimism Bias Measure
Sizce, önümüzdeki 10 yıl boyunca sizin aşağıdaki kaza türlerini geçirme
olasılığınız nedir?
1 2 3 4 5 6 7 8 9 10 11 Hiç Çok olasılık
dışı Olasılık dışı Olası Çok olası Kesin
1 2 3 4 5 6 7 8 9 10 111. Önünüzdeki araca arkadan
çarpma O O O O O O O O O O O
2. Karşıdan gelen araçla kafa kafaya çarpışma
O O O O O O O O O O O
3. Aracınızın kontrolünü kaybettiğiniz için kaza yapma
O O O O O O O O O O O
4. Kavşakta kaza geçirme O O O O O O O O O O O
Sizce, önümüzdeki 10 yıl boyunca ortalama bir sürücünün aşağıdaki kaza
türlerini geçirme olasılığı nedir?
1 2 3 4 5 6 7 8 9 10 11 Hiç Çok olasılık
dışı Olasılık dışı Olası Çok olası Kesin

85
1 2 3 4 5 6 7 8 9 10 111. Önünüzdeki araca arkadan
çarpma O O O O O O O O O O O
2. Karşıdan gelen araçla kafa kafaya çarpışma
O O O O O O O O O O O
3. Aracınızın kontrolünü kaybettiğiniz için kaza yapma
O O O O O O O O O O O
4. Kavşakta kaza geçirme O O O O O O O O O O O

86
Appendix G- Multidimensional Traffic Locus of Control Scale
Bu bölümde, kaza yapmış araç sürücülerinin, yapmış oldukları kazalara neden
olarak gösterdikleri faktörler liste halinde verilmiştir. Kendi sürüş tarzınızı
düşündüğünüzde bu faktörlerin yapmış olduğunuz veya olabileceğiniz kazalardaki
olası etkisini ilgili yeri karalayarak belirtiniz. Her bir soru için cevap seçenekleri:
1= Hiç olası değil 2= Olası değil 3= Hem olası hem de olası değil 4= Olası 5=
Büyük olasılıkla (ihtimalle)
1 2 3 4 5 1. Trafik kazası yapıp yapmayacağım çoğunlukla
araç kullanma becerilerimin yetersizliğine bağlıdır O O O O O
2. Trafik kazası yapıp yapmayacağım çoğunlukla araç kullanırken yaptığım riskli davranışlara bağlıdır
O O O O O
3. Trafik kazası yapıp yapmayacağım çoğunlukla diğer sürücülerin araç kullanma becerilerinin yetersizliğine bağlıdır
O O O O O
4. Trafik kazası yapıp yapmayacağım çoğunlukla diğer sürücülerin araç kullanırken yaptığı riskli davranışlara bağlıdır
O O O O O
5. Trafik kazası yapıp yapmayacağım çoğunlukla kötü şansa (veya şansızlığa) bağlıdır
O O O O O
6. Trafik kazası yapıp yapmayacağım çoğunlukla bozuk ve tehlikeli yollara bağlıdır
O O O O O
7. Trafik kazası yapıp yapmayacağım çoğunlukla aşırı sürat yapmama bağlıdır.
O O O O O
8. Trafik kazası yapıp yapmayacağım çoğunlukla diğer sürücülerin aşırı sürat yapmasına bağlıdır
O O O O O
9. Trafik kazası yapıp yapmayacağım çoğunlukla öndeki araçları çok yakından takip edip etmeme bağlıdır
O O O O O
10. Trafik kazası yapıp yapmayacağım çoğunlukla diğer araç sürücülerinin kullandığım aracı yakın takip etmelerine bağlıdır
O O O O O
11. Trafik kazası yapıp yapmayacağım çoğunlukla k d b ğl d
O O O O O

87
kadere bağlıdır 12. Trafik kazası yapıp yapmayacağım çoğunlukla
kötü hava ve aydınlatma koşullarına bağlıdır O O O O O
13. Trafik kazası yapıp yapmayacağım çoğunlukla araçtaki mekanik bir arızaya bağlıdır
O O O O O
14. Trafik kazası yapıp yapmayacağım çoğunlukla diğer sürücülerin alkollü araç kullanmasına bağlıdır
O O O O O
15. Trafik kazası yapıp yapmayacağım çoğunlukla diğer sürücülerin tehlikeli bir şekilde hatalı sollama yapmasına bağlıdır
O O O O O
16. Trafik kazası yapıp yapmayacağım çoğunlukla tehlikeli bir şekilde hatalı sollama yapmama bağlıdır
O O O O O
17. Trafik kazası yapıp yapmayacağım çoğunlukla tesadüflere bağlıdır
O O O O O

88
Appendix H- Rotter’s Internality Externality Scale
a. Ana-babaları çok fazla cezalandırdıkları için çocukları problem oluyor. 1. b. Günümüz çocuklarının çoğunun problemi, ana-babaları tarafından aşırı serbest bırakılmalarıdır. a. İnsanların yaşamındaki mutsuzlukların çoğu, biraz da şanssızlıklarına bağlıdır.
2.
b. İnsanların talihsizlikleri kendi hatalarının sonucudur. a. Savaşların başlıca nedenlerinden biri, halkın siyasetle yeterince ilgilenmemesidir.
3.
b. İnsanlar savaşı önlemek için ne kadar çaba harcarsa harcasın, her zaman savaş olacaktır. a. İnsanlar bu dünyadaki hak ettikleri saygıyı er geç görürler. 4. b. İnsan ne kadar çabalarsa çabalasın ne yazık ki değeri genellikle anlaşılmaz. a. Öğretmenlerin öğrencilere haksızlık yaptığı fikri saçmadır. 5. b. Öğrencilerin çoğu, notların tesadüfi olaylardan etkilendiğini fark etmez. a. Koşullar uygun değilse insan başarılı bir lider olamaz. 6. b. Lider olamayan yetenekli insanlar fırsatları değerlendirememiş kişilerdir. a. Ne kadar uğraşsanız da bazı insanlar sizden hoşlanmaz. 7. b. Kendilerini başkalarına sevdiremeyen kişiler başkalarıyla nasıl geçinileceğini bilmeyenlerdir. a. İnsanın kişiliğinin belirlenmesinde en önemli rolü kalıtım oynar. 8. b. İnsanların nasıl biri olacaklarını kendi hayat tecrübeleri belirler. a. Bir şey olacaksa eninde sonunda olduğuna sık sık tanık olmuşumdur. 9. b. Ne yapacağıma kesin karar vermek kadere güvenmekten daima daha iyidir.
Bu anket bazı önemli oalyların insanları etkileme biçimini bulmayı amaçlamaktadır. Her maddede ‘a’ ya da ‘b’ harfleriyle gösterilen iki seçenek bulunmaktadır. Lütfen, her seçenek çiftinde sizin kendi görüşünüze göre gerçeği yansıttığına en çok inandığınız cümleyi (yalnız bir cümleyi) seçiniz ve bir yuvarlak içine alınız. Seçiminizi yaparken, seçmeniz gerektiğini düşündüğünüz veya doğru olmasını arzu ettiğiniz cümleyi değil, gerçekten daha doğru olduğuna inandığınız cümleyi seçiniz. Bu anket kişisel inançlarla ilgilidir; bunun için ‘doğru’ ya da ‘yanlış’ cevap diye bir durum söz konusu değildir. Bazı maddelerde her iki cümleye de inandığınızı ya da hiç birine inanmadığınızı düşünebilirsiniz. Böyle durumlarda, size en uygun olduğuna inandığınız cümleyi seçiniz. Seçim yaparken her bir cümle için bağımsız karar veriniz; önceki tercihlerinizden etkilenmeyiniz.

89
a. İyi hazırlanmış bir öğrenci için, adil olmayan bir sınav hemen hemen söz konusu olamaz.
10.
b. Sınav sonuçları derste işlenenle çoğu kez o kadar ilişkisiz oluyor ki, çalışmanın anlamı kalmıyor. a. Başarılı olmak çok çalışmaya bağlıdır; şansın bunda payı ya hiç yoktur ya da çok azdır.
11.
b. İyi bir iş bulmak, temelde, doğru zamanda doğru yerde bulunmaya bağlıdır. a. Hükümetin kararlarında sade vatandaş da etkili olabilir. 12. b. Bu dünya güç sahibi birkaç kişi tarafından yönetilmektedir ve sade vatandaşın bu konuda yapabileceği fazla bir şey yoktur. a. Yaptığım planları yürütebileceğimden hemen hemen eminimdir. 13. b. Çok uzun vadeli planlar yapmak her zaman akıllıca olmayabilir, çünkü birçok şey zaten iyi ya da kötü şansa bağlıdır. a. Hiç bir yönü iyi olmayan insanlar vardır. 14. b. Herkesin iyi bir tarafı vardır. a. Benim açımdan istediğimi elde etmenin talihle bir ilgisi yoktur. 15. b. Çoğu durumda, yazı-tura atarak da isabetli kararlar verebiliriz. a. Kimin patron olacağı, genellikle, doğru yerde ilk önce bulunma şansına kimin sahip olduğuna bağlıdır.
16.
b. İnsanlara doğru şeyi yaptırmak bir yetenek işidir; şansın bunda payı ya hiç yoktur ya da çok azdır. a. Dünya meseleleri söz konusu olduğunda, çoğumuz anlayamadığımız ve kontrol edemediğimiz güçlerin kurbanıyızdır.
17.
b. İnsanlar siyasal ve sosyal konularda aktif rol alarak dünya olaylarını kontrol edebilirler. a. Bir çok insan rastlantıların yaşamlarını ne derece etkilediğinin farkında değildir.
18.
b. Aslında ‘şans’ diye bir şey yoktur. a. İnsan, hatalarını kabul edebilmelidir. 19. b. Genelde en iyisi insanın hatalarını örtbas etmesidir. a. Bir insanın sizden gerçekten hoşlanıp hoşlanmadığını bilmek zordur. 20. b. Kaç arkadaşınızın olduğu, ne kadar iyi olduğunuza bağlıdır. a. Uzun vadede, yaşamınızdaki kötü şeyler iyi şeylerle dengelenir. 21. b. Çoğu talihsizlikler yetenek eksikliğinin, ihmalin, tembelliğin ya da her üçünün birden sonucudur. a. Yeterli çabayla siyasal yolsuzlukları ortadan kaldırabiliriz. 22. b. Siyasetçilerin kapalı kapılar ardında yaptıkları üzerinde halkın fazla bir kontrolü yoktur. a. Öğretmenlerin verdikleri notları nasıl belirlediklerini bazen anlayamıyorum 23. b. Aldığım notlarla çalışma derecem arasında doğrudan bir bağlantı vardır. a. İyi bir lider, ne yapacaklarına halkın bizzat karar vermesini bekler. 24. b. İyi bir lider herkesin görevinin ne olduğunu bizzat belirler. a. Çoğu kez başıma gelenler üzerinde çok az etkiye sahip olduğumu hissederim. 25. b. Şans ya da talihin yaşamımda önemli bir rol oynadığına inanmam.
26. a. İnsanlar arkadaşça olmaya çalışmadıkları için yalnızdırlar.

90
b. İnsanları memnun etmek için çok fazla çabalamanın yararı yoktur, sizden hoşlanırlarsa hoşlanırlar. a. Liselerde atletizme gereğinden fazla önem veriliyor. 27. b. Takım sporları kişiliğin oluşumu için mükemmel bir yoldur. a. Başıma ne gelmişse, kendi yaptıklarımdandır. 28. b. Yaşamımın alacağı yön üzerinde bazen yeterince kontrolümün olmadığını hissediyorum. a. Siyasetçilerin neden öyle davrandıklarını çoğu kez anlayamıyorum. 29. b. Yerel ve ulusal düzeydeki kötü idareden uzun vadede halk sorumludur.