ebookbits - cash back forex · pdf file visit for ... i'd also like to acknowledge robert...
TRANSCRIPT

http://eBookBits.com
visit for more:
Your Source For Knowledge

I(ane Trading on: Trading ABeD Patterns
by Jim I(ane Tips, ideas and t�chniques for market traders

Kane Trading on: Trading ABeD Patterns
By Jim Kane
KaneTrading.com

Kane Trading on: Trading ABCD Patterns
Copyright © 2003 by James J. Kane
Publ ished by Kane Trading
ALL RIGHTS RESERVED. No part of this publication may be reproduced, stored in a retrieval system or transmitted in any form or by any means, electronic, mechanical, photocopying, recording, scanning or otherwise, without prior written permission of the publisher and the author.
This publ ication is designed to provide accurate and authoritative information in regard to the subject matter covered. It is sold with the understanding that the publisher and the author are not engaged in rendering legal , accounting or other professional services. If professional advice or other expert assistance i s required, the services of a competent professional person should be sought.
Printed in the United States of America
Disclaimer
No claim is made by James J. Kane, or Kane Trading, that the trading methods shown in this book will result in profits, or will not result in losses. There is a substantial risk of loss in trading securities, options on securities, futures, options on futures or any other trading vehicle. Past performance is not indicative of future results. Trading securities, options on securities, futures, options on futures or any other trading vehicle may not be suitable for all recipients of this book. Always seek competent professional advice when considering any trade. All examples in this book are for educational purposes only. All material and examples in this book are based on information obtained from sources that are believed to be reliable, but which are not guaranteed as to their accuracy or completeness. Nothing in this book should be construed, in any way, shape or form, as a solicitation of any offer to buy or sell any trading instrument. James J. Kane, his family and friends, and associates of Kane Trading have at times in the past and may now or at times in the future, trade or have traded any or all of the issues used as educational examples in the book. Any thoughts or opinions expressed in this book are subject to change without notice. No information provided in this book should be construed in any way as an encouragement by the author, publisher or distributors to trade. Each trader must make his or her own decisions with regard to trading. Each trader must be responsible for his or her own decisions and his or her own actions, if any. Purchasing or reading this book or parts thereof constitutes acceptance of and agreement to this disclaimer and exempts the author, publisher and distributors from any and all liability and litigation.
v


Table of Contents
Acknowledgements . IX
Introduction 1
Chapter 1 The ABCD Pattern 5
Chapter 2 ABCD Pattern Criteria 21
Chapter 3 ABCD Points at Fibonacci Areas 53
Chapter 4 Alternate ABCD Patterns 93
Chapter 5 ABCD Time Symmetry 135
Conclusion 149
VB


Acknowledgements
In my evolution as a trader I 've read more material than I can even recall . The majority of this material has contributed very l ittle to my knowledge base. That lack of value, for me, in the material, in and of itself, is important information. It' s shown me, by a process of elimination, the things that don't help me, and I can use that information when formulating a trading plan.
In developing material related to Fibonacci trading, two sources have been of great help. I would l ike to acknowledge these sources, and recommend that readers look into their materials. See if they might be of as much help to your own trading, as they were to mine.
I 'd l ike to acknowledge Scott Carney over at Harmonic Trader. Scott' s book, The Harmonic Trader, and the material on his website (www.HarmonicTrader.com). opened my eyes to another way to view the markets. This was my first substantial introduction to the concepts of Fibonacci and harmonics in trading the markets. Scott has quite extensive information on harmonic patterns on his website and has developed several patterns of his own. Scott and I have since spent endless hours discussing harmonics and the markets. His historical knowledge of the markets is extraordinary and has contributed greatly to my own knowledge base.
I 'd also like to acknowledge Robert Miner at Dynamic Traders Group, Inc. (www.DynamicTraders.com). Robert' s book, Dynamic Trading™, was my next serious excursion into Fibonaccis and trading. This book is extensive beyond belief. There is so much material in Dynamic Trading ™ I would have to consider it must reading for anyone interested in increasing their knowledge of Fibonacci in trading and in Elliot wave analysis . Robert' s use of the time factor is also extensive and will open one 's eyes to factors outside of just price. Robert also has Dynamic Trader software available, which I,use for creating charts labeled with various Fibonacci, harmonic and time factors. It is the software that I used to create the charts for this book. I would like to extend an additional thanks and acknowledgement to Robert for allowing me to use these charts in my works. Information on his products is available on his website. I recommend checking it out to see if you feel that it has information that you can use to help your trading. His contributions in the field are practically immeasurable.
IX


Introduction
One way to determine a potential trade area is to look for a 'pattern' , and see where it completes. There are, perhaps, more potential types of patterns than there are traders. Traders have to decide for
'themselves which patterns, if
any, work for their own style of trading. I have found several patterns that I particularly l ike for my own trading. One very simple pattern that I really like is called the ABCD.
The ABCD pattern is simply a 'two-step' pattern, where price moves for a bit, then 'corrects ' , and then continues to move in the original direction. This forms a pattern that looks somewhat l ike a 'zigzag' , and the ABCD is sometimes called a 'zigzag' pattern. When the pattern fits a certain set of criteria it becomes much more useful for my trading, and it is in this context that I will present the pattern and the variations that I look for.
The ABCD pattern goes by many different names, and has been presented in many different ways, in many different contexts. In Elliot wave analysis there is the ' abc' correction, and if it is a 'regular' or ' simple' correction, it has relatively equal a and c legs, and is essentially the same thing as the ABCD, as far as how it appears. In fact, the ABCD is sometimes referred to as AB=CD by some sources. I don't particularly care for using AB=CD, because, as you will see, the AB leg frequently does not equal the CD leg in the pattern as I sometimes trade it.
I have also opted not to use the Elliot wave terminology of abc for the pattern, for the following reasons. In Elliot wave analysis the abc is generally used to label a wave 2 or wave 4 correction (most commonly a wave 2 correction). The abc correction, in this context, does not necessarily have to be a 'two-step' or 'zigzag' pattern to still be called an abc, and is generally a correction to an existing trend.
Also, in Elliot wave analysis, the legs of the abc will also require a certain wave substructure to them, and the ABCD pattern, as I present it, does not. When I utilize the pattern that I will be presenting, it will always be a 'twostep' or 'zigzag' pattern, and it does not necessarily have to be in the context of a correction to a trend, although that is the most common context that I trade it in.
1

This leaves me with calling the pattern the ABCD, and I think that is the most common term I come across for this pattern. Perhaps I would be better off 'renaming' what I wil l present here, since it will be somewhat unique, with all the 'twists ' I will add. I have decided to just stick with the term ABCD, and hope that it is understood that this won't constrain me to follow any of the ' guidelines' for similar patterns presented by any other authors.
Before I move on to the pattern, I want to make one thing clear to the reader. This book is very 'Fibonacci intensive ' . I must make assumptions that my readers have a very solid knowledge of Fibonacci retracements, both internal and external, as well as an understanding of the concept of price projections. I will also be using additional Fibonacci numbers that the reader may not be familiar with. All of these retracement and projection concepts, as well as the additional F ibonacci numbers that I have derived, are presented in detail in my book Kane Trading on: Advanced Fibonacci Trading Concepts.
There is just no way I could produce this book without an assumption of this prerequisite knowledge. I want to be clear, though, I did not do this so I could sell more books. The ABCD pattern, as I present it, requires knowledge of these techniques. There is just no way around that. And since I use many additional Fibonacci derived numbers in my own trading, I must use them in presenting the techniques that I use. This requires me to use these additional numbers in this book.
The scope of this book does not allow me derive all these numbers here, as that was done in Kane Trading on: Advanced Fibonacci Trading Concepts. If the reader wants to just take the additional numbers used here, and use them without knowing how they were derived, that is up to the reader. I strongly suggest, though, that you fully understand where something comes from before you consider its use. Regardless of that consideration, the derivations of these additional numbers are not required to understand the ABCD pattern.
Finally, I want to be clear that this pattern is used, in my trading, to help me find potential trade areas, what I call PTA's . It is important for the reader to understand how this fits into the 'Plan for a Trade' (the so-called 'Critical Elements of a Trade'), and the master 'Trading Plan' . This is outlined in two free articles on the Kane Trading website, entitled: Kane Trading on: The Critical Elements of a Trade and Kane Trading on: The Difference Between a 'Plan for a Trade' and the 'Trading Plan' .
2

These articles will give the reader the background to understand the context of the 'potential trade area' within my overall game plan. I ask that the reader read these articles before proceeding forward. With that said, let 's move on to the pattern.
3

Chapter 1
The ABeD Pattern
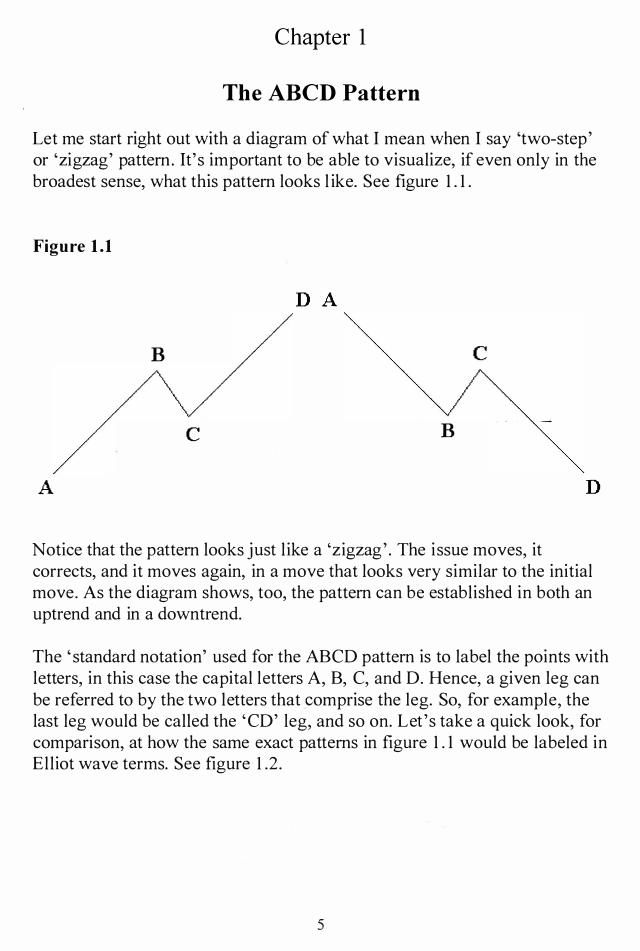
Let me start right out with a diagram of what I mean when I say 'two-step' or 'zigzag' pattern. It' s important to be able to visualize, if even only in the broadest sense, what this pattern looks l ike. See figure 1 . 1 .
Figure 1.1
DA
B
c B
A D
Notice that the pattern looks just like a 'zigzag' . The issue moves, it corrects, and it moves again, in a move that looks very similar to the initial move. As the diagram shows, too, the pattern can be established in both an uptrend and in a downtrend.
The ' standard notation' used for the ABCD pattern is to label the points with letters, in this case the capital letters A, B, C, and D. Hence, a given leg can be referred to by the two letters that �omprise the leg. So, for example, the last leg would be called the 'CD' leg, and so on. Let 's take a quick look, for comparison, at how the same exact patterns in figure 1 . 1 would be labeled in Elliot wave terms. See figure 1 .2 .
5
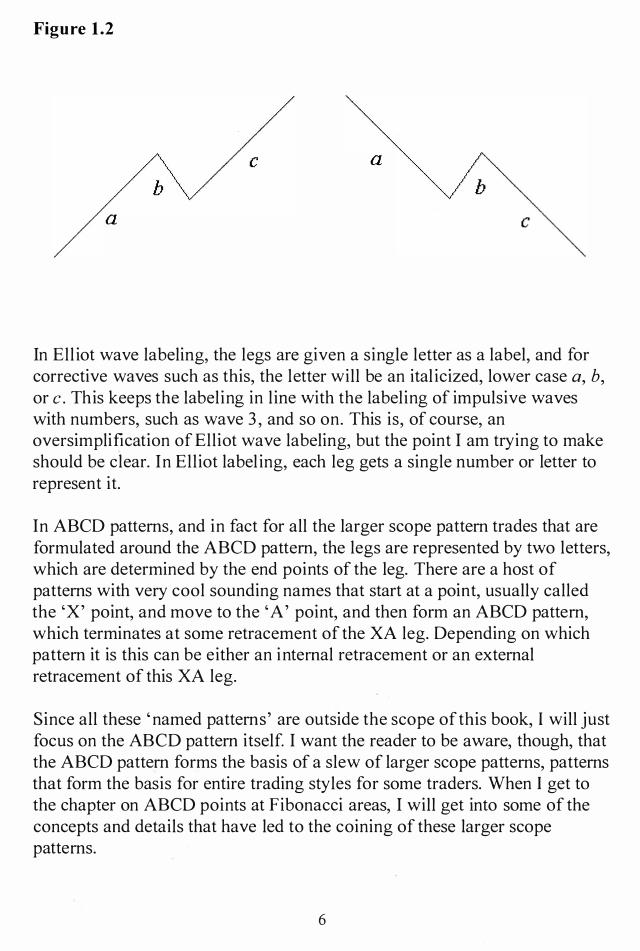
Figure 1.2
a
a
In Ell iot wave labeling, the legs are given a single letter as a label, and for corrective waves such as this, the letter will be an ital icized, lower case G, b, or c. This keeps the labeling in line with the labeling of impulsive waves with numbers, such as wave 3 , and so on. This is, of course, an oversimplification of Elliot wave labeling, but the point I am trying to make should be clear. In Elliot label ing, each leg gets a single number or letter to represent it.
In ABeD patterns, and in fact for all the larger scope pattern trades that are formulated around the ABeD pattern, the legs are represented by two letters, which are determined by the end points of the leg. There are a host of patterns with very cool sounding names that start at a point, usually called the 'X' point, and move to the 'A' point, and then form an ABeD pattern, which terminates at some retracement of the XA leg. Depending on which pattern it is this can be either an internal retracement or an external retracement of this XA leg.
Since all these ' named patterns' are outside the scope of this book, I will just focus on the ABeD pattern itself. I want the reader to be aware, though, that the ABeD pattern forms the basis of a slew of larger scope patterns, patterns that form the basis for entire trading styles for some traders. When I get to the chapter on ABeD points at Fibonacci areas, I will get into some of the concepts and details that have led to the coining of these larger scope patterns.
6
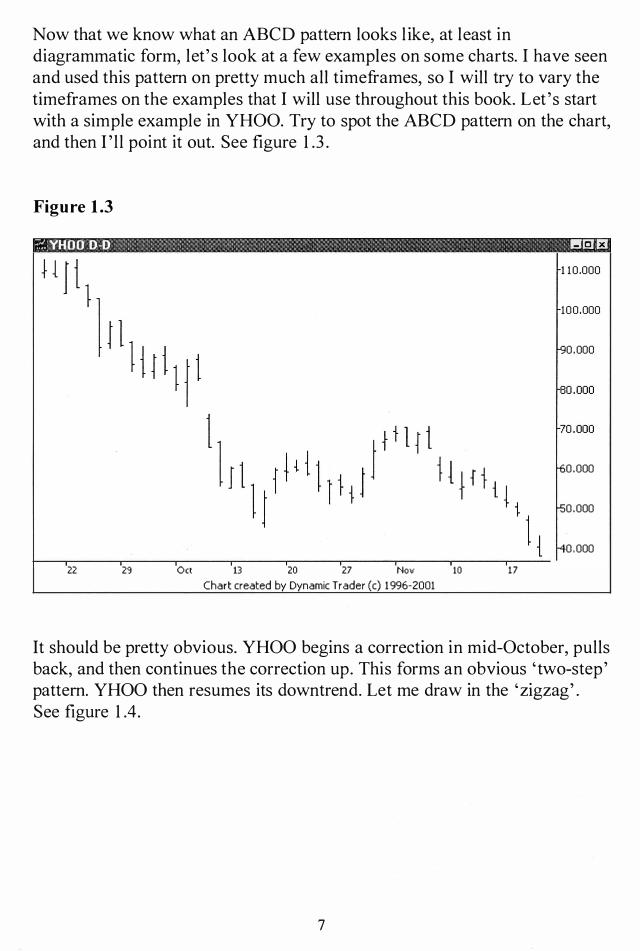
Now that we know what an ABCD pattern looks l ike, at least in diagrammatic form, let' s look at a few examples on some charts. I have seen and used this pattern on pretty much all timeframes, so I will try to vary the timeframes on the examples that I will use throughout this book. Let 's start with a simple example in YHOO. Try to spot the ABCD pattern on the chart, and then I ' ll point it out. See figure 1 .3 .
Figure 1.3
::''1. YHOO D-D I!!GI £J
1 10 .000
100.000
0 .000
70.000
0 .000
0 .000
0 .000
22 29 0ct 13 20 27 Nov 10 17
Chart created by Dynamic Trader (c) 1 996-2001
It should be pretty obvious. YHOO begins a correction in mid-October, pulls back, and then continues the correction up. This forms an obvious 'two-step' pattern. YHOO then resumes its downtrend. Let me draw in the 'zigzag' . See figure 1 .4.
7

Figure 1.4
?: YHOO 0-0 1!!!18 EJ
1 1 0.000
100 .000
D 70.000
A
22 29 0ct 13 20 27 Nov 10 17
Chart created by Dynamic Trader (c) 1996-2001
The first thing I notice when I look at this 'zigzag' , as compared to the diagrammatic 'zigzag' , is that it' s not quite as ' symmetrical ' . Although I prefer textbook symmetry, I rarely find it in real-world examples. As this book progresses, you wil l learn what criteria I use to evaluate a potential ABCD pattern. Although symmetry is important, it ' s not the most important criterion.
Let's examine the symmetry here, though, before I move on with this example. What makes the 'zigzag' asymmetrical? Well, the CD leg is not rising as steep as the AB leg. The uptrend is not as strong in this second leg as it is in the first leg. Look at the time relationship of the AB and CD legs, too. The AB leg spans four bars, and the CD leg spans nine. If these legs were time symmetrical, the number of bars would be equal . I prefer to see a fairly close number of bars in the AB and CD legs, but I won't pass a trade over based on just this one factor.
And how about the CD leg? Do you see it as longer than the AB leg? If so, you're about to be surprised. Longer doesn't mean the CD line I 've drawn on the chart is longer than the AB line, it means having a greater price move.
8
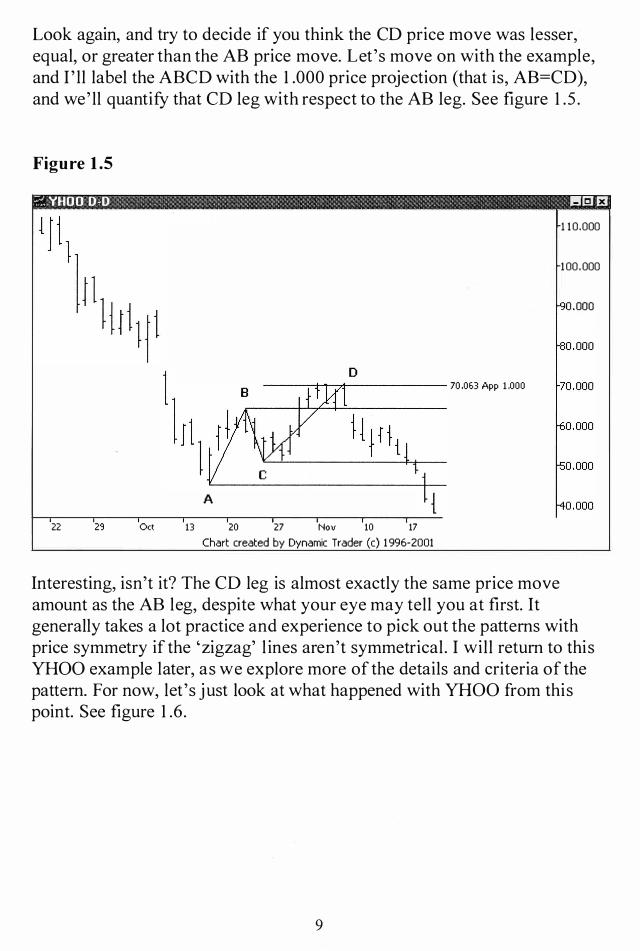
Look again, and try to decide if you think the CD price move was lesser, equal, or greater than the AB price move. Let's move on with the example, and I ' ll label the ABCD with the 1 .000 price projection (that is, AB=CD), and we' ll quantify that CD leg with respect to the AB leg. See figure 1 .5 .
Figure 1.5
::.-:: YHOO D-D B8 £J
1 10.000
100 .000
D ---;-.t-'�r------ 70.053 App 1 .000 70.000
A { 22 Oct 13 20 27 Nov 10 17
Chart created by Dynamic Trader (c) 1 996-2001
Interesting, isn't it? The CD leg is almost exactly the same price move amount as the AB leg, despite what your eye may tell you at first. It generally takes a lot practice and experience to pick out the patterns with price symmetry if the 'zigzag' l ines aren't symmetrical. I will return to this YHOO example later, as we explore more of the details and criteria of the pattern. For now, let 's just look at what happened with YHOO from this point. See figure 1 .6.
9
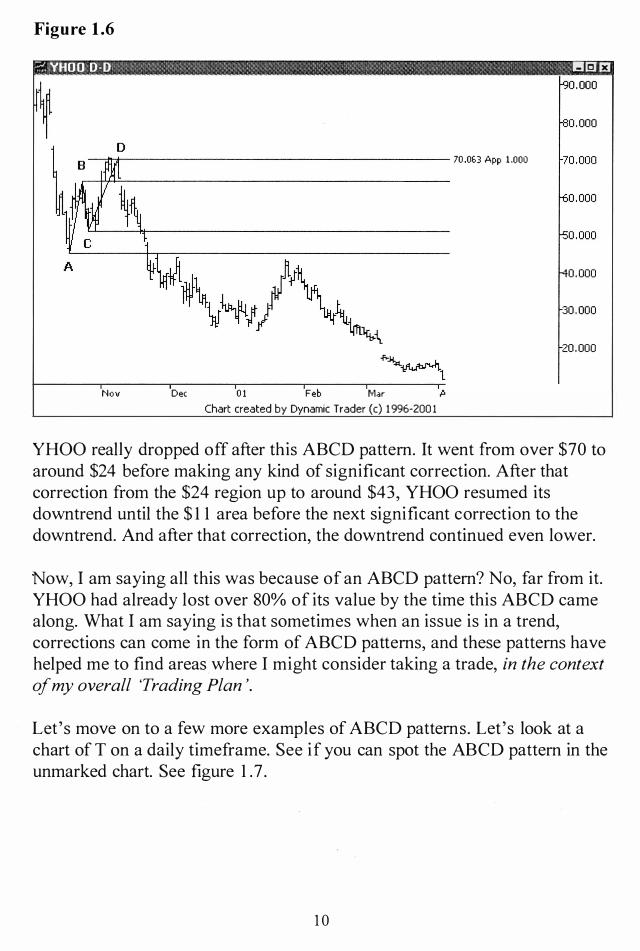
Figure 1.6
?: YHOO D-D !IS £J
v k "r--+-4-+'°=---________________ 70.063 App 1.000
30 . 000
20 . 000
Nov Dec 01 Feb Mar f> Chart created by Dynamic Trader (c) 1 996-200 1
YHOO really dropped off after this ABeD pattern. It went from over $70 to around $24 before making any kind of significant correction. After that correction from the $24 region up to around $43, YHOO resumed its downtrend until the $ 1 1 area before the next significant correction to the downtrend. And after that correction, the downtrend continued even lower.
Now, I am saying all this was because of an ABeD pattern? No, far from it. YHOO had already lost over 80% of its value by the time this ABeD came along. What I am saying is that sometimes when an issue is in a trend, corrections can come in the form of ABeD patterns, and these patterns have helped me to find areas where I might consider taking a trade, in the context of my overall 'Trading Plan '.
Let's move on to a few more examples of ABeD patterns. Let's look at a chart of T on a daily timeframe. See if you can spot the ABeD pattern in the unmarked chart. See figure 1 .7 .
1 0
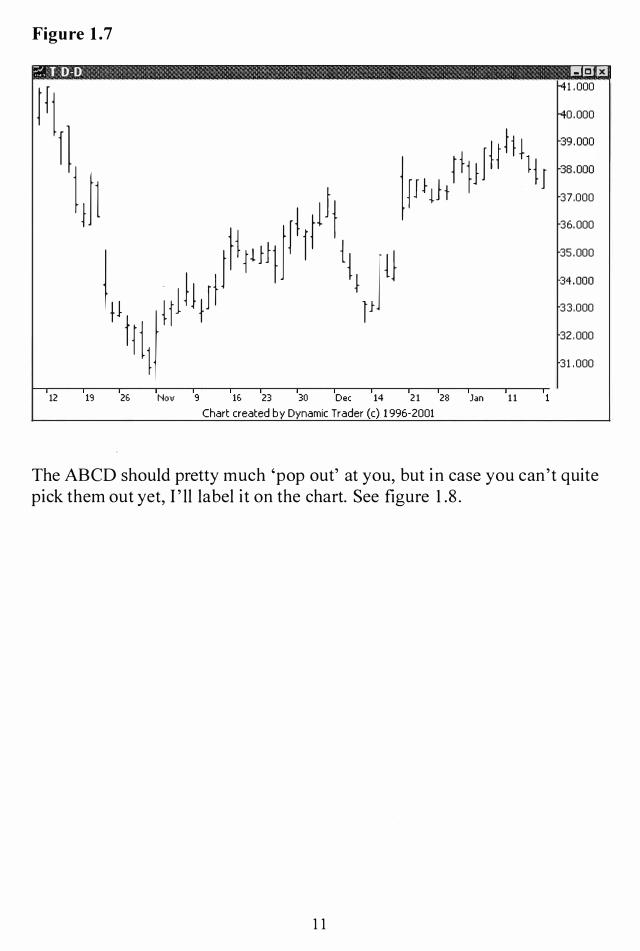
Figure 1.7
?: T D-D I!!!I(;U3 Fj fJ 1)]1
12 19
Illlj 1 ttll!!i)}l f lj It! jJ H1JJ}It IF tull
2f, Nov 9 1f, 23 30 Dec 14
Hh+ t filII ltJ F}�h
21 28 Jan 11
Chart created by Dynamic Trader (c) 1996-2001
1 .000
0 .000
39 .000
38 .000
37.000
36.000
35 .000
34 .000
33.000
32 .000
31 . 000
The ABeD should pretty much 'pop out' at you, but in case you can't quite pick them out yet, I ' ll label it on the chart. See figure 1 .8 .
1 1
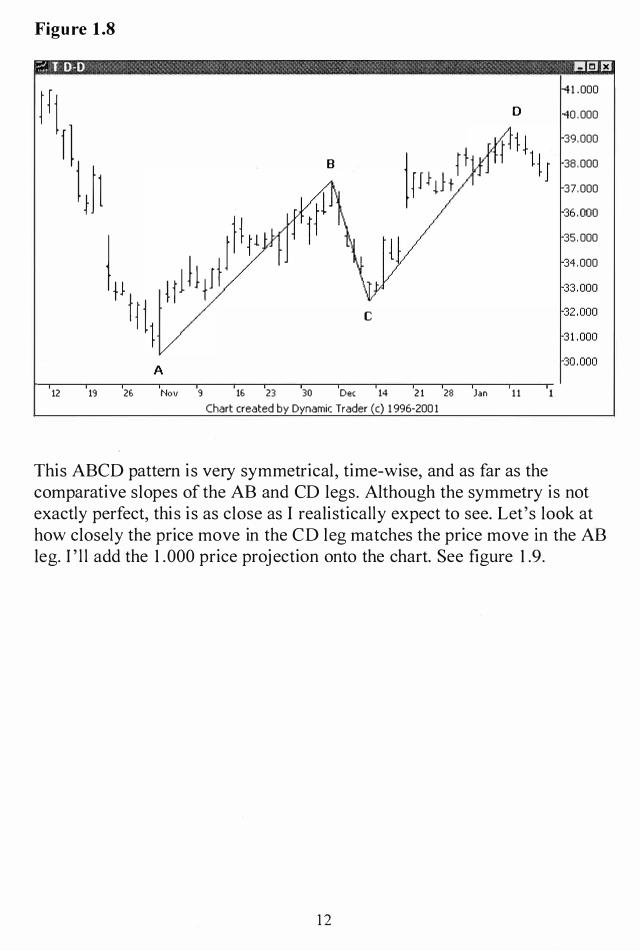
Figure 1.8
?, T D-D 1!113 F3 Fj 1 .000
0 0 . 000 f] 39.000
B
j 11 38 .000 j ttl iP�h 37.000
36 .000
II) ) j� jl 35 . 000
34 .000
til hill 33. 000 tit C 32 .000
1 31 .000
A 30.000
12 19 26 Nov 9 16 23 30 Dec 14 2 1 28 Jan 1 1
Chart created by Dynamic Trader (c) 1 996-200 1
This ABCD pattern is very symmetrical, time-wise, and as far as the comparative slopes of the AB and CD legs. Although the symmetry is not exactly perfect, this i s as close as I realistically expect to see. Let's look at how closely the price move in the CD leg matches the price move in the AB leg. I ' l l add the 1 .000 price projection onto the chart. See figure 1.9.
1 2
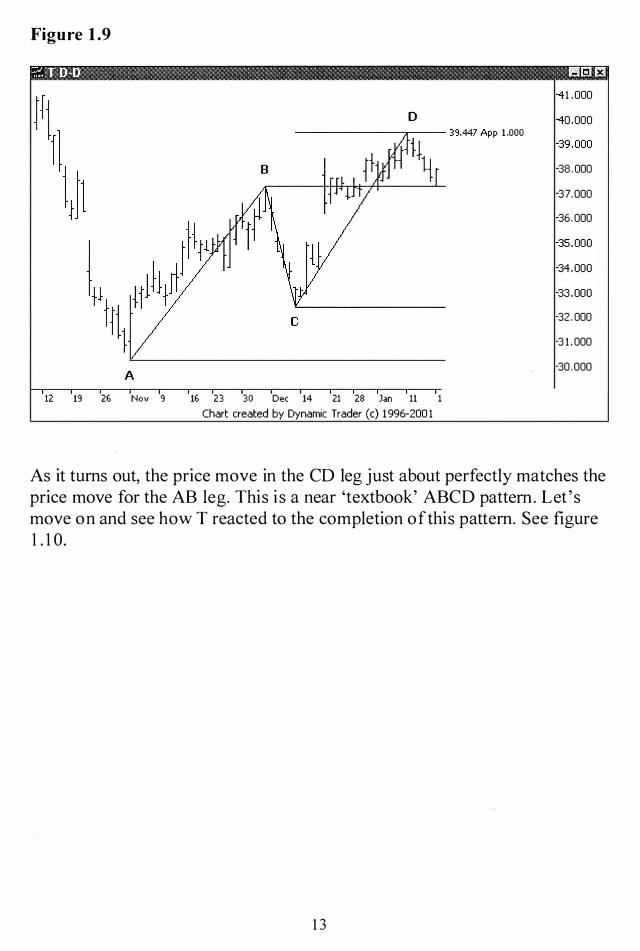
Figure 1.9
D -----------,.------ 39.447 App 1 .000
c
A 12 19 26 Nov 9 16 23 30 Dec 14 21 28 Jan 11 1
Chart created by Dynamic Trader (c) 1 996-200 1
1 .000
0 .000
39.000
38 . 000
37.000
36. 000
35 .000
34.000
33.000
32 . 000
3 1 . 000
30 .000
As it turns out, the price move in the CD leg just about perfectly matches the price move for the AB leg. This i s a near 'textbook' ABCD pattern. Let ' s move on and see how T reacted to the completion of this pattern. See figure 1 . 1 0.
1 3
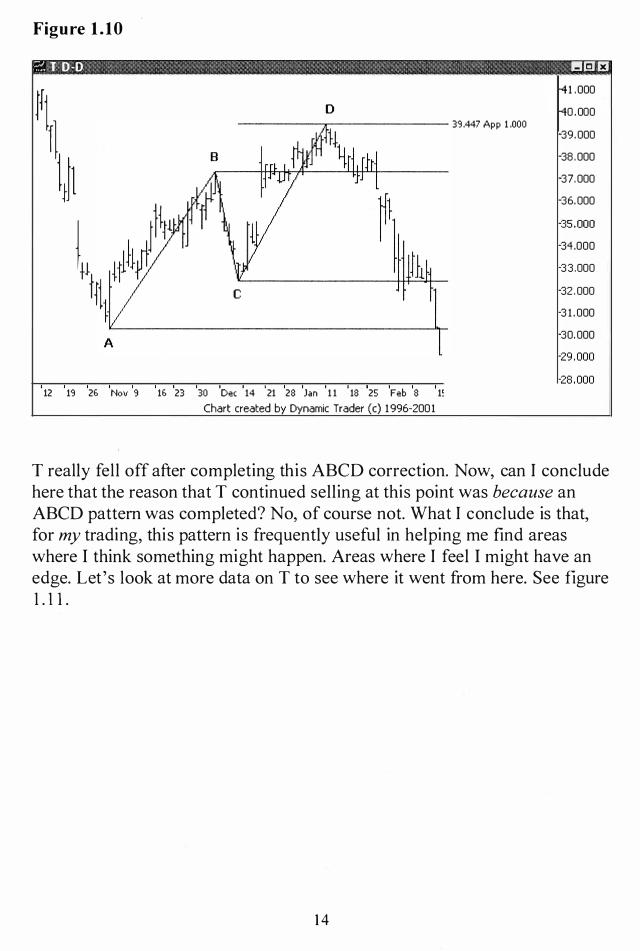
Figure 1.10
:::;. T D-D !IS J!'I
)fj D
it tJl I JIll! ft l¥h� t{t c l
1 .000
0 .000 39.447 App 1 .000
39.000
38 .000
37.000
36.000
35 .000
34.000
33.000
32 .000
3 1 . 000
A 30.000
29.000
28 .000 12 19 26 Nov '3 16 23 30 Dec 14 21 213 Jan 1 1 113 25 Feb 13 1�
Chart created by Dynamic Trader (c) 1 996-2001
T really fell off after completing this ABCD correction. Now, can I conclude here that the reason that T continued selling at this point was because an ABCD pattern was completed? No, of course not. What I conclude is that, for my trading, this pattern is frequently useful in helping me find areas where I think something might happen. Areas where I feel I might have an edge. Let's look at more data on T to see where it went from here. See figure 1 .1l .
14
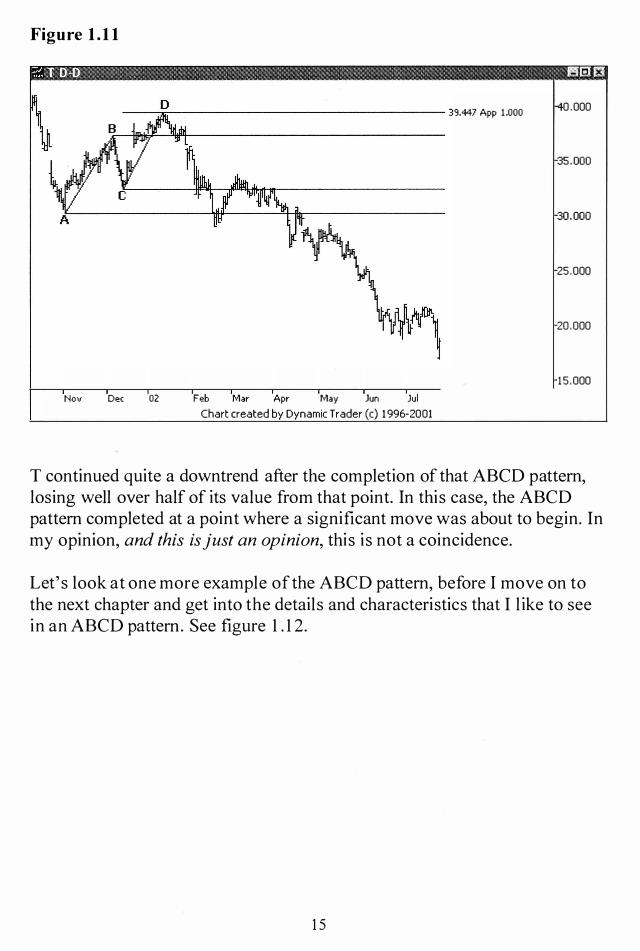
Figure 1.11
---i':---------------- 39.447 App 1 .000
Nov Dec 02 Feb Mar Apr May Jun Jul
Chart created by Dynamic Trader (c) 1 996-2001
0 .000
35 .000
30 .000
25 .000
20 .000
15 .000
T continued quite a downtrend after the completion of that ABeD pattern, losing well over half of its value from that point. In this case, the ABeD pattern completed at a point where a significant move was about to begin. In my opinion, and this is just an opinion, this is not a coincidence.
Let' s look at one more example of the ABeD pattern, before I move on to the next chapter and get into the details and characteristics that I l ike to see in an ABeD pattern. See figure 1 . 1 2.
1 5

Figure 1.12
?. M 0-0 I!IGU!'J 18 .500
18 . 000
17 .500
17 .000
16 .500
16 .000
15 .500
15 .000
1 4 . 500 19 26 Jui 10 17 24 31 Aug 14 2 1 28
Chart created by Dynamic Trader (c) 1996-2001
Can you see the potential ABCD pattern in this AA chart? This one is a l ittle bit trickier because the CD leg is significantly shorter than the AB leg, timewise. I am purposefully choosing examples that are not all 'textbook' , so you can see what you may be faced with as you look for these patterns. 1'11 label the pattern so you can see it more clearly. See figure l. 1 3 .
1 6

Figure 1.13
?. Aft. 0-0 EIl3 £'J
A 18 .500
18 .000
C 17 .500
17 .000
16 .500
16 .000
15 .500
f1 15 .000
14 .500
0 1'1 25 Jul 10 17 24 31 Aug 14 2 1 28
Chart created by Dynamic Trader (c) 1 996-2001
Just l ike the first example with YHOO, this example has ' mismatched' time symmetry between the AB and CD legs. This time, though, the difference i s reversed. In the YHOO example, the AB leg was significantly shorter than the CD leg, time-wise. In this AA example, the AB leg i s significantly longer than the CD leg, on a time basis. You can find every possible combination of time relationships with these patterns.
You might be asking 'How can there be any more possibilities than the two you just mentioned?' Well, we haven't considered the time span of the BC leg. Other than the obvious observation that the BC leg has been the shortest leg time-wise and price-wise, we have no idea what we would l ike the BC leg to be doing. I will get into details on price aspects of this BC leg in the next chapter, and I will get into more detail on time symmetries for all the legs in a later chapter.
1 7

I ' l l put the 1 .000 price projection on the chart to see how close the price move of the CD leg is to the price move of the AB leg. See figure 1 . 1 4.
Figure 1.14
?. M I)-I) I!S £J
19 26 Jul
A
10
18 , 500
18,000
C 17 ,500
17 ,000
16 , 500
16 ,000
B 15 ,500
15 ,000
14 , 500
D
17 24 31 Aug 14 21 28
Chart created by Dynamic Trader (c) 1996-2001
We are starting to see a repeating pattern here. A good part of that, of course, is due to the fact that I'm choosing these examples because they are just that, good examples. Not all patterns have a nice 1 .000 price projection reversal .
Sometimes this implies that the price action is not doing what I want it to do, and hence I won't consider a potential trade. Other times, though, this failure of a 1 .000 price projection reversal can be just fine for me. It can lead to a variation on the pattern, which I will cover in a later chapter on alternate ABCD patterns.
Let's look at AA one more time, with additional data, to see how it responded in this area. See figure 1 . 1 5 .
1 8

Figure 1.15
?. M [)-D B8£!
20.000
19. 000
18 . 000
17 .000
16 . 000
15 .000
--1----------- 14.531 App 1 .000 D
14.000
1'3 26 Jul 10 17 24 31 Aug 14 21 23 Sep 11 13 25 Oct '3 j
Chart created by Dynamic Trader (c) 1996-2001
AA reversed hard upon completion of the pattern. It went up over 40% before it did a more significant pullback than any of the pullbacks seen on this chart after point D. Again, this move didn't happen because of the ABeD pattern. Instead, the ABeD pattern allows me to find potential trade areas, areas where I think something might happen, and where I might consider taking a trade.
I think the basic structure of the ABeD pattern should be pretty clear to the reader at this point. I will now move on to describing the details of what I look for within this general framework, to make my own personal dec isions on what are ' good enough conditions' for me to consider a potential trade with this pattern.
1 9


Chapter 2
ABCD Pattern Criteria
ABCD patterns can come together in a variety of ways. The most obvious variable, to me, would be how large the retracement of the AB leg is . (This retracement forms the BC leg, which completes at the C point.) The BC leg can do a very shallow pullback of the AB leg, perhaps a .236 retracement, or it can retrace all the way back to an .886 retracement. It can also retrace anything in between those numbers, or even outside of them. Although these very shallow and very deep retracements would not preclude an ABCD pattern from forming, perhaps their usefulness for trading is not the same.
I have experimented and decided what criteria I l ike best for trading the ABCD pattern. I am not about to say, at all, that these are 'the best' criteria. In fact, if you follow the Kane Trading methodology at all , you already know what I am going to say. You need to do your own study and experimentation and decide what, if any, variation(s) of this pattern work(s) for you and your own unique trading style, as well as your 'Trading Plan' . I will present what I have found works best for me and my style.
The AB leg retracement, which forms the BC leg and completes at the C point, is the first thing I look at when I see a potential ABCD pattern start to develop. Although I have seen many, many beautiful ABCD patterns play out with a shallow .382 or .447 retracement, I prefer a deeper retracement for my own trading. I would l ike a .6 1 8 retracement as my preferred choice, or thereabouts. I also l ike retracements in the .500 area and sometimes even as deep as the . 786, although the latter is getting on the deep s ide for me.
2 1
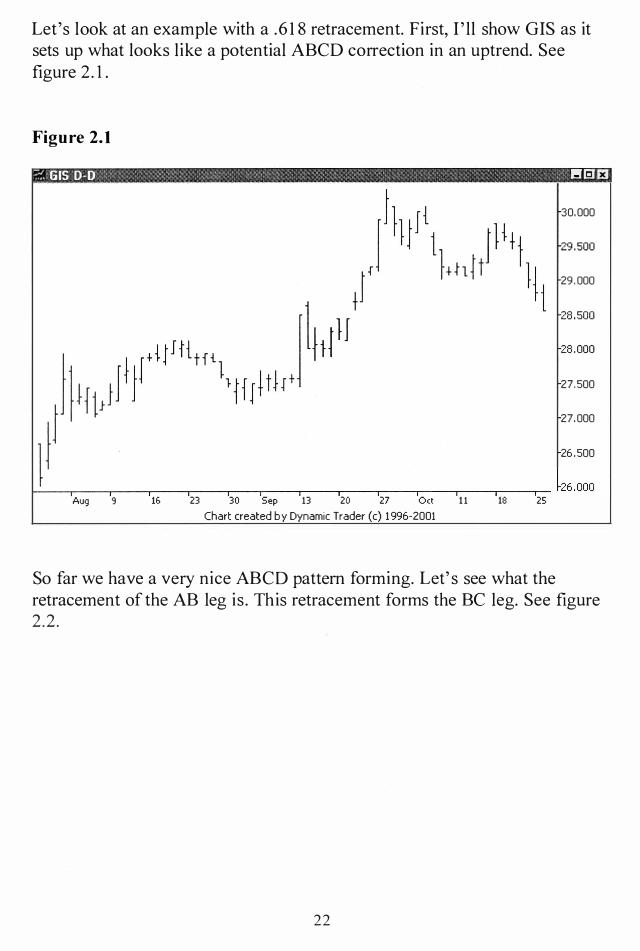
Let's look at an example with a .6 1 8 retracement. First, I ' ll show GIS as it sets up what looks like a potential ABeD correction in an uptrend. See figure 2 . 1 .
Figure 2.1
?. GIS O-D 158 £'J
Aug 9 if> 23 30 Sep 13 20 27 Oct 1 1
Chart created by Dynamic Trader (c) 1 996-2001
18 25
30.000
29.500
29 . 000
28 . 500
28 .000
27.500
27.000
26 .500
So far we have a very nice ABeD pattern forming. Let' s see what the retracement of the AB leg is . This retracement forms the Be leg. See figure 2 .2 .
22

Figure 2.2
?'. GIS D-D I
Figure 2.3
?, GIS D-D I!I3 £J
30 . 000
29 .500
29 .000
28 .500
28 .000
27.500
27.000
26 .500
Aug '3 11', 23 30 Sep 13 20 27 0ct 11 18 25
Chart created by Dynamic Trader (c) 1 996-2001
The ABeD pattern completes just below the current price action. Let' s add some more data, and see how GIS reacts to the area. See figure 2.4.
24

Figure 2.4
30.000
29.500
29.000
23.500 App 1 .000 28 .500
28 . 000
27.500
27.000
Aug 'l 16 23 30 Sep 13 20 27 0ct 11 18 25 Nc
Chart created by Dynamic Trader (c) 1 996-200 1
So far, GIS has started to reverse right off the completion point of the ABeD pattern. It' s hard to see on the chart, but the last price bar's close overlaps the horizontal l ine used for the retracement and projection calculations. This puts the close in the upper 25% of the bar. Let 's move ahead one more bar, and see how this is playing out. See figure 2 .5 .
25

Figure 2.5
?: GIS 0-0 I!!!IS £'J
30 .000
29.500
29.000
28 .500
28.000
27.500
27.000
26 .500
Aug 9 if, 23 30 Sep 13 20 27 Oct 11 18 25 No\
Chart created by Dynamic Trader (c) 1 996-2001
Well, that sure makes one wonder if this pattern is going to hold. GIS gaps down and opens right on the 1 .000 price projection, to the penny. It' s hard to see the opening hash mark on the price bar due to the horizontal l ine for the projection, but it i s right at $28.50. This would not threaten any stop I would likely have in place, since I tend to put my stops just below the potential trade area. And, depending on your entry trigger, you may or may not even be in the trade at this point.
It is interesting to note, though, that trying to interpret the price bar action at this point is very challenging. GIS threw a doj i bar at the completion point, and then another doj i with a large upward tail . Then it followed with a strong bar up that had a strong close. But then GIS gapped down, only to reverse and finish at the top of the bar. So this is strong, right? Who knows ! This bar action is all over the place.
That's why I l ike to watch the bar action, but not take it too seriously for my trading. I l ike to look at each issue over time and decide how reliable and relevant to the trading I think the immediate bar action is . In my experience, GIS is fairly choppy and the immediate bar action is very unreliable. Hence,
26
my focus is on the potential trade area and my particular entry technique, as well as my pre-determined stop loss point. For the most part, I ignore the opens and closes of the bars themselves.
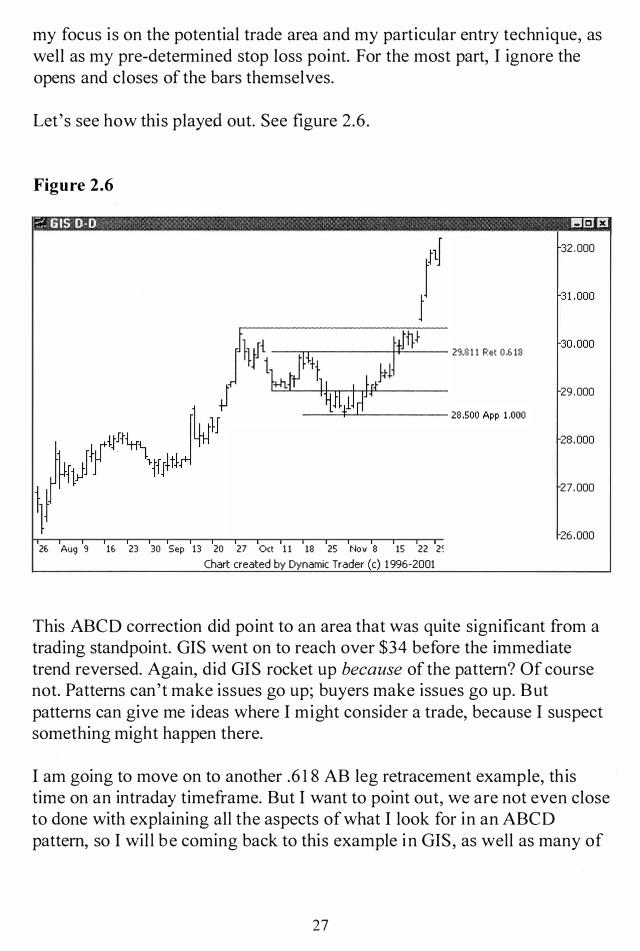
Let's see how this played out. See figure 2.6.
Figure 2.6
;,:. GIS 0-0 II!!B £J
32 .000
3 1 . 000
30.000 29.811 Ret 0.&13
29 . 000
28 .000
27.000
26 .000 26 Aug 9 16 23 30 Sep 13 20 27 Oct 1 1 18 25 Nov 8 15 22 2�
Chart created by Dynamic Trader (c) 1 996-2001
This ABCD correction did point to an area that was quite significant from a trading standpoint. GIS went on to reach over $34 before the immediate trend reversed. Again, did GIS rocket up because of the pattern? Of course not. Patterns can't make issues go up; buyers make issues go up. But patterns can give me ideas where I might consider a trade, because I suspect something might happen there.
I am going to move on to another .6 1 8 AB leg retracement example, this time on an intraday timeframe. But I want to point out, we are not even close to done with explaining all the aspects of what I look for in an ABCD pattern, so I wil l be coming back to this example in GIS, as well as many of
27

the other examples. Let' s look at a potential ABCD pattern on a IS-minute timeframe chart in the S&P e-mini . See figure 2 .7 .
Figure 2.7
?: ES03H 15·1 !lEI Ell
J\
&t 7f FeblOm
Chart created by Dynamic Trader (c) 1 996-2001
The mini is in a downtrend on this timeframe, and is setting up what looks l ike a fairly nice ABCD pattern. The assumption I am looking at is that the mini wi l l continue its downtrend after the ABCD correction completes . F irst let 's look at the retracement at the C point. This i s the 'BC retracement of the AB leg' . See figure 2 .8 .
28

Figure 2.8
?. ES03H 15-( 1!!13£1
60.000
55.000
50.000
45.000
f 40.000
)� -----=-- 827.789 Ret 0 .518
35 .000
30 .000
25.000
5t 7f Febl0m
Chart created by Dynamic Trader (c) 1996-2001
The pullback was almost exactly at the . 6 1 8 retracement; in fact it was within less than one tick. Let' s add in the 1 .000 price projection, and then we' l l see how the mini reacted in that area. See figure 2.9 .
29

Figure 2.9
?. ESOlH 15-( !IS£!
- 842 .500 App 1.000
f
� 827J" '0< 0.'"
6t 7f FeblOm
Chart created by Dynamic Trader (c) 1 996-2001
The mini has just a l ittle ways to go before the potential trade area. Let's add in a few more bars, and see what happens. See figure 2 . 1 0 .
30
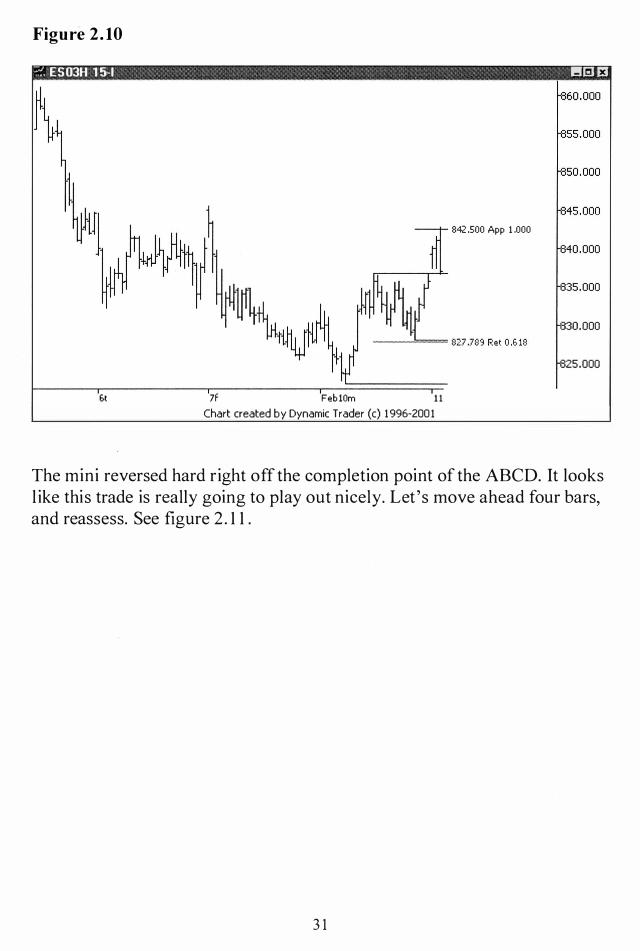
Figure 2.10
?'. ES03H 15-1 1!!Ir=I D
6t 7F Febl0m 11
Chart created by Dynamic Trader (c) 1 996-2001
842 .500 App 1 .000
The mini reversed hard right off the completion point of the ABeD. It looks l ike this trade is really going to play out nicely. Let 's move ahead four bars, and reassess. See figure 2 . 1 1 .
3 1

Figure 2.11
?1. E S 03H 15-1 !IS £I
6t
-t--r- 842 0500 App 1 .000
7f Feb 10m 11t
Chart created by Dynamic Trader (c) 1996-2001
Well, that doesn't look all that good. The mini reversed right off the ABeD pattern completion, and then turned right around and started back up. This is why you never trade without pre-determined stops. I f the mini keeps going up it will catch my stop, and that will be that.
I generally have my stop set just above the potential trade area for short trades Gust below for long trades), so I would not be stopped out at this point, but I'm on the alert and ready. If my stop i s set mechanically, all I can do is sit back and watch. The one thing I do notice i s that the last bar closed near its low, and has an upward tail . Let's look at the next bar, and see what happens. See figure 2 . 1 2 .
32

Figure 2.12
?. ES03H 15-( 11!!18E1
6t
-+--r- 842 .500 App 1.000
--!::=:== 827.7101'3 Ret 0.G18
7f Feb10m 1 11
Chart created by Dynamic Trader (c) 1 996-2001
OK, the mini has 'tested' the potential trade area twice now, and is starting back down. My stop would not have been hit, and I'd still be managing the trade as it unfolds. Let' s see how this one played out. See figure 2 . 1 3 .
33

Figure 2.13
?: E S 03" 15-1 " I!EI £J
--t-.--------- 842.500 App 1.000
--'----..;./,+fi+*Ht---:------ 827,789 Ret 0,&13
&t 7f Feb 10m llt 12w 13t
Chart created by Dynamic Trader (c) 1 996-2001
As it turns out, that l ittle move up was just a small 'headfake' , and down the mini went. This ABeD pattern, again, pointed to an area where a potential trade was setting up. It should be clear by now why I l ike this pattern so much, and why I keep such a close watch out for it in the issues that I watch. I wi l l refer back to this example later on, too, since there is more going on here that I want to point out. Much more.
Let's look at one more retracement example, and then we'l l move on to the next criterion that I look for. Let's look at an example in A VY. See figure 2. 1 4.
34
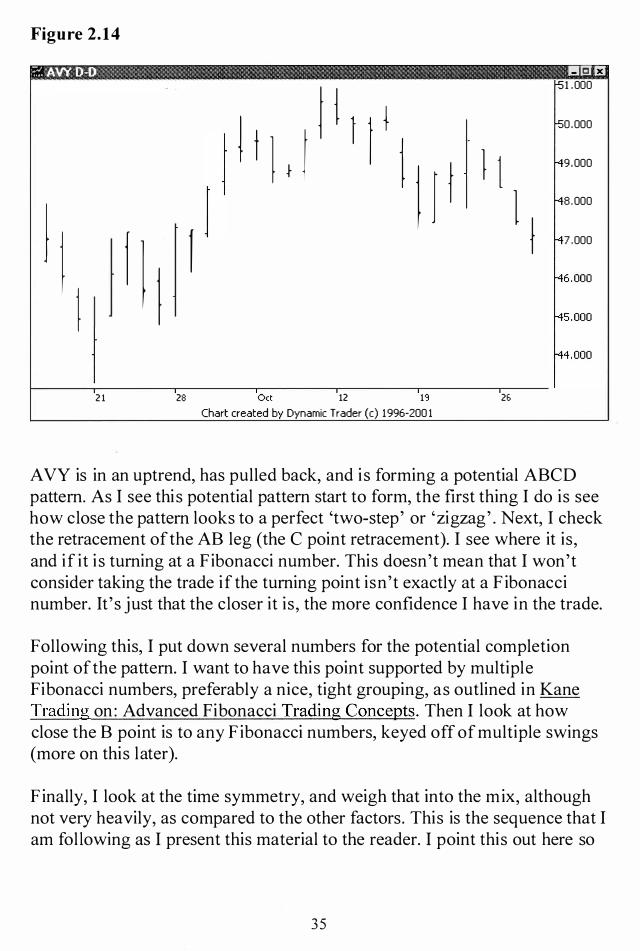
Figure 2.14
?. AVY I)-I) !l9£1
) j 1 flJ 2 1
{ j 1 t j I III j t t I I 1 28 Oct 12 19
Chart created by Dynamic Trader (c) 1996-200 1
1 .000
0 .000
� 1 9 .000
I j 8 .000
7 .000
2&
A VY is in an uptrend, has pulled back, and i s forming a potential ABCD pattern. As I see this potential pattern start to form, the first thing I do is see how close the pattern looks to a perfect 'two-step' or 'zigzag' . Next, I check the retracement of the AB leg (the C point retracement). I see where it is, and if it i s turning at a F ibonacci number. This doesn't mean that I won't consider taking the trade if the turning point isn't exactly at a F ibonacci number. It' s just that the closer it is , the more confidence I have in the trade.
Following this, I put down several numbers for the potential completion point of the pattern. I want to have this point supported by multiple Fibonacci numbers, preferably a nice, tight grouping, as outlined in Kane Trading on: Advanced Fibonacci Trading Concepts. Then I look at how close the B point is to any F ibonacci numbers, keyed off of multiple swings (more on this later).
F inally, I look at the time symmetry, and weigh that into the mix, although not very heavily, as compared to the other factors. This is the sequence that I am following as I present this material to the reader. I point this out here so
35

that the reader will understand what i s unfolding, and why it is unfolding in the order that it is .
Let' s continue on with this A VY example. I ' l l add the retracement of the AB leg to the chart. See figure 2 . 1 5 .
Figure 2.15
_�\'·A-.UI. _ c.lx.! -5 1 . 000
50.155 Ret 0.78& -50 . 000
) j 1 1 f'49.000
r ) J 1 1 I
f'48 .000
I fll f f'47.000
f'46.000 j f'45 .000
f'44 .000
21 23 0ct 12 19 26
Chart created by Dynamic Trader (c) 1 996-2001
The C point formed at almost exactly a .786 retracement, in fact it was within just about five cents . I purposely chose this example because, although I don't rank the deeper .786 C point ABCD's as my favorite, they can set up some spectacular trades, and I do trade them at times. I leave it to the readers to experiment and decide what parameters, if any, work for them. As in the other examples, I ' l l add in the 1 .000 price projection and then we'll see how this played out. See figure 2. 1 6 .
36

Figure 2.16 •
_�"Ji�. U!I J ._Iolx rs1 .000
50.155 Ret 0.786 rsO.OOO
J j l 1 M9 .000
1 I t 1 1 I
f4s. ooo
I j lJ f f47 .000
46 .340 App 1.000 f46 .000 j -45.000
-44.000
2 1 28 0ct 12 19 26
Chart created by Dynamic Trader (c) 1996-2001
The potential trade area i s just below the current price action in AVY. Let's move ahead one more bar, and assess the situation. See figure 2 . 1 7 .
37

Figure 2.17
?. AVY D-D I!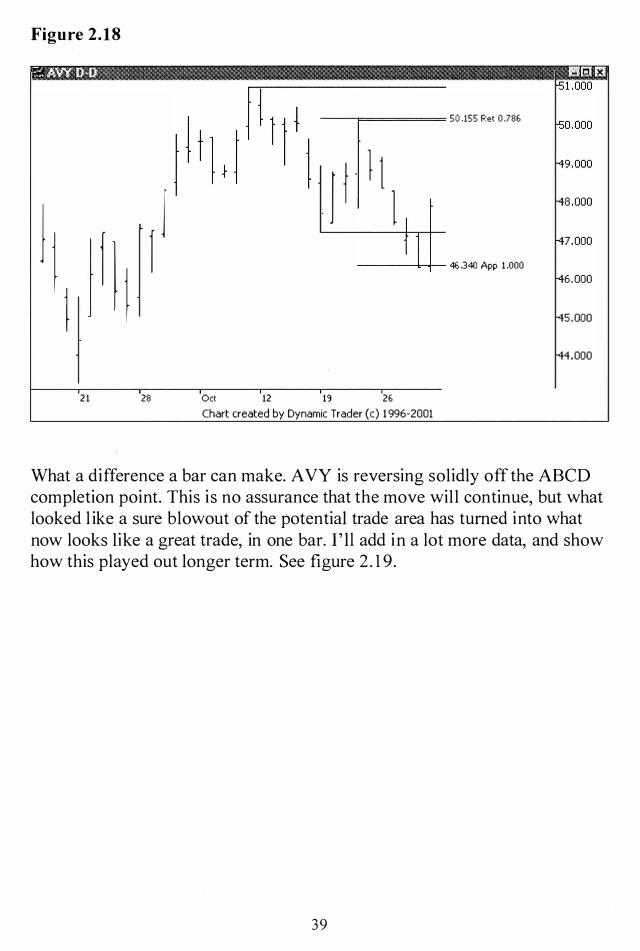
Figure 2.18
1IKWN'.I9i1'l! , - C.JXJ -51.000
50.155 Ret 0 .786 -50.000
J j 1 1 -49.000
1 ) ) j 1 I -48.000
j 1 j f 1 -47.000
46.340 App 1 .000 -46.000 I -45.000
-44.000
21 28 Oct 12 19 26
Chart created by Dynamic Trader (c) 1996-2001
What a difference a bar can make. A VY is reversing solidly off the ABeD completion point. This is no assurance that the move wil l continue, but what looked l ike a sure blowout of the potential trade area has turned into what now looks like a great trade, in one bar. 1'11 add in a lot more data, and show how this played out longer term. See figure 2 . 1 9.
39
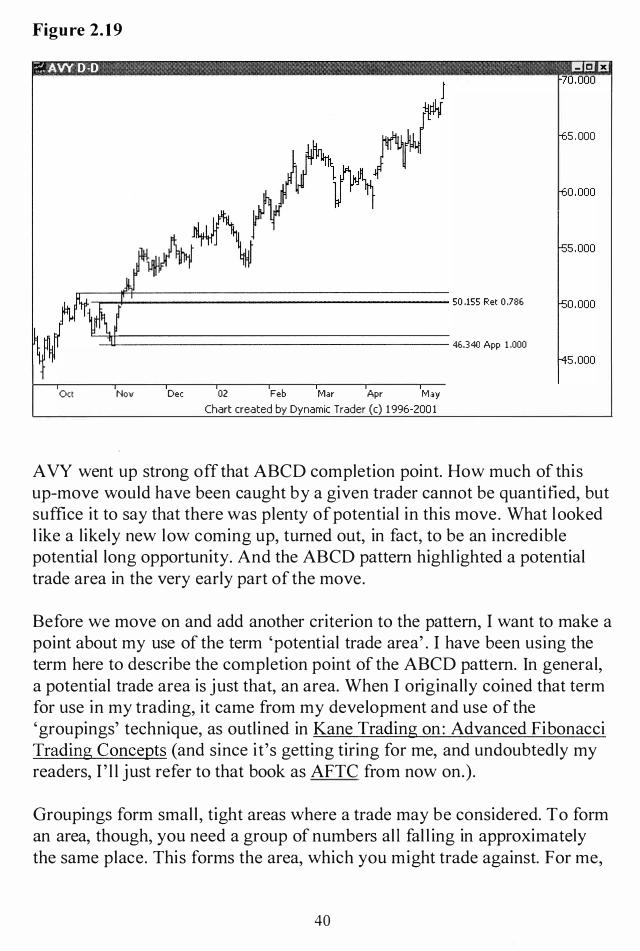
Figure 2.19
?. AW D-D I!
the more numbers in a small area, the better. In my mind, each number adds to the potential support or resistance that the area may have. I rarely take trades with only one or two numbers in an area, such as trading against a single retracement. I prefer a large grouping of numbers to trade against.
My point is that I have only used this term, potential trade area, here, because I know that before I am done presenting this material, we will have multiple numbers in the area. Ifwe don't, I won't consider the area as a valid potential trade area. It won't meet my criteria. So, although the use of the term is premature at this point, as long as the reader knows what we are working towards, and doesn't adopt the use of the term where it would be inappropriate, it should be all right to use it as I have so far.
With all that said, let' s move on to forming our first potential overlay of numbers, forming the start of our first 'grouping' . Again, and I point this out without in any way trying to ' sell more books' , the sense, and technique, of creating groupings i s clearly laid out in AFTC. That book really complements the work that we are doing here on the ABCD pattern.
I am limited in how much I can get off topic in this work to fill in background information on how to construct groupings, and how I trade using them. Hence, I am assuming my reader understands how I am doing this part of the process. I am simply trying to point out that if you have trouble following those aspects of the process, it i s not due to a deficiency in this work, but more l ikely because of missing prerequisite knowledge. I am only trying to point out one potential source of that prerequisite knowledge.
The next step in the process is to do an external retracement of the BC leg. I am looking for a F ibonacci number to fall very close to the 1 .000 price projection, what I have been calling the ABCD completion point. This would put two numbers in the potential trade area, further increasing, for me, the reversal potential of that area.
4 1
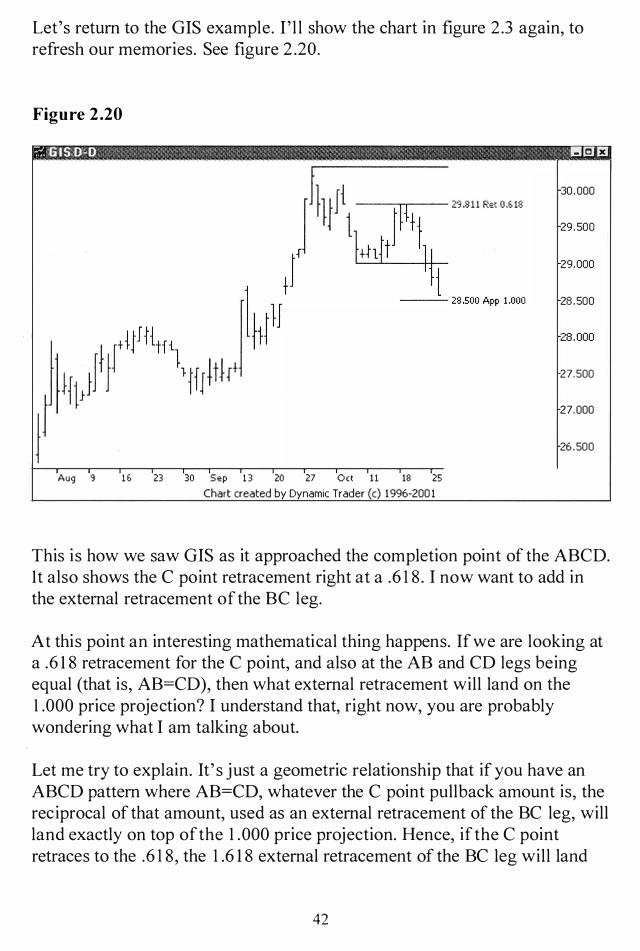
Let's return to the GIS example. I ' l l show the chart in figure 2 .3 again, to refresh our memories. See figure 2 .20.
Figure 2.20
?. GIS 0-0 !IS £I
30 .000
29 . 500
29.000
28 .500
28.000
27.500
27.000
26 .500
Aug 9 1& 23 30 Sep 13 20 27 0ct 11 18 25
Chart created by Dynamic Trader (c) 1996-200 1
This is how we saw GIS as it approached the completion point of the ABCD. It also shows the C point retracement right at a .6 1 8 . I now want to add in the external retracement of the BC leg.
At this point an interesting mathematical thing happens. If we are looking at a .6 1 8 retracement for the C point, and also at the AB and CD legs being equal (that is, AB=CD), then what external retracement will land on the 1 .000 price projection? I understand that, right now, you are probably wondering what I am talking about.
Let me try to explain. It' s just a geometric relationship that if you have an ABCD pattern where AB=CD, whatever the C point pullback amount is, the reciprocal of that amount, used as an external retracement of the BC leg, will land exactly on top of the 1 .000 price projection. Hence, if the C point retraces to the .6 1 8 , the 1 .6 1 8 external retracement of the BC leg will land
42

exactly on top of the 1 .000 price projection. If the C point retraces to the .786, then the 1 .272 external retracement will land right on the 1 .000 price projection.
Since I was, at one time, a high school math teacher, I could quite easily draw out diagrams and show why this is so, but I don't think the reader has to have this information to use the technique. For this reason I will spare my readers this agony, and leave it at that. Now, why do I care about this, except that it is a fun l ittle mathematical factoid?
I care because I want the external retracement of the BC leg to be as c lose to the 1 .000 price projection (the ABCD completion point) as it can be, and the closer the retracement of the AB leg i s to a Fibonacci number, the closer my external retracement will be to where I want it to be. The previous 'harmony' seems to carry forward and contribute to future Fibonacci 'harmony' .
I find the tightest groupings come from issues that have had tight previous groupings leading to the grouping under consideration. This is another way of saying the i ssue is 'harmonic ' . So, let 's note that in the GIS example the C point retracement, which i s the retracement of the AB leg, is pretty much right at the .6 1 8 . Hence, I would expect the 1 .6 1 8 external retracement to land just about exactly on top of the 1 .000 price projection.
43

First, I will show just the 1 .6 1 8 external retracement of the Be leg, so that it wi ll be clear what it is I am doing. I will then show this retracement with the 1 .000 price projection on the same chart. See figure 2 .2 1 .
Figure 2.21
:::1. GIS D·D !IS£!
1)
jt)fjJ{t )� l � ,t}JHtf{ �tfH 28'9$ '" '61'
Aug '3 1& 23 30 Sep 13 20 27 0ct 1 1 18 2
Chart created by Dynamic Trader (c) 1996-2001
30 . 000
29.500
29.000
28.500
28.000
27.500
27.000
26.500
26.000
I will now add the 1 .000 price projection onto this chart. I am expecting that the overlap will be nearly perfect, and that the l ines will be difficult to differentiate. Let's see how close this i s to what actual ly happens. See figure 2 .22.
44

Figure 2.22
?" GIS 0-0 I!I3 £J
30.000
29.500
29.000
-- 2S.!le13 � U(WD 28.500
28 . 000
27 .500
27.000
26.500
26.000 Aug '3 1& 23 30 Sep 13 20 27 Oct 11 1S 2
Chart created by Dynamic Trader (c) 1996-2001
As expected, the overlap is just about exact. It would have to be, given the mathematical relationship that I just described. What this tells me, as a trader, is that we have a near perfect .6 1 8 C point retracement, and a completion point, a 'potential trade area' , with a near perfect 1 .6 1 8 external retracement overlapping the 1 .000 price projection. This increases my confidence level in the potential trade.
I won't be ready to consider this potential trade until I have more numbers in this area, and possibly some other F ibonacci alignments, but this current overlap allows me to continue the screening process. Let' s move on and look at a few other examples of BC leg external retracements before we add the next criterion to the pattern.
45

We'l l return to the IS-min chart of the mini, and follow the same procedure that we just did with GIS . First, let me show the same chart as in figure 2 .9, to refresh our memories on how this one looks. See figure 2 .23 .
Figure 2.23
?: [S03" 15-1 1!!113J F!J
- 842 .500 App 1 .000
f )1��LI ---== 327 .73·� Ret O .U8
6t 7f Febl0m Chart created by Dynamic Trader (c) 1996-200 1
I wi ll add the 1 .6 1 8 external retracement for the BC leg onto the chart, since the C point is a .6 1 8 retracement. Again, I am expecting a near perfect overlap with the 1 .000 price projection. See figure 2 .24.
46

Figure 2.24
?. ES03H 15-( 1I!!13 E'J
6t 7F FeblOm
f
)� '" ."., R" 0.&1'
Chart created by Dynamic Trader (c) 1996-2001
Now, that's really nice. You have the two l ines almost on top of each other, but not quite. That makes this a really good example for my purposes. It leads to a great question that I hope my readers are already asking. Why aren't the numbers just about exactly on top of each other, l ike the last example?
The answer is right there on the chart. The C point retracement is just shy of the .6 1 8 retracement line. Hence the reciprocal number that will hit the 1 .000 price projection will be a bit greater than 1 .6 1 8 . This can be confirmed by observing where the 1 .6 1 8 external retracement l ine is with respect to the 1 .000 price projection line . Everything i s as expected.
47

1 'm going to show one more example of the BC external retracement, this time going back to the A VY example. Let 's look, again, at the chart from figure 2 . 1 6. See figure 2 .25 .
Figure 2.25
_!'.\.T�-"'1!!' -lob rs1 . OOO 50.155 Ret O.78G rso .ooo
I j t 1 [49 .000
1 J ) j 1 I
f4s .ooo
I f 1 1 f :47 .000
46 .340 App 1 .000 -46 . 000 1 -45.000
-44 .000
21 28 0ct 12 19 26
Chart created by Dynamic Trader (c) 1996-2001
Notice the C point retracement is just about a .786, so let's try a 1 .272 external retracement of the BC leg. S ince AVY turned just a fraction shy of the .786, I would expect the 1 .272 external retracement of the BC leg to fall just above the 1 .000 price projection. See figure 2 .26.
48

Figure 2.26
?. AVY 0-0 Be F!'l
j l I j 1 1 1 21 28
1 1
0ct 12 19 26
1 I f
Chart created by Dynamic Trader (c) 1996-2001
[51 . 000 50.155 Ret 0 .781; [so.ooo
rt9.000
"48.000
"47 .000 ilM� J.\�\:> 11ro'OO
"46 .000
"45.000
-44.000
The 1 .272 external retracement of the BC leg fell just where I expected, and confirms the completion point of the ABCD pattern quite welL This is one of the reasons why I want a F ibonacci retracement of the AB leg, so that the overlap will be tight at the completion point. I 'm trying to select out ABCD patterns for trading that have a grouping of numbers close together at the completion point.
I now want to move on and add in more criteria that I use for determining an acceptable ABCD pattern for my own trading. At this point, though, you might be noticing that there isn't too much more to the ABCD structure to allow us to do any more projections or retracements. If there was a smaller structure within the CD leg, we could use that, but in many cases there won't be a significant enough ' substructure' to be useful .
There is one more technique that we can add in that is derived directly from the ABCD pattern itself, but once we do that, we will have to look outside the pattern for our additional numbers. The one remaining technique I use is called an expansion, and it i s the least well known of the retracement, price projection and expansion group of techniques. I refer the reader who is
49

unfamiliar with this technique, but who wants to know the details of its use, to AFTC.
That book has a chapter on expansions, as well as examples throughout the book on the use of the technique. I use the technique myself, but more as a secondary technique. Also, I find that if the C point retracement i s at certain Fibonacci numbers such as .3 82 or .6 1 8 , and I am looking at an ABCD where AB=CD, the expansion technique will be redundant.
I will add in one example of an expansion using the last example in the emini, before moving on to finding numbers outside the ABCD pattern to support our completion point. First, I ' ll add in just the expansion, so it will be clear what I 've done. Then, I ' ll show the chart with the other numbers we have built so far, too. See figure 2 .27 .
Figure 2.27
Jil] � fo 1 ", ,,mp 0 382
11 6t 7f FeblOm
Chart created by Dynamic Trader (c) 1996-2001
60.000
55.000
50.000
45.000
40.000
35.000
30.000
25.000
20.000
The expansion, as outlined on the chart, takes a F ibonacci ratio of the AB leg and adds it to the top of the B point. In this case I chose a .382 ratio of the AB leg. Knowing that the C point was a .6 1 8 pullback, and that we are
50

targeting a 1 .000 price projection, by simple subtraction I can see that the expansion will be a .382 . This type of oversimplified calculation will not be possible when we move on to alternate ABCD's, and perhaps C points that aren't right at Fibonacci retracements. I ' ll add the previous numbers back onto the chart, so we can see where the expansion fits in. See figure 2 .28.
Figure 2.28
:::'1. ES03H 1 5-1 !!S 13
!\ 60.000
55.000
j�)lI 50.000
45,000 .� 1m kIP tUD1
f 40.000
}1�L 827 78' So< ""
35,000 \l\ltl�j 30,000
25,000
7f FeblOm
Chart created by Dynamic Trader (c) 1996-2001
That's actually pretty impressive. The expansion fell right in between the two previous numbers. It may be, as I said, a bit redundant, when the C point is at a .6 1 8 Fibonacci retracement and the ABCD completes at a 1 .000 price projection, but soon we will be looking at ABCD's that are at alternate price projections.
Sometimes, too, I find really nice looking ABCD's that don't pull back at the C point to a perfect Fibonacci retracement, yet the expansion technique shows really tight overlap with the completion point. I feel it is a good technique to know and use, if only in a secondary capacity. I will use expansions in the examples in the fol lowing chapters, when appropriate.
5 1

It is now necessary to look outside the ABeD pattern itself for additional potential support or resistance numbers that may overlap with the ABeD completion point. Although these numbers, too, are criteria that I look for before I consider trading the ABeD pattern, they are not criteria within the pattern itself. They are criteria of the pattern's placement with respect to previous price action. These criteria all have one characteristic that groups them together. They are all 'ABeD Points at Fibonacci Areas' .
52

Chapter 3
ABeD Points at Fibonacci Areas
So far we have looked within the ABeD pattern itself to determine the potential completion point, and hence the potential trade area. I have found that the pattern is more useful for my trading if it is also filtered with some context. I have found that I prefer to trade the ABeD pattern if it has certain relationships with previous price action.
For me, the 'positioning' of an ABeD pattern falls into four categories. These categories greatly influence if, and how, I may trade the pattern. The categories, as I see them, are as fol lows:
1 . ABeD's that appear as corrections to fairly well-established trends
2 . ABeD's that are part of the group of 'named patterns'
3 . ABeD's that correlate well with F ibonacci areas, but nonetheless do not meet the criteria to be a 'named pattern'
4. ABeD's that, although they are very nice ABeD patterns in and of themselves, are ' sitting out in space' , with no seeming relationship at all with previous price action
My preference for trading the ABeD pattern leans strongly towards category one. There is a very simple reason for this. If you reread category one you might be able to guess it. Let me lead you a bit: ' . . . corrections to fairly wellestablished trends' . This points out that the ABeD, in this context, is a correction to a trend, a fairly well-established trend, and the assumption i s that when the correction ends the trend will resume.
I l ike to trade with the trend. I don't l ike to try to pick tops or bottoms on my traded timeframe. I like to get on board established trends when they resume. I really like to trade ABeD patterns in this context. It may be my favorite way to get into trades on these type trends. The only problem is, on a percentage basis, this type of correction is not all that common. Hence, I look for these setups, and usually get really excited when I see one shaping up, but I by no means l imit my potential entries to them.
53
In my book AFTC, I develop the Fibonacci groupings technique, in the context of entering established trends. Some of the examples have ABCD corrections in the pullback towards the F ibonacci groupings. Although I make use of the aspects of the pattern in that book, I do not label it as a pattern or discuss it as such.
What I can say to the reader who has that book, or who goes out and gets it after reading this work, is look back at the examples and look for the ABCD patterns that also fit the techniques being taught in that book. Those are the trades I really keep an eye out for in my own personal trading. The more you can apply the grouping techniques in combination with the ABCD pattern, the better the quality of the setups you will have, in my opinion. As we progress in this chapter I will teach some of the grouping concepts from AFTC, in combination with the ABCD pattern.
Category two ABCD's are the ABCD's that make up the group of ' 5-point patterns' . These patterns all have really cool names, frequently named after an animal that the pattern resembles. The idea is to start at a reference point, usual ly called the X point, and then after the price moves and begins to reverse, that reversal point then becomes the A point of an ABCD pattern.
Each pattern has very specific characteristics as to how all the points relate to each other. The concept is that by having the various points of the ABCD relate to each other in very specific ways, and to previous price action in very specific ways, the reliability of the pattern is increased. I have to say that I have seen some incredible trade examples with these special ized ABCD patterns.
I don't prefer to trade these patterns as much as category one setups because they are, by their very structure, reversal trades. The do attempt to pick fairly significant reversal points. I prefer to trade in the direction of the trend, as opposed to trying to call the end of the immediate trend. Nevertheless, this is a fascinating area for potential study, and I do trade these category two patterns from time to time.
Category three trades are somewhat similar to category two, but without the specific ratios that category two requires. The concept is very simi lar, but the main idea is to have the B and D points of the ABCD hit F ibonacci numbers or groupings, albeit not specific Fibonacci numbers or groupings. As long as the B and D points are in areas of potential Fibonacci support or
54
resistance, that is adequate. Sometimes the setup will actually be one of the named patterns, but the trader would not know this unless they specifically studied the patterns.
Not knowing the name of the pattern does not preclude one from trading it, without even being aware it's a 'named pattern' . The main potential disadvantage to not knowing is that if you felt the potential trade area was more significant if you did have the alignments of one of those patterns, and if that would influence how you made your trading decisions, then perhaps by not knowing you would be acting in a manner different than you otherwise would. Traders have to make that decision for themselves. For me, I want to see and recognize any potential pattern forming that I think other traders are watching for.
Some of the examples to follow, both in this chapter and in the remaining chapters, will be category three ABeD's . The final category is what I call 'out in space' ABeD's. They form without any discernable relationship to previous price action. I, personally, don't l ike to take trades without any 'context' . Hence, I rarely take category four ABeD's .
Keep in mind, though, there should, possibly, be exceptions to almost every 'rule', and once in awhile I find a really perfect ABeD just sitting out there, and I may play it. Sometimes they appear in trading ranges or in 'chop' , and sometimes they can be uncanny at pointing out turning points. I only suggest, here, that you do some experimenting and make your own decisions on how to use this pattern, if you choose to use it at all .
Let's move on to some examples. What I plan to do i s just present some ABeD's, and then show some Fibonacci retracements and such, as they relate to the B point of the ABeD, and as they relate to point D, the completion point.
55

I ' ll start out with a look at the e-mini example that we have been developing, in the I 5-minute timeframe. I ' l l pick up where we left off, with the chart shown in figure 2 .28. See figure 3 . 1 .
Figure 3.1
?: E S03H 15·1 ' !IS £J
60,000
55,000
50,000
45,000
f 40,000 llW _----"t= 827.73'3 Ret 0 ,1; 18
35,000
30,000
25,000
I;t 7f Feb10m
Chart created by Dynamic Trader (c) 1996-200 1
The first thing that I notice on this chart is the two prominent highs on February 5 and 7 . Let me point these out on the next chart to be perfectly clear. I will add in just a little bit of data on the left side of the chart, to be sure this is, in fact, a significant peak on February 5 . See figure 3 .2 .
56

Figure 3.2
?. ES03H 15-1 1!8 £.i
Gt 7F Feb10m
f
nMl -------'= 827.789 Ret 0 ,G 18
Chart created by Dynamic Trader (c) 1 996-2001
What I want to do here is see if F ibonacci retracements from both of these two peaks (to the reversal point on February 1 0), lands on, or pretty close to, the B and D points of this potential ABCD. I am much more interested in the D point for this technique than I am in the B point, although a Fibonacci overlap at the B point definitely strengthens the trade potential for me. It' s just that the potential trade area i s at the D point, so that is the area that I want to focus most strongly on.
One of the 'problems' that I have with this chart, though, before we continue on, is that we have very l ittle context as to where this ABCD is in the overal l picture, as well as the context of the two peaks that I am focusing on. Although these two peaks look very pertinent when all we have to look at is the current chart, they may or may not tum out to be significant when we see the bigger picture.
As those that follow my style of trading know, I use three timeframes for trading, which is a somewhat common practice. The middle timeframe is the traded timeframe. I use the lower timeframe for finding and implementing
57

entry techniques, and I use the larger timeframe, sometimes even multiple larger timeframes, for overall context.
My point here is that before I begin to add in some retracements I want to add in some more data, and see what peaks look the most important in this larger context. For this reason, I want to look at a 60-minute chart of the mini here, before I make my final decisions on what to add. First, I will present the chart, and then 1'11 add in some arrows and show where I see points of interest to me. See figure 3 .3 .
Figure 3.3
::::'1. E S 03H 60-1 ' , , II!!I3 £I
Jan3 10 V 24 3 1
Chart created by Dynamic Trader (c) 1996-2001 Feb7
Now, that adds in some perspective that I wouldn't have even been able to guess at. And where i s the potential ABeD pattern that we are looking at in all this? It' s at the very bottom right of the chart. Look at how small it is in the context of this 60-minute chart!
Now we can look at the two peaks that I was pointing out on the I 5-minute chart, in this context, and evaluate them 'from this angle ' . Let me first add in
58

two arrows showing the two peaks from the I S-minute chart, and then we' l l discuss the peaks. See figure 3 .4.
Figure 3.4
?: ESOJH 60-( I!!I[;U3
Jan3 10
i� 17 24 31
Chart created by Dynamic Trader (c) 1996-2001
30.000
20.000
10 .000
00.000
90.000
80.000
70.000
60.000
50.000
40.000
Feb7
Those peaks, although very close and surely pertinent to the ABeD, are only two of many that I would want to consider. Before I point out the other peaks that I want to look at, let me make a point here. One might think that the farther away from the current action you get, the less relevance the older price action has. To that I say 'Yes, and no' . I feel it matters how significant the previous price action actually was.
Sometimes, I believe, the older price action can have a much greater influence (on the current price behavior) than the more recent price action. In my opinion, an older, very significant high or low may be a much bigger influence on the price action than a recent, although very minor, high or low. Hence, I very often use older, what look to me to be significant, highs and lows, in my calculations. I ' l l add in arrows on the chart at the peaks that I want to use in my calculations here. See figure 3 . 5 .
59

Figure 3.5
?. ES03H 60-1 !lEI £i
Jan3 10 17 24 31
Chart created by Dynamic Trader (c) 1996-200 1
10 ,000
Feb7
I imagine a few readers are saying 'Well, I can see the peaks shown with all those arrow possibly being significant, but that first peak, on January 1 0, that's so far away, I just can't see that one . . . ' Well, that one is the main one I want to look at. I have found that many, many times corrections go to the smaller Fibonacci or F ibonacci derived retracements (keyed off of the start of the move), as usually seen best on the larger timeframe chart.
The retracements I see this happen with the most are the . 1 86, .236 and .300. Al l three of these numbers are derived directly from <1>, the Golden Ratio (= 1 .6 1 8), and I use them frequently in my trading. I have seen many charts where a pullback forms similar to the ABeD on the last chart, and I see three noticeable peaks early in the trend. I key three retracements off these three peaks, a . 1 86 off the top, a .236 off the next peak, and a .300 off the next lower peak.
All three retracements hit in a very tight area (what I call a 'grouping'), and the area sits right on the local area that I determined as the potential trade area. And this turns out to be the turning point. I have seen this enough times for me to want to use it in my trading. It' s my own personal opinion that if
60
these numbers had no meaning, I wouldn't see so many tight overlaps l ike I do. Traders need to decide for themselves if they feel that these numbers are of any use to them in their own trading. For me, the choice is clear.
At this point, I would begin to add Fibonacci retracement numbers in and see what ' sticks out' . For those of my readers who have read AFTC, you know that with practice one can learn to eye the chart and pretty much make an educated guess as to what retracements to add where. Until that skill i s developed, I teach that you can add whatever retracements seem even close to correct, and then s imply erase off the ones that fall outside of the area of interest.
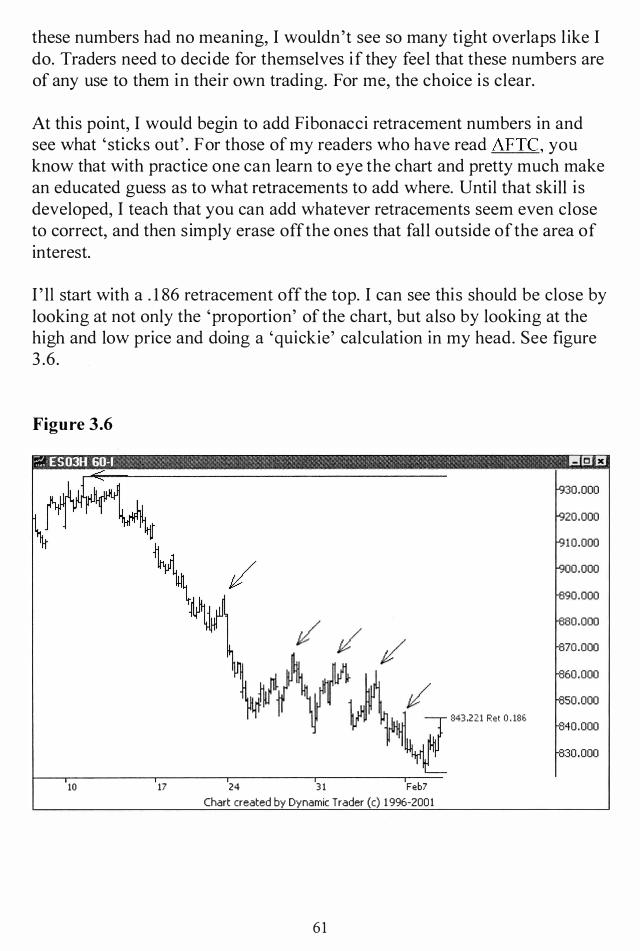
I ' ll start with a . 1 86 retracement off the top. I can see this should be close by looking at not only the 'proportion' of the chart, but also by looking at the high and low price and doing a 'quickie' calculation in my head. See figure 3 .6.
Figure 3.6
?: E503" 60-1 !1S t!
10 17 24 3 1 Feb7
Chart created by Dynamic Trader (c) 1996-2001
61
343.221 Ret 0 . 186
In this case the . 1 86 retracement i s right in the area that we are looking at. This will not always be the case. Sometimes the retracements don't l ine up at all. If that is the case, it tells me that the i ssue isn't behaving 'harmonically' , and I weigh that into my trading plan.
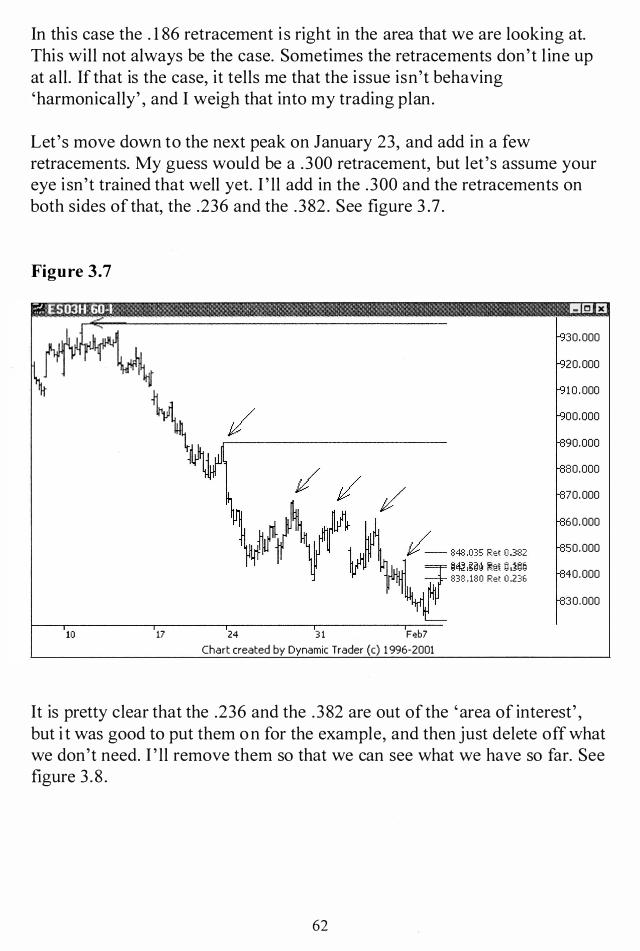
Let 's move down to the next peak on January 23, and add in a few retracements. My guess would be a .300 retracement, but let 's assume your eye i sn't trained that well yet. I ' ll add in the .300 and the retracements on both sides of that, the .236 and the .382 . See figure 3 .7 .
Figure 3.7
::''1. ES03" 60-" !IS EJ
10 17 24 3 1 Feb7
Chart created by Dynamic Trader (c) 1 996-2001
30.000
20.000
10 .000
00.000
90.000
80.000
70.000
60.000
50.000
838 . 180 Ret 0 .23& 40,000
30,000
It is pretty clear that the .236 and the .382 are out of the 'area of interest' , but i t was good to put them on for the example, and then just delete off what we don't need. I ' ll remove them so that we can see what we have so far. See figure 3 .8 .
62

Figure 3.8
?. ES03H 60-1 eEU!J
10 17 24 3 1 Feb7 Chart created by Dynamic Trader (c) 1 996-2001
Let's move down to the next peak on January 29, which is the most significant peak, in my opinion, of the group of three peaks in that general area. I feel it is the most significant because it was the high peak. The other two peaks could be thought of as ' failed tests' of this peak, or lower highs within congestion. That' s not to say we that won't use them; it ' s just that I weigh the January 29 peak as the most important of the three.
I would guess the retracement is a .447 retracement (a number that I have popularized in AFTC, it ' s the reciprocal of the fairly well know 2.236 external retracement). If you aren't sure, you might add in the .382, the .447,and the .486 (another number that I developed in the AFTC). I ' l l add those three, and we' ll see what we want to keep. See figure 3 .9.
63

Figure 3.9
?: ES03H GO-f !IS £J
10 17 24 31 Feb7 Chart created by Dynamic Trader (c) 1996-2001
30,000
20,000
10 ,000
00,000
90,000
80,000
70,000
The .447 retracement is the correct one. The other two retracements landed above and below the area. I ' ll delete those off, and we' l l take another look. See figure 3 . 1 0.
64

Figure 3. 1 0
?: ES03H 60-1 !lEI a
10 17 24 31 Feb7
Chart created by Dynamic Trader (c) 1996-2001
30.000
20.000
10 .000
00.000
90.000
80.000
70.000
60.000
50.000
40.000
30.000
So far this is a very nice, tight grouping that is forming, right in the area we are already looking at. I have three more peaks that I can use at this point. Let 's go to the next peak on February 3 . S ince this peak is lower than the previous peak that we j ust used, the retracement, if it i s to land in the grouping, must be a larger retracement. Hence, I will try the .486 retracement for this peak. See figure 3 . 1 1 .
65

Figure 3.11
?: ES03H GO-I I!liU!I
10 17 24 3 1 Feb7
Chart created by Dynamic Trader (c) 1996-2001
30.000
20.000
10 .000
00.000
90.000
80.000
70.000
60.000
50.000
40.000
30.000
Well, I can assure you the retracement is in there, you j ust can't see it. This is the kind of reinforcement that I like to see. These previous peaks, in my opinion, have a lot to do with current price action.
Let's move on to the next peak, from February 5 . This one is interesting, because we know that with the peak being lower we need a higher retracement number than the .486, but the next number up is the .6 1 8 . My eye can see that the .6 1 8 is too large. Although there is a 'tertiary' Fibonacci number between these two, I feel that the 'tertiary' numbers have l ittle significance in trading, and hence I won't consider using them here.
I will put the .486 and .6 1 8 on the chart, but I can tell you right now we are going to wind up deleting them off. When you are new to building groupings you j ust put anything close on the chart and see what fits in the groupings, and delete off the rest. See figure 3 . 1 2 .
66

Figure 3.12
?, ES03H 60-( 1!!113 £J
10 17 24 3 1 Feb7
Chart created by Dynamic Trader (c) 1996-2001
Just as I suspected, they fal l outside of the area, To me, this simply means that, if this potential trade area turns out to be a significant reversal point, the price action from this last peak didn't play that heavily in the reversaL I ' l l delete off the retracements from this peak, but let me save a step here.
We have one more peak left, the one from February 7. This is a 'textbook' example of an ,886 retracement. The .886 is a retracement that I discovered (I showed the derivation in AFTC), and it is perhaps my single best trading tool at this point. I ' l l add the .886 retracement in at the same time that I remove the retracements we don't need from the previous peak. See figure 3 . 1 3 .
67
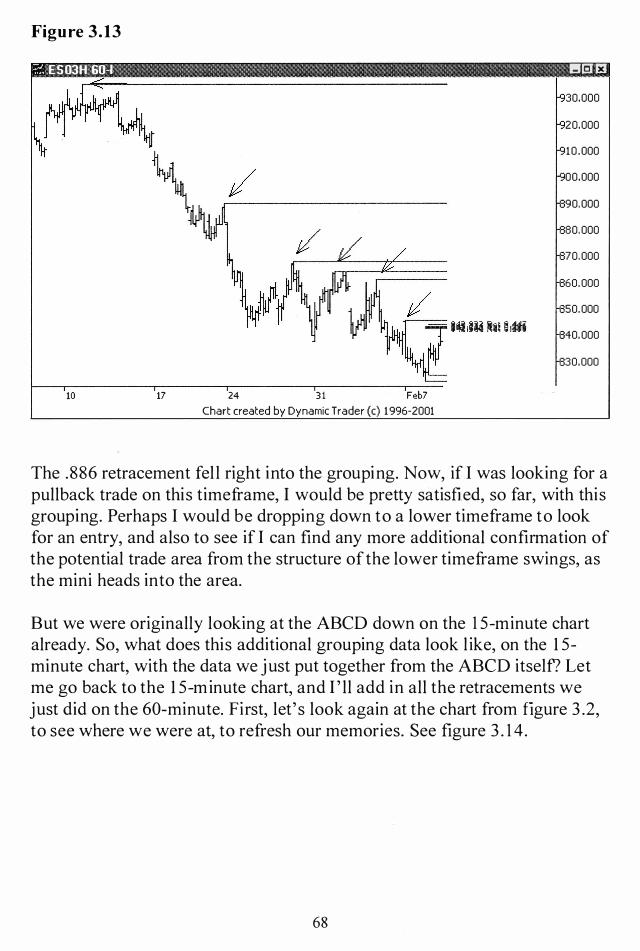
Figure 3.13
?. ES03H GO-I I!I[;] E'J
10 17 24 3 1 Feb7
Chart created by Dynamic Trader (c) 1996-2001
30,000
20,000
10 ,000
00,000
90,000
80,000
70,000
60,000
50,000
40,000
30,000
The .886 retracement fel l right into the grouping. Now, if I was looking for a pullback trade on this timeframe, I would be pretty satisfied, so far, with this grouping. Perhaps I would be dropping down to a lower timeframe to look for an entry, and also to see if I can find any more additional confirmation of the potential trade area from the structure of the lower timeframe swings, as the mini heads into the area.
But we were originally looking at the ABCD down on the 1 5-minute chart already. So, what does this additional grouping data look l ike, on the 1 5-minute chart, with the data we just put together from the ABCD itself? Let me go back to the 1 5-minute chart, and I ' ll add in all the retracements we just did on the 60-minute. First, let' s look again at the chart from figure 3 .2, to see where we were at, to refresh our memories. See figure 3 . 1 4 .
68

Figure 3.14
?. [SOlH 15-1 R!8 £J
Gt 7f FeblOm
f
� '27.'" '" 0 -' 18
Chart created by Dynamic Trader (c) 1996-2001
This is the grouping that we created from data contained within the ABCD itself. I ' l l now add the data that we just derived from the price action outside of the ABCD. Get ready for a surprise. See figure 3 . 1 5 .
69
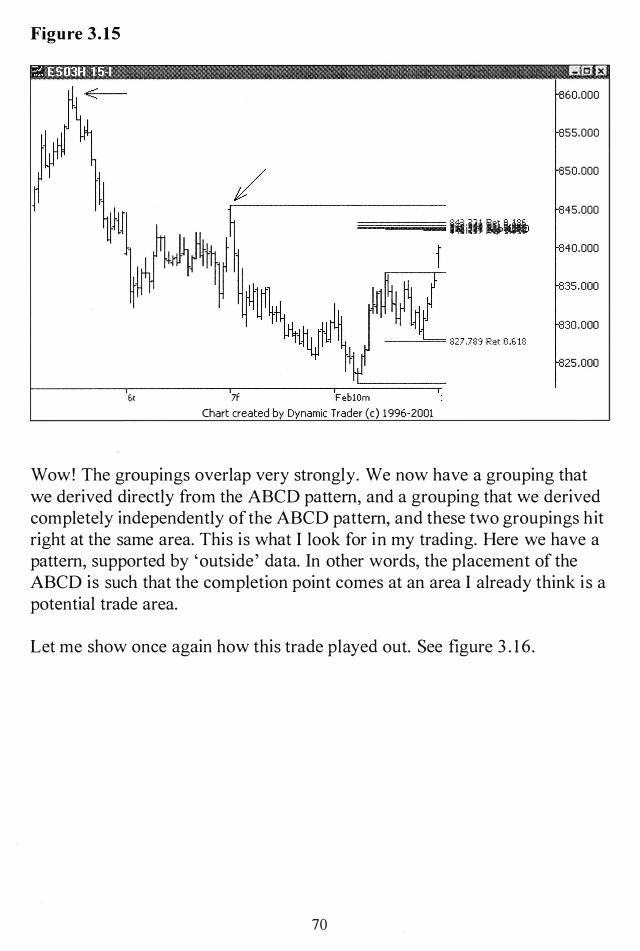
Figure 3.15
Eot 7f Febl0m Chart created by Dynamic Trader (c) 1996-2001
60.000
55.000
50.000
45.000
40.000
Wow! The groupings overlap very strongly. We now have a grouping that we derived directly from the ABeD pattern, and a grouping that we derived completely independently of the ABeD pattern, and these two groupings hit right at the same area. This is what I look for in my trading. Here we have a pattern, supported by 'outside' data. In other words, the placement of the ABeD is such that the completion point comes at an area I already think i s a potential trade area.
Let me show once again how this trade played out. See figure 3 . 16 .
70

Figure 3.16
?. [S03H 15-1 !!IS F!J f < 60.000
55,000
\ ....---/ _-�\�tJ1�y i lij� ii.
\���
50.000
45,000
40.000
35,000
----'=== 827,78'3 Ret 0 ,6 18
6t 7f Feb 10m 111
Chart created by Dynamic Trader (c) 1996-2001
If you remember, the mini first hit the potential trade area, pulled back, did a 'retest' of the area, and then fell off. Let' s take one last look at where it went from here. See figure 3 . 1 7.
7 1

Figure 3.17
?: ES03H 15-1 1!!8 £J
830.000 --I-.--�+iII+--:------ 827.789 Ret 0 .b18
bt 7F Feb 10m llt 12w 13t
Chart created by Dynamic Trader (c) 1 996-200 1
This is an amazing example of the power of the ABCD pattern at a potential trade area. This is a classic category one trade example. A well-established downtrend was in place, the i ssue corrected in an ABCD pattern, and then the trend reasserted itself. This is, perhaps, my all-time favorite type of trade right now.
I 'd l ike to present one quick aside before we move on. Remember that first peak on the last chart? The one at the upper left with the arrow pointing to it on figure 3 . 1 7? As we discovered on the 60-minute timeframe, this peak was the third of three peaks that were part of an area of congestion. I noticed something interesting about this peak, and I want to point it out. Take a look at the retracement I 've added to the chart. See figure 3 . 1 8 .
72

Figure 3.18
?: ES03H 15-1 I!!IGl l!J
----..---:<,,------------- 86 1 .065 Ret 0 .886
I
--'=== 827.78'3 Ret 0 .6 18
Feb 4t 5w 6t 7F Feb 10m 1 1t
Chart created by Dynamic Trader (c) 1996-2001
That last peak that we were looking at, marked by the arrow at the top left of the chart, was a near perfect .886 retracement from the previous peak. I wanted to show this as yet one more additional example of the .886 in action, because it might be that a few people are skeptical about some of the new Fibonacci numbers.
I can understand that, but for me, I 've seen too much not to use them in my trading. Still not sure that it' s not just a coincidence? Let' s do the peak before this one. I ' l l do the retracement of this second peak from the top of the first peak. See figure 3 . 1 9.
73

Figure 3.19
?: ES03H 15-1 !!Ie £J
-----:r---::--------------- SEA,245 Ret 0 ,886
----:r-:".---------- 861 .065 Ret 0,88E.
----"= 827,789 Ret 0 ,6 18
30t 3 1F F eb3m <It Sw 6t 7F Feb 10m 1 1t
Chart created by Dynamic Trader (c) 1996-2001
Lo and behold, that peak, too, was an almost perfect .886 retracement. I see this very frequently in areas of congestion, or areas where there are greatly overlapping swings. As I mentioned, I feel that this retracement is the single best tool in my arsenal at this time.
Anyone who follows the Kane Trading methodology knows that I never use anything by itself, or without context, and hence it fol lows that I don't use the .886 retracement by itself. But I sure do use it as part of my complete and comprehensive plan. I suggest that the reader experiment with it, and see if it has any place in his or her trading plan.
I will now move on to an example of a category three trade. This is an ABeD pattern that forms as a ' 5-point' pattern, but doesn't fit any of the Fibonacci ratios of the 'named patterns' . I must say, though, that people are naming patterns for more and more of the potential combinations of Fibonacci ratios, and at some point, perhaps, every possible combination may have a name ! I mention this now because, as time passes, whatever example I choose now might fit the definition of a 'named pattern' that, as of
74
yet, doesn't exist. I don't want any of my readers saying 'Well, that' s a so and so pattern, and he doesn't even know it ! '
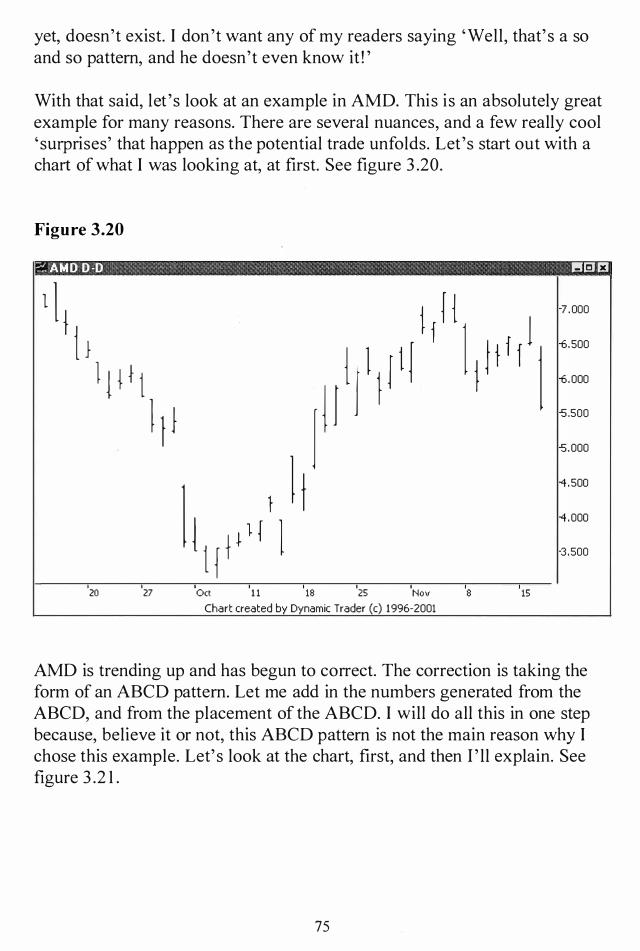
With that said, let 's look at an example in AMD. This is an absolutely great example for many reasons. There are several nuances, and a few really cool ' surprises' that happen as the potential trade unfolds. Let's start out with a chart of what I was looking at, at first. See figure 3 .20.
Figure 3.20
?: AMD D ·D 1!13 13
1 1 1 1 ) l ! t f 1
l } )
20 27
1 1 I I { t � 1 1 1 t { Oct 1 1
j 18
j f H J l t 1 I t f l j ) t f f 1 I I j
25 Nov 8 15
Chart created by Dynamic Trader (c) 1996-2001
7 .000
.500
.000
.500
.000
.500
.000
3 .500
AMD is trending up and has begun to correct. The correction is taking the form of an ABeD pattern. Let me add in the numbers generated from the ABeD, and from the placement of the ABeD. I will do all this in one step because, believe it or not, this ABeD pattern is not the main reason why I chose this example. Let' s look at the chart, first, and then I ' ll explain. See figure 3 .2 1 .
75

Figure 3.21
?: AMD D -D !lEl F3
1 l l J 1 I 1 j 1 P l j 1 1 {
27 Oct 11
I H j ' ''4 R" 0 ,"' j t l � l t f f 1�1 . _ [ l I ��I�
18 25 Nov 8 15
Chart created by Dynamic Trader (c) 1996-200 1
7.000
.000
. 500
.000
.500
. 000
3 .500
I 've labeled a potential trade area here, and it has six numbers in it, a lthough it' s hard to discern all of them because of the tight overlap. This is a great potential trade in its own right. It makes a nice example for this chapter, and it fits in well with the other examples that I 've presented so far. But what happens after this trade is what is really amazing to me. I ' l l move ahead and show how this trade played out. Look and see if you notice anything interesting. See figure 3 .22.
76
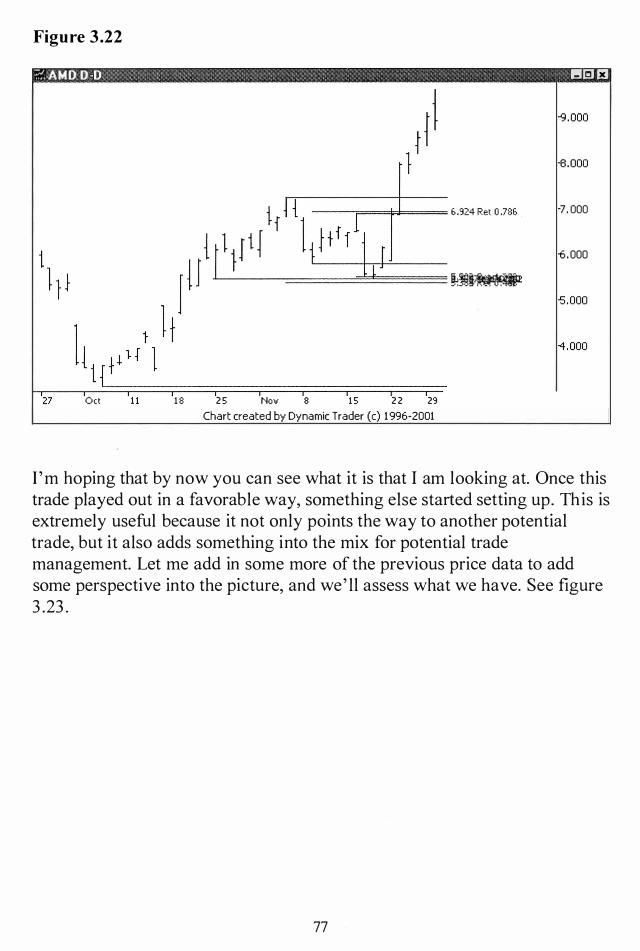
Figure 3.22
?. AMD D -D 1!!13 E3
f-9.000
ra·ooo
7.000
ft.. 000
-5.000
"4.000
27 Oct 1 1 1 8 2 5 Nov 8 1 5 2 2 29
Chart created by Dynamic Trader (c) 1996-2001
I 'm hoping that by now you can see what it is that I am looking at. Once this trade played out in a favorable way, something else started setting up. This is extremely useful because it not only points the way to another potential trade, but it also adds something into the mix for potential trade management. Let me add in some more of the previous price data to add some perspective into the picture, and we' ll assess what we have. See figure 3 .23 .
77

Figure 3.23
10 .000
� . ooo
[B . ooo
7.000
'E..ooo
-5.000
-4.000
1& 23 30 Sep 13 20 27 Oct 11 18 25 Nov 8 15 22 29
Chart created by Dynamic Trader (c) 1996-2001
What we have is a larger ABeD pattern setting up, and setting up as a 5-point pattern with respect to the down move on the left side of the chart. The ABeD pattern that first attracted me to AMD was simply the Be leg of a larger ABeD pattern setting up. Let me put the entire grouping of numbers I came up with on the chart in one shot, to show the potential trade area that I am looking at. See figure 3 .24.
78

Figure 3.24
?. AND 0-0 I!!IEH!I
10 .000
1& 23 30 5ep 13 20 27 0ct 11 18 25 Nov 8 15 22
Chart created by Dynamic Trader (c) 1996-2001
This is a fairly tight grouping, considering how large of a range of data I used to generate them. At first look, I would probably delete out the lower .486 retracement, and the upper .3 82 retracement, and leave the remaining as my grouping. Before I discuss the numbers, though, let me show a lot more data on the chart, and highlight all the peaks that I used to create some of these numbers. This wil l add in some needed perspective. See Figure 3 .25 .
79
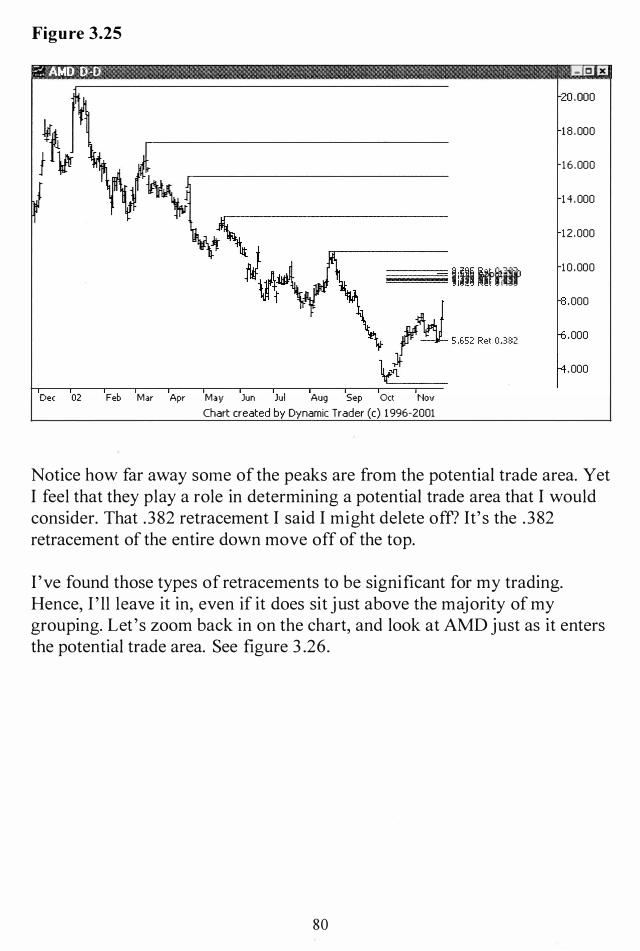
Figure 3.25
?. AMD D-D !lEI £J
Dec 02 Feb Mar Apr May Jun Jul Aug Sep 0ct l'Iov
Chart created by Dynamic Trader (c) 1996-2001
20 .000
18 . 000
16 .000
1 '1 . 000
12 .000
10 .000
.000
.000
.000
Notice how far away some of the peaks are from the potential trade area. Yet I feel that they play a role in determining a potential trade area that I would consider. That .382 retracement I said I might delete off? It' s the .382 retracement of the entire down move off of the top.
I 've found those types of retracements to be significant for my trading. Hence, I ' ll leave it in, even if it does sit just above the majority of my grouping. Let 's zoom back in on the chart, and look at AMD just as it enters the potential trade area. See figure 3 .26.
80

Figure 3.26
:::"!. AMD D-D 1!!18 Dl
10 .000
16 23 30 Sep 13 20 27 Oct 11 18 25 Nov 8 15 22 2�
Chart created by Dynamic Trader (c) 1996-2001
AMD went up strongly into the potential trade area. It just about exploded off of that .3 82 retracement area of the AB leg, which was the completion point of the original ABCD that we were looking at. It has now thrown a reversal bar, after hitting the AB=CD point just about exactly (shown as the APP 1 .000 line on the chart).
I ' ll move quite a bit ahead in time now, to show what happened after this. (I 'm trying to focus more holistically here on what is happening, and not on how to generate the numbers and bui ld the groupings. I 'm hoping that the reader has the idea on the latter part by now.) See figure 3 .27.
8 1

Figure 3.27
?: AND D ·D !lEI F.3
5ep Oct Nov Dec 03 Feb
Chart created by Dynamic Trader (c) 1996-2001
10 .000
This larger ABeD pattern played out beautifully. I first got interested in AMD because of a small correction that was in the form of an ABeD pattern. This turned into a much larger ABeD pattern that really played out nice. And now, I 'm hoping that all my readers are anxiously saying 'But Jim, look at the chart ! Are you seeing that? Look at that! ' Yes, I sure do see it. Just in case you don't, let me highlight the chart for you. See figure 3 .28 .
82

Figure 3.28
?: AMO 0 -0 I!!IEI F!I
Sep
--------------- 9.785 Ret 0 .332
������I!Hlifl�1
Oct
--t£'--------=tr.-,,.--lr- S .E-S2 Ret 0 .3132
Nov Dec 03 Feb
Chart created by Dynamic Trader (c) 1996-2001
10 .000
Nah, it couldn't be. Could that actually work out, again? You can't know for sure ahead of time, but this is what I look for. 1 'd set up a potential trade area, and once the area is penetrated, 1 'd dial down to a lower timeframe and look for an entry technique (see Kane Trading on: Entry Techniques for details on how I do that).
Let' s move on and see if this setup makes it three ABCD's in a row. Or is it four? Look at the BC leg of the highlighted ABCD pattern. I see an ABCD pattern in that leg, just like there was one in the BC leg of the first large ABCD pattern we looked at. What do you think? Is it going to reverse again? See figure 3 .29.
83

Figure 3.29
?: AMD D-D 1!!13 J!1
Sep
----------------- 9 .785 Ret 0 .382 �������I!H� i!rtl
Oct
, \j¥J --It'------tr,,.-'t-_----:r�--- 5.E.52 Ret 0382
Nov Dec 03 Feb Mar Apr
Chart created by Dynamic Trader (c) 1996-2001
10 .000
It almost doesn't seem possible. When I see things like what I 've presented in this AMD example, I just can't comprehend how anyone can say that price action is completely random and independent of all past price action. It was just a random coincidence that AMD did four ABCD pattern reversals in row here? And we only examined this small area of AMD history.
I can't 'prove' that price action isn't random, or 'prove' that anyone can make money using this technique. I can only present it to my readers and let them decide, individually, if they want to use it or not. Myself, I feel there is an edge here, and I use it in my trading.
1 'd like to make a few comments before we move on to the next chapter on alternate ABCD patterns. First, I didn't focus on the Fibonacci placement of the B point as much as I could have in the last two examples. I didn't want to get too many ideas going at one time, possibly confusing the reader. Nonetheless, I feel it' s an important criterion to satisfy, and I don't want to leave the impression that I don't fully examine it. For this reason, I want to look at this in brief before we move on. Let 's look back at figure 3 . 1 , shown again for convenience. See figure 3 .30 .
84

Figure 3.30
?'. ES03H 15-1 1!13£1
Gt 7f FeblOm
f Jf� 8".'" '0< 0 -'18
Chart created by Dynamic Trader (c) 1996-2001
This is the potential trade area created from just the data within the ABCD, before we started to add in 'external' data from the previous swings. I didn't even present my look at the placement of the B point, which I use to help my decision on how much I l ike this particular ABCD pattern. Let me add that to the chart, and see what that tells us. See figure 3 .3 1 .
85

Figure 3.31
?. E S 03H 1 5-1 I!EU.3
hi! J
'�UI' Aoo>!Im
E.t
11 7F FeblOm
Chart created by Dynamic Trader (c) 1996-2001
The B point was a near perfect .6 1 8 retracement off that peak from February 7. Let me point out, then, that this also forms a 5-point pattern with the X point at that very same February 7 peak. I ' l l get back to this with my second point, in a minute. F irst, let me add in a .382 retracement from that peak on February 5 , as seen in the upper left hand comer of the chart. See figure 3 .32.
86
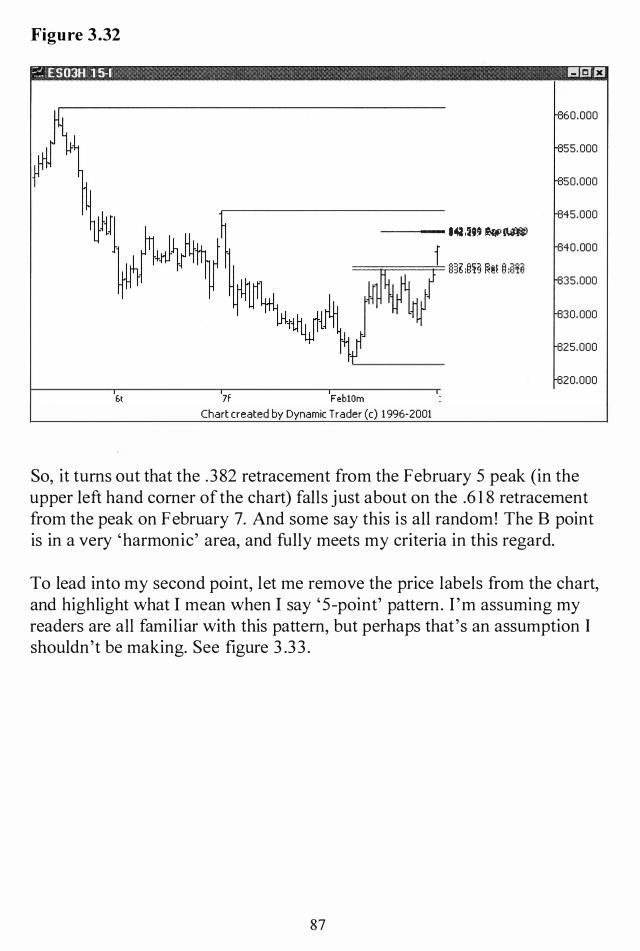
Figure 3.32
::.-:: [S03H 1 5-1 !I[;J f!1
� �m ��
11 6t 7f FeblOm
Chart created by Dynamic Trader (c) 1996-2001
60.000
55.000
50,000
45.000
40.000
35.000
30.000
25.000
20.000
So, it turns out that the .382 retracement from the February 5 peak (in the upper left hand corner of the chart) falls just about on the .6 1 8 retracement from the peak on February 7. And some say this is all random! The B point is in a very 'harmonic' area, and fully meets my criteria in this regard.
To lead into my second point, let me remove the price labels from the chart, and highlight what I mean when I say ' 5-point' pattern. I 'm assuming my readers are all familiar with this pattern, but perhaps that's an assumption I shouldn't be making. See figure 3 .33 .
87
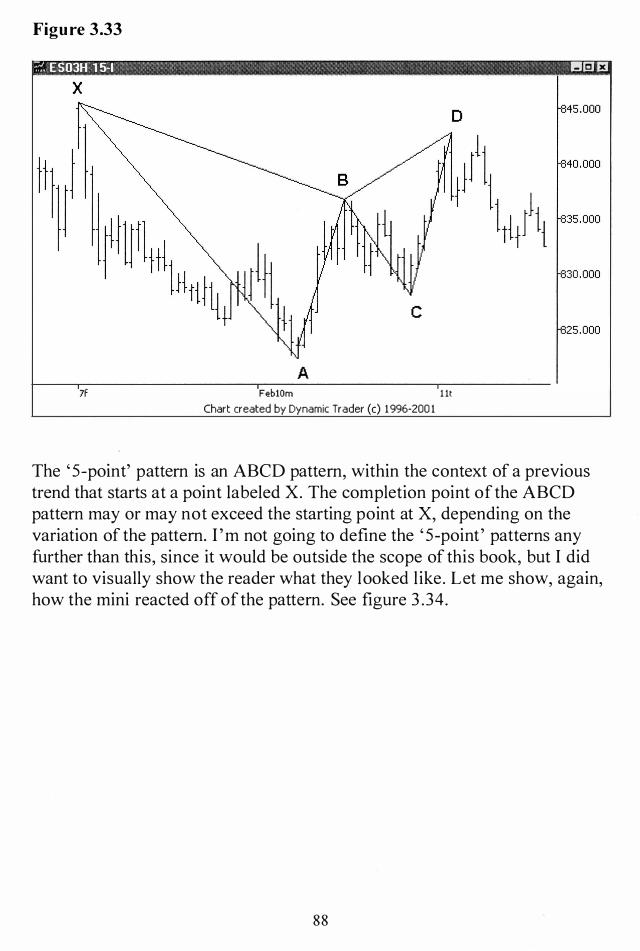
Figure 3.33
?:. E S 03H 1 5-1 1I!!8 £I
x
A 7f FeblOm l lt
Chart created by Dynamic Trader (c) 1996-200 1
The ' 5-point' pattern is an ABCD pattern, within the context of a previous trend that starts at a point labeled X. The completion point of the ABCD pattern may or may not exceed the starting point at X, depending on the variation of the pattern. I 'm not going to define the ' 5-point' patterns any further than this, since it would be outside the scope of this book, but I did want to visually show the reader what they looked like. Let me show, again, how the mini reacted off of the pattern. See figure 3 .34.
88

Figure 3.34
?. E 5 03H 1 5-1 1!!8 t1
X D 45.000
40.000 \It 35.000
C
A
�1 15 .000 �l� 10 .000 �Vlt 7f Febl0m 1 1t 12w 13t
Chart created by Dynamic Trader (c) 1996-2001
This particular pattern isn't one of the 'named patterns' because the Fibonacci ratios don't meet the criteria of any of the patterns (yet ! ) . That doesn't mean, for my trading, that the pattern isn't useful to me, though.
Let me get on to my second point. Let 's see what happens to our perspective when we add a lot of previous data to the chart. See figure 3 .35 .
89

Figure 3.35
?. E S 03H 60-1 1!!I13 £J
15w lbt 17f Jan 22w 23t 24f Jan 28t 29w 30t 3 1f Feb 4t 5w bt 7f Feb l lt 12w 13t
Chart created by D�/namic Trader (c) 1996-200 1
30.000
20.000
10 .000 00.000
90.000
80.000
70.000
60.000
50.000
40.000 30.000
20.000
10 .000
What you see now is a long, fairly strong downtrend, with the 5-point pattern just a small part of the overall trend. What I originally saw was an ABeD correction to a trend, a category one trade, one of my favorite kinds of trades. It only becomes a 5-point pattern when you look at it close up, on a smaller timeframe.
My point is, many times an ABeD pattern wi ll be both a category one and a category two or three setup, depending on the timeframe that you look at the setup in. Most of the times that I see 5-point patterns presented in books or on websites, they are presented either as a stand-alone pattern, or at the end of a trend, but setup to reverse the trend. The X point or the completion point of the pattern is at the end of the trend. This sets up a reversal of what is, perhaps, a major trend.
The way I have the 5-point pattern shown in the last chart, it' s a continuation pattern. I don't l ike to try to pick the ends of long trends. So my point is, I categorize the type of ABeD based on the larger timeframe. Although this last chart example is certainly a textbook 5-point pattern, it' s also, more importantly, an ABeD correction to a very long-standing trend. Always
90

know and understand the context of what you are looking at as a potential trade area, in the context of the traded timeframe.
In the next chapter we are going to look at ABCD's where the length of the AB and the CD legs are not equal, as has been the case in all the examples so far. This doesn't, however, have a material effect on how we develop the potential trade areas. In fact, the procedure will be essentially identical . And it will open up a much larger pool of potential trades.
9 1


Chapter 4
Alternate ABeD Patterns
One of the most interesting things that I noticed when I started studying ABCD patterns was that many very good looking and tradable patterns were falling just short of, or going just long of, the point where AB=CD. I started wondering if there was any reason why I should only consider patterns where the AB leg was equal to the CD leg, and I couldn't think of any good reason to limit myself like that. If nothing more, I wanted to at least study patterns where ABi=CD, and see what I might discover.
What I discovered was that not only was there a huge number of successful ABCD patterns where ABi=CD, I found that, in the studies that I did, they outnumbered the patterns where AB=CD. This only makes sense, since there are many possible ways to form patterns where ABi=CD, and just one possible way where AB=CD. This told me that I definitely wanted to consider these additional ABCD patterns in my trading, where ABi=CD. These variations are called 'alternate' ABCD patterns.
I did not discover or invent the concept of alternate ABCD's, I just put my own spin on some variations. I first came across the concept of alternate ABCD's in discussions with Scott Carney over at Harmonic Trader. Scott presents this alternate concept in his material in reference to ABCD' s where the CD leg is either a 1 .272 or 1 .6 1 8 multiple of the AB leg, or the reciprocal multiples, .6 1 8 and . 786. In my presentation here I will use the . 786 and 1 .272 multiples of the AB leg, but I will also use two other multiples that I 've never seen used before.
That is not to say that these two particular multiples have not been presented elsewhere, it' s just that I don't recall ever having seen them presented anywhere else. And since the two variations key off of the .886 retracement (and its reciprocal) that I developed, it' s unlikely that those two variations have been considered before my work. Again, I refer the reader to my book AFTC for the full derivation of these numbers.
My reasoning on the merits of alternate ABCD patterns is as follows. I feel that if there is merit in the l .272 alternate price projection, it should fol low that there would also be merit in its reciprocal, the . 786. I have found no
93

reason to prefer ABCD patterns where the CD legs are equal to or greater than a l .000 ratio of the AB legs. And i f the .786 is valid in my eyes, then the .886 should be, too, especially if I feel that the .886 retracement is, perhaps, the best tool in my trading arsenal right now.
It would then fol low that the reciprocal of the .886, which is the l . 1 3 , would also be useful. (Detailed derivations and uses of the l. 1 3 , as well as the .886, are available in AFTC, for those readers that want more information on these new numbers.) Hence, these are the five numbers that I use for price projections: the .786, .886, l .000, l . 1 3 , and l .272.
It is easy to put those five price projections on the chart in one shot with specialized software, but they are reasonably easy to hand calculate (although it' s time consuming), if you want to just do it that way. I prefer to make it easy on myself and use software, but it i sn't critical to the process. At this point I want to note, there is nothing different about the development of potential trade areas for this technique except the use of alternate ABCD projections in the calculations, and the fact that now there may be jive areas that we need to look at instead of just one.
If you've read AFTC and are fami liar with the groupings technique, you will understand that you may form several tight groupings in a particular area. After that, you watch how the i ssue behaves as it enters the area of the groupings, and then move to the entry technique phase of the trade. So now, instead of just one grouping in the potential trade area, we may have more than one, set very closely together.
As you wi ll see, though, other than having more than one grouping, the process is pretty much the same. Hence, once I have demonstrated the new aspects of the building process, I will not focus as much after that on creating the groupings, I will just present various examples so the overall picture can be studied.
94
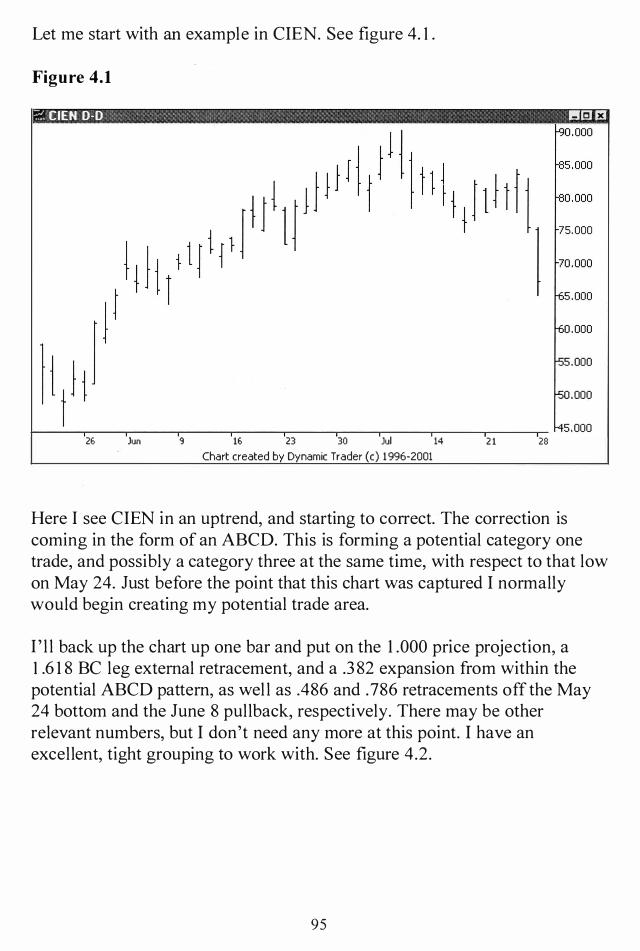
Let me start with an example in CIEN. See figure 4. 1 .
Figure 4.1
?: elEN 0-0 B8 £J
75.000
70. 000
26 Jun 9 16 23 30 Jul 14 2 1 28
Chart created by Dynamic Trader (c) 1996-2001
Here I see CIEN in an uptrend, and starting to correct. The correction is coming in the form of an ABCD. This is forming a potential category one trade, and possibly a category three at the same time, with respect to that low on May 24. Just before the point that this chart was captured I normally would begin creating my potential trade area.
I ' l l back up the chart up one bar and put on the 1 .000 price projection, a 1.6 1 8 BC leg external retracement, and a .3 82 expansion from within the potential ABCD pattern, as wel l as .486 and . 786 retracements off the May 24 bottom and the June 8 pullback, respectively. There may be other relevant numbers, but I don't need any more at this point. I have an excellent, tight grouping to work with. See figure 4.2.
95

Figure 4.2
?. CIEN D-O 1!!r:;J F!'I
2& Jun 9
75.000
70.000
16 23 30 Jul 14 2 1 Chart created by Dynamic Trader (c) 1 996-2001
Now, I wait as CIEN approaches the potential trade area. If you have a good eye and you look back at figure 4. 1 , you can guess what i s going to happen. Something happens that didn't happen in any of the previous examples. Let's move back to where we were in figure 4 . 1 , which is just one more bar ahead, but this time with the potential trade area labeled on the chart. See figure 4.3 .
96

Figure 4.3
?. elEN D-D 11!!18 E'J ) l j tdt dri ft ) t 1
26 Jun 9 16 23 30 Jul 14 21 2:
Chart created by Dynamic Trader (c) 1 996-2001
75,000
70,000
That is a clear blowout of the potential trade area. Fortunately, I wouldn't have gotten an entry signal for this trade on the lower timeframe using the entry techniques that I use, as outlined in Kane Trading on: Entry Techniques. This amounts to just watching this one go by. This will happen on a certain amount of trades, they just don't respond to the potential trade area. That's trading. At least waiting for a confirmation entry technique will keep you out of some of those 'blow out the zone' trades.
All is not lost here, though. Let me add in a 1 .272 price projection of the AB leg, which will show up just below the current potential trade area. See figure 4.4.
97

Figure 4.4
?. elEN D·D I!!I(;I £J
2& Jun 9
75.000
70 . 000
-- &4.375 App 1 .272
1& 23 30 Jul 14 21 2:
Chart created by Dynamic Trader (c) 1996-2001
This 1 .272 alternate ABCD completes at a price just under where CIEN currently is trading on this chart. Since I pretty much never trade just 'one number' , I would now create a grouping in this area, to confirm that there is additional Fibonacci support to complement this area. If I am unable to find such additional support, I simply pass on the trade and move on. In this case, I am able to find the numbers to satisfy my own needs. I will add them onto the chart in one shot. I followed the same procedure that I have followed in creating the other examples so far. See figure 4 .5 .
98
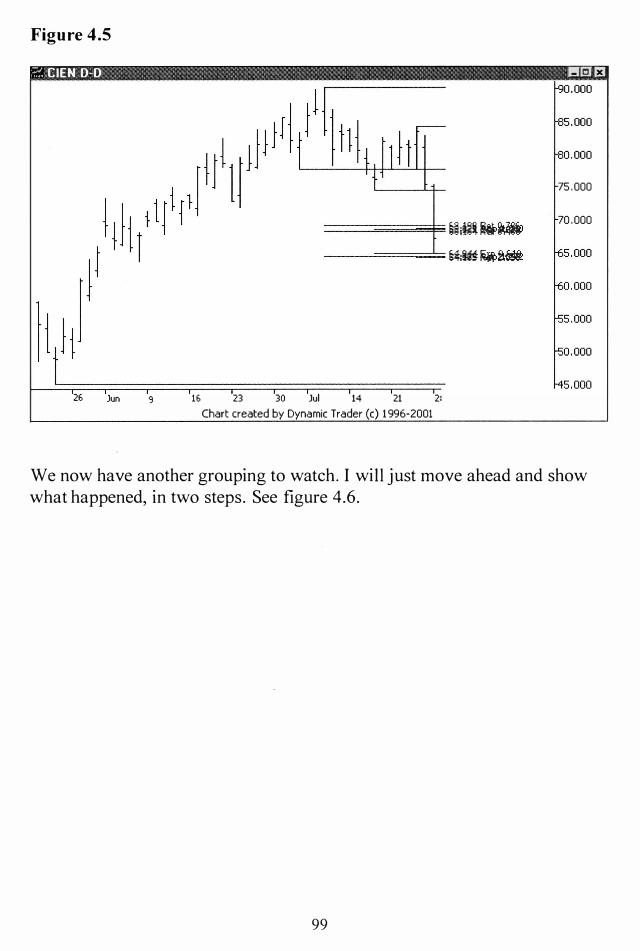
Figure 4.5
?. elEN 0-0 !!IS EJ
26 Jun '3 16 23 30 Jul 14 21 2:
Chart created by Dynamic Trader (c) 1996-2001
75 ,000
70 ,000
We now have another grouping to watch. I will just move ahead and show what happened, in two steps. See figure 4.6.
99

Figure 4.6
2& Jun 9 if> 23 30 Jul 14 2 1 28
Chart created by Dynamic Trader (c) 1996-2001
0 .000
5 . 000
0 . 000
75.000
iU�t �� 70 .000
B�;iff ��� 5 .000
0 . 000
5 .000
0 .000
5 . 000
CIEN bounced just about three cents above the top of the grouping, but since the grouping wasn't penetrated, I would not have been ready to accept an entry trigger on the lower timeframe. CIEN then came back down and penetrated the grouping in textbook fashion.
It is at this point that I would now determine my entry trigger and accept it, if all played out as expected (I sometimes abort trades if the price action gets 'unusual' in the potential trade area, so I don't want to imply that my trading is always so 'cut and dried' , devoid of subjective decision making, as far as the entry trigger acceptance goes). Let 's see how this 1 .272 ABCD worked out, after CIEN blew out the AB=CD pattern variation. See figure 4.7 .
1 00

Figure 4.7
?. CIEN D-D !IS F3
==========t$=i$==========� �iji�� �� ---...... -...------ '4,m �MU:
26 Jun '3 16 23 30 Jui 14 21 28 Aug 11 18 25 !:
Chart created by Dynamic Trader (c) 1996-2001
1 10 ,000
100,000
70,000
CIEN just smoked up after the 1 .272 alternate ABCD pattern completed. There was a near 80% run up of over $50, just about ' straight up' , as they say. CIEN continued on up to $ 1 5 1 before finally reversing significantly. Now, I wil l in no way say that this alternate ABCD pattern 'compelled' CIEN to go up, or that the pattern had anything whatsoever to do with CIEN going up. As they say, there is only one thing that makes a stock go up, and that 's buying.
Patterns don't make stocks, or any other trading vehicles, go up. But what I feel that they do is point to areas where buyers (or sellers) may come in. The techniques point me to areas where something might happen, areas that potentially give me an edge. I can't 'prove' that any of the techniques give me any edge at all , but I truly feel that they do, or I wouldn't trade using them.
How many times can I see things l ike this example in CIEN, and say that it' s all just random? Besides, there is nothing random about steady accumulation by big players, for example. The market is not fil led with players who just wake up, go to the office, flip a coin and buy if it 's heads or sell if it' s tails.
1 0 1

They are doing very specific things to meet very specific agendas, and that 's not random. That's why a recent study done by MIT researchers showed that some setups and patterns do, in fact, produce a non-random edge.
I say all this here because there are stil l people who figure that because one can't mathematically 'prove' , according to rigorous academic standards, that a setup produces an edge, therefore the edge doesn't exist. I say it very well may exist, it is just not rigorously and mathematically proven. Traders take a lot of heat from the 'random-walkers ' , and I just want to make it clear that I , personally, cannot bel ieve that all the examples I can find are just random occurrences. Hopefully, the MIT studies wil l finally put to rest the 'randomwalkers ' .
At this point 1 ' d l ike to show another example of an alternate ABCD pattern, and then I ' ll move on to how I actually make decisions using what might seem l ike an overwhelming five projections, instead of just one. Let 's look at C, as a potential ABCD pattern shapes up. See figure 4.8 .
Figure 4.8
_ ... 111
[42 , 000
[40, 000
23 30 Apr 12 20 27 May 11 1S 25 Jun S 15 22 29 Jul 13 20 27
Chart created by Dynamic Trader (c) 1996-2001
1 02

There are a few ways to look at the position of C in this chart. Some might say that C is in a large trading range that started back in early April . That is an interpretation that I wouldn 't disagree with. But recall how I said that I frequently see very nice, tradable ABCD patterns appear in areas of congestion or in trading ranges. So, the fact that C is in a range won't preclude me from considering potential ABCD pattern trades.
That 's not, however, what attracted me to this potential ABCD pattern. I noticed that C had run up a bit from the low on Mar 22. As it struggled to move higher, it did a small 'double top' of sorts on May 24 and June 5 , and then sold off fairly sharply. It then recovered from this sell off and set a nominal new high for the move. Shortly after this, it formed another double top, and sold off even more sharply. It was at this point that it started to form a potential ABCD pattern.
This looked like a place where C might fai l and start to sell off again. I had no idea if C would set a nominal new low or really sell off, or if C would even reverse at all at the potential ABCD pattern completion point. What I did know is that I wanted to see what type of groupings I could build around this pattern, and how C would react to them.
The first step is to see how the C point (the end of the BC leg, not the ticker symbol C) looks, as far as whether it reversed at or near a Fibonacci number. I can see quite clearly what retracement that is, so I ' ll just add that one. See if you can make an educated guess as to which retracement it is. In reality, when you are new to this, you will l ikely add in all the retracements that make sense, and see if the issue reverses at any of the retracements that you added. See figure 4.9.
1 03
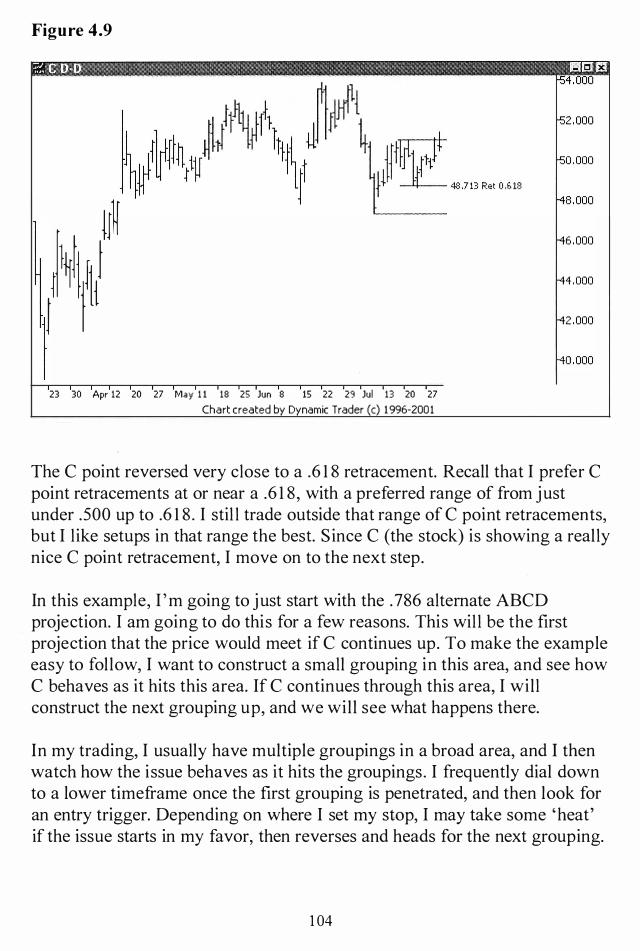
Figure 4.9
U� Jl�tj 11 ) I ! 1 1
ll� jt) l�Jll
23 30 Apr 12 20 27 May 1 1 18 25 Jun 8 15 22 29 Jul 13 20 27
Chart created by Dynamic Trader (c) 1996-2001
..:.lolxi [-54.000
fs2.000
fso .ooo
-48 . 000
-46. 000
f44 . 000
f42.000
f40.000
The C point reversed very close to a .6 1 8 retracement. Recall that I prefer C point retracements at or near a .6 1 8 , with a preferred range of from just under .500 up to .6 1 8 . I stil l trade outside that range of C point retracements, but I l ike setups in that range the best. Since C (the stock) is showing a really nice C point retracement, I move on to the next step.
In this example, I 'm going to just start with the . 786 alternate ABCD projection. I am going to do this for a few reasons. This wil l be the first projection that the price would meet if C continues up. To make the example easy to follow, I want to construct a small grouping in this area, and see how C behaves as it hits this area. If C continues through this area, I will construct the next grouping up, and we will see what happens there.
In my trading, I usually have multiple groupings in a broad area, and I then watch how the issue behaves as it hits the groupings. I frequently dial down to a lower timeframe once the first grouping is penetrated, and then look for an entry trigger. Depending on where I set my stop, I may take some 'heat' if the issue starts in my favor, then reverses and heads for the next grouping.
1 04

Sometimes thi s leads to a stop out, and shortly after that the issue gives another entry trigger off of the next grouping. It' s not uncommon, if you use a very fine entry trigger and keep the stop tight, for it to take one or two extra 'tries' to catch the move. If the groupings are fairly tight together, sometimes a prudent stop can be set just outside the farthest grouping. That would allow the trader to s it through multiple bounces on the inner area of the groupings.
My point is, in this example I will add further groupings as needed, but in my own trading I will have all these groupings pre-constructed and on the chart before the entry trigger phase is even begun. Sometimes it is confusing to beginners to see all the groupings at once, so for clarity in this example, I will add them as needed.
I ' l l add the .786 price projection onto the chart, and for clarity I ' ll show the 'zigzag' that we are looking at. See figure 4 . 1 0.
Figure 4.10
j j
22 29
1 j t j
Jul 13 20 27
Chart created by Dynamic Trader (c) 1 996-2001
1 05
3 .000
2 .000
51 .458 App 0 .78&
1 .000
0 .000
9 .000 4'3 .713 Ret 0 .E.1S
8 .000
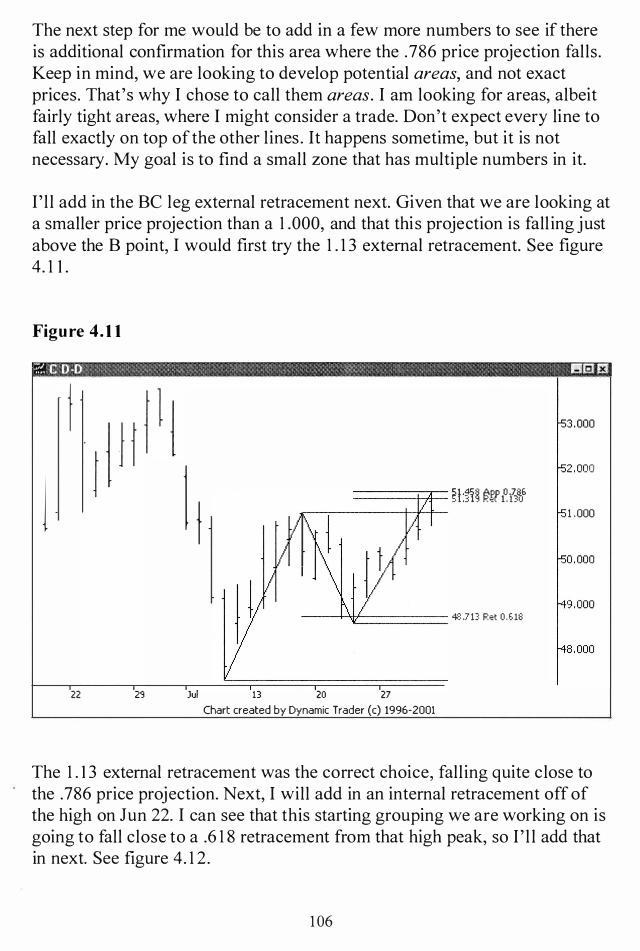
The next step for me would be to add in a few more numbers to see if there is additional confirmation for this area where the . 786 price projection falls. Keep in mind, we are looking to develop potential areas, and not exact prices. That's why I chose to call them areas. I am looking for areas, albeit fairly tight areas, where I might consider a trade. Don't expect every line to fall exactly on top of the other lines . It happens sometime, but it is not necessary. My goal is to find a small zone that has multiple numbers in it.
I ' l l add in the Be leg external retracement next. Given that we are looking at a smaller price projection than a 1 .000, and that this projection is fall ing just above the B point, I would first try the 1 . 1 3 external retracement. See figure 4. 1 1 .
Figure 4.11
j j
22
1 j �Hl� ��Nb�&
-----l---"tt======== 4'3 .7 13 Ret O .E.le
Jul 13 20 27
Chart created by Dynamic Trader (c) 1996-2001
1 . 000
The 1 . 1 3 external retracement was the correct choice, falling quite close to the .786 price projection. Next, I will add in an internal retracement off of the high on Jun 22. I can see that this starting grouping we are working on is going to fall close to a .6 1 8 retracement from that high peak, so I ' l l add that in next. See figure 4. 1 2 .
1 06
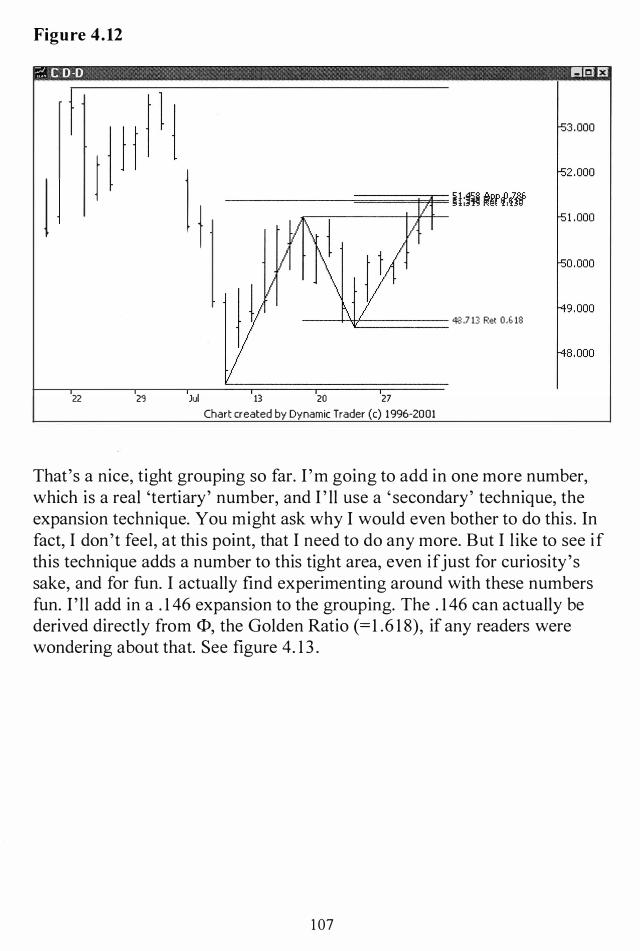
Figure 4.12
?: C 0 -0 I!!I GU!'I
1 t j j 22 2�
---4�======== 48 .7 13 Ret O.� 18
Jul 13 20 27
Chart created by Dynamic Trader (c) 1 996-2001
That's a nice, tight grouping so far. I 'm going to add in one more number, which is a real 'tertiary' number, and I ' ll use a ' secondary' technique, the expansion technique. You might ask why I would even bother to do this. In fact, I don't feel, at this point, that I need to do any more. But I like to see if this technique adds a number to this tight area, even if just for curiosity's sake, and for fun. I actually find experimenting around with these numbers fun. I ' l l add in a . 1 46 expansion to the grouping. The . 1 46 can actually be derived directly from <1>, the Golden Ratio (=1 .6 1 8), if any readers were wondering about that. See figure 4. 1 3 .
1 07

Figure 4.13
?. C D -D !lEU:!
j ) 1 t
22 29
--�======== 43.713 Ret 0.c18
Jul 13 20 27
Chart created by Dynamic Trader (c) 1 996-2001
The . 146 expansion fell just over eight cents above the . 786 price projection. How's that for close? I now have a grouping that I would look to trade against. At this point I would drop down to a lower timeframe and observe how C behaves in this area, as I watch for an entry trigger. Let's add a few bars in, and see what C is doing with respect to this area. See figure 4. 1 4.
1 08

Figure 4.14
t t
t 1 ) I f 1 1 d ) 1 j
---'+1[:============ 48 .713 Ret 0 .6 13
22 29 � 13 � II A�
Chart created by Dynamic Trader (c) 1996-2001
C is reversing right at this grouping. In fact, the high price into the grouping was within less than two cents of that .786 price projection. Let's see how the trade played out longer term. See figure 4 . 1 5 .
1 09
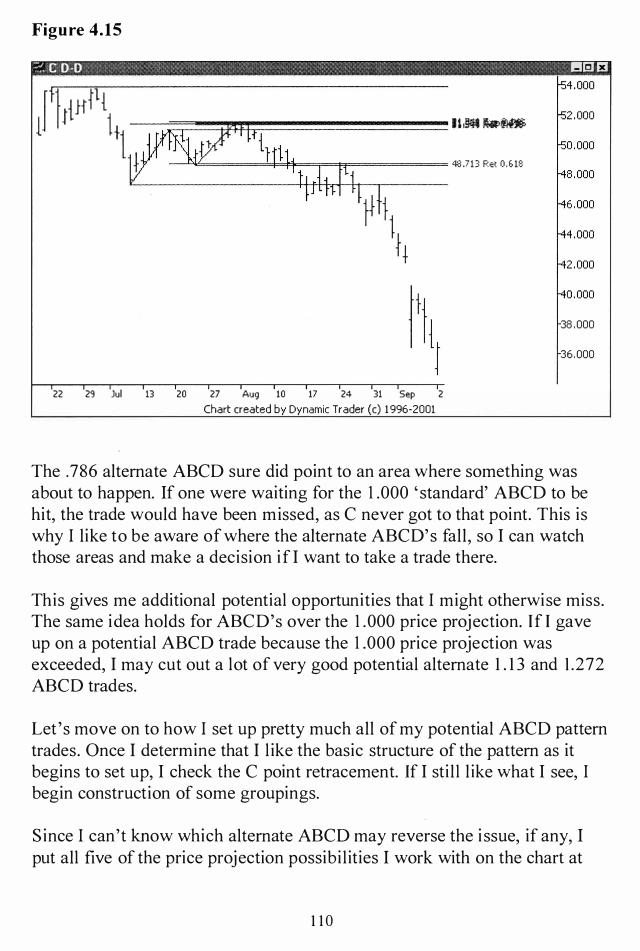
Figure 4.15
?. C 0-0 !IS a
-�==���==;==t';I===== 4$ .713 Ret O .€'lS
38 .000
36.000
22 29 Jul 13 20 27 Aug 10 17 24 31 Sep 2
Chart created by Dynamic Trader (c) 1996-2001
The .786 alternate ABCD sure did point to an area where something was about to happen. If one were waiting for the 1 .000 ' standard' ABCD to be hit, the trade would have been missed, as C never got to that point. This is why I like to be aware of where the alternate ABCD's fall, so I can watch those areas and make a decision if I want to take a trade there.
This gives me additional potential opportunities that I might otherwise miss. The same idea holds for ABCD's over the 1 .000 price projection. If I gave up on a potential ABCD trade because the 1 .000 price projection was exceeded, I may cut out a lot of very good potential alternate 1 . 1 3 and 1 .272 ABCD trades.
Let 's move on to how I set up pretty much all of my potential ABCD pattern trades. Once I determine that I l ike the basic structure of the pattern as it begins to set up, I check the C point retracement. If I stil l l ike what I see, I begin construction of some groupings.
S ince I can't know which alternate ABCD may reverse the i ssue, if any, I put all five of the price projection possibil ities I work with on the chart at
1 1 0

one time (.786, .886, 1 .000, 1 . 1 3 , and 1 .272). I follow this up with three external retracements of the Be leg, the 1 . 1 3 , 1 .272, and 1 .6 1 8 . I will then look at some expansions and see if they complement what is forming at that point.
As I 've mentioned already, expansions are a secondary technique, but one which I like to experiment with. I pretty much add expansions onto all of my charts, but I weigh them less heavily than the other techniques. If they don't l ine up well with the numbers already on the chart (they usually do l ine up quite well, in my experience), I simply don't use them.
At this point I add in internal retracements from previous price action. These are the numbers that are generated from data outside of the ABeD pattern. I also look for any other significant swings that I could use with the same techniques we have been looking at. Sometimes there is a swing within a leg, or something of that nature, that can also contribute to the groupings. I then look to see what, if anything, is lining up.
I 'm looking to not only reinforce the completion point of the ABeD, but also the B point of the pattern. Keep in mind, too, that I 'm trying to find areas. This means that, for all intents and purposes, I don't look at the five price projections as five potential areas, I look at them as possible l ines for defining areas.
Let me explain my thinking here. If the area between the l . 1 3 and l .272 price projection, for example, had a .large group of numbers fall in between them, and very little number grouping elsewhere, I would define my area as the area between these two projections, including all the numbers grouping within the area.
I would not try to find, or ' force' , two areas, one based on each projection. I 'm putting numbers on the chart that I feel could potentially be significant, and looking to see what areas 'jump out' by forming tight groupings. I then remove the lone numbers, and look to trade against the remaining groupings.
1 1 1
Although what I 've just outlined is, for the most part, a reiteration of the process that I have followed to get us to this point, perhaps the procedure I follow isn't quite as clear to the less experienced readers as I think it is . Before I move on, then, and show an example following this process, let me summarize the steps that I follow, one more time:
1 . I evaluate the potential ABCD pattern as it shapes up, and decide if it meets my criteria for a potential ABCD pattern trade. I look for proportion and placement in this step. I determine which category the pattern will fall in.
2. I check the C point retracement and make sure it meets my criteria. I prefer a .6 1 8 retracement, but I sometimes accept them as shallow as .382 or as deep as .886. My main concern i s how close the retracement is to a F ibonacci number.
3 . I add in the five price projections (.786, .886, 1 .000, 1 . 1 3 , and 1 .272).
4. I add in the 1 . 1 3 , 1 .272, and 1 .6 1 8 external retracements of the BC leg.
5. I add in any expansions I find that fit the groupings so far, but I keep these as secondary numbers in my m ind.
6. I add in internal retracements from previous price data that is outside of the ABCD pattern itself. I look for these to not only reinforce the groupings at the completion point of the ABCD, but also for them to reinforce the B point of the ABCD.
7. I look for any swings that I feel might be useful, but which haven't been uti lized in any of the calculations so far.
8 . I delete off any numbers that don't fit into obvious groupings.
This is quite a list, and perhaps a lot more than some readers s igned on for. Understand, you can elect, if it fits your trading plan, to just trade the 1 .000 ABCD patterns, and ignore all this additional material. This is a much more advanced technique, and requires a lot more legwork to determine the potential trade areas.
1 1 2

I pursue it because I not only feel it provides some great potential trading opportunities, but also because I feel the additional work, once the techniques are learned, is well worth it. If you are satisfied with just looking for potential trades only where AB=CD, there is absolutely nothing wrong with that. And for those who want more, I have included this additional information.
Let's finish thi s chapter with an example in the NDX. I particularly chose thi s example because it isn't 'textbook' . It is very much like many of the examples that I find when attempting to trade not only the ABCD pattern, but also grouping techniques in general. I think it points out a very important aspect about these techniques, and that is : don't get too caught up in the specific action such that you lose the holistic perspective.
Here 's what I mean by that. Just because we have several nice groupings doesn't mean the issue will reverse, to the penny, on any one of them. Let' s say, for example, you have three nice, tight groupings, and they are sitting very close together. Now, say the issue goes through the first grouping, and through the second grouping, and then reverses before hitting the third grouping. It then rockets off, making for a great potential trade.
If you go in and say 'Well, it didn't tum on even one single number I had laid out! ' you'l l be missing the point. I look for areas where I think something may happen. I think of these areas as ' statistical ' areas, in that each individual number, in and of itself, contributes to what I feel is a statistically significant area. Once I have that area laid out, the individual numbers aren't that important anymore. And if I have three tight groupings, for example, in a small overall area, the potential trade area is, really, the whole area made up of the groupings.
If the issue turns right between groupings, some of which are, at times, separated by mere pennies, that doesn't make the trade any less likely to be a winner, in my experience. The most important thing is, i s the pattern there, and is the pattern pointing to a somewhat specific area, where a lower time frame entry trigger can then prompt you into a trade? I 'm suggesting that you don't lose s ight of the bigger p icture, and that is that the 'two-step' pattern can be a powerful tool to point a trader to potential trade areas.
1 1 3
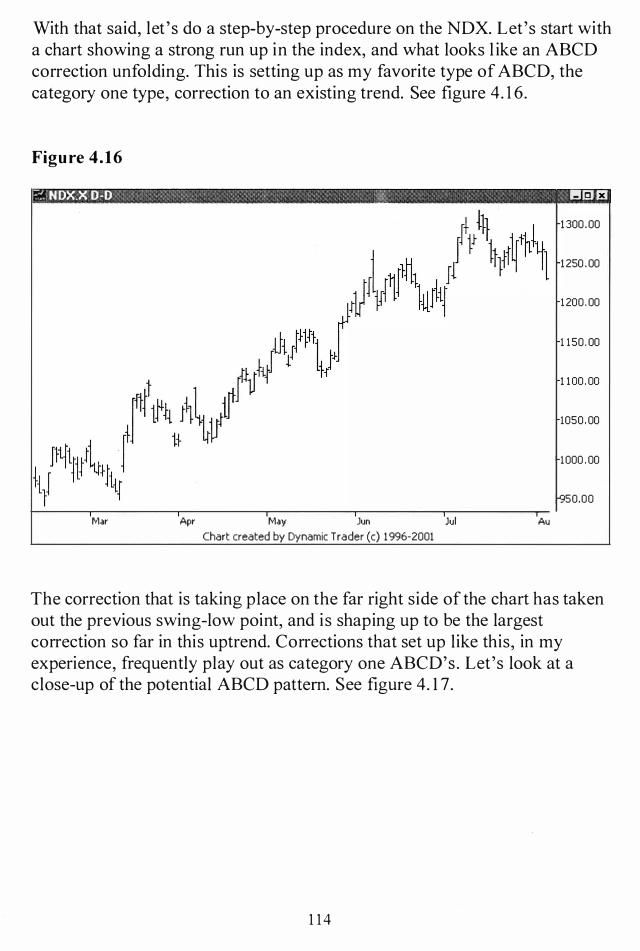
With that said, let 's do a step-by-step procedure on the NDX. Let's start with a chart showing a strong run up in the index, and what looks l ike an ABCD correction unfolding. This is setting up as my favorite type of ABCD, the category one type, correction to an existing trend. See figure 4. 1 6.
Figure 4.16
� NOKX 0-0 if 1!!9i £J
Mar Apr May Jun Jul Chart created by Dynamic Trader (c) 1996-2001
Au
1300 .00
1250 . 00
1200 . 00
1 150. 00
1 100 . 00
1050 . 00
1000 . 00
50.00
The correction that is taking place on the far right side of the chart has taken out the previous swing-low point, and is shaping up to be the largest correction so far in this uptrend. Corrections that set up like this, in my experience, frequently play out as category one ABCD's . Let's look at a close-up of the potential ABCD pattern. See figure 4. 1 7.
1 1 4
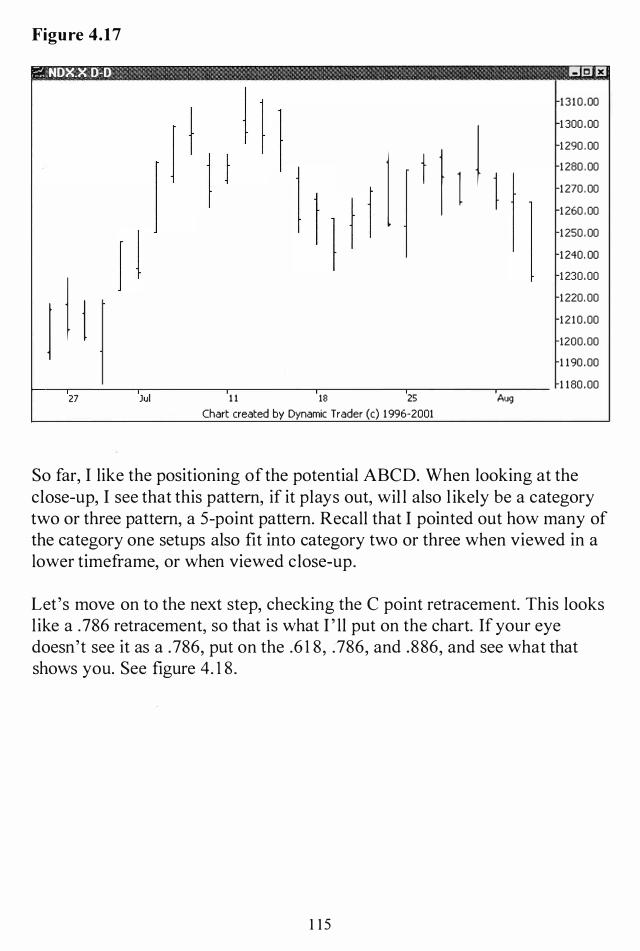
Figure 4.17
?: NDX.X D-D !l13 £I
13 10 .00
t 1 1 j 1 300 .00 1290 . 00
I 1280 . 00 1270 . 00 1260 . 00 1250 . 00 1240. 00
I j 1230.00 1220. 00 1 1210 .00 1200.00 1 190 .00 1 180 .00
27 Jul 1 1 18 25 Aug
Chart created by Dynamic Trader (c) 1996-2001
So far, I like the positioning of the potential ABCD. When looking at the close-up, I see that this pattern, if it plays out, wil l also l ikely be a category two or three pattern, a 5-point pattern. Recall that I pointed out how many of the category one setups also fit into category two or three when viewed in a lower timeframe, or when viewed close-up.
Let's move on to the next step, checking the C point retracement. This looks like a .786 retracement, so that is what I ' ll put on the chart. If your eye doesn't see it as a .786, put on the .6 1 8, .786, and .886, and see what that shows you. See figure 4. 1 8 .
1 1 5

Figure 4.18
?: N OX.X 0-0 !l8 D]
t j 27 Jul 1 1 13 25 Aug
Chart created by Dynamic Trader (c) 1 996-2001
1310 .00
1298.39 Ret 0 .786 1 300 .00 1290 . 00 1280 .00 1270 .00 1260 .00 1250 .00 1240 .00 1230 . 00 1220 .00 1210 .00 1200 .00 1 1 90 .00 1 1 80 . 00
The NDX reversed at an almost perfect . 786 retracement at the C point. See if you notice anything else interesting about the run up to the C point, which is actually the BC leg of the potential ABCD. If you don't see it, let me point it out to you. The BC leg has an ABCD pattern in it. You would have to drop down to a lower timeframe to really see the detail of it, but it' s there, and it was a pretty decent pattern in its own right.
The NDX reversed within less than a point and a half of the 1 . 1 3 ABCD completion point (in this BC leg ABCD pattern). Not bad, for a volatile index with a value of almost thirteen hundred at the time. As an aside, let me show the chart with this 1 . 1 3 price projection on it. Not only does it support the C point, it shows that, once again, the BC leg of an ABCD itself contains an ABCD that I find tradable. See figure 4 . 1 9.
1 1 6

Figure 4.19
?: NDKX D-D I!IGI F.3
I j j 1 27 Jul 1 1 18 25 Aug
Chart created by Dynamic Trader (c) 1996-2001
13 10 , 00
i��ij :g� �ol:;ohl9 1 300 , 00 1290 ,00 1280 ,00 1270 ,00 1260 ,00 1250 ,00 1240 , 00 1230 , 00 1220 ,00 12 10 ,00 1200 ,00 1 190 ,00 1 180 ,00
If you dial this one down to the 60-minute time frame, you will find that this was an excellent alternate ABCD pattern, and, depending on how strict one is with their definition, was also a 'named pattern' on that timeframe. I ' l l remove that 1 . 1 3 price projection from the BC leg, and we' l l get back to the main example.
At this point, I will add in all five of my price projections, the . 786, .886, 1 .000, 1 . 1 3 , and 1 .272, all in one shot. They will cover a pretty broad area, but don't worry. We' l l l ikely delete some of them off as we go along. See figure 4.20.
1 1 7

Figure 4.20
?. NOX.X 0-0 I!I3 EJ
13 10 .00
1298 .39 Ret 0.786 1300 .00 1290 .00 1280 .00 1270 .00 1260.00 1250 .00 1240 .00
1232.53 App 0.786
I t j 1230 .00
1224.1& App 0.886 1220 .00
1214.55 App 1 .000 1210 .00
1203.60 App 1 . 130 1200 .00 1191 .63 App 1 .272 1 1 90 .00
1 180 .00 27 Jul 1 1 13 25 Aug
Chart created by Dynamic Trader (c) 1 996-2001
Now something interesting, but mathematically predictable, has happened here. The . 786 projection has landed pretty much right on the horizontal line from the B point. Why is this? Think about it for a minute. If the C point retracement is at a .786, then the . 786 price projection will just get you back to start. This leads to some important things to consider.
The deeper the C point retracement, the more the smal ler number price projections are going to fal l short of 'taking out' the B point. They may sometimes form 'double tops' or ' double bottoms' , or not even get to the level of the B point. This does not imply that these price projection areas may not be tradable, only that they are no longer, really, ABCD patterns. For me, the D point of an ABCD pattern must exceed the B point, or it isn't a 'zigzag' . So when the C point retracement is deep, you might consider what price projections you even start with, to save yourself some time.
Let's move on, and add in the external retracements of the BC leg. I ' l l add in the 1 . 1 3 , 1 .272, and 1 .6 1 8 retracements. See figure 4.2 1 .
1 1 8
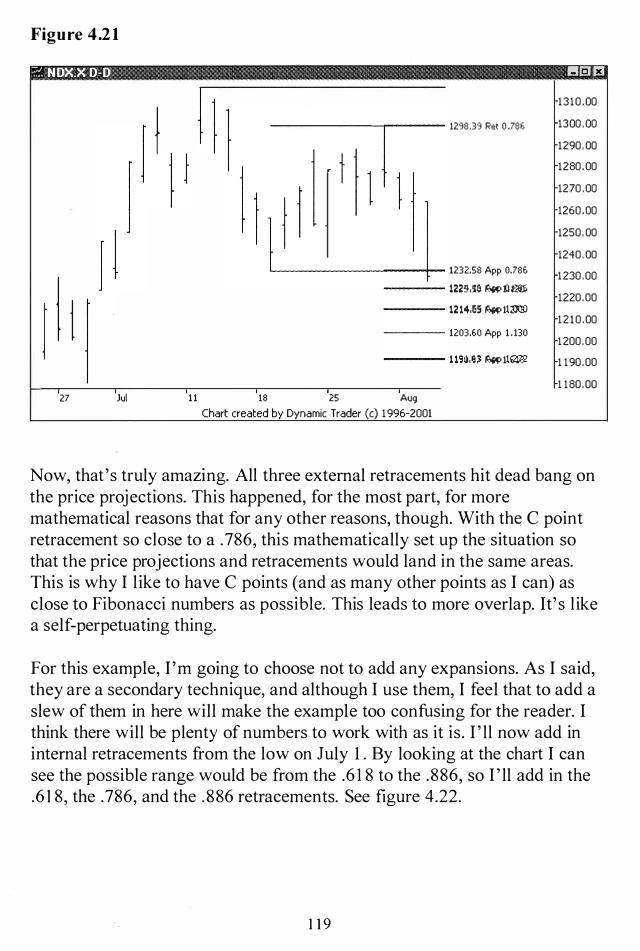
Figure 4.21
?: NDX.X D-D II!!El £J } 1 1 13 10 .00
1298 .39 Ret 0 .786 1300 . 00 1290 . 00 1280 .00 1270 . 00 1260 .00 1250 . 00 1240 . 00
1232.58 App 0.78b 1230 .00
j t j 122�,�a �flat6 1220 .00 12 14,55 � rtmJ
12 10 . 00 1203.60 App 1 . 130 1200 .00 ml),e) �1tw.2 1 190 .00
1 180 .00 27 Jul 1 1 18 25 Aug
Chart created by Dynamic Trader (c) 1996-2001
Now, that's truly amazing. All three external retracements hit dead bang on the price projections. This happened, for the most part, for more mathematical reasons that for any other reasons, though. With the C point retracement so close to a .786, this mathematically set up the situation so that the price projections and retracements would land in the same areas. This is why I like to have C points (and as many other points as I can) as close to Fibonacci numbers as possible. This leads to more overlap. It' s like a self-perpetuating thing.
For this example, I 'm going to choose not to add any expansions. As I said, they are a secondary technique, and although I use them, I feel that to add a slew of them in here will make the example too confusing for the reader. I think there will be plenty of numbers to work with as it is. I ' ll now add in internal retracements from the low on July 1 . By looking at the chart I can see the possible range would be from the .6 1 8 to the .886, so I ' ll add in the .6 1 8, the . 786, and the .886 retracements. See figure 4.22.
1 1 9

Figure 4.22
?: NOX-X 0-0 1!!8 13
13 10 .00
12913.39 Ret 0 .736 1300 .00 1290 .00 1280 .00 1270 .00 1260 .00 1250 . 00 1240 .00
1232 ,se �o:lm;
1 1 j � 1230 .00
122�,'le � tl 00 1220 . 00 1214,55 �rttl® 1209.23 Ret 0.7136 12 10 .00 1203.GO App 1 . 130 1200 .00 1195.65 Ret 0 .83� 1 19�,6� �1t� 1 190 .00
1 1 80 . 00 27 Jul 11 18 25 Aug
Chart created by Dynamic Trader (c) 1996-2001
Now, the .6 1 8 retracement was dead on the first area, which is the area of the .786 price projection, and this points out something else of importance. Notice that the B point, too, is right at that .6 1 8 retracement. I will get back to that a little later, but I want the reader to note this . The other two retracements, they didn't hit the developing groups as closely as I would have liked, but I 'm not going to worry too much about that just yet.
I want to get the rest of the numbers on the chart, and then make an assessment as to what I 'm going to eliminate. Now I need to back the chart up and find what other swings I think are significant enough to warrant doing retracements off of. I ' l l add in a lot more previous data to the chart, and I ' ll highlight the swings that I am going to work with. See figure 4.23 .
1 20

Figure 4.23
?. NOX.X 0-0 I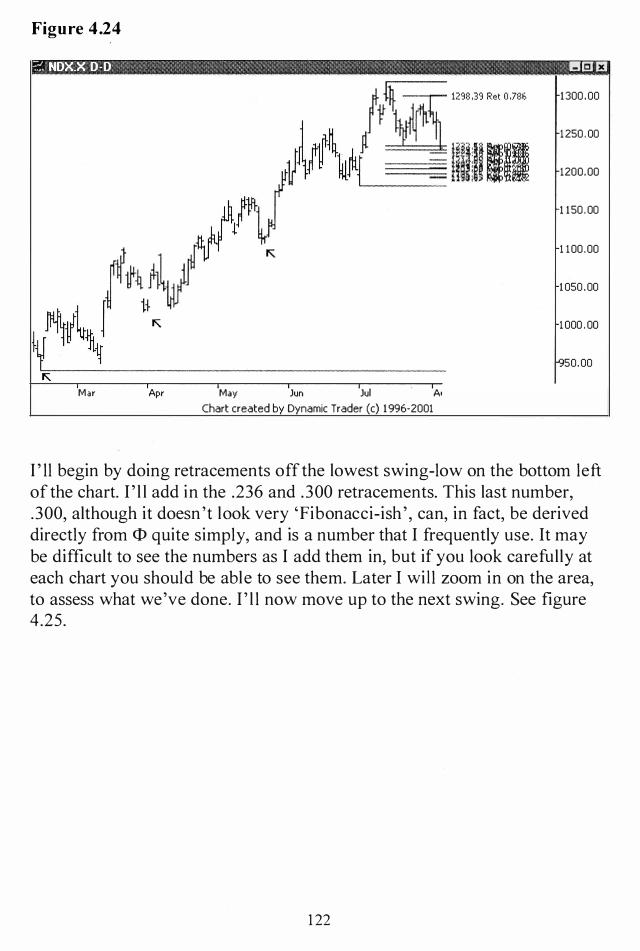
Figure 4.24
?: NDKX D-D !lEU:!
Mar Apr May Jun Jul AI
Chart created by Dynamic Trader (c) 1996-2001
1300 .00
1250 . 00
1200.00
1 150 . 00
1 100 .00
1050 .00
1000 . 00
50.00
I ' ll begin by doing retracements off the lowest swing-low on the bottom left of the chart. I ' l l add in the .236 and .300 retracements. This last number, .300, although it doesn 't look very 'Fibonacci-ish ' , can, in fact, be derived directly from <l> quite simply, and is a number that I frequently use. It may be difficult to see the numbers as I add them in, but if you look carefully at each chart you should be able to see them. Later I wi ll zoom in on the area, to assess what we've done. I ' l l now move up to the next swing. See figure 4.25.
1 22

Figure 4.25
?: NOX.X 0-0 I!!I3 a
Mar Apr May Jun Jul AI
Chart created by Dynamic Trader (c) 1996-2001
1300 .00
1250 .00
1200 .00
1 150 .00
1 100 .00
1050 . 00
1000 . 00
50.00
For this swing point I 've added in the .300 and .382 retracements. This only makes sense, since this swing point is higher, and the up move is hence smaller, the retracements must be larger. I just jumped up one notch in my choices of retracements. Both of these additional retracements show very close overlap. I ' ll now finish with the last highlighted swing. See figure 4.26.
1 23

Figure 4.26
?: NOX.X 0-0 !IS EI N\ � Q" " '0< 0 786
/l\"---__ (f\!lul �
v�if��j �
Mar Apr May Jun Jul AI
Chart created by Dynamic Trader (c) 1996-2001
1300 , 00
1250 ,00
1200 ,00
1 150 , 00
1 1 00 ,00
1050 , 00
1000 ,00
50,00
Again, following the same idea, I ' ll increase the value of my retracement choices. This time, though, I ' ll move up a l ittle bit more, since the swing is a bit larger of a step up. I ' l l add in the .447 and .486 retracements. The derivations of both of these retracements are in AFTC, for those readers who are unfamiliar with them.
The .382 would have been a good choice here also, but it turned out to be above our working area, so I deleted it off to preserve whatever clarity we sti ll have. These last retracements didn't overlap perfectly as far as I can see, but they still may be grouping nicely. We' ll see, later, when we zoom in.
Before we zoom in, though, I want to go back and look at the B point for a second. I said that I l ike to see additional confirmation at the B point. And I like the B point to be formed at a Fibonacci number, or numbers. Let 's look at a couple of retracements for the B point, to see if it is meeting my criteria there. I 've temporarily deleted all the other lines off of the chart, to just point out the B point retracements. I 've highlighted the B point with an arrow. See figure 4.27.
124

Figure 4.27
?: NOX-X 0-0 I!Im a
1300 .00
1280.00
1260 .00
1240.00
1220 .00
1200.00
1 1 80 .00
1 160 .00
1 140 .00
1 120 .00
23 30 Jun 13 20 27 Jul 1 1 113 25 Aug Chart created by Dynamic Trader (c) 1 996-2001
The B point was quite 'harmonic ' , and it did meet my criteria. I just want the reader to know that this step should always be considered, in my opinion, when weighing up the trade potential .
I ' l l now zoom in on the potential trade area. I must warn you, though, if you aren't really well versed in groupings techniques, a zoom in this close, at first, can look quite jumbled. See figure 4.28.
125
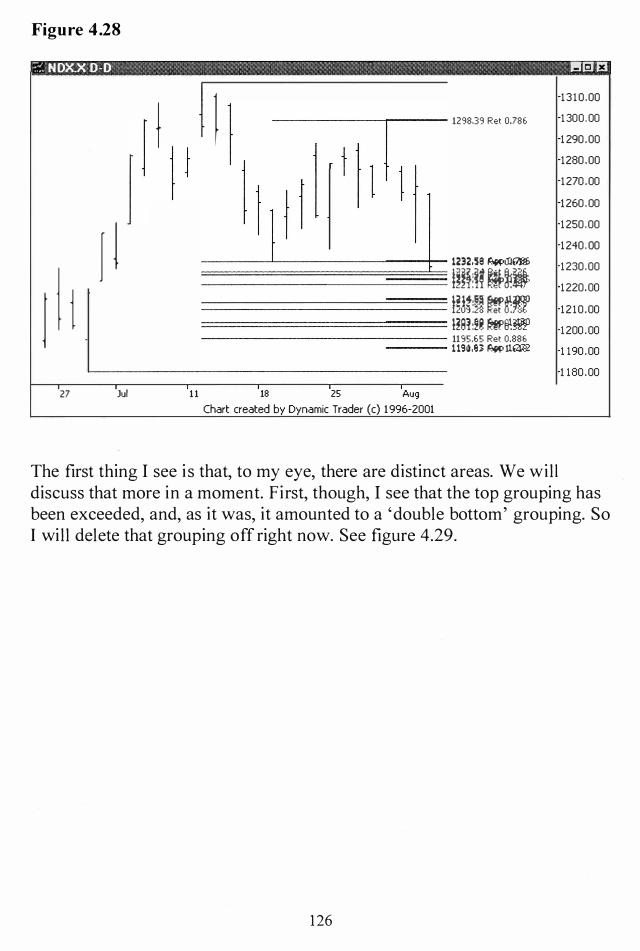
Figure 4.28
?. NOx..X 0-0 ' 1!8 Ei
I t j 27
t j 1 j ! 1 ] 1 1
Jul 1 1 18 25 Aug
�
Chart created by Dynamic Trader (c) 1996-2001
13 10 ,00
1298,39 Ret 0,786 1 300,00 1 290 ,00 1280 ,00 1270 ,00 1260 , 00 1250 ,00 1240 , 00
1232.'19 �trJ�
m�!u��� 1230 ,00 1220,00
t�5�:�� ��� 1210 ,00 H8H� ��� 1200 ,00 11 '35,65 Ret O,88E. 1 191),e� � U� 1 190 ,00
1 180 ,00
The first thing I see i s that, to my eye, there are distinct areas. We wil l discuss that more in a moment. First, though, I see that the top grouping has been exceeded, and, as it was, it amounted to a 'double bottom' grouping. So I will delete that grouping off right now. See figure 4.29.
126

Figure 4.29
?. N[)x..X [)-[) !IS F3
I t j 27
f t 1 J ! I I f j
Jul 1 1 18 25 Aug
I Chart created by Dynamic Trader (c) 1 996-2001
1310 ,00
1293,39 Ret O ,7SG 1 300 ,00 1290,00 1280,00 1270,00 1260 ,00 1250,00 1240,00
l�n!U��� 1230 ,00 1220 ,00
t��§:�� ��V 1210 ,00 H8H@ �ffi� 1200 ,00 1 1S� ,e� !C;w l1ot'1 1 1 90 ,00
1 180 ,00
What I see are four somewhat distinct groupings, each one formed around the four remaining price projections for the alternate ABeD's . I would now wait to see what the price action does. I ' ll move ahead one more price bar, and make an assessment. See figure 4.30.
1 27

Figure 4.30
?: NDX.X D-D 1!18 F!!
t J \ j 27
f 1 1 j j l 1 I j
Jul 1 1 18 25 Aug
Chart created by Dynamic Trader (c) 1996-2001
1310 .00
1298.39 R€:t O .78G 1300 .00 1290 .00 1280 .00 1270 .00 1260 . 00 1250 . 00 1240. 00
l�n!Ug,�� 1230 .00 1220 .00
l� if :�� ��� u .2� .et ., 3 1210 .00 H8i:�� tMSl:� 1200 .00 1 1SU� � U� 1 190 .00
1 1 80 .00
The price action has driven right through the .886 price projection grouping. I will now delete that grouping off of the chart. See figure 4.3 1 .
128

Figure 4.31
?: N OX,.X [)-O !IS F..3
t ) t j 27
f tJ J ! l ) f j
Jul 1 1 18 25 Aug
Chart created by Dynamic Trader (c) 1 996-2001
1310 .00
1293.39 Ret 0.786 1300 .00 1290 . 00 1280. 00 1270 .00 1260 .00 1250 .00 1240.00 1230. 00 1220.00
lal§!�� ��� �u .2101 et ., " 1210 .00 H8H@ rMffi� 1200 .00 1 190,e� � U� 1 1 90 .00
1 180 .00
Now, again, I can just wait and see as the price action continues to develop. I ' ll add two more price bars, and reassess. See figure 4.32.
1 29
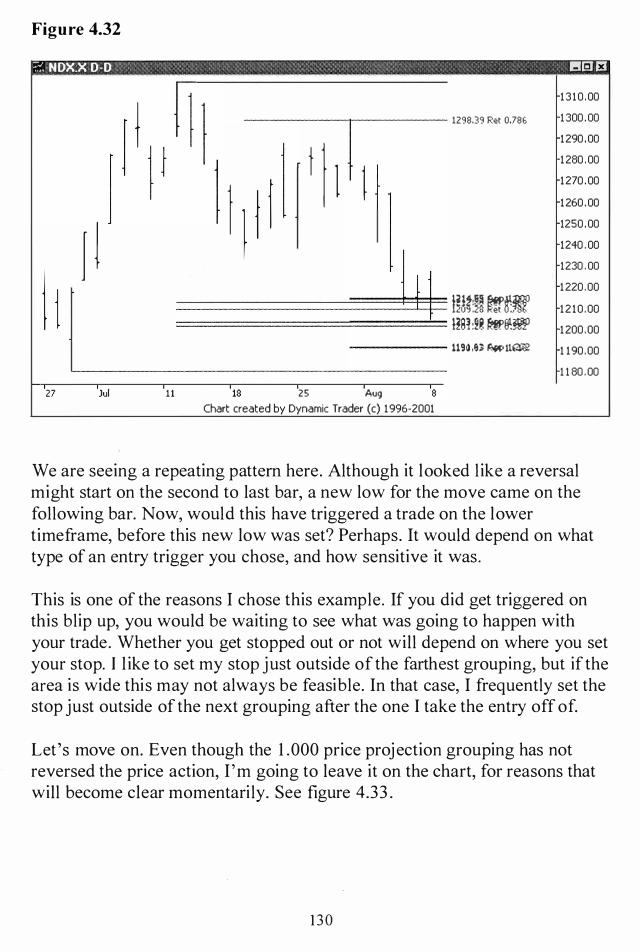
Figure 4.32
?. NOX-X 0-0 1!!18 J!I
t 1 1 13 10 ,00
j [ l I l 1298,39 Ret 0,781', 1 300 ,00
1290 ,00 1280 , 00
J � r ) f l 1270 ,00 1260 ,00 1250 ,00 1240 , 00
1 j 1230 , 00 1220 ,00
i��f:�� ��mo 12 10 ,00 HBi :2� �ffi� 1200 ,00 119U� �11� 1 190 ,00
1 1 80 , 00 27 Jul 11 18 25 Aug 8
Chart created by Dynamic Trader (c) 1996-2001
We are seeing a repeating pattern here. Although it looked l ike a reversal might start on the second to last bar, a new low for the move came on the following bar. Now, would this have triggered a trade on the lower timeframe, before this new low was set? Perhaps. It would depend on what type of an entry trigger you chose, and how sensitive it was.
This is one of the reasons I chose this example. If you did get triggered on this blip up, you would be waiting to see what was going to happen with your trade. Whether you get stopped out or not will depend on where you set your stop. I l ike to set my stop just outside of the farthest grouping, but if the area is wide this may not always be feasible. In that case, I frequently set the stop just outside of the next grouping after the one I take the entry off of.
Let's move on. Even though the 1 .000 price proj ection grouping has not reversed the price action, I 'm going to leave it on the chart, for reasons that will become clear momentarily. See figure 4.33 .
1 30
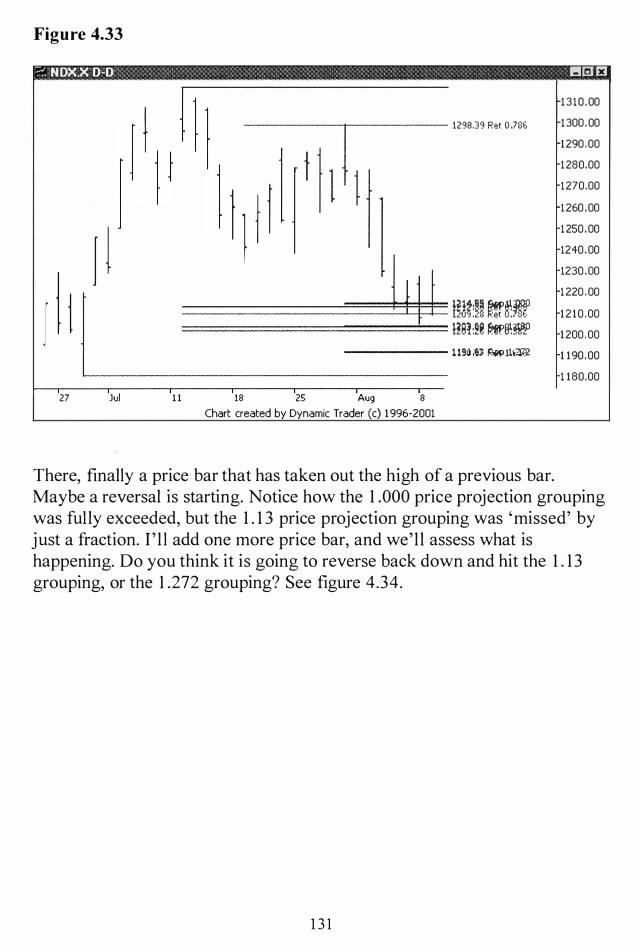
Figure 4.33
?: NOX.X 0-0 !II:;:( F!J
I 1 1 13 10 .00
1298.39 Ret 0 .786 1300 .00 1290 .00 1280.00
J I l f l l 1270.00 1260 .00 1250 .00 1240 .00
I t j 1230 .00 1220 . 00
mf:�� ��Mr 12 10 .00 H8H@ �8':� 1200 .00 1 190 ,e� Row llazJ2 1 190 .00
1 180.00 27 Jul 1 1 18 25 Aug 8
Chart created by Dynamic Trader (c) 1996-2001
There, finally a price bar that has taken out the high of a previous bar. Maybe a reversal is starting. Notice how the 1 .000 price projection grouping was ful ly exceeded, but the 1 . 1 3 price projection grouping was 'missed' by just a fraction. I ' l l add one more price bar, and we' l l assess what is happening. Do you think it is going to reverse back down and hit the 1 . 1 3 grouping, or the 1 .272 grouping? See figure 4.34.
1 3 1

Figure 4.34
?. N OX-X 0-0 1!!18 £I j 1 1 13 10 , 00
1293,39 Ret 0 ,786 1300 ,00 1290 ,00 1280 ,00
) 1 l l f l 1270 ,00 1260 , 00 1250 , 00 1240 , 00
I j 1230 ,00 1220 , 00
t� i�!�� �r:� U .2::: et .J ::- 12 10 ,00 HBH� ��� 1200 , 00 1190 ,e;; � U� 1 190 ,00
1 180 ,00 27 Jul 1 1 18 25 Aug 8
Chart created by Dynamic Trader (c) 1 996-2001
Nope, another up bar. Pretty much regardless of what lower timeframe entry I would have chosen, I would have been in the trade for a while now. Even if an entry was taken off of the 1 .000 grouping, a stop below even the next lower grouping was not threatened. Let ' s see how this played out. See figure 4.35 .
1 32

Figure 4.35
?: NDX.X D-D SGU!J
27 Jul 1 1 18 25 Aug 8 15 22 29 Se�
Chart created by Dynamic Trader (c) 1996-2001
1380 .00
1360 . 00
1340 . 00
1320 .00
12gg.3g Ret 0 .786 1 300 .00
1280 .00
1260 .00
1240 . 00
1220 . 00
1200 . 00
1 180 . 00
A strong reversal was made off of the ABCD pattern, and a very large move ensued. Now comes the evaluation part of the example. The NDX didn't reverse off of any of the groups. In fact, i t didn't even reverse off of a single number. So, I can hear a few people saying ' What good is that? '
Well, it reversed just fractions away from the 1 . 1 3 price projection grouping, or just a small amount below the 1 .000 price proj ection grouping. This is something I see quite frequently, a reversal coming in the area just between these tight groupings. In the context of the price value of the index and the ensuing move, though, I consider this nothing short of phenomenal .
This is the point I alluded to earlier. Don't try to pinpoint a move l ike this to the nearest penny; it can't be done. Don't lose sight of the larger, holistic picture, and that is that the ABCD is the pattern we are looking at. Is it still a nice 'two-step'? Do you have a pretty good idea where the pattern might complete? These are the things that we are trying to determine, and not the exact price point, to the penny, that the issue may tum on.
1 33
I follow this procedure because I think that the area I come up with has the potential to be an area that something might happen. Once the area is determined, the emphasis shifts to the lower, trigger timeframe, and on to the behavior of the issue with respect to the chosen entry trigger. The price, with respect to the exact placement within the grouping, then becomes secondary.
As long as this is understood and kept in mind, I feel that the techniques presented have a lot of potential. I understand, too, that this has been a lot of material to absorb. I encourage the reader to experiment with what has been offered and see what, if any, of it will be of value to you.
In the last chapter I wi ll take a very brief look at time symmetry in ABeD patterns. I will present l ittle more than a primer on the topic, but I want to stimulate the reader by presenting this food for thought.
1 34

Chapter 5
ABeD Time Symmetry
The question frequently comes up, i f you can apply F ibonacci retracements and projections to price, can you also apply them to time? This i s a very interesting area, and one that i s overlooked by most traders. It is outside the scope of this book to do a detailed examination of this topic, but I want to do an introductory excursion into some of the things that one can look at with respect to ABeD patterns.
It is my belief that the concept of using F ibonacci retracement, projection and grouping techniques is just as valid with time as it is with price. In other words, I feel that time is just as 'harmonic ' as price. In the case of an ABeD pattern, the length of time it takes for each leg to form can, frequently, be related in some way to the lengths of time the other legs take to form. There can also be a relationship between the length of time it takes the AB leg to form and the time lengths of previous swings outside of the potential ABeD pattern. It would fol low, too, that the length of time that it takes the entire ABeD pattern to complete could also be related to the time lengths of
. . prevIOUS swmgs.
This should all sound familiar, since these are the same premises we have used so far with price, to accomplish what we have up to this point. In this chapter I will just examine some basic relationships, in order to provide the reader with some serious food for thought. The most important aspect of this topic, in my opinion, i s the synergy that I feel occurs when price action is pointing to a certain area, and when the price reaches that area, the time factor is saying 'now' . If this area is also the area of the completion of a pattern, you have a potential threefold synergy. This adds to the level of confidence I have in trading that area, and it is the basis for a large part of my trading.
1 3 5
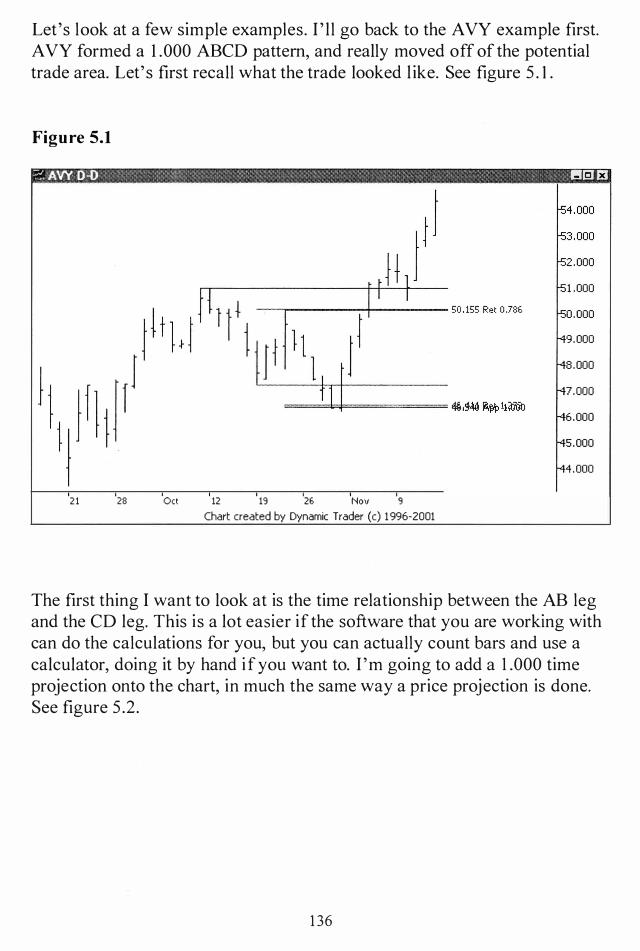
Let's look at a few simple examples. I ' l l go back to the AVY example first. A VY formed a 1 .000 ABCD pattern, and really moved off of the potential trade area. Let' s first recall what the trade looked l ike. See figure 5 . 1 .
Figure 5.1
?: AVY I)-I) �, I!!I3 F3
21 28 Oct 12 1'3 26 Nov '3
Chart created by Dynamic Trader (c) 1996-2001
The first thing I want to look at is the time relationship between the AB leg and the CD leg. This is a lot easier if the software that you are working with can do the calculations for you, but you can actually count bars and use a calculator, doing it by hand if you want to. I 'm going to add a 1 .000 time projection onto the chart, in much the same way a price projection is done. See figure 5 .2 .
1 36

Figure 5.2
_�\.'JI�. nil' ._ll:llx [5 1 .000
50. 155 Ret O.7SG rso.ooo
I I t 1 j M9 .000
1 ) 1 I M8 .000
I f 1 1 f 1 [47 .000
ilM� R� 11$'00
M6 . 000 I I I I
1 10ct01 190ctO 1 240ctO 1 1.000 ATP 1Nov [45 .000
[44.000
2 1 28 Oct 12 19 26 No
Chart created by Dynamic Trader (c) 1996-2001
What is quite clear here is that the length of the AB and CD legs are equal . Not only was the price move for these legs pretty much equal, so was the time it took for those legs to unfold. It' s simply not possible for me to believe that this is random, given the almost endless number of examples that I 've seen over my trading career.
Before we move on, I want to point out something that was mentioned in the price construction phase that also applies here. When doing this 'real-time ' , I would be putting the time projections and retracements on the chart ahead of time, that is, before the price action reaches the area. Just l ike forming price groupings, I would set up time groupings.
I don't focus on one time projection or retracement, just as I don't focus on one price projection or retracement. What I am showing in this chapter is 'after-poker' . I am just trying to show, briefly, not only the techniques themselves, but also some examples of the time symmetry and time harmony.
1 37

I am not, however, showing any examples 'as they unfold' , trying, as I did in previous chapters, to simulate how a potential trade may look as it unfolds in 'real-time ' . I point this out so that there is no confusion on how I apply the techniques, or what it is that I am trying to demonstrate here. I have a work in progress, as a fol low up to AFTC, on time groupings. The reader is directed to seek that material out if a fully detailed work on the topic is desired. Let's continue on.
What about an AB leg time retracement? Can we do a time retracement of the AB leg, to give us time targets for the BC leg to complete? The answer is absolutely. Let's see how the AB leg time retracement worked out on the A VY example. See figure 5 .3 .
Figure 5.3
?: AW 0-0 l!61 EJ
21 28
TCR 110ctOl I
240ct 190ctOl 0 .500
I I
--;======= 50. 155 Ret 0 .786
� u � � �
Chart created by Dynamic Trader (c) 1 996-2001
f52.000
-51 .000
-50 .000
-49.000
�8.000
�7.000
[46 .000
�5.000
[44.000
The BC leg was a .500 time retracement of the AB leg. Now that leads to something interesting to think about. The BC leg was a .786 price retracement, but it was a .500 time retracement. There isn't always a similar retracement value between price and time, but I don't feel they have to be the same. Although I always pay c lose attention when I see a .6 1 8 price and
1 38

time retracement, it may just be that I really l ike .6 1 8 ' s. As long as the time calculations are 'harmonic ' , that' s what I 'm looking for.
Now, readers that are fami liar with AFTC may be saying 'I thought you didn't use the .500 retracement, I thought you used the .486?' I do use the .486 instead, for price retracements, as well as for time retracements. In practicality, the difference is so minor, though, that it would, l ikely, be hard to see any difference. I ' ll put a .486 time retracement on the same chart instead of a .500, and let 's assess what we see. See figure 5 .4.
Figure 5.4
::'-=. AVY D-D i!!IEI £I
TCR 240ct [52 ,000 1 10(tOl 190ctO 1 0,4$i; I I I
I t t 1 } t I t I I j I [5 1 , 000
50,155 Ret 0 ,736 [50 , 000 _
J j 1 1 ! f49,000 j 1 I
f4a, ooo
) j f f ! 1 f 1 f47 , 000 �,� �� 11iWb f46 ,000
f4s, ooo j f44,OOO
21 28 Oct 12 19 26 No
Chart created by Dynamic Trader (c) 1996-2001
There is no discernible difference in this example between the .500 and the .486 time retracement. Let' s wrap this example up with the last time calculation that I normally do within a potential ABCD pattern, and that's the BC leg ' external retracement' . If the BC leg time retraced back .500 and the CD leg time projection was 1 .000, it stands to reason that the ' external ' time retracement of the BC leg should be a 2.000. Let me add this retracement onto the chart. See figure 5 .5 .
1 39

Figure 5.5
?. AVY D-D I!!IEI £J
�1 , 000
50, 155 Ret 0 ,786 -50,000
J j 1 1 ) -49, 000
f ) 1 I -48, 000 ) f 1 j
f 1 -47,000 �,�.\4 �f.Pl1amo
L __ L ___ ._I -46,000 j 190'tO 1 240(tO 1 2 ,000
TCR 1No\l -45,000
-44,000
21 28 Oct 12 19 26 Nc
Chart created by Dynamic Trader (c) 1996-2001
It is quite clear from the chart that the CD leg was twice as long, time-wise, as the BC leg. I ' l l apply the same reasoning that I applied to the .500 versus .486 time retracements from the last chart, this time with the 2 .000 versus the 2.058 that I prefer (see AFTC for derivations). See figure 5 .6.
140

Figure 5.6
?. AVY 0-0 !lElD
j ) f 1 t 1 21 28
) -51 .000
50. 155 Ret 0.786 -50.000
j I 1 1 1 -49.000
1 I -48.000
f 1 r+7 .000
� ,� �* 11amb f46 .000 I I I
190(tO 1 240(tO 1 2 .058 TCJ;: 1Nov f4S .000
M4 . 000
� u � � �
Chart created by Dynamic Trader (c) 1 996-2001
Again, there i s no discernible difference between the 2 .000 and 2 .05 8 time retracements in this example. The most important thing is to grasp the concept of what I 'm looking at here. Let's look at one more thing before we move on to another example.
Let me put two of the time calculations we've just looked at on the chart at the same time. They fal l in the completion area of the potential ABCD. Keep in mind that these calculations can be done before the price reaches that area. They can be done once the C point is complete. See figure 5 .7 .
1 4 1
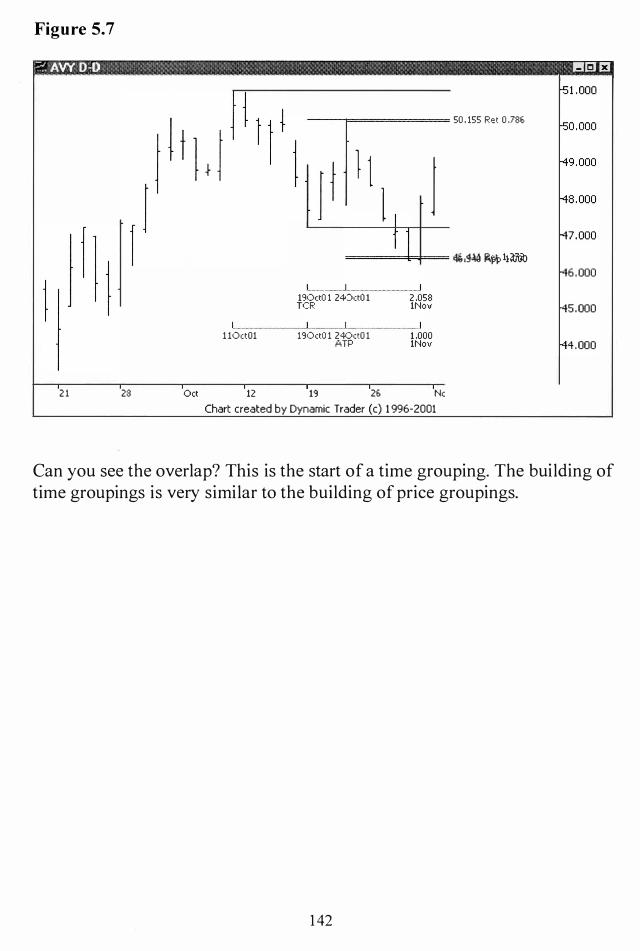
Figure 5.7
?. AW D-I) 1!!113 £I
21 23
1 10(t01
I I
1 1
190(tO 1 240ctO 1 TCR I I
190ctO 1 240(\0 1 ATP
1 I f 1 J
I 2 .058 1No\!
1 .000 1No\!
� U " � �
Chart created by Dynamic Trader (c) 1 996-2001
[51 .000
50 . 155 Ret 0 .78G fso.ooo -49.000
-48.000
-47.000 461�.w I'l.fo\l 11iW'b
-46.000
-45 . 000
f"44 .000
Can you see the overlap? This is the start of a time grouping. The building of time groupings is very similar to the building of price groupings.
1 42

Let's look back at the CIEN example, which, as you' l l recall , was very close to a 1 . 1 3 alternate ABCD. We' l l start with a refresher chart. See figure 5 .8 .
Figure 5.8
?: elEN 0-0 !IS £'J
1 10 .000
100.000
==��*¥tt===����== �U2��fW6 70 .000
---........... ------ .4,� ��
26 Jun '3 16 23 30 Jul 14 21 28 Aug 11 18 25 !:
Chart created by Dynamic Tr ader (c) 1 996-200 1
This was the example where CIEN came back down into the potential trade area and set a nominal new low. Let 's see how the time length of the CD leg compares to the time length of the AB leg. See figure 5 .9.
1 43
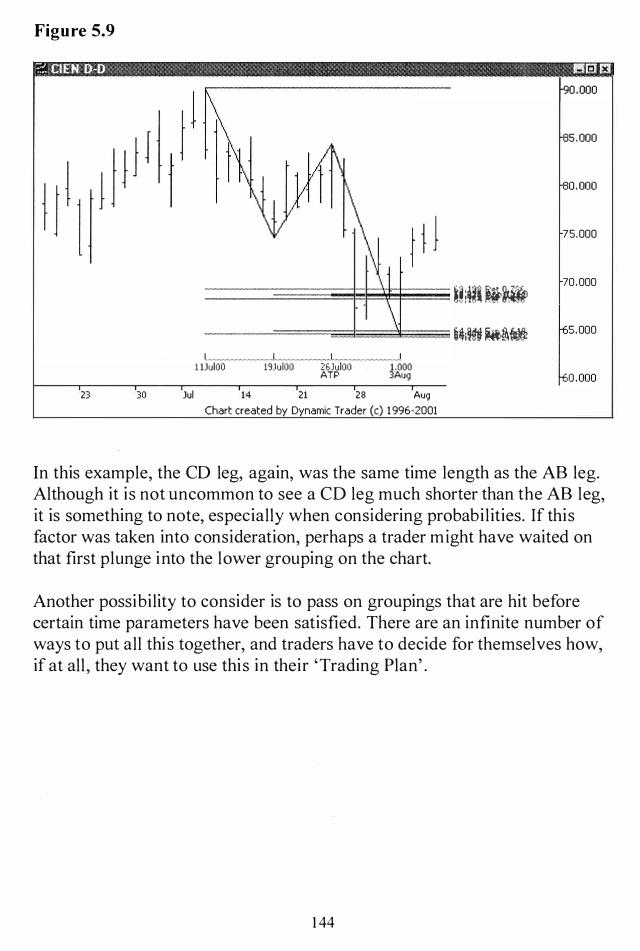
Figure 5.9
p l 75.000
U;�Uif� 70.000
��i� ��� 5 .000
I I I 1 1JuIOO 19JuiOO 25JuiOO 1 .000
ATP 3Aug
23 30 Jul 14 21 28 Aug
Chart created by Dynamic Trader (c) 1 996-2001
In this example, the CD leg, again, was the same time length as the AB leg. Although it is not uncommon to see a CD leg much shorter than the AB leg, it is something to note, especially when considering probabilities. If this factor was taken into consideration, perhaps a trader might have waited on that first plunge into the lower grouping on the chart.
Another possibility to consider is to pass on groupings that are hit before certain time parameters have been satisfied. There are an infinite number of ways to put all this together, and traders have to decide for themselves how, if at all , they want to use this in their 'Trading Plan' .
1 44
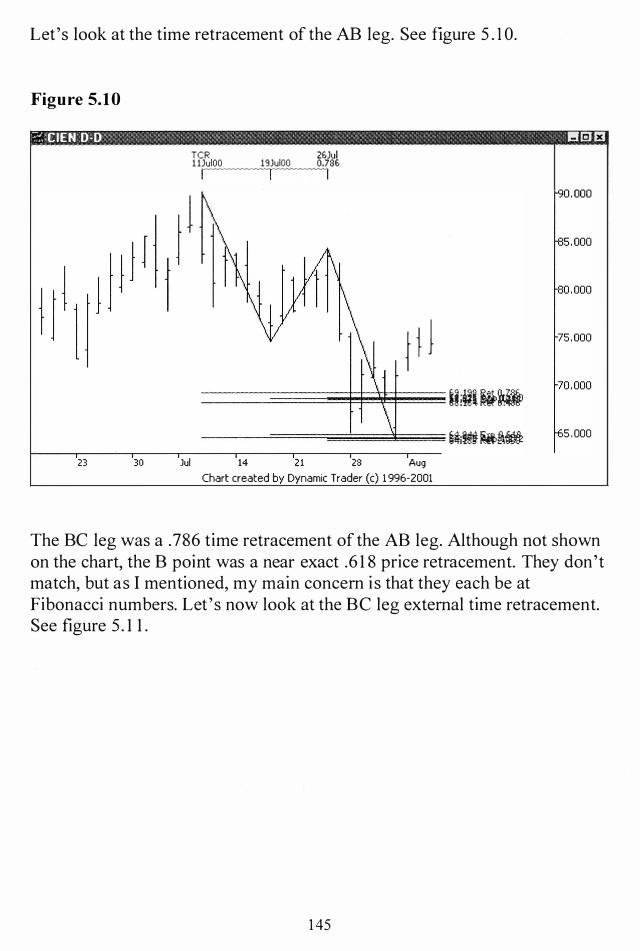
Let's look at the time retracement of the AB leg. See figure 5 . 1 0.
Figure 5.1 0
:::-:: elEN D·D I!IEl £I
23 30
TCR 1 1JuIOO
I 19JuIOO
I
2bJui 0.73b
I
p I Jul 14 21 23 Aug
Chart created by Dynamic Trader (c) 1 996-2001
75.000
70 . 000
5 . 000
The BC leg was a .786 time retracement of the AB leg. Although not shown on the chart, the B point was a near exact .6 1 8 price retracement. They don't match, but as I mentioned, my main concern is that they each be at Fibonacci numbers. Let ' s now look at the BC leg external time retracement. See figure 5 . 1 1 .
1 45

Figure 5.1 1
p ) 75 , 000
I�i�i�� 70 ,000
�u� ��mt 5 ,000
I I I 19JuiOO 26JuiOO 1 .272 TCR 3Aug
0 ,000
23 30 Jul 14 21 28 Aug
Chart created by Dynamic Trader (c) 1 996-2001
The completion point is right at a 1 .272 time retracement. Although not every leg of every ABCD I see i s as 'time harmonic' as the examples presented here, I do see a lot of time symmetries in the ABCD's that I look at. I use the price and time 'harmony' to make decisions on how much I like a particular pattern for a potential trade. If the symmetries just aren't there, I simply pass and keep looking.
Let me make one additional point here. Some authors do not like to use the .786 and 1 .272 for time retracements. Myself, I have found them to be useful for my own trading, and hence I use them. I haven't seen the research data that has led anyone else to conclude that those particular time factors aren't useful, so I can't comment on how their conclusions were drawn. What I suggest is, as the reader experiments to determine what he or she wants to use in his or her 'Trading Plan ' , pay particular attention and be particularly critical with these two time factors. I use them, but the fact that some reject them should be noted.
1 46

Let me finish up with a look at the AA example from Chapter 1 . The ABCD pattern that we looked at was very non-symmetrical, time-wise. Let' s look at a chart to refresh our memories. See figure 5 . 1 2.
Figure 5.12
:::.: M D-D I!S £'I
--1----------- 14.53 1 App 1 .000 D
19 26 Jul 10 17 24 3 1 Aug 14 21 28 Sep 1 1 18 25 0ct 'l 1
Chart created by Dynamic Trader (c) 1 996-2001
20 .000
19 .000
18 .000
1 7 .000
16 .000
15 .000
14 .000
Let me put a F ibonacci time projection on the chart. Thi s will show a F ibonacci time ratio of the CD leg to the AB leg. The ratio will have to be quite small , s ince the CD leg is a lot shorter in time duration than the AB leg. See figure 5 . 1 3 .
1 47

Figure 5. 13
?. M 0-0 1!!J8 £J
A
18 .000
c
17 .000
16 .000
15 . 000
---4---- 14.53 1 App 1 .000
D 14 . 000
10 17 24 31 Aug 14 21 28
Chart created by Dynamic Trader (c) 1996-2001
The CD leg was a .236 time ratio of the AB leg. Even with such a large difference in the time duration of the two legs, there was still a time harmony.
I hope these examples have stirred an interest in the reader. I feel that this is an underexplored and underutilized area, and one that is worthy of study. It' s my opinion that the addition of time studies has greatly helped me in my own trading. I strongly suggest that all traders further investigate this very interesting topic.
148

Conclusion
I feel that the ABCD pattern is a great potential additional to any trader' s arsenal. Of course, I encourage all traders to experiment, modifY, and test the pattern and its variations, and see what aspects, if any, might be of use in their individual plans. Not every trading concept is suited to everyone. Personally, I really l ike this pattern. When it forms as a correction to a significant trend, I really pay attention.
A large percentage of my trades are category one ABCD patterns that are also category two or three patterns in the lower timeframe. I have found few setups for finding potential trade areas that I l ike better than these category one and three combination patterns, especially if they have strong time symmetries. Combined with one of my preferred entry triggers on a lower timeframe, this is, perhaps, my favorite way to trade.
1 49