(ebook - firearms) ballistics matching using 3d images of bullets and cartridge cases - final...
TRANSCRIPT

The author(s) shown below used Federal funds provided by the U.S.Department of Justice and prepared the following final report:
Document Title: Ballistics Matching Using 3D Images of Bulletsand Cartridge Cases: Final Report
Author(s): Benjamin Bachrach
Document No.: 182567
Date Received: May 23, 2000
Award Number: 97-LB-VX-0008
This report has not been published by the U.S. Department of Justice.To provide better customer service, NCJRS has made this Federally-funded grant final report available electronically in addition totraditional paper copies.
Opinions or points of view expressed are thoseof the author(s) and do not necessarily reflect
the official position or policies of the U.S.Department of Justice.
Intelligmt Automation, Inc. Grant Number: 97-LB-VX-0008
Ballistics Matching Using 3D Images of Bullets and Cartridge Cases
Grant Number: 97-LB-VX-0008
Final Report
Period Covered: Sept 3,1997 - December 3 I , 1999
This project was supported under award number 97-LB-VX-0008 from the National Institute of
Justice Office of Justice Programs, U.S. Department of Justice. Points of view in this document
are those of the author(s) and do not necessarily represent the oficial position of the U.S.
Depart men t of Just ice.
Copyright - Intelligent Automation, Inc.
This document is a research report submitted to the U.S. Department of Justice. This reporthas not been published by the Department. Opinions or points of view expressed are thoseof the author(s) and do not necessarily reflect the official position or policies of theU.S. Department of Justice.

Intelligent Automation, Inc. Grant Number: 97-LB-VX-0008
1.1 Introduction
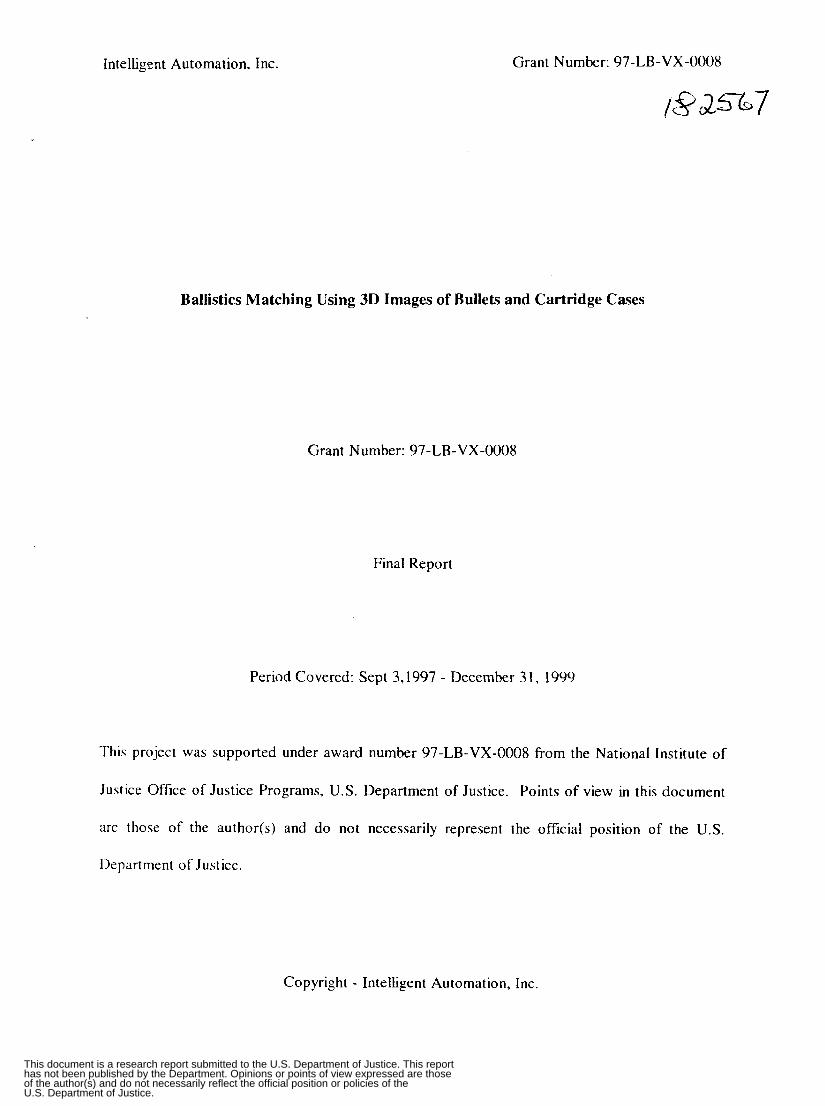
Microscopic impressions (striations) found on the surface of fired bullets are routinely used as a
means to associate a questioned bullet with a suspect weapon. Such association is possible
because the striations found on the surface of fired bullets are imprinted on them by the
microscopic imperfections found in the gun’s barrel. Exhibit 1 shows the main components
involved in the transference of barrel imperfections into the bullet’s surface; namely the barrel and
the fired bullet. The interior of the barrel (seen on the right side of Exhibit 1) is machined to have
lands and grooves whose purpose is to force the bullet to rotate as it travels through it. These
lands and grooves in turn imprint land impressions and groove impressions on the surface of the
bullet (seen on the left side of Exhibit 1) . Because all bullets fired by a given gun must travel
through the same barrel (discounting guns with interchangeable barrels), the striations found on
bullets fired by the same gun will display significant similarities. We emphasize the expression
“significant similarities,” because even in the best of conditions, the striations found on two bullets
fired by the same gun will not be the same. Usually, the most one can hope for are regions of
similarity.
This very simple principle is the basis of the discipline practiced by firearms examiners. At the
core of firearms examiners’ discipline is their ability to compare the striations found on the surface
of different bullets. and to determine whether these striations indicate that different bullets were
fired by the same gun. I t might be worth noting that making such determination requires
significant experience and is by no means an easy task.
This document is a research report submitted to the U.S. Department of Justice. This reporthas not been published by the Department. Opinions or points of view expressed are thoseof the author(s) and do not necessarily reflect the official position or policies of theU.S. Department of Justice.
Intelligent Automation, Inc. Grant Number: 97-LB-VX-0008
Land Impression Groove Impression Gi vb :e
L A 61
Bullet Impressions Barrel Rifling
Exhibit 1: Generation of Striations on Bullets
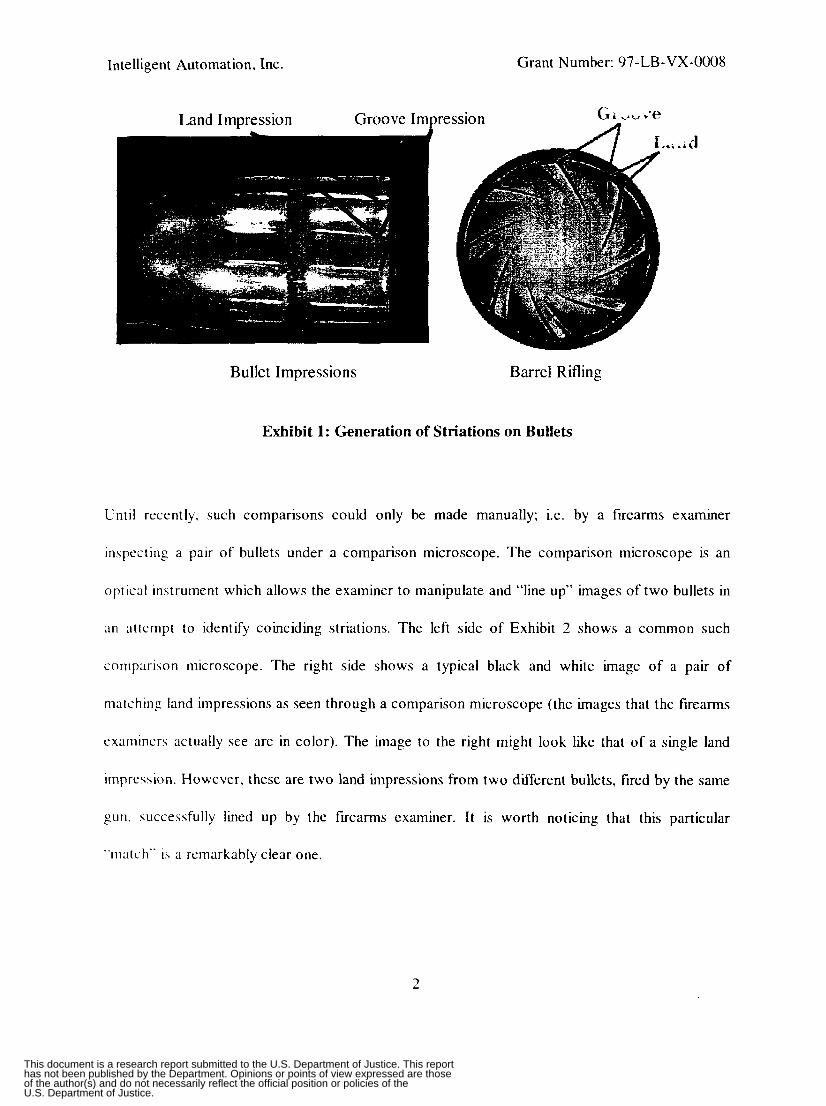
Until recently, such comparisons could only be made manually; i.e. by a firearms examiner
inspecting a pair of bullets under a comparison microscope. The comparison microscope is an
oplicltl instrument which allows the examiner to manipulate and “line up” images of two bullets in
an attcrnpt to identify coinciding striations. The left side of Exhibit 2 shows a common such
cornparison microscope. The right side shows a typical black and white image of a pair of
matching land impressions as seen through a comparison microscope (the images that the firearms
cxamincrs actually see are in color). The image to the right might look like that of a single land
irnprcssion. However, these are two land impressions from two different bullets, fired by the same
gun. .successfully lined up by the firearms examiner. It is worth noticing that this particular
“ma[c.h“ i.s ;I remarkably clear one.
2
This document is a research report submitted to the U.S. Department of Justice. This reporthas not been published by the Department. Opinions or points of view expressed are thoseof the author(s) and do not necessarily reflect the official position or policies of theU.S. Department of Justice.

Intelligent Automation, Inc. Grant Number: 97-LB-VX-0008
captured data corresponds to the different light intensities at different points on the
sample’s surface. This process is performed by specialized hardware (sensors).
b) Encode the data in a format that can be stored and manipulated by a computer. We will
refer to this data as “digitized data.” This process is also performed by specialized
hardware.
c) Process the digitized data in preparation for analysis and comparison. This process usually
requires a number of intermediate steps. We will refer to the final processed data set as
“normalized data,” and by extension we refer to the overall process as “data
normalization.” At the core of the data normalization process are the normalization
algorithms.
The correlation component is responsible for comparing sets of normalized data, and organizing
the results for inspection by the user. The name “correlation component” originates from the fact
that correlation algorithms are very often used to compare normalized data sets. In general, the
correlation component includes all the software elements necessary to:
a ) Evaluate the degree of similarity between two sets of normalized data. At the core of this
process are the correlation algorithms.
b) If more than two bullets are involved in the comparison, to organize the results of a set of
comparisons in some convenient way (for example, to rank by degree of similarity).
c ) To provide the user with tools to venfy the results obtained by the correlation algorithms.
At the core of this task is a Graphic User Interface (GUI).
4
This document is a research report submitted to the U.S. Department of Justice. This reporthas not been published by the Department. Opinions or points of view expressed are thoseof the author(s) and do not necessarily reflect the official position or policies of theU.S. Department of Justice.
Intelligent Automation, Inc. Grant Number: 97-LB-VX-0008
Exhibit 2: Comparison Microscope and Typical Comparison Microscope Image
During the 1990’s, a number of automated “search and retrieval” systems emerged. The rational
behind the development of these systems was to take advantage of the continuously improving
performance (and decreasing cost) of today’s computers to facilitate the task of the firearms
examiner. The basic components of an automated search and retrieval system are the acquisition
and the correlation components:
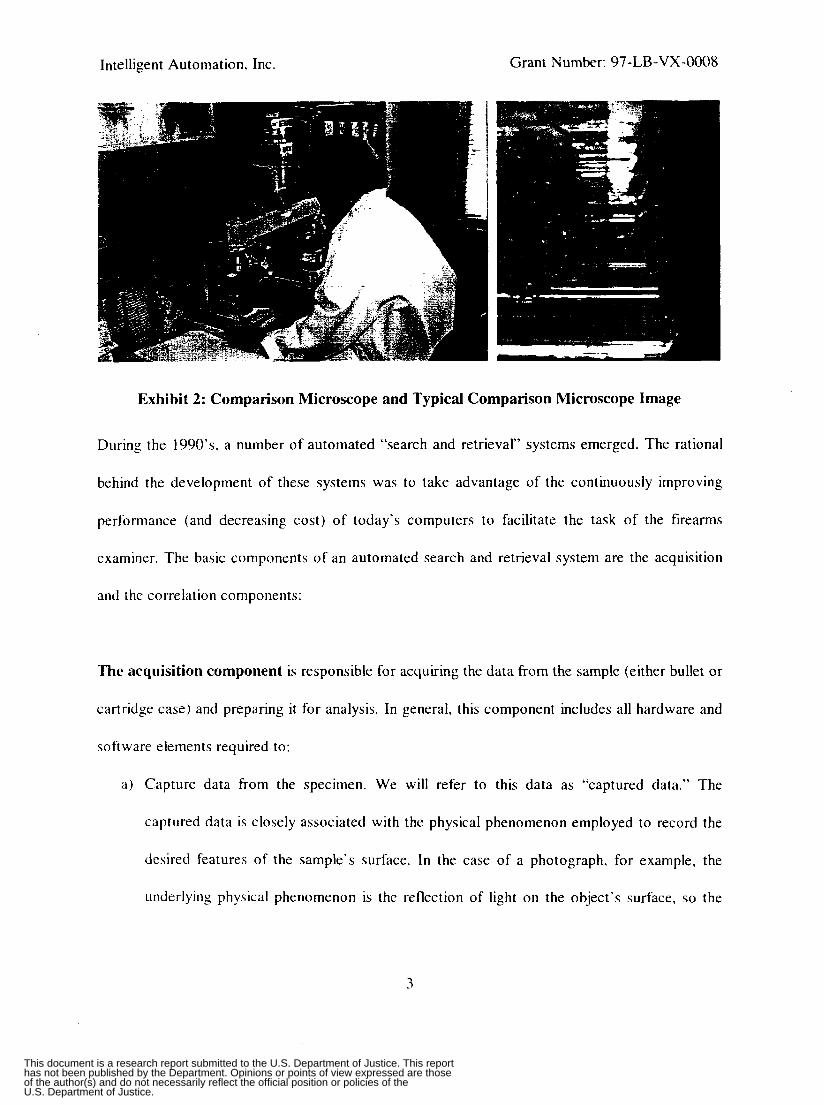
The acquisition component is responsible for acquiring the data from the sample (either bullet or
cartridge case) and preparing it for analysis. In general, this component includes all hardware and
software elements required to:
a) Capture data from the specimen. We will refer to this data as “captured data.” The
captured data is closely associated with the physical phenomenon employed to record the
desired features of the sample’s surface. In the case of a photograph, for example, the
underlying physical phenomenon is the reflection of light on the object’s surface, so the
3
This document is a research report submitted to the U.S. Department of Justice. This reporthas not been published by the Department. Opinions or points of view expressed are thoseof the author(s) and do not necessarily reflect the official position or policies of theU.S. Department of Justice.
Intelligent Automation, Inc. Grant Number: 97-LB-VX-0008
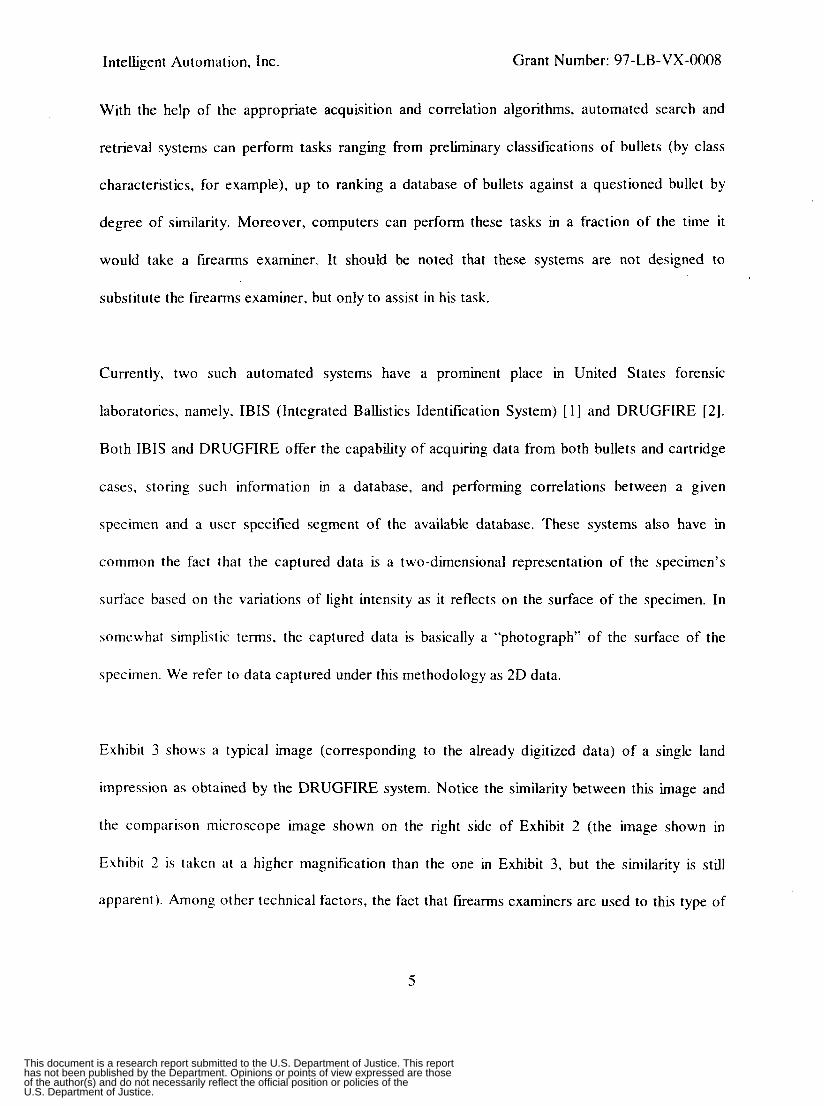
With the help of the appropriate acquisition and correlation algorithms, automated search and
retrieval systems can perform tasks ranging from preliminary classifications of bullets (by class
characteristics, for example), up to ranking a database of bullets against a questioned bullet by
degree of similarity. Moreover, computers can perform these tasks in a fraction of the time it
would take a frrearms examiner. It should be noted that these systems are not designed to
substitute the firearms examiner, but only to assist in his task.
Currently, two such automated systems have a prominent place in United States forensic
laboratories, namely, IBIS (Integrated Ballistics Identification System) [ I ] and DRUGFIRE [2].
Both IBIS and DRUGFIRE offer the capability of acquiring data from both bullets and cartridge
cases, storing such information in a database, and performing correlations between a given
specimen and a user specified segment of the available database. These systems also have in
common the fact that the captured data is a two-dimensional representation of the specimen’s
surface based on the variations of light intensity as it reflects on the surface of the specimen. In
somewhat simplistic terms, the captured data is basically a “photograph” of the surface of the
specimen. We refer to data captured under this methodology as 2D data.
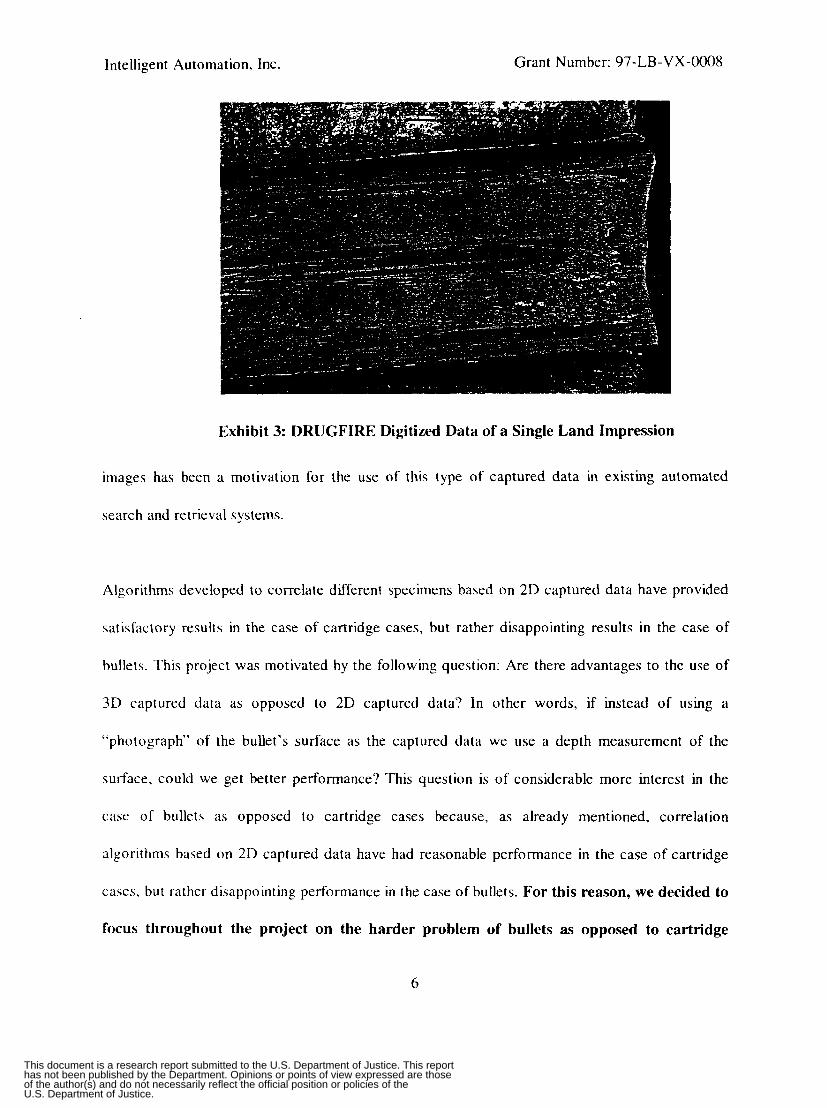
Exhibit 3 shows a typical image (corresponding to the already digitized data) of a single land
impression as obtained by the DRUGFIRE system. Notice the similarity between this image and
the comparison microscope image shown on the right side of Exhibit 2 (the image shown in
Exhibit 2 is taken at a higher magnification than the one in Exhibit 3, but the similarity is still
apparent). Among other technical factors, the fact that firearms examiners are used to this type of
5
This document is a research report submitted to the U.S. Department of Justice. This reporthas not been published by the Department. Opinions or points of view expressed are thoseof the author(s) and do not necessarily reflect the official position or policies of theU.S. Department of Justice.
Intelligent Automation, Inc. Grant Number: 97-LB-VX-0008
Exhibit 3: DRUGFIRE Digitized Data of a Single Land Impression
images has been a motivation for the use of this type of captured data in existing automated
search and retrieval systems.
Algorithms developed to correlate different specimens based on 2D captured data have provided
satisfactory results in the case of cartridge cases, but rather disappointing results in the case of
bullets. This project was motivated by the following question: Are there advantages to the use of
3D captured data as opposed to 2D captured data? In other words, if instead of using a
“photograph’ of the bullet’s surface as the captured data we use a depth measurement of the
surface, could we get better performance? This question is of considerable more interest in the
case of bullets as opposed to cartridge cases because, as already mentioned, correlation
algorithms based on 2D captured data have had reasonable performance in the case of cartridge
cases. but rather disappointing performance in the case of bullets. For this reason, we decided to
focus throughout the project on the harder problem of bullets as opposed to cartridge
6
This document is a research report submitted to the U.S. Department of Justice. This reporthas not been published by the Department. Opinions or points of view expressed are thoseof the author(s) and do not necessarily reflect the official position or policies of theU.S. Department of Justice.
Intelligent Automation, Inc. Grant N um be r : 9 7 - LB - V X -0008
cases. In the following sub-sections we discuss in more precise terms what does it mean to
capture 3D data of the bullet’s surface, and why is the use of 3D captured data more effective
than the use of 2D captured data.
1.2 What does 3D acquisition mean?
As discussed in the previous sub-section, capturing data in 2D can be thought of as taking a
photograph of the surface of the specimen. So what does it mean to capture 3D data? Intuition
suggests that 3D data capture should be associated with the depth of the striations. In this sub-
section we make a more precise description of what is meant by 3D data capture.
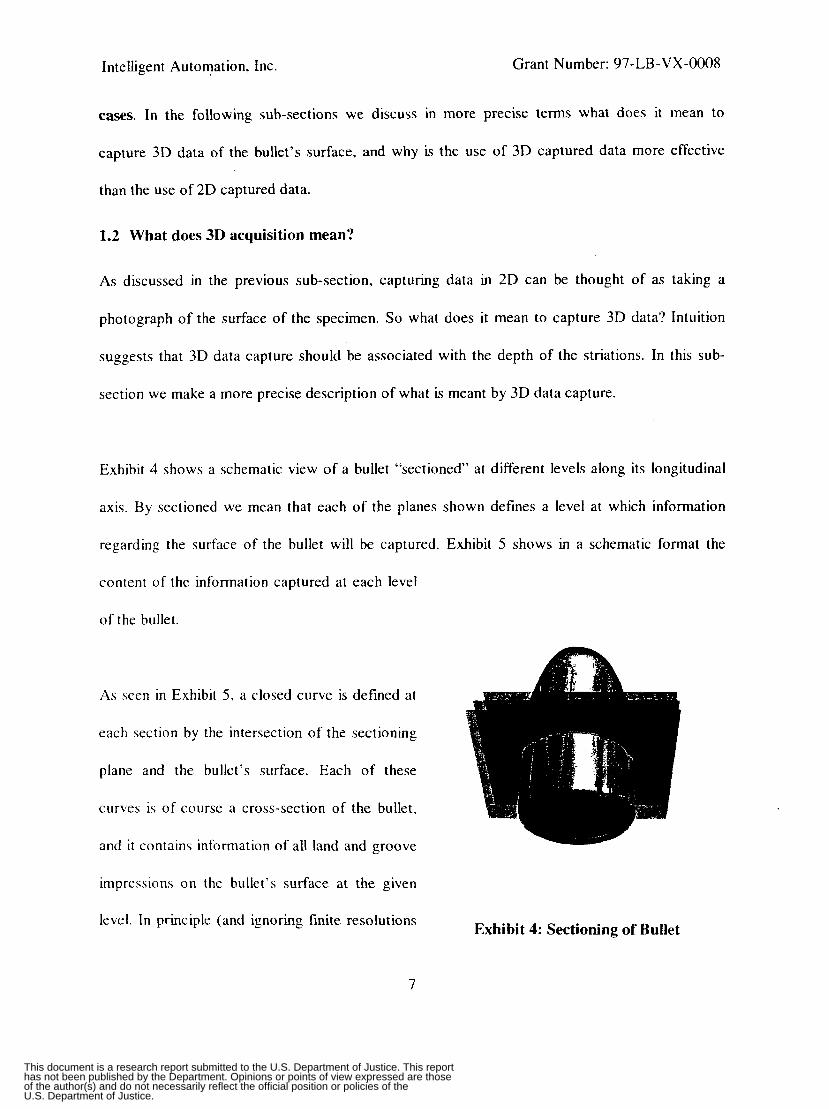
Exhibit 4 shows a schematic view of a bullet “sectioned” at different levels along its longitudinal
axis. By sectioned we mean that each of the planes shown defines a level at which information
regarding the surface of the bullet will be captured. Exhibit 5 shows in a schematic format the
content of the information captured at each level
of the bullet.
As seen in Exhibit 5 , a closed curve is defined at
each section by the intersection of the sectioning
plane and the bullet’s surface. Each of these
curves is of course a cross-section of the bullet,
and it contains information of all land and groove
impressions on the bullet’s surface at the given
level. In principle (and ignoring finite resolutions Exhibit 4: Sectioning of Bullet
7
This document is a research report submitted to the U.S. Department of Justice. This reporthas not been published by the Department. Opinions or points of view expressed are thoseof the author(s) and do not necessarily reflect the official position or policies of theU.S. Department of Justice.
Intelligent Automation, Inc. Grant Number: 97-LB-VX-0008
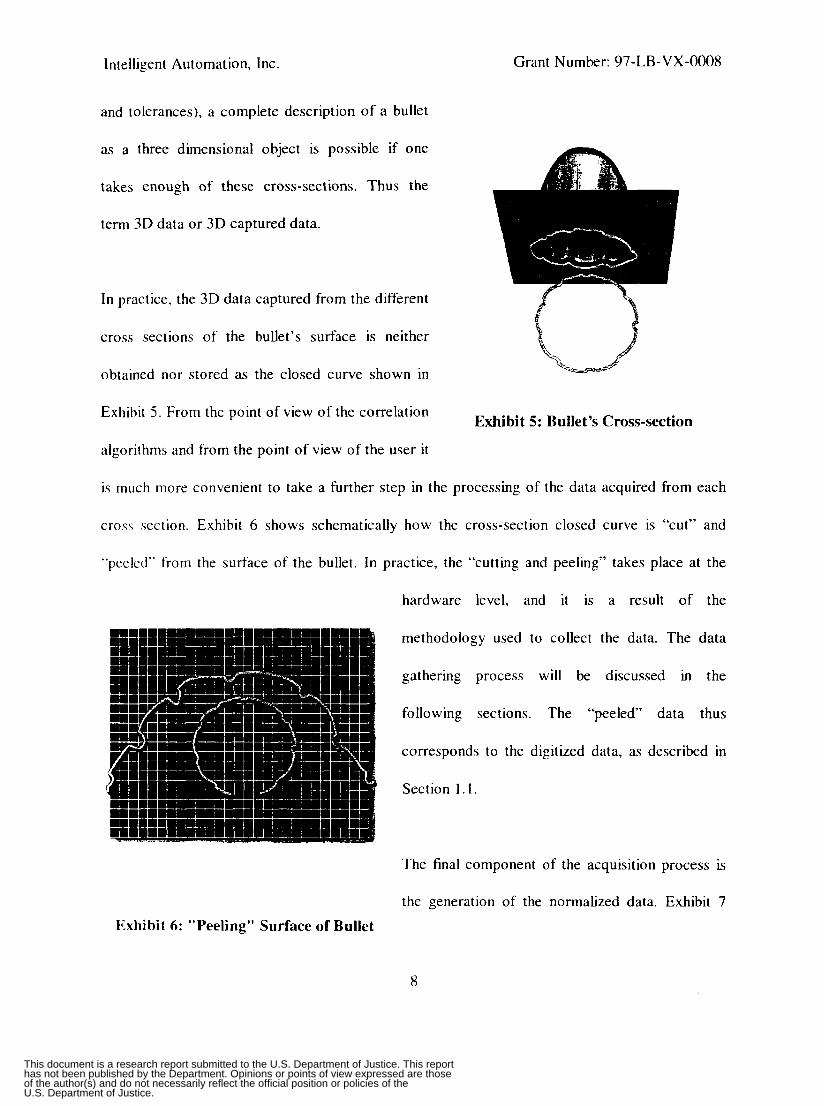
and tolerances), a complete description of a bullet
as a three dimensional object is possible if one
takes enough of these cross-sections. Thus the
term 3D data or 3D captured data.
cross sections of the bullet’s surface is neither
obtained nor stored as the closed curve shown in
Exhibit 5. From the point of view of the correlation Exhibit 5: Bullet’s Cross-section
algorithms and from the point of view of the user it
is much more convenient to take a further step in the processing of the data acquired from each
cross section. Exhibit 6 shows schematically how the cross-section closed curve is “cut” and
“peeled“ from the surface of the bullet. In practice, the “cutting and peeling” takes place at the
Exhibit 6: ”Peeling” Surface of Bullet
hardware level, and it is a result of the
methodology used to collect the data. The data
gathering process will be discussed in the
following sections. The ‘‘peeled” data thus
corresponds to the digitized data, as described in
Section
The fma
. I .
component of the acquisition process is
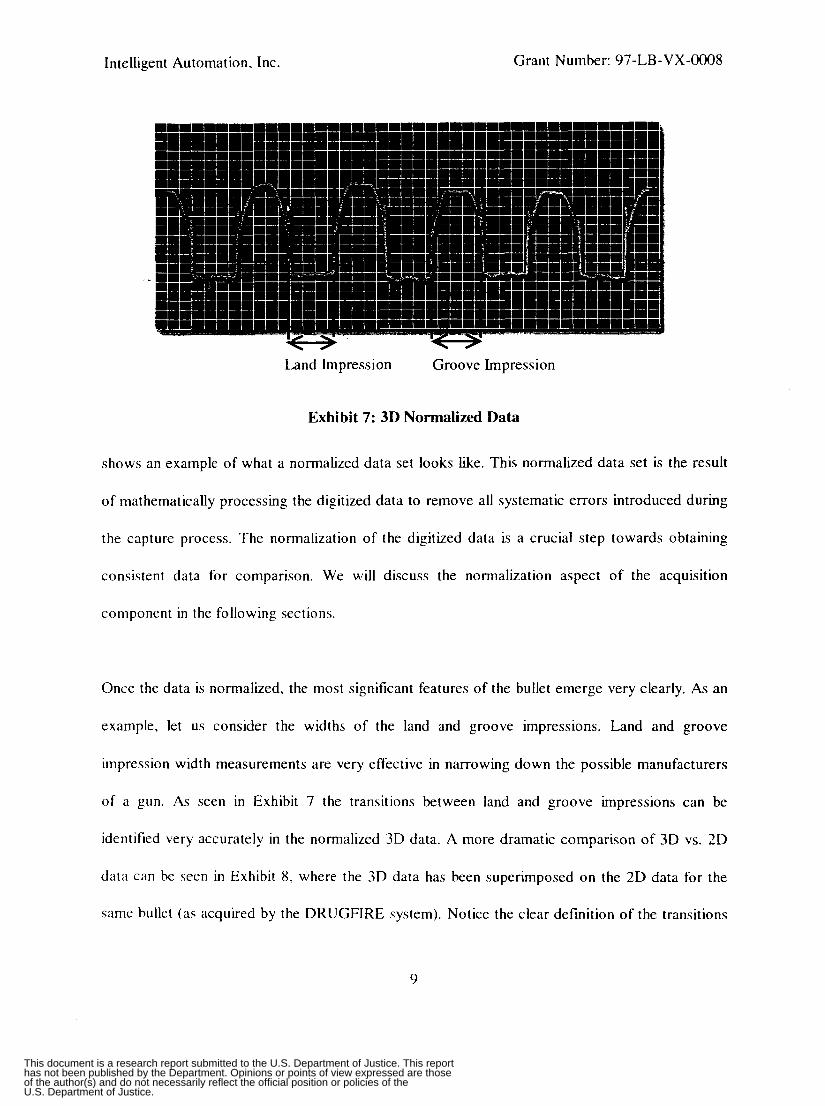
the generation of the normalized data. Exhibit 7
8
This document is a research report submitted to the U.S. Department of Justice. This reporthas not been published by the Department. Opinions or points of view expressed are thoseof the author(s) and do not necessarily reflect the official position or policies of theU.S. Department of Justice.
Intelligent Automation, Inc. Grant Number: 97-LB-VX-0008
Land Impression Groove Impression
Exhibit 7: 3D Normalized Data
shows an example of what a normalized data set looks like. This normalized data set is the result
of mathematically processing the digitized data to remove all systematic errors introduced during
the capture process. The normalization of the digitized data is a crucial step towards obtaining
consistent data for comparison. We will discuss the normalization aspect of the acquisition
component in the following sections.
Once the data is normalized, the most significant features of the bullet emerge very clearly. As an
example, let us consider the widths of the land and groove impressions. Land and groove
impression width measurements are very effective in narrowing down the possible manufacturers
of a gun. As seen in Exhibit 7 the transitions between land and groove impressions can be
identified very accurately in the normalized 3D data. A more dramatic comparison of 3D vs. 2D
data can be seen in Exhibit 8, where the 3D data has been superimposed on the 2D data for the
same bullet (as acquired by the DRUGFIRE system). Notice the clear definition of the transitions
9
This document is a research report submitted to the U.S. Department of Justice. This reporthas not been published by the Department. Opinions or points of view expressed are thoseof the author(s) and do not necessarily reflect the official position or policies of theU.S. Department of Justice.
Intelligent Automation, Inc. Grant Number: 97-LB-VX-0008
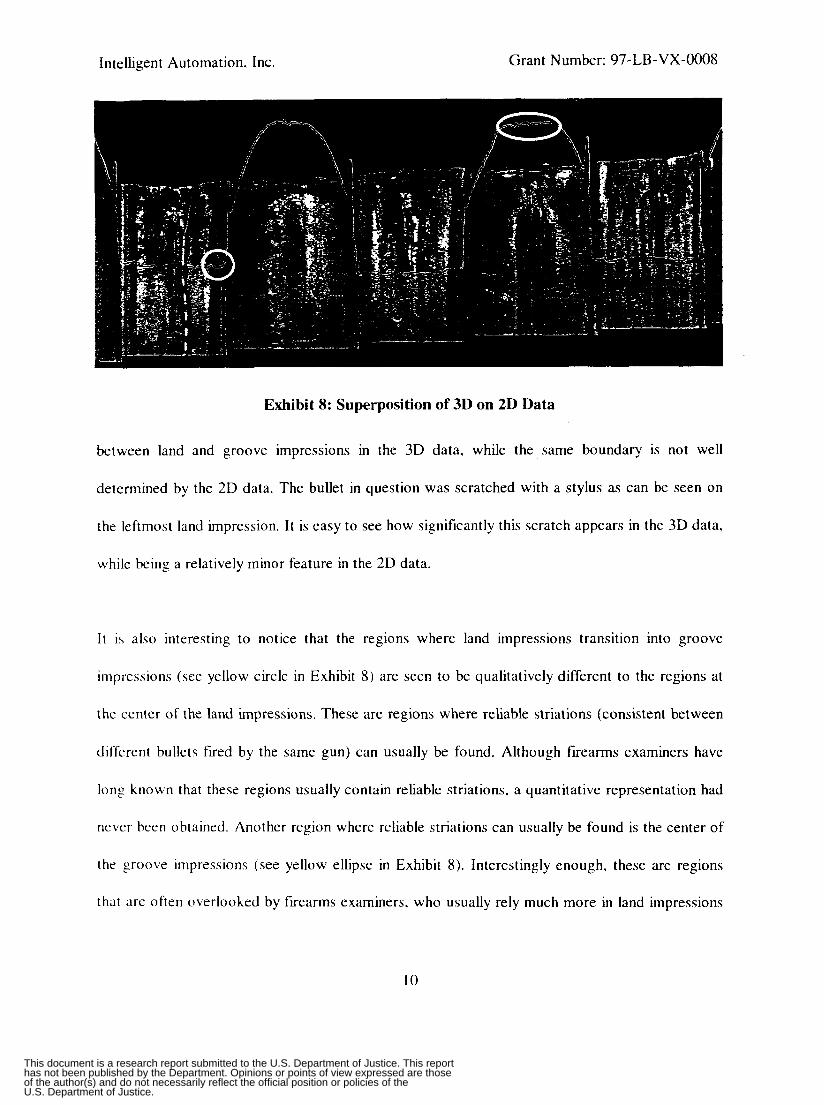
Exhibit 8: Superposition of 3D on 2D Data
between land and groove impressions in the 3D data, while the same boundary is not well
determined by the 2D data. The bullet in question was scratched with a stylus as can be seen on
the leftmost land impression. It is easy to see how significantly this scratch appears in the 3D data,
while being a relatively minor feature in the 2D data.
I t is also interesting to notice that the regions where land impressions transition into groove
impressions (see yellow circle in Exhibit 8) are seen to be qualitatively different to the regions at
the center of the land impressions. These are regions where reliable striations (consistent between
different bullets fired by the same gun) can usually be found. Although firearms examiners have
long known that these regions usually contain reliable striations, a quantitative representation had
never been obtained. Another region where reliable striations can usually be found is the center of
the groove impressions (see yellow ellipse in Exhibit 8). Interestingly enough, these are regions
that are often overlooked by firearms examiners, who usually rely much more in land impressions
10
This document is a research report submitted to the U.S. Department of Justice. This reporthas not been published by the Department. Opinions or points of view expressed are thoseof the author(s) and do not necessarily reflect the official position or policies of theU.S. Department of Justice.
Intelligent Automation, Inc. Grant Number: 97-LB-VX-0008
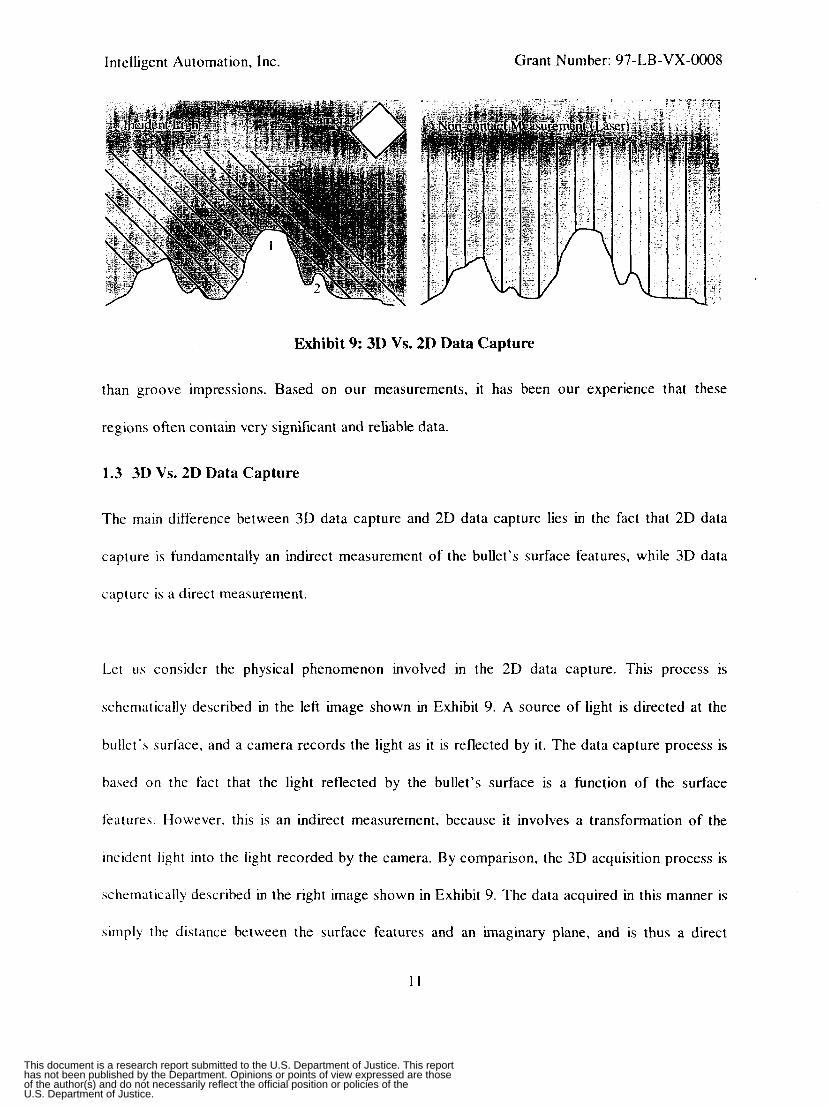
Exhibit 9: 3D Vs. 2D Data Capture
than groove impressions. Based on our measurements, it has been our experience that these
regions often contain very significant and reliable data.
1.3 3D Vs. 2D Data Capture
The main difference between 3D data capture and 2D data capture lies in the fact that 2D data
capture is fundamentally an indirect measurement of the bullet’s surface features, while 3D data
capture is a direct measurement.
Let us consider the physical phenomenon involved in the 2D data capture. This process is
schematically described in the left image shown in Exhibit 9. A source of light is directed at the
bullet’s surface, and a camera records the light as it is reflected by it. The data capture process is
based on the fact that the light reflected by the bullet’s surface is a function of the surface
features. However, this is an indirect measurement, because it involves a transformation of the
incident light into the light recorded by the camera. By comparison, the 3D acquisition process is
schematically described in the right image shown in Exhibit 9. The data acquired in this manner is
simply the distance between the surface features and an imaginary plane, and is thus a direct
1 1
This document is a research report submitted to the U.S. Department of Justice. This reporthas not been published by the Department. Opinions or points of view expressed are thoseof the author(s) and do not necessarily reflect the official position or policies of theU.S. Department of Justice.
Intelligent Automation, Inc. Grant Number: 97-LB-VX-0008
measurement. Let u s consider the disadvantages associated with of the indirectness of the 2D data
capture :
Robustness: A significant problem associated with 2D data capture lies in the fact that the
transformation relating the light incident on the bullets surface and the reflected light by it depends
not only on the features of the bullet’s surface, but also on a number of independent parameters
such as the angle of incidence of the light, the angle of view of the camera, variations on the
reflectivity of the bullet surface, light intensity, etc. This implies that the captured data (the data
recorded by the camera) is dependent on these parameters too. To attempt to eliminate the effect
of these parameters on the captured data would be next to impossible (except possibly for light
intensity). As a consequence, the 2D captured data is vulnerable to considerable variability, or in
other terms. it is non-robust.
Indeterminate conditions: A different kind of problem associated with 2D data capture is the
presence of indeterminate conditions in the data. Take as an example a surface as depicted in
Exhibit 9. Given an incident light source with the shown angle, some of the smaller surface
features (for example the feature labeled 2) can be “shadowed” by the larger features (feature 1).
This implies that there will be regions of the surface where the captured data will not accurately
reflect the surface features. In mathematical terms, the transformation between the incident light
and the reflected light is non-invertible. Furthermore, this is an example where the angle of
incidence of the light source can have a critical effect on the captured data, because arbitrarily
small changes in the angle of incidence may determine whether feature 2 is detected or not. In
mathematical terms, the transformation between the incident light and the reflected light is
12
This document is a research report submitted to the U.S. Department of Justice. This reporthas not been published by the Department. Opinions or points of view expressed are thoseof the author(s) and do not necessarily reflect the official position or policies of theU.S. Department of Justice.
Intelligent Automation, Inc. Grant Number: 97-LB-VX-0008
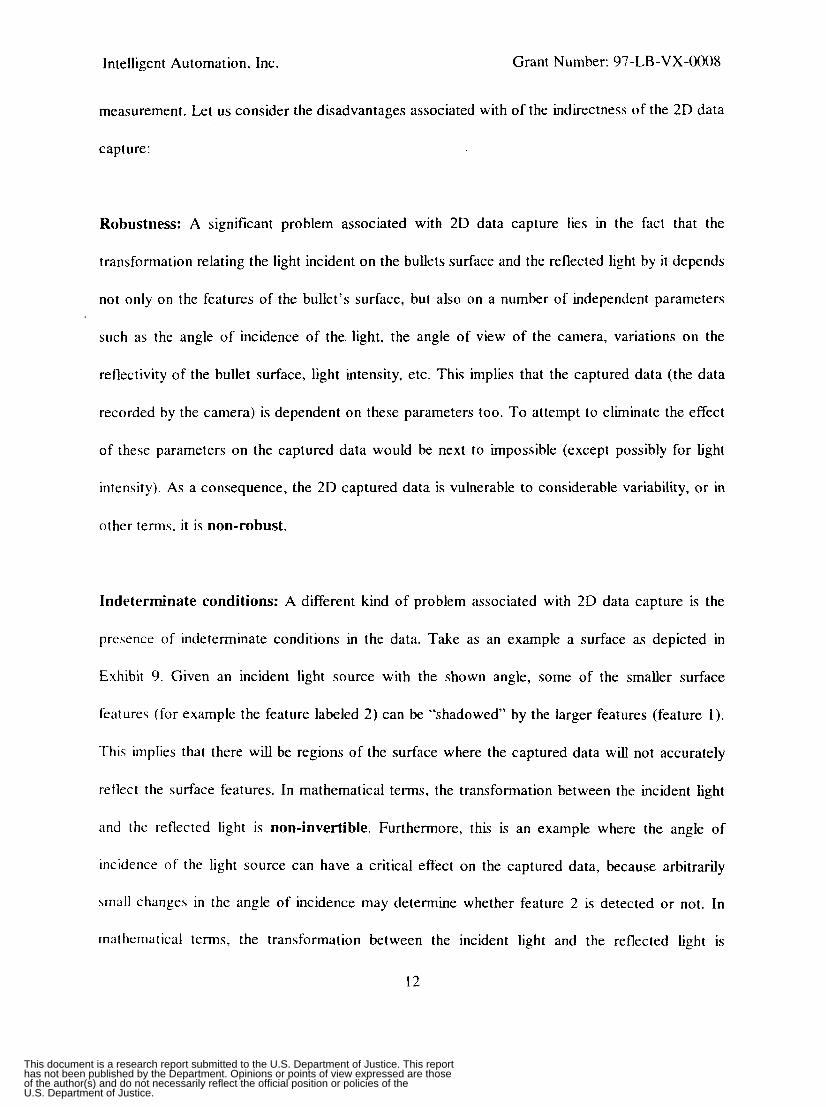
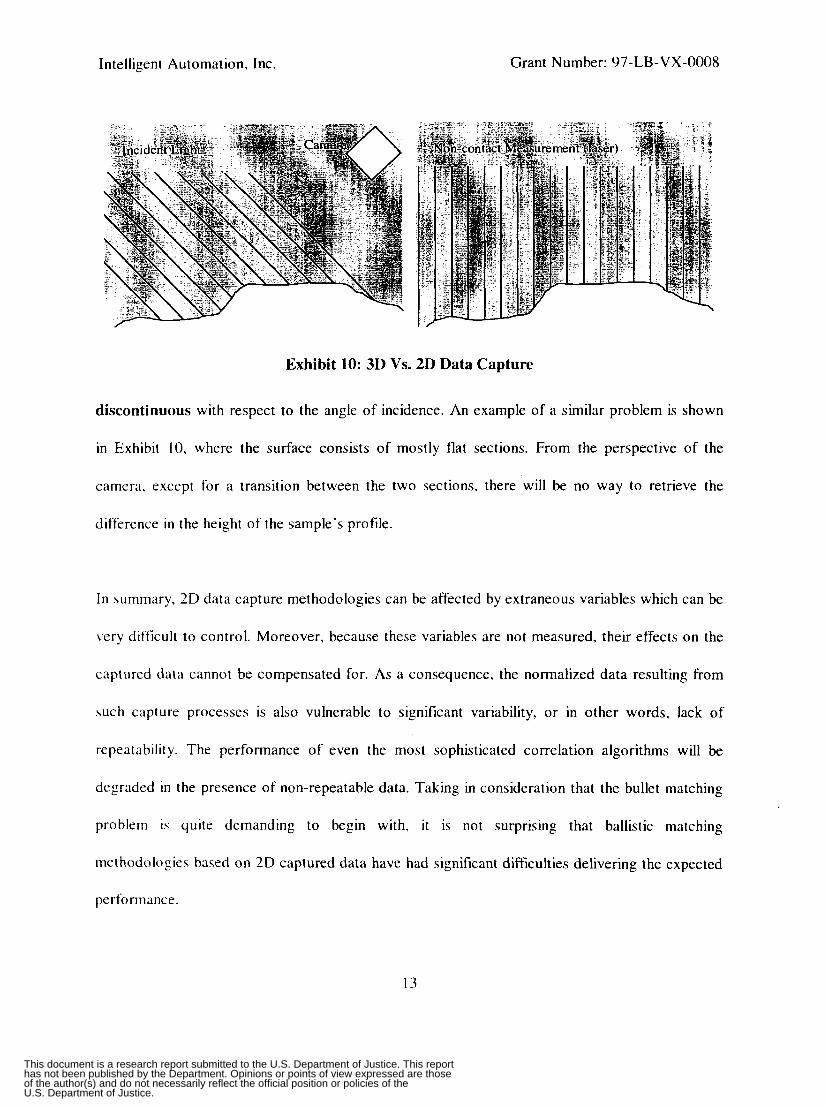
Exhibit 10: 3D Vs. 2D Data Capture
discontinuous with respect to the angle of incidence. An example of a similar problem is shown
in Exhibit IO, where the surface consists of mostly flat sections. From the perspective of the
camera, except for a transition between the two sections. there will be no way to retrieve the
difference in the height of the sample’s profile.
In summary, 2D data capture methodologies can be affected by extraneous variables which can be
very difficult to control. Moreover, because these variables are not measured, their effects on the
captured data cannot be compensated for. As a consequence, the normalized data resulting from
such capture processes is also vulnerable to significant variability, or in other words, lack of
repeatability. The performance of even the most sophisticated correlation algorithms will be
degraded in the presence of non-repeatable data. Taking in consideration that the bullet matching
problem is quite demanding to begin with, it is not surprising that ballistic matching
methodologies based on 2D captured data have had significant difficulties delivering the expected
performance.
13
This document is a research report submitted to the U.S. Department of Justice. This reporthas not been published by the Department. Opinions or points of view expressed are thoseof the author(s) and do not necessarily reflect the official position or policies of theU.S. Department of Justice.
Intelligent Automation, Inc. Grant Number: 97-LB-VX-0008
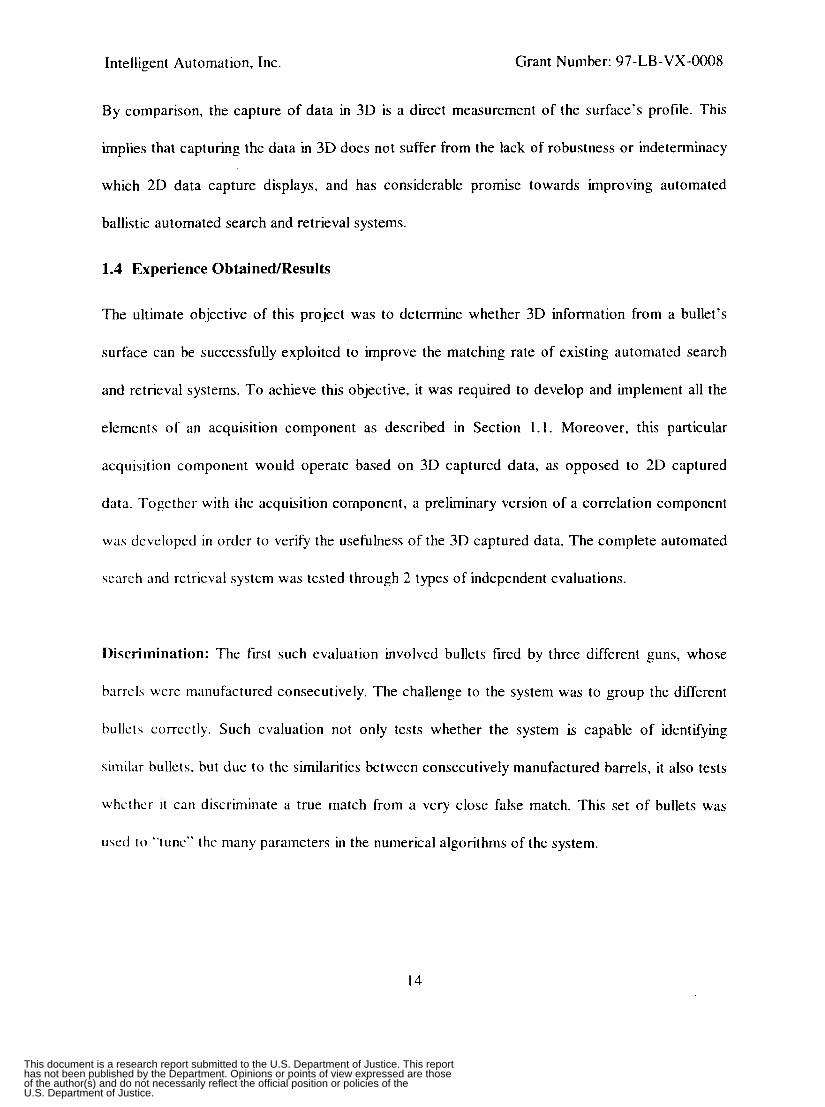
By comparison, the capture of data in 3D is a direct measurement of the surface’s profile. This
implies that capturing the data in 3D does not suffer from the lack of robustness or indeterminacy
which 2D data capture displays, and has considerable promise towards improving automated
ballistic automated search and retrieval systems.
1.4 Experience ObtainecUResults
The ultimate objective of this project was to determine whether 3D information from a bullet’s
surface can be successfully exploited to improve the matching rate of existing automated search
and retrieval systems. To achieve this objective, it was required to develop and implement all the
elements of an acquisition component as described in Section 1.1. Moreover, this particular
acquisition component would operate based on 3D captured data, as opposed to 2D captured
data. Together with die acquisition Component, a preliminary version of a correlation component
was developed in order to verify the usefulness of the 3D captured data. The complete automated
search and retrieval system was tested through 2 types of independent evaluations.
Discrimination: The first such evaluation involved bullets fired by three different guns, whose
barrels were manufactured consecutively. The challenge to the system was to group the different
bulletx correctly. Such evaluation not only tests whether the system is capable of identlfying
similar bullets. but due to the similarities between consecutively manufactured barrels, it also tests
whcther it can discriminate a true match from a very close false match. This set of bullets was
uscd t o “tunc” the many parameters in the numerical algorithms of the system.
14
This document is a research report submitted to the U.S. Department of Justice. This reporthas not been published by the Department. Opinions or points of view expressed are thoseof the author(s) and do not necessarily reflect the official position or policies of theU.S. Department of Justice.
Intelligent Automation, Inc. Grant Number: 97-LB-VX-0008
Identification: The second type of evaluation was meant to emulate a more “real life” situation.
These evaluations involved so-called “blind tests.” We were provided with control bullets from
different guns (ix., we were told which gun which frred each of the “control bullets”), and with
questioned bullets. The task was to identify which gun fired each of the questioned bullets based
on the data obtained from the control bullets (ix., to match the questioned bullets with the control
bullets). It is worth mentioning that in each of these tests the guns in question had the same class
characteristics. We performed.two sets of tests, the first with 6 guns and the second with 5 guns.
In both cases the system was able to correctly identlfy which gun fired each of the questioned
bullets.
As mentioned in Section 1.4, the ultimate objective of this project is to determine whether 3D
information from a bullet’s surface can be successfully exploited to improve the matching rate of
existing automated search and retrieval systems. To achieve this objective, it was required to
develop all the hardware and software elements of an acquisition component as described in
Section 1.1. Together with the acquisition component, in order to venfy the usefulness of the 3D
captured data, a preliminary version of a correlation component was also developed.
Together with these efforts, a number of evaluations were performed to determine the potential of
the system. These evaluations are described in general terms in Section 1.4, and in detail in
Section 4.
15
This document is a research report submitted to the U.S. Department of Justice. This reporthas not been published by the Department. Opinions or points of view expressed are thoseof the author(s) and do not necessarily reflect the official position or policies of theU.S. Department of Justice.

Intelligent Automation, Inc. Grant Number: 97-LB-VX-0008
The scope of this project was to validate the use of 3D captured surface data as a reliable
methodology for ballistics analysis and matching. In order to achieve this goal, it was necessary to
develop the main components of a basic search and retrieval system. and to evaluate its
performance. Because at the core of this project is the premise of exploiting a new type of
captured data, we focused most of our efforts in the acquisition component of the system; in other
words, in the consistency and reliability of the acquisition procedures and algorithms. We have
also invested a considerable amount of effort in the development of a correlation component. This
correlation component has also proved to be quite successful.
3.1 Acquisition Component: Hardware
One of the most important steps for this project was to design, build and test a practical setup to
measure the depth of bullet striations. This task involved two main decisions: the selection of a
depth measuring device capable of performing the required measurements to the required
specifications (for a reasonable cost), and the selection of a methodology and corresponding
hardware setup to perform these measurements. We selected the measurement technology/device
which best satisfies the requirements of this application. This was not a trivial task due to the
stringent requirements inherent to the required measurements. We also conceived a methodology
and assembled a prototype mechanism to enable us to make these measurements. This section
describes in detail our considerations for the development of the hardware aspects of the
acquisition component .
16
This document is a research report submitted to the U.S. Department of Justice. This reporthas not been published by the Department. Opinions or points of view expressed are thoseof the author(s) and do not necessarily reflect the official position or policies of theU.S. Department of Justice.
intelligent Automation, Inc. Grant Number: 97-LB-VX-0008
_ _ ~ ~~ ~
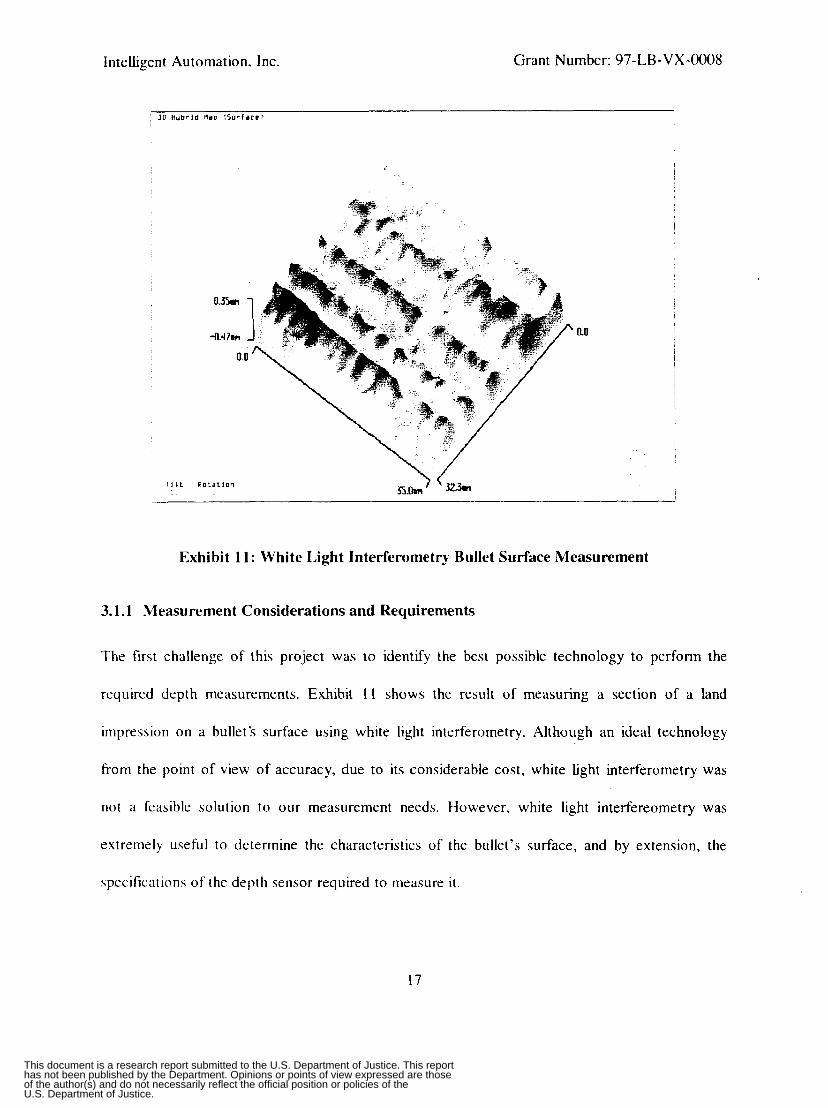
Exhibit 11: White Light Interferometry Bullet Surface Measurement
3.1.1 Measurement Considerations and Requirements
The first challenge of this project was to identify the best possible technology to perform the
required depth measurements. Exhibit I I shows the result of measuring a section of a land
impression on a bullet's surface using white light interferometry. Although an ideal technology
from the point of view of accuracy, due to its considerable cost, white light interferometry was
not a feasible solution to our measurement needs. However, white light interfereometry was
extremely useful to determine the characteristics of the bullet's surface, and by extension, the
specifications of the depth sensor required to measure it.
17
This document is a research report submitted to the U.S. Department of Justice. This reporthas not been published by the Department. Opinions or points of view expressed are thoseof the author(s) and do not necessarily reflect the official position or policies of theU.S. Department of Justice.

Intelligent Automation, Inc. Grant Number: 97-LB-VX-0008
Based on a number of these and a number of other measurements, we concluded that in order to
obtain significant information regarding the striations on a bullet’s surface. an instrument with
depth resolution on the order o f . 1 microns and lateral resolution on the order of 1 micron would
be optimal. Additional measurements helped us determine that the depth differential between a
land impression and a groove impression on a bullet’s surface is on the order of 100 microns.
Together with the depth sensor, it was necessary to identdy a simple and cost effective
methodology to perform the measurement in a consistent manner. By consistent we mean that the
measurement methodology had to be such that different bullets would be measured under the
same conditions and in the same manner. Due to the basically cylindrical shape of bullets, it was
determined that the best measurement methodology would be to rotate the bullet in view of the
depth sensor as opposed to performing a X-Y raster of the bullet’s surface. By doing so, it is
possible to take full advantage of the depth sensor range. The basic structure of the experimental
setup is shown on the left side of Exhibit 12. The bullet under measurement is rotated in front of
the depth sensor, while the depth sensor measures a cross section of the bullet.
Given that the depth difference between a land impression and a groove impression on a bullet’s
surface is on the order of 100 microns, in order to measure a complete cross section of a bullet
(i.e.. 360 degrees), the minimum required range for the depth sensor is in principle exactly 100
microns. However, because bullets are never perfectly round after being fired, and because there
are always miss-alignment imperfections in the measurement process (the bullet under
measurement could be improperly centered, or tilted, for example), a depth range of 600 microns
was considered the minimum acceptable range for this application.
18
This document is a research report submitted to the U.S. Department of Justice. This reporthas not been published by the Department. Opinions or points of view expressed are thoseof the author(s) and do not necessarily reflect the official position or policies of theU.S. Department of Justice.

Intelligent Automation, Inc. Grant Number: 97-LB-VX-0008
Finally, it was of critical importance for this application to identlfy a non-contacting measurement
instrument (to prevent any possible damage to the bullets). Identifying a non-contacting depth
sensor capable of satisfying the required lateral, depth resolution, and range parameters (together
with reasonable measurement bandwidth) is not necessarily a very difficult task for reasonably
flat surfaces. As an example, it is possible to find conventional triangulation-based sensor systems
capable of satisfying these requirements for flat surfaces. However, after trying a couple of these,
we found that such systems could not reliably measure the transitions (shoulders) between land
and groove impressions. In fact, the output of such systems would saturate at these points, and
whole sections of the bullet’s surface would be lost. The reason triangulation-based sensors did
not provide satisfactory performance for these regions is that the slope of the surface at these
transition areas is too steep for these sensors.
Besides triangulation systems (which have the advantage of being cheap and widely available) we
studied the feasibility of using other measurement methodologies. Among others, we considered
Moire Interferometry, Shape from shading techniques, Photometric Stereo techniques, Scanning
Electron Microscopy, Confocal Microscopy, and other Confocal sensors. Of all these techniques,
we found that confocal based sensors offered a very good compromise between cost and
performance. These were the only commercially available sensors capable of making
measurements of the steep shoulders between land and groove impressions, while not being
prohibitively expensive. Two commercially available confocal sensors were identified, one
manufactured by Keyence Corporation, and the other manufactured by UBM Corporation. The
sensor manufactured by UBM Corporation was selected based on cost and performance
19
This document is a research report submitted to the U.S. Department of Justice. This reporthas not been published by the Department. Opinions or points of view expressed are thoseof the author(s) and do not necessarily reflect the official position or policies of theU.S. Department of Justice.
Intelligent Automation, Inc. Grant Number: 97-LB-VX-0008
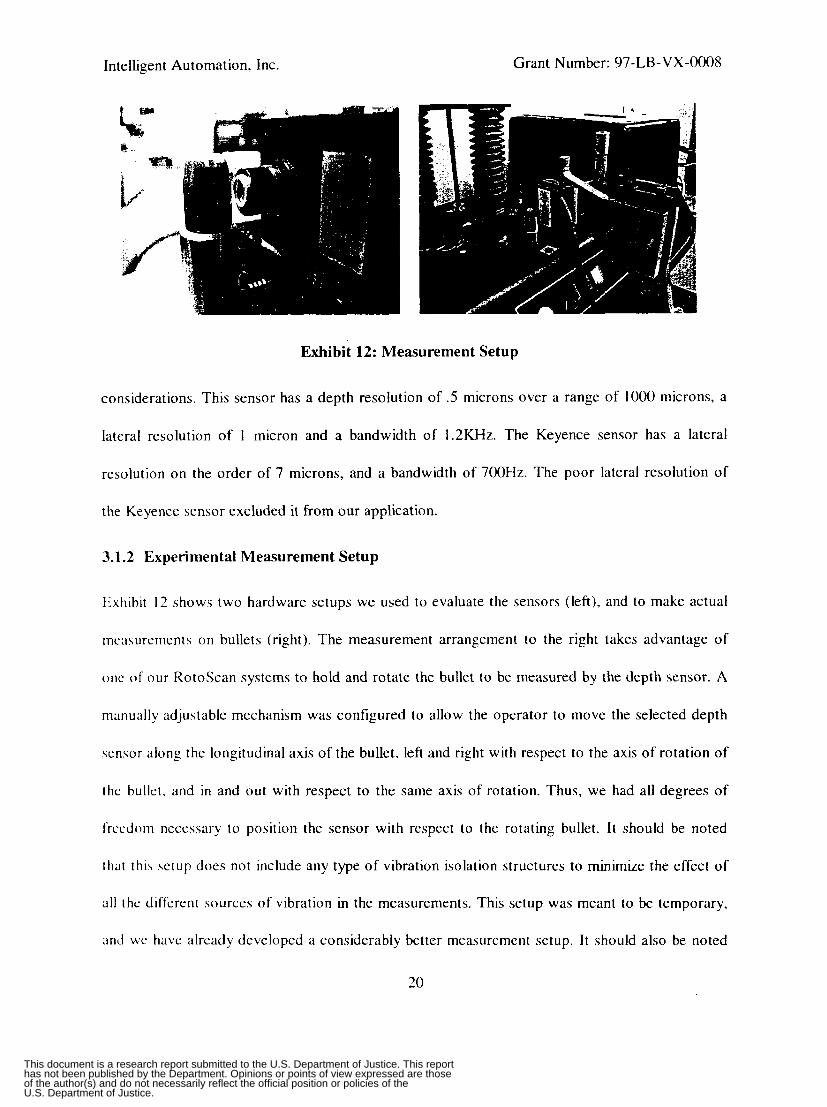
Exhibit 12: Measurement Setup
considerations. This sensor has a depth resolution of .5 microns over a range of 1000 microns, a
lateral resolution of 1 micron and a bandwidth of 1.2KHz. The Keyence sensor has a lateral
resolution on the order of 7 microns, and a bandwidth of 700Hz. The poor lateral resolution of
the Keyence sensor excluded it from our application.
3.1.2 Experimental Measurement Setup
Exhibit 12 shows two hardware setups we used to evaluate the sensors (left), and to make actual
mcasurements on bullets (right). The measurement arrangement to the right takes advantage of
one of our RotoScan systems to hold and rotate the bullet to be measured by the depth sensor. A
manually adjustable mechanism was configured to allow the operator to move the selected depth
sensor along the longitudinal axis of the bullet, left and right with respect to the axis of rotation of
the bullet. and in and out with respect to the same axis of rotation. Thus, we had all degrees of
frccdom necessary to position the sensor with respect to the rotating bullet. It should be noted
tha t thi.s w u p does not include any type of vibration isolation structures to minimize the effect of
all thc different sources of vibration in the measurements. This setup was meant to be temporary,
and u'c have already developed a considerably better measurement setup. It should also be noted
20
This document is a research report submitted to the U.S. Department of Justice. This reporthas not been published by the Department. Opinions or points of view expressed are thoseof the author(s) and do not necessarily reflect the official position or policies of theU.S. Department of Justice.
Intelligent Automation, Inc. Grant Number: 97-LB-VX-0008
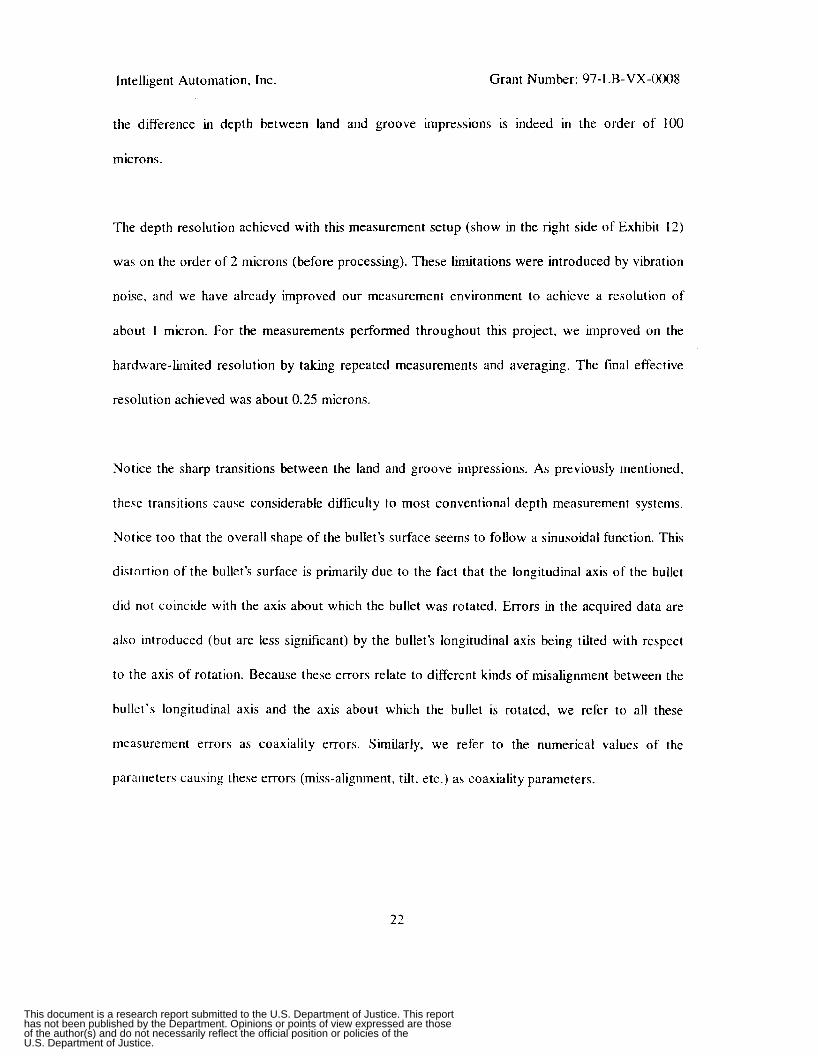
the difference in depth between land and groove impressions is indeed in the order of 100
microns.
The depth resolution achieved with this measurement setup (show in the right side of Exhibit 12)
was on the order of 2 microns (before processing). These limitations were introduced by vibration
noise, and we have already improved our measurement environment to achieve a resolution of
about 1 micron. For the measurements performed throughout this project, we improved on the
hardware-limited resolution by taking repeated measurements and averaging. The final effective
resolution achieved was about 0.25 microns.
Notice the sharp transitions between the land and groove impressions. As previously mentioned,
these transitions cause considerable difficulty to most conventional depth measurement systems.
Notice too that the overall shape of the bullet’s surface seems to follow a sinusoidal function. This
distortion of the hullet’s surface is primarily due to the fact that the longitudinal axis of the bullet
did not coincide with the axis about which the bullet was rotated. Errors in the acquired data are
also introduced (but are less significant) by the bullet’s longitudinal axis being tilted with respect
to the axis of rotation. Because these errors relate to different kinds of misalignment between the
bullet’s longitudinal axis and the axis about which the bullet is rotated, we refer to all these
measurement errors as coaxiality errors. Similarly, we refer to the numerical values of the
parameters causing these errors (miss-alignment, tilt. etc.) as coaxiality parameters.
22
This document is a research report submitted to the U.S. Department of Justice. This reporthas not been published by the Department. Opinions or points of view expressed are thoseof the author(s) and do not necessarily reflect the official position or policies of theU.S. Department of Justice.
Intelligent Automation. Inc. Grant Number: 97-LB-VX-0008
Averaged data 2 50
2 00
150
100
50
E O
- 50
-1 00
-1 50
-2 00
0 L U ._
0 500 1000 1500 2000 2500 3000 3500 4000 4500 samples
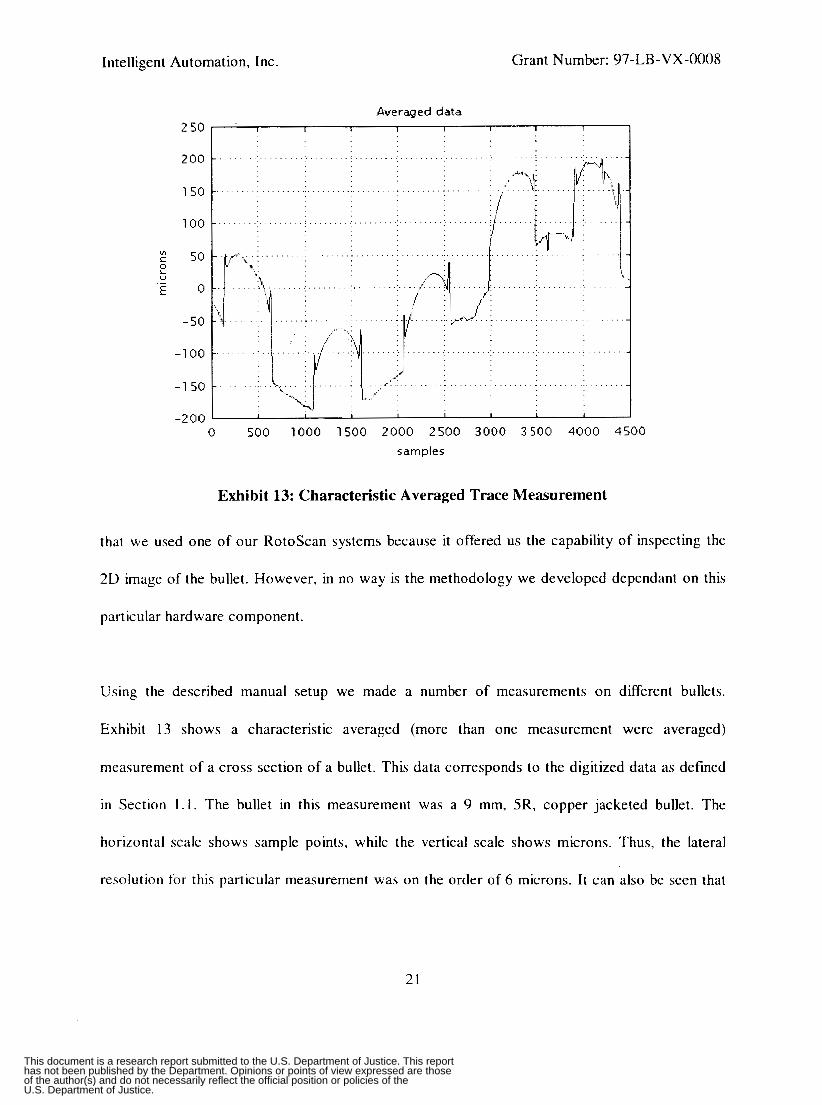
Exhibit 13: Characteristic Averaged Trace Measurement
that we used one of our RotoScan systems because it offered us the capability of inspecting the
2D image of the bullet. However, in no waq
particular hardware component.
is the methodology we developed dependant on this
Using the described manual setup we mac: a number of measurements on different bullets.
Exhibit 13 shows a characteristic averaged (more than one measurement were averaged)
measurement of a cross section of a bullet. This data corresponds to the digitized data as defined
in Section 1 . 1 . The bullet in this measurement was a 9 mm, 5R, copper jacketed bullet. The
horizontal scale shows sample points, while the vertical scale shows microns. Thus, the lateral
resolution for this particular measurement was on the order of 6 microns. It can also be seen that
21
This document is a research report submitted to the U.S. Department of Justice. This reporthas not been published by the Department. Opinions or points of view expressed are thoseof the author(s) and do not necessarily reflect the official position or policies of theU.S. Department of Justice.
Intelligent Automation, Inc. Grant Number: 97-LB-VX-0008
3.2.1 Coaxiality Errors Parameter Estimation:
As already mentioned, in order to compensate for the effect of coaxiality parameters, we first have
to identlfy them. In order to identlfy all the required coaxiality parameters, we construct a
mathematical model of the effect of the coaxiality parameters on the measured data. We then
perform a least-squares estimation of these parameters based on the acquired data. In other
words, we construct a cost function parameterized by the coaxiality parameters, and taking into
account the acquired data. By minimizing this cost function, we obtain the best possible estimate
of the true coaxiality parameters.
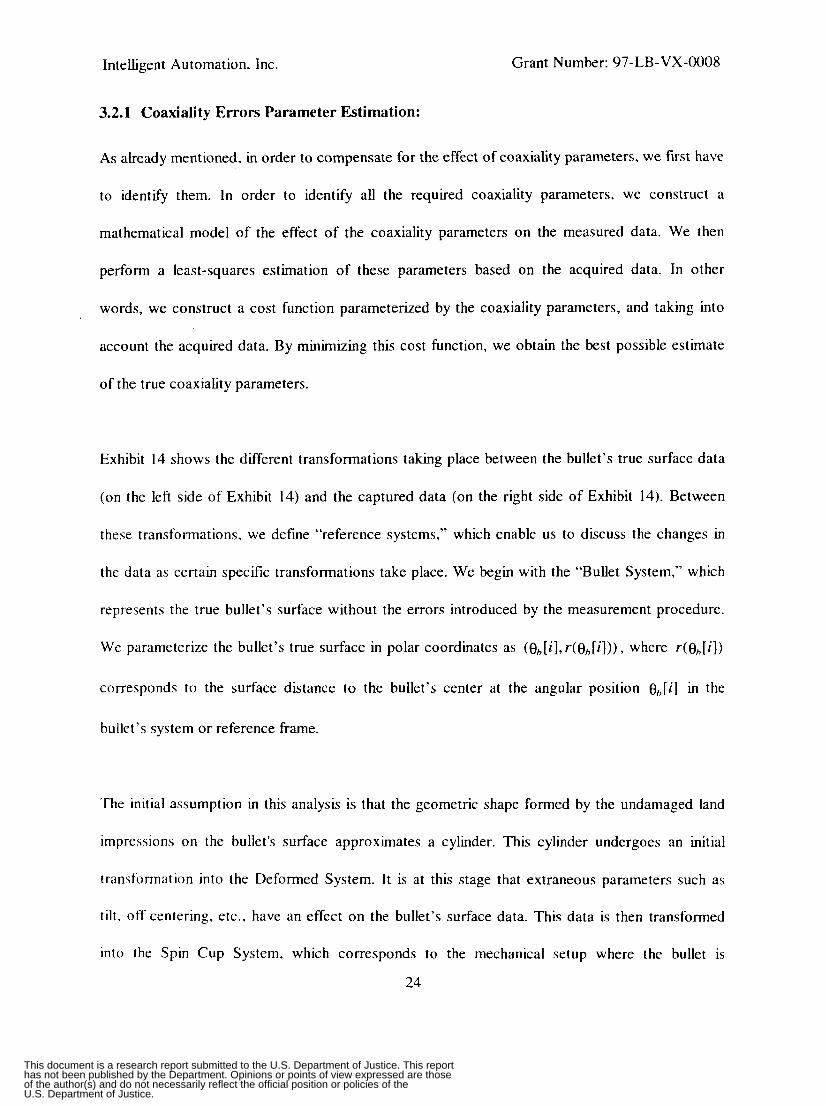
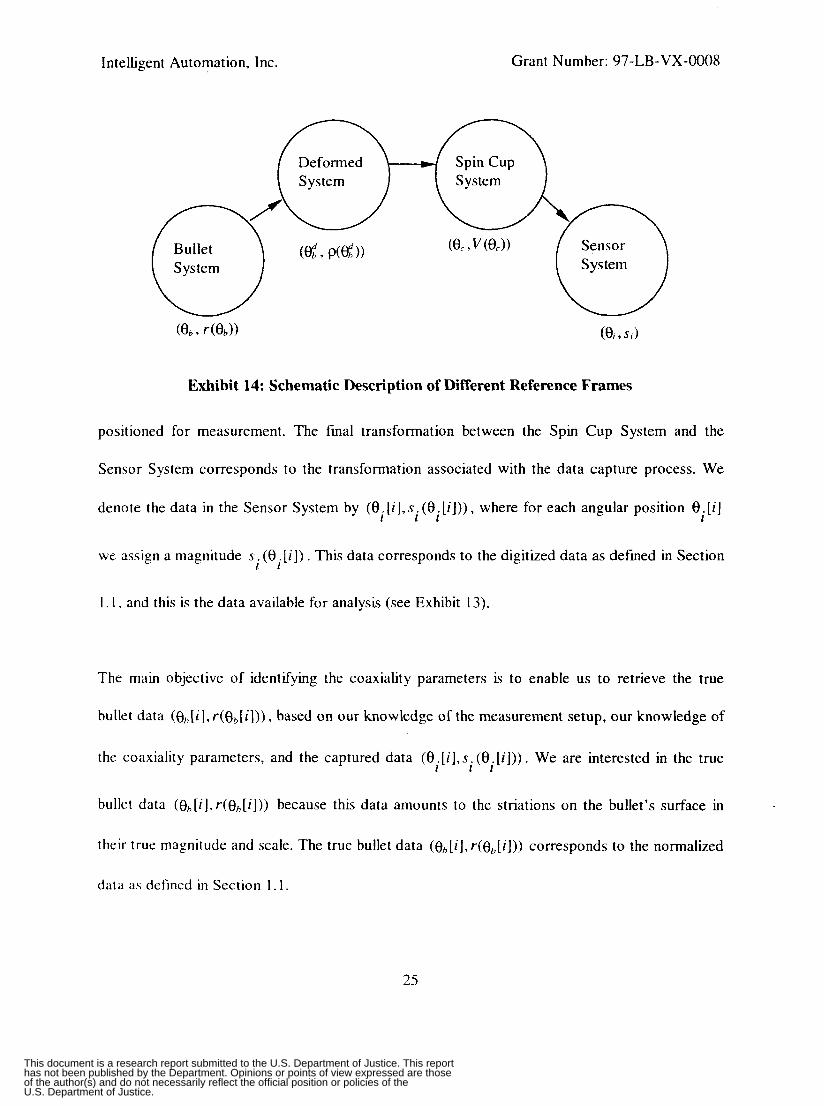
Exhibit 14 shows the different transformations taking place between the bullet’s true surface data
(on the left side of Exhibit 14) and the captured data (on the right side of Exhibit 14). Between
these transformations, we define “reference systems,” which enable us to discuss the changes in
the data as certain specific transformations take place. We begin with the “Bullet System,” which
represents the true bullet’s surface without the errors introduced by the measurement procedure.
We parameterize the bullet’s true surface in polar coordinates as (e,[i], r-(&,[ i ] ) ) , where r(e , , [ i ] )
corresponds to the surface distance to the bullet’s center at the angular position e,[i] in the
bullet’s system or reference Frame.
The initial assumption in this analysis is that the geometric shape formed by the undamaged land
impressions on the bullet’s surface approximates a cylinder. This cylinder undergoes an initial
transformation into the Deformed System. I t is at this stage that extraneous parameters such as
ti l t . off centering, etc., have an effect on the bullet’s
into the Spin Cup System, which corresponds to
24
surface data. This data is then transformed
the mechanical setup where the bullet is
This document is a research report submitted to the U.S. Department of Justice. This reporthas not been published by the Department. Opinions or points of view expressed are thoseof the author(s) and do not necessarily reflect the official position or policies of theU.S. Department of Justice.
Intelligent Automation. Inc. Grant Number: 97-LB-VX-0008
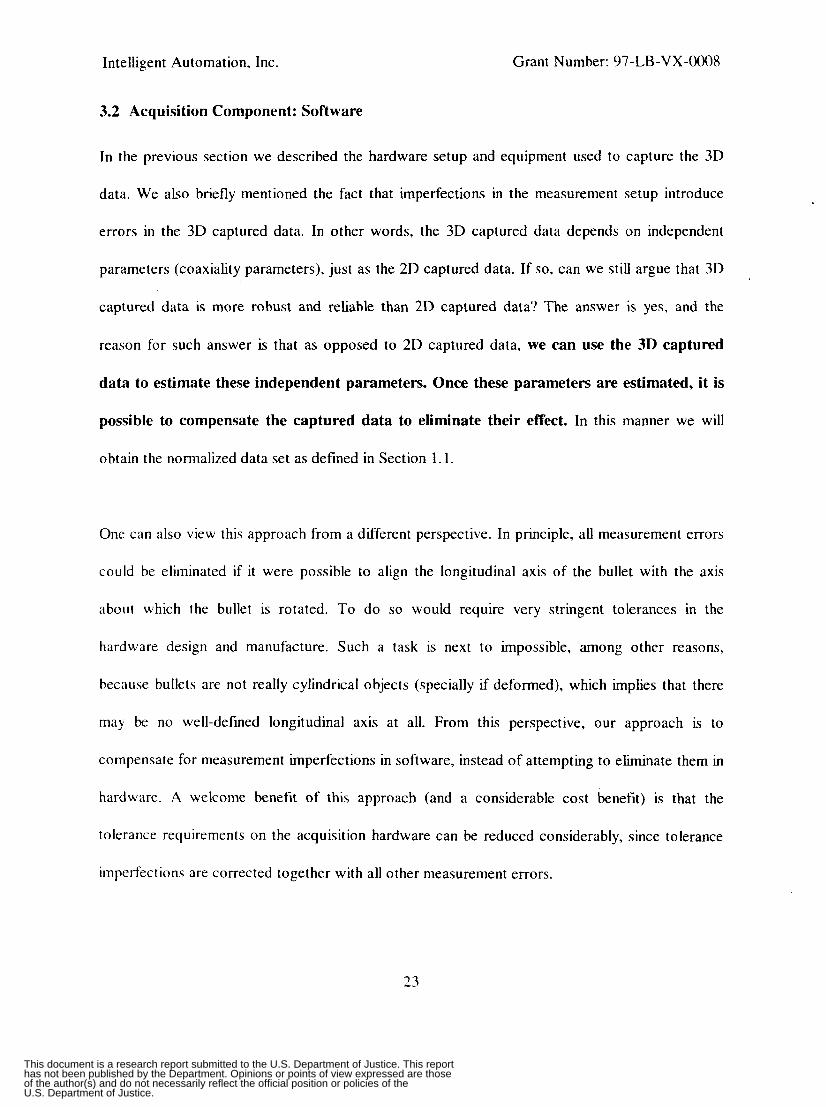
3.2 Acquisition Component: Software
In the previous section we described the hardware setup and equipment used to capture the 3D
data. We also briefly mentioned the fact that imperfections in the measurement setup introduce
errors in the 3D captured data. In other words, the 3D captured data depends on independent
parameters (coaxiality parameters), just as the 2D captured data. If so, can we still argue that 3D
captured data is more robust and reliable than 2D captured data? The answer is yes, and the
reason for such answer is that as opposed to 2D captured data, we can use the 3D captured
data to estimate these independent parameters. Once these parameters are estimated, it is
possible to compensate the captured data to eliminate their effect. In this manner we will
obtain the normalized data set as defined in Section 1.1.
One can also view this approach from a different perspective. In principle, all measurement errors
could be eliminated if it were possible to align the longitudinal axis of the bullet with the axis
about which the bullet is rotated. To do so would require very stringent tolerances in the
hardware design and manufacture. Such a task is next to impossible, among other reasons,
because bullets are not really cylindrical objects (specially if deformed), which implies that there
may be no well-defined longitudinal axis at all. From this perspective, our approach is to
compensate for measurement imperfections in software, instead of attempting to eliminate them in
hardware. A welcome benefit of this approach (and a considerable cost benefit) is that the
tolerance requirements on the acquisition hardware can be reduced considerably, since tolerance
imperfections are corrected together with all other measurement errors.
23
This document is a research report submitted to the U.S. Department of Justice. This reporthas not been published by the Department. Opinions or points of view expressed are thoseof the author(s) and do not necessarily reflect the official position or policies of theU.S. Department of Justice.
Intelligent Automation, Inc. Grant Number: 97-LB-VX-0008
Bullet
Deformed Spin Cup \ System I system I
3 y s Lt: I I I u System ii Exhibit 14: Schematic Description of Different Reference Frames
positioned for measurement. The final transformation between the Spin Cup System and the
Sensor System corresponds to the transformation associated with the data capture process. We
denote the data in the Sensor System by (e.[i],s.(e.[i])), where for each angular position e . [ i ] 1 1 1 1
we assign a magnitude s. (e. [i]) . This data corresponds to the digitized data as defined in Section 1 1
1 . 1 , and this is the data available for analysis (see Exhibit 13).
The main objective of identlfying the coaxiality parameters is to enable us to retrieve the true
bullet data (&,[ill r(@,[i])), based on our knowledge of the measurement setup, our knowledge of
the coaxiality parameters, and the captured data ( 0 . [ i ] , s . ( € I . [ i ] ) ) . We are interested in the true I l l
bullet data (e,[i],r(e,[i])) because this data amounts to the striations on the bullet’s surface in
their true magnitude and scale. The true bullet data (8, i],r(e,[i])) corresponds to the normalized
data as defined in Section 1 . 1 .
25
This document is a research report submitted to the U.S. Department of Justice. This reporthas not been published by the Department. Opinions or points of view expressed are thoseof the author(s) and do not necessarily reflect the official position or policies of theU.S. Department of Justice.

Intelligent Automation; Inc. Grant Number: 97-LB-VX-0008
As already mentioned, the estimation of the coaxiaiity parameters is based on the solution of a
least-squares estimation problem. We can formulate this problem based on at least two different
approaches, which we have called the Forward Transformation approach and the Inverse
Transformation Approach. As will be detailed in the following, in the Forward Transformation
Approach the least-squares problem is formulated in the Sensor System, while in the Inverse
Transformation Approach the least-squares problem is formulated in the Bullet System. It should
be clear that we could also pick some "intermediate point" in the transformation to formulate the
least-square problem. We discuss both approaches, and point out the advantages of the inverse
approach with respect to the forward approach.
3.2.1.1 Forward Transformation Approach
In this approach, the least-squares problem is formulated as the solution of the following
opt imization problem:
mjn CF ( 7 s ) P
Where the cost function CF ( p ) is defined by:
Thc vector 7 corresponds to the coaxiality parameters, the vector F.(e.[i]) is the result of 1 1
forward-transforming a cylinder of radius r according to the assumed values of the coaxiality
parmicters. and s. ( 6 . [ i ] ) is the portion of the captured data describing the surface defined by the 1 1
land impressions. The difficulty in this approach is that we need to compute the forward
transformation at the exact same phase angles at which we have data; in other words, at e . [ i ] . 1
26
This document is a research report submitted to the U.S. Department of Justice. This reporthas not been published by the Department. Opinions or points of view expressed are thoseof the author(s) and do not necessarily reflect the official position or policies of theU.S. Department of Justice.
Intelligent Automation, Inc. Grant Number: 97-LB-VX-0008
This would require a preliminary computation of the corresponding angles in the spin cup
reference frame, and this complicates the procedure. The following inverse approach is much
more convenient.
3.2.1.2 Inverse Transformation Approach
In this approach, the least-squares problem is formulated as the solution of the following
optimization problem:
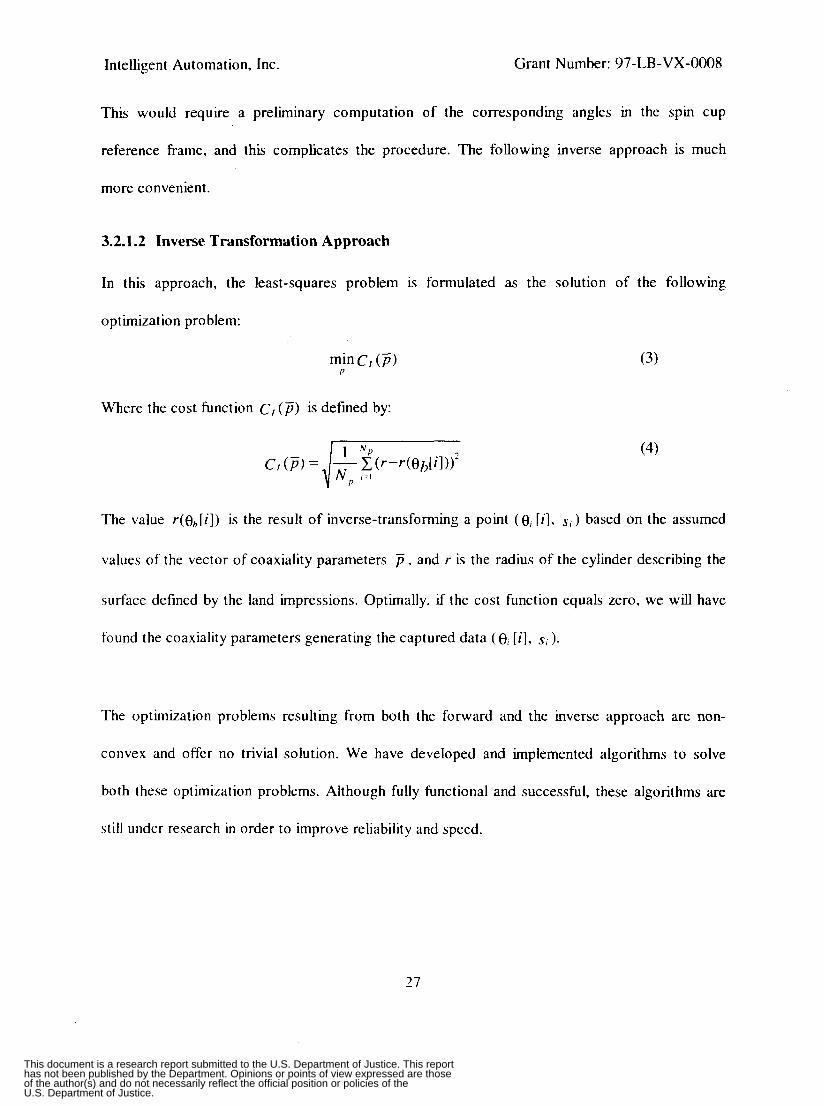
Where the cost function C / ( T i ) is defined by:
The value r(e,[i]) is the result of inverse-transfoming a point (e, [i], S, ) based on the assumed
values of the vector of coaxiality parameters p , and r is the radius of the cylinder describing the
surface defined by the land impressions. Optimally, if the cost function equals zero, we will have
found the coaxiality parameters generating the captured data (e, [i], S , ).
The optimization problems resulting from both the forward and the inverse approach are non-
convex and offer no trivial solution. We have developed and implemented algorithms to solve
both these optimization problems. Although fully functional and successful, these algorithms are
still under research in order to improve reliability and speed.
27
This document is a research report submitted to the U.S. Department of Justice. This reporthas not been published by the Department. Opinions or points of view expressed are thoseof the author(s) and do not necessarily reflect the official position or policies of theU.S. Department of Justice.

Intelligent Automation, Inc. Grant Number: 97-LB-VX-0008
3.2.2 Data Compensation Based on Estimated Coaxiali ty Errors:
Once the coaxiality parameters are estimated by solving either the Forward or Inverse least-square
problem, it is relatively straight-forward to use these parameters to compensate the captured data
(in fact, the digitized data). The compensated data becomes the normalized data as defined in
Section 1.1. We have developed and implemented the algorithms required to perform the
compensation. As a test of our parameter estimatiodcompensation programs, we performed a
consistency evaluation. The objective of the consistency evaluation was to assess the consistency
of the normalized data for a given bullet measured under different conditions. Such evaluation
would challenge all our acquisition procedures and algorithms.
In order to perform this evaluation, we positioned a bullet in the measurement setup, and acquired
data from 5 cross sections of the bullet on a lmm ring (i.e. each cross section measurement was
made 250 microns apart). The same bullet was then taken out of the measurement setup,
repositioned in the same setup, and a similar measurement was made. By taking the bullet out of
the setup and repositioning it, we inevitably modified the coaxiality parameters. In this manner we
had data from the same bullet measured under different conditions; i.e., the captured data was
distorted by different coaxiality parameters. We then proceeded to estimate the coaxiality
parameters associated with each of the two data sets, and we compensated each data set
according to their respective estimated coaxiality parameters.
Exhibit 15 shows the results of our evaluation. As can be seen, the normalized data from the two
independent measurements looks very consistent indicating that the coaxiality parameters were
reliably estimated, and that the data was accurately normalized. To get an idea of the magnitude
28
This document is a research report submitted to the U.S. Department of Justice. This reporthas not been published by the Department. Opinions or points of view expressed are thoseof the author(s) and do not necessarily reflect the official position or policies of theU.S. Department of Justice.
Intelligent Automation, Inc. Grant Number: 97-LB-VX-0008
-- .
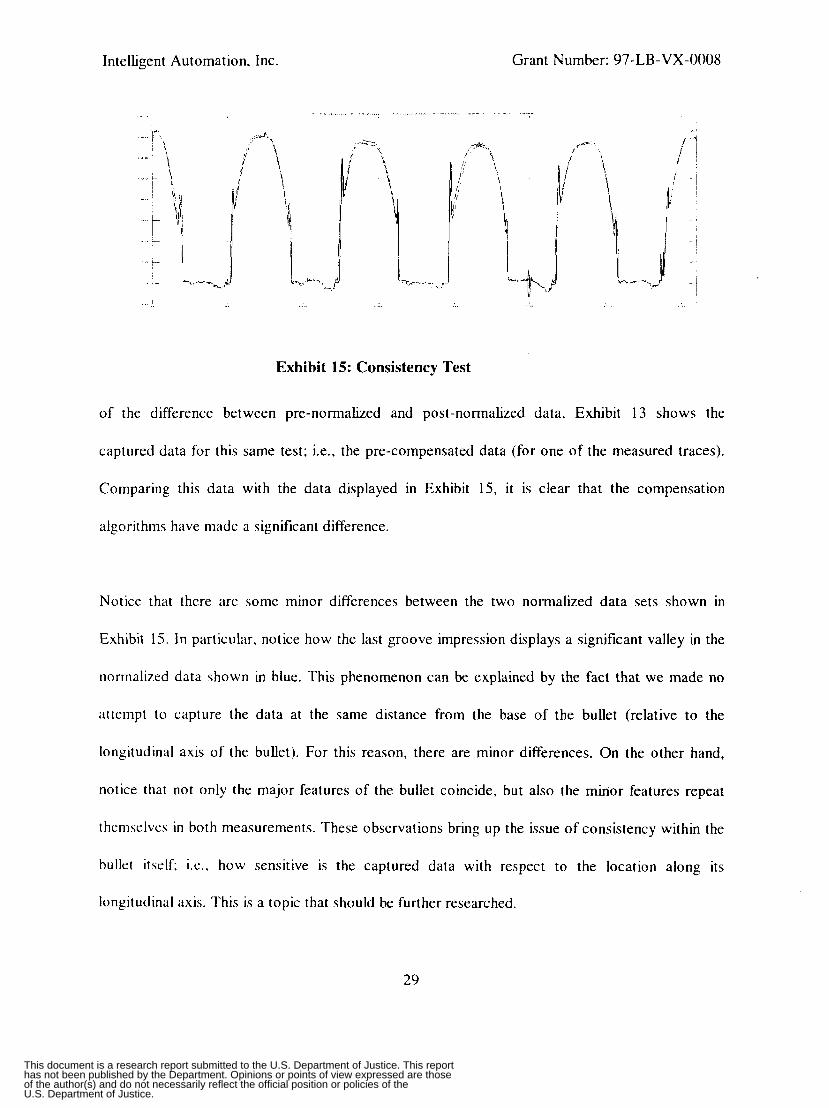
Exhibit 15: Consistency Test
of the difference between pre-normalized and post-normalized data, Exhibit 13 shows the
captured data for this same test; i.e., the pre-compensated data (for one of the measured traces).
Comparing this data with the data displayed in Exhibit 15, it is clear that the compensation
algorithms have made a significant difference.
Notice that there are some minor differences between the two normalized data sets shown in
Exhibit 15. In particular, notice how the last groove impression displays a significant valley in the
normalized data shown in blue. This phenomenon can be explained by the fact that we made no
attempt to capture the data at the same distance from the base of the bullet (relative to the
longitudinal axis of the bullet). For this reason, there are minor differences. On the other hand,
notice that not only the major features of the bullet coincide, but also the minor features repeat
themselves in both measurements. These observations bring up the issue of consistency within the
bullet itself; i.e., how sensitive is the captured data with respect to the location along its
longitudinal axis. This is a topic that should be further researched.
29
This document is a research report submitted to the U.S. Department of Justice. This reporthas not been published by the Department. Opinions or points of view expressed are thoseof the author(s) and do not necessarily reflect the official position or policies of theU.S. Department of Justice.

Intelligent Automation, Inc. Grant Number: 97-LB-VX-0008
The importance of an accurate compensation in the normalization process cannot be sufficiently
emphasized. The effect of the coaxiality errors manifests itself not only in the form of a vertical
displacement of the data, but it also produces a deformation along the horizontal axis
(shrinkinglstretching). Accurate compensation of the captured data is essential for the satisfactory
performance of the correlation algorithms. It is for this reason that we take the trouble of
estimating and compensating for the coaxiality parameters as opposed to simply filtering out their
effects. The simpler idea of high pass filtering the captured data (to e l i n a t e the predominantly
low frequency coaxiality errors) would not compensate in any way the deformation of the bullet
along the horizontal axis (shrinking/stretching).
3.3 Correlation Component
So far we have shown the feasibility of making reliable measures and obtaining consistent data
from a bullet's surface. The question remains as to whether this information can be used to
enhance the performance of existing ballistic analysis systems. To this effect, we developed a
preliminary version of a correlation component. This software is still under development, but
preliminary results have been extremely encouraging. At its core, the correlation component
receives as an input the normalized data of two bullets (say for bullets a and b) , and returns as an
output the relative orientation at which these two bullets are most similar, and a similarity
measure (denoted s(a,b) ). The similarity measure is a function of different correlation values
obtained from the data of the bullets under comparison. It was this software that was used to align
the two signatures shown in Exhibit 15.
30
This document is a research report submitted to the U.S. Department of Justice. This reporthas not been published by the Department. Opinions or points of view expressed are thoseof the author(s) and do not necessarily reflect the official position or policies of theU.S. Department of Justice.
Intelligent Automation, Inc. Grant Number: 97-LB-VX-0008
I - . ,"I _ " ."" - , ,
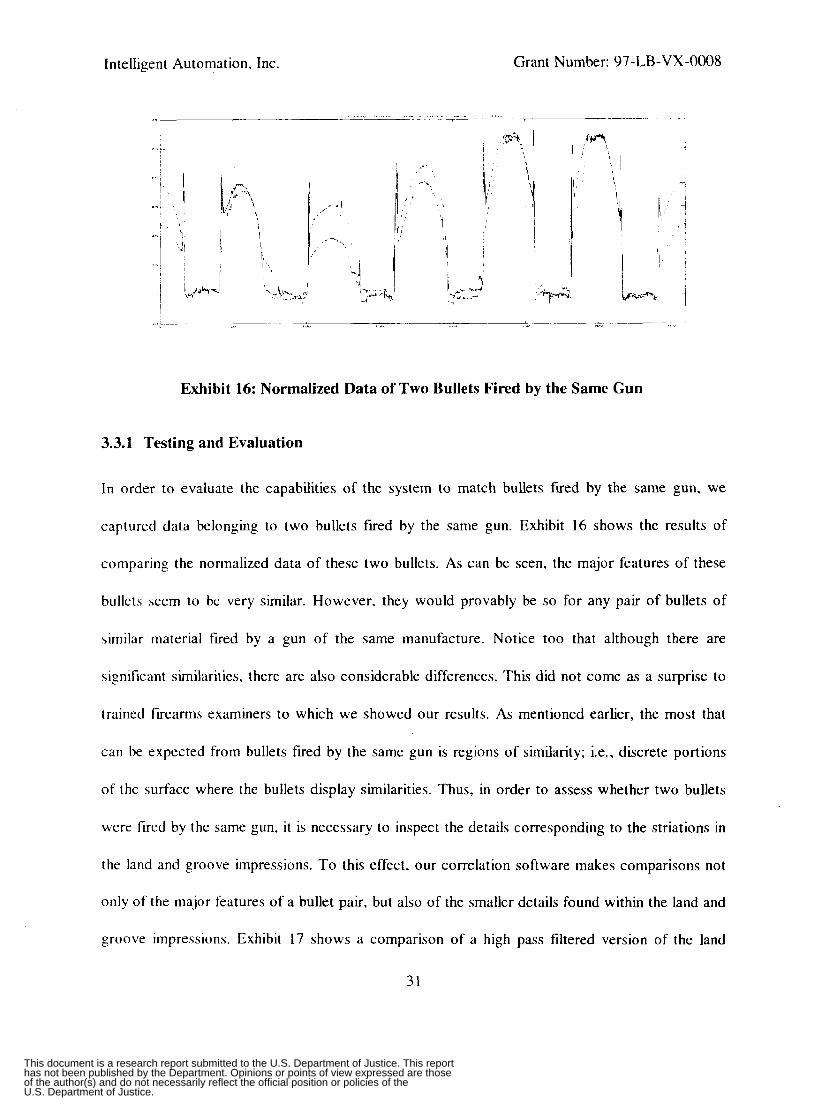
Exhibit 16: Normalized Data of Two Bullets Fired by the Same Gun
3.3.1 Testing and Evaluation
In order to evaluate the capabilities of the system to match bullets fired by the same gun, we
captured data belonging to two bullets fired by the same gun. Exhibit 16 shows the results of
comparing the normalized data of these two bullets. As can be seen, the major features of these
bullets seem to be very similar. However, they would provably be so for any pair of bullets of
similar material fired by a gun of the same manufacture. Notice too that although there are
significant similarities, there are also considerable differences. This did not come as a surprise to
trained firearms examiners to which we showed our results. As mentioned earlier, the most that
can be expected from bullets fired by the same gun is regions of similarity; i.e., discrete portions
of the surface where the bullets display similarities. Thus, in order to assess whether two bullets
were fired by the same gun. it is necessary to inspect the details corresponding to the striations in
the land and groove impressions. To this effect, our correlation software makes comparisons not
only of the major features of a bullet pair, but also of the smaller details found within the land and
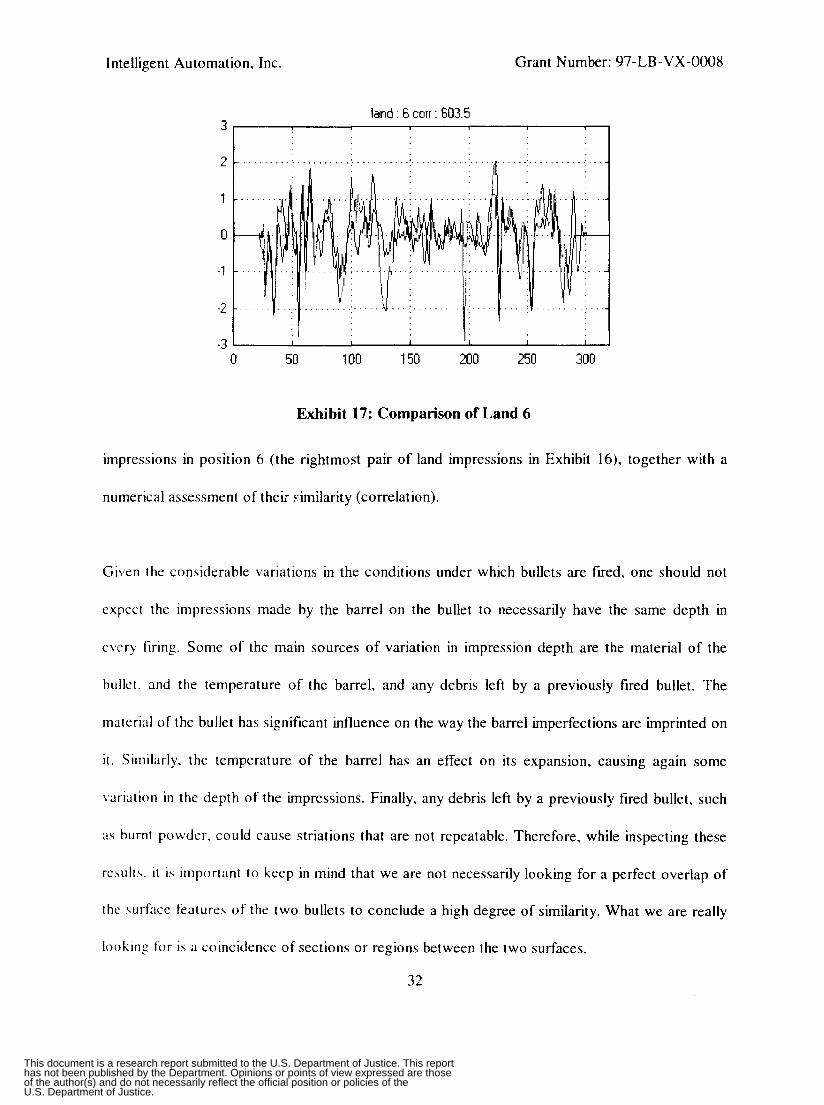
groove impressions. Exhibit 17 shows a comparison of a high pass filtered version of the land
31
This document is a research report submitted to the U.S. Department of Justice. This reporthas not been published by the Department. Opinions or points of view expressed are thoseof the author(s) and do not necessarily reflect the official position or policies of theU.S. Department of Justice.
Intelligent Automation. Inc. Grant Number: 97-LB-VX-0008
land : 6 coir : 603.5 ? i J 2 I . . . . . . . . . . . . . . . . . . . . . . . . . . . . . . . . . . . . . . . . . . . . . . . . . . . . . . . . . . . . . . . . . . . . . : . . .
I I I I I
0 50 100 150 200 250 300
Exhibit 17: Comparison of Land 6
impressions in position 6 (the rightmost pair of land impressions in Exhibit 16), together with a
numerical assessment of theii ~imilarity (correlation).
Given the considerable variations in the conditions under which bullets are fired, one should not
expect the impressions made by the barrel on the bullet to necessarily have the same depth in
every tiring. Some of the main sources of variation in impression depth are the material of the
bullet. and the temperature of the barrel, and any debris left by a previously fired bullet. The
material of the bullet has significant influence on the way the barrel imperfections are imprinted on
i t . Similarly, the temperature of the barrel has an effect on its expansion, causing again some
:.ariation in the depth of the impressions. Finally, any debris left by a previously fired bullet, such
as hurnt powder. could cause striations that are not repeatable. Therefore, while inspecting these
result.$. i t is important to keep in mind that we are not necessarily looking for a perfect overlap of
the surface features of the two bullets to conclude a high degree of similarity. What we are really
looking lor is a coincidence of sections or regions between the two surfaces.
32
This document is a research report submitted to the U.S. Department of Justice. This reporthas not been published by the Department. Opinions or points of view expressed are thoseof the author(s) and do not necessarily reflect the official position or policies of theU.S. Department of Justice.
Intelligent Automation, Inc. Grant Number: 97-LB-VX-0008
groove 6 coir 537 4 3 , 1 1 I I I I I
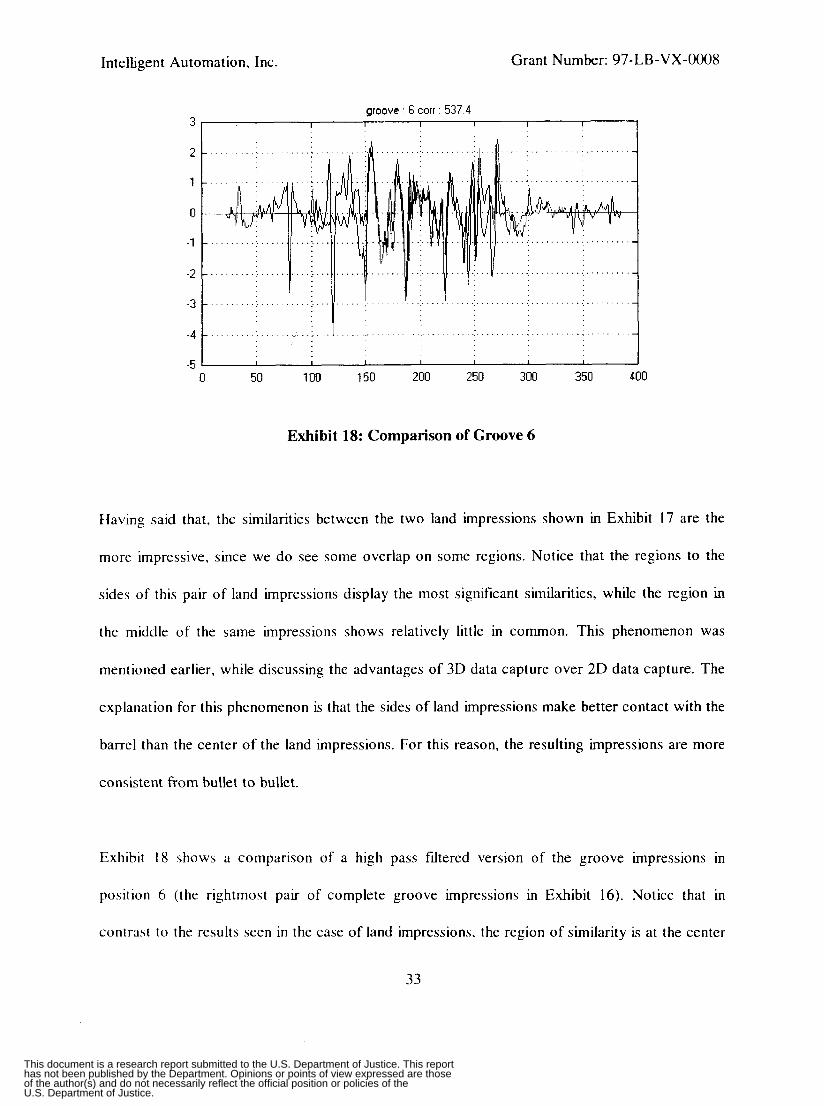
Exhibit 18: Comparison of Groove 6
Having said that, the similarities between the two land impressions shown in Exhibit 17 are the
more impressive, since we do see some overlap on some regions. Notice that the regions to the
sides of this pair of land impressions display the most significant similarities, while the region in
the middle of the same impressions shows relatively little in common. This phenomenon was
mentioned earlier, while discussing the advantages of 3D data capture over 2D data capture. The
explanation for this phenomenon is that the sides of land impressions make better contact with the
barrel than the center of the land impressions. For this reason, the resulting impressions are more
consistent from bullet to bullet.
Exhibit 18 shows a comparison of a high pass filtered version of the groove impressions in
position 6 (the rightmost pair of complete groove impressions in Exhibit 16). Notice that in
contrast to the results seen in the case of land impressions, the region of similarity is at the center
33
This document is a research report submitted to the U.S. Department of Justice. This reporthas not been published by the Department. Opinions or points of view expressed are thoseof the author(s) and do not necessarily reflect the official position or policies of theU.S. Department of Justice.
Intelligent Automation, Inc. Grant Number: 97-LB-VX-0008
of the groove impressions. Notice too that there is considerable overlap between the two
normalized sets. The phenomenon that explains these results is the fact that the center of the
groove impressions makes better contact with the gun’s barrel. just as the sides of the land
impressions. This phenomenon can be easily seen in Exhibit 16. Notice how the groove
impressions have an almost rounded shape. It can easily be seen that mostly the middle region of
the groove impressions display striations consistent with having contacted the barrel. The rounded
sections, which do not seem to have been in contact with the barrel, do not contain consistent
striations. Moreover, notice that some of the groove impressions do not show any signs of having
contacted the barrel at all.
Based on conversations with firearms examiners, it seems that groove impressions are often
ignored in the comparison of bullets, or are often given secondary importance compared to land
impressions. A possible explanation is that, as discussed in the previous paragraph, groove
impressions do not always make contact with the barrel’s surface, and thus may have no
consistent striations. Although this phenomenon has been understood for a long time, the
development of a 3D acquisition component has enabled for the first time to observe and quantify
this phenomenon. Moreover, as seen in Exhibit 16, the information obtained with this new
methodology allows the examiner to detect which groove impressions contain significant
information and which do not. I t has been our experience that groove impressions often contain
extremely valuable data, and it is our assessment that the potential for improvement of existing
search and retrieve systems by incorporating groove impression’s data is very significant.
34
This document is a research report submitted to the U.S. Department of Justice. This reporthas not been published by the Department. Opinions or points of view expressed are thoseof the author(s) and do not necessarily reflect the official position or policies of theU.S. Department of Justice.

Intelligent Automation, Inc. Grant Number: 97-LB-VX-0008
The ultimate objective of this project was to determine whether 3D information from a bullet’s
surface can be successfully exploited to improve the matching rate of existing automated search
and retrieval systems. To achieve this objective, we developed and implement all the elements of
both an acquisition and a correlation component as described in Section 1.1. So far, we have
described the results of our research in mostly qualitative terms. These results within themselves
show that the application of 3D techniques has considerable potential in the ballistics analysis
arena. However, in order to evaluate the feasibility of improving existing automated search and
retrieval systems it is important to make some quantitative evaluations of the system’s
performance. The complete automated search and retrieval system was tested through 2 types of
independent evaluations: a discrimination evaluation and an identification evaluation. Following is
a discussion of the results of these evaluations.
4.1 Discrimination:
Thix evaluation involved bullets fued by three different guns whose barrels were manufactured
consecutively. The challenge to the system was to group the different bullets correctly. The fact
that the bullets used for this evaluation originated from guns with consecutively manufactured
barrels implies that the impressions on these bullets were quite similar. Thus, this evaluation not
only tests whether the system is capable of identifying similar bullets, but due to the similarities
between consecutively manufactured barrels, it also tests whether it can discriminate a true match
from 3 very close false match. This set of bullets was used to “tune” the many parameters in the
numerical algorithms of the system.
35
This document is a research report submitted to the U.S. Department of Justice. This reporthas not been published by the Department. Opinions or points of view expressed are thoseof the author(s) and do not necessarily reflect the official position or policies of theU.S. Department of Justice.
Intelligent Automation, Inc. Grant Number: 97-LB-VX-0008
Gun 2 22.7
Gun 3 r-30 30.86 24.50 27.24 24.76 100.0( 27.96 23.6
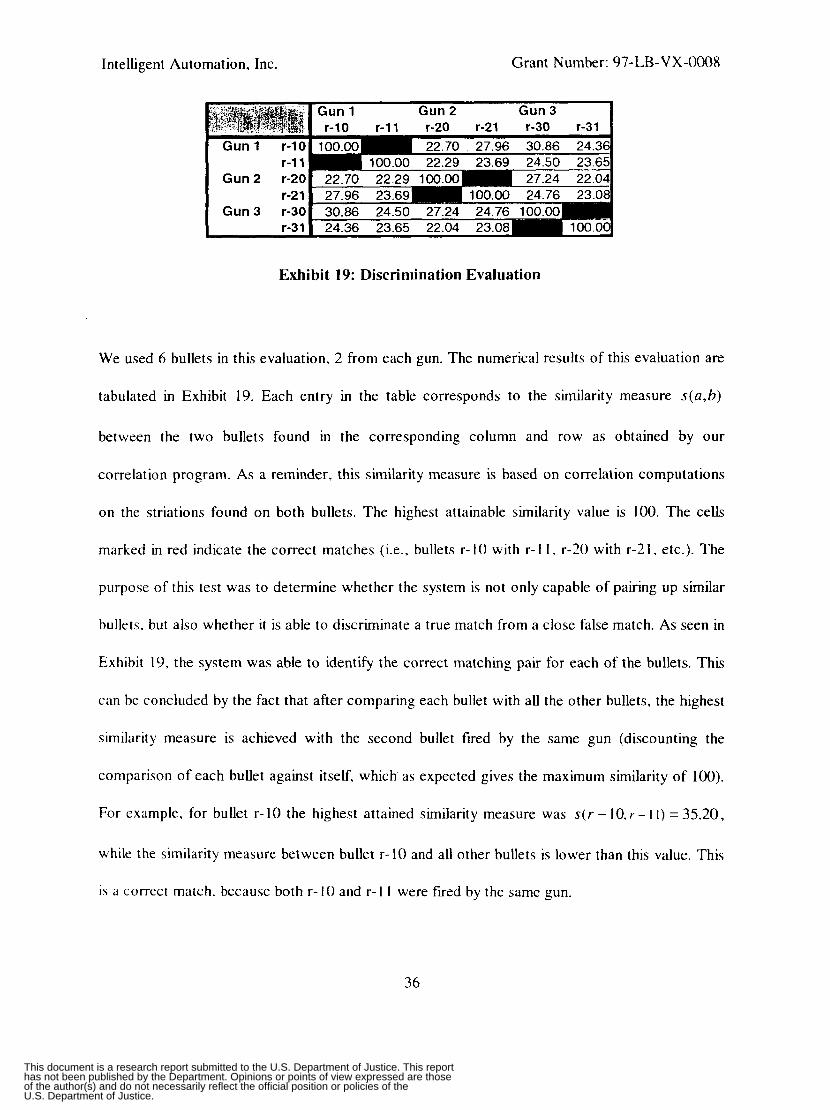
Exhibit 19: Discrimination Evaluation
We used 6 bullets in this evaluation, 2 from each gun. The numerical results of this evaluation are
tabulated in Exhibit 19. Each entry in the table corresponds to the similarity measure s(a,b)
between the two bullets found in the corresponding column and row as obtained by our
correlation program. As a reminder, this similarity measure is based on correlation computations
on the striations found on both bullets. The highest attainable similarity value is 100. The cells
marked in red indicate the correct matches (i.e., bullets r- 10 with r- I 1 , r-20 with r-2 I , etc.). The
purpose of this test was to determine whether the system is not only capable of pairing up similar
bullets. but also whether it is able to discriminate a true match from a close false match. As seen in
Exhibit 19, the system was able to identify the correct matching pair for each of the bullets. This
can be concluded by the fact that after comparing each bullet with all the other bullets, the highest
similarity measure is achieved with the second bullet fired by the same gun (discounting the
comparison of each bullet against itself, which as expected gives the maximum similarity of 100).
For example, for bullet r-10 the highest attained similarity measure was s (r - IO. r - I I ) = 35.20,
while the similarity measure between bullet r-10 and all other bullets is lower than this value. This
is a correct match, because both r- IO and r- 1 I were fired by the same gun.
36
This document is a research report submitted to the U.S. Department of Justice. This reporthas not been published by the Department. Opinions or points of view expressed are thoseof the author(s) and do not necessarily reflect the official position or policies of theU.S. Department of Justice.
Intelligent Automation, Inc. Grant Number: 97-LB-VX-0008
Consecutively Manufactured Barrels
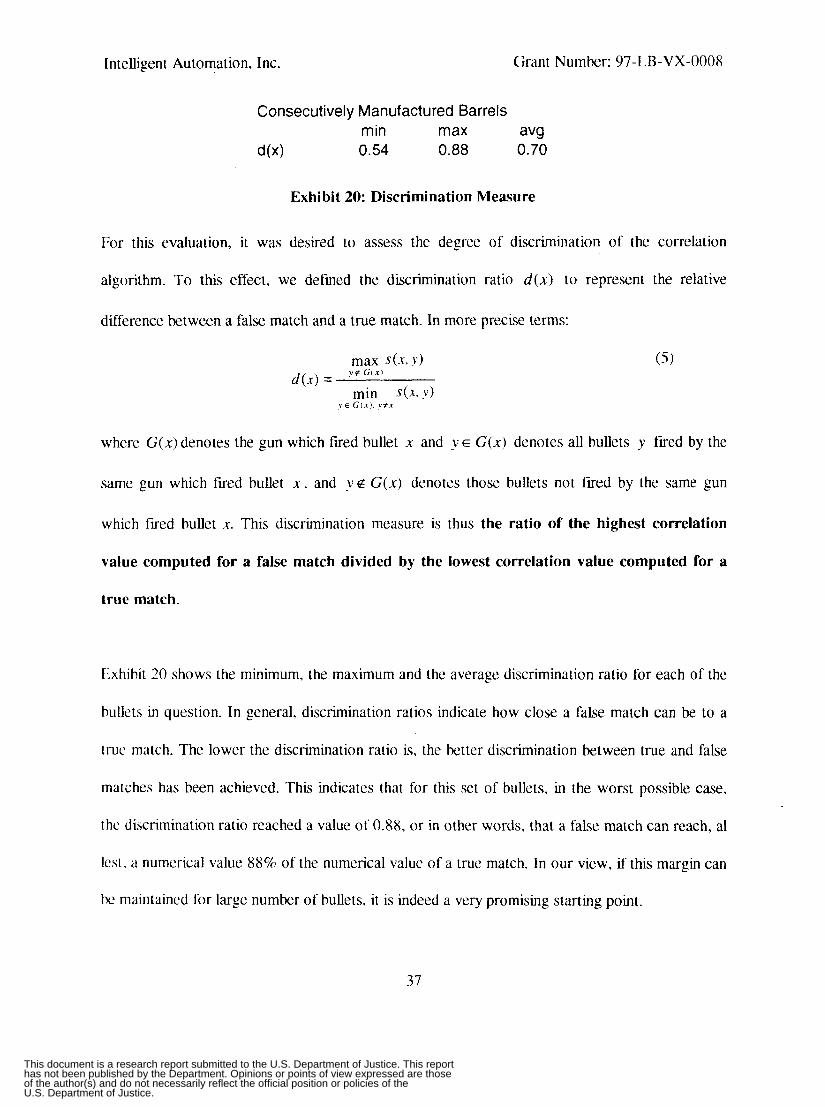
do0 0.54 0.88 0.70 m in m ax avg
Exhibit 20: Discrimination Measure
For this evaluation, it was desired to assess the degree of discrimination of the correlation
algorithm. To this effect, we defined the discrimination ratio d ( x ) to represent the relative
difference between a false match and a true match. In more precise terms:
where G(x) denotes the gun which fired bullet x and ,y E G(x) denotes all bullets y fired by the
same gun which fired bullet x , and ,ye G(x) denotes those bullets not fired by the same gun
which fired bullet x. This discrimination measure is thus the ratio of the highest correlation
value computed for a false match divided by the lowest correlation value computed for a
true match.
Lxhibit 20 shows the minimum, the maximum and the average discrimination ratio for each of the
bullets in question. In general, discrimination ratios indicate how close a false match can be to a
true match. The lower the discrimination ratio is, the better discrimination between true and fake
matches has been achieved. This indicates that for this set of bullets, in the worst possible case,
the discrimination ratio reached a value of 0.88, or in other words, that a false match can reach, a1
Icst. a numerical value 88% of the numerical value of a true match. In our view, if this margin can
be maintained for large number of bullets, it is indeed a very promising starting point.
37
This document is a research report submitted to the U.S. Department of Justice. This reporthas not been published by the Department. Opinions or points of view expressed are thoseof the author(s) and do not necessarily reflect the official position or policies of theU.S. Department of Justice.
Intelligent Automation, Inc. Grant Number: 97-LB-VX-0008
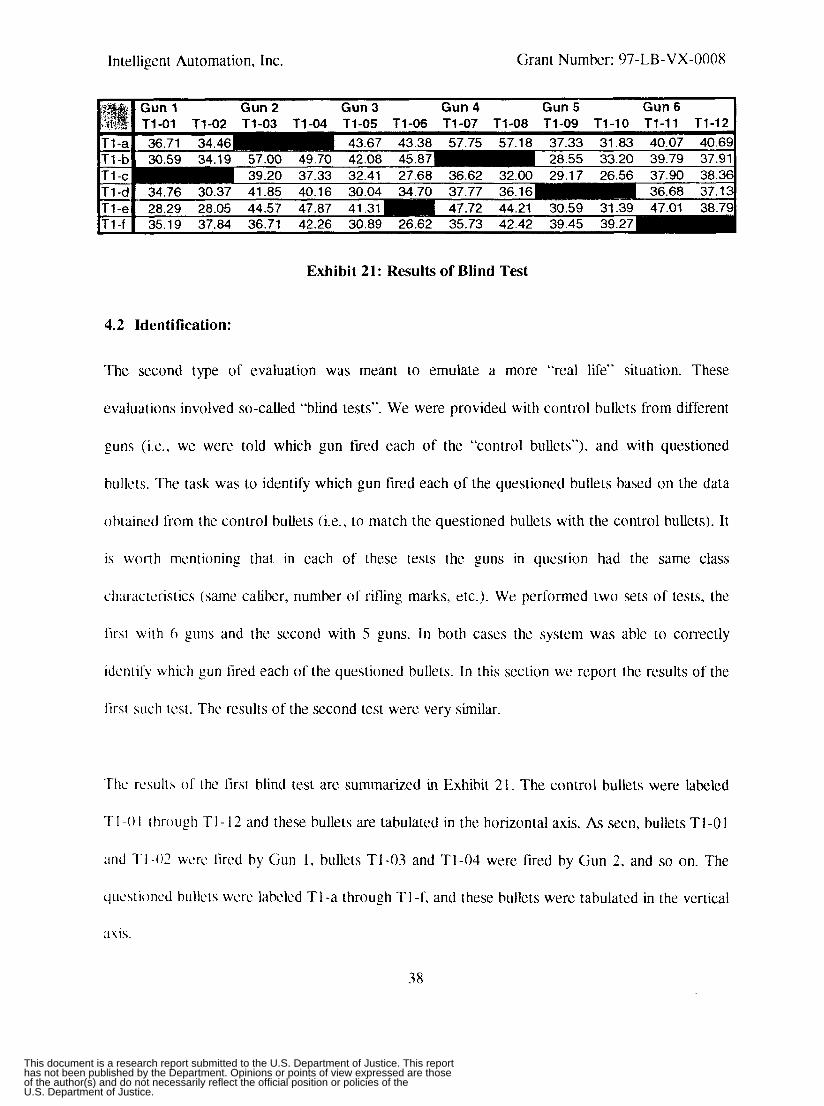
Exhibit 21: Results of Blind Test
4.2 Identification:
The second type of evaluation was meant to emulate a more “real life” situation. These
evaluations involved so-called “blind tests”. We were provided with control bullets from different
guns (i.e., we were told which gun tired each of the “control bullets”). and with questioned
bullets. The task was to identify which gun fired each of the questioned bullets based on the data
obtained lrom the control bullets (i.e., to match the questioned bullets with the control bullets). It
is wonh mentioning that in each of these tests the guns in question had the s m e class
characteristics (same caliber, number of rifling marks, etc.). We performed two sets of tests, the
iirsi wiih 6 guns and the second with 5 guns. In both cases the system was able to correctly
idcntily which gun fired each of the questioned bullets. In this section we report the results of the
tirst such test. The results of the second test were very similar.
Thc rcsults o f the first blind test are summariied in Exhibit 21. The control butlets were labeled
TI -0 1 through TI- 12 and these bullets are tabulated in the horizontal axis. As seen, bullets T1-01
m d TI -02 werc [ired by Gun 1 , bullets TI-03 and T1-04 were fired by Gun 2 , and so on. The
qucstioncd hullcis were labeled T1-a through T1-f, and these bullets were tabulated in the vertical
3x1s.
38
This document is a research report submitted to the U.S. Department of Justice. This reporthas not been published by the Department. Opinions or points of view expressed are thoseof the author(s) and do not necessarily reflect the official position or policies of theU.S. Department of Justice.
Intelligent Automation, Inc. Grant Number: 97-1,B-VX-OOOX
For all questioned bullets except TI-e, the entries marked in red correspond to the two control
bullets for which the correlation algorithm computed the highest similarity measure. As can be
seen, for all these bullets the highest similarity measures were always obtained when compared
with control bullets corresponding to the same weapon. It was thus assessed that these bullets
were most likely to have been fired by such weapon (for example, T 1 -a was linked to Gun 2, T 1 -b
was linked to Gun 4, etc.). At already mentioned, bullet T1-e was an exception. because the first
and second highest scores did not correspond to the same gun. Nevertheless. we assessed that this
T1-e should be paired with the gun whose control bullet gave the highest similarity measure, i.e.,
Gun 3 . The reasoning behind such decision was based on the fact that bullets T1-OS and T1-06
were not very similar between themselves either (s(r1- 05,TI- 06) = 44.03 ). Thus, we concluded
that although bullets T1-05, T1-06, and TI-e were fired by the same gun, bullet T1-05 was for
some reason somewhat different than T1-06 and T1-e. When, after making our assessment, we
verified our results with the firearms examiners who provided the bullets, they confirmed that we
had correctly paired all the questioned bullets with their respective guns, including bullet TI -e.
gun. since
( s (T1 - 05.7
It should be said that we learned a considerable amount from questioned bullet T1-e. The main
lesson was that even two bullets fired by the same gun can be considerably different. As already
mentioned, when we compared bullets T1-OS against T1-06 (which we knew came from the same
hey were both control bullets) we obtained a surprisingly low similarity measure
- 06) = 44.03 ). Upon commenting our experience with the firearms examiners who
provided us the bullets, they confirmed that this is not an uncommon occurrence. Based on their
experience, it is not uncommon to obtain rather different looking bullets form the same gun. The
39
This document is a research report submitted to the U.S. Department of Justice. This reporthas not been published by the Department. Opinions or points of view expressed are thoseof the author(s) and do not necessarily reflect the official position or policies of theU.S. Department of Justice.
Intelligent Automation, Inc. Grant Number: 97-I,B-VX-0008
importance of this result cannot be sufficiently emphasized, since it implies that multiple bullets
should always be used when trying to confirm whether a questioned bullet was fired by suspect
gun.
As a result of our experience with the described evaluation, we were prompted to consider the
case when more than one control bullet is available to the examiner. In many cases (very often
when used as evidence in court) the firearms examiner is not required to determine whether two
bullets were fired by the same gun, but whether a questioned bullet was fired by a suspect gun. If
one assumes that the suspect gun is available (which is very often the case whenever ballistic
evidence is presented in court), the possibility of multiple control bullets should k considered.
For this reason, it is relevant to define a measure of similarity between a bullet and a gun, as
opposed to between two bullets. This similarity measure would rely on the availability of more
than one control bullet. Given a questioned bullet x and a gun G, we define the similarity measures
s , , , (~ .G) and s ~ ~ ~ ~ ( x , G ) as follows:
Sovg b , G ) = avg s(x, y ) ~ E G . v t r
( 7 )
where y E G denotes all bullets y fired by gun G. Thus, savg (x,G) corresponds to an averaged
mcasurc o f similarity between bullet x and all bullets fired by gun G (except itself, i f x was fired by
G). while SPeak(x.G) corresponds to the highest similarity measure between bullet x and all
bullets lircd by gun G (except itself, i f x was fired by G). These two similarity measures are a
40
This document is a research report submitted to the U.S. Department of Justice. This reporthas not been published by the Department. Opinions or points of view expressed are thoseof the author(s) and do not necessarily reflect the official position or policies of theU.S. Department of Justice.
Intelligent Automation, Inc. Grant Number: 97-I,B-VX-0008
pi' Gun 1 Gun 2 Gun 3 Gun 4 Gun 5 Gun 6 '6% I 01-02 03-04 05-06 07-08 09-10 11-12
'& Gun1 Gun2 Gun3 Gun4 Gun5 Gun6 01-02 03-04 05-06 07-08 0410 11-121
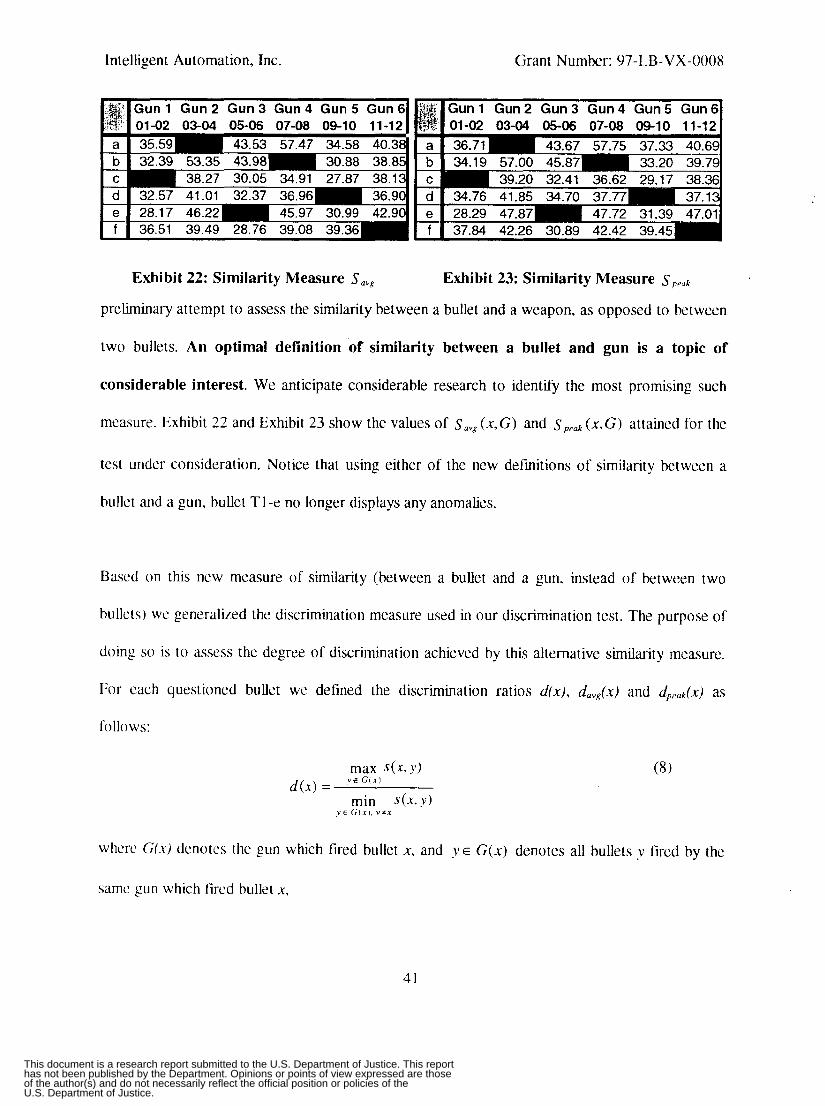
Exhibit 22: Similarity Measure Savg Exhibit 23: Similarity Measure SpCok
preliminary attempt to assess the similarity between a bullet and a weapon, as opposed to between
two bullets. An optimal definition of similarity between a bullet and gun is a topic of
considerable interest. We anticipate considerable research to identify the most promising such
measure. Exhibit 22 and Exhibit 23 show the values of Sayg (x,G) and speak ( x . G ) attained for the
test under consideration. Notice that using either of the new definitions of similarity between a
bullet and a gun, bullet TI -e no longer displays any anomalies.
Based on this new measure of similarity (between a bullet and a gun, instead of between two
bullets) we generali~ed the discrimination measure used in our discrimination test. The purpose of
doing so is to assess the degree of discrimination achieved by this alternative similarity measure.
For each questioned bullet we defined the discrimination ratios d f x ) , dnvg(x) and dppak(X) as
follows:
where Gf.r) denotes the gun which fired bullet x, and Y E G(x ) denotes all bullets y fired by the
samc gun which fired bullet x,
41
This document is a research report submitted to the U.S. Department of Justice. This reporthas not been published by the Department. Opinions or points of view expressed are thoseof the author(s) and do not necessarily reflect the official position or policies of theU.S. Department of Justice.
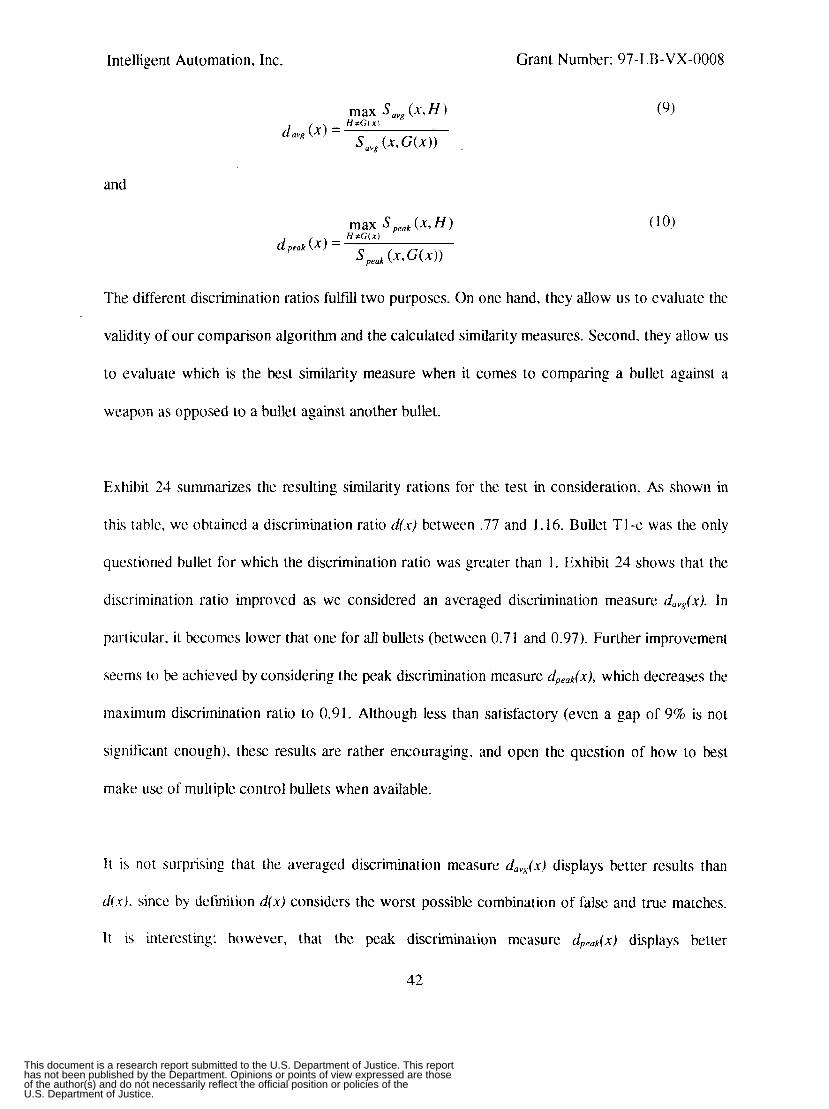
Intelligent Automation, Inc.
and
Grant Number: 97-LB-VX-0008
(9)
The different discrimination ratios fulfii two purposes. On one hand, they allow us to evaluate the
validity of our comparison algorithm and the calculated similarity measures. Second, they allow us
to evaluate which is the best similarity measure when it comes to comparing a bullet against a
weapon as opposed to a bullet against another bullet.
Exhibit 24 summarizes the resulting similarity rations for the test in consideration. As shown in
this table, we obtained a discrimination ratio d(x) between .77 and 1.16. Bullet TI-e was the only
questioned bullet for which the discrimination ratio was greater than 1. Exhibit 24 shows that the
discrimination ratio improved as we considered an averaged discrimination measure d,,(x). In
particular. it becomes lower that one for all bullets (between 0.71 and 0.97). Further improvement
seems to be achieved by considering the peak discrimination measure dpeak(x), which decreases the
maximum discrimination ratio to 0.91. Although less than satisfactory (even a gap of 9% is not
significant enough), these results are rather encouraging, and open the question of how to best
make use of multiple control bullets when available.
I t is not surprising that the averaged discrimination measure d,,,(x) displays better results than
&x). since by definition d(x) considers the worst possible combination of false and true matches.
I t is interesting: however, that the peak discrimination measure dp,,k(x) displays better
42
This document is a research report submitted to the U.S. Department of Justice. This reporthas not been published by the Department. Opinions or points of view expressed are thoseof the author(s) and do not necessarily reflect the official position or policies of theU.S. Department of Justice.
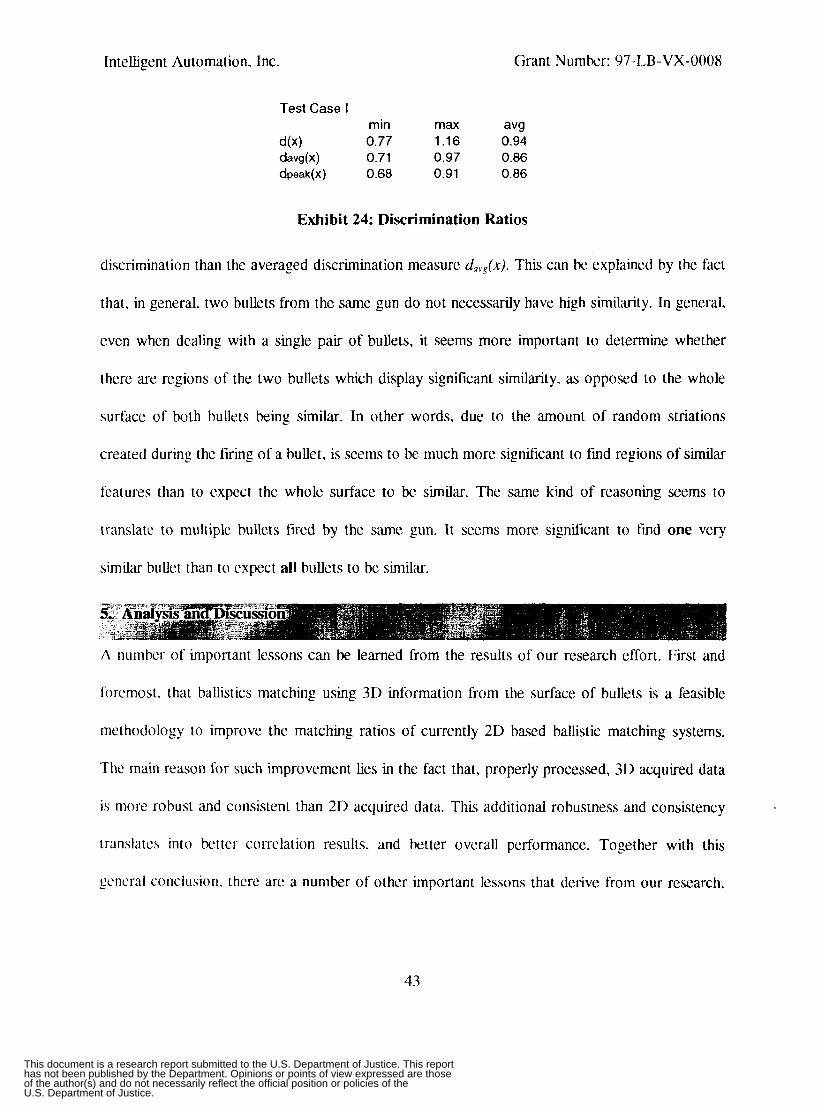
Intelligent Automation, Inc. Grant Number: 97-LB-VX-0008
Test Case I
d(x) 0.77 1.16 0.94 d3vg (x) 0.71 0.97 0.86 dpeak(x) 0.68 0.91 0.86
rnin max avg
Exhibit 24: Discrimination Ratios
discrimination than the averaged discrimination measure daVg(x). This can be explained by the fact
that, in general, two bullets from the same gun do not necessarily have high similarity. In general,
even when dealing with a single pair of bullets, it seems more important to determine whether
there are regions of the two bullets which display signifcant similarity, as opposed to the whole
surface of both bullets being similar. In other words, due to the amount of random striations
created during the firing of a bullet, is seems to be much more significant to find regions of similar
features than to expect the whole surface to be similar. The same kind of reasoning seems to
translate to multiple bullets fired by the same gun. It seems more significant to f i d one very
similar bullet than to expect all bullets to be similar.
A number of important lessons can be learned from the results of our research effort. First and
foremost, that ballistics matching using 3D information from the surface of bullets is a feasible
methodology to improve the matching ratios of currently 2D based ballistic matching systems.
The main reason for such improvement lies in the fact that, properly processed, 3D acquired data
is more robust and consistent than 2D acquired data. This additional robustness and consistency
translates into better correlation results, and better overall performance. Together with this
general conclusion, there are a number of other important lessons that derive from our research,
43
This document is a research report submitted to the U.S. Department of Justice. This reporthas not been published by the Department. Opinions or points of view expressed are thoseof the author(s) and do not necessarily reflect the official position or policies of theU.S. Department of Justice.
Intelligent Automation, Inc. Grant Number: 97-LB-VX-0008
and which might, in some cases, be of help to ballistic analysis in general, be it 2D based or 31)
based.
1) Careful processing of the acquired data is crucial for the successful comparison of bullet’s
surface information. In particular, it is critical to “normalize” the acquired data so that the
conditions under which the data was taken have as little as possible influence on the data used for
the actual comparison. In this fashion, the data used in the comparison does not depend on the
particular operator that entered the data, the particular piece of hardware used to obtain the data,
etc. This is another point where 3D methodologies have an upper hand over 2D methodologies,
because the parameters which influence the acquired data (coaxiality errors, in our discussion) can
be estimated and compensated for from 3D data, while the same is next to impossible to achieve
with 21) data.
2 ) I1 has been our experience that groove impressions often contain extremely valuable data, and
i r is o u r assessment that the potential for improvement of existing search and retrieval systems by
incorporating groove impression’s data is very significant.
3 ) An important conclusion of our research is that whenever possible (whenever a suspect gun is
availablc) it is very important to use multiple control bullets to compare against the evidence
hullct. The importance of this result cannot be sufficiently emphasized, since it implies that
muliiple hulluts should always be used when trying to c o n f m whether a questioned bullet was
l i d by suspcc~ gun.
44
This document is a research report submitted to the U.S. Department of Justice. This reporthas not been published by the Department. Opinions or points of view expressed are thoseof the author(s) and do not necessarily reflect the official position or policies of theU.S. Department of Justice.
Intelligent Automation. Inc. Grant Number: 97-LB-VX-0008
Based on our research, there is little doubt that ballistics matching using 3D information of a
bullet’s surface is a powerful tool to improve automated search and retrieval ballistics analysis
systems. Our research indicates that using the right measurement technology and processing
techniques, it is possible to obtain reliable and consistent normalized data of a bullet surface.
Moreover, the information found is often sufiicient to identify the gun by which a bullet has been
fired.
Our research focused on the bullet identification and matching problem, instead of the cartridge
cases matching problem. We did so not because we believe that a 3D imaging approach would not
work for cartridge matching, but because computer-aided identification and matching
methodologies are considerably more mature for cartridges cases than for bullets, and we felt it
would k more beneficial to focus in the harder problem. That computer-aided bullet matching is
more difficult than their cartridge counterparts is not surprising. To begin with, cartridges (when
available) are usually retrieved in better condition than bullets. Furthermore, the processes that
imprint a cartridge case are less “traumatic” than those that imprint a bullet. Finally, there are at
least four different independent markings that are used to identify cartridges (breach face
impression. pin impression, ejection marks and ejector mechanism impression), while there is only
one fundamental process that imprints a bullet.
Until now. the creation of a national database of firearms based on either cartridge cases or bullets
has been an elusive dream of the law enforcement community. In a recent New York Times
article, the creation of such a database is stated as a specific goal (with the corresponding
4s
This document is a research report submitted to the U.S. Department of Justice. This reporthas not been published by the Department. Opinions or points of view expressed are thoseof the author(s) and do not necessarily reflect the official position or policies of theU.S. Department of Justice.

Intelligent Automation, Inc. Grant Number: 97-LB-VX-0008
government support and funding) of the current administration [3] . Such database would be
created by having all gun manufacturers test fire each weapon before it is sold to the public. At
this stage, such database will be based on the use of cartridge cases as opposed to bullets. The
main reason for such choice is past performance. As already mentioned, so far there has been
considerable more success in the matching of cartridge cases as opposed to bullets. The reasons
for such poor performance by the current 2D systems have already been discussed.
On the other hand, cartridge cases are not always available at a crime scene. This is because
criminals are either becoming more sophisticated and are retrieving them, or because they are
using revolver-type weapons, which do not eject the cartridge case as the weapon is fired. Bullets,
on the other hand, are always left behind in a crime scene. For this reason, if at all possible, a
computerized system capable of successfully matching bullets as opposed to cartridge cases
would be much preferred for the creation of such database.
Alicr a demonstration of its capabilities, Frank J. Sauer, Program Manager of the
NIBIN/I>KUGFIRI~~, FBI Laboratory, and Robert W. Sibert, Chief Firearms and Toolmarks Unit,
I'BI Laboratory, expressed their believe that 3D based ballistic identification could improve bullet-
based automated ballistic analysis systems to the point of making it possible to establish a practical
national database of firearms based on bullet signatures. The implications of creating a bullet-
based database of firearms in addition to a cartridge case-based database would be significant,
sincc such database would improve the ability of law enforcement officials to identify the weapons
used in a crime.
46
This document is a research report submitted to the U.S. Department of Justice. This reporthas not been published by the Department. Opinions or points of view expressed are thoseof the author(s) and do not necessarily reflect the official position or policies of theU.S. Department of Justice.

Intehgent Automation, Inc. Grant Number: 97-LB-VX-0008
6.1 Future Research
The results obtained during this project have been very encouraging. We are at the point where a
3D computer-aided ballistic analysis system is feasible. However, there LF considerable work to be
done towards validating and improving such a system. In general, there is room for improvement
in all aspects of this project (both hardware and software). The hardware setup can be improved
considerably to decrease noise levels and increase the speed at which a bullet can be acquired. As
far as software, both the acquisition algorithms and the correlation algorithms can also be
improved in terms of effectiveness and speed. In particular, there is considerable more work to be
done in the correlation algorithms. There are, however some specific topics that were not directly
addressed in this study, and where considerable improvement to the current state of the art in
computer-aided ballistic analysis is attainable:
Classification Algorithms: One of the most challenging problems of taking full advantage of a
national database of bullets is the magnitude of such database. It is not difficult to anticipate that
oncc such database is in place, correlation comparisons over thousands of bullets will become
routine. Therefore. in order to make such database practical and efficient, it will be necessary to
perform large correlation comparisons in a reasonable amount of time. Classification algorithms
will decrease the time it takes to make a match by narrowing the number of candidate bullets
whenever a large search is performed. Classification algorithms can be thought of as a pre-filter in
the matching process. In fact, simple versions of such algorithms are implemented in the existing
systems, whcre the user can specify certain parameters such as number of lands and grooves
(there is n o point in comparing bullets that do not have the same number of lands and grooves),
land-width and groove-width dimensions, bullet material, etc. to narrow the number of candidate
41
This document is a research report submitted to the U.S. Department of Justice. This reporthas not been published by the Department. Opinions or points of view expressed are thoseof the author(s) and do not necessarily reflect the official position or policies of theU.S. Department of Justice.

Intelligent Automation. Inc. Grant Number: 97-LB-VX-0008
bullets. However, more sophisticated means of classifying a large universe of bullets will be
necessary.
Gun-to-bullet Correlation: To date, all research in computerized ballistic analysis has focused
on the comparison of one bullet against another bullet. Clearly, such comparisons are of
fundamental interest, and constitute one of the building blocks of computerized ballistic analysis.
However, whenever the suspect weapon is available to the examiner, there are a number of
alternatives that have never been addressed, namely, the possibility of making gun-to-bullet
comparisons. By gun to bullet comparisons we mean the comparison of an evidence bullet against
a variety of control bullets. As we have learned through our research, in order to determine
whether a given evidence bullet was fired by a suspect gun, it is important to compare the
evidence bullet against as many control bullets as possible. The question is then how to best
perform such comparison.
One could postulate a number of ways to perform such one-to-many bullet comparison. We
consider two of them here. The first option involves the creation of a composite bullet based on
the multiple control bullets, and using such synthetic bullet as a signature bullet that characterkes
a weapon. The second option involves comparing the degree of similarity among the control
bullets themselves to the degree of similarity between the evidence bullet and the control bullets.
We briefly expand on these ideas in the following paragraphs.
The first approach would be to synthesize a composite bullet signature out of all available control
bullets. Such composite signature would capture the most signlftcant and consistent features of all
48
This document is a research report submitted to the U.S. Department of Justice. This reporthas not been published by the Department. Opinions or points of view expressed are thoseof the author(s) and do not necessarily reflect the official position or policies of theU.S. Department of Justice.

Intelligent Aut omat ion, Inc . Grant Number: 97-LB-VX-0008
the control bullets, and it could in principle eliminate the randomness of each individual bullet.
Although this idea could be used to create a “gun signature,” one should be careful in that bullets
of different material (or even manufacture) can be imprinted in significantly different fashion.
Thus, to completely characterize a gun, it might be necessary to create composite signatures of
bullets of a number of different materials.
The second approach can be described as a two-step process. First, the control bullets are
compared among themselves, and the statistical characteristics of such comparison would be
recorded. Once such step is taken, the evidence bullet would be compared against the control
bullets, and the statistical characteristics of such comparison would be compared against the
statistical characteristics obtained between the control bullets. If the statistical characteristics of
the comparison between the evidence bullet indicate a degree of similarity (we use this term very
loosely in this context) higher or equal than that obtained between the control bullets themselves,
then there is a high degree of confidence that the evidence bullet indeed originated from the same
source as the control bullets. This approach also lends itself to the following area of research:
Quantification of Results.
Quantification of Results: of all areas where further research is required, an objective
methodology to quantify the provability of an evidence bullet being fired by a suspect gun is
provably the most interesting and valuable one. Such tool, once accepted by the scientific and
legal community, would eliminate the subjectivity that currently exists in the testimony of “expert
witnesses” in court. One could imagine a time when ballistic analysis comparison results will have
the same kind of scientific and legal acceptance as today’s DNA analysis.
49
This document is a research report submitted to the U.S. Department of Justice. This reporthas not been published by the Department. Opinions or points of view expressed are thoseof the author(s) and do not necessarily reflect the official position or policies of theU.S. Department of Justice.

Intelligent Automation, Inc. Grant Number: 97-I,B-VX-0008
6.2 Current Status
AT a direct result of the research done under this project, and thanks to additional funding
provided by the National Science Foundation (Contract No. DMI-980 136 1 ) and Nichols Research
Corporation (Previously Mnemonic Systems Incorporated), we have developed a fully functional
prototype of the 3D ballistic analysis system. This prototype system (named SCICLOPS”. see
Exhibit 25) made its public debut in the 1999 Conference of the Association of Firearms and
Toolmarks Examiners (AFTE) that took place in July 1999 in Williamsburg, Virginia. During this
conference, we gave a presentation of the system in the main conference hall to a large audience
of AITIJ professionals. The debut of our system generated considerable interest, and a significant
number of attendees inquired about the expected time frame for its release as a commercial
product.
Another interesting development that took place during the M T E 1999 conference was the
dcprce of interest that our presentation generated among the developers of the IBIS system. The
IBIS system is the ballistic identification system favored by ATF, and is the competition of
I ) I ( [1( iI~IR1.i which is manufactured by our commercial partner Nichols Research. Although we
h a \ c ;I business relationship with Nichols Research, they have no objection to the sale of our
product to the IBIS manufacturer. This understanding opens the possibility for the sale of our
syswim to both the DRUGFIRE and IBIS manufacturers. This is not only beneficial to IN and the
SBIR program. but would also contribute to the unification of these two systems. This was one of
[ h c main requirements and goals of this project, and we feel that we have satisfied it in the most
~ i~ccc~ss lu l manner.
SO
This document is a research report submitted to the U.S. Department of Justice. This reporthas not been published by the Department. Opinions or points of view expressed are thoseof the author(s) and do not necessarily reflect the official position or policies of theU.S. Department of Justice.
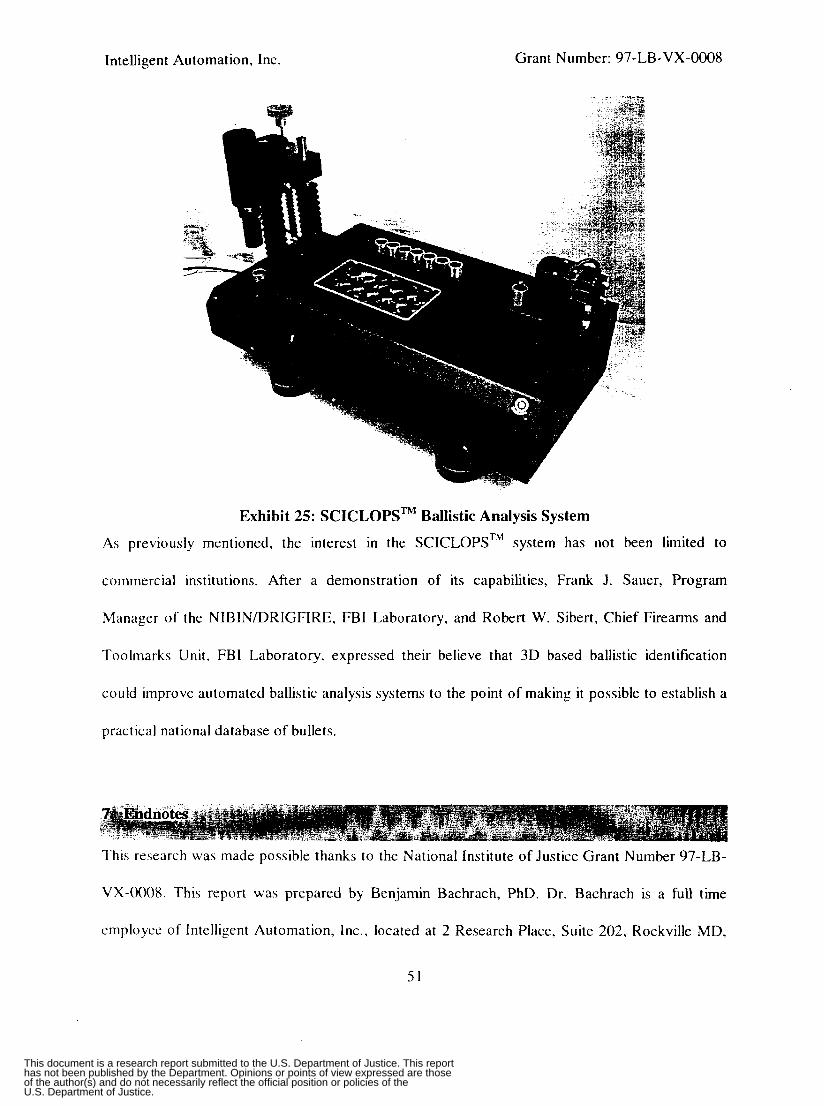
Intelligent Automation, Inc. Grant Number: 97-LB-VX-0008
Exhibit 25: SCICLOPSTM Ballistic Analysis System
As previously mentioned, the interest in the SCICLOPSm system has not been limited to
commercial institutions. After a demonstration of its capabilities, Frank J . Sauer, Program
Manager of the NIBINDRIGFIRE, FBI Laboratory, and Robert W. Sibert, Chief Firearms and
Toolmarks Unit, FBI Laboratory, expressed their believe that 3D based ballistic identification
could improve automated ballistic analysis systems to the point of making it possible to establish a
practical national database of bullets.
This research was made possible thanks to the National Institute of Justice Grant Number 97-LB-
VX-0008. This report was prepared by Benjamin Bachrach, PhD. Dr. Bachrach is a full time
employee of Intelligent Automation, Inc., located at 2 Research Place, Suite 202, Rockville MD,
51
This document is a research report submitted to the U.S. Department of Justice. This reporthas not been published by the Department. Opinions or points of view expressed are thoseof the author(s) and do not necessarily reflect the official position or policies of theU.S. Department of Justice.
Intelligent Automation. Inc. Grant Number: 97-LB-VX-0008
20850, Phone: (301) 590-3 155. The Chief Executive Officer of Intelligent Automation is Joseph
Schwartz, at same address.
7.1 References:
[ 11 Information regarding IBIS can be found at http://www.fti-ibis.com/.
[2] Information regarding DRUGFIRE can be found at
http://www.firtmsid.com/A_drugfire. htrn.
[3] New York Times article, National Report Section, published December 20, 1999, pg. A17.
52
This document is a research report submitted to the U.S. Department of Justice. This reporthas not been published by the Department. Opinions or points of view expressed are thoseof the author(s) and do not necessarily reflect the official position or policies of theU.S. Department of Justice.

Intelligent Automation, Inc. Grant Number: 97-LB-VX-0008
0 J. Paik, E. R. Canavan, B. Bachrach and H. J. Hauke, "Development of Superconducting Technology for Inertial Guidance, Gravity Survey and Fundamental Gravity Experiments", Report number TL-TR-94-2222 to Air Force, Phillips laboratory. Directorate of Geophysics.
0 B. Bachrach, E. R. Canavan and W. S. Levine, "Diagonalizing Controller for a Superconducting Six- Axis Accelerometer". Proceedings of 29'h Conference on Decision and Control, Hawaii 1990, Vol. 5, pg. 2785.
54
This document is a research report submitted to the U.S. Department of Justice. This reporthas not been published by the Department. Opinions or points of view expressed are thoseof the author(s) and do not necessarily reflect the official position or policies of theU.S. Department of Justice.
Intelligent Automation, Inc. Grant Number: 97-LB-VX-0008
Benjamin Bachrach, Ph.D. Education : Ph.D. Electrical Engineering May 1997 M.S. Electrical Engineering University of Maryland at College Park May 1990 B.S. Electrical Engineering Tel Aviv University, Tel Aviv, Israel. May 1987
University of Maryland at College Park
Professional Experience: Senior Scientist. Intelligent Automation Inc. April 1997 - Date
3D Ballistic Analysis: Developed and implemented data acquisition and correlation algorithms for ballistics matching based on topological (3D) information. Responsible for all design and implementation aspects of the SCICLOI?3T" system, IN'S fully operational ballistic analysis system.
Image Capture Device: Responsible for design and implementation of electronic control systems. In particular, lighting and motion control systems. The Image Capture Device (ICD) is an image acquisiton device to be used by the Drug Enforcement Administration for identification of drugs and drug related paraphernalia.
Multipurpose, Multiaxial, Isokinetic Dynamometer: Developed overall system architecture and de tailed control algorithms for exercise applications of the Multipurpose, Multiaxial, Isokinetic Dynamometer (MMID). The MMID is a candidate exercise system for the international space station.
X-33 technology demonstrator: Designed an implemented an adaptive control algorithm for the X - 33, the advanced technology demonstrator for the Reusable Launch Vehicle under construction at Lockheed Martin's Skunk Works.
Research Experience: Sept 1994 - May 1997 I>eveloped an algorithm and synthesis program for the design of fvted-structure robust performance controllers based on the use of p synthesis theory. The program implements a branch and bound algorithm to solve a non-convex btlinear matrix inequality problem. Developed an algorithm for the synthesis of minimum order filtered inverses for FDLTI systems. This algorithm was used to develop a MATLAB program for the design of 2-degree-of-freedom dew upling controllers.
Graduate Research Assistant: Feb 1989 - Sept 1994 Ikveloped dynamic model of the Superconducting Six-Axis Accelerometer (SSA) using Mathematica, which made it possible to understand complicated aspects of the SSA (such as coupling between axes). Designed a robust multi-input, multi-output decoupling controller for the SSA using Koscnbrock's INA and singular value decomposition techniques. The controller succccdcd on improving the linearity and dynamic range of the instrument.
Selected Publications :
This document is a research report submitted to the U.S. Department of Justice. This reporthas not been published by the Department. Opinions or points of view expressed are thoseof the author(s) and do not necessarily reflect the official position or policies of theU.S. Department of Justice.