ebanon economic monitor - world bankthe lebanon economic monitor provides an update on key economic...
TRANSCRIPT

0.9375 cm
LEBANON ECONOMIC MONITOR
A SLUGGISH ECONOMY IN A HIGHLY VOLATILE ENVIRONMENT
SPRING 2014
Poverty Reduction and Economic Management UnitMIDDLE EAST AND NORTH AFRICA REGION
The World Bankwww.worldbank.org/lb
The World Bank
The Lebanon Economic Monitor provides an update on key economic developments and policies over the past six months. It also presents findings from recent World Bank work on Lebanon. It places them in a longer-term and global context, and assesses the implications of these developments and other changes in policy on the outlook for Lebanon. Its coverage ranges from the macro-economy to financial markets to indicators of human welfare and development. It is intended for a wide audience, including policy makers, business leaders, financial market participants, and the community of analysts and professionals engaged in Lebanon.
The Lebanon Economic Monitor is a product of the World Bank’s Lebanon Poverty Reduction and Economic Management (PREM) team. It was prepared by Ibrahim Jamali (Economist) and Samer Matta (Economic Analyst), under the general guidance of Eric Le Borgne (Lead Economist) and Bernard Funck (Sector Manager). Ibrahim Jamali authored the Special Focus on sovereign wealth funds. Samer Matta authored the Special Focus on coincident and leading indicators. May Ibrahim (Senior Executive Assistant) provided Arabic translation and Zeina El Khalil (Communications Officer) print-produced the report. The team would like to thank staff from the Ministry of Finance, the Banque du Liban, the Petroleum Administration and the International Monetary Fund for their comments and stimulating discussions.
The findings, interpretations, and conclusions expressed in this Monitor are those of World Bank staff and do not necessarily reflect the views of the Executive Board of The World Bank or the governments they represent.
For information about the World Bank and its activities in Lebanon, including e-copies of this publication, please visit www.worldbank.org.lb
To be included on an email distribution list for this Lebanon Economic Monitor series and related publications, please contact Nada Abou Rizk ([email protected]). For questions and comments on the content of this publication, please contact Ibrahim Jamali ([email protected]) or Eric Le Borgne ([email protected]). Questions from the media can be addressed to Mona Ziade ([email protected]).
Preface
lebanon economic monitor | a sluggish economy in a highly volatile environment
Executive Summary | 1

Table of conTenTsPreface ................................................................................................................................................................................................................. 1execuTive summary ............................................................................................................................................................................... 4.................................................................................................................................................................................................... الملخ�ص التنفيذي 6recenT economic anD Policy DeveloPmenTs........................................................................................................ 8Output and Demand .......................................................................................................................................................................................... 8Labor Markets ......................................................................................................................................................................................................10Fiscal Policy ..........................................................................................................................................................................................................11Monetary Policy, Banking and Prices ......................................................................................................................................................11Financial Markets ...............................................................................................................................................................................................14Balance of Payments and External Sector .............................................................................................................................................14ProsPecTs .......................................................................................................................................................................................................16sPecial focus .............................................................................................................................................................................................18a sovereign Wealth fund for lebanon: issues and Preliminary recommendations ............................................18Introduction ..........................................................................................................................................................................................................18Sovereign Wealth Funds: What Are They, What Are They Not? ...............................................................................................21Commodity Price Volatility, SWF revenues and the non-resource primary balance: Some analytical issues ........23Governance of SWFs ........................................................................................................................................................................................24A SWF for Lebanon: Objectives, risks and recommendations ...................................................................................................26new coincident and leading indicators for the lebanese economy ..............................................................................30Introduction ..........................................................................................................................................................................................................30Literature Review ...............................................................................................................................................................................................31Methodology ........................................................................................................................................................................................................33Results and Implications ................................................................................................................................................................................37DaTa aPPenDix............................................................................................................................................................................................41selecTeD sPecial focus from recenT lebanon economic moniTors ....................................46selecTeD recenT WorlD banK PublicaTions on lebanon .....................................................................48
lisT of figuresfigure 1. Economic activity was tepid between Q3-2012 and Q2-2013. ...................................................................... 8figure 2. Growth in 2013 is at its lowest level since 1999… ................................................................................................ 9figure 3. .. weak activity continues into the first two month of 2014. ............................................................................ 9figure 4. Declining consumption patterns in 2013 .................................................................................................................... 9figure 5. Both the tourism and… .......................................................................................................................................................10figure 6. …the retail sectors performed weakly in 2013. .....................................................................................................10figure 7. The widening fiscal deficit… ............................................................................................................................................11figure 8. … reversed the downward trend of debt- to-GDP ...............................................................................................11figure 9. Headline and core inflation abated in 2013. ...........................................................................................................12figure 10. Commercial banks assets’ grew considerably. ......................................................................................................12figure 11. Deposits at commercial banks continued to increase in 2013......................................................................12figure 12. Lebanese banks’ sovereign debt exposure increased in 2013. ......................................................................13figure 13. Lending to the private sector grew, partly due to BdL’s stimulus package. ............................................13figure 14. Higher risk premium on Lebanese Eurobonds translated into widening spreads. ..............................13figure 15. The equity market weakened in 2013. .......................................................................................................................14figure 16. The trade-in-goods balance deteriorated in 2013 due to the influx of Syrian refugees ....................14figure 17. The strengthening of the balance of payments during 2013... ......................................................................15
The World Bank

figure 18. … helped BDL to increase its stock of foreign reserves.....................................................................................15figure 19. Crude oil prices are volatile… .........................................................................................................................................23figure 20. …and so are natural gas prices .......................................................................................................................................23figure 21. Long-lasting swings in energy and non-energy commodity prices… .........................................................24figure 22 … are also present for natural gas and crude oil prices .....................................................................................24figure 23. Current coincident indicators of the Lebanese economy have performed relatively weakly over recent years. .............................................................................................................................31figure 24. Growth rate of the WB-CI is equal to the GDP growth. ....................................................................................36figure 25. The WB-LI is an accurate forecast tool for the Lebanese economic activity. ..........................................39
lisT of TablesTable 1. Quarterly growth rate of the WB-CI (yoy). ................................................................................................................. 8Table 2. Business conditions deteriorated ..................................................................................................................................10Table 3. Lebanon’s Transparency and Rule of Law Indicators ..........................................................................................19Table 4. Largest Global Sovereign Wealth Funds ....................................................................................................................21Table 5. Cross-country SWF objectives, accumulation and withdrawal rules ..........................................................26Table 6. Lebanon’s GDP decomposition from the supply side ........................................................................................33Table 7. Potential candidates for inclusion in the WB-CI ....................................................................................................34Table 8. Final variables used in the WB-CI .................................................................................................................................34Table 9. Variables used in the construction of the WB-LI ...................................................................................................36Table 10. Potential variables used in the construction of the WB-LI................................................................................37Table 11. Error between WB-CI, BDL-CI, IIF-CI and GDP growth ....................................................................................38Table 12. Private sector deposits and primary spending have the biggest weights in the composition of the WB-CI. .................................................................................................................................39Table 13. Impact of one percentage point shock of certain variables on the WB-CI growth rate. ...................39Table 14. Personnel cost and Freight incoming at the Port of Beirut have the biggest weights in the composition of the WB-LI. ..................................................................................................................................39Table 15. World Bank Coincident Indicator for Lebanon /1. ................................................................................................41Table 16. World Bank Leading Indicator for Lebanon /1. .......................................................................................................41Table 17. Lebanon: Selected Economic Indicators, 2011-2016 ..........................................................................................42Table 18. Lebanon at a Glance .............................................................................................................................................................43Table 19. Lebanon: Millennium Development Goals, 1990-2011 ....................................................................................45
lisT of Key abbreviaTions useDbps: Basis pointsH1, H2: First half of the year, second half of the year.3mma: Three-months moving averagepp: Percentage pointsQ1 (Q2, Q3, Q4): First (second, third, fourth) quarter of the yearqoq: Quarter-on-quartersa: Seasonally adjustedsaar: Seasonally adjusted, annual rateyoy: Year-on-yearlHs, rHs: Left hand side, right hand side (for axis of figures)
lebanon economic monitor | a sluggish economy in a highly volatile environment

i. lebanon faces serious challenges from a volatile security environment and spillovers from the ongoing syrian conflict which pose serious risks to an already fragile internal political situation. Security incidents have become increasingly more common and the volatile security environment is weakening consumer and investor sentiments and adversely affecting tourism, a central contributor to economic growth and employment in Lebanon. The influx of Syrian refugees to Lebanon persists, with officially registered refugees reaching close to 1 million (i.e., 21.6 percent of Lebanon’s pre-conflict population), which poses significant fiscal, health and educational challenges.
ii. These challenges, and the lengthy political stalemate, weighed down on the economy. Real GDP growth is estimated at 0.9 percent in 2013 (based on newly developed World Bank Coincident and Leading Indicators). This is lower than the 1.6 percent growth recorded in 2006, the year of the conflict with Israel, and is the worst performance since 1999. A ten month vacuum period at the government level which followed the resignation of the Najib Mikati government impacted confidence and the ability of government to address pressing challenges. Measured inflation abated due to the waning impact of the 2012 salary increases as well as lower aggregate demand pressures. The balance of payments remained in deficit for the third consecutive year (2.5 percent of GDP deficit in 2013), as the security situation reduced both tourism and investment inflows considerably.
iii. The difficult political and security environment significantly complicated macroeconomic policy-making but the financial sector remained resilient. On the fiscal front, the deficit widened to 9.5 percent of GDP in 2013, mostly due to a sharp drop in revenue (by
1 percentage point (pp)); expenditure dropped by a modest 0.2 pp. The decline in revenue stemmed from weaknesses in the tax effort (especially taxes on income and profits, VAT, and tobacco excises) and in non-tax revenue. Expenditure saw a pronounced drop in current expenditures (as the effect of the 2012 cost of living adjustment for public servants wanes off) which was partly offset by an increase in capital spending. Growing deficits coupled with subdued GDP growth are expected to drive Lebanon’s debt-to-GDP ratio upwards in 2013 and 2014. On the monetary front, the Banque du Liban (BdL) maintained an expansionary stance to support the economy, while succeeding to sustain the public’s confidence in the Lebanese pound. Indeed, the dollarization rate of deposits only slightly increased, by 1.3 percentage points, over 2013. Conservatism in both financial sector regulations and approach to private sector banking helped maintain a well-capitalized and resilient domestic banking sector, despite sluggish growth and downgrades by international rating agencies. Elevated spreads between domestic and international rates of return supported continued inflows of deposits to Lebanese banks, thus supporting an expansion of the banks’ liquidity buffer.
iv. Despite some progress on the political front, spillovers from the syrian conflict, outstanding political uncertainty, and the volatile security environment pose significant challenges and tilt the balance of risks to the downside. The formation of a new government in February 2014 is a positive development for the economy. But presidential and parliamentary elections are due later this year and significant uncertainty prevails as to whether they will be held on time. Spillovers from the Syrian conflict will also continue to be a drag on growth which is expected to remain below potential for the near term. For 2014, real GDP growth is
execuTive summary
The World Bank
4 | Executive Summary

projected at 1.5 percent under the assumption that political uncertainty is rapidly resolved and that the security situation improves slightly. The balance of risks to our growth projection is tilted to the downside. In this context, necessary reforms to restore fiscal sustainability, resolve infrastructure bottlenecks, promote private sector development and create jobs are significantly delayed.
v. as lebanon contemplates prospects of sizeable hydrocarbon discoveries, the country is in the process of designing an institutional framework to manage these resources. one such issue is the establishment of a sovereign Wealth fund (sWf), as required by the 2010 Hydrocarbon Law. This Special Focus provides an overview of the various types of SWFs that have been established across countries, draws lessons from these experiences, highlights some pitfalls, and proposes preliminary recommendations for Lebanon as it moves towards establishing its SWF. Key among these recommendations is that the Lebanese SWF’s design should include (i) integration with the budget system, (ii) some (limited) flexibility in operational rules, (iii) no (or limited) earmarking but no extra-budgetary spending, (iv) coherence with country investment strategy, and (v) transparency and accountability.
vi. faced with weak economic statistics in lebanon—which impede analysis and decision making—World bank staff developed two indicators of economic activity for lebanon: a coincident indicator (Wb-ci) and a leading indicator (Wb-li). These indicators, which are based on an expanded NBER-Conference Board methodology, reveal promising statistical properties that should make them valuable coincident and leading (one-year ahead) indicators for the Lebanese economy. Based on these indicators, GDP growth for 2012 and 2013 is estimated to be, respectively, 2.2 and 0.9 percent while growth in 2014 is predicted to reach 1.5 percent. Aside from having a high degree of accuracy, both indicators are of relatively high (monthly) frequency and are available with a relatively small time lag (2-3 months), which make them well suited for economic analysts, investors, and policy makers alike. In contrast to the BdL-CI,
the WB-CI points to a deceleration in economic activity during the first ten months of 2013, which, if sustained over a few more months, would warrant a different monetary policy stance than the one based on the BdL-CI. This monetary policy example highlights the critical importance of having accurate, high frequency, and timely economic indicators.
lebanon economic monitor | a sluggish economy in a highly volatile environment
Executive Summary | 5

ال�ضوء على االقت�ضادية الن�ضرة العدد هذا من وي�ضلط .2010 عام
بلدان اأن�ضاأت في التي ال�ضيادية الثروة نماذج مختلفة من �ضناديق
الخبرات من الم�ضتفادة الدرو�س ا�ضتخال�س بهدف وذلك عدة،
تفاديها، الممكن من التي العوائق بع�س اإلى والتنبه ال�ضلة، ذات
اإن�ضاء على لبنان ت�ضاعد قد التي االأولية التو�ضيات وا�ضتخراج
ال�ضندوق المذكور اآنفًا. ومن اأهم التو�ضيات التي يمكن اعتبارها في
مرحلة الت�ضميم: )اأ( دمج متكامل مع الموازنة؛ )ب( بع�س المرونة
تخ�ضي�س من( الحد )اأو تفادي )ج( التنفيذية؛ االإجراءات في
اال�ضتراتيجية مع التكامل )د( الموازنة؛ خارج من اإ�ضافية نفقات
الوطنية لال�ضتثمار؛ و)هـ( اعتماد ال�ضفافية والم�ضاءلة.
�أمام عائقاً ي�شكل لبنان في �لبيانات قاعدة �شعف �إن .6
�إعد�د �لتحليالت �القت�شادية، مّما ي�ؤثر �شلباً على �شناعة �لقر�ر.
ب��شع �لدولي �لبنك خبر�ء قام لقد �الأمر، معالجة وبهدف
وموؤ�ضر تزامني موؤ�ضر لبنان: في �القت�شادي للن�شاط م�ؤ�ِشَرين
ا�ضتباقي. وقد ك�ضف هذان الموؤ�ضران، اللذان يرتكزان على المنهجية
)NBER( المتبعة من قبل مكتب الدرا�ضات االقت�ضادية االأميركية
،)Conference Board( و�ضركة الدرا�ضات االقت�ضادية االأميركية
تزامنية موؤ�ضرات اإلى تتحول قد واعدة اإح�ضائية خ�ضائ�س عن
وا�ضتباقية لالقت�ضاد اللبناني )بموجب �ضنة م�ضبقة(. وبناًء على هذه
الموؤ�ضرات، من المتوقع اأن ي�ضجل نمو الناتج المحلي االإجمالي ن�ضبة
2.2 بالمئة في العام 2012، و0.9 بالمئة في 2013. اأما ن�ضبة النمو
اإلى وباالإ�ضافة بالمئة. 1.5 تبلغ اأن المتوقع فمن 2014 العام في
درجة كبيرة من الدقة، يتميز هذان الموؤ�ضران بترددية عالية )على
نحو �ضهري( وهما متوفران بفارق زمني �ضغير ن�ضبيًا )من 2 اإلى 3
اأ�ضهر(، مما يجعلهما منا�ضبين للتحليل االإقت�ضادي، وللم�ضتثمرين،
الم�ضرف موؤ�ضر مع وبالمقارنة �ضواء. حد على القرار ول�ضانعي
في تباطوؤ عن الدولي البنك موؤ�ضر يك�ضف التزامني، المركزي
،2013 الن�ضاط االقت�ضادي خالل االأ�ضهر الع�ضرة االأولى من العام
واإذا ما ا�ضتمر الو�ضع على حاله خالل االأ�ضهر الباقية، �ضوف يتطلب
الموؤ�ضر على ترتكز التي النقدية ال�ضيا�ضة في مختلفًا موقفًا ذلك
الملحة ال�ضرورة المثال هذا ويبرز المركزي. للم�ضرف التزامني
والجودة، الزمنية، الدقة ت�ضمن التي المنا�ضبة الموؤ�ضرات لو�ضع
والترددية العالية في تطبيق ال�ضيا�ضات النقدية.
The World Bank
الملخ�س التنفيذي | 6

ي��جه لبنان تحدّيات جدية ب�شبب �الأو�شاع �الأمنية غير .1
�لم�شتقرة وتد�عيات �ل�شر�ع �لم�شتمر في �ش�ريا �لتي عر�شت �لبلد
�لذي �لد�خلي �ل�شيا�شي �ل��شع �إن�شحبت على �لى مخاطر حاّدة
�ل�شائد بال��شع �لمتعلقة �أ�شاًل من بع�ض �ال�شر�بات كان يعاني
في �لمنطقة. فقد تزايدت الحوادث االأمنية على نطاق وا�ضع واأّدى
الو�ضع االأمني غير المطمئن اإلى اإ�ضعاف ثقة الم�ضتهلك والم�ضتثمر
على حد �ضواء، مّما انعك�س �ضلبًا على قطاع ال�ضياحة الذي ُيعتبر من
اأهم العوامل الم�ضاهمة في النمو االقت�ضادي وخلق فر�س العمل. كما
ي�ضتمر تدفق الالجئين ال�ضوريين اإلى لبنان، حيث بلغ عدد الالجئين
21.6 بالمئة من اإجمالي الم�ضجلين ر�ضميًا ما يقارب المليون )اأي
مّما يفر�س تحدّيات هائلة على االأزمة(، لبنان ما قبل �ضكان عدد
القطاع المالي وال�ضحي والتربوي.
�إن تلك �لتد�عيات، �إ�شافة �إلى �لجم�د �ل�شيا�شي �لط�يل، .2
في �القت�شادي �لن�شاط على �شلباً �أثرت ثقيلة �أعباء �لى �أف�شت
بالمئة 0.9 بـِ الحقيقي المحلي االإجمالي الناتج نمو ُيقدر لبنان.
اال�ضتباقي والموؤ�ضر التزامني الموؤ�ضر على )بناًء 2013 العام في
اللذين اأعدهما البنك الدولي موؤخرًا(. ُي�ضار اإلى اأن هذه الن�ضبة هي
2006 )اأي خالل فترة ال�ضراع اأدنى من ن�ضبة النمو الم�ضجلة عام
الن�ضاط �ضجل كما اآنذاك. بالمئة 1.6 بلغت والتي اإ�ضرائيل( مع
1999. كما 2013 االأداء االأ�ضواأ له منذ العام االقت�ضادي في العام
اأ�ضهر 10 ا�ضتمر الذي الحكومي بالفراغ االقت�ضادي الو�ضع تاأثر
عقب ا�ضتقالة رئي�س الوزراء نجيب ميقاتي، مّما انعك�س ب�ضكل �ضلبي
على ثقة الحكومة وقدرتها على معالجة التحديات المّلحة. اأما ن�ضبة
زيادة قرار عن الناتج التاأثير تراجع ب�ضبب فانح�ضرت الت�ضخم
الرواتب لموظفي القطاع العام �ضنة 2012، باالإ�ضافة اإلى انخفا�س
عجزه على المدفوعات ميزان وبقي الكلي. الطلب على ال�ضغط
لل�ضنة الثالثة على التوالي )2.5 بالمئة من الناتج المحلي االإجمالي
اإيرادات قطاع اإلى تقلي�س اأّدى التدهور االأمني 2013(، حيث عام
ال�ضياحة واال�ضتثمارات ب�ضكل كبير.
تعقيد �إلى و�الأمنية �ل�شيا�شية �لبيئة �شع�بة �أدت .3
�لقطاع لكن �لكلي، �القت�شاد �شعيد على �لقر�ر�ت و�شع عملية
�لم�شرفي حافظ على �شالبته. فمن الناحية النقدية، ات�ضع العجز
اإلى ن�ضبة 9.5 بالمئة من الناتج االإجمالي المحلي في العام 2013،
ويعود ذلك باالأغلب اإلى اإنخفا�س حاد في االإيرادات )بن�ضبة نقطة
مئوية واحدة(، وقد انخف�ضت النفقات بن�ضبة متوا�ضعة )0.2 نقطة
مئوية(. اأما تدني ن�ضبة النفقات فهو ناتج عن ال�ضعف الحا�ضل في
الرواتب على المفرو�ضة ال�ضرائب )وباالأخ�س ال�ضرائب جباية
التبغ( واالإيرادات غير الم�ضافة، ور�ضوم القيمة واالأرباح، و�ضريبة
ال�ضرائبية. كما �ضهدت النفقات انخفا�ضًا ملحوظًا في معدل االإنفاق
بها بادرت التي المعي�ضية الكلفة ت�ضوية اأثر ت�ضاءل الجاري )حيث
الحكومة عام 2012(. اأما ارتفاع االإنفاق الراأ�ضمالي ف�ضاعد جزئيًا
في اإعادة التوازن. من المتوقع اأن يوؤدي االت�ضاع الحا�ضل في العجز،
بالتزامن مع �ضعف في النمو، اإلى دفع ن�ضبة الدين العام اإلى الناتج
المحلي االإجمالي نحو االأعلى في العامين 2013 و2014. ومن الجانب
النقدي، تبّنى م�ضرف لبنان المركزي �ضيا�ضات نقدية تو�ضعية لدعم
االقت�ضاد، وقد نجح في الحفاظ على الثقة في الليرة اللبنانية. فقد
مئوية، نقطة 1.3 بن�ضبة اأي �ضئيل، ب�ضكل الدولرة ن�ضبة ارتفعت
القطاع اأنظمة في المحافظ الموقف و�ضاعد .2013 العام خالل
المالي، والنهج المتبع في ما يخ�س القطاع الم�ضرفي الخا�س، في
الحفاظ على ر�ضملة ومرونة القطاع الم�ضرفي المحلي، على الرغم
للم�ضارف االإئتماني الت�ضنيف م�ضتوى وانخفا�س النمو تباطوؤ من
من قبل وكاالت الت�ضنيف الدولية. ووا�ضل التفاوت الكبير بين اأ�ضعار
القطاع اإلى الودائع تدفقات تحفيز على والدولية المحلية الفائدة
الم�ضرفي، مّما اأدى اإلى ات�ضاع حجم الودائع في الم�ضارف اللبنانية
وخلق عازل متين للحد من ال�ضدمات.
�لم�شت�ى على �الإيجابية �لتط�ر�ت بع�ض من بالرغم .4
و�ل��شع �ش�ريا، في �ل�شر�ع تد�عيات ت�شكل لبنان، في �ل�شيا�شي
تحديات �الأمنية �الأو�شاع في و�لتده�ر �لم�شتقر، غير �ل�شيا�شي
ج�شيمة وتدفع بميز�ن �لمخاطر �إلى �لتدني. يعتبر ت�ضكيل حكومة
جديدة في �ضباط/ فبراير 2014 تطور اإيجابي لالقت�ضاد اللبناني.
التي اال�ضتحقاقات من والبرلمانية الرئا�ضية االنتخابات وتبقى
�ضوف يواجهها لبنان خالل العام الحالي، بيد اأن الغمو�س ي�ضود حول
تداعيات اأن كما المحدد. الوقت في المذكورة االنتخابات اإجراء
المتوقع من الذي النمو على عبئها بفر�س ت�ضتمر ال�ضورية االأزمة
اأن ي�ضجل ن�ضبة دون م�ضتوى قدرات لبنان على المدى القريب. ومن
المتوقع اأن يبلغ النمو ن�ضبة 1.5 بالمئة في العام 2014، ذلك في ظل
اإيجاد الحلول ال�ضريعة لتحقيق اال�ضتقرار ال�ضيا�ضي وبروز افترا�س
بوادر تح�ضٍن، ولو �ضئيل، في الو�ضع االأمني. اإن ميزان المخاطر في
هذا وفي التدني. نحو يتجه النمو اإلى بالن�ضبة توقعاتنا يخ�س ما
ال�ضياق، تتباطاأ المبادرات االإ�ضالحية في ما يخ�س اإعداة ت�ضويب
التحتية، بالبنى المتعلقة العوائق ومعالجة المالية، اال�ضتمرارية
وتطوير القطاع الخا�س، وخلق فر�س العمل.
من و��شعة حق�ل ��شتك�شاف �إلى يتطلع لبنان �أن وبما .5
�لمعنية �لجهات بد�أت و�لغاز(، فقد )�لنفط �لهيدروكرب�ن مادة
بت�شميم �إطار م�ؤ�ش�شاتي الإد�رة تلك �لم��رد، منها �إن�شاء �شندوق
�لثروة �ل�شيادية تطبيقاً ل�شروط قان�ن �لنفط و�لغاز �لذي و�شع
الملخ�ص التنفيذي.
lebanon economic monitor | a sluggish economy in a highly volatile environment
7 | الملخ�س التنفيذي

1. economic activity suffered and continues to be significantly and negatively affected by spillovers related to the ongoing syrian conflict (Figure 1). As national accounts in Lebanon are only available with a significant time lag—e.g., the latest accounts are from 2011—World Bank staff have developed two new indicators, a Coincident Indicator (WB-CI) and a Leading Indicator (WB-LI)1 to better assess recent economic developments. Based on these and other high frequency indicators, economic activity is estimated to have softened noticeably in 2013 (Table 1 and Figure 1). This softening can partly be attributed to the resignation of the Mikati government in March 2013 and the continued conflict in Syria and its growing negative security spillovers into Lebanon. A new phase in the worsening security environment started in August 2013 with a series of large bomb explosions and targeted assassinations.2 These have continued so far into 2014 and, as expected, have put further
pressure on economic activity. As a result, many countries whose citizens are key tourist markets for Lebanon have reiterated their advisories urging their citizens not to travel to Lebanon. The ratcheting of the security incidents also hurt investor and consumer confidence.3 The formation of a new government headed by Prime Minister Taman Salam in February 2014 represents a positive political development.
Output and Demand2. spillovers from the syrian conflict—including the deteriorating security conditions—and the lengthy political stalemate weighted down economic activity. Real GDP growth is estimated to have grown by 0.9 percent in 2013 (based on a newly developed World Bank Coincident and Leading Indicators—see page 34). This 2013 growth
recenT economic anD Policy DeveloPmenTs
-4
-2
0
2
4
6
8
10
12
Q1 Q2 Q3 Q4 Q1 Q2 Q3 Q4 Q1 Q2 Q3 Q4 Q1 Q2 Q3 Q4
2010 2011 2012 2013
WB-CI quarterly growth (yoy) Percent
Resignation of PM Saad Harrir's government Formation of PM
Najib Mikati's government
Negative Impact of Syrian crisis
Kidnapping
wave
and
deterioration
of
security
conditions
Assassination
of
General
Al-Hassan
Abra Incidents
Government
resignation
figure 1. economic activity was tepid between Q3-2012 and Q2-2013.
Source: WB staff calculations.
Table 1. Quarterly growth rate of the Wb-ci (yoy).
Source: WB staff calculations; n.a.: not available.
1 See the Special Focus on page 37 for details on the methodology used.
2 These include large bomb incidents in Beirut and twin bombs in Tripoli in August, the assassination of former Finance Minister Dr. Mohamad Chatah in a car bombing in Beirut on December 27, 2013, and a suicide bomber detonated a car in Beirut in January 2014.
3 While the economy grew by 3.1 percent (yoy) during 2013Q3, this was the result of an increase from a low base in the previous quarter rather than a sustained improvement in economic activity.
year Quarter growth (%) year Quarter growth (%) year Quarter growth (%)
2006
Q1 13.1
2009
Q1 15.4
2012
Q1 7.3
Q2 15.2 Q2 12.6 Q2 5.2
Q3 -19.6 Q3 7.8 Q3 -1.3
Q4 1.6 Q4 5.7 Q4 -2.1
2007
Q1 1.2
2010
Q1 8.3
2013
Q1 -0.5
Q2 -1.5 Q2 10.4 Q2 -1.3
Q3 33.2 Q3 8.0 Q3 3.1
Q4 7.9 Q4 5.4 Q4 n.a.
2008
Q1 5.4
2011
Q1 -0.8
Q2 5.9 Q2 -0.4
Q3 10.6 Q3 3.1
Q4 14.7 Q4 6.3
The World Bank
8 | Recent Economic and Policy Developments

rate is lower than the 1.6 percent growth recorded in 2006, the year of the conflict with Israel (Figure 2), and is the worst performance since 1999. The tourism and wholesale and retail trade sectors, which accounted for, respectively, 2.7 and 14.4 percent of GDP in 2011,4 have been severely impacted by the deteriorating security situation. The economic slowdown was reflected in the BLOM purchasing managers’ index (PMI),5 which is a new indicator based on a monthly survey of business conditions in the Lebanese private sector. Between May 2013 (the first observation on the PMI) and December 2013, the PMI averaged 48.2 points, pointing to a contraction in activity. The contraction deepened in early 2014, with headline indices of 44.7 and 45.5 in January and February, respectively (Figure 3).
3. from the demand side, consumer and investor sentiments weakened significantly due to the increasingly more volatile security situation. A number of indicators point to a decline in private consumption in 2013. The ARA consumer confidence index6 dropped by 17.2 percent during 2013, while the Byblos Bank/AUB Index declined by an average of 4.4 percent during the first half of 2013 (Figure
4). The weakening consumer sentiment indicators were coupled with deteriorating investor appetite. Construction permits, one of the available high-frequency indicators of investment activity, declined by 12 percent in 2013. The decrease in investment activity comes amid a regression in Lebanon’s overall business conditions. In fact, Lebanon ranked 111 (out of 189 countries) in 2014 in the World Bank’s ease of doing business indicators7 down from 105th in 2013 (Table 2).
1.3
4.0 3.4 3.2
7.5
2.7
1.6
9.4 9.1
10.3
8.0
2.0 2.2
0.9
0
1
2
3
4
5
6
7
8
9
10
11
2000
2001
2002
2003
2004
2005
2006
2007
2008
2009
2010
2011
2012
e
2013
p
Lebanese GDP growth since 2000 (%) Percent
figure 2. growth in 2013 is at its lowest level since 1999…
Source: Lebanese authorities and WB staff calculations.
40
45
50
55
60
May
-13
Jun-
13
Jul-1
3
Aug
-13
Sep-
13
Oct
-13
Nov
-13
Dec
-13
Jan-
14
Feb-
14
BLOM PMI
Increasing rate of contraction
Points
Increasing rate of expansion
figure 3. .. weak activity continues into the first two month of 2014.
Source: BLOM Bank
4 The latest official national accounts are from 2011.
5 The PMI is a composite index calculated as a weighted average of five individual sub-components: New Orders (30%), Output (25%), Employment (20%), Suppliers’ Delivery Times (15%) and Stocks of Purchases (10%). A value of the PMI above 50.0 signals an improvement in business conditions from the previous month, while a drop in the PMI below the 50.0 threshold indicates a slowdown in business activity (BLOM Bank, 2013).
6 ARA Marketing Research and Consultancy, a private consultancy firm, constructs and disseminates a consumer confidence index on a monthly basis. This Index is based on the following six sub-indices: current economic situation index, expected economic situation index, current personal income index, expected personal income index, current employment opportunities index and purchase of durables index.
7 World Bank (2014) “Doing business 2014: Understanding regulations for small and medium size enterprises”.
-80
-60
-40
-20
0
20
40
60
Jan-
10
Apr
-10
Jul-1
0
Oct
-10
Jan-
11
Apr
-11
Jul-1
1
Oct
-11
Jan-
12
Apr
-12
Jul-1
2
Oct
-12
Jan-
13
Apr
-13
Jul-1
3
Oct
-13
Growth rate of consumer confidence indices (sa, %)
Byblos Bank/AUB CCI ARA CCI
figure 4. Declining consumption patterns in 2013
Source: Byblos Bank, ARA consulting and research, WB staff calculations.
lebanon economic monitor | a sluggish economy in a highly volatile environment
Recent Economic and Policy Developments | 9

4. from the supply side, the tourism, wholesale and retail trade sectors were the most affected by the deteriorating security environment. The number of tourist arrivals decreased by 6.7 percent during 2013, following 23.7 and 17.5 percent drops in 2011 and 2012, respectively (a cumulative drop of 41.2 percent from 2010 to 2013). In addition, notwithstanding softer prices, hotel occupancy rates in Beirut dropped by 3.3 percentage points in 2013 following a similar 3.6 percentage point decrease in 2012 (Figure 5).8 The slowdown in the tourism sector was mostly driven by (i) adverse and more frequent local and regional security incidents and (ii) the travel advisories issued by a number of countries urging their citizens not to travel to Lebanon. Despite the offset to aggregate demand stemming from the large influx of Syrian refugees in 2013 (to 675,000 by end-December), the retail sector contracted by 14 percent in the first three quarters of 2013 according to the BTA-Fransabank retail trade index, with performance decelerating sharply throughout the year (Figure 6). Sales of new and used cars dropped by 6 percent in nominal terms in 2013 (Association of Automobile Importers in Lebanon), though new car sales grew modestly by 1.8 percent. The slowdown in the tourism, wholesale and retail trade, and transport sectors
weighed negatively and significantly on GDP growth as these sectors account for about a quarter of total GDP in Lebanon.
Labor Markets5. a structurally weak lebanese labor market is estimated to have worsened in 2013 in part due to the refugee-induced increase in labor force and the slowdown in gDP growth. The large influx of Syrian refugees increased the labor supply by an estimated 30 percent in 2013 (World Bank, 20139). With the majority of Syrian refugees being low- to
8 Ernst and Young’s Middle East hotel benchmark survey as reported in Bank Audi’s “The Lebanon weekly economic monitor”, February 03-09, 2014.
9 World Bank et al., 2013, Lebanon: Economic and Social Impact Assessment of the Syrian Conflict, Washington DC.
0
10
20
30
40
50
60
70
80
0
20,000
40,000
60,000
80,000
100,000
120,000
140,000
160,000
180,000
Tourism sector
Tourist arrivals (sa)
Hotel occupancy rate in Beirut (rhs, sa)
percent
figure 5. both the tourism and…
Source: Byblos Bank, ARA consulting and research, World Bank staff calculations.
100.0
94.2
101.7 100.0
102.9
89.7 86.9
78.2
70
75
80
85
90
95
100
105
Q4-11 Q1-12 Q2-12 Q3-12 Q4-12 Q1-13 Q2-13 Q3-13
BTA-Fransabank Retail Trade Index (real)
figure 6. …the retail sectors performed weakly in 2013.
Source: BTA- Fransabank.
Table 2. business conditions deteriorated
Source: World Bank.
Db 2014 rank
Db 2013 rank
change in rank
Doing Business Rank 111 105 6-
Starting a Business 120 116 4-
Dealing with Construction Permits 179 176 3-
Getting Electricity 51 48 3-
Registering Property 112 108 4-
Getting Credit 109 105 4-
Protecting Investors 98 95 3-
Paying Taxes 39 36 3-
Trading Across Borders 97 98 1
Enforcing Contracts 126 125
Resolving Insolvency 93 88 5-
The World Bank
10 | Recent Economic and Policy Developments

semi-skilled workers, job competition, especially in the informal sector, has materially increased. Youth unemployment in Lebanon is estimated to exceed 22 percent in 2013 (ILO, 201410). The labor market continues to suffer from skills mismatches, widespread informality (more than 56.2 percent of total employment) and low-productivity and low-quality jobs (ILO, 2014). The competition created by low-to semi-skilled Syrian refugees at times fuels social discontent and tensions between the refugee and host communities.
Fiscal Policy6. The fiscal balance deteriorated sharply in 2013, mostly due to weak revenue collection. The central government’s overall fiscal deficit widened by 0.8 percentage points (pp) to 9.5 percent of GDP in 2013 (Figure 7). For the second year running, Lebanon experienced a primary deficit. This weak performance reflects a 1 pp drop in revenues despite a 0.2 pp decrease in government expenditures. The decline in government revenues was driven by a drop in the tax effort (especially taxes on income and profits, VAT, and tobacco excises) and in non-tax collection. While some of these weaknesses reflect the subdued GDP growth, some are also due to policy decisions, such as the government’s decision on March 2012 to exempt gasoil from VAT).
From the expenditures side, current expenditures decreased by 0.5 pp as a result of 0.6 pp drop in public servants salaries as the effect of the 2012 cost of living adjustment waned off. Transfers to EDL also dropped by 0.6 pp. The decrease in current expenditures was partly offset, however, by a 0.3 pp increase in capital spending.
7. growing deficits coupled with subdued gDP growth continue to drive lebanon’s debt-to-gDP ratio upwards, for the second year running (Figure 8). Public debt reached USD 63.5 billion at end-2013 (143.1 percent of GDP) up from USD 57.7 billion (133.5 percent of GDP) at end-2012. The government financed the widening fiscal deficit by issuing Treasury bills (TBs) and Eurobonds the last of which was a TB issue valued at USD 1.6 billion in September 2013. The stock of debt outstanding remains mostly internal11 as 77.2 percent of it is held by commercial banks and BdL. The debt-to-GDP ratio is projected to continue increasing in 2014 and 2015 (Table 17).
Monetary Policy, Banking and Prices8. measured inflation abated during 2013, due to the waning impact of the 2012 salary
10 International Labor Organization, 2014, “Global employment trends 2014: Risk of a jobless recovery?”.
11 Internal debt is defined as the sum of Treasury bills and Eurobonds held by commercial banks plus the Treasury bills held by BdL.
-15
-10
-5
0
5
10
15
20
25
30
35
2009 2010 2011 2012 2013p
Central Government Finances (% of GDP)
Total
Revenues
Total
Expenditures
Budget Deficit
Percent
figure 7. The widening fiscal deficit…
Source: MoF and WB staff calculations.
120
130
140
150
160
170
180
190
0
10
20
30
40
50
60
70
80
2005
2006
2007
2008
2009
2010
2011
e
2012
e
2013
p
2014
p
Debt to GDP ratio (%)
Gross Public Debt Nominal GDP) Debt to GDP (rhs)
US$ bln
Percent
figure 8. … reversed the downward trend of debt- to-gDP
Source: BdL, CAS and WB staff calculations.
lebanon economic monitor | a sluggish economy in a highly volatile environment
Recent Economic and Policy Developments | 11

increases and the expanding idle capacity of the economy. According to the Consultation and Research Institute (CRI) the headline CPI inflation averaged 2.6 percent during 2013, representing a 3.1 percentage points decrease relative to the same period in 2012 (Figure 9).12 The declining inflation rate likely reflects (i) below potential growth rate in real GDP over the 2011-2013 period that resulted in a negative the output gap (i.e., excess capacity) and (ii) a fading away of the effect of minimum wage and public sector salary increases of 2012. As rent/housing inflation is not adequately captured in the various existing inflation measures in Lebanon, the expected large increase in rents due to the surge in Syrian refugees and the associated demand for housing implies that existing inflation indices underestimate actual inflation.
9. The banque du liban (bdl) maintained its expansionary monetary policy stance while confidence in the local currency was sustained in 2013. Money supply (M3, including non-resident deposits) increased by 9 percent (yoy) in 2013 compared to 8.1 percent (yoy) in 2012. While the central bank intends to launch a new stimulus package in 2014 (akin to the stimulus package of 2013)13, these plans have not yet materialized.
Notwithstanding repeated security incidents, the dollarization rate of deposits, which is an indicator of confidence in the local currency, increased by only 46 basis points (mom) to 66.1 percent in December 2013 (a 1.3 percentage point increase from year-end 2012).
Despite subdued economic activity and credit downgrades of banks, the Lebanese banking sector remains resilient. In light of the turbulent political and security situation and the downgrade in Lebanon’s sovereign ratings (see Financial Markets section below), Standard and Poor (S&P)’s downgraded the
12 The Central Administration of Statistics’ CPI inflation averaged 5.6 percent in 2013. The higher CAS inflation reflects infrequent measurement of rent inflation. Given that no CPI data inflation figures were produced by CAS between January and May 2013, World Bank staff obtained these figures by linear interpolation.
13 The last stimulus package was launched in January 2013. As detailed in the Spring 2013 issue of Lebanon Economic Monitor, the real estate sector benefited the most from the subsidized loans
0.0
1.0
2.0
3.0
4.0
5.0
6.0
7.0
8.0
Jan
Apr
Jul
Oct
Jan
Apr
Jul
Oct
Jan
Apr
Jul
Oct
Jan
Apr
Jul
Oct
Jan
Apr
Jul
Oct
2009 2010 2011 2012 2013
Headline and Core Inflation Rates (yoy change, 3mma, sa)
US: core inflation rate
figure 9. Headline and core inflation abated in 2013.
Source: CAS, CRI and WB staff calculations. 1/ Core inflation depicts changes in domestic prices excluding fuel and food. It is calculated using the CPI figure of CRI and recalibrated by the weights of the
official CPI of CAS.
0
5
10
15
20
25
30
35
40
2009 2010 2011 2012 2013
Growth Rate of Assets (%)
Commercial Banks
BDL
Percent
figure 10. commercial banks assets’ grew considerably.
Source: BdL and WB staff calculations
0
20
40
60
80
100
120
140
160
Jan-
10
Apr
-10
Jul-1
0
Oct
-10
Jan-
11
Apr
-11
Jul-1
1
Oct
-11
Jan-
12
Apr
-12
Jul-1
2
Oct
-12
Jan-
13
Apr
-13
Jul-1
3
Oct
-13
Deposits at Commercial Banks
Non-resident deposits Resident Deposits
Total Deposits
US$ bln
figure 11. Deposits at commercial banks continued to increase in 2013.
Source: BdL and WB staff calculations
The World Bank
12 | Recent Economic and Policy Developments
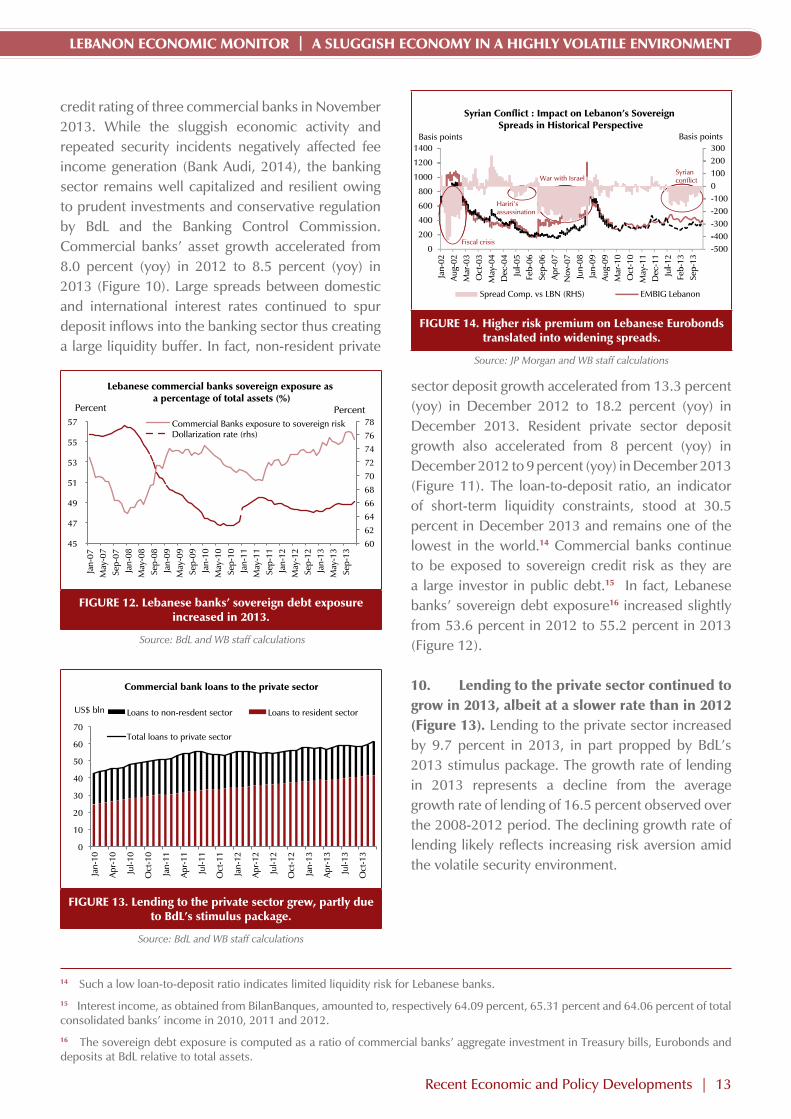
credit rating of three commercial banks in November 2013. While the sluggish economic activity and repeated security incidents negatively affected fee income generation (Bank Audi, 2014), the banking sector remains well capitalized and resilient owing to prudent investments and conservative regulation by BdL and the Banking Control Commission. Commercial banks’ asset growth accelerated from 8.0 percent (yoy) in 2012 to 8.5 percent (yoy) in 2013 (Figure 10). Large spreads between domestic and international interest rates continued to spur deposit inflows into the banking sector thus creating a large liquidity buffer. In fact, non-resident private
sector deposit growth accelerated from 13.3 percent (yoy) in December 2012 to 18.2 percent (yoy) in December 2013. Resident private sector deposit growth also accelerated from 8 percent (yoy) in December 2012 to 9 percent (yoy) in December 2013 (Figure 11). The loan-to-deposit ratio, an indicator of short-term liquidity constraints, stood at 30.5 percent in December 2013 and remains one of the lowest in the world.14 Commercial banks continue to be exposed to sovereign credit risk as they are a large investor in public debt.15 In fact, Lebanese banks’ sovereign debt exposure16 increased slightly from 53.6 percent in 2012 to 55.2 percent in 2013 (Figure 12).
10. lending to the private sector continued to grow in 2013, albeit at a slower rate than in 2012 (figure 13). Lending to the private sector increased by 9.7 percent in 2013, in part propped by BdL’s 2013 stimulus package. The growth rate of lending in 2013 represents a decline from the average growth rate of lending of 16.5 percent observed over the 2008-2012 period. The declining growth rate of lending likely reflects increasing risk aversion amid the volatile security environment.
14 Such a low loan-to-deposit ratio indicates limited liquidity risk for Lebanese banks.
15 Interest income, as obtained from BilanBanques, amounted to, respectively 64.09 percent, 65.31 percent and 64.06 percent of total consolidated banks’ income in 2010, 2011 and 2012.
16 The sovereign debt exposure is computed as a ratio of commercial banks’ aggregate investment in Treasury bills, Eurobonds and deposits at BdL relative to total assets.
60
62
64
66
68
70
72
74
76
78
45
47
49
51
53
55
57
Jan-
07
May
-07
Sep-
07
Jan-
08
May
-08
Sep-
08
Jan-
09
May
-09
Sep-
09
Jan-
10
May
-10
Sep-
10
Jan-
11
May
-11
Sep-
11
Jan-
12
May
-12
Sep-
12
Jan-
13
May
-13
Sep-
13
Lebanese commercial banks sovereign exposure as a percentage of total assets (%)
Commercial Banks exposure to sovereign risk Dollarization rate (rhs)
Percent Percent
figure 12. lebanese banks’ sovereign debt exposure increased in 2013.
Source: BdL and WB staff calculations
0
10
20
30
40
50
60
70
Jan-
10
Apr
-10
Jul-1
0
Oct
-10
Jan-
11
Apr
-11
Jul-1
1
Oct
-11
Jan-
12
Apr
-12
Jul-1
2
Oct
-12
Jan-
13
Apr
-13
Jul-1
3
Oct
-13
Commercial bank loans to the private sector
Loans to non-resdent sector Loans to resident sector
Total loans to private sector
US$ bln
figure 13. lending to the private sector grew, partly due to bdl’s stimulus package.
Source: BdL and WB staff calculations
Basis points Basis points
2003001400
1001200
S i
0100
800
1000Syrian conflictWar with Israel
-200-100
600 Hariri's assassination
-400-300
200
400
-500-
0
2 2 3 3 4 4 5 6 6 7 7 8 9 9 0 0 1 1 2 3 3
Fiscal crisis-5000
Jan-
02A
ug-0
2M
ar-0
3O
ct-0
3M
ay-0
4D
ec-0
4Ju
l-05
Feb-
06Se
p-06
Apr
-07
Nov
-07
Jun-
08Ja
n-09
Aug
-09
Mar
-10
Oct
-10
May
-11
Dec
-11
Jul-1
2Fe
b-13
Sep-
13
d b
Jan
Aug
Mar
Oct
May
Dec Ju
lFe
bSe
pA
prN
ov Jun
Jan
Aug
Mar
Oct
May
Dec Ju
lFe
bSe
p
Spread Comp. vs LBN (RHS) EMBIG LebanonSpread Comp. vs LBN (RHS) EMBIG Lebanon
Syrian Conflict : Impact on Lebanon’s Sovereign Spreads in Historical Perspective
figure 14. Higher risk premium on lebanese eurobonds translated into widening spreads.
Source: JP Morgan and WB staff calculations
lebanon economic monitor | a sluggish economy in a highly volatile environment
Recent Economic and Policy Developments | 13

Financial Markets11. Deteriorating economic conditions and increasing security risks have led to a worsening in lebanon’s sovereign credit ratings. Following Standard and Poor’s downgrade of the Lebanese sovereign credit ratings from B to B- in November 2013, Fitch ratings revised, in December 2013, Lebanon’s outlook from stable to negative. These downward credit revisions are a result of the increasing public debt, widening fiscal deficit and weakening of growth prospects. The rating agencies also attributed the downward revision to the heightened political and security risks.
12. spreads on lebanese eurobonds have narrowed in early 2014, likely reflecting a combination of weaker emerging markets and
improved domestic politics. The (JP Morgan’s EMBIG) spread between the Lebanese Eurobonds and those of other Emerging markets rose by an average of 30 basis points in 2013 compared to 2012. The widening spread indicates that investors require a higher risk premium for holding Lebanese Eurobonds. The increasing risk premia are largely attributable to the political stalemate that delayed the formation of a government for eleven months as well as to the deteriorating security conditions in 2013. However, since mid-January 2014 the EMBIG narrowed due to promising signs of the resolution of the political stalemate and the ensuing formation of new government on 15 February 2014 (Figure 14). The improvement in Lebanon’s EMBIG spreads comes despite the persistent and more frequent security incidents and amid a widening of emerging markets spreads reflecting political upheaval in several large emerging markets.
13. Despite an improvement in the first month of 2014, the lebanese stock market performed poorly in 2013. The 1.6 percent drop in the BLOM stock index (BSI) in 2013 constituted the fourth consecutive stock market annual loss since 2010 (Figure 15). The total trading value at the Beirut stock exchange (BSE) dropped from US$ 408.5 million in 2012 to US$ 375.2 million in 2013 as investor confidence weakened due to the volatile political and security situations. As a ratio of GDP, the market capitalization of stocks dropped by 0.3 percentage points in 2013 (relative to 2012) reaching 23.8 percent (US$ 10.5 billion). Relative to end-2013, the equity market registered gains of 5.1 percent in the first month of 2014 likely reflecting increased investor confidence following the formation of a new government.
Balance of Payments and External Sector14. lebanon’s trade-in-goods balance deteriorated in 2013 as a result of increased demand by syrian refugees. Lebanese customs data show that the trade-in-goods balance recorded
7 8 9 10 11 12 13 14 15 16 17
900
1,100
1,300
1,500
1,700
1,900
2,100
Jan-
08
May
-08
Sep-
08
Jan-
09
May
-09
Sep-
09
Jan-
10
May
-10
Sep-
10
Jan-
11
May
-11
Sep-
11
Jan-
12
May
-12
Sep-
12
Jan-
13
May
-13
Sep-
13
Jan-
14
Equity Market
Blom Stock Index (BSI) Market Capitalization (rhs)
US$ bln
figure 15. The equity market weakened in 2013.
Source: Beirut Stock Exchange, BLOM Bank and WB staff.
0
2,000
4,000
6,000
8,000
10,000
12,000
14,000
16,000
2010 2011 2012 2013
Trade in Goods (Jan-Dec)
Total Imports Excluding Energy
Total Exports
Trade Deficit Excluding Energy Imports US$ mln
figure 16. The trade-in-goods balance deteriorated in 2013 due to the influx of syrian refugees
Source: Lebanese customs and WB staff calculations
The World Bank
14 | Recent Economic and Policy Developments

a cumulative deficit of US$17.3 billion (39 percent of GDP) in 2013, widening by 3 percent compared to 2012. Excluding lumpy and volatile energy imports, the trade-in-goods deficit widens by 13.2 percent during 2013 as a result of a 5.7 percent rise in imports coupled with a 12.2 percent drop in exports (Figure 16). The surge in imports is driven by 4.1 and 19.5 percent increases in food and capital goods imports, respectively. These are likely driven by the increased consumption of Syrian refugees17 which helped partially offset the softer consumption patterns of the Lebanese and the sharp drop in tourist consumption. The drop in exports is driven by a sharp 55.4 percent (yoy) drop in exports of pearls, precious stones and metals.
15. Despite strengthening in 2013, the balance of payments remained in deficit for the third consecutive year (Figure 17). Lebanon’s balance of payment deficit shrank from 3.5 percent of GDP in 2012 (US$ 1.5 billion) to 2.5 percent of GDP in 2013 (US$ 1.1 billion). As a ratio of GDP, the 1 percentage point (pp) improvement in the balance of payment between 2012 and 2013 was the result of 1.1 pp increase in the inflow of foreign capital, income and services. Nonetheless, the growth rate of inflows decelerated from 9.8 percent in 2012 to 5.9 percent in 2013. The deceleration in inflows, despite the wide spread between domestic and international interest rates that reached an average of 353 basis points in 2013, is likely attributable to (i) lower inflows from tourism, and (ii) an expected decrease in foreign direct investment due to the heightened political and security risks caused by the Syrian conflict.
16. as a result of the continuous inflow of foreign capital, income and services, foreign reserves at bDl increased during 2013. The stock of international reserves (excluding gold) at the central bank reached US$ 31.7 billion (71.5 percent of GDP) by end-2013 increasing by 5.8 percent compared to end 2012 (Figure 18). In terms of months of imported goods, the coverage ratio increased from 16.9 percent in 2012 to 17.9 percent in 2013.
-2
-1
0
1
2
3
4
5
6
-15
-10
-5
0
5
10
15
2007 2008 2009 2010 2011 2012 2013
Balance of Payments
Capital Inflow Trade in Goods Balance BoP (rhs)
US$ bln US$ bln
figure 17. The strengthening of the balance of payments during 2013...
Source: BdL, Lebanese Customs and WB staff calculations
0
5
10
15
20
25
0
5
10
15
20
25
30
35
2007 2008 2009 2010 2011 2012 2013
Coverage Ratio Foreign reserves at BDL (excl Gold, US$ bln) Imports of Goods (US$ bln) Coverage Ratio (months of imported goods, rhs)
US$ bln months
figure 18. … Helped bDl to increase its stock of foreign reserves
Source: BdL, Lebanese Customs and WB staff calculations
17 For instance, imports of pharmaceutical products increased by 12 percent in 2013 due to increased demand by Syrian refugees.
lebanon economic monitor | a sluggish economy in a highly volatile environment
Recent Economic and Policy Developments | 15
17. Despite positive political developments, spillovers from the syrian conflict and the volatile security environment are projected to continue holding the economy down. World Bank staff projections through 2016 are based on the assumption that spillovers from the Syrian conflict gradually abate in 2015 and 2016. Relative to our Fall 2013 issue of the Lebanon Economic Monitor, we have revised our growth projection for 2015 downwards from 4.0 percent to 2.5 percent. For 2014, our growth projection builds on the newly developed World Bank Leading Indicator (see Special Focus below). Specifically, we are now projecting the economy to grow by 1.5 percent, though with significant downside risk to these projections. These indeed embed an assumption that political uncertainty related to the Presidential and Parliamentary elections are rapidly resolved, and that the security situation improves slightly. The large downward revision for 2015 reflects a change in the assumption regarding the timing of a major improvement of the conflict in Syria and the associated security spillovers in Lebanon. Growth is projected to return towards potential in 2016 (at 4 percent). The growth acceleration in 2016 critically hinges on a resolution of the conflict in Syria as well as a marked improvement in the security and political situations in Lebanon.
18. risks to the growth projections remain broadly balanced. While the formation of a new government and the emerging political consensus are positive developments, the new government might be short-lived as presidential elections are scheduled in the last week of May 2014. With the end of the presidential term, the government takes on a care taker capacity until the formation of a new cabinet. The risks of a presidential and governmental vacuum exist if the opposing political factions do not reach a consensus. A renewed
political gridlock, further sectarian tensions and an even more volatile security environment might ensue. Such adverse political developments will weigh down on consumer and investor sentiment. A further worsening of the spillovers from the Syrian conflict and a more volatile security situation would also constitute downside risks to economic growth. Upside growth potential exists if the security situation improves. By ratifying pending legislature (such as the Public Private Partnership law) and overseeing the oil and gas bidding and expropriation process, the new government can contribute to raising growth prospects. A resolution of the Syrian conflict would jumpstart economic growth in Lebanon as the country would be well positioned for the reconstruction in Syria and the security incidents it is facing would abate.
19. While lebanon faces daunting short-term challenges due to the syrian conflict, the country is also beset by structural bottlenecks, including in infrastructure such as electricity, water, transportation and telecommunications. With a new government likely to take office after the presidential elections, the current government has a limited window to engage in much needed long-term structural reforms to address the existing infrastructure bottlenecks in the electricity, water, transportation and telecommunication sectors. These infrastructure bottlenecks are translating into a worsening in Lebanon’s ranking in the World Bank’s ease of doing business indicators. Addressing these bottlenecks is essential for fostering a favorable environment for small to medium size enterprises.
20. lebanon’s fiscal deficits and debt dynamics continue to pose significant risks. The recurring fiscal deficits continue to limit fiscal space, hindering the country’s ability to absorb
ProsPecTs
The World Bank
16 | Prospects
shocks through countercyclical policies and suggest the need to drastically improve the efficiency of government spending. Lebanon will have to rely on expansionary monetary policy, such as the planned stimulus package of BdL in 2014, to boost growth. BdL’s new stimulus package might also entice commercial banks to diversify their investments away from holding sovereign debt by lending to small and medium size enterprises. The increasing debt-to-GDP ratio and recurring fiscal deficits will expose Lebanon to shifts in investor sentiment. An additional source of risk is an increase in interest rates which results in larger debt servicing costs. In fact, the US Federal Reserve (Fed) will “taper-off” its purchases of assets in 2015. The Fed’s tapering-off likely precedes an increase in US interest rates in 2015 or 2016. Given the foreign exchange rate peg of the Lebanese pound to the dollar, an increase in US interest rates will result in higher Lebanese interest rates and, consequently, an increase debt servicing costs.
21. Disruptions to russian oil and gas supplies, due to a worsening of the ukrainian crisis, are likely to adversely affect lebanon. Russia plays an integral role in global oil markets and European countries heavily depend in Russian natural gas imports. Disruptions in Russian supplies of oil and natural gas or imposing sanctions on Russia are likely to ensue in higher global energy prices. Given that Lebanon is a net importer of energy, increased energy prices will result in large trade-in-goods and balance of payments deficits. The Ukrainian crisis might also lead to an increase in global food prices (such as wheat) that would adversely affect the most vulnerable Lebanese households.
22. Water shortages in the levant can negatively affect employment and the livelihood of the most vulnerable lebanese households. Given the low level of precipitation this winter relative to prior years, water shortages in Lebanon are a serious risk. Such shortages would negatively affect the employment in the agricultural sector thereby worsening the conditions of the most vulnerable Lebanese households.
lebanon economic monitor | a sluggish economy in a highly volatile environment
Prospects | 17

A SOVEREIGN WEALTH FUND FOR LEBANON: ISSUES AND PRELIMINARY RECOMMENDATIONSAs Lebanon contemplates prospects of sizeable hydrocarbon discoveries, the country is in the process of designing an institutional framework to manage these resources. One such issue is the establishment of a Sovereign Wealth Fund (SWF), as required by the 2010 Hydrocarbon Law. This Special Focus provides an overview of the various types of SWFs that have been established across countries, draws lessons from these experiences, highlights some pitfalls, and presents preliminary recommendations for Lebanon as it moves towards establishing its SWF. Key among these recommendations is that the Lebanese SWF’s design should include (i) integration with the budget system, (ii) some (limited) flexibility in operational rules, (iii) no (or limited) earmarking but no extra-budgetary spending, (iv) coherence with country investment strategy, and (v) transparency and accountability.
Introduction23. recent studies reveal that lebanon has strong prospects of having substantial hydrocarbon resources, thereby bringing opportunities but also challenges to the country.
Preliminary 3D seismologic mapping of Lebanon’s offshore reveals that the country could have sizeable hydrocarbon resources (mostly gas), potentially worth several times Lebanon’s annual GDP. Such a large discovery could generate new opportunities for Lebanon, such as becoming as net energy exporter of electric power generation using gas. Challenges, however, also arise from such discoveries. These cover a wide spectrum ranging from the political, to the institutional to the governance of the hydrocarbon resources sector and the management of resource revenues. The governance challenges facing Lebanon are especially pronounced given the country’s institutional framework which is characterized by a high public sector corruption perception, weak institutions and susceptibility to civil strife (e.g., Lebanon ranks 127th out of 175 in terms of corruption perceptions). Cognizant of these challenges, the country—though the newly established Lebanese Petroleum Administration (LPA)—has already worked on designing a sound legal and regulatory environment for the bidding and exploration processes. Under such an environment, investors have responded positively to the prospects of exploring Lebanon’s offshore potential.18
24. Theoretical and empirical evidence suggest that countries with good initial conditions are more likely to benefit from non-renewable resource windfalls. Theoretical models point to several channels through which non-renewable resource windfalls would negatively impact an economy and its citizens’ welfare. These include increased rent-seeking (Tornell and Lane, 1999 and Velasco, 1999) or civil strife (Besley and Persson, 2008; Caselli and Coleman, 2011 and Ross, 2006).19
sPecial focus
18 At the pre-qualification round in 2013, the LPA received 54 applications from firms.
19 Tornell and Lane (1999) “The voracity effect,” American Economic Review, Vol. 89, pp. 22-46
Velasco (1999) “A model of endogenous fiscal deficits and delayed fiscal reforms”. In Fiscal Institutions and fiscal Performance, edited by James M. Poterba and Jurgen von Hagen, 37-68. Chicago: University of Chicago Press.
The World Bank
18 | Special Focus
Cross country empirical evidence do find that countries with weak institutions and poor governance have been adversely affected by the discovery of a resource windfall.
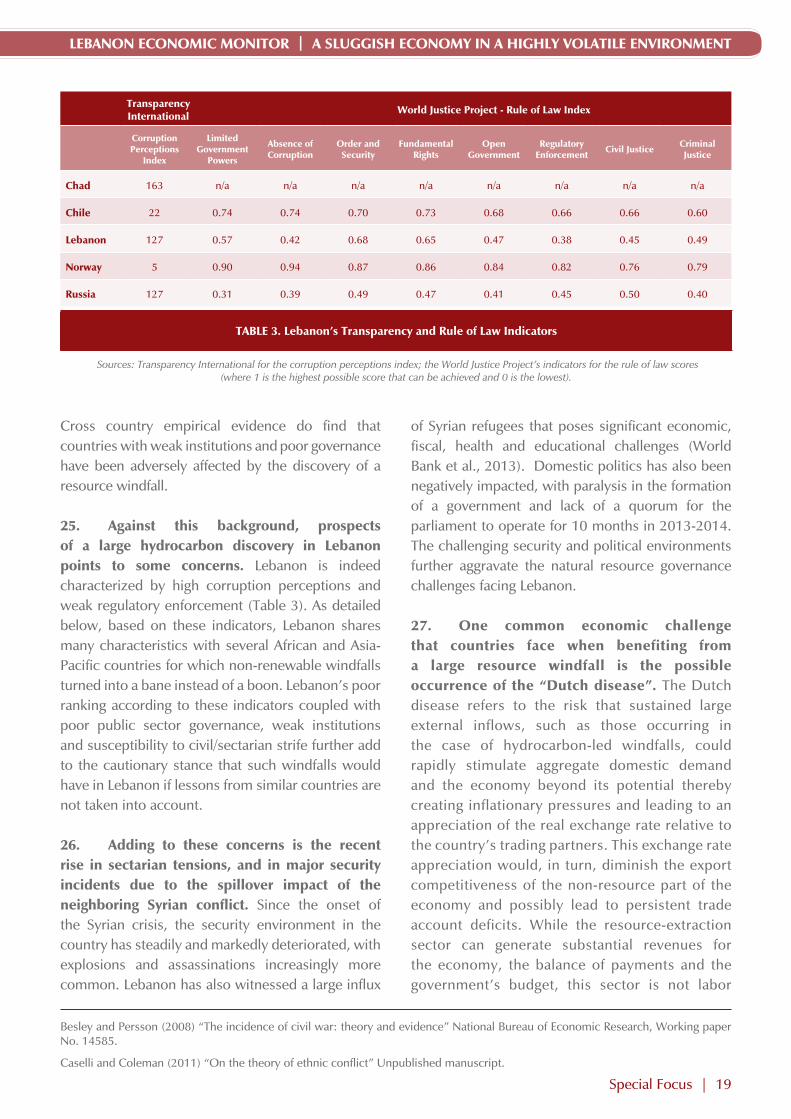
25. against this background, prospects of a large hydrocarbon discovery in lebanon points to some concerns. Lebanon is indeed characterized by high corruption perceptions and weak regulatory enforcement (Table 3). As detailed below, based on these indicators, Lebanon shares many characteristics with several African and Asia-Pacific countries for which non-renewable windfalls turned into a bane instead of a boon. Lebanon’s poor ranking according to these indicators coupled with poor public sector governance, weak institutions and susceptibility to civil/sectarian strife further add to the cautionary stance that such windfalls would have in Lebanon if lessons from similar countries are not taken into account.
26. adding to these concerns is the recent rise in sectarian tensions, and in major security incidents due to the spillover impact of the neighboring syrian conflict. Since the onset of the Syrian crisis, the security environment in the country has steadily and markedly deteriorated, with explosions and assassinations increasingly more common. Lebanon has also witnessed a large influx
of Syrian refugees that poses significant economic, fiscal, health and educational challenges (World Bank et al., 2013). Domestic politics has also been negatively impacted, with paralysis in the formation of a government and lack of a quorum for the parliament to operate for 10 months in 2013-2014. The challenging security and political environments further aggravate the natural resource governance challenges facing Lebanon.
27. one common economic challenge that countries face when benefiting from a large resource windfall is the possible occurrence of the “Dutch disease”. The Dutch disease refers to the risk that sustained large external inflows, such as those occurring in the case of hydrocarbon-led windfalls, could rapidly stimulate aggregate domestic demand and the economy beyond its potential thereby creating inflationary pressures and leading to an appreciation of the real exchange rate relative to the country’s trading partners. This exchange rate appreciation would, in turn, diminish the export competitiveness of the non-resource part of the economy and possibly lead to persistent trade account deficits. While the resource-extraction sector can generate substantial revenues for the economy, the balance of payments and the government’s budget, this sector is not labor
Besley and Persson (2008) “The incidence of civil war: theory and evidence” National Bureau of Economic Research, Working paper No. 14585.
Caselli and Coleman (2011) “On the theory of ethnic conflict” Unpublished manuscript.
Table 3. lebanon’s Transparency and rule of law indicators
Sources: Transparency International for the corruption perceptions index; the World Justice Project’s indicators for the rule of law scores (where 1 is the highest possible score that can be achieved and 0 is the lowest).
Transparency international World Justice Project - rule of law index
corruption Perceptions
index
limited government
Powers
absence of corruption
order and security
fundamental rights
open government
regulatory enforcement civil Justice criminal
Justice
chad 163 n/a n/a n/a n/a n/a n/a n/a n/a
chile 22 0.74 0.74 0.70 0.73 0.68 0.66 0.66 0.60
lebanon 127 0.57 0.42 0.68 0.65 0.47 0.38 0.45 0.49
norway 5 0.90 0.94 0.87 0.86 0.84 0.82 0.76 0.79
russia 127 0.31 0.39 0.49 0.47 0.41 0.45 0.50 0.40
lebanon economic monitor | a sluggish economy in a highly volatile environment
Special Focus | 19

intensive. Hence, any loss in competitiveness from the non-resource part of the economy could potentially result in large employment losses. Given that export of services (e.g., tourism) is of central importance to the Lebanese economy, not least because of its large employment capacity, a real exchange rate appreciation can diminish Lebanon’s export competitiveness (e.g., the country becomes a more expensive destination for tourists) and result in substantial loss of employment. Mitigating this Dutch Disease risk in Lebanon, at least over the medium-term, is the expectation that revenue from the oil wealth will start flowing relatively gradually into the Lebanese economy as extraction capacity, which is years away, progressively expands.
28. in 2010, lebanon passed a first series of legal and institutional measures aimed at managing its upcoming hydrocarbon wealth. On December 4, 2010 the parliament passed the Offshore Petroleum Law (the Petroleum Law thereafter). This Law provides, inter alia, for the establishment of (i) a petroleum administration (which was established in December 2012: the Lebanese petroleum administration or LPA20) and (ii) and a sovereign wealth fund (SWF). Among the core immediate responsibilities of the LPA is the overseeing of the bidding process for offshore petroleum and the assessment of the bids/bidders.
29. Work on one of these legislated institutions—a sovereign wealth fund—however, has yet to be initiated. In this spirit, this Special Focus aims to provide an overview of the various types of SWFs that have been established across countries, draw lessons from these experiences, highlight some pitfalls and draws preliminary recommendations for Lebanon as it moves towards establishing its own sovereign wealth fund.
30. article 3 of the Petroleum law requires that the proceeds from lebanon’s petroleum
activities or rights be placed in a savings fund—a specific type of sovereign wealth fund. Specifically, Article 3 stipulates that “The statute regulating the Fund, the rules for its specific management, the principles of investment and use of proceeds shall be regulated by a specific law, based on clear and transparent principles for investment and use of proceeds that shall keep the capital and part of the proceeds in an investment fund for future generations, leaving the other part to be spent according to standards that will guarantee the rights of the State and avoid serious, short or long-term negative economic consequences.” SWFs with the types of goal included in Article 3, where financial accumulation and use aims to preserve inter-generational equity have been termed as savings funds as their goal is to accumulate savings in order to ensure that all future generations of a country benefit equally from the extraction of non-renewal resources that have taken millions of years to form, not just the generation that happens to live in the country at the time these finite hydrocarbon resources were extracted from the country’s underground.
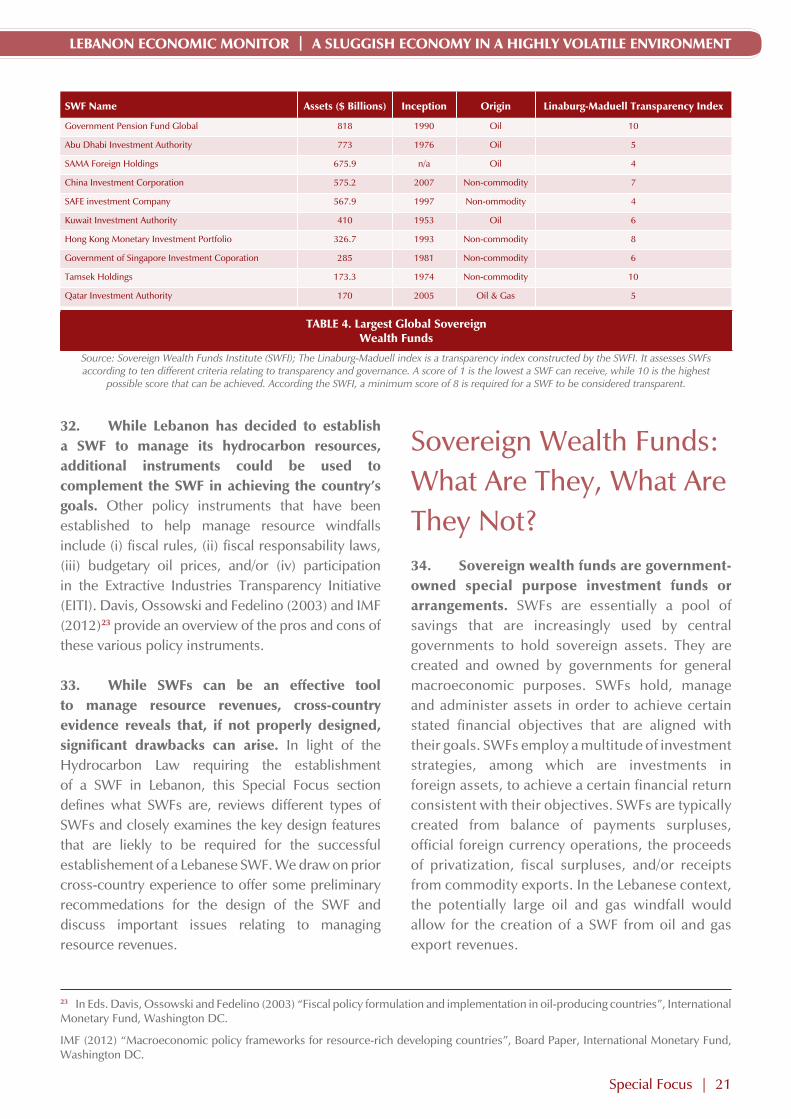
31. given the asset accumulation objective of several sWfs, these funds are rapidly emerging as important global institutional investors with trillion of dollars of assets under management. Table 4 lists the largest ten global SWFs by assets, origin and ranking in terms of Linaburg-Maduell Transparency index. In line with the International Working Group (IWG)’s definition of SWFs, total assets under management by SWFs amounted to approximately US$4 trillion in 2010 (Triki and Faye, 2011). As noted in Triki and Faye (2011),21 SWF managed funds are expected to grow to US$10 trillion by 2015 according to OECD projections. Given the long-term investing objective of several large SWFs, these funds played a stabilizing role in the global financial system in the aftermath of the subprime mortgage credit crisis (Bolton, Samama and Stiglitz, 2013).22
20 For details on licensing, regulations and seismic data, see the LPA’s website: http://www.lpa.gov.lb.
21 Triki and Faye (2011) “Africa’s quest for development: Can sovereign wealth funds help?”, Working paper series, African Development Bank Group.
22 Bolton, Samama and Stiglitz (2013) “Sovereign wealth funds and long-term investing”, Columbia University Press.
The World Bank
20 | Special Focus
32. While lebanon has decided to establish a sWf to manage its hydrocarbon resources, additional instruments could be used to complement the sWf in achieving the country’s goals. Other policy instruments that have been established to help manage resource windfalls include (i) fiscal rules, (ii) fiscal responsability laws, (iii) budgetary oil prices, and/or (iv) participation in the Extractive Industries Transparency Initiative (EITI). Davis, Ossowski and Fedelino (2003) and IMF (2012)23 provide an overview of the pros and cons of these various policy instruments.
33. While sWfs can be an effective tool to manage resource revenues, cross-country evidence reveals that, if not properly designed, significant drawbacks can arise. In light of the Hydrocarbon Law requiring the establishment of a SWF in Lebanon, this Special Focus section defines what SWFs are, reviews different types of SWFs and closely examines the key design features that are liekly to be required for the successful establishement of a Lebanese SWF. We draw on prior cross-country experience to offer some preliminary recommedations for the design of the SWF and discuss important issues relating to managing resource revenues.
Sovereign Wealth Funds: What Are They, What Are They Not?34. sovereign wealth funds are government-owned special purpose investment funds or arrangements. SWFs are essentially a pool of savings that are increasingly used by central governments to hold sovereign assets. They are created and owned by governments for general macroeconomic purposes. SWFs hold, manage and administer assets in order to achieve certain stated financial objectives that are aligned with their goals. SWFs employ a multitude of investment strategies, among which are investments in foreign assets, to achieve a certain financial return consistent with their objectives. SWFs are typically created from balance of payments surpluses, official foreign currency operations, the proceeds of privatization, fiscal surpluses, and/or receipts from commodity exports. In the Lebanese context, the potentially large oil and gas windfall would allow for the creation of a SWF from oil and gas export revenues.
Table 4. largest global sovereign Wealth funds
Source: Sovereign Wealth Funds Institute (SWFI); The Linaburg-Maduell index is a transparency index constructed by the SWFI. It assesses SWFs according to ten different criteria relating to transparency and governance. A score of 1 is the lowest a SWF can receive, while 10 is the highest
possible score that can be achieved. According the SWFI, a minimum score of 8 is required for a SWF to be considered transparent.
23 In Eds. Davis, Ossowski and Fedelino (2003) “Fiscal policy formulation and implementation in oil-producing countries”, International Monetary Fund, Washington DC.
IMF (2012) “Macroeconomic policy frameworks for resource-rich developing countries”, Board Paper, International Monetary Fund, Washington DC.
sWf name assets ($ billions) inception origin linaburg-maduell Transparency index
Government Pension Fund Global 818 1990 Oil 10
Abu Dhabi Investment Authority 773 1976 Oil 5
SAMA Foreign Holdings 675.9 n/a Oil 4
China Investment Corporation 575.2 2007 Non-commodity 7
SAFE investment Company 567.9 1997 Non-ommodity 4
Kuwait Investment Authority 410 1953 Oil 6
Hong Kong Monetary Investment Portfolio 326.7 1993 Non-commodity 8
Government of Singapore Investment Coporation 285 1981 Non-commodity 6
Tamsek Holdings 173.3 1974 Non-commodity 10
Qatar Investment Authority 170 2005 Oil & Gas 5
lebanon economic monitor | a sluggish economy in a highly volatile environment
Special Focus | 21

35. assets held by central banks or state-owned enterprises are not considered part of sWf assets. Foreign reserves held by the central bank for traditional balance of payments or monetary policy purposes and government-employee pension funds are not considered as part of the SWF’s assets. However, this does not preclude the central bank from being the designated manager of SWF assets, given its asset management expertise. Assets managed on the behalf of individuals also do not constitute a part of a SWF’s asset base. Including such assets will lead to double counting.
36. sWfs have disparate legal, institutional, governance structures and objectives. Cross-country experience shows that SWFs can have diverse stated policy objectives. The International Monetary Fund and Santiago principles taxonomy24 identify four different types of SWFs. These are (i) stabilization funds, (ii) savings funds, (iii) development funds and (iv) pension reserve funds. While Lebanon’s legislators have decided that the country should establish a savings fund-type of SWF, it is useful to briefly describe what the objectives of the other types of SWFs are, so as to highlight more clearly the role that will be expected and those that will not be expected of the future Lebanese SWF.
37. stabilization funds aim at insulating the budget and the economy from the effects of commodity price volatility. Given the historically high levels of commodity price volatility, natural resource revenues tend to be volatile. Non-renewable resource revenues are also uncertain and finite due to the uncertainty of resource volume and production as well as the exhaustibility of the natural resource. Resource revenues tend to form a large share of the budget in resource-rich countries. In light of these characteristics of non-renewable resource revenues, a stabilization fund’s goal is to implement counter-cyclical fiscal policy that mitigates the impact of commodity price fluctuations and shields fiscal revenues from external shocks. Several countries,
such as Chile (Economic and Social Stabilization Fund), Timor-Leste, Iran, and Russia (Oil Stabilization Fund) have established a stabilization fund. The investment horizon of stabilization funds is typically short-term and their liquidity objectives resemble those of central banks (Al-Hassan, Papaioannou, Skancke and Sung, 2013). Because of their short-term stabilization focus, stabilization funds tend to largely invest in highly liquid portfolios of assets (Al-Hassan, Papaioannou, Skancke and Sung, 2013).25 Naturally, the flexibility required to have a highly liquid portfolio means that the return on the assets of these SWF is relatively small. Stabilization funds seek to avoid negative nominal returns26 over their investment horizons.
38. The objective of savings funds is to set aside revenues so that current and future generations can all equally benefit from the extraction of the non-renewable resources of the country. Savings funds aim at achieving inter-generational equity and sharing the resource wealth across generations by transforming non-renewable assets into diversified financial assets. Given their long-term investment horizons, savings funds typically have a high risk-return profile that allows them to cover future liabilities. Several countries have established savings funds (e.g., Abu Dhabi Investment Authority, Libya and Russia’s national wealth fund). The primary risk facing savings (or future and endowment) funds is not to meet their real return target over time.
39. Development funds allocate resources to priority socio-economic projects such as infrastructure. Development funds seek to promote long-term fiscal sustainability (i.e., generating alternative non-resource revenues) to support local or national development due to perceived gaps in private sector investment capacity. Development funds exist in the UAE (Mubadala) and Iran (National Development Fund). It is important to note that SWF objectives depend on country specific circumstances. In fact, SWFs may have hybrid (dual or multiple)
24 International Working Group on Sovereign Wealth Funds (2008) “Sovereign wealth funds: Generally Accepted Principles and Practices, “Santiago Principles”
25 Al-Hassan, Papaioannou, Skancke and Sung (2013) “Sovereign wealth funds: Aspects of governance structures and investment management”, IMF Working Paper No. 13/231, Washington DC.
26 Given that these SWFs have to maintain a highly liquid portfolio, their real returns are often negative.
The World Bank
22 | Special Focus

objectives. For instance, an SWF can have dual stabilization and savings objectives (Azerbejian, Bostwana, Trinidad and Tobago), savings and pension objectives (Australia) or stabilization, saving and developmental objectives (Kazakhstan).
40. Pension reserve funds are established to meet identified future pension-related contingent liabilities. Given that the primary objective of this type of SWF is to meet the future liabilities of the government, pension reserve funds typically have long investment horizons. In terms of risk tolerance, pension funds have to avoid not meeting expected benefit payouts. Pension reserve funds are found in resource rich and non-resource rich countries, e.g. Chile and Australia for the former and Ireland and New Zealand for the latter. Some countries have established or converted their savings SWF into a pension reserve fund in order for the public to better understand the long-term commitments that the country has and that the SWF’s assets, which at times can be substantial, are already earmarked to future liabilities of the country. This strengthened understanding of the rationale for the current asset accumulation of the SWF ensures better political and social backing of the need to protect the SWF’s financial assets from short-term spending demands.
Commodity Price Volatility, SWF revenues and the non-resource primary balance: Some analytical issues
41. When considered as an asset class, commodity prices are highly volatile. As noted in Gospodinov and Jamali (2013),27 commodities exhibit higher volatility than other financial assets such as interest rates, exchange rates and stock prices. For instance, Burghardt (2008)28 notes that the annualized volatilities of the 10-year Treasury note, S&P 500 returns, crude oil and natural gas are, respectively, 3.8 percent, 9.7 percent, 38.5 percent and 62.2 percent. ¬Figure 19 and 20 plot the time-series dynamics of the monthly volatilities of the WTI crude oil and the natural gas index as calculated by the World Bank.29 These figures clearly show the prices of crude oil and natural gas exhibit high volatilities. These high volatilities imply, in turn, that
0
5
10
15
20
25
30
35
1993
-12-
01
1994
-09-
01
1995
-06-
01
1996
-03-
01
1996
-12-
01
1997
-09-
01
1998
-06-
01
1999
-03-
01
1999
-12-
01
2000
-09-
01
2001
-06-
01
2002
-03-
01
2002
-12-
01
2003
-09-
01
2004
-06-
01
2005
-03-
01
2005
-12-
01
2006
-09-
01
2007
-06-
01
2008
-03-
01
2008
-12-
01
2009
-09-
01
2010
-06-
01
2011
-03-
01
2011
-12-
01
2012
-09-
01
2013
-06-
01
Volatility of crude oil price Percent
figure 19. crude oil prices are volatile
Source: World Bank and World Bank staff calculations.
0
5
10
15
20
25
30
35
40
1993
-12-
01
1994
-10-
01
1995
-08-
01
1996
-06-
01
1997
-04-
01
1998
-02-
01
1998
-12-
01
1999
-10-
01
2000
-08-
01
2001
-06-
01
2002
-04-
01
2003
-02-
01
2003
-12-
01
2004
-10-
01
2005
-08-
01
2006
-06-
01
2007
-04-
01
2008
-02-
01
2008
-12-
01
2009
-10-
01
2010
-08-
01
2011
-06-
01
2012
-04-
01
2013
-02-
01
2013
-12-
01
Volatility of natural gas index Percent
figure 20. …and so are natural gas prices
Source: World Bank and World Bank staff calculations.
27 Gospodinov and Jamali (2013) “Monetary policy surprises, positions of traders and changes in commodity futures prices”, working paper 2013-12, Federal Reserve Bank of Atlanta.
28 Burghardt (2008) “Volume surges again: global futures and options trading rises 28% in 2007”, Futures Industry Magazine , March/April, 15-26.
29 Volatility is computed as the squared monthly returns on crude oil or natural gas. While different gas prices exist worldwide, the natural gas index provided by the World Bank is used for illustrative purposes. Crude oil is a more fungible commodity than natural gas so that the deviations between different oil prices (Brent and crude oil, for example) are usually not pronounced.
lebanon economic monitor | a sluggish economy in a highly volatile environment
Special Focus | 23

the oil and gas revenues of a Lebanese SWF are highly uncertain and would be very volatile over time. This guaranteed resource revenue uncertainty should, therefore, be accounted for by policy makers.
42. in addition to high price volatility, commodity prices display long-lasting swings that complicate macroeconomic management. The run-up in commodity prices in the mid-2000s illustrates the tendency of commodity prices to exhibit long-lasting swings. This can be seen in the two Figures below. Figure 21 displays the dynamics of two spot price indices of energy and non- energy commodity prices, while Figure 22 shows the dynamics of natural gas and crude oil prices. Figures 21 and 22 demonstrate the large swings that commodity prices exhibit. Resource exhaustibility, commodity price swings as well as the significant commodity price volatility require an adequate analytical framework for macroeconomic management in resource-rich developing countries. The IMF (2012) recommends employing the non-resource primary balance (NRPB) as a key fiscal indicator with a higher non-resource primary deficit indicating an expansionary fiscal stance. Using the NRPB assists policy makers in delinking fiscal policy from resource revenue volatility.
Governance of SWFs43. While governance structures differ across sWfs, there are certain principles of good governance that have been found to be desirable across countries. The Generally Accepted Principles and Practices (GAPP) of the International Working Group on Sovereign Wealth Funds provides detailed recommendations relating to good governance of SWFs.30 In line with the GAPP recommendations, sound governance of SWFs requires (i) an independent board, (ii) professional staff, (iii) transparent reporting and (iv) strong and independent audit functions (see Gelb, Tordo and Halland, 2014 for further details).31
Principles of Sound Governance
44. in the lebanese context which is characterized by weak institutions and high corruption perceptions, adhering to the gaPP principles of sound governance is critical. In line with sound corporate governance principles, the separation of ownership and control forms a cornerstone of good governance. While a SWF is owned by the central government, government officials should not combine ownership and supervisory roles. As noted by Gelb, Toro and Halland (2014), combining ownership and control
0 20 40 60 80
100 120 140 160 180 200
1960
M01
19
62M
02
1964
M03
19
66M
04
1968
M05
19
70M
06
1972
M07
19
74M
08
1976
M09
19
78M
10
1980
M11
19
82M
12
1985
M01
19
87M
02
1989
M03
19
91M
04
1993
M05
19
95M
06
1997
M07
19
99M
08
2001
M09
20
03M
10
2005
M11
20
07M
12
2010
M01
20
12M
02
Energy and non-energy commodity price indexes
Energy Index
Non-Energy Index
Inde
figure 21. long-lasting swings in energy and non-energy commodity prices
Source: World Bank.
0 25 50 75 100 125 150 175 200 225 250
0
20
40
60
80
100
120
140
1982
M01
19
83M
04
1984
M07
19
85M
10
1987
M01
19
88M
04
1989
M07
19
90M
10
1992
M01
19
93M
04
1994
M07
19
95M
10
1997
M01
19
98M
04
1999
M07
20
00M
10
2002
M01
20
03M
04
2004
M07
20
05M
10
2007
M01
20
08M
04
2009
M07
20
10M
10
2012
M01
20
13M
04
Natural gas and crude oil prices
Crude oil, WTI ($/bbl)
Natural gas index (2010=100), rhs
Index US$
figure 22. … are also present for natural gas and crude oil prices
Source: World Bank
30 GAPP principles 4 to 18 provide explicit recommendations relating to sound governance of SWFs.
31 Gelb, Tordo and Halland (2014) “Sovereign wealth funds and domestic investment in resource-rich countries: love me, or love me not?”, Economic Premise, The World Bank.
The World Bank
24 | Special Focus

leads to conflicts of interest situations that can undermine the functioning and integrity of the SWF. Board independence is of crucial importance for the functioning of a SWF and members should be selected according to specific skills and experience. Committees nominating board members should also enjoy independence and objectivity so as to ensure a politically independent selection process. In line with GAPP principle 16, the manner in which the SWF management and ownership are operationally independent should be publicly disclosed.
Staff Recruitment
45. as with any financial institution seeking to meet its investment objectives, the recruitment and retention of competent staff is of central importance for investment success. A SWF should be staffed by experienced and well-trained investment professionals in order to meet its financial objectives. The abundance of human capital in Lebanon and the vast experience of Lebanese expatriates that assume leading positions in the regional and international financial sector should ensure no shortage of such qualified professionals. Lebanon’s thriving banking sector could also be a source of recruitment of well-trained and experienced staff. Recruitment criteria and performance appraisals should be clear, transparent and fundamentally rooted in meritocracy. Staff recruitment should also not be subject to political interference or sectarian considerations. Maintaining gender equality in the recruitment process should also be encouraged.
Transparent Reporting and Auditing
46. Transparency and frequent reporting are critical to reduce risk of ‘raiding’ and rent-seeking. Governance should entail clear reporting lines and accountabilities, clear investment guidelines (e.g., asset allocation, scope for active management, universe of permitted asset classes) to ensure that implementation is consistent with the government’s risk tolerance and broader fiscal policy objectives. Linking staff compensation to external benchmarks may also help to avoid rent-seeking and strengthen transparency while allowing for recruitment of skilled investment professionals. Cash flows should also
pass through the treasury single account to enhance transparency and facilitate cash management.
47. establishing internal and external audit functions for a sWf are a vital component of good governance. Establishing an independent internal audit function, which reports directly to the board of directors of the SWF, is a vital component of good governance. An external audit by an internationally-renowned firm should also be undertaken annually. Annual auditing in accordance with existing national and international accounting standards is in line with GAPP principle 12. The high corruption perceptions in the Lebanese public sector make the establishment of sound internal and external audit functions of vital importance for the efficient functioning of the SWF and for the public to be confident their assets are properly managed.
48. Transparent reporting of activities is another central element of good practice. Transparent internal (to the owner and the board of directors) and public reporting of the objectives of a SWF, its activities, portfolio of assets and returns is another important component of good governance. The requirement for transparent reporting is consistent with GAPP sub-principle 18.3. External public reporting of the holdings, performance and objectives of the SWF would significantly strengthen the incentives for proper management of the SWF’s assets. Such a transparent reporting system is, therefore, essential in the Lebanese context to foster public support for the SWF.
Accumulation and Withdrawal Rules
49. an important design feature for a successful sWf would be to clearly define the rules governing the accumulation and withdrawal of funds from the sWf. Accumulation rules specify the proportion of SWF funds that are to be saved/spent, while withdrawal rules specify the conditions under which the government can withdraw funds from the SWF. Table 5 details several SWF accumulation and withdrawal rules that countries have adopted. A critical requirement for a Lebanese SWF is to establish clear rules that govern the accumulation and withdrawal from the
lebanon economic monitor | a sluggish economy in a highly volatile environment
Special Focus | 25
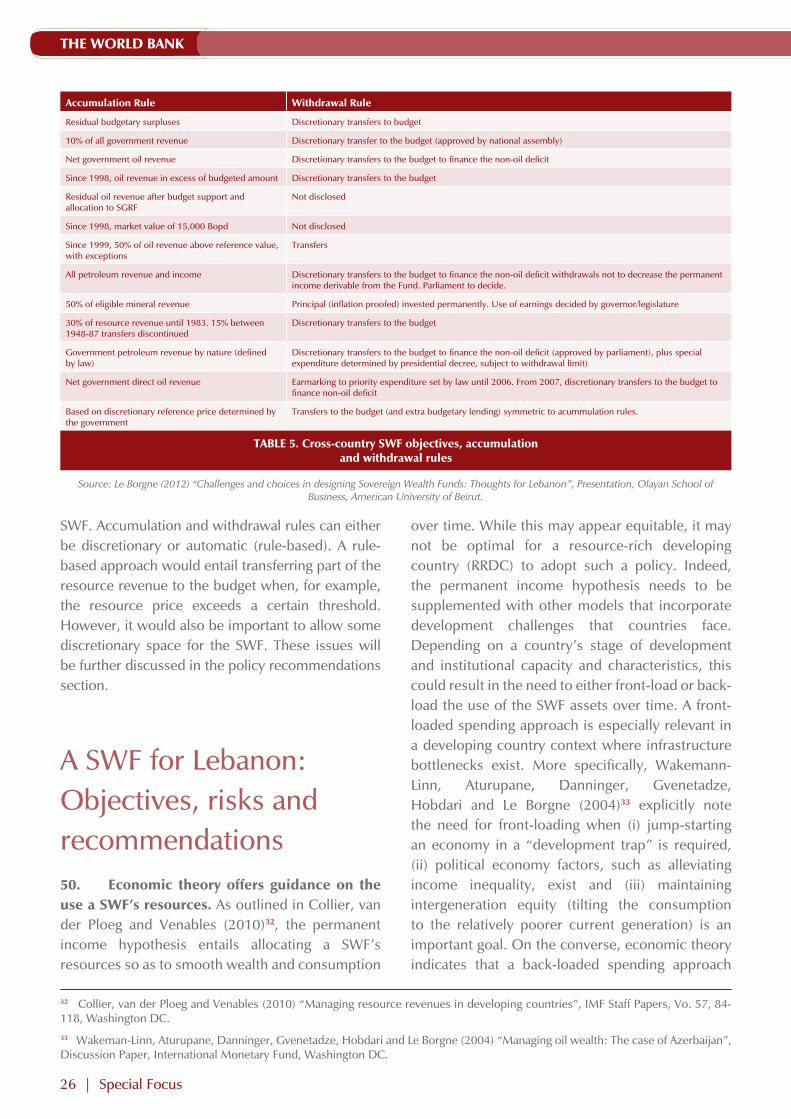
SWF. Accumulation and withdrawal rules can either be discretionary or automatic (rule-based). A rule-based approach would entail transferring part of the resource revenue to the budget when, for example, the resource price exceeds a certain threshold. However, it would also be important to allow some discretionary space for the SWF. These issues will be further discussed in the policy recommendations section.
A SWF for Lebanon: Objectives, risks and recommendations50. economic theory offers guidance on the use a sWf’s resources. As outlined in Collier, van der Ploeg and Venables (2010)32, the permanent income hypothesis entails allocating a SWF’s resources so as to smooth wealth and consumption
over time. While this may appear equitable, it may not be optimal for a resource-rich developing country (RRDC) to adopt such a policy. Indeed, the permanent income hypothesis needs to be supplemented with other models that incorporate development challenges that countries face. Depending on a country’s stage of development and institutional capacity and characteristics, this could result in the need to either front-load or back-load the use of the SWF assets over time. A front-loaded spending approach is especially relevant in a developing country context where infrastructure bottlenecks exist. More specifically, Wakemann-Linn, Aturupane, Danninger, Gvenetadze, Hobdari and Le Borgne (2004)33 explicitly note the need for front-loading when (i) jump-starting an economy in a “development trap” is required, (ii) political economy factors, such as alleviating income inequality, exist and (iii) maintaining intergeneration equity (tilting the consumption to the relatively poorer current generation) is an important goal. On the converse, economic theory indicates that a back-loaded spending approach
accumulation rule Withdrawal rule
Residual budgetary surpluses Discretionary transfers to budget
10% of all government revenue Discretionary transfer to the budget (approved by national assembly)
Net government oil revenue Discretionary transfers to the budget to finance the non-oil deficit
Since 1998, oil revenue in excess of budgeted amount Discretionary transfers to the budget
Residual oil revenue after budget support and allocation to SGRF
Not disclosed
Since 1998, market value of 15,000 Bopd Not disclosed
Since 1999, 50% of oil revenue above reference value, with exceptions
Transfers
All petroleum revenue and income Discretionary transfers to the budget to finance the non-oil deficit withdrawals not to decrease the permanent income derivable from the Fund. Parliament to decide.
50% of eligible mineral revenue Principal (inflation proofed) invested permanently. Use of earnings decided by governor/legislature
30% of resource revenue until 1983. 15% between 1948-87 transfers discontinued
Discretionary transfers to the budget
Government petroleum revenue by nature (defined by law)
Discretionary transfers to the budget to finance the non-oil deficit (approved by parliament), plus special expenditure determined by presidential decree, subject to withdrawal limit)
Net government direct oil revenue Earmarking to priority expenditure set by law until 2006. From 2007, discretionary transfers to the budget to finance non-oil deficit
Based on discretionary reference price determined by the government
Transfers to the budget (and extra budgetary lending) symmetric to acummulation rules.
Table 5. cross-country sWf objectives, accumulation and withdrawal rules
Source: Le Borgne (2012) “Challenges and choices in designing Sovereign Wealth Funds: Thoughts for Lebanon”, Presentation, Olayan School of Business, American University of Beirut.
32 Collier, van der Ploeg and Venables (2010) “Managing resource revenues in developing countries”, IMF Staff Papers, Vo. 57, 84-118, Washington DC.
33 Wakeman-Linn, Aturupane, Danninger, Gvenetadze, Hobdari and Le Borgne (2004) “Managing oil wealth: The case of Azerbaijan”, Discussion Paper, International Monetary Fund, Washington DC.
The World Bank
26 | Special Focus
would be warranted when rapid SWF expenditures are constrained by (i) capacity constraints, (ii) Dutch disease considerations, (iii) governance and intergenerational equity issues, and (iv) unknown future liabilities (such as pension liabilities). Recently, a hybrid recommendation has emerged in which revenues could be “parked” in a short-term fund to be phased in to the economy as concomitant improvements in absorption capacity are being made. Such an approach needs to balance the risks that the fund could be tapped prematurely with loss of public support for the fund if it is not seen as meeting the needs of the country due to excessive back-loading. In Lebanon, a thorough analysis of the disbursement profile of the SWF is warranted as the country combines features that would warrant either a front- or a back-loading of the resources so that the net impact is uncertain.
51. several institutional risk factors should be accounted for and mitigated when designing a newly established sWf. Lebanon suffers from high structural fiscal deficits and the downward trend in the debt-to-GDP ratio has recently reversed. The fiscal challenges facing the country create significant institutional risks for a newly established Lebanese SWF. Specifically, a Lebanese SWF might be prone to direct or indirect raiding. Direct raiding occurs when the fund’s resources are used for purposes other than originally intended. Indirect raiding refers to excessive debt accumulation on the back of the fund’s resources. Contingent liabilities, for example from the financial sector, are another potential source of indirect raiding. Given Lebanon’s fiscal challenges, indirect raiding constitutes a key institutional risk facing the SWF. Another important institutional risk is the inefficient management of the SWF’s funds (due to, for example, corruption or mismanagement if the Fund is, for example, staffed based on confessional considerations rather than meritocratic ones). As detailed below, these challenges should be mitigated using clear legal and institutional arrangements that are specific to Lebanon.
52. cross-county experience, especially in the asia-Pacific island countries, shows that sWfs have not been always successful in achieving fiscal goals. As documented in Le Borgne and Medas (2007),34 many Asia-Pacific countries face significant fiscal challenges. These fiscal challenges include volatile government spending and fiscal deficits, the accumulation of expensive debts and/or payment arrears and significant or complete depletion of the SWF resources. The causes of the fiscal challenges range from poor cash management coupled with rigid SWF withdrawal rules (e.g., Marshall islands and Tuvalu), to depletion of reserves due to required contributions to SWF (e.g., Marhsall Islands), to use of SWF funds as collateral to finance fiscal deficits (e.g., Papua New Guinea, Nauru), to risky and/or undiversified investments, and to mismanagement and poor governance (e.g., Nauru). Given its fiscal challenges and some institutional weaknesses, Lebanon is particularly prone to these challenges. The lessons learned from these cross-country experiences and the ensuing recommendations for Lebanon will be discussed next.
53. The governance problems that negatively affected the performance of african sWfs exemplify some additional risks facing a lebanese sWf. Triki and Faye (2011) note that governance problems in African SWFs arise from a lack of institutional arrangements, lack of transparency as well as high corruption. Chad, a country similar to Lebanon in terms of high corruption perceptions (see Table 3), faced governance problems due to poor enforceability of existing institutional arrangements. For instance, Chad amended its national revenue management law in 2005 in order to increase the share of oil revenues going into the budget. The country subsequently introduced discretionary expenses and cancelled the fund for future generations. Notwithstanding Lebanon’s middle income status, the country’s ranking in terms of corruption perceptions and rule of law make the country more directly comparable with developing
34 Le Borgne and Medas (2007) “Sovereign wealth funds in the pacific island countries: macro-fiscal linkages”, Working Paper 07/297, International Monetary Fund, Washington DC.
35 This should not be construed to imply that a Lebanese SWF would necessarily mimic the Chadian experience as Lebanon differs in many other important respects from Chad, for example Lebanon enjoys abundant human capital, including a well-established and regarded banking system and diaspora from which experienced fund managers could be drawn from to efficiently manage a SWF.
lebanon economic monitor | a sluggish economy in a highly volatile environment
Special Focus | 27

nations that have struggled to cope with large influx of non-renewable resources (see Table 3).35
54. The cross-country lessons and experience with sWfs should critically inform the design of a lebanese sWf. In light of Lebanon’s fiscal, institutional, and governance challenges, the SWF design and objectives should be consistent with an overall fiscal and macroeconomic framework for the country. The SWF’s design should include strong outflow controls and cash management needed for the SWF to achieve the objectives of limiting the size and the volatility of spending. Accumulation and withdrawal rules should always be clearly defined. It should be noted, however, that rigid operational rules related to having a savings fund—which is what Lebanon’s legislators have decided the country would have—would limit (by design) the ability to use the SWF funds for fiscal stabilization and, potentially, to adjust to changing circumstances. Having a savings SWF and using it for stabilization purposes would likely result in large financial losses for the Lebanon SWF and ultimately defeat its policy objective and societal goal of providing benefits for future generation of Lebanese.36 The asset management strategy (including the choice of the risk-return tradeoff) must be consistent with the SWF policy objectives. This inconsistency has been the cause of many bad experiences with SWFs around the world.
55. a lebanese sWf’s design should have limited flexibility, be transparent and integrated within the country’s fiscal systems and consistent with its investment strategies. A number of desirable design features should be implemented in a newly established Lebanese SWF. These include (i) integration with the budget system, (ii) some (limited) flexibility in operational rules, (iii) no (or limited) earmarking but no extra-budgetary spending, (iv) coherence with country investment strategy, and (v) transparency and accountability. We provide further details regarding each of these design features below.
56. a lebanese sWf’s revenues should be integrated with the budget systems (integrated in the sense that its outflows should go to the government budget and not outside, such as to an extra budgetary fund). Such integration would ensure that spending decisions are aligned with fiscal policy and address fungibility challenges (e.g., Norway, Timor Leste). In principle, a SWF should not duplicate the budgetary functions of the Ministry of Finance (MoF). Spending and fiscal policy decisions should remain with the government and the SWF should transfer resources to the budget, as warranted under the SWF’s outflow rules.
57. The sWf should have limited flexibility in operational rules. While adopting flexible deposit and withdrawal rules would facilitate the use of funds for stabilization this would run counter to the savings objective that Lebanese legislators have decided in the 2010 Hydrocarbon Law. However, limited flexibility might be warranted and allowed under exceptional circumstances (e.g., national disaster). In such cases, the financial needs of the country and the cost at which the country might have to borrow could be so high that using slightly more of the SWF funds than usual would be in the long-run interest of the country. This use of the limited flexibility that could be allowed as part of the SWF operational rules should clearly be exceptional as otherwise it would rapidly deplete the assets accumulated in the SWF.
58. The sWf should have no (or at worst limited) earmarking and should not be allowed to finance extra-budgetary spending. Limiting earmarking of the SWF outflow transfers and preventing extra-budgetary spending by the SWF permits (i) flexibility in adjusting to changing conditions and priorities (as decided by the government’s annual budget and as approved by Parliament), (ii) efficiency of spending through competition for resource between priority areas, (iii) simpler liquidity management, and (iv) enhanced transparency and governance.
36 As discussed earlier, a savings SWF would have as a financial objective to match the returns of long-term indices. To do so it would have to invest in asset classes with high risk-return, and therefore high price volatility and potentially limited liquidity (e.g., real estate, private equity). Should politicians during a recession require the SWF to liquidate its assets to help pay for a fiscal stimulus program, then the SWF would have to liquidate some of its non-liquid and high volatility portfolio at the worst time (when assets prices of high risk-return assets are significantly down). Such a misalignment between the investment strategy required of the SWF and the use of the SWF assets would result in large financial losses.
The World Bank
28 | Special Focus

59. a sWf’s investment policy should be coherent with the country’s overall investment strategy. Integrating the SWF’s investment strategy into the country’s broader fiscal and asset management strategies avoids financially ill-advised situations where a country could be simultaneously holding public debt on expensive terms while accumulating assets in a SWF for which the financial returns are below the interest rate paid on its debt. Such integration would be of central importance for Lebanon – a country with sizeable internal and external debt. As with any institutional investor, a SWF portfolio allocation strategy should aim at maximizing risk-adjusted financial returns conditional on the underlying fiscal objectives. Lebanon’s overall balance sheet contains significant liabilities. The large public debt coupled with a high fixed interest rate on foreign currency denominated debt (the average weighted interest rate on Eurobonds was 6.49 percent in October 2013) entails sizeable outflows. A Lebanese SWF should take into account Lebanon’s significant liabilities when deciding its portfolio allocation. That is, the investment allocation decisions, risk tolerance levels and return targets of the SWF should account for Lebanon’s significant future debt outflows.
60. from a purely financial perspective,37 it is likely that some revenue from lebanon’s hydrocarbon resources should initially be used to pay down some of the country’s debt. From an asset-liability perspective, it is likely that, in the first few years when hydrocarbon resources are turned into financial assets, rapid asset accumulation of SWF assets might not be desirable; instead, repaying some of the country’s sovereign debt to a lower debt-to-GDP ratio so as to generate a large drop in the country’s risk premium could be desirable. Several benefits would arise from this strategy. First, a lower sovereign risk premium would reduce the total cost of Lebanon’s public debt (i.e., a reduction in Lebanon’s debt-to-GDP ratio to, say, 100 percent would reduce the interest cost of these entire 100 percent of GDP; if as a result of the repayment of
some of Lebanon’s public debt, the risk premium on Lebanon’s debt were reduced by 100 basis points—a reasonable assumption—this would save the annual budget 1 percent of GDP (or US$4.4 billion every year based on 2014 GDP). Second, Lebanon’s lower debt level would result in an improved sovereign rating for the country. This in turn would lower interest rates at which the private sector can borrow (e.g., banks financing cost would be reduced, as would firms’ and households’ borrowing costs). This would improve the competitiveness of the economy and boost growth. At some point, once Lebanon’s risk premium has been reduced sufficiently, the payoff on further reducing the country’s debt as opposed to accumulating financial assets more rapidly in the SWF would no longer be justified. At that time, outflows from the SWF should be significantly reduced (instead of being used in an accelerated manner to pay down some of the country’s debt) so that assets rapidly accumulate in the SWF.
61. Transparency and accountability should be core design features of a newly established sWf. Fund oversight, including performance reports, external audits and clear standards for disclosure of information can promote better performance, limit corruption and build public confidence in the management of resource revenues. This, in turn, will foster public support for the fund.
37 As noted in paragraph 49, financial considerations are only one of the factors to consider regarding the best use of the SWF resources. Thus, once all factors, such as economic, institutional, governance, financial are taken into account, it could be that rapidly repaying Lebanon’s large public debt is not warranted.
lebanon economic monitor | a sluggish economy in a highly volatile environment
Special Focus | 29

NEW COINCIDENT AND LEADING INDICATORS FOR THE LEBANESE ECONOMYWeak economic statistics in Lebanon impede economic analysis and decision making. To remedy this, World Bank staff developed two indicators of economic activity for Lebanon: a coincident indicator (WB-CI) and a leading indicator (WB-LI). These indicators, which are based on an expanded NBER-Conference Board methodology, reveal promising statistical properties that should make them valuable coincident and leading (one-year ahead) indicators for the Lebanese economy. Based on these indicators, GDP growth for 2012 and 2013 is estimated to be, respectively, 2.2 and 0.9 percent while growth in 2014 is predicted to reach 1.5 percent. Aside from having a high degree of accuracy, both indicators are of relatively high (monthly) frequency and are available with a relatively small time lag (2-3 months), which make them ideally suited for economic analysts, investors, and policy makers alike. In contrast to the BdL-CI, the WB-CI points to a deceleration in economic activity during the first ten months of 2013, which, if sustained over a few more months, would warrant a different monetary policy stance than the one based on the BdL-CI. This monetary policy example highlights the critical importance of having accurate, high frequency, and timely economic indicators.
Introduction62. lebanon’s weak economic statistics are impeding timely decision making by businesses, investors and policy makers. The quality of economic
statistics in Lebanon has been extremely weak, not only in terms of data compilation and frequency, but also relative to countries with similar level of development (IMF, 2012).38 Statistical weaknesses include areas such as national accounts, balance of payments, prices and inflation, and labor and social measures. For example, the Consumer Price Index (CPI) as measured by the Central Administration of Statistics (CAS) does not accurately reflect the dynamics of aggregate prices in Lebanon because rental surveys, which account for 16 percent of the CPI basket, are only undertaken every three years, leading to unexpected jumps in the housing sub-component of the CPI. Furthermore, CAS did not collect CPI data from January to May 2013 resulting in a break in the CPI series. On the labor market front, the latest official unemployment rate dates from 2009, as indicated on CAS’s website. The country does not have labor force surveys. Notwithstanding recent improvements in the compilation of national accounts,39 Lebanon’s latest GDP data are from 2011 and are only available on an annual basis.
63. faced with weak economic statistics, the private sector started recently to develop new indices that would assist in understanding the economic situation in lebanon in a timelier basis. For example, the dynamics of private consumption which constituted 88.7 percent of GDP in 2011 (latest actual data) can be proxied using the monthly consumer confidence index produced by “ARA Research & Consultancy”.40 In order to analyze private sector economic activity, BLOM bank and Markit launched in November 2013 a new indicator called the BLOM Purchasing Managers’ Index (BLOM PMI).41 To capture the activity of the retail sector which accounted for 14.4 percent of GDP in 2011, the Beirut Traders Association (BTA) launched in 2012 and in partnership with Fransabank the “Beirut Traders Association – Fransabank Retail Index”, with Q4-2011 as the base year. Moreover, and in order to reflect
38 February 2012 , 2011 Article IV Consultation, IMF.
39 In October 2013, CAS published for the first time revised national accounts from 2004-2011 using (i) new data (VAT returns, imports of services and the latest household budget survey 2011-2012) and (ii) a revised National Accounts framework that is consistent with the latest international standards (UN SNA 2008).
40 Another indicator of the level of consumer confidence in Lebanon would be the Byblos Bank/AUB consumer confidence index; however this indicator is published with a six to nine months lag. As of February 2014, the latest Byblos Bank/AUB Index dates back to June 2013.
41 The PMI is an indicator used by policy makers, economists and investors to forecast GDP growth and/or make investment decisions.
The World Bank
30 | Special Focus

the dynamics of the private sector investment which represented 23.3 percent of GDP in 2011, the BTA and BankMed designed a “Beirut Traders Association - BankMed Investment Index” starting from Q3-2013.
64. To provide a more timely and comprehensive assessment of economic activity in lebanon, banque du liban (bdl) and the international institute of finance (iif) separately developed coincident indicators. The former, which we denote by “BdL-CI”, was developed in 1993, immediately following the end of the civil war and is composed of eight variables.42 Notwithstanding the profound structural changes in Lebanon’s economy that took place since the end of the civil war, the weights of the eight BdL-CI variables in the index have remained fixed since 1993. The latter, denoted by “IIF-CI”, follows the same approach as the BdL-CI but includes an additional five variables (IIF, 2010).43
65. While providing useful gauge of economic activity in lebanon, analysis reveals that statistical properties of these two coincident indicators—such as accuracy and unbiasedness—could be improved. As illustrated Figure 23, the IIF-CI, for example, consistently underestimated actual GDP growth between 2006 and 2011. While the BdL-CI has no systematic estimation error, its accuracy has recently been weak as the gap between the BdL-CI and actual growth has been relatively large in several years, and in one year (2006), the BdL-CI also qualitatively misdiagnosed the strength of economic activity (the BdL-CI signaled that the economy was contracting by 1.4 percent while it actually grew by 1.6 percent).
66. To improve the timeliness and accuracy of estimates of economic activity in lebanon, World bank staff designed two new indicators for the lebanese economy: a coincident (Wb-ci) and a leading (Wb-li) indicator. The starting point in developing these composite indices is the NBER-
Conference Board approach,44 modified by the use of minimization and calibration techniques to improve statistical properties of the two indicators. Specifically, the novelty of these two WB indicators compared to the NBER-Conference Board approach is in the choice of weights assigned to each variable. The weights are chosen so that the yearly growth rate of the () converges to the yearly growth rate of at any point in time t. This Special Focus presents a brief historical overview of coincident and leading indicators, describes the methodology used to construct the WB-CI and WB-LI, and finally presents and discusses the results.
Literature Review67. Depending on the quality of statistics in a given country, two distinct methodologies can be adopted to design composite indices. Two main methodologies have been used to develop coincident and leading indicators: (i) the National Bureau of Economic Research (NBER) and/or Conference Board (CB) methodology and (ii) the Stock and
42 BdL-CI is composed of the following eight variables: electricity production (Volume terms), imports of petroleum derivatives (Volume terms), M3 (in monetary terms), cleared checks (in monetary terms) total airport passengers (Volume terms), cement deliveries (Volume terms) and imports and exports (in monetary terms).
43 The IIF-CI includes the following five additional variables “real growth in credit to the private sector (instead of growth in deposits), growth in tourist arrivals (instead of passengers arrivals), real growth in government revenues excluding grants, real growth in government consumption (current expenditure minus transfers minus interest payments), and real growth in imports of machinery and equipment”. For details, see Iradian and Zouk (2010) “Lebanon: New Estimates Reveal Exceptional Growth”, Institute of International Finance, Washington DC.
44 For further details see http://www.conference-board.org/data/bci/index.cfm?id=2154
-4
-2
0
2
4
6
8
10
12
14
16
2006 2007 2008 2009 2010 2011
Yearly growth rates of BDL-CI, IIF-CI and real GDP
Real GDP BDL-CI IIF-CI
Percent
figure 23. current coincident indicators of the lebanese economy have performed relatively weakly
over recent years.
Source: BDL, CAS, IIF and WB staff calculations.
lebanon economic monitor | a sluggish economy in a highly volatile environment
Special Focus | 31

Watson (SW, 1989) methodology.45 While the NBER-CB approach is not based on a theoretical model, the SW methodology is based on advanced econometric techniques such as dynamic factor or Markov switching models. Although the latter provides a proper statistical framework, the former can be applied in countries that suffer from weak statistical systems (like Lebanon). The NBER-CB approach also has the important advantage of being easy to construct, explain and analyze. These are valuable properties in constructing composite indices aimed at a wide public.
68. The idea of quantitatively monitoring a business cycle was firstly introduced in 1938 by a research team at the nber.46 This team which was led by Wesley Mitchell and Arthur Burns examined the dynamics of some economic variables to investigate whether these changes lagged, led or coincided with changes observed in US business cycles. Twenty years later, and based on Burns and Mitchell’s research conducted in 1946,47 Moore and Shiskin (1967)48 developed for the first time a methodology to construct composite indices of real economic activity. They designed “a scoring plan that has been developed to help in the evaluation and selection of indicators” (Moore and Shiskin, 1967). The scoring plan of each variable was based on (i) statistical adequacy (ii) timeliness of publication (iii) smoothness (iv) economic significance (v) historical business cycle conformity and (vi) cyclical timing. This approach which was adopted by the Conference Board in 1995 and developed further on is, however, subject to some criticism. In addition to being described as a “measurement
without theory” by Koopmans (1946)49 many econometricians (according to Marcellino, 2005)50 argued that the NBER-CB methodology did not rely on any econometric techniques as the selected variables and their respective weights were subjectively chosen.
69. in a first attempt to respond to these criticisms, stock and Watson (1989) developed an econometric model to construct new coincident and leading indicators for the us. In their method, the coincident indicator (or Index) is represented by an unobserved reference cycle representing what they call the “state of the economy”. The Index formed is then measured using a dynamic factor model, where the parameters of the series51 forming the index are estimated using the maximum likelihood and the Kalman filter methods. In addition, they developed a leading indicator that forecasts the growth of the coincident indicator over the next six months, using a set of variables52 in a Vector Autoregressive model (VAR).
70. economic research examining business cycles in emerging countries accelerated during the last decade. Historically, economic research in this area was focused on developed countries. However, as a result of the improvement witnessed in the quality and frequency of data in emerging countries, economists were able during the last decade to better analyze business cycles and develop, in many of these countries, coincident and/or leading indicators. For example, Saadi-Sedik and Mongardini (200353 presented an econometric model to construct coincident and leading indicators for Jordan, while Elias Pereira constructed in 2012 a coincident
45 Stock and Watson (1989) “New Indexes of Coincident and Leading Economic Indicators”, Cambridge, Massachuseets: NBER Macroeconomic Annual Report, pp. 351-394
46 Stock and Watson (1989) “The business cycle commonly refers to co-movements in different forms of activity, not just fluctuations in GNP.”
47 Burns and Mitchell (1946) “Measuring business cycles”, NBER Studies in Business Cycles No. 2,New York.
48 Moore and Shiskin (1967) “Indicators of Business Expansion and Contractions”, NBER Occasional paper 103.
49 Koopmans (1947) “Measurement without theory”, Review of Economics and Statistics 29, 161–179.
50 Marcellino (2005) “Leading Indicators: What have we learned?”, Centre for Economic Policy Research, Discussion Paper No. 4977.
51 The four variables that composed the coincident indicator proposed by Stock and Watson (1989) were: employee-hours in nonagricultural establishments, industrial production, real personal income less transfer payments and real manufacturing and trade sales.
52 The variables used in the construction of a leading indicator were: Average weekly hours of production, Average weekly initial claims of state unemployed insurance, manufacturing new orders, S&P 500, building permits, M2 and change in business and consumer credit outstanding.
53 Saadi-Sedik and Mongardini (2003) “Estimating Indexes of Coincident and Leading Indicators: An application to Jordan”, IMF Working Paper No. 03/170, Washington DC.
The World Bank
32 | Special Focus
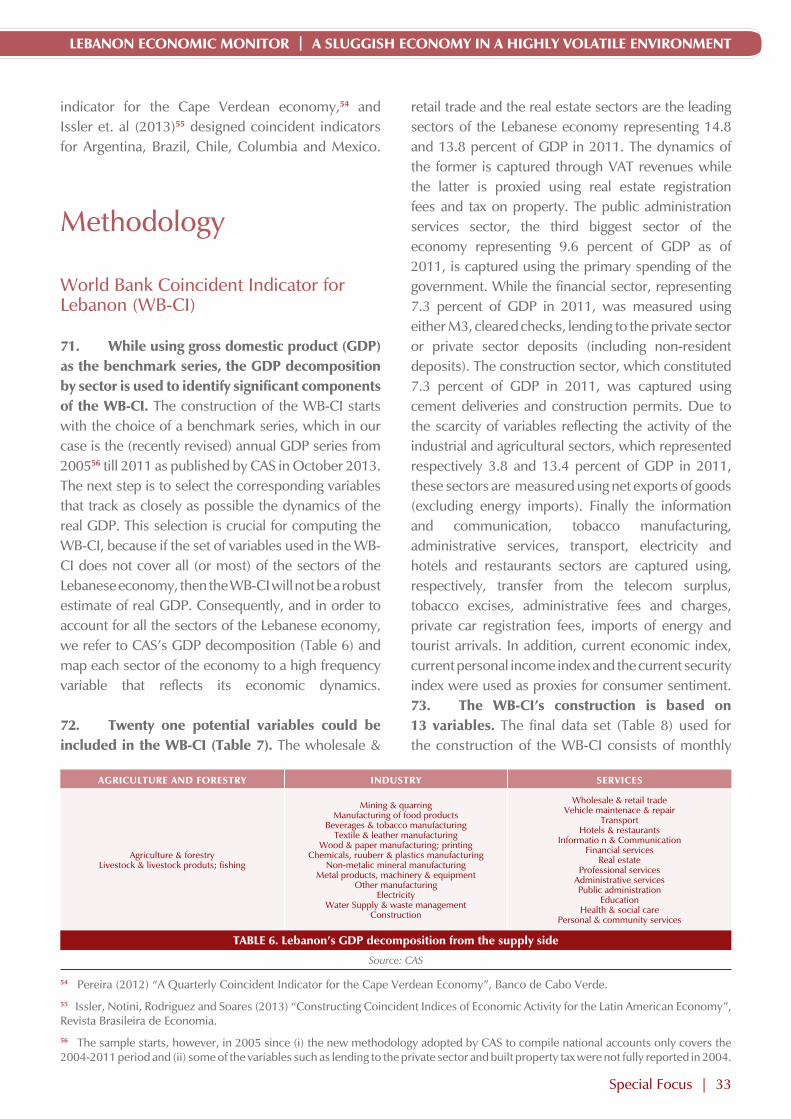
Table 6. lebanon’s gDP decomposition from the supply side
Source: CAS
indicator for the Cape Verdean economy,54 and Issler et. al (2013)55 designed coincident indicators for Argentina, Brazil, Chile, Columbia and Mexico.
Methodology
World Bank Coincident Indicator for Lebanon (WB-CI)
71. While using gross domestic product (gDP) as the benchmark series, the gDP decomposition by sector is used to identify significant components of the Wb-ci. The construction of the WB-CI starts with the choice of a benchmark series, which in our case is the (recently revised) annual GDP series from 200556 till 2011 as published by CAS in October 2013. The next step is to select the corresponding variables that track as closely as possible the dynamics of the real GDP. This selection is crucial for computing the WB-CI, because if the set of variables used in the WB-CI does not cover all (or most) of the sectors of the Lebanese economy, then the WB-CI will not be a robust estimate of real GDP. Consequently, and in order to account for all the sectors of the Lebanese economy, we refer to CAS’s GDP decomposition (Table 6) and map each sector of the economy to a high frequency variable that reflects its economic dynamics.
72. Twenty one potential variables could be included in the Wb-ci (Table 7). The wholesale &
retail trade and the real estate sectors are the leading sectors of the Lebanese economy representing 14.8 and 13.8 percent of GDP in 2011. The dynamics of the former is captured through VAT revenues while the latter is proxied using real estate registration fees and tax on property. The public administration services sector, the third biggest sector of the economy representing 9.6 percent of GDP as of 2011, is captured using the primary spending of the government. While the financial sector, representing 7.3 percent of GDP in 2011, was measured using either M3, cleared checks, lending to the private sector or private sector deposits (including non-resident deposits). The construction sector, which constituted 7.3 percent of GDP in 2011, was captured using cement deliveries and construction permits. Due to the scarcity of variables reflecting the activity of the industrial and agricultural sectors, which represented respectively 3.8 and 13.4 percent of GDP in 2011, these sectors are measured using net exports of goods (excluding energy imports). Finally the information and communication, tobacco manufacturing, administrative services, transport, electricity and hotels and restaurants sectors are captured using, respectively, transfer from the telecom surplus, tobacco excises, administrative fees and charges, private car registration fees, imports of energy and tourist arrivals. In addition, current economic index, current personal income index and the current security index were used as proxies for consumer sentiment.73. The Wb-ci’s construction is based on 13 variables. The final data set (Table 8) used for the construction of the WB-CI consists of monthly
54 Pereira (2012) “A Quarterly Coincident Indicator for the Cape Verdean Economy”, Banco de Cabo Verde.
55 Issler, Notini, Rodriguez and Soares (2013) “Constructing Coincident Indices of Economic Activity for the Latin American Economy”, Revista Brasileira de Economia.
56 The sample starts, however, in 2005 since (i) the new methodology adopted by CAS to compile national accounts only covers the 2004-2011 period and (ii) some of the variables such as lending to the private sector and built property tax were not fully reported in 2004.
agriculTure anD foresTry inDusTry services
Agriculture & forestryLivestock & livestock produts; fishing
Mining & quarringManufacturing of food products
Beverages & tobacco manufacturingTextile & leather manufacturing
Wood & paper manufacturing; printingChemicals, ruuberr & plastics manufacturing
Non-metalic mineral manufacturingMetal products, machinery & equipment
Other manufacturingElectricity
Water Supply & waste managementConstruction
Wholesale & retail tradeVehicle maintenace & repair
TransportHotels & restaurants
Informatio n & CommunicationFinancial services
Real estateProfessional services
Administrative servicesPublic administration
EducationHealth & social care
Personal & community services
lebanon economic monitor | a sluggish economy in a highly volatile environment
Special Focus | 33
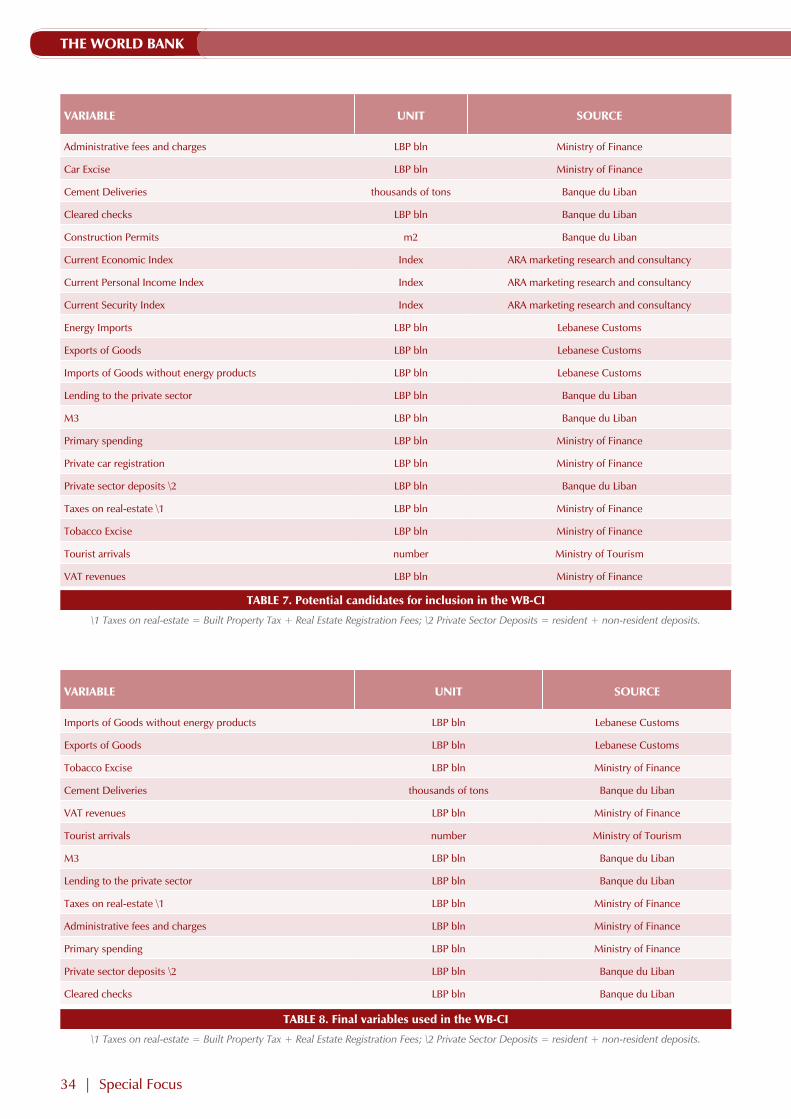
Table 7. Potential candidates for inclusion in the Wb-ci
\1 Taxes on real-estate = Built Property Tax + Real Estate Registration Fees; \2 Private Sector Deposits = resident + non-resident deposits.
Table 8. final variables used in the Wb-ci
\1 Taxes on real-estate = Built Property Tax + Real Estate Registration Fees; \2 Private Sector Deposits = resident + non-resident deposits.
variable uniT source
Administrative fees and charges LBP bln Ministry of Finance
Car Excise LBP bln Ministry of Finance
Cement Deliveries thousands of tons Banque du Liban
Cleared checks LBP bln Banque du Liban
Construction Permits m2 Banque du Liban
Current Economic Index Index ARA marketing research and consultancy
Current Personal Income Index Index ARA marketing research and consultancy
Current Security Index Index ARA marketing research and consultancy
Energy Imports LBP bln Lebanese Customs
Exports of Goods LBP bln Lebanese Customs
Imports of Goods without energy products LBP bln Lebanese Customs
Lending to the private sector LBP bln Banque du Liban
M3 LBP bln Banque du Liban
Primary spending LBP bln Ministry of Finance
Private car registration LBP bln Ministry of Finance
Private sector deposits \2 LBP bln Banque du Liban
Taxes on real-estate \1 LBP bln Ministry of Finance
Tobacco Excise LBP bln Ministry of Finance
Tourist arrivals number Ministry of Tourism
VAT revenues LBP bln Ministry of Finance
variable uniT source
Imports of Goods without energy products LBP bln Lebanese Customs
Exports of Goods LBP bln Lebanese Customs
Tobacco Excise LBP bln Ministry of Finance
Cement Deliveries thousands of tons Banque du Liban
VAT revenues LBP bln Ministry of Finance
Tourist arrivals number Ministry of Tourism
M3 LBP bln Banque du Liban
Lending to the private sector LBP bln Banque du Liban
Taxes on real-estate \1 LBP bln Ministry of Finance
Administrative fees and charges LBP bln Ministry of Finance
Primary spending LBP bln Ministry of Finance
Private sector deposits \2 LBP bln Banque du Liban
Cleared checks LBP bln Banque du Liban
The World Bank
34 | Special Focus
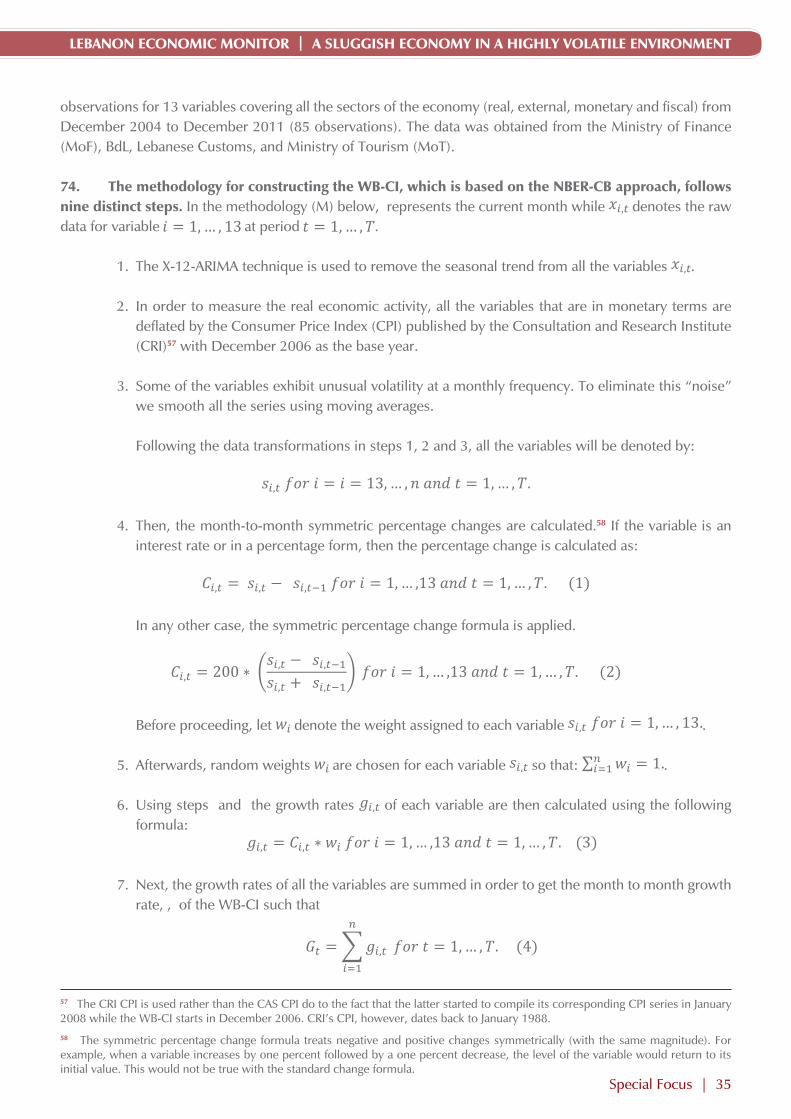
observations for 13 variables covering all the sectors of the economy (real, external, monetary and fiscal) from December 2004 to December 2011 (85 observations). The data was obtained from the Ministry of Finance (MoF), BdL, Lebanese Customs, and Ministry of Tourism (MoT).
74. The methodology for constructing the Wb-ci, which is based on the nber-cb approach, follows nine distinct steps. In the methodology (M) below, represents the current month while denotes the raw data for variable at period .
1. The X-12-ARIMA technique is used to remove the seasonal trend from all the variables .
2. In order to measure the real economic activity, all the variables that are in monetary terms are deflated by the Consumer Price Index (CPI) published by the Consultation and Research Institute (CRI)57 with December 2006 as the base year.
3. Some of the variables exhibit unusual volatility at a monthly frequency. To eliminate this “noise” we smooth all the series using moving averages.
Following the data transformations in steps 1, 2 and 3, all the variables will be denoted by:
4. Then, the month-to-month symmetric percentage changes are calculated.58 If the variable is an interest rate or in a percentage form, then the percentage change is calculated as:
In any other case, the symmetric percentage change formula is applied.
Before proceeding, let denote the weight assigned to each variable .
5. Afterwards, random weights are chosen for each variable so that: .
6. Using steps and the growth rates of each variable are then calculated using the following formula:
7. Next, the growth rates of all the variables are summed in order to get the month to month growth rate, , of the WB-CI such that
57 The CRI CPI is used rather than the CAS CPI do to the fact that the latter started to compile its corresponding CPI series in January 2008 while the WB-CI starts in December 2006. CRI’s CPI, however, dates back to January 1988.
58 The symmetric percentage change formula treats negative and positive changes symmetrically (with the same magnitude). For example, when a variable increases by one percent followed by a one percent decrease, the level of the variable would return to its initial value. This would not be true with the standard change formula.
lebanon economic monitor | a sluggish economy in a highly volatile environment
Special Focus | 35

8. Assuming that the base year of the WB-CI is the first period (i.e. ) the level of the index is calculated recursively using equation (4) and the below symmetric percentage change formula,
9. Finally the model is calibrated so that the final weights satisfy equations (6) and (7) below:
World Bank Leading Indicator of Lebanon (WB-LI)
75. in a turbulent and volatile environment like lebanon, a high-frequency leading indicator is a natural complement to a coincident indicator. A leading indicator for the Lebanese economy (WB-LI) would help to (i) detect early signs of turning points in the business cycle and (ii) forecast GDP growth during the next 12 months. To our knowledge, the designed WB-LI would be the only publicly available leading indicator for the Lebanese economy.
76. The Wb-li is constructed based on a methodology similar, but not identical, to the nber-cb approach. The main difference resides in the choice of weights. While the NBER-CB methodology computes the weights of each variable as the inverse of its respective standard deviation, the WB-LI weights are chosen in order to minimize the difference between the growth rate of the leading indicator at time and the growth rate of the coincident indicator at time . In other words, the weights are selected so that the growth rate of is as close as possible as the growth rate of . The rationale for such an approach is to increase (decrease) the forecast confidence (error) of GDP growth for the forthcoming year.
77. The next steps in constructing the Wb-li are to (i) choose an appropriate reference series, and (ii) determine the relevant components of the Wb-li. Given that the WB-CI is a reliable measure of the current state of the economy (Figure 24), it is used as the benchmark series. It should be noted that one of the two following conditions should be met in order that a certain variable be used in the construction of the WB-LI. The first condition is economic significance, implying that a certain variable has “expectational components,
Table 9. variables used in the construction of the Wb-li
variable unit source
Cement Deliveries thousand tons Banque du Liban
EMBIG spread bps JP Morgan; WB staff calculations
Custom Revenues LBP bln Ministry of Finance
Airport Arrivals number Banque du Liban
Freight Incoming at the Port of Beirut
tons Banque du Liban
Spread between local and Libor interest rate
bps Banque du Liban; WB staff calcualtions
Lending to the Private Sector LBP bln Banque du Liban
Personnel Cost LBP bln Ministry of Finance
Capital expenditures LBP bln Ministry of Finance-2
0
2
4
6
8
10
12
14
2006 2007 2008 2009 2010 2011
Growth rates of WB-CI, BDL-CI, IIF-CI and GDP
WB-CI Real GDP BDL-CI IIF-CI
Percent
figure 24. growth rate of the Wb-ci is equal to the gDP growth.
Source: Lebanese authorities, IIF and WB staff calculations.
The World Bank
36 | Special Focus

that would (under some economic theory) respond rapidly to some shocks to the economy” (Stock and Watson, 1989). The second is statistical significance which means that the correlation coefficient between a certain variable at time and the reference series at time should be larger than 0.5 in absolute value. Based on the above two conditions, 9 variables (Table 9) from a pool of 17 potential variables (Table 10) were used to construct the WB-LI.
78. The same approach used to develop the Wb-ci is adopted to construct the Wb-li with one major difference residing in the minimization problem. The WB-LI is computed and tested against the WB-CI for the period December 2006 to October 2012 (69 observations)59 using monthly data of the 9 variables listed in Table 9. To develop the WB-LI the same methodology followed in the construction of the WB-CI is used, expect for the use of a different minimization problem (step 9). A prime () is used to represent the variables corresponding to the WB-LI. As a result, equations (6) and (7) of Step 9 of methodology (M) become,
Results and Implications79. The designed Wb-ci measures the economic activity in lebanon very accurately.60 The criteria used to assess the effectiveness of the WB-CI in predicting the Lebanese economic activity is the absolute value of the error between the yearly growth rate of the WB-CI and the actual (realized) GDP growth rate. When this error tends, on average, to 0 and its standard deviation converges to 0 this implies that the WB-CI
Table 10. Potential variables used in the construction of the Wb-li
59 Our sample for the WB-LI starts from December 2006 and not December 2004 (as the WB-CI) given that 2006 was subject to an unexpected exogenous shock represented by the conflict with Israel. Hence, any attempt to estimate in 2005 the state of the Lebanese economy in 2006 would have been misleading.
60 The WB-CI series is available in Table 15.
variable unit source
Consumer Confidence Index Index ARA Research & Consultancy
Cement Deliveries thousand tons Banque du Liban
EMBIG spread bps JP Morgan; WB staff calculations
Custom Revenues LBP bln Ministry of Finance
Airport Arrivals number Banque du Liban
Freight Incoming at the Port of Beirut tons Banque du Liban
Spread between local and Libor interest rate bps Banque du Liban; WB staff calcualtions
Lending to the Private Sector LBP bln Banque du Liban
Personnel Cost LBP bln Ministry of Finance
Capital expenditures LBP bln Ministry of Finance
Change in dollarization rate bps BDL; WB staff calculations
Public Debt LBP bln Banque du Liban
Blom Stock Index Index BLOM Bank
Industrial Exports mln USD Ministry of Industry
Construction permits m2 Banque du Liban
Construction in progrees LBP bln Ministry of Finance
Future Economic Index Index ARA Research & Consultancy
lebanon economic monitor | a sluggish economy in a highly volatile environment
Special Focus | 37

Table 11. error between Wb-ci, bDl-ci, iif-ci and gDP growth
Source: Lebanese authorities, IIF and WB staff calculations.
reflects accurately the dynamics of the Lebanese real economy. When calculating the yearly growth rate of the WB-CI and comparing it to actual GDP growth, the results are promising as the average error and the standard deviation between 2006 and 2011 were both equal to 0.0 percent. This compares favorably to both the BdL and the IIF coincident indicators. For the BdL-CI (IIF-CI), the average growth rate was 2.37 (1.53) percent and the standard deviation was 1.29 (1.14) percent over the same period (Table 11 and Figure 24).
80. using the Wb-ci decomposition (Table 12), we can examine the impact of unexpected changes in macroeconomic variables on economic growth. We employ the Vector Autoregressive (VAR) model61 to examine the relation between the variables forming the World Bank coincident indicator and real GDP growth as proxied for using the growth rate of the WB-CI. A necessary condition for VAR models to be econometrically valid is the stationarity of the variables. When used in log differences, the variables WB-CI, cement deliveries, VAT revenues, taxes on real estate, deposits to the private sector (PS), cleared checks and administrative fees and charges, are found to be stationary at the 5 percent level (stationarity tests are undertaken using the Augmented Dickey-Fuller test).62 Let denote the growth rate of the of the WB-CI at time (or month) 2007, ... , 2013 and by the growth rate of variable 63 at time . The -variable VAR model is given by:
where denotes the optimal lag length as determined using the Akaike Information Criterion (AIC). Using equation (8) we estimate our k-variable VAR model corresponding to the stationary variable and generate impulse response functions (IRFs) to quantify the impact of a one percentage point shock in each variable at time , on the growth rate of the WB-CI during the following next two years64. Based on these results, the economy would be expected to grow by 0.03, 0.12, 0.17, 0.40 and 0.52 percentage points during 2013 if we observe a one percentage point increase in cement deliveries, taxes on real estate, cleared checks, deposits to the private sector and VAT revenues, respectively, in December 2012 (Table 13).
61 A VAR model is a system of equation in which each endogenous variable is related to its own lags as well as to lags of all the other endogenous variables in the system.
62 Tobacco excise, M3, tourist arrivals, primary spending, net exports (without energy) and lending to the private sector are not stationary at the 5 percent level, hence we did not use them to generate impulse response functions.
63 represents one of the following stationary variables: cement deliveries, VAT revenues, taxes on real estate, deposits to the private sector, cleared checks and administrative fees and charges.64 A one percentage point shock increase in administrative fees and charges does not have a statistically significant impact on the growth rate of the WB-CI.
Wb-ci growth
(%)
bDl-ci growth
(%)
iif-ci growth
(%)
gDP growth
(%)
absolute value of error between Wb-ci growth and
gDP growth (%)
absolute value of error between bDl-ci growth and
gDP growth (%)
absolute value of error between iif-ci growth and
gDP growth (%)
2006 1.6 -1.4 -0.4 1.6 0.0 3.0 2.0
2007 9.4 5.8 5.9 9.4 0.0 3.6 3.5
2008 9.1 10.2 8.2 9.1 0.0 1.1 0.9
2009 10.3 13.8 8.7 10.3 0.0 3.5 1.6
2010 8.0 10.5 7.0 8.0 0.0 2.5 1.0
2011 2.0 2.5 1.8 2.0 0.0 0.5 0.2
memoranDum iTems:
average of error (2006-2011) 0.00 2.37 1.53
standard deviation of error (2006-2011) 0.00 1.29 1.14
correlation coefficient 1.00 0.88 0.96
The World Bank
38 | Special Focus
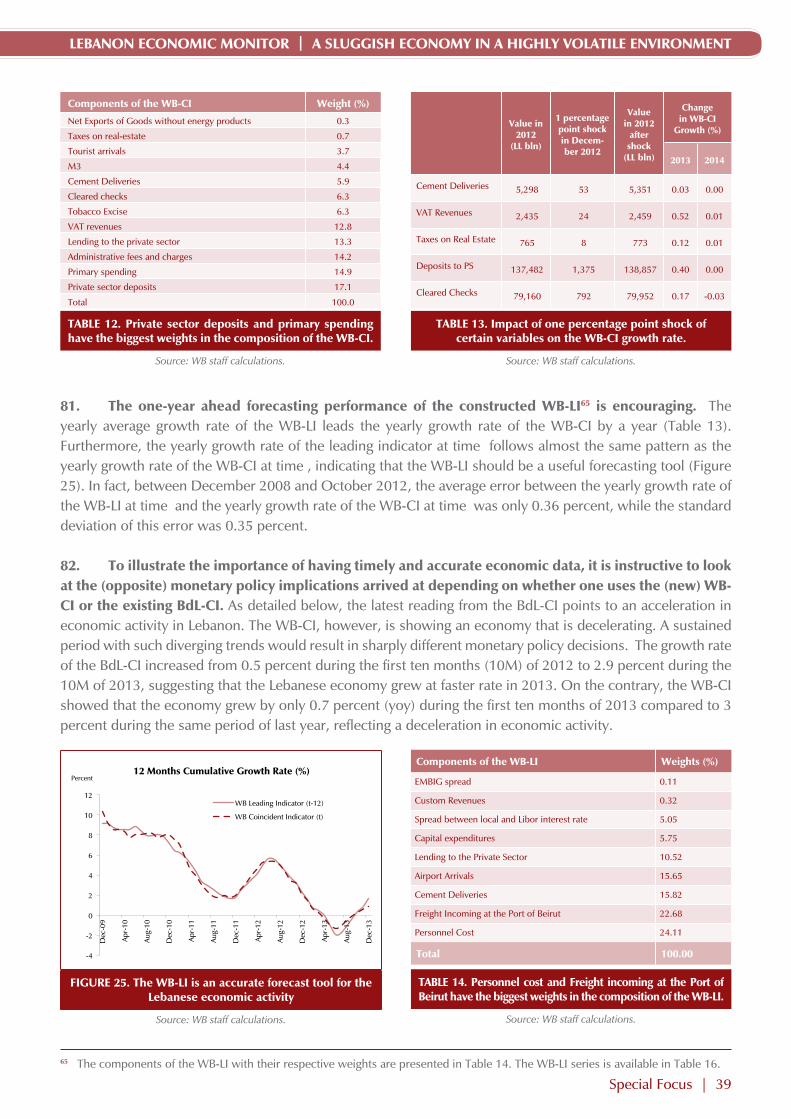
81. The one-year ahead forecasting performance of the constructed Wb-li65 is encouraging. The yearly average growth rate of the WB-LI leads the yearly growth rate of the WB-CI by a year (Table 13). Furthermore, the yearly growth rate of the leading indicator at time follows almost the same pattern as the yearly growth rate of the WB-CI at time , indicating that the WB-LI should be a useful forecasting tool (Figure 25). In fact, between December 2008 and October 2012, the average error between the yearly growth rate of the WB-LI at time and the yearly growth rate of the WB-CI at time was only 0.36 percent, while the standard deviation of this error was 0.35 percent.
82. To illustrate the importance of having timely and accurate economic data, it is instructive to look at the (opposite) monetary policy implications arrived at depending on whether one uses the (new) Wb-ci or the existing bdl-ci. As detailed below, the latest reading from the BdL-CI points to an acceleration in economic activity in Lebanon. The WB-CI, however, is showing an economy that is decelerating. A sustained period with such diverging trends would result in sharply different monetary policy decisions. The growth rate of the BdL-CI increased from 0.5 percent during the first ten months (10M) of 2012 to 2.9 percent during the 10M of 2013, suggesting that the Lebanese economy grew at faster rate in 2013. On the contrary, the WB-CI showed that the economy grew by only 0.7 percent (yoy) during the first ten months of 2013 compared to 3 percent during the same period of last year, reflecting a deceleration in economic activity.
Table 12. Private sector deposits and primary spending have the biggest weights in the composition of the Wb-ci.
Source: WB staff calculations.
-4
-2
0
2
4
6
8
10
12
Dec
-09
Apr
-10
Aug
-10
Dec
-10
Apr
-11
Aug
-11
Dec
-11
Apr
-12
Aug
-12
Dec
-12
Apr
-13
Aug
-13
Dec
-13
12 Months Cumulative Growth Rate (%)
WB Leading Indicator (t-12)
WB Coincident Indicator (t)
Percent
figure 25. The Wb-li is an accurate forecast tool for the lebanese economic activity
Source: WB staff calculations.
Table 13. impact of one percentage point shock of certain variables on the Wb-ci growth rate.
Source: WB staff calculations.
Table 14. Personnel cost and freight incoming at the Port of beirut have the biggest weights in the composition of the Wb-li.
Source: WB staff calculations.
value in 2012
(ll bln)
1 percentage point shock in Decem-ber 2012
value in 2012
after shock
(ll bln)
change in Wb-ci
growth (%)
2013 2014
Cement Deliveries 5,298 53 5,351 0.03 0.00
VAT Revenues 2,435 24 2,459 0.52 0.01
Taxes on Real Estate 765 8 773 0.12 0.01
Deposits to PS 137,482 1,375 138,857 0.40 0.00
Cleared Checks 79,160 792 79,952 0.17 -0.03
components of the Wb-ci Weight (%)
Net Exports of Goods without energy products 0.3
Taxes on real-estate 0.7
Tourist arrivals 3.7
M3 4.4
Cement Deliveries 5.9
Cleared checks 6.3
Tobacco Excise 6.3
VAT revenues 12.8
Lending to the private sector 13.3
Administrative fees and charges 14.2
Primary spending 14.9
Private sector deposits 17.1
Total 100.0
components of the Wb-li Weights (%)
EMBIG spread 0.11
Custom Revenues 0.32
Spread between local and Libor interest rate 5.05
Capital expenditures 5.75
Lending to the Private Sector 10.52
Airport Arrivals 15.65
Cement Deliveries 15.82
Freight Incoming at the Port of Beirut 22.68
Personnel Cost 24.11
Total 100.00
65 The components of the WB-LI with their respective weights are presented in Table 14. The WB-LI series is available in Table 16.
lebanon economic monitor | a sluggish economy in a highly volatile environment
Special Focus | 39

83. notwithstanding the deceleration in economic activity during 2013, the lebanese economy is expected to slightly pick up in 2014. Based on a blend between the WB-CI and the WB-LI we expect the economy to grow by 0.9 percent during 2013. On the other hand, and based on the WB-LI, the economy is forecasted to grow by 1.8 percent in 2014 assuming that the security conditions do not change compared to 2013. However, as events unfolded in January 2014, Lebanon was hit by five suicide attacks. As a result, as detailed in the Prospects section, real GDP growth is expected to expand modestly, by 1.5 percent, in 2014.
The World Bank
40 | Special Focus

DaTa aPPenDix
Table 15. World bank coincident indicator for lebanon /1.
Source: WB staff calculations./1 December 2004 is the base year.
Table 16. World bank leading indicator for lebanon /1.
Source: WB staff calculations./1 December 2006 is the base year.
Wb-ci
Jan-05
Feb-05
Mar-05
Apr-05
May-05
Jun-05
Jul-05
Aug-05
Sep-05
Oct-05
Nov-05
Dec-05
98.1
93.9
93.9
95.4
97.5
101.8
102.7
104.8
107.3
101.8
101.2
104.5
Jan-08
Feb-08
Mar-08
Apr-08
May-08
Jun-08
Jul-08
Aug-08
Sep-08
Oct-08
Nov-08
Dec-08
113.1
115.9
115.6
115.4
116.2
121.9
122.7
126.3
124.4
126.4
130.5
130.8
Jan-11
Feb-11
Mar-11
Apr-11
May-11
Jun-11
Jul-11
Aug-11
Sep-11
Oct-11
Nov-11
Dec-11
142.5
142.0
142.2
144.5
144.6
147.8
149.1
147.6
152.4
153.5
149.4
156.3
Jan-06
Feb-06
Mar-06
Apr-06
May-06
Jun-06
Jul-06
Aug-06
Sep-06
Oct-06
Nov-06
Dec-06
103.8
108.8
110.5
114.1
115.0
110.1
77.1
78.9
99.3
97.6
108.9
106.6
Jan-09
Feb-09
Mar-09
Apr-09
May-09
Jun-09
Jul-09
Aug-09
Sep-09
Oct-09
Nov-09
Dec-09
134.1
132.8
130.4
131.8
134.0
131.7
134.9
134.3
133.6
138.0
134.9
137.5
Jan-12
Feb-12
Mar-12
Apr-12
May-12
Jun-12
Jul-12
Aug-12
Sep-12
Oct-12
Nov-12
Dec-12
153.7
153.2
150.6
153.8
153.1
152.6
149.3
145.8
148.4
149.2
149.4
150.8
Jan-07
Feb-07
Mar-07
Apr-07
May-07
Jun-07
Jul-07
Aug-07
Sep-07
Oct-07
Nov-07
Dec-07
105.5
110.4
111.2
111.1
112.2
110.6
110.8
113.1
113.6
110.8
114.3
112.6
Jan-10
Feb-10
Mar-10
Apr-10
May-10
Jun-10
Jul-10
Aug-10
Sep-10
Oct-10
Nov-10
Dec-10
141.8
141.5
146.6
147.3
145.1
146.2
147.7
144.4
143.5
143.9
144.0
144.6
Jan-13
Feb-13
Mar-13
Apr-13
May-13
Jun-13
Jul-13
Aug-13
Sep-13
Oct-13
152.6
150.1
151.4
152.4
151.4
150.3
152.8
155.3
151.7
152.1
Wb-li
Jan-07Feb-07Mar-07Apr-07
May-07Jun-07Jul-07
Aug-07Sep-07Oct-07Nov-07Dec-07
101.7106.2105.5104.6104.8106.7101.898.8101.0104.7103.8107.6
Jan-11Feb-11Mar-11Apr-11
May-11Jun-11Jul-11
Aug-11Sep-11Oct-11Nov-11Dec-11
129.8128.4127.1128.3129.9129.6125.5122.1124.1123.4127.3124.7
Jan-08Feb-08Mar-08Apr-08
May-08Jun-08Jul-08
Aug-08Sep-08Oct-08Nov-08Dec-08
110.5114.0113.7112.8113.4112.5114.3113.0110.7112.1114.1119.5
Jan-12Feb-12Mar-12Apr-12
May-12Jun-12Jul-12
Aug-12Sep-12Oct-12Nov-12Dec-12
127.7126.4129.7128.0126.5122.8127.9129.6130.0132.3132.3132.0
Jan-09Feb-09Mar-09Apr-09
May-09Jun-09Jul-09
Aug-09Sep-09Oct-09Nov-09Dec-09
119.9118.0119.8121.2122.5123.0122.9121.7121.5121.7122.8123.9
Jan-13Feb-13Mar-13Apr-13
May-13Jun-13Jul-13
Aug-13Sep-13Oct-13
131.9133.8129.2129.2130.2131.0132.4132.4131.0130.7
Jan-10Feb-10Mar-10Apr-10
May-10Jun-10Jul-10
Aug-10Sep-10Oct-10Nov-10Dec-10
119.4119.3119.9120.4120.6120.9125.3125.2127.7126.8129.3130.1
lebanon economic monitor | a sluggish economy in a highly volatile environment
Data Appendix | 41

Table 17. lebanon: selected economic indicators, 2011-2016
Source: Government data, and World Bank staff estimates and projections./1Gross Reserves (months of imports GNFS) = (Imports of Goods & Services / Gross Res. excl. Gold)*12/2 Total Imports using the BOP data from the Quarterly Bulletin of BDL
The World Bank
42 | Data Appendix

Table 18. lebanon at a glance
lebanon economic monitor | a sluggish economy in a highly volatile environment
Data Appendix | 43
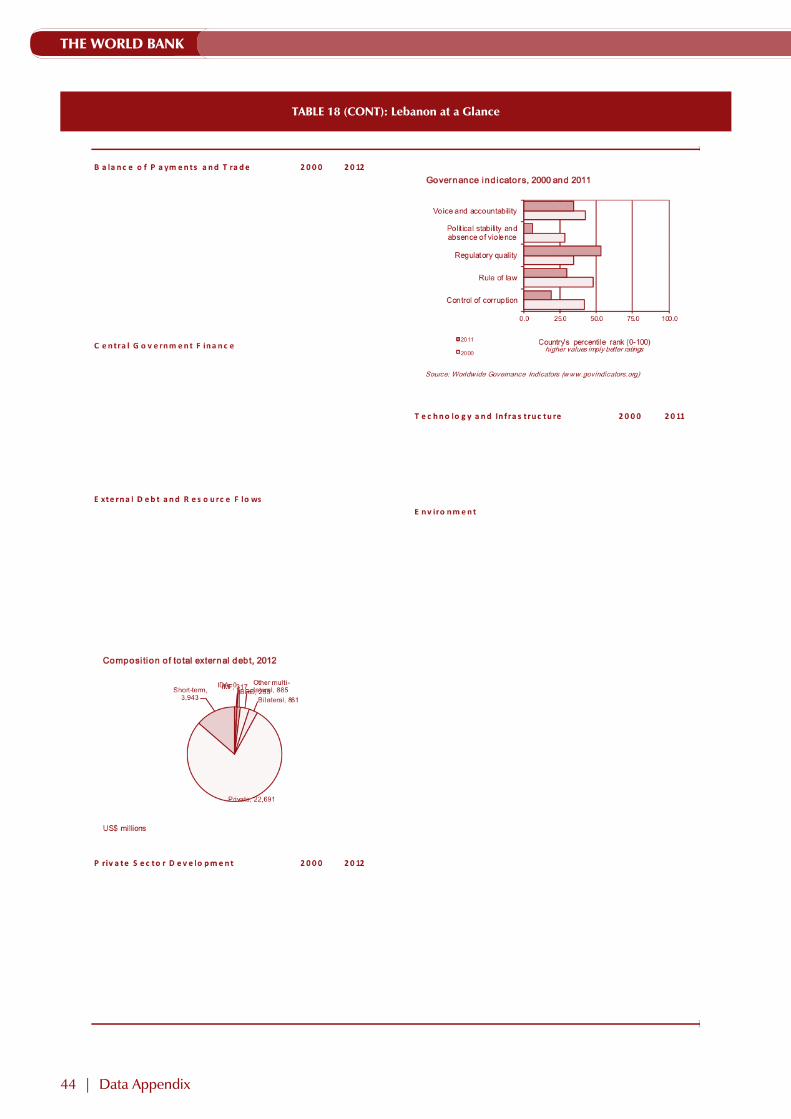
Table 18 (conT): lebanon at a glance
The World Bank
44 | Data Appendix

Table 19. lebanon: millennium Development goals, 1990-2011
lebanon economic monitor | a sluggish economy in a highly volatile environment
Data Appendix | 45

SPRING 2013 LEM: GROWING TENSIONS IN A RESILIENT ECONOMYThe Impact of the Syrian Conflict on Lebanon’s Economy: (Special Focus 1) The conflict in Syria—a country that is closely linked, both through historical, social and economic ties to Lebanon—has created a humanitarian crisis of enormous scale. While Lebanon is to be commended for its openness to Syrian refugees, the conflict is severely and negatively impacting the Lebanese economy. The largest impact arises through the insecurity and uncertainty spillovers and touches at the heart of Lebanon’s societal fabric. This insecurity negatively impacts investor and consumer confidence. The conflict also directly impacts Lebanon’s trade routes, raising the cost of imports, and lowering exports notwithstanding some benefits reaped in niche Syrian markets. The tourism sector is the most negatively affected while real estate and banking have proven to be resilient. Inflationary pressures seem to mount, in part due to imports substitution away from cheap Syrian products, and localized price pressure from the large Syrian refugee influx (e.g., on rents). The refugee influx is also creating pressures on both employment and nominal wages for host communities, and crowding out access to and lowering the quality of public services. The resulting hardship for hosting communities is stirring social tensions, which could further erode confidence and, ultimately, macroeconomic stability. Prompt policy responses to help hosting communities are warranted to limit these material downside risks and address the mounting developmental challenges that are emerging. Support from the international community, including through financial support,
should urgently be provided so as to help Lebanon’s hosting efforts.
Impact of the Proposed Changes in Public Sector Wages: (Special Focus 2) Amid uncertain growth prospects and shrinking fiscal space, the government’s initial decision to significantly increase public sector employees’ salaries is raising significant challenges. While the cost of living increase aims to offset the erosion of real wages over time, the change in the structure of salary scales is not accompanied by a similar structural revision of tasks and efficiency of public sector employees. At the macro-economic level, the overall increase in wages would weaken the Lebanese economy through the return of unsustainable debt dynamics, pressures on the peg, lower economic growth, and increased unemployment. Introducing revenue measures would reduce these negative impacts but would lower resilience to shocks and impede the use of counter-cyclical fiscal policies. Reforming the pension system would further reduce the negative impact, but such reform cannot be separated from the need for strengthening social safety nets.
selecTeD sPecial focus from recenT lebanon economic moniTors
The World Bank
46 | Selected Special Focus from Recent Lebanon Economic Monitors

FALL 2013 LEM: THE BRUNT OF THE SYRIAN CONFLICTLebanon: Economic and Social Impact of the Syrian Conflict: (Special Focus 1) During the 2012-2014 period, the conflict in Syria is having a large, negative, and rapidly growing impact on Lebanon’s economy, its social fabric, and its public services. On the economic front, the deteriorating security situation is undermining consumption, investment which is dragging down growth. The cumulative losses in economic activity could reach an estimated USD7.5 billion. On the social front, social cohesion is rapidly deteriorating partly due to combination of rising poverty—approximately 170,000 Lebanese would be pushed into poverty (over and above the 1 million currently living below the poverty line)—a worsening labor market which is estimated to result in a doubling of the unemployment rate to above 20 percent, rising insecurity, amid deteriorating core public services. Public services are under pressure given the sudden and large increase in their demand arising from the Syrian refugee influx. The fiscal cost of Syrian conflict is estimated at USD2.6 billion, of which USD1.5 billion stems from foregone government revenue collection while the remaining USD1.1 billion are expenditure incurred by the government to meet some of the surge in demand for public services. Across all core public services, the surge in demand is currently being partly met through a decline in both the access to and the quality of public service delivery. It is estimated that an additional spending of USD2.5 billion would be required for stabilization, i.e., to reinstate the access to and quality of public services to their pre-Syrian conflict level.
lebanon economic monitor | a sluggish economy in a highly volatile environment
Selected Special Focus from Recent Lebanon Economic Monitors | 47

(for an exhaustive list, please go to: http://go.worldbank.org/8700A29QW0http://go.worldbank.org/5N4AMNJXV0)
selecTeD recenT WorlD banK PublicaTions on lebanon
The World Bank
48 | Selected recent World Bank publications on Lebanon

0.9375 cm
LEBANON ECONOMIC MONITOR
A SLUGGISH ECONOMY IN A HIGHLY VOLATILE ENVIRONMENT
SPRING 2014
Poverty Reduction and Economic Management UnitMIDDLE EAST AND NORTH AFRICA REGION
The World Bankwww.worldbank.org/lb
The World Bank