eat less salt, drink more wine, dump the cellphone, eat more salt, and live longer: teaching...
TRANSCRIPT

Eat less salt, drink more wine, dump the
cellphone, eat more salt, and live longer:
teaching students to understand the role of
data collection in statistical inference

Outline•1) The problem.
•2) Why is causal inference important? What is it?
•3) Three types of data collection schemes.
•4) What should students know?
•5) What should we teach?

The problem•Statistical inference is concerned
with answering the question “Could observed differences be simply due to chance?”
•To answer, we must choose an appropriate test or inferential procedure, check assumptions, calculate (or have calculated) appropriate test statistics, and compare results to an appropriate chance model.

The problem
•This is familiar ground, because a background in mathematics prepares us well.
•But “is this due to chance” is only half the battle. The more interesting half is “What does this tell us about the world?”

The problem
•And to answer this, we need to understand that data are not just numbers but, as statistician David Moore said:
•Data are numbers with context.
•And by “context” we usually mean the context in which the data were gathered.

data collection and causal inference
•Statistical inference is limited or enhanced by the design of the data collection procedure.
•An important part of statistical inference is causal inference: X and Y might be associated, but can we also conclude that changing X causes a change in Y?


Others:•cellphones causes brain cancer
•sleep deprivation impedes memory
•(moderate) alcohol consumption prolongs life
•humans affect climate change
•abortion lowers crime rates
•HIV causes AIDS

What is causality?•If a change in the value of x tends to
result in a change in the value of y, then we say x causes y.
•For example, if I change my status from “no flu shot” to “flu shot”, then I am less likely to get the flu.
•Note that I could still get the flu, without invalidating the effectiveness of the vaccine.

paradigm•Two groups: Treatment and Control.
Membership in these groups is recorded in a treatment variable.
•Response variable compared across the two groups.
•(But really, there can be multiple “treatments” and multiple “controls”.)

Why Causal Inference is Hard
•Confounding Factors
•“Confounding means a difference between the treatment and control groups -- other than the treatment--which affects the response”--David Freedman (Statistical Models)

smoking cancercauses

smoking cancercauses
GeneGeness
GeneGeness
Now, Genes confound the causal association.

data collection
•Anecdotes
•Observational Studies
•Controlled Experiments

“Listen, I’m not crazy,” the Macy’s worker said. “I know this stuff has made me a healthier woman.”
Name that data collection method:
Anecdotes; no comparison group, so no causal inference possible

Observational
•Observational studies are those in which the subjects place themselves into treatment groups.
•Obviously, this may happen without their awareness.

Observational?
•Cellphones cause brain cancer.
•Identify treatment and response variables.
•Observational? why?
•Yes, because no researcher could control a person’s cell phone exposure over time.

Fact of Life
•One can never know if there are confounding factors in an observational study.
•Researchers can eliminate, but there could always be a nagging doubt that we just haven’t thought of the right one.

The secret to successful causation•Make sure the groups you are
comparing are similar in every way except for the value of the treatment variable.
•Said differently: make sure there are no confounding factors.
•Easier said than done. But here's one way of doing:
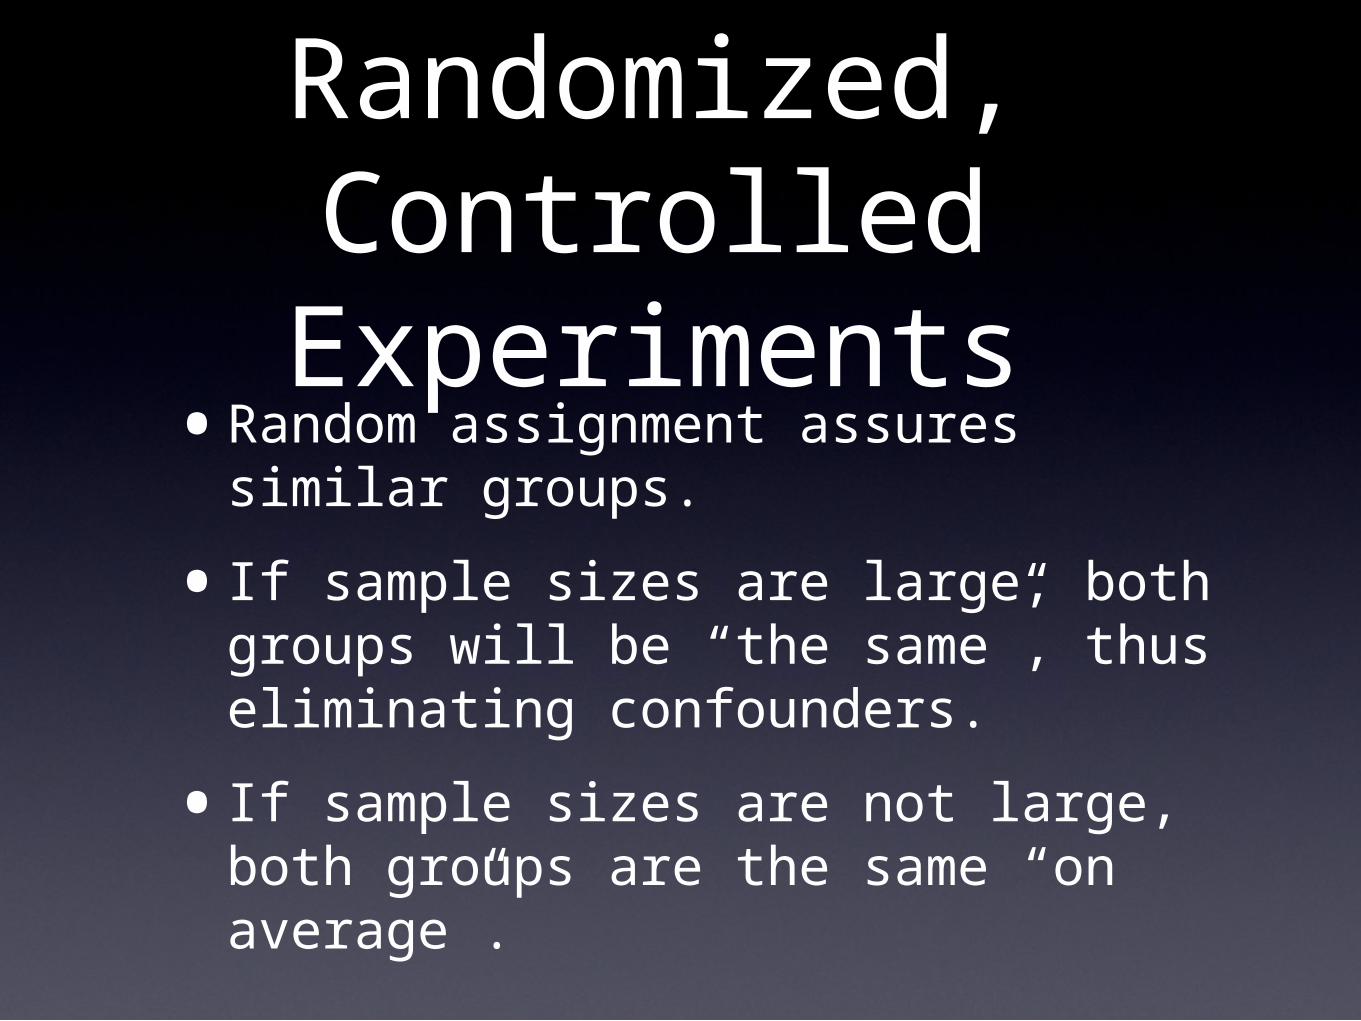
Randomized, Controlled
Experiments•Random assignment assures
similar groups.
•If sample sizes are large, both groups will be “the same”, thus eliminating confounders.
•If sample sizes are not large, both groups are the same “on average”.

Randomized
•Only in a randomized, controlled experiment can we make causal inference.
•(and even then, we need to be aware of problems).

Why?
•Because only in a randomized, controlled experiment are the treatment and control groups the same, on average.
•Thus, if the response variable is different the only explanation is the treatment.

What every student should know &
understand•Data beat anecdotes.
•Random assignment in comparative experiments allows causal conclusions to be drawn.
•Random sampling allows generalization to the population
Guidelines for Assessments and Instruction in Statistics Education (GAISE), College Report
www.amstat.org/education/gaise

Random assignment
No Random Assignment
Random Sample
causality can be extended
to the population
No causality, but an
association can be
extended to population.
No Random Sample
Causality, but only for the
sample.
no statistical inference
Statistical Sleuth, Ramsey & Schafer

Students should recognize
•Common sources of bias in surveys and experiments.
•How to determine when cause-and-effect can be inferred, based on how data were collected.
Guidelines for Assessments and Instruction in Statistics Education (GAISE), College Report
www.amstat.org/education/gaise

Students should know
•How to critique news stories and journal articles that include statistical information, including identifying what’s missing in the presentation and the flaws in the studies or methods used to generate the information.
Guidelines for Assessments and Instruction in Statistics Education (GAISE), College Report
www.amstat.org/education/gaise

What to Teach•How to distinguish observational
studies from controlled experiments.
•How to identify confounders and explain why they confound.
•Don’t rush to conclusions based on a single study.
•Controlled, randomized experiments can go wrong.

What to Teach
•Give students headlines. Ask them whether the headline is making a claim for causation or for association.
•Students have difficulty telling these apart because our everyday language blurs the distinction.

What To Teach
•Amazing claims require amazing evidence!
•(attributed to “Amazing Randi” or possibly Carl Sagan.)

homeopathy
•The claim: Hyland’s Cold ‘n Cough 4 Kids will allow children to get over colds faster or prevent colds.
•Solution so heavily diluted that there are no molecules of active ingredients in the solution.
Los Angeles Times, 12/6/2010

homoepathy
•Proponents say that solution retains a “memory” of active ingredients.
•But as [Prof. Gleason, chemistry] explains, every molecule of water in our bodies has been enough other places --oceans, sewers--to make any “memories” hopeless jumbled.

homoepathy
•So even if a randomized, controlled study concluded that there was a benefit to the Cold ‘n Cough, Prof. Gleason would need to see more, because if the study was true, then many things we have longed believed about chemistry are false.

Questions for students
•What is the research question?
•What is their answer?
•How were data collected?
•Are conclusions appropriate for data collection methods?
•To what population, if any, do conclusions apply?
•Have results been replicated? Or are they “amazing”? Gould & Ryan, 2012
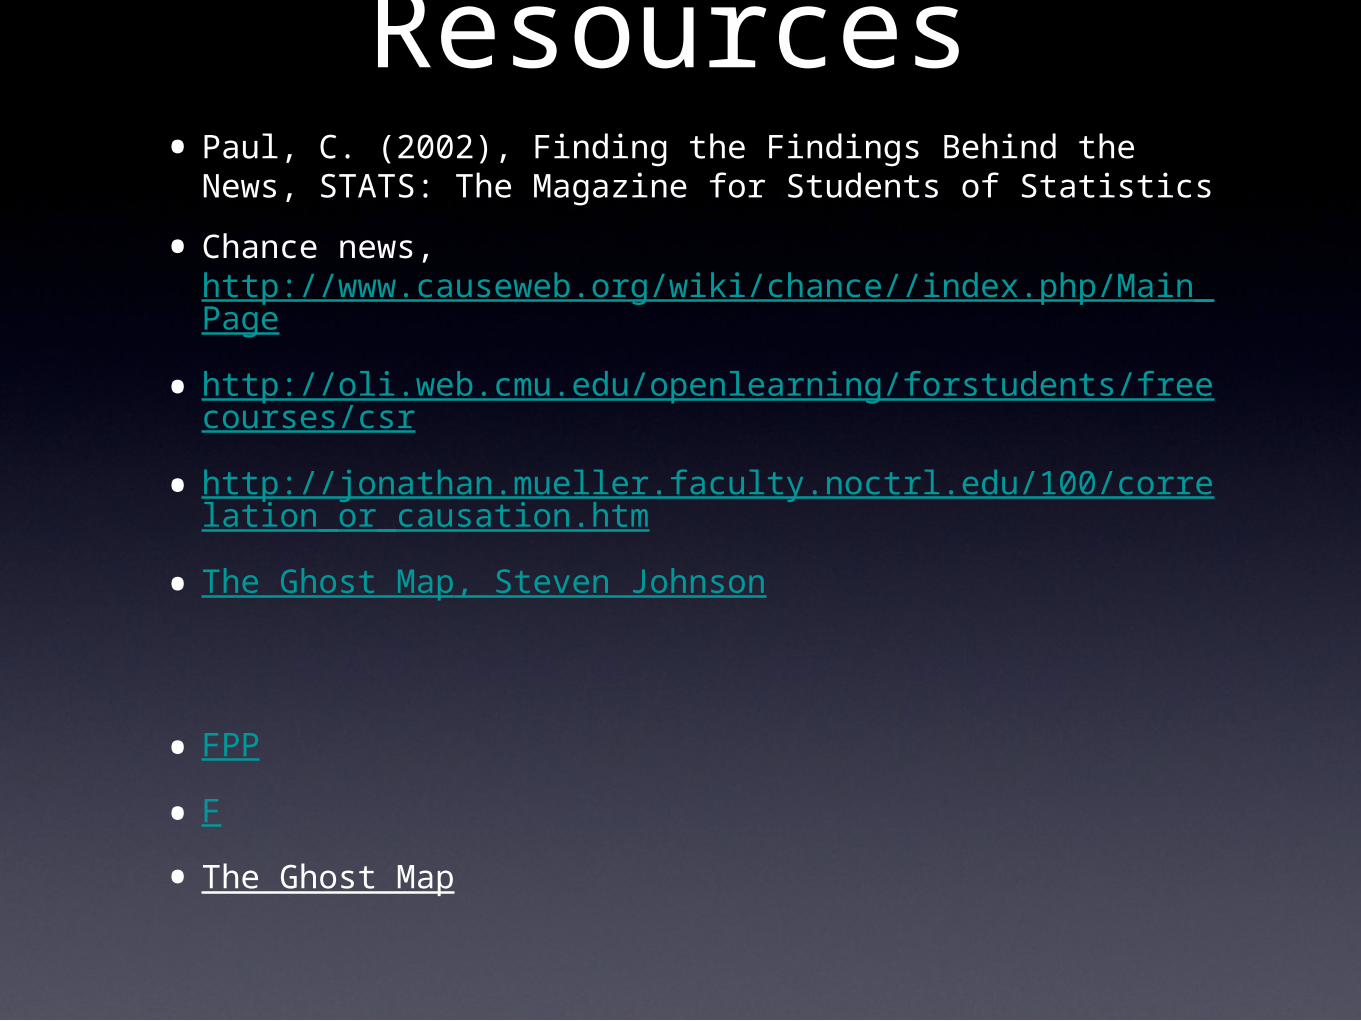
Resources• Paul, C. (2002), Finding the Findings Behind the News,
STATS: The Magazine for Students of Statistics
• Chance news, http://www.causeweb.org/wiki/chance//index.php/Main_Page
• http://oli.web.cmu.edu/openlearning/forstudents/freecourses/csr
• http://jonathan.mueller.faculty.noctrl.edu/100/correlation_or_causation.htm
• The Ghost Map, Steven Johnson
• FPP
• F
• The Ghost Map