eastern regional power...
TRANSCRIPT

Creation and maintaining a Web based Protection
Database and Desktop based Protection setting
calculation tool for Eastern Regional Grid
Eastern Regional Power Committee
14 Golf Club Road, Tollygunge,
Kolkata, West Bengal 700033
January 2017
OPERATIONAL LOAD FLOW STUDIES
UNDER OFF PEAK LOADING
CONDITIONS
Power Research and Development Consultants
Private Limited
# 5, 11th cross, 2nd stage, west of chord road,
Bangalore - 560 086, Karnataka
Tel: +91- 80-23192159 / 23192168
E-mail – [email protected]
Web site: www.prdcinfotech.com

Web based Protection Database and Desktop based Protection setting calculation tool – ERPC
2 PRDC Bangalore January 2017
Document reference details: LOA No : ERPC/PR_DBASE/2016/3567
Document reference No : PRDC/2016-2017/ERPC-WB/1649
Revision Index
Revision Description Date Remarks
1.0 Off peak Load Flow Report
29.12.2016 Initial version
1.1 Modification 02.01.2017 Based on the comments given by
Mrs. Debarati Basu
2.0 Approved 06.01.2017 Approved
Internal Approval
Prepared by Mr. Akash Singh Aaryan
29.12.2016
Mr. Anirban Banerjee
Reviewed by Mrs. Debarati Basu 02.01.2017
Approved by Dr. Nagaraja Ramappa 06.01.2017

Web based Protection Database and Desktop based Protection setting calculation tool – ERPC
3 PRDC Bangalore January 2017
TABLE OF CONTENTS
1 INTRODUCTION ...................................................................................................................... 13
2 PROJECT SCOPE ................................................................................................................... 14
2.1 Database Building Activities for Operational Studies ...................................................... 14
3 SYSTEM OPERATIONAL DATA ............................................................................................. 16
3.1 Methodology adopted for performing the load flow analysis ........................................... 18
3.1.1 Data Collection Procedure .......................................................................................... 18
3.2 August 27, 2016 Off-peak system demand condition ...................................................... 20
3.3 Salient points of CEA planning criteria referred for network modelling and analysis of
study results .................................................................................................................................. 20
3.3.1 Transmission line parameters .................................................................................... 20
3.4 Transformer parameters .................................................................................................. 22
3.4.1 Voltage limits .............................................................................................................. 22
3.5 Network element statistics for ER Grid ............................................................................ 22
3.5.1 Substation details ....................................................................................................... 22
3.5.2 Transmission line details ............................................................................................ 23
3.5.3 Transformer details ..................................................................................................... 23
3.5.4 Generation details....................................................................................................... 24
3.5.5 HVDC details .............................................................................................................. 24
3.5.6 Reactor details ............................................................................................................ 25
3.5.7 Load details ................................................................................................................ 25
3.6 Generation schedule details for operational load flow ..................................................... 25
4 OPERATIONAL LOAD FLOW STUDY ................................................................................... 28
4.1 Introduction to Load flow analysis .................................................................................... 28
4.2 Load Generation Balance from the results of operational load flow analysis .................. 30
4.3 Line loading conditions .................................................................................................... 34
4.4 Transformer loading conditions........................................................................................ 36
4.5 Voltage profile .................................................................................................................. 39
4.6 Analysis of the load flow study results ............................................................................. 39
5 SHORT CIRCUIT STUDIES ..................................................................................................... 40
5.1 Short circuit study result analysis..................................................................................... 41
6 CONCLUSION .......................................................................................................................... 43

Web based Protection Database and Desktop based Protection setting calculation tool – ERPC
4 PRDC Bangalore January 2017
LIST OF FIGURES
Figure 3.1: Constituents of Eastern Regional grid ........................................................................... 17
Figure 3.2: Scheduled generation, Import and Export of Eastern Regional grid ............................. 27
Figure 4.1: Block diagram of load generation balance of ER ........................................................... 33

Web based Protection Database and Desktop based Protection setting calculation tool – ERPC
5 PRDC Bangalore January 2017
LIST OF TABLES
Table 3.1: Data availability status .................................................................................................... 18
Table 3.2: ER loading details ........................................................................................................... 19
Table 3.3: Source of the data considered for the study ................................................................... 20
Table 3.4: Details of transmission line parameters .......................................................................... 21
Table 3.5: Details of transformer parameters ................................................................................... 22
Table 3.6: Voltage limits at different voltage levels prescribed in CEA’s “Transmission ................. 22
Planning Criteria” .............................................................................................................................. 22
Table 3.7: Existing number of sub-station in the ER ........................................................................ 22
Table 3.8: Summary of transmission line data in the ER ................................................................. 23
Table 3.9: Summary of transformers capacity in the ER ................................................................. 23
Table 3.10: Summary of Generator installed capacity in the ER ..................................................... 24
Table 3.11: HVDC Back to Back in the ER ...................................................................................... 24
Table 3.12: HVDC Link in the ER ..................................................................................................... 24
Table 3.13: Load Details of ER ........................................................................................................ 25
Table 3.14: Generation schedule Details of ER ............................................................................... 25
Table 4.1: Load generation balance Details of ER........................................................................... 30
Table 4.2: Load generation balance details of Bihar ........................................................................ 30
Table 4.3: Load generation balance details of Jharkhand ............................................................... 30
Table 4.4: Load generation balance details of Odisha ..................................................................... 31
Table 4.5: Load generation balance details of Sikkim ..................................................................... 31
Table 4.6: Load generation balance details of West Bengal ............................................................ 31
Table 4.7: Load generation balance details of DVC ........................................................................ 32
Table 4.8: Load generation balance details of CESC ...................................................................... 32
Table 4.9: Load generation balance details of DPL ......................................................................... 32
Table 4.10: Percentage loading details of lines of Eastern Region ................................................. 34
Table 4.11: Percentage loading details of lines of Bihar .................................................................. 34
Table 4.12: Percentage loading details of lines of Jharkhand ......................................................... 34
Table 4.13: Percentage loading details of lines of Odisha ............................................................... 35
Table 4.14: Percentage loading details of lines of Sikkim ................................................................ 35
Table 4.15: Percentage loading details of lines of West Bengal ...................................................... 35
Table 4.16: Percentage loading details of lines of DVC ................................................................... 35
Table 4.17: Percentage loading details of lines of CESC ................................................................ 36
Table 4.18: Percentage loading details of lines of DPL ................................................................... 36
Table 4.19: Percentage loading details of Transformers of Eastern Region ................................... 36
Table 4.20: Percentage loading details of Transformers of Bihar .................................................... 36
Table 4.21: Percentage loading details of Transformers of Jharkhand ........................................... 37
Table 4.22: Percentage loading details of Transformers of Odisha ................................................. 37
Table 4.23: Percentage loading details of Transformers of Sikkim.................................................. 37

Web based Protection Database and Desktop based Protection setting calculation tool – ERPC
6 PRDC Bangalore January 2017
Table 4.24: Percentage loading details of Transformers of West Bengal ........................................ 38
Table 4.25: Percentage loading details of Transformers of DVC ..................................................... 38
Table 4.26: Percentage loading details of Transformers of CESC .................................................. 38
Table 4.27: Percentage loading details of Transformers of DPL ..................................................... 38
Table 4.28: Bus Voltage Profile for Eastern Region ........................................................................ 39
Table 5.1: 3-Ph fault levels > 80% of breaker rating ........................................................................ 41
Table 5.2: SLG fault levels > 80% of breaker rating ........................................................................ 42

Web based Protection Database and Desktop based Protection setting calculation tool – ERPC
7 PRDC Bangalore January 2017
EXECUTIVE SUMMARY
In the recent past, it has been noted that most of the grid collapses have been
attributed to protection system failure or mal functioning. The reports on the North
American blackout (August 2003) and the more recent Indian grid collapse (July
2012) have all emphasized the need for “Protection Management System”.
As a recommendation of the Enquiry Committee headed by Chairperson CEA on
grid disturbances in NEW grid on 30th and 31st July 2012, Ministry of Power
constituted a “Task Force on Power System Analysis under Contingencies” in
December 2012.
The task force recommends creation and maintenance of protection database
under RPC’s. Accordingly, Secretary (Power) in a meeting in Ministry of Power held
on 11.03.2014 directed all RPC’s to implement the recommendations of the report
submitted by “Task Force” in a time bound manner.
Following the decision of Ministry of Power ERPC as a pioneering venture has taken
up the project “Creation and maintaining a Web based Protection Database and
a Desktop based Protection Setting Calculation Tool for Eastern Regional
Grid”..
M/s PRDC has been awarded with the order by ERPC to implement the project in its
entirety including creation of database and supply of software and hardware along
with necessary power system analysis relevant for the project.
Eastern Regional Grid comprises of the electrical system of the states of Bihar,
Jharkhand, West Bengal, Odisha, Sikkim and area under DVC. The major
constituents of ER grid are the State/UT Transmission and Distribution Utilities,
Central Transmission Utility, State and Central sector Generating Companies, DVC,
CESC, DPL, IPP’s and Private sector Transmission and Distribution Utilities. The ER
covers a geographical area of 425432 sq km with an installed capacity of 36575 MW.
In addition to this the region has an installed capacity of 7840 MW in the form of
CPP’s.
Eastern Regional Power Committee (ERPC) formed by Ministry of Power is entrusted
for facilitating the integrated operation of the power system in the region.
As a prerequisite of building the protection management system the first step as
envisaged is the electrical modelling of the entire network data under ER system from
765 kV to 132 kV and 66 kV for Sikkim and carrying out the base case operational
load flow analysis and short circuit studies for peak and off peak load conditions.

Web based Protection Database and Desktop based Protection setting calculation tool – ERPC
8 PRDC Bangalore January 2017
The Load flow and Short Circuit studies of Eastern Grid considering grid was carried
out for peak load conditions of ER. The network was updated till 31st May 2016 and
report was submitted with study results on 27th July 2016.
As a next phase of the power system studies, the off peak scenario of ER grid is
studied for Load flow and Short Circuit analysis. The data and electrical parameters of
the EHV network elements as updated till 31st August 2016 by collecting data from
the respective constituents of ER grid and updated network is modelled in power
system analysis software MiP-PSCT.
It was decided in the OCC meeting that the operational Load Flow study for ER grid is
carried out for a load generation condition during normal off peak condition on an
updated network data till August 2016. The load generation condition was selected for
two time steps are collected for 27th & 28th August 2016 at 13:00 hours and 03:00
hours respectively. After analyzing the ERLDC’s SCADA record for both these time
steps off peak time’s total recorded loads appeared to be on the higher side almost of
the same quantum as was studied for peak conditions. From ERLDC’s SCADA and
SEM’s data mismatches in regional demand as well as state wise demand is
observed. In 126th OCC meeting, it was suggested that off peak load generation of a
different day may be considered and load may be apportioned among states based
on SCADA data of 27th August 2016 at 13:00 hrs or 28th August 2016 at 03:00 hrs.
After much deliberation (126th OCC) it was decided that the off peak load flow study
will be carried out with load generation scenario of 27th August 2016 at 13:00 hrs as
per the load generation scenario data given by ERLDC from SEM data.
A comparison of loading details of 26th May 2016 peak hours and 27th August 2016 off
peak hours of ER grid is presented below.
Sl. No. Constituents Load (MW)
27th
Aug-16 13:00 hrs 26th
May-16, 20:00 hrs
1 Bihar 2716 3044
2 Jharkhand 799 991
3 Odisha 2872 3354
4 Sikkim 43 75
5 W. Bengal 4858 5460
6 DVC 2426 2621
7 CESC 1507 1441
8 DPL 217 217
Total Load 15438 17203
loss 671 762
Total Demand 16109 17965
Web based Protection Database and Desktop based Protection setting calculation tool – ERPC
9 PRDC Bangalore January 2017
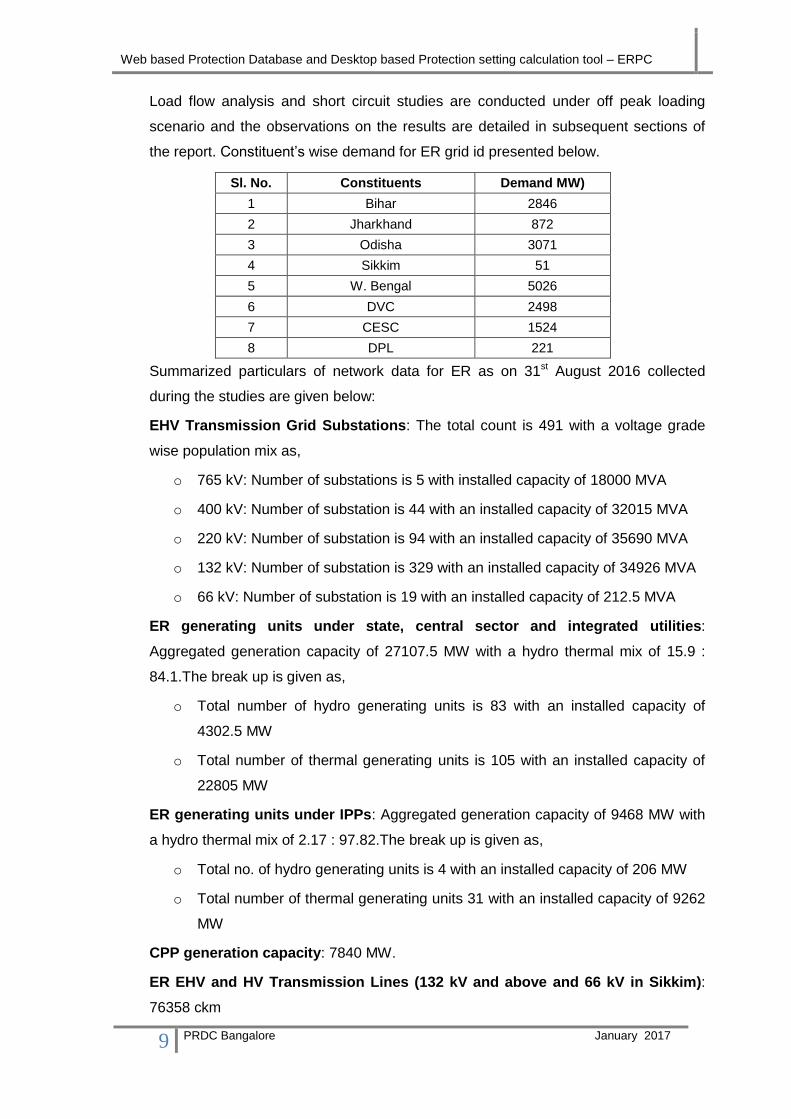
Load flow analysis and short circuit studies are conducted under off peak loading
scenario and the observations on the results are detailed in subsequent sections of
the report. Constituent’s wise demand for ER grid id presented below.
Sl. No. Constituents Demand MW)
1 Bihar 2846
2 Jharkhand 872
3 Odisha 3071
4 Sikkim 51
5 W. Bengal 5026
6 DVC 2498
7 CESC 1524
8 DPL 221
Summarized particulars of network data for ER as on 31st August 2016 collected
during the studies are given below:
EHV Transmission Grid Substations: The total count is 491 with a voltage grade
wise population mix as,
o 765 kV: Number of substations is 5 with installed capacity of 18000 MVA
o 400 kV: Number of substation is 44 with an installed capacity of 32015 MVA
o 220 kV: Number of substation is 94 with an installed capacity of 35690 MVA
o 132 kV: Number of substation is 329 with an installed capacity of 34926 MVA
o 66 kV: Number of substation is 19 with an installed capacity of 212.5 MVA
ER generating units under state, central sector and integrated utilities:
Aggregated generation capacity of 27107.5 MW with a hydro thermal mix of 15.9 :
84.1.The break up is given as,
o Total number of hydro generating units is 83 with an installed capacity of
4302.5 MW
o Total number of thermal generating units is 105 with an installed capacity of
22805 MW
ER generating units under IPPs: Aggregated generation capacity of 9468 MW with
a hydro thermal mix of 2.17 : 97.82.The break up is given as,
o Total no. of hydro generating units is 4 with an installed capacity of 206 MW
o Total number of thermal generating units 31 with an installed capacity of 9262
MW
CPP generation capacity: 7840 MW.
ER EHV and HV Transmission Lines (132 kV and above and 66 kV in Sikkim):
76358 ckm

Web based Protection Database and Desktop based Protection setting calculation tool – ERPC
10 PRDC Bangalore January 2017
The node wise load and generation data, recorded are collected from the respective
system owners and are matched with the demand, generation and exchange
recorded by ERLDC, SCADA for the selected time instant.
The consolidated observations from load flow analysis are:
Load Generation Balance Off-Peak Scenario:
o System input ( Generation & Import ): 22500 MW
o System Demand including losses in ER network : 16109 MW
o Consolidated Export from ER bus : 6391 MW
Generation Scheduling: All generators are scheduled as per SCADA records of
ERLDC.
Voltage Profile: Busbar voltages at all voltage levels are within the stipulated range
of grid code of CEA
Transformer loading: In the entire population no overloading is observed. 37
number transformers are loaded beyond 80% and 236 numbers are loaded below
20%.
Line loading: No overloading is observed in any of the voltage grades. Number of
lines loaded between 80 to 100% of thermal capacity is 37 predominantly in 132 kV
level. Number of lines loaded below 5% thermal capacity is 128 and the percentage is
predominant at 132 kV level.
Comparison of the simulated results for Bus bar voltages and active power flows with
the available SCADA records has not been carried out due to unavailability of
accurate SCADA record concurrent with simulated system demand of 16109 MW.
This mismatch is attributed to insufficient data in load substations and also to the
mismatch of SLDC records and ERLDC records.
Short Circuit studies are conducted on the network topology and generation
scheduling of the load flow modelling for both three phase symmetrical faults and
single line to ground fault conditions at every bus up to 66 kV level by considering sub
transient reactance’s of the generators and closed bus operation at all 765,400 and
220 kV bus.
It is observed from the results of short circuit studies the fault MVA is exceeding the
breaker capacity in following buses:
Bihar: Kahalgaon 400 kV
Jharkhand: Maithon 400 kV

Web based Protection Database and Desktop based Protection setting calculation tool – ERPC
11 PRDC Bangalore January 2017
Bus splitting is suggested for above substations. Breaker upgradation may also be
considered during substation renovations.
Due to High fault level at 220 kV bus of Meramundali S/S under short circuit study for
peak scenario bus splitting was suggested. From short circuit study under off peak
scenario with split bus of Meramundali S/S at 220 kV level fault level is well within the
breaker capacity.
Detailed analysis of data and study results for operational load flow and short circuit
studies are elaborated in subsequent sections of the report.

Web based Protection Database and Desktop based Protection setting calculation tool – ERPC
12 PRDC Bangalore January 2017
ABBREVIATIONS AND ACRONYMS
Acronym Full form
CEA Central Electricity Authority
CGP/CPP Captive generating plant
CTU Central Transmission Utility
DB Data Base
DPR Detailed Project Report
DTR Distribution Transformer
EHV Extra High Voltage
ER Eastern Region
ERLDC Eastern Regional Load Dispatch Centre
ERPC Eastern Regional Power Committee
GoI Government of India
GS Generating Station
GUI Graphical User interface
HV High Voltage
IPP Independent Power Producer
MiP-PSCT Protection Setting Calculation Tool
NR Northern region
PRDC Power Research & Development Consultants Pvt. Ltd.
PSS Power System Study
SCADA Supervisory control and data acquisition
SLD Single Line Diagram
SLDC State Load Dispatch Centre
SS Substation
STU State Transmission Utility

Web based Protection Database and Desktop based Protection setting calculation tool – ERPC
13 PRDC Bangalore January 2017
1 INTRODUCTION
Eastern Regional Grid comprises of the electrical transmission system of the states of
Bihar, Jharkhand, West Bengal, Odisha, Sikkim and supply area under DVC. The
major constituents of ER grid are the State/UT Transmission and Distribution Utilities,
Central Transmission Utility, State and Central sector Generating Companies, DVC,
CESC, DPL, IPP’s and Private sector Transmission and Distribution Utilities. The ER
covers a geographical area of 425,432 sq. km which is about 13% of the total area of
the country with an installed capacity of 44416 MW. Keeping in view the criticality of
safe and reliable operation of this vast and complex system of ER, M/s. ERPC has
awarded the project for implementation of a software based protection management
system that includes building up a comprehensive web based protection database for
the ER grid to M/s PRDC, a pioneer consultant in the field of power engineering on
31st March 2016.
As a fundamental prerequisite of building the protection management system and as
base work for protection system simulation and studies the entire existing network
data under ER system is modeled from 765 kV level to 33 kV buses of 132/33 kV
substations for all states other than Sikkim where the network is modeled up to 11 kV
buses of 66/11 kV substations. The network model in its entirety encompasses each
of the individual power system elements including generators (hydro, thermal, pump
storage), substations/switching station equipment, transmission lines, HVDC system,
reactors, capacitors and load.
This report presents the results of the base case load flow studies for the modeled
EHV transmission network of the ER grid for a selected scenario of off peak load
condition. With reference to the discussions with M/s ERPC and its constituents, 27th
August 2016 is identified as a typical day with the afternoon off peak load at 13:00
hours. The load flow analysis is carried out with the load generation scenario for the
selected instant and the parameters are crosschecked with the SCADA results to
authenticate the correctness of the modeling.
ER network is modeled for 27th August 2016 load and generation scenario, wherein a
demand of 16109 MW is recorded for the ER grid at 13:00 hrs. This volume of the
report presents the details of existing Eastern region transmission network data, load
generation balance along with operational load flow and short circuit study results
under off peak scenario.

Web based Protection Database and Desktop based Protection setting calculation tool – ERPC
14 PRDC Bangalore January 2017
2 PROJECT SCOPE
The scope of work envisaged in tender document is elaborated in detailed here.
As per scope M/s PRDC should supply Protection Analysis Software Package with
following requirements but not limited to the following modules for the supply of
Software and Database building activities,
M/s PRDC should develop and maintain a hardware setup and software package
capable of meeting the following objectives; but not limited to:
Classified database of all bay equipment and the protection system details of
all bays 132 kV and above, for Eastern Regional power system.
A user friendly interface for browsing and editing the contents of the database.
Tool for simulating the performance/ behavior of the protection system under
all possible normal and abnormal operating conditions of the power system,
including effect of changing one or more parameter setting of the relays.
Diagnostics for verifying proper coordination among various protective relays.
Generation of useful reports.
The detailed scope of work is elaborated in Volume-1 of the DPR and submitted on
27.04.2016. A consolidated view on Network Modeling and database building activity
for operational load flow involve “Creation and maintaining a Web based Protection
Database and Desktop based Protection setting calculation tool for Eastern Regional
Grid” is presented below.
2.1 Database Building Activities for Operational Studies
One time power system network model building for the Load flow, Short circuit
and dynamic simulations of entire Eastern region with Indian national grid
transmission network model.
Data collected from respective substations to be validated before populating
the same in the database.
Complete modeling of ER transmission network for 132 kV and above
including HVDC systems connected with ER, with relevant system parameters
of transmission lines, generators, transformers, reactors for all existing
substations. However, for Sikkim 66 kV system along with 66 kV
interconnections are to be considered.
Prepared network is made ready for base case load flow analysis and the
same has to be verified with field engineers of ER constituents. Both MW and

Web based Protection Database and Desktop based Protection setting calculation tool – ERPC
15 PRDC Bangalore January 2017
MVAr flow are computed and Voltage Level at different Buses is ascertained
along with suggestive conditions to reduce or enhance Bus voltage.
Short circuit, studies to be simulated and the results to be demonstrated to the
ER constituents for approval.
This report includes operational load flow and short circuit study of existing ER grid
under off peak loading condition.

Web based Protection Database and Desktop based Protection setting calculation tool – ERPC
16 PRDC Bangalore January 2017
3 SYSTEM OPERATIONAL DATA
As increasing electricity demand, electrical transmission and distribution system is
expanding at very fast pace. To meet future expected demand with reliable manner
there is a need of great integration among electricity generating, transmission and
distribution agencies.
With an objective to facilitate integrated operation of power system in Eastern Region,
Govt. of India had established Eastern Regional Power Committee comprising the
states of Bihar, Jharkhand, Orissa, West Bengal and Sikkim along with area under
DVC. The major constituents of ER grid are the State/UT Transmission and
Distribution Utilities, Central Transmission Utility, State and Central sector Generating
Companies, DVC, CESC, DPL, IPP’s and Private sector Transmission and
Distribution Utilities. Figure 3.1 depicts constituents of Eastern Regional grid.

Web based Protection Database and Desktop based Protection setting calculation tool – ERPC
17 PRDC Bangalore January 2017
Figure 3.1: Constituents of Eastern Regional grid

Web based Protection Database and Desktop based Protection setting calculation tool – ERPC
18 PRDC Bangalore January 2017
3.1 Methodology adopted for performing the load flow analysis
3.1.1 Data Collection Procedure
In 124th OCC meeting, it was decided that operational load flow study under
off peak loading scenario will be carried out for load conditions of 27.08.2016
and 28.08.2016 at 13.00 hrs and 03.00 hrs respectively.
To collect the Eastern grid network data for operational load flow under off
peak scenario a standard data collection format was prepared and forwarded
to ERPC.
Load generation data collection format was finalized by M/s PRDC and
uploaded in ERPC portal.
M/s PRDC has received the network data from most of the constituents in
agreed format and remaining is collected from field survey in coordination with
ERLDC and SLDC’s.
Network data for all the utilities under Eastern region were collected in co-ordination
with ERPC and its constituents. The complete Eastern Region Network from 765 kV
level to 33 kV buses of 132/33 kV S/S (with the exception where generator is
connected to a lower voltage network) is considered in the studies. However, for
Sikkim 66 kV system along with 66 kV interconnections are considered. Inter-regional
765 kV, 400 kV, 220 kV and 132 kV transmission lines with Northern, Western,
Southern and North-Eastern region is also considered in the studies.
Network update data as collected from ER constituent has been also verified with
monthly status report of CEA.
Table 3.1 present the collected/received data status from ERPC and its constituents.
Table 3.1: Data availability status
Constituent of ERPC
State wise Data received*
Load data (%) Network augmentation Data
(%)
Bihar 35 0
Jharkhand 82 0
Odisha 93 100
Sikkim 0 0
West Bengal 90 100
Note: Network data includes CTU and STU network details as per state wise location while
DVC network details are allocated in Jharkhand and West Bengal as per physical location.

Web based Protection Database and Desktop based Protection setting calculation tool – ERPC
19 PRDC Bangalore January 2017
*Utility owners have furnished network data for all elements but the line and transformer
parameter data is furnished for 70% elements.
* SCADA record of 765 & 400 kV line flow and Generation schedule from ERLDC is collected.
The methodology adopted by the study team for performing the load flow
analysis is as given below.
Configuring the entire Eastern Regional Grid electrical network down to 33 kV
(up to 11 kV bus of 66/11 kV S/S in Sikkim) banks of the transmission
substations. i.e. transmission system comprising of 765 kV, 400 kV, 220 kV
and 132 kV (66 kV S/S in Sikkim) substation buses up to the 33 kV buses at
the substations.
Represented the collective load of the substations at 33 kV buses for Bihar,
Jharkhand, Odisha and West Bengal and at 11 kV buses in Sikkim.
Import form generation located outside the region is considered as a bulk
import.
Railway loads are modeled by considering radially link with grid.
Slack bus is considered outside the region at the point having a maximum
power exchange from eastern grid.
Generation scheduling is matched with ERLDC’s SCADA record.
Allocation of load to the substations is finally done to match the state wise
system demand as per ERLDC’s SCADA record.
Simulation of load flow analysis under off peak scenario is done on the
integrated Grid transmission network of Eastern Region.
Geographical drawings for entire Eastern Regional Grid transmission network
along with separate maps of eastern grid constituent states.
Eastern regional transmission network is simulated under off peak scenario by
taking load demand of 27.08.2016 at 13.00 hrs. Currently, the modeled
Eastern grid network has been simulated for the loading conditions which are
given in Table 3.2.
Table 3.2: ER loading details
Date & Time 27th
August 2016, 13:00 hrs
System Demand Met 16109 MW
Total Load 15438 MW
System Loss 671 MW
Web based Protection Database and Desktop based Protection setting calculation tool – ERPC
20 PRDC Bangalore January 2017
Comparison of the simulated results with the available SCADA records has not
been carried out due to unavailability of accurate SCADA record concurrent
with simulated system demand of 16109 MW.
Software used : MiP-PSCT
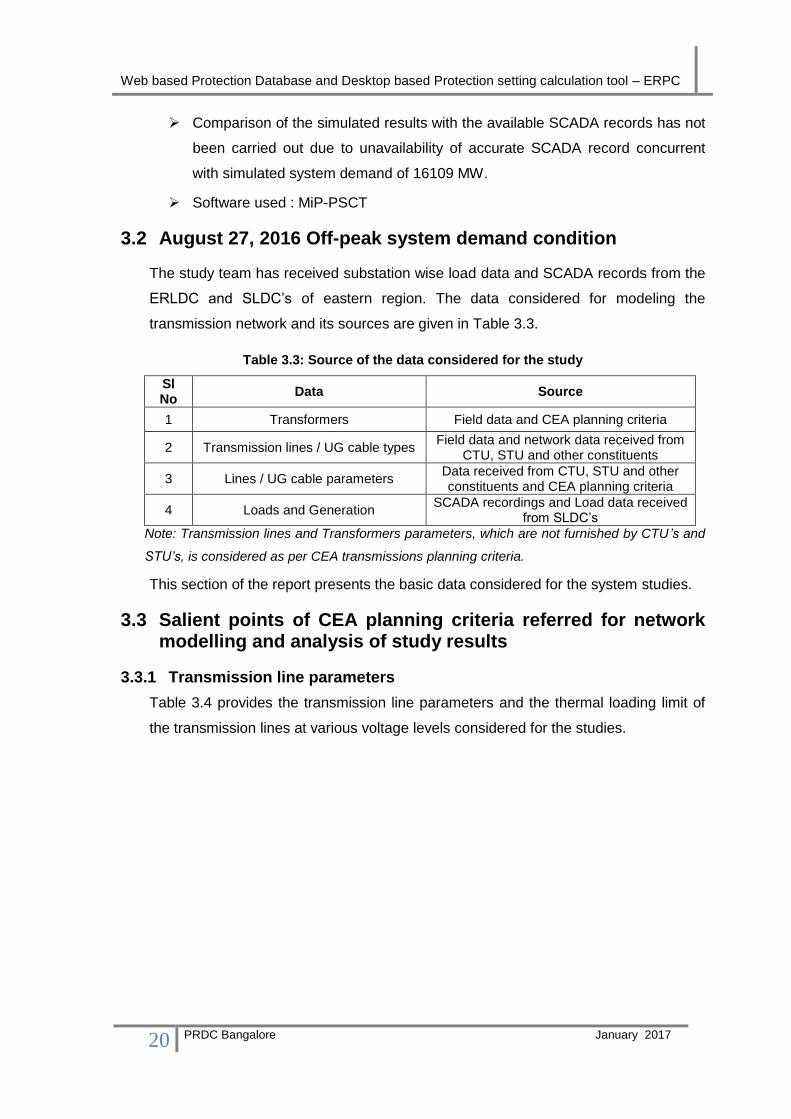
3.2 August 27, 2016 Off-peak system demand condition
The study team has received substation wise load data and SCADA records from the
ERLDC and SLDC’s of eastern region. The data considered for modeling the
transmission network and its sources are given in Table 3.3.
Table 3.3: Source of the data considered for the study
Sl No
Data Source
1 Transformers Field data and CEA planning criteria
2 Transmission lines / UG cable types Field data and network data received from
CTU, STU and other constituents
3 Lines / UG cable parameters Data received from CTU, STU and other constituents and CEA planning criteria
4 Loads and Generation SCADA recordings and Load data received
from SLDC’s
Note: Transmission lines and Transformers parameters, which are not furnished by CTU ’s and
STU’s, is considered as per CEA transmissions planning criteria.
This section of the report presents the basic data considered for the system studies.
3.3 Salient points of CEA planning criteria referred for network modelling and analysis of study results
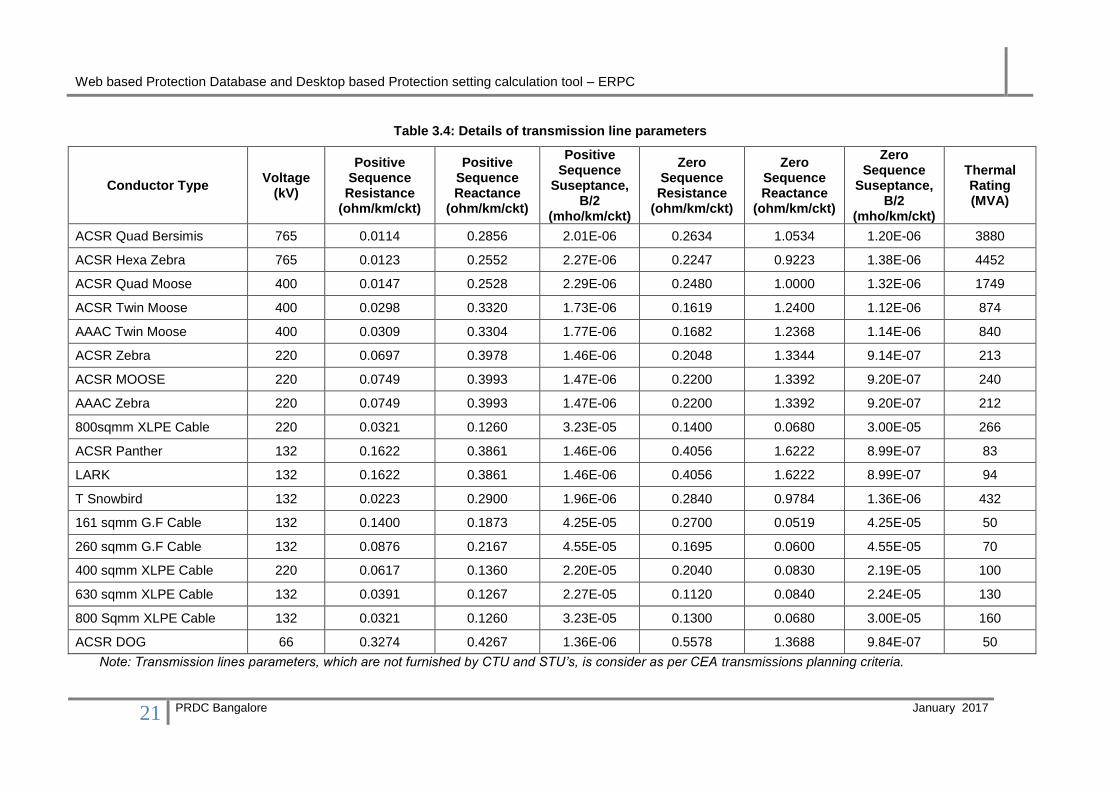
3.3.1 Transmission line parameters
Table 3.4 provides the transmission line parameters and the thermal loading limit of
the transmission lines at various voltage levels considered for the studies.
Web based Protection Database and Desktop based Protection setting calculation tool – ERPC
21 PRDC Bangalore January 2017
Table 3.4: Details of transmission line parameters
Conductor Type Voltage
(kV)
Positive Sequence Resistance
(ohm/km/ckt)
Positive Sequence Reactance
(ohm/km/ckt)
Positive Sequence
Suseptance, B/2
(mho/km/ckt)
Zero Sequence Resistance
(ohm/km/ckt)
Zero Sequence Reactance
(ohm/km/ckt)
Zero Sequence
Suseptance, B/2
(mho/km/ckt)
Thermal Rating (MVA)
ACSR Quad Bersimis 765 0.0114 0.2856 2.01E-06 0.2634 1.0534 1.20E-06 3880
ACSR Hexa Zebra 765 0.0123 0.2552 2.27E-06 0.2247 0.9223 1.38E-06 4452
ACSR Quad Moose 400 0.0147 0.2528 2.29E-06 0.2480 1.0000 1.32E-06 1749
ACSR Twin Moose 400 0.0298 0.3320 1.73E-06 0.1619 1.2400 1.12E-06 874
AAAC Twin Moose 400 0.0309 0.3304 1.77E-06 0.1682 1.2368 1.14E-06 840
ACSR Zebra 220 0.0697 0.3978 1.46E-06 0.2048 1.3344 9.14E-07 213
ACSR MOOSE 220 0.0749 0.3993 1.47E-06 0.2200 1.3392 9.20E-07 240
AAAC Zebra 220 0.0749 0.3993 1.47E-06 0.2200 1.3392 9.20E-07 212
800sqmm XLPE Cable 220 0.0321 0.1260 3.23E-05 0.1400 0.0680 3.00E-05 266
ACSR Panther 132 0.1622 0.3861 1.46E-06 0.4056 1.6222 8.99E-07 83
LARK 132 0.1622 0.3861 1.46E-06 0.4056 1.6222 8.99E-07 94
T Snowbird 132 0.0223 0.2900 1.96E-06 0.2840 0.9784 1.36E-06 432
161 sqmm G.F Cable 132 0.1400 0.1873 4.25E-05 0.2700 0.0519 4.25E-05 50
260 sqmm G.F Cable 132 0.0876 0.2167 4.55E-05 0.1695 0.0600 4.55E-05 70
400 sqmm XLPE Cable 220 0.0617 0.1360 2.20E-05 0.2040 0.0830 2.19E-05 100
630 sqmm XLPE Cable 132 0.0391 0.1267 2.27E-05 0.1120 0.0840 2.24E-05 130
800 Sqmm XLPE Cable 132 0.0321 0.1260 3.23E-05 0.1300 0.0680 3.00E-05 160
ACSR DOG 66 0.3274 0.4267 1.36E-06 0.5578 1.3688 9.84E-07 50
Note: Transmission lines parameters, which are not furnished by CTU and STU’s, is consider as per CEA transmissions planning criteria.

Web based Protection Database and Desktop based Protection setting calculation tool – ERPC
22 PRDC Bangalore January 2017
3.4 Transformer parameters
Actual transformer parameters wherever provided by CTU and STU’s is used. In
cases where data is not furnished standard data as per CEA transmissions planning
criteria given in Table 3.5 is considered.
Table 3.5: Details of transformer parameters
Type of Transformer Transformer reactance Xt
(at its own base MVA)
Generator transformer (GT) 14 – 15 %
Inter-Connecting Transformer (ICT) 12.50%
3.4.1 Voltage limits
The steady-state voltage limits prescribed in CEA’s “Transmission Planning Criteria”
at different voltage levels are presented in Table 3.6.
Table 3.6: Voltage limits at different voltage levels prescribed in CEA’s “Transmission
Planning Criteria”
Nominal Voltage (kV)
Normal rating Emergency rating
Maximum Minimum Maximum Minimum
kV pu kV pu kV pu kV pu
765 800 1.05 728 0.95 800 1.05 713 0.93
400 420 1.05 380 0.95 420 1.05 372 0.93
220 245 1.11 198 0.90 245 1.11 194 0.88
132 145 1.10 122 0.92 145 1.10 119 0.90
66 72.5 1.10 60 0.91 72.5 1.10 59 0.89
3.5 Network element statistics for ER Grid
3.5.1 Substation details
The summary of the number of substations present in the Eastern region state wise is
presented in Table 3.7 and the complete list of substations along with load considered
at each substation is given in Table A of Annexure-I.
Table 3.7: Existing number of sub-station in the ER
Sl. No. Substation* State
Bihar Jharkhand Odisha Sikkim W. Bengal
1 765 kV 2 1 2 - -
2 400 kV 11 7 13 1 12

Web based Protection Database and Desktop based Protection setting calculation tool – ERPC
23 PRDC Bangalore January 2017
Sl. No. Substation* State
Bihar Jharkhand Odisha Sikkim W. Bengal
3 220 kV 16 15 25 - 38
4 132 kV 88 47 86 4 104
5 66 kV - - - 19 -
Total No. of S/S in ER 491
Note: If 765/400/220 kV substation has 400/220 kV transformation level also, in that case
765/400/230 kV substation is counted as single 765 kV substation.
*Above listed substation number excludes switching stations and generating stations.
3.5.2 Transmission line details
The summary of Transmission line data present in the Eastern region is presented in
Table 3.8 and the complete list of transmission lines state wise is given in Table B of
Annexure-I.
Table 3.8: Summary of transmission line data in the ER
Sl. No. Voltage (kV) Line Length (ckm)
1 765 2040
2 400 29983
3 220 17249
4 132 26790
5 66 295
3.5.3 Transformer details
The summary of Transformer data present in the Eastern region is presented below in
Table 3.9 and the complete list of substation and their transformation capacity for
each constituent state of ER Grid is given in Table A of Annexure-I.
Table 3.9: Summary of transformers capacity in the ER
Sl. No Voltage Ratio (kV) Installed Capacity (MVA)
1 765 18000
2 400 32015
3 220 35690
4 132 34926
5 66 212

Web based Protection Database and Desktop based Protection setting calculation tool – ERPC
24 PRDC Bangalore January 2017
3.5.4 Generation details
The summary of generator installed capacity present in the Eastern region state wise
is presented in Table 3.10 and the complete list of generators is given in Table C of
Annexure-I.
Table 3.10: Summary of Generator installed capacity in the ER
Sl. No. State Installed capacity (MW)*
Thermal Hydro
1 Bihar 4545 35
2 Jharkhand 5251 289
3 Odisha 15956 2143
4 Sikkim 0 776
5 West Bengal 14155 1265
Total ER 39907 4508
44415
*Note: Installed capacity includes central, state, IPP and CPP generations
3.5.5 HVDC details
The details of the existing converter stations used for HVDC transmission and HVDC
Back to Back, considered in the studies are given in Table 3.11 and Table 3.12.
Table 3.11: HVDC Back to Back in the ER
Sl. No. Parameter Sasaram B2B Gazuwaka B2B
1 Power Rating 1 X 500 MW 1 X 500 MW 1 X 500 MW
2 Number of blocks 1 Block 1 Block 2
3 AC voltage 400 kV 400 kV 400 kV
4 DC voltage 205 kV 205 kV 177 kV
5 Converter transformer
(Inverter/Rectifier) 6 X 234 MVA 6 X 234 MVA 6 X 201.2 MVA
Table 3.12: HVDC Link in the ER
Sl. No. Parameter Talcher to Kolar
1 Power Rating 2000 MW
2 Number of Poles 2
3 AC voltage 400 kV
4 DC voltage ± 500 kV
5 Converter transformer (Inverter) 6 X 398 MVA
6 Converter transformer (Rectifier) 6 X 398 MVA

Web based Protection Database and Desktop based Protection setting calculation tool – ERPC
25 PRDC Bangalore January 2017
3.5.6 Reactor details
The complete list of state wise Series and shunt reactors installed in the Eastern
region is presented in Table D and E of Annexure-I respectively.
3.5.7 Load details
The state wise summary of load data considered for the study is given in Table 3.13.
Substation wise loading details considered for operational load flow is presented in
Table F of Annexure-I.
Table 3.13: Load Details of ER
Sl. No. Constituents Load*
1 Bihar 2716
2 Jharkhand 799
3 Odisha 2872
4 Sikkim 43
5 West Bengal 4858
6 DVC 2426
7 CESC 1507
8 DPL 217
*Note: 15438 MW (summation of recorded loads in S/S) on 27.08.2016 at 13:00 hrs in ER grid
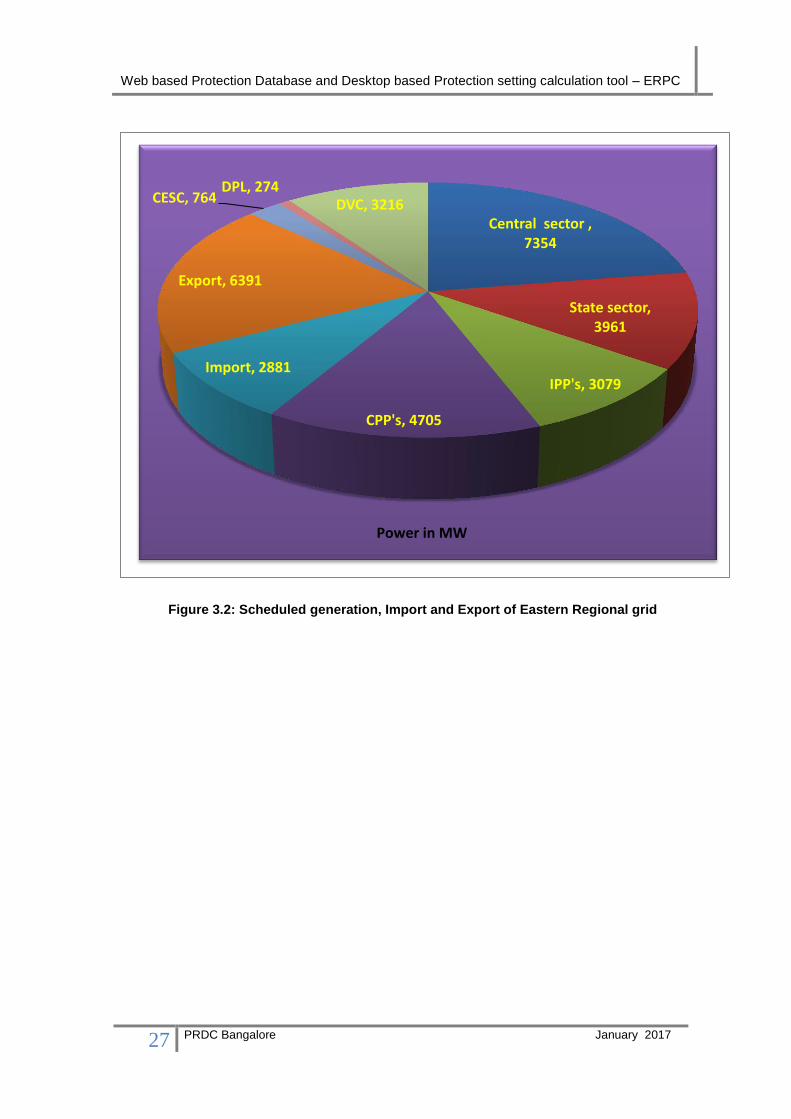
3.6 Generation schedule details for operational load flow
The generation schedule considered was based on the information obtained from
the ERLDC and other constituents of ER grid. Power plant wise generation
allocation is given in Table 3.14 and graphically represented in figure 3.2.
Table 3.14: Generation schedule Details of ER
Sl.No.
State Station Name Owned By Scheduled Generation
(MW)
1
Bihar
Muzaffarpur Joint venture of NTPC &
BSEB 100.0
2 Kahalgaon NTPC
1859
3 Barh 405
4
Jharkhand
Patratu Thermal JVNL
0
5 Tenughat Thermal 180
6 Kodarma Thermal
DVC
438
7 Chandrapura Thermal 403
8 Panchet 70
9 Mithon Dam 62
10 Bokaro Thermal 148

Web based Protection Database and Desktop based Protection setting calculation tool – ERPC
26 PRDC Bangalore January 2017
Sl.No.
State Station Name Owned By Scheduled Generation
(MW)
11 Adhunik Thermal APNRL 222
12 Mithon RB Thermal MPL 416
13
Odisha
Upper Kolab
OHPC
0
14 Indravati 0
15 Rengali 213
16 Hirakud 152
17 Talcher Thermal NTPC 429
18 IB Thermal OPGC 390
19 Balimela OHPC
37
20 Machkund 85
21 Talcher Super Thermal NTPC 2309
22 Meenakshi Power 40
23 GMR GMR Kamalanga Energy 536
24 Jindal Thermal JITPL 1140
25 Sterlite Energy Vedanta Ltd. 0.0
26 Net CPP Injection to Grid 780
27
Sikkim
Rangit Hydro NHPC
62
28 Teesta 5 Hydro 330
29 Lagit Hydro
Sikkim Gov.
0.0
30 Meyong Hydro 0.0
31 Rongli Hydro 0.0
32 Chuzachen Gati Infrastructure Pvt. Ltd 100
33 Jorthang DANS Energy Pvt. Ltd. 87
34
West Bengal
Bandel Thermal
WBPDCL
188
35 Santaldih Thermal 177
36 Kolaghat Thermal 671
37 Bakreswar Thermal 899
38 Sagardighi Thermal 495
39 Purulia Pump Storage
Hydro WBSEDCL
300
40 Jaldhaka Hydro 25
41 Rammam Hydro 49
42 Tista Load Dam Hydro NHPC 0.0
43 Farakka Super Thermal NTPC 1960
44 Mejia
DVC
1356
45 RTPS 350
46 Durgapur Steel Thermal 389
47 DPL Thermal DPL 274
48 Budge Budge
CESC
719
49 SRS 45
50 TRS 0
51 Haldia Thermal 538
Web based Protection Database and Desktop based Protection setting calculation tool – ERPC
27 PRDC Bangalore January 2017
Figure 3.2: Scheduled generation, Import and Export of Eastern Regional grid
Central sector , 7354
State sector, 3961
IPP's, 3079
CPP's, 4705
Import, 2881
Export, 6391
CESC, 764 DPL, 274
DVC, 3216
Power in MW

Web based Protection Database and Desktop based Protection setting calculation tool – ERPC
28 PRDC Bangalore January 2017
4 OPERATIONAL LOAD FLOW STUDY
4.1 Introduction to Load flow analysis
One of the most common computational procedures used in power system analysis is
the load flow calculation. The planning, design and operation of power systems
require such calculations to analyze the steady state performance of power system
under various operating conditions and to study the effects of changes in network
configuration. These load flow solutions are performed using computer programs
designed specifically for this purpose.
The basic question in the load flow analysis is: “Given the demand at all buses of a
known electric power system configuration and the power production at each
generator, find the power flow in each line and transformer of the interconnecting
network and the voltage magnitude with phase angle at each bus.“
Analyzing the solution of load flow analysis for numerous conditions helps ensure that
the power system is designed to satisfy its performance criteria while incurring the
most favorable investment and operation costs. Some examples of the uses of load
flow studies are to determine,
Component or circuit loading.
Steady state bus voltages.
Active and Reactive power flows.
Transformers tap settings.
System losses.
Performance under emergency conditions.
Modern systems are complex and have many paths or branches over which power
can flow. Such systems form networks of series and parallel paths. Electric power
flow in these networks divides among the branches until a balance is reached in
accordance with established circuit theory.
Computer programs to solve load flows are divided into two type’s static (offline) and
dynamic (real time). Most load flow studies for system analysis are based on static
network models. Real time load flows (online) that incorporate data input from the
actual networks are typically used by utilities in Supervisory Control and Data
Acquisition (SCADA) systems. Such systems are used primarily as operating tools for
optimization of generation, VAr control, dispatch, losses, and tie line flow control. This
discussion is concerned with only static network models and their analysis.

Web based Protection Database and Desktop based Protection setting calculation tool – ERPC
29 PRDC Bangalore January 2017
A load flow calculation determines the state of the power system with respect to a
given load and generation schedule. It represents a steady state condition which is
assumed to remain fixed for some time. In reality, line flows and bus voltages
fluctuate in small amounts because load changes due to lights, motors, and other
loads being turned on or off in the system. However, these small fluctuations are
ignored in calculating the steady state effects on system equipment. As the load
distribution, and hence power flow in the network vary considerably during different
time periods, it may be necessary to obtain load flow solutions representing different
system conditions such as peak load, average load or light load. Generally, these
solutions provide,
Optimum operating modes for normal conditions, such as proper setting of
voltage control devices, or how the system will respond to abnormal
conditions, such as outage of transformers or lines.
When the new equipment additions are needed.
Effectiveness of new alternatives to solve present deficiencies and meet future
requirements.
The load flow model is also the basis for several other types of studies such as short
circuit, stability, motor starting, and harmonic studies. The load flow model supplies
the network data and an initial steady state condition for these studies.
The present study is carried out to determine the power flows at different
lines/transformers and to compute the voltage profile at different buses of the existing
system. The system configuration considered for the study and simulation results are
explained in the subsequent sections.

Web based Protection Database and Desktop based Protection setting calculation tool – ERPC
30 PRDC Bangalore January 2017
4.2 Load Generation Balance from the results of operational load flow analysis
The detail of load generation balance of ER is given in Table 4.1 and state wise load
generation balance is presented in Table 4.2, 4.3, 4.4, 4.5, 4.6, 4.7 and 4.8. The
detailed load and generation data is given in Annexure-I.
Table 4.1: Load generation balance Details of ER
Sl. No. Description Quantity (MW)
1 Generation 19619
2 Import 2881
Total (Generation + Import) 22500
3 Loss 671*(2.98%)
4 Load 15438
Demand Met (Load + Loss) 16109
5 Export 6391
Total System (Load + Export + Loss) 22500
*Note: Only for 765 kV, 400 kV, 220 kV, 132 kV and 66 kV transmission network.
Table 4.2: Load generation balance details of Bihar
Sl. No. Description Quantity (MW)
1 Generation 2364
2 Import 3208
Total Total(Generation + Import) 5572
3 Loss 129* (2.32%)
4 Load 2716
Demand Met (Load + Loss) 2846
5 Export 2726
Total (Load + Export + Loss) 5572
*Note: Only for 765 kV, 400 kV, 220 kV and 132 kV transmission network
Table 4.3: Load generation balance details of Jharkhand
Sl. No. Description Quantity (MW)
1 Generation 818
2 Import 3437
Total (Generation + Import) 4255
3 Loss 74*(1.73%)
4 Load 799
Demand Met (Load + Loss) 872

Web based Protection Database and Desktop based Protection setting calculation tool – ERPC
31 PRDC Bangalore January 2017
Sl. No. Description Quantity (MW)
5 Export 3383
Total (Load + Export + Loss) 4255
*Note: Only for 765 kV, 400 kV, 220 kV and 132 kV transmission network
Table 4.4: Load generation balance details of Odisha
Sl. No. Description Quantity (MW)
1 Generation 6111
2 Import 710
Total (Generation + Import) 6822
3 Loss 199*(2.92%)
4 Load 2872
Demand Met (Load + Loss) 3071
5 Export 3751
Total (Load + Export + Loss) 6822
*Note: Only for 765 kV, 400 kV, 220 kV and 132 kV transmission network
Table 4.5: Load generation balance details of Sikkim
Sl. No. Description Quantity (MW)
1 Generation 579
2 Import 0
Total (Generation + Import) 579
3 Loss 8*(1.31%)
4 Load 43
Demand Met (Load + Loss) 51
5 Export 528
Total (Load + Export + Loss) 579
*Note: Only for 400 kV, 132 kV and 66 kV transmission network
Table 4.6: Load generation balance details of West Bengal
Sl. No. Description Quantity (MW)
1 Generation 5402
2 Import 3360
Total (Generation + Import) 8762
3 Loss 168*(1.92%)
4 Load 4858
Demand Met (Load + Loss) 5026
5 Export 3736
Total (Load + Export + Loss) 8762
Web based Protection Database and Desktop based Protection setting calculation tool – ERPC
32 PRDC Bangalore January 2017
*Note: Only for 400 kV, 220 kV and 132 kV transmission network
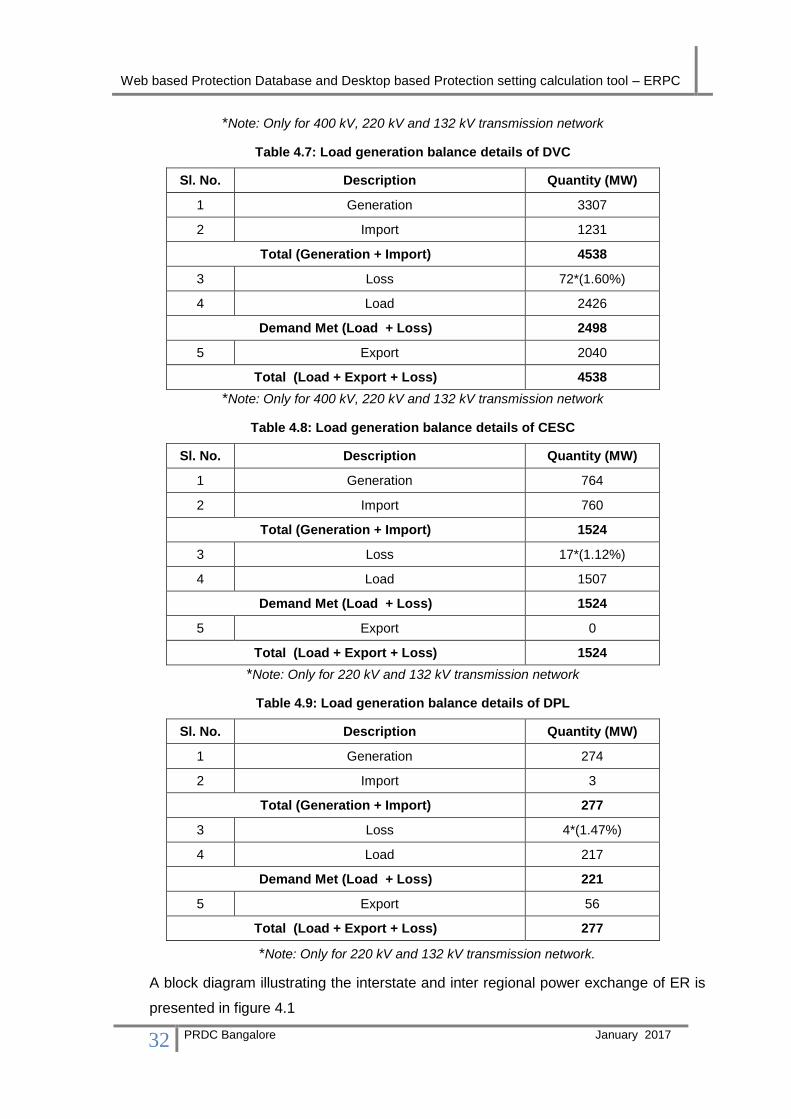
Table 4.7: Load generation balance details of DVC
Sl. No. Description Quantity (MW)
1 Generation 3307
2 Import 1231
Total (Generation + Import) 4538
3 Loss 72*(1.60%)
4 Load 2426
Demand Met (Load + Loss) 2498
5 Export 2040
Total (Load + Export + Loss) 4538
*Note: Only for 400 kV, 220 kV and 132 kV transmission network
Table 4.8: Load generation balance details of CESC
Sl. No. Description Quantity (MW)
1 Generation 764
2 Import 760
Total (Generation + Import) 1524
3 Loss 17*(1.12%)
4 Load 1507
Demand Met (Load + Loss) 1524
5 Export 0
Total (Load + Export + Loss) 1524
*Note: Only for 220 kV and 132 kV transmission network
Table 4.9: Load generation balance details of DPL
Sl. No. Description Quantity (MW)
1 Generation 274
2 Import 3
Total (Generation + Import) 277
3 Loss 4*(1.47%)
4 Load 217
Demand Met (Load + Loss) 221
5 Export 56
Total (Load + Export + Loss) 277
*Note: Only for 220 kV and 132 kV transmission network.
A block diagram illustrating the interstate and inter regional power exchange of ER is
presented in figure 4.1

Web based Protection Database and Desktop based Protection setting calculation tool – ERPC
33 PRDC Bangalore January 2017
Figure 4.1: Block diagram of load generation balance of ER
Note: Inter regional exchange is shown as net exchange

Web based Protection Database and Desktop based Protection setting calculation tool – ERPC
34 PRDC Bangalore January 2017
4.3 Line loading conditions
Under operational load flow study, number of lines whose loading is below 5% and
above 80% is presented in Table 4.10 for complete ER grid and Table 4.11 to 4.18 for
constituent state of ER grid.
Table 4.10: Percentage loading details of lines of Eastern Region
Sl.No Voltage Grade
(kV)
Loading Percentage
Max Min Avg No of lines loaded 80% and above
No of Lines loaded 5% and
below
1 765 14.50 5.30 8.94 0 0
2 400 65.20 3.70 20.89 0 4
3 220 83.90 0.20 30.02 8 28
4 132 99.8 0.10 30.12 29 87
5 66 51.90 0.10 11.87 0 9
Table 4.11: Percentage loading details of lines of Bihar
Sl.No Voltage Grade (kV)
Loading Percentage
Max Min Avg No of lines loaded 80% and above
No of Lines loaded 5% and
below
1 765 14.50 6.00 11.17 0 0
2 400 35.20 5.10 18.80 0 0
3 220 81.60 6.80 39.18 2 0
4 132 95.80 0.40 28.84 8 25
Table 4.12: Percentage loading details of lines of Jharkhand
Sl.No Voltage Grade (kV)
Loading Percentage
Max Min Avg No of lines loaded 80% and above
No of Lines loaded 5% and
below
1 765 12.20 11.70 11.95 0 0
2 400 39.20 6.20 16.40 0 0
3 220 59.10 18.00 36.76 0 0
4 132 99.00 0.90 20.72 1 12

Web based Protection Database and Desktop based Protection setting calculation tool – ERPC
35 PRDC Bangalore January 2017
Table 4.13: Percentage loading details of lines of Odisha
Sl.No Voltage Grade (kV)
Loading Percentage
Max Min Avg No of lines loaded 80% and above
No of Lines loaded 5% and
below
1 765 6.20 5.30 5.75 0 0
2 400 65.20 9.00 26.04 0 0
3 220 81.50 0.40 26.09 2 15
4 132 99.8 0.10 26.92 6 31
Table 4.14: Percentage loading details of lines of Sikkim
Sl.No Voltage Grade (kV)
Loading Percentage
Max Min Avg No of lines loaded 80% and above
No of Lines loaded 5% and
below
1 400 26.40 18.90 22.65 0 0
2 220 24.10 16.90 20.23 0 0
3 132 59.4 4.2 34.02 0 1
4 66 51.90 0.10 9.26 0 9
Table 4.15: Percentage loading details of lines of West Bengal
Sl.No Voltage Grade (kV)
Loading Percentage
Max Min Avg No of lines loaded 80% and above
No of Lines loaded 5% and
below
1 400 48.10 4.30 24.40 0 1
2 220 83.90 0.20 32.47 4 4
3 132 97.20 0.10 36.85 8 10
Table 4.16: Percentage loading details of lines of DVC
Sl.No Voltage Grade (kV)
Loading Percentage
Max Min Avg No of lines loaded 80% and above
No of Lines loaded 5% and
below
1 400 39.2 3.7 13.44 0 3
2 220 78 1.2 28.5 0 9
3 132 66.8 0.1 22.39 0 8

Web based Protection Database and Desktop based Protection setting calculation tool – ERPC
36 PRDC Bangalore January 2017
Table 4.17: Percentage loading details of lines of CESC
Sl.No Voltage Grade (kV)
Loading Percentage
Max Min Avg No of lines loaded 80% and above
No of Lines loaded 5% and
below
1 220 69.6 43 52.17 0 0
2 132 96.9 6.8 45.84 6 0
Table 4.18: Percentage loading details of lines of DPL
Sl.No Voltage Grade (kV)
Loading Percentage
Max Min Avg No of lines loaded 80% and above
No of Lines loaded 5% and
below
1 132 73.30 15.80 31.74 0 0
Note: As observed in operational load flow that no line is loaded 100% and above.
4.4 Transformer loading conditions
Under operational load flow study, number of transformers whose loading is below
20% and above 80% is presented in Table 4.19 for complete ER grid and Table 4.20
to 4.27 for constituent state of ER grid.
Table 4.19: Percentage loading details of Transformers of Eastern Region
Sl.No Voltage Grade (kV)
Loading Percentage
Max Min Avg
No of Transformers
loaded 80% and above
No of Transformers
loaded 20% and below
1 765 18.8 6.1 12.62 0 6
2 400 82.3 0.9 46.20 4 14
3 220 93.2 0.1 48.16 3 53
4 132 98.2 1 37.86 30 153
5 66 36.4 16.3 29.01 0 10
Table 4.20: Percentage loading details of Transformers of Bihar
Sl.No Voltage Grade (kV)
Loading Percentage
Max Min Avg
No of Transformers
loaded 80% and above
No of Transformers
loaded 20% and below
1 765 17 13.1 15.05 0 4
2 400 74.9 6.3 35.13 0 4
Web based Protection Database and Desktop based Protection setting calculation tool – ERPC
37 PRDC Bangalore January 2017
Sl.No Voltage Grade (kV)
Loading Percentage
Max Min Avg
No of Transformers
loaded 80% and above
No of Transformers
loaded 20% and below
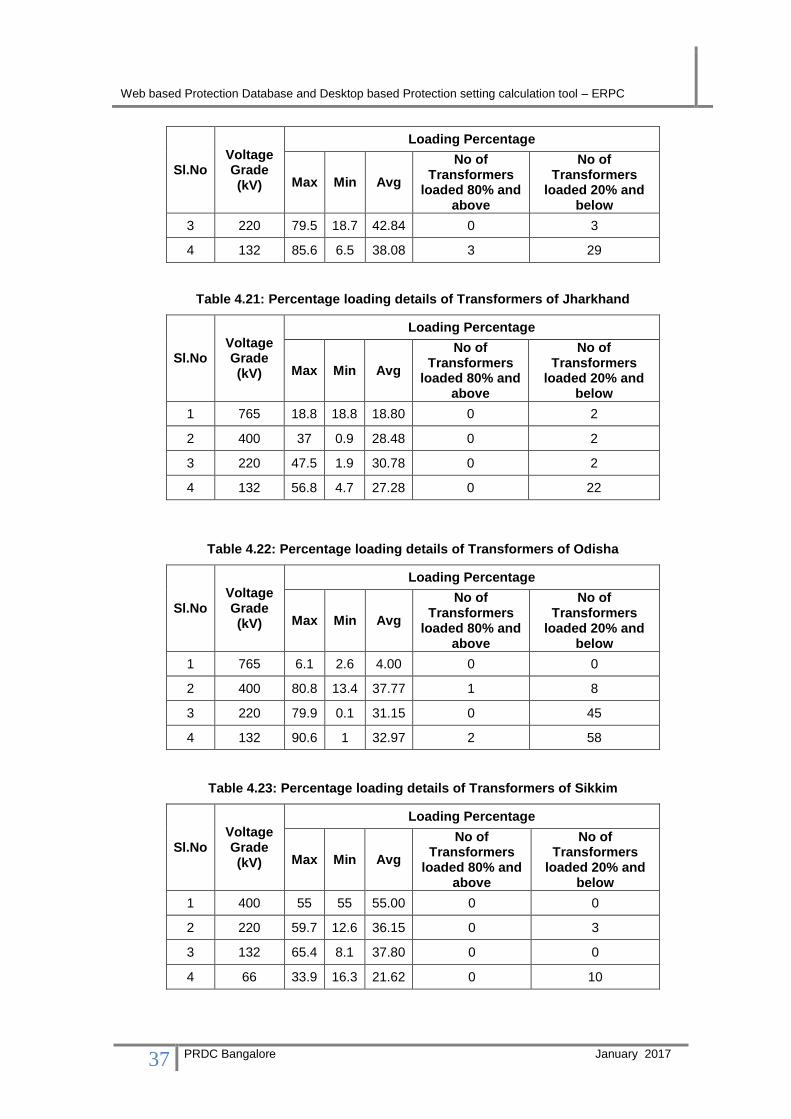
3 220 79.5 18.7 42.84 0 3
4 132 85.6 6.5 38.08 3 29
Table 4.21: Percentage loading details of Transformers of Jharkhand
Sl.No Voltage Grade (kV)
Loading Percentage
Max Min Avg
No of Transformers
loaded 80% and above
No of Transformers
loaded 20% and below
1 765 18.8 18.8 18.80 0 2
2 400 37 0.9 28.48 0 2
3 220 47.5 1.9 30.78 0 2
4 132 56.8 4.7 27.28 0 22
Table 4.22: Percentage loading details of Transformers of Odisha
Sl.No Voltage Grade (kV)
Loading Percentage
Max Min Avg
No of Transformers
loaded 80% and above
No of Transformers
loaded 20% and below
1 765 6.1 2.6 4.00 0 0
2 400 80.8 13.4 37.77 1 8
3 220 79.9 0.1 31.15 0 45
4 132 90.6 1 32.97 2 58
Table 4.23: Percentage loading details of Transformers of Sikkim
Sl.No Voltage Grade (kV)
Loading Percentage
Max Min Avg
No of Transformers
loaded 80% and above
No of Transformers
loaded 20% and below
1 400 55 55 55.00 0 0
2 220 59.7 12.6 36.15 0 3
3 132 65.4 8.1 37.80 0 0
4 66 33.9 16.3 21.62 0 10

Web based Protection Database and Desktop based Protection setting calculation tool – ERPC
38 PRDC Bangalore January 2017
Table 4.24: Percentage loading details of Transformers of West Bengal
Sl.No Voltage Grade (kV)
Loading Percentage
Max Min Avg
No of Transformers
loaded 80% and above
No of Transformers
loaded 20% and below
1 400 82.3 26 58.79 3 0
2 220 72.2 22.5 33.31 0 0
3 132 98.2 1.1 43.21 15 22
4 66 36.4 36.4 36.40 0 0
Table 4.25: Percentage loading details of Transformers of DVC
Sl.No Voltage Grade (kV)
Loading Percentage
Max Min Avg
No of Transformers
loaded 80% and above
No of Transformers
loaded 20% and below
1 400 70.5 53.5 62 0 0
2 220 93.2 6.4 38.50 2 7
3 132 96.2 7 43.37 6 10
Table 4.26: Percentage loading details of Transformers of CESC
Sl.No Voltage Grade (kV)
Loading Percentage
Max Min Avg
No of Transformers
loaded 80% and above
No of Transformers
loaded 20% and below
1 220 76.8 76.8 76.80 0 0
2 132 88.7 13.2 48.42 3 4
Table 4.27: Percentage loading details of Transformers of DPL
Sl.No Voltage Grade (kV)
Loading Percentage
Max Min Avg
No of Transformers loaded 80% and above
No of Transformers
loaded 20% and below
1 220 86.1 86.1 86.10 1 0
2 132 86 5.3 31.73 1 8

Web based Protection Database and Desktop based Protection setting calculation tool – ERPC
39 PRDC Bangalore January 2017
4.5 Voltage profile
Bus Voltage Profile for Eastern Region grid is presented in Table 4.28
Table 4.28: Bus Voltage Profile for Eastern Region
Sl.No Voltage Grade (kV) Bus Voltage In pu
Max Min Average
1 765 1.002 0.985 0.994
2 400 1.044 0.953 1.001
3 220 1.025 0.947 0.990
4 132 1.026 0.903 0.975
5 66 1.027 0.923 0.998
Note: As observed in operational load flow study that bus voltage of ER grid is within the
acceptable limit (as per CEA grid code).
4.6 Analysis of the load flow study results
Power map of ER grid along with separate power map of constituent states
(Bihar, Jharkhand, Odisha, Sikkim and West Bengal) for operational load flow
study is presented in Annexure-II.
Line loading details are presented in Table G of Annexure-II.
The voltages at all the bus bars (765 kV, 400 kV, 220 kV, 132 kV and 66 kV)
were within the standard tolerance limits (as per CEA grid code).
The line /Transformers were loaded within the rated capacity under off-peak
operating condition of 27th August 2016 at 13.00 hrs.
Maximum inter regional power exchange is 2544 MW to NR.
Web based Protection Database and Desktop based Protection setting calculation tool – ERPC
40 PRDC Bangalore January 2017
5 SHORT CIRCUIT STUDIES
Even the most carefully designed power systems may be subjected to damaging arc
blast or overheating and the explosive magnetic forces associated with high
magnitude currents flowing during a short circuit. To ensure that circuit’s protective
equipment can isolate faults quickly and minimize system component damage,
personal hazard and outage severity, it is essential that a short circuit study be
included in the electrical design of new industrial and commercial power systems, and
for modifications to existing system. There are five possibilities for a short circuit in
three-phase system.
3-phase to ground fault.
Single line to ground fault.
Line to line fault.
Double line to ground fault.
Open conductor fault.
If a short circuit of one type is not interrupted promptly, it often progresses to another
type, which generally results in more severe damage. For example in a solidly
grounded system, a single line to ground fault, if not interrupted, can quickly escalate
to a double line to ground or a three phase to ground fault. The choice of study that is
required for a particular system is a matter of engineering judgment based on an
analysis of the basic single line diagram and determination of the specific purpose of
the study.
For the three-phase industrial and commercial power systems, the most common
study is the calculation of three-phase (balanced) short circuit current which is more
severe compared to other faults, specifically for comparison with switching equipment
capability. The short circuit current determined from this type of study generally
represents the highest value at a particular location in the system. It is important to
realize that single line to ground or double line to ground short circuit current
magnitude can exceed three-phase short circuit current under certain conditions. This
condition may arise near,
Solidly grounded synchronous machines.
Solidly grounded star connection of a delta-star transformer of the three-
phase core design.
Grounded star-delta tertiary autotransformers.

Web based Protection Database and Desktop based Protection setting calculation tool – ERPC
41 PRDC Bangalore January 2017
Grounded star-delta tertiary three winding transformers.
In system where any of these machines or transformer connections exists, it may be
necessary to conduct a single line to ground short circuit study. Medium and high
voltage circuit breakers have 15% higher interrupting capability for single line to
ground short circuits than for phase to phase or three phase short circuits. This
difference must be taken into account when comparing short circuit duty with
equipment ratings. Further, future network growth (about 20% increases in result
obtained through study) has to be accounted while considering the fault levels for
equipment ratings.
5.1 Short circuit study result analysis
The detailed results of the Short circuit study for the three phases to ground fault and
single line to ground faults are tabulated in Table H and presented in Annexure-III.
Based on the detailed analysis, it is observed that
For 400 kV and 220 kV voltages, 3-phase fault level & SLG fault level at some
of the substations are at the critical level. Fault levels which are more than 80%
of breaker rating are listed in Table 5.1 and Table 5.2.
It is observed from the results of short circuit studies that, the fault MVA is
exceeding the breaker capacity in following buses:
o Bihar: Kahalgaon 400 kV
o Jharkhand: Maithon 400 kV
For 765 kV, 132 kV & 66 kV voltage level, there are no violation in the fault
level.
Table 5.1: 3-Ph fault levels > 80% of breaker rating
Sl.No. Substation Name Rated
Voltage (kV) 3-Phase
fault (MVA)
Fault Current
(kA)
1 Meramundali 400 27108.0 39.01
2 TTPS 220 13438.4 35.27
3 Budhipadar 220 14259.8 37.42
4 NALCO 220 13646.9 35.81
5 BSSL 220 11211.2 29.42
6 Bidhannagar 220 13268.5 34.82
7 Parulia 400 24895.5 35.93
8 DTPS (Waria) 132 6038.8 26.41

Web based Protection Database and Desktop based Protection setting calculation tool – ERPC
42 PRDC Bangalore January 2017
Sl.No. Substation Name Rated
Voltage (kV) 3-Phase
fault (MVA)
Fault Current
(kA)
9 Kahalgaon NTPC 400 29907.5 43.17
10 Maithon 400 32198.7 46.48
Table 5.2: SLG fault levels > 80% of breaker rating
Sl.No. Substation Name Rated
Voltage (kV) SLG fault
(MVA)
Fault Current
(kA)
1 Meramundali 400 24817.5 35.82
220 12284.1 32.23
2 Budhipadar 220 14000.8 36.74
3 Vedanta 220 13036.0 34.21
4 NALCO 220 14100.9 37.01
5 BSSL 220 11040.4 28.97
6 Bidhannagar 220 13621.0 35.75
7 DTPS (Waria) 132 6262.5 27.39
8 Mejia 220 12944.2 33.97
9 DPL 132 6467.6 28.29
10 Kahalgaon NTPC 400 28745.8 41.49
Note: In some of the Generating stations the SLG fault rating is exceeding 80% while the three
phase fault rating is within 80% of breaker capacity.
Web based Protection Database and Desktop based Protection setting calculation tool – ERPC
43 PRDC Bangalore January 2017
6 CONCLUSION
Based on the operational load flow studies carried out for aforesaid condition
following observation are made,
The voltages at all the bus bars (765 kV, 400 kV, 220 kV, 132 kV and 66 kV)
were within the standard tolerance limits (as per CEA grid code).
The line/transformers were loaded within the rated capacity under off peak
operating condition of 27th August 2016 at 13.00 hrs.
Maximum inter regional power exchange is 2544 MW to NR.
It is observed that short circuit levels are critical at some of the substations
and violating at certain locations. Such cases are listed above in section 5.1.
Bus splitting is suggested for above substations. Breaker upgradation may
also be considered during substation renovations.
The network modelling for operational load flow and short circuit study and the results
will provide the base for the subsequent protection system analysis and calculation.
This will also provide the base for reactive power compensation of ER grid.

Web based Protection Database and Desktop based Protection setting calculation tool – ERPC
44 PRDC Bangalore January 2017
ANNEXURE I – EXISTING EASTERN REGION TRANSMISSION NETWORK
AND LOAD DETAILS

Web based Protection Database and Desktop based Protection setting calculation tool – ERPC
45 PRDC Bangalore January 2017
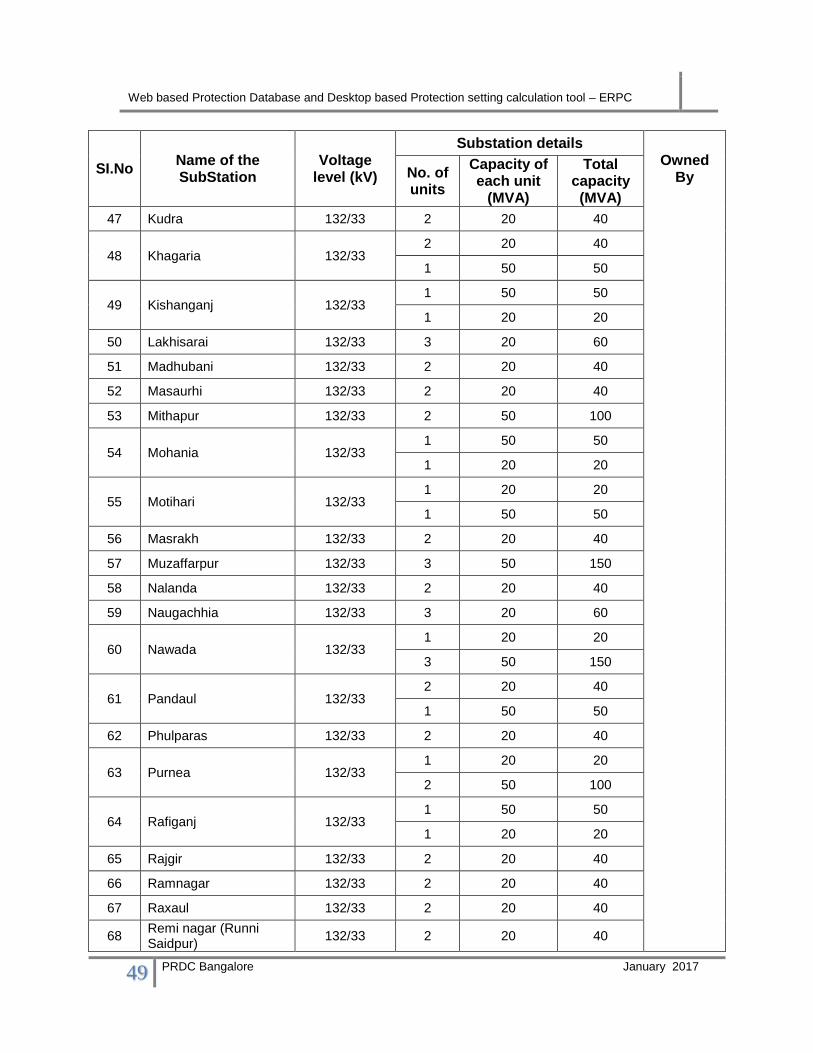
Table A: State wise list of substations present in the Eastern region grid
SI.No Name of the SubStation
Voltage level (kV)
Substation details
Owned By No. of
units
Capacity of each unit
(MVA)
Total capacity (MVA)
Bihar
765kV Level
1 Sasaram
765/400 1 1500 1500
PGCIL 400/220 1 315 315
1 500 500
132/33 2 10 20
2 Gaya
765/400 3 1500 4500
PGCIL 400/220
1 315 315
1 500 500
400kV Level
1 Banka 400/132 2 200 400 PGCIL
2 Barh 400/132 2 200 400 NTPC
3 Biharsharif 400/220 3 315 945 PGCIL
4 Kahalgaon 400/132 2 200 400 NTPC
5 Muzaffarpur 400/220
2 315 630
PGCIL
1 500 500
220/132 1 100 100
6 New Purnea 400/220 1 315 315
1 500 500
7 Patna 400/220 2 315 630
8 Lakhisarai 400/132 2 200 400
9 Sasaram B2B 400/(93/√3)/93 3 234/117/117
10 Kishanganj 400/220 2 500 1000
11 Nabinagar Rly 400/132 2 200 400 Railway
220kV Level
1 Purnea 220/132 3 160 480
PGCIL 2 Arrah 220/132
1 160 160
2 100 200

Web based Protection Database and Desktop based Protection setting calculation tool – ERPC
46 PRDC Bangalore January 2017
SI.No Name of the SubStation
Voltage level (kV)
Substation details Owned
By No. of units
Capacity of each unit
(MVA)
Total capacity (MVA)
3 Biharshariff 220/132 3 150 450
BSPTCL
132/33 1 20 20
4 Bodhgaya
220/132 4 150 600
220/132 1 160 160
132/33 3 50 150
5 Darbhanga new 220/132 2 160 320
6 Dehri 220/132 4 100 400
132/33 2 50 100
7 Fatuha 220/132 5 100 500
132/33 3 50 150
8 Gopalganj 220/132 3 100 300
132/33 3 50 150
9 Khagaul 220/132 4 100 400
132/33 5 50 250
10 Begusarai 220/132 4 100 400
132/33 3 50 150
11 Sipara
220/132 2 150 300
220/132 1 160 160
132/33 2 50 100
12 Hazipur New 220/132 2 100 200
13 Madhepura 220/132 3 100 300
132/33 2 20 40
14 Pusauli New 220/132 2 150 300
132/33 2 50 100
15 Sonenagar 220/132 2 160 320
132/33 2 50 100
16 Muzaffarpur (MTPS) 220/132 3 100 300
132kV Level
1 Arrah 132/33 1 20 20
BSPTCL 3 50 150

Web based Protection Database and Desktop based Protection setting calculation tool – ERPC
47 PRDC Bangalore January 2017
SI.No Name of the SubStation
Voltage level (kV)
Substation details Owned
By No. of units
Capacity of each unit
(MVA)
Total capacity (MVA)
2 Ataula (Arwal) 132/33 2 20 40
3 Aurangabad 132/33 2 20 40
4 Banjari 132/33 3 20 60
5 Banka 132/33 3 20 60
6 Barauni TPS 132/33 1 50 50
2 20 40
7 Barh 132/33 1 20 20
1 50 50
8 Baripahari 132/33 2 50 100
9 Belaganj 132/33 2 20 40
10 Bettiah 132/33 2 20 40
1 50 50
11 Bihta 132/33 3 50 150
12 Bikramganj 132/33 2 20 40
1 50 50
13 Buxar 132/33 2 20 40
1 50 50
14 Chandauti (Gaya) 132/33 2 50 100
132/25 2 13.35 26.7
15 Chhapra 132/33 2 20 40
1 50 50
16 Darbhanga (old) 132/33 2 50 100
17 Dhaka 132/33 3 20 60
18 Dalsingsarai 132/33 2 20 40
19 Digha 132/33 3 50 150
20 Dumraon 132/33 1 20 20
1 50 50
21 Ekma 132/33 1 20 20
22 Ekanga Sarai (Ekanagar)
132/33 3 20 60
23 Forbeshganj 132/33 1 20 20

Web based Protection Database and Desktop based Protection setting calculation tool – ERPC
48 PRDC Bangalore January 2017
SI.No Name of the SubStation
Voltage level (kV)
Substation details Owned
By No. of units
Capacity of each unit
(MVA)
Total capacity (MVA)
1 50 50
24 Goh 132/33 2 20 40
25 Gangwara 132/33 2 50 100
26 Gaighat 132/33 2 50 100
27 Hazipur 132/33 3 50 150
28 Hulasganj 132/33 2 20 40
29 Harnaut 132/33 2 20 40
30 Hathidah 132/33 3 20 60
31 Imamganj 132/33 2 20 40
32 Jagdishpur 132/33 2 20 40
33 Jandaha 132/33 2 20 40
34 Jainagar 132/33 3 20 60
35 Jakkanpur 132/33 4 50 200
1 20 20
36 Jamalpur 132/33 2 50 100
37 Jamui 132/33 2 20 40
38 Jehanabad 132/33 2 20 40
39 Kahalgaon 132/33 2 20 40
2 50 100
40 Karmnasa
132/33 2 50 100
1 20 20
132/25 1 21.6 21.6
1 20 20
41 Kataiya 132/33 3 20 60
42 Katihar 132/33 3 20 60
1 50 50
43 Katra 132/33 3 50 150
44 Kusheshwarsthan 132/33 2 20 40
45 Kochas 132/33 2 20 40
46 Karbigahiya 132/33 4 50 200
Web based Protection Database and Desktop based Protection setting calculation tool – ERPC
49 PRDC Bangalore January 2017
SI.No Name of the SubStation
Voltage level (kV)
Substation details Owned
By No. of units
Capacity of each unit
(MVA)
Total capacity (MVA)
47 Kudra 132/33 2 20 40
48 Khagaria 132/33 2 20 40
1 50 50
49 Kishanganj 132/33 1 50 50
1 20 20
50 Lakhisarai 132/33 3 20 60
51 Madhubani 132/33 2 20 40
52 Masaurhi 132/33 2 20 40
53 Mithapur 132/33 2 50 100
54 Mohania 132/33 1 50 50
1 20 20
55 Motihari 132/33 1 20 20
1 50 50
56 Masrakh 132/33 2 20 40
57 Muzaffarpur 132/33 3 50 150
58 Nalanda 132/33 2 20 40
59 Naugachhia 132/33 3 20 60
60 Nawada 132/33 1 20 20
3 50 150
61 Pandaul 132/33 2 20 40
1 50 50
62 Phulparas 132/33 2 20 40
63 Purnea 132/33 1 20 20
2 50 100
64 Rafiganj 132/33 1 50 50
1 20 20
65 Rajgir 132/33 2 20 40
66 Ramnagar 132/33 2 20 40
67 Raxaul 132/33 2 20 40
68 Remi nagar (Runni Saidpur)
132/33 2 20 40

Web based Protection Database and Desktop based Protection setting calculation tool – ERPC
50 PRDC Bangalore January 2017
SI.No Name of the SubStation
Voltage level (kV)
Substation details Owned
By No. of units
Capacity of each unit
(MVA)
Total capacity (MVA)
69 Sherghati 132/33 2 20 40
70 SKMCH 132/33 2 50 100
71 Sonebarsa 132/33 2 20 40
72 Sabour 132/33 3 50 150
73 Saharsa 132/33 1 20 20
74 Samastipur 132/33 2 20 40
75 Sasaram 132/33 2 50 100
76 Shekhpura 132/33 2 20 40
77 Sheetalpur 132/33 2 20 40
78 Sitamarhi 132/33 3 50 150
79 Siwan 132/33 1 20 20
2 50 100
80 Sonenagar
132/33 1 50 50
1 20 20
132/25 1 21.6 21.6
1 20 20
81 Sultanganj 132/33 2 20 40
2 50 100
82 Supaul 132/33 3 20 60
83 Tehta 132/33 2 20 40
84 Tekari 132/33 2 20 40
85 Udaikishanganj 132/33 2 20 40
86 Vaishali 132/33 2 20 40
87 Valmikinagar 132/33 1 10 10
88 Wazirganj 132/33 2 20 40
Jharkhand
765kV Level
1 Ranchi New 765/400 2 1500 3000 PGCIL
400kV Level
1 Jamshedpur 400/220 2 315 630 PGCIL

Web based Protection Database and Desktop based Protection setting calculation tool – ERPC
51 PRDC Bangalore January 2017
SI.No Name of the SubStation
Voltage level (kV)
Substation details Owned
By No. of units
Capacity of each unit
(MVA)
Total capacity (MVA)
2 Maithon 400/220 2 315 630
3 Ranchi 400/220 2 315 630
4 Chaibasa 400/220 2 315 630
5 Koderma (KTPS) 400/220 2 315 630
DVC 220/132 2 150 300
6 BTPS-A (Bokaro) 400/220/33 2 315 630
7 TISCO 400/220 2 315 630
220kV Level
1 Chandil 220/132 4 100 400
JUSNL
2 Chaibasa 220/132 2 150 300
132/33 2 50 100
3 Hatia New 220/132 3 150 450
4 Lalmatiya
220/132 1 100 100
132/33 1 20 20
2 50 100
5 PTPS 220/132 2 150 300
6 Ramachandrapur 220/132 3 150 450
7 TTPS 220/132 2 250 500
8 Dumka (New) 220/132 2 150 300
9 BTPS-B (Bokaro) 220/132 2 150 300
DVC
132/33 2 50 100
10 CTPS 220/132/11 3 150 450
132/33 2 80 160
11 Giridhi
220/132/33 2 150 300
220/33 2 80 160
132/33 3 80 240
12 Jamshedpur 220/132/33 2 150 300
132/33 3 50 150
13 Ramgarh 220/132 2 150 300
132/33 2 80 160

Web based Protection Database and Desktop based Protection setting calculation tool – ERPC
52 PRDC Bangalore January 2017
SI.No Name of the SubStation
Voltage level (kV)
Substation details Owned
By No. of units
Capacity of each unit
(MVA)
Total capacity (MVA)
1 50 50
14 Dhanbad 220/33 2 80 160
220/132
15 Kalyanswari
220/132/33 2 150 300
220/132/33 1 160 160
132/33 2 50 100
132kV Level
1 Maniqui 132/33 2 50 100
JUSNL
2 Adityapur 132/33 4 50 200
3 Chakradharpur 132/33 1 50 50
4 Dalbhumgarh 132/33 2 50 100
5 Chaibasa 132/33 1 25 25
6 Manoharpur 132/33 2 50 100
7 Deogarh 132/33 3 50 150
8 Dumka 132/33 2 50 100
9 Garhwa Road 132/33 1 50 50
1 20 20
10 Goielkara 132/33 1 20 20
11 Golmuri 132/33 2 50 100
12 Gumla 132/33 2 20 40
13 Hatia old 132/33 4 50 200
14 Tamar 132/33 2 50 100
15 Madhupur 132/33 2 50 100
16 Sikidri 132/33 2 20 40
17 Jadugoda 132/33 2 20 40
1 50 50
18 Jamtara 132/33 1 50 50
1 20 20
19 Japla 132/33 2 20 40
20 Kamdara 132/33 2 20 40

Web based Protection Database and Desktop based Protection setting calculation tool – ERPC
53 PRDC Bangalore January 2017
SI.No Name of the SubStation
Voltage level (kV)
Substation details Owned
By No. of units
Capacity of each unit
(MVA)
Total capacity (MVA)
1 20 20
21 Kanke 132/33 2 50 100
22 Kendposi 132/33 2 20 40
1 50 50
23 Latehar 132/33 2 50 100
24 Lohardaga 132/33 2 50 100
25 Namkum 132/33 4 50 200
26 Nowamundi 132/33 1 50 50
27 Pakur 132/33 2 50 100
28 Rajkharsawan 132/33 1 20 20
1 50 50
29 Sahebgunj 132/33 2 50 100
30 Daltonganj 132/33 2 50 100
31 Koderma 132/33
1 80 80
DVC
1 50 50
132/25 1 25 25
32 Nimiaghat 132/33 2 31.5 63
132/25 2 25 50
33 North Karnapura 132/33 2 50 100
34 Pradhankanta 132/33 No Load
35 Patherdhi
132/33 2 80 160
132/33 1 50 50
132/25 2 12.5 25
36 Patratu (DVC) 132/33 1 31.5 31.5
37 Putki 132/33 3 80 240
38 Barhi 132/33 1 50 50
132/33 1 31.5 31.5
39 Gola 132/33 1 31.5 31.5
132/33 1 20 20
40 Hazaribag Road 132/33 No load
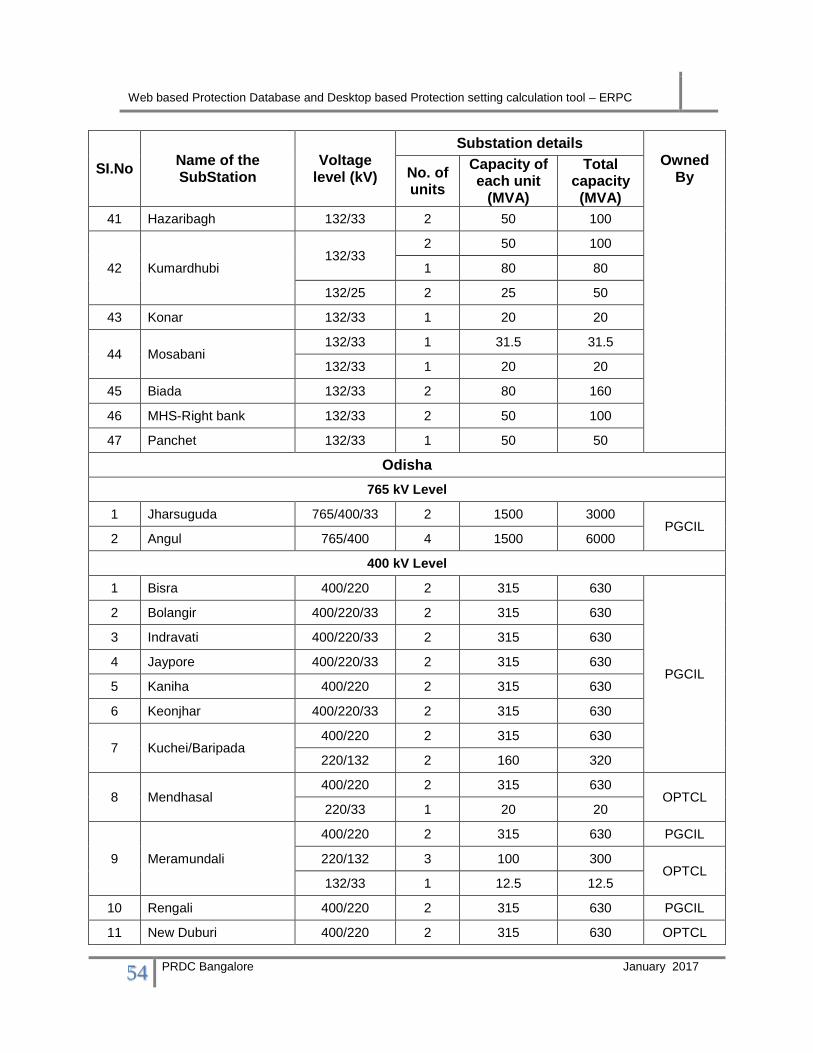
Web based Protection Database and Desktop based Protection setting calculation tool – ERPC
54 PRDC Bangalore January 2017
SI.No Name of the SubStation
Voltage level (kV)
Substation details Owned
By No. of units
Capacity of each unit
(MVA)
Total capacity (MVA)
41 Hazaribagh 132/33 2 50 100
42 Kumardhubi 132/33
2 50 100
1 80 80
132/25 2 25 50
43 Konar 132/33 1 20 20
44 Mosabani 132/33 1 31.5 31.5
132/33 1 20 20
45 Biada 132/33 2 80 160
46 MHS-Right bank 132/33 2 50 100
47 Panchet 132/33 1 50 50
Odisha
765 kV Level
1 Jharsuguda 765/400/33 2 1500 3000 PGCIL
2 Angul 765/400 4 1500 6000
400 kV Level
1 Bisra 400/220 2 315 630
PGCIL
2 Bolangir 400/220/33 2 315 630
3 Indravati 400/220/33 2 315 630
4 Jaypore 400/220/33 2 315 630
5 Kaniha 400/220 2 315 630
6 Keonjhar 400/220/33 2 315 630
7 Kuchei/Baripada 400/220 2 315 630
220/132 2 160 320
8 Mendhasal 400/220 2 315 630
OPTCL 220/33 1 20 20
9 Meramundali
400/220 2 315 630 PGCIL
220/132 3 100 300 OPTCL
132/33 1 12.5 12.5
10 Rengali 400/220 2 315 630 PGCIL
11 New Duburi 400/220 2 315 630 OPTCL

Web based Protection Database and Desktop based Protection setting calculation tool – ERPC
55 PRDC Bangalore January 2017
SI.No Name of the SubStation
Voltage level (kV)
Substation details Owned
By No. of units
Capacity of each unit
(MVA)
Total capacity (MVA)
12 Sterlite 400/220 2 315 630 SEL
13 Pandiabil 400/220 2 500 1000 PGCIL
220 kV Level
1 Atri 220/132 2 160 320
OPTCL
2 Balasore
220/132 2 160 320
132/33 2 63 126
132/33 1 40 40
3 Bhadrak
220/132 3 100 300
132/33 2 63 126
132/33 1 40 40
4 Bidanasi
220/132 1 160 160
220/132 2 100 200
132/33 2 63 126
132/33 1 40 40
5 Bolangir new 220/132 2 160 320
132/33 1 12.5 12.5
6 Budhipadar
220/132 2 160 320
132/33 1 20 20
132/33 1 12.5 12.5
7 Chandaka
220/132 2 100 200
220/132 2 160 320
132/33 2 63 126
132/33 1 40 40
8 Duburi
220/132 3 100 300
220/33 2 40 80
132/33 1 5 5
9 Jayanagar
220/132 2 160 320
132/33 2 20 40
132/33 1 12.5 12.5
10 Joda 220/132 3 100 300
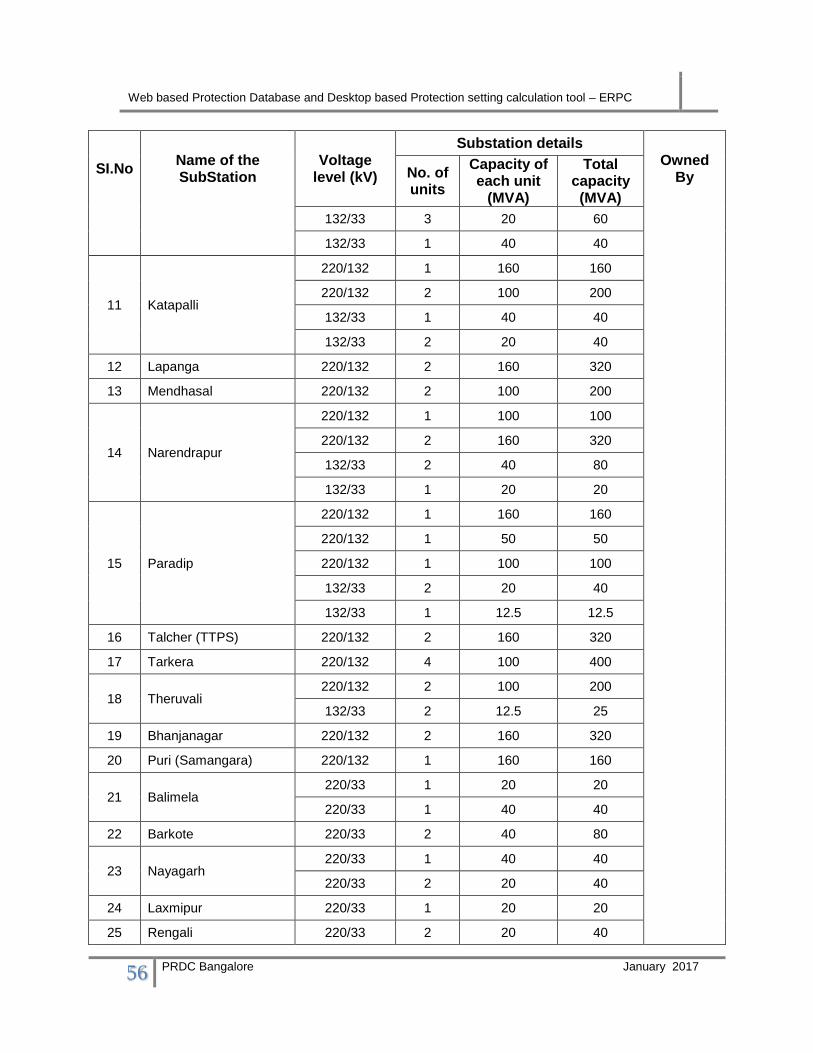
Web based Protection Database and Desktop based Protection setting calculation tool – ERPC
56 PRDC Bangalore January 2017
SI.No Name of the SubStation
Voltage level (kV)
Substation details Owned
By No. of units
Capacity of each unit
(MVA)
Total capacity (MVA)
132/33 3 20 60
132/33 1 40 40
11 Katapalli
220/132 1 160 160
220/132 2 100 200
132/33 1 40 40
132/33 2 20 40
12 Lapanga 220/132 2 160 320
13 Mendhasal 220/132 2 100 200
14 Narendrapur
220/132 1 100 100
220/132 2 160 320
132/33 2 40 80
132/33 1 20 20
15 Paradip
220/132 1 160 160
220/132 1 50 50
220/132 1 100 100
132/33 2 20 40
132/33 1 12.5 12.5
16 Talcher (TTPS) 220/132 2 160 320
17 Tarkera 220/132 4 100 400
18 Theruvali 220/132 2 100 200
132/33 2 12.5 25
19 Bhanjanagar 220/132 2 160 320
20 Puri (Samangara) 220/132 1 160 160
21 Balimela 220/33 1 20 20
220/33 1 40 40
22 Barkote 220/33 2 40 80
23 Nayagarh 220/33 1 40 40
220/33 2 20 40
24 Laxmipur 220/33 1 20 20
25 Rengali 220/33 2 20 40
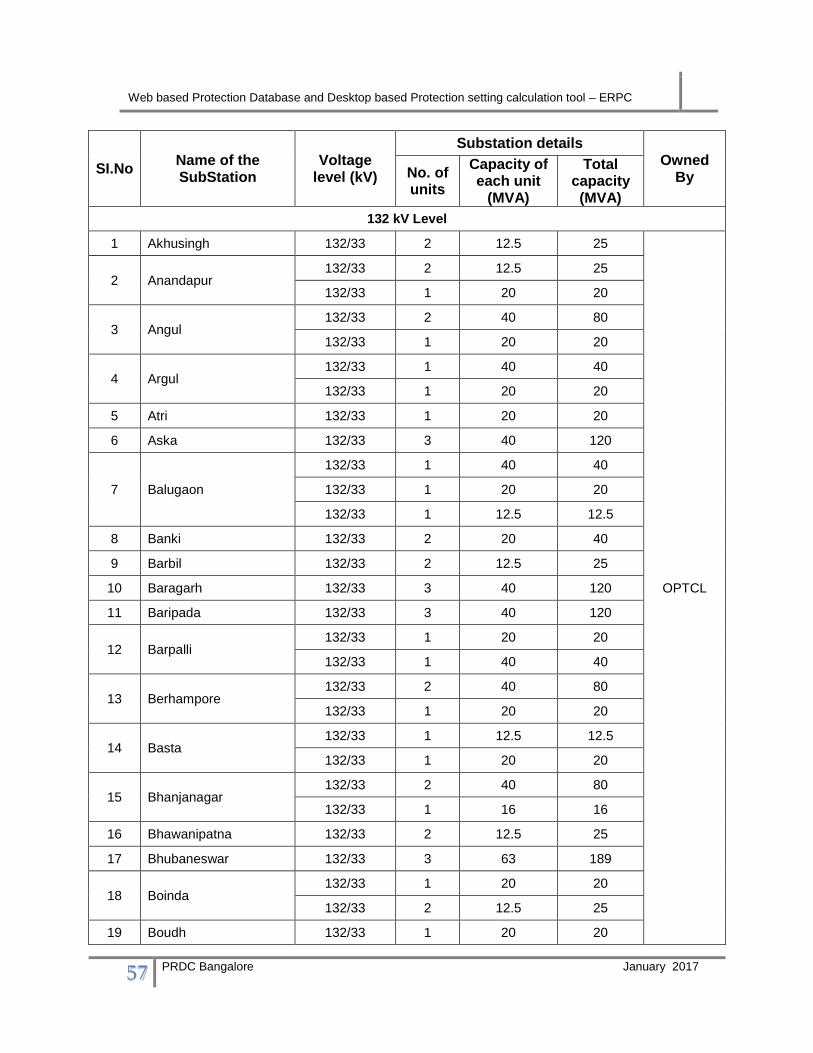
Web based Protection Database and Desktop based Protection setting calculation tool – ERPC
57 PRDC Bangalore January 2017
SI.No Name of the SubStation
Voltage level (kV)
Substation details Owned
By No. of units
Capacity of each unit
(MVA)
Total capacity (MVA)
132 kV Level
1 Akhusingh 132/33 2 12.5 25
OPTCL
2 Anandapur 132/33 2 12.5 25
132/33 1 20 20
3 Angul 132/33 2 40 80
132/33 1 20 20
4 Argul 132/33 1 40 40
132/33 1 20 20
5 Atri 132/33 1 20 20
6 Aska 132/33 3 40 120
7 Balugaon
132/33 1 40 40
132/33 1 20 20
132/33 1 12.5 12.5
8 Banki 132/33 2 20 40
9 Barbil 132/33 2 12.5 25
10 Baragarh 132/33 3 40 120
11 Baripada 132/33 3 40 120
12 Barpalli 132/33 1 20 20
132/33 1 40 40
13 Berhampore 132/33 2 40 80
132/33 1 20 20
14 Basta 132/33 1 12.5 12.5
132/33 1 20 20
15 Bhanjanagar 132/33 2 40 80
132/33 1 16 16
16 Bhawanipatna 132/33 2 12.5 25
17 Bhubaneswar 132/33 3 63 189
18 Boinda 132/33 1 20 20
132/33 2 12.5 25
19 Boudh 132/33 1 20 20

Web based Protection Database and Desktop based Protection setting calculation tool – ERPC
58 PRDC Bangalore January 2017
SI.No Name of the SubStation
Voltage level (kV)
Substation details Owned
By No. of units
Capacity of each unit
(MVA)
Total capacity (MVA)
20 Bolangir 132/33 2 40 80
132/33 1 12.5 12.5
21 Brajrajnagar 132/33 1 40 40
132/33 3 20 60
22 Chainpal 132/33 2 40 80
132/33 1 20 20
23 Chandikhole 132/33 3 20 60
24 Chhandpur 132/33 2 12.5 25
25 Chhatrapur 132/33 3 20 60
26 Chhend 132/33 3 40 120
27 Choudwar 132/33 1 20 20
132/33 2 40 80
28 Cuttack 132/33 3 40 120
29 Dabugaon 132/33 2 12.5 25
30 Dhenkanal 132/33 3 40 120
31 Digapahandi 132/33 2 20 40
132/33 1 12.5 12.5
32 Ganjam 132/33 2 12.5 25
33 Jagatsinghpur 132/33 2 20 40
132/33 1 40 40
34 Jajpur road 132/33 2 40 80
132/33 1 20 20
35 Jajpur town 132/33 2 40 80
132/33 1 20 20
36 Jaleswar 132/33 2 31.5 63
132/33 1 12.5 12.5
37 Jharsuguda 132/33 1 40 40
38 Junagarh 132/33 3 20 60
39 Kalarangi 132/33 2 12.5 25
132/33 1 20 20
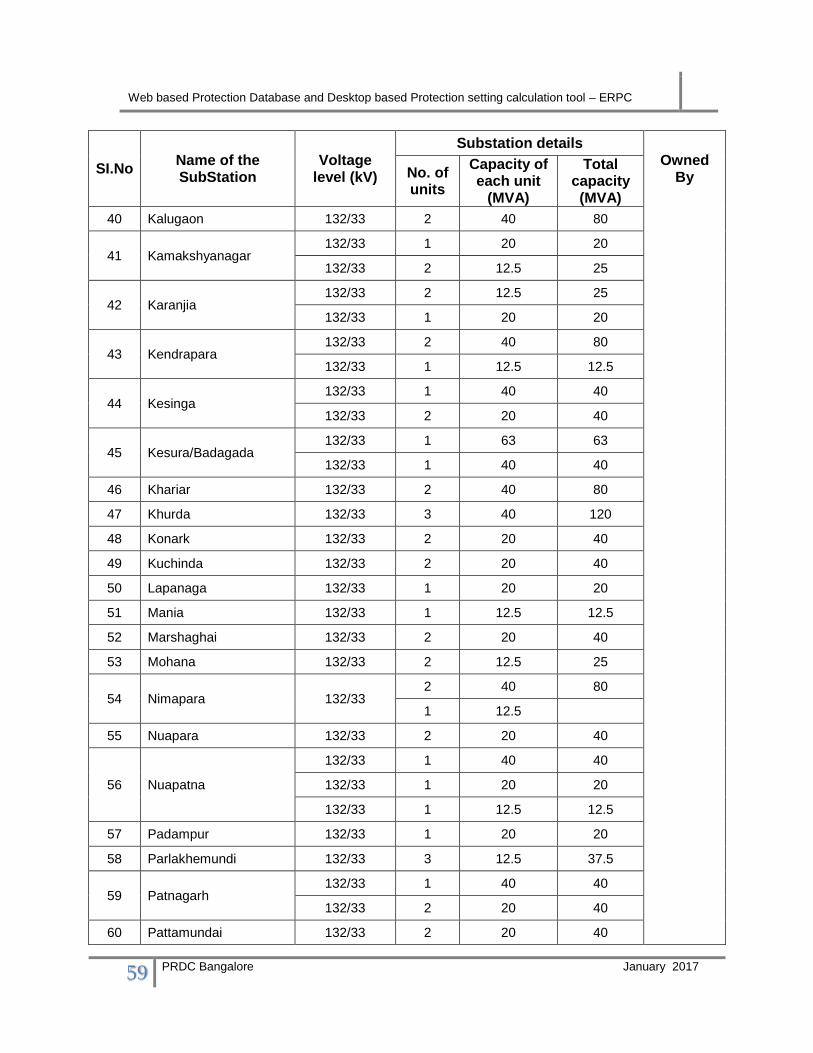
Web based Protection Database and Desktop based Protection setting calculation tool – ERPC
59 PRDC Bangalore January 2017
SI.No Name of the SubStation
Voltage level (kV)
Substation details Owned
By No. of units
Capacity of each unit
(MVA)
Total capacity (MVA)
40 Kalugaon 132/33 2 40 80
41 Kamakshyanagar 132/33 1 20 20
132/33 2 12.5 25
42 Karanjia 132/33 2 12.5 25
132/33 1 20 20
43 Kendrapara 132/33 2 40 80
132/33 1 12.5 12.5
44 Kesinga 132/33 1 40 40
132/33 2 20 40
45 Kesura/Badagada 132/33 1 63 63
132/33 1 40 40
46 Khariar 132/33 2 40 80
47 Khurda 132/33 3 40 120
48 Konark 132/33 2 20 40
49 Kuchinda 132/33 2 20 40
50 Lapanaga 132/33 1 20 20
51 Mania 132/33 1 12.5 12.5
52 Marshaghai 132/33 2 20 40
53 Mohana 132/33 2 12.5 25
54 Nimapara 132/33 2 40 80
1 12.5
55 Nuapara 132/33 2 20 40
56 Nuapatna
132/33 1 40 40
132/33 1 20 20
132/33 1 12.5 12.5
57 Padampur 132/33 1 20 20
58 Parlakhemundi 132/33 3 12.5 37.5
59 Patnagarh 132/33 1 40 40
132/33 2 20 40
60 Pattamundai 132/33 2 20 40

Web based Protection Database and Desktop based Protection setting calculation tool – ERPC
60 PRDC Bangalore January 2017
SI.No Name of the SubStation
Voltage level (kV)
Substation details Owned
By No. of units
Capacity of each unit
(MVA)
Total capacity (MVA)
132/33 1 12.5 12.5
61 Phulbani 132/33 2 12.5 25
132/33 1 40 40
62 Phulnakhara 132/33 2 20 40
63 Polasapanga 132/33 1 40 40
132/33 2 20 40
64 Puri 132/33 3 40 120
65 Purusottampur 132/33 2 12.5 25
66 Rairakhole 132/33 2 12.5 25
67 Rairangpur 132/33 2 20 40
132/33 1 12.5 12.5
68 Rajgangpur 132/33 3 40 120
69 Ranasinghpur 132/33 2 63 126
132/33 1 40 40
70 Rayagada 132/33 2 12.5 25
71 Rourkela 132/33 4 35 140
72 Saintala 132/33 1 10 10
132/33 1 12.5 12.5
73 Salipur 132/33 2 20 40
132/33 1 12.5 12.5
74 Sambalpur 132/33 2 31.5 63
132/33 1 40 40
75 Shamuka 132/33 2 31.5 63
76 Somnathpur 132/33 1 12.5 12.5
77 Sonepur 132/33
3 20 60
132/33 0
78 Soro 132/33 1 40 40
132/33 2 20 40
79 Sunabeda 132/33 3 12.5 37.5
80 Sundargarh 132/33 1 40 40
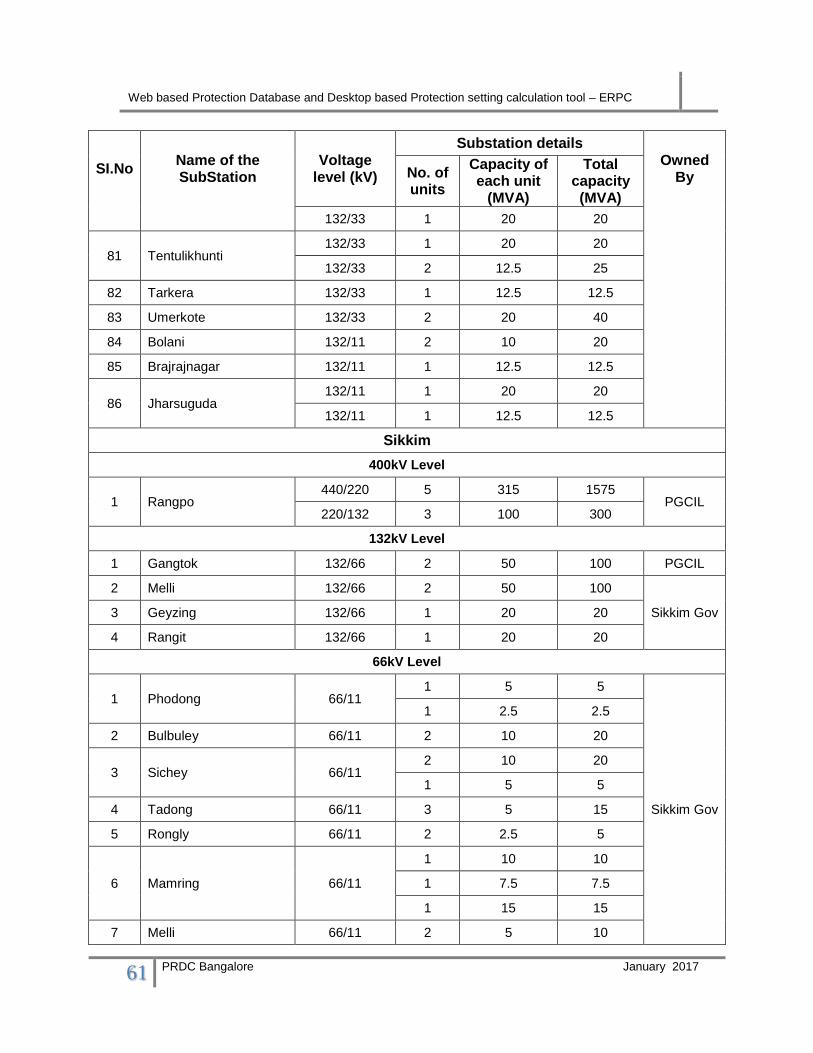
Web based Protection Database and Desktop based Protection setting calculation tool – ERPC
61 PRDC Bangalore January 2017
SI.No Name of the SubStation
Voltage level (kV)
Substation details Owned
By No. of units
Capacity of each unit
(MVA)
Total capacity (MVA)
132/33 1 20 20
81 Tentulikhunti 132/33 1 20 20
132/33 2 12.5 25
82 Tarkera 132/33 1 12.5 12.5
83 Umerkote 132/33 2 20 40
84 Bolani 132/11 2 10 20
85 Brajrajnagar 132/11 1 12.5 12.5
86 Jharsuguda 132/11 1 20 20
132/11 1 12.5 12.5
Sikkim
400kV Level
1 Rangpo 440/220 5 315 1575
PGCIL 220/132 3 100 300
132kV Level
1 Gangtok 132/66 2 50 100 PGCIL
2 Melli 132/66 2 50 100
Sikkim Gov 3 Geyzing 132/66 1 20 20
4 Rangit 132/66 1 20 20
66kV Level
1 Phodong 66/11 1 5 5
Sikkim Gov
1 2.5 2.5
2 Bulbuley 66/11 2 10 20
3 Sichey 66/11 2 10 20
1 5 5
4 Tadong 66/11 3 5 15
5 Rongly 66/11 2 2.5 5
6 Mamring 66/11
1 10 10
1 7.5 7.5
1 15 15
7 Melli 66/11 2 5 10

Web based Protection Database and Desktop based Protection setting calculation tool – ERPC
62 PRDC Bangalore January 2017
SI.No Name of the SubStation
Voltage level (kV)
Substation details Owned
By No. of units
Capacity of each unit
(MVA)
Total capacity (MVA)
8 Namchi 66/11 2 2.5 5
9 Rabangla 66/11 1 5 5
10 Rothak 66/11 2 2.5 5
11 Soreng 66/11 2 2.5 5
12 Geyzing 66/11 2 2.5 5
13 Purano Namchi 66/11 2 7.5 15
14 Pakyong 66/11 1 10 10
15 Pelling 66/11 1 5 5
16 Rhenock 66/11 1 5 5
17 Mangan 66/11 2 5 10
18 Ranipool 66/11 2 7.5 15
19 Topakhani 66/11 1 7.5 7.5
66/11 1 5 5
West Bengal
400 kV Level
1 Arambagh
400/220 4 315 1260
WBSETCL
220/132 3 160 480
132/33 3 50 150
2 Jeerat 400/220 4 315 1260
220/132/33 3 160 480
3 Bidhannagar (Durgapur WBSETCL)
400/220 2 315 630
4 Kharagpur 400/220 2 315 630
220/132 2 160 320
5 Bakreswar 400/220 2 315 630 WBPDCL
220/33 1 50 50 WBSETCL
6 Kolaghat TPS 400/220 2 315 630 WBPDCL
7 Sagardighi 400/220 2 315 630
8 Binaguri 400/220 2 315 630
PGCIL 9 Malda 400/220 2 315 630
10 Parulia (Durgapur PG) 400/220 2 315 630
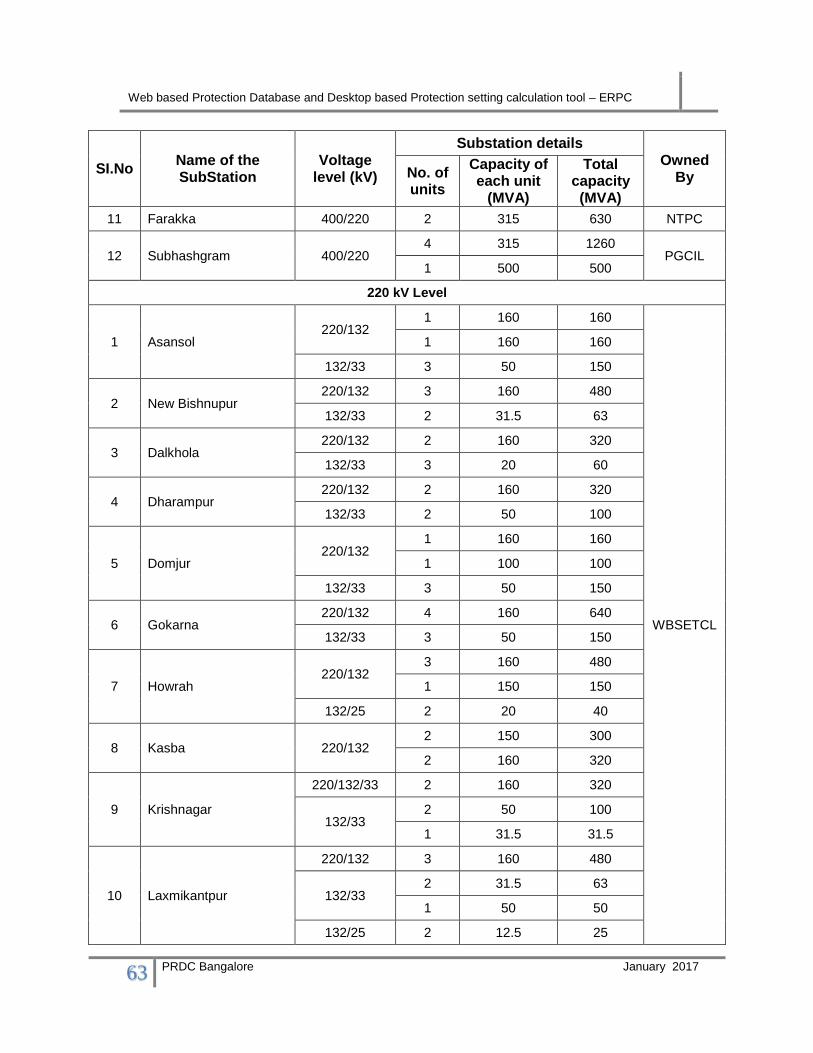
Web based Protection Database and Desktop based Protection setting calculation tool – ERPC
63 PRDC Bangalore January 2017
SI.No Name of the SubStation
Voltage level (kV)
Substation details Owned
By No. of units
Capacity of each unit
(MVA)
Total capacity (MVA)
11 Farakka 400/220 2 315 630 NTPC
12 Subhashgram 400/220 4 315 1260
PGCIL 1 500 500
220 kV Level
1 Asansol 220/132
1 160 160
WBSETCL
1 160 160
132/33 3 50 150
2 New Bishnupur 220/132 3 160 480
132/33 2 31.5 63
3 Dalkhola 220/132 2 160 320
132/33 3 20 60
4 Dharampur 220/132 2 160 320
132/33 2 50 100
5 Domjur 220/132
1 160 160
1 100 100
132/33 3 50 150
6 Gokarna 220/132 4 160 640
132/33 3 50 150
7 Howrah 220/132
3 160 480
1 150 150
132/25 2 20 40
8 Kasba 220/132 2 150 300
2 160 320
9 Krishnagar
220/132/33 2 160 320
132/33 2 50 100
1 31.5 31.5
10 Laxmikantpur
220/132 3 160 480
132/33 2 31.5 63
1 50 50
132/25 2 12.5 25

Web based Protection Database and Desktop based Protection setting calculation tool – ERPC
64 PRDC Bangalore January 2017
SI.No Name of the SubStation
Voltage level (kV)
Substation details Owned
By No. of units
Capacity of each unit
(MVA)
Total capacity (MVA)
11 New Haldia
220/132 2 160 320
132/33 1 31.5 31.5
132/33 1 50 50
12 New Jalpaiguri 220/132 2 160 320
132/33 2 50 100
13 New town action area-III
220/132 2 160 320
220/33 2 50 100
14 Rishra 220/132 3 160 480
132/33 3 50 150
15 Satgachia
220/132 2 160 320
132/33 2 50 100
1 31.5 31.5
16 Subhashgram 220/132 2 160 320
132/33 2 31.5 63
17 KTPS 400 kV 220/132 1 160 160
WBPDCL 2 150 300
18 STPS (Santhaldih) 220/132 1 130 130
WBPDCL 1 100 100
19 Birpara 220/132 2 160 320
PGCIL 20 Malda 220/132 1 50 370
2 160 640
21 Siliguri 220/132 2 160 320
22 DPL 220/132 2 160 320
DPL 1 100 100
23 Bidhannagar(Durgapur) 220/132 2 160 320
WBSETCL
220/132 1 200 200
24 Hura 220/132 2 160 320
132/33 2 50 100
25 Foundry park 220/132/33 2 160 320
132/33 2 50 100

Web based Protection Database and Desktop based Protection setting calculation tool – ERPC
65 PRDC Bangalore January 2017
SI.No Name of the SubStation
Voltage level (kV)
Substation details Owned
By No. of units
Capacity of each unit
(MVA)
Total capacity (MVA)
26 Midnapur 220/132 3 160 480
132/33 2 50 100
27 Kolkata leather complex
220/132 2 160 320
132/33 3 50 150
28 Vidyasagar Park 220/132 2 160 320
29 Egra 200/132 2 160 320
30 EMSS 220/132 /33 5 160 800
CESC 31 BBGS 220/132 /33 2 160 320
32 NCGS 220/132 /33 2 160 320
33 Waria (DTPS)
220/132/33 3 150 450
DVC
132/33 3 50 150
132/25 2 25 50
34 Durgapur/Muchipara 220/33 2 80 160
1 50 50
35 Parulia 220/33 2 80 160
132/33 1 50 50
36 Barjora
220/132 2 150 300
220/33
1 100 100
1 80 80
1 50 50
37 Mejia 220/33 2 35 70
38 Burnpur 220/33 2 50 100
132 kV Level
1 Adisapthagram 132/33
2 50 100
WBSETCL
1 31.5 31.5
132/25 2 20 40
2 Alipurduar 132/66
2 16 32
1 20 20
132/33 1 31.5 31.5
3 Amtala 132/33 1 31.5 31.5

Web based Protection Database and Desktop based Protection setting calculation tool – ERPC
66 PRDC Bangalore January 2017
SI.No Name of the SubStation
Voltage level (kV)
Substation details Owned
By No. of units
Capacity of each unit
(MVA)
Total capacity (MVA)
1 50 50
4 Asoknagar 132/33 2 50 100
132/25 2 7.5 15
5 Bagnan GIS 132/33 2 50 100
6 Bagmundi 132/33 1 20 20
7 Balurghat 132/33 4 12.5 50
8 Bankura 132/33 2 50 100
9 Barasat 132/33 3 50 150
10 Behala/Joka 132/33 3 50 150
11 Basirhat 132/33 2 50 100
12 Belmuri 132/33 2 31.5 63
13 Berhampore 132/33 3 50 150
14 Bighati 132/33 2 50 100
15 Birsingha 132/33 2 50 100
16 Bishnupur (Old) 132/33 1 50 50
132/33 1 31.5 31.5
17 Bolpur 132/33 3 50 150
18 Bongaon 132/33 3 31.5 94.5
19 Barjora 132/33 2 31.5 63
20 Chanditala 132/33 2 50 100
21 Chandrakora road 132/33 1 50 50
1 31.5 31.5
22 Contai 132/33 2 50 100
23 Coochbehar 132/33 3 50 150
24 Darjeeling 132/33 3 10 30
25 Debogram 132/33
1 20 20
1 31.5 31.5
1 50 50
26 Dhulian 132/33 2 31.5 63
27 Egra 132/33 3 50 150
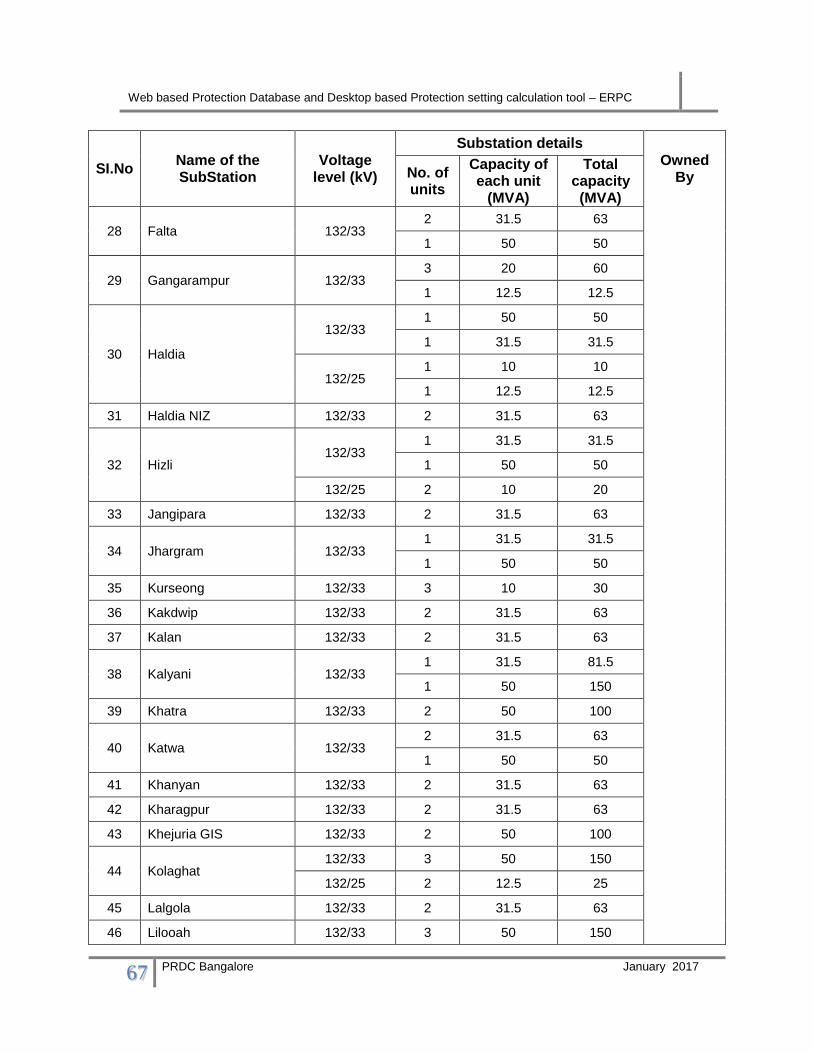
Web based Protection Database and Desktop based Protection setting calculation tool – ERPC
67 PRDC Bangalore January 2017
SI.No Name of the SubStation
Voltage level (kV)
Substation details Owned
By No. of units
Capacity of each unit
(MVA)
Total capacity (MVA)
28 Falta 132/33 2 31.5 63
1 50 50
29 Gangarampur 132/33 3 20 60
1 12.5 12.5
30 Haldia
132/33 1 50 50
1 31.5 31.5
132/25 1 10 10
1 12.5 12.5
31 Haldia NIZ 132/33 2 31.5 63
32 Hizli 132/33
1 31.5 31.5
1 50 50
132/25 2 10 20
33 Jangipara 132/33 2 31.5 63
34 Jhargram 132/33 1 31.5 31.5
1 50 50
35 Kurseong 132/33 3 10 30
36 Kakdwip 132/33 2 31.5 63
37 Kalan 132/33 2 31.5 63
38 Kalyani 132/33 1 31.5 81.5
1 50 150
39 Khatra 132/33 2 50 100
40 Katwa 132/33 2 31.5 63
1 50 50
41 Khanyan 132/33 2 31.5 63
42 Kharagpur 132/33 2 31.5 63
43 Khejuria GIS 132/33 2 50 100
44 Kolaghat 132/33 3 50 150
132/25 2 12.5 25
45 Lalgola 132/33 2 31.5 63
46 Lilooah 132/33 3 50 150

Web based Protection Database and Desktop based Protection setting calculation tool – ERPC
68 PRDC Bangalore January 2017
SI.No Name of the SubStation
Voltage level (kV)
Substation details Owned
By No. of units
Capacity of each unit
(MVA)
Total capacity (MVA)
132/25 2 20 40
47 Mahachanda 132/33 2 31.5 63
1 50 50
48 Mathabhanga 132/33 1 50 50
1 31.5 31.5
49 Malda 132/33 3 50 150
50 Mankar 132/33 3 31.5 94.5
51 Maynaguri 132/33
1 31.5 31.5
1 50 50
2 30 60
52 North Bengal university (NBU)
132/33 2 31.5 63
1 50 50
53 New town AA 1 132/33 2 50 100
54 Pingla 132/33 3 50 150
55 Purulia (WB) 132/33
2 31.5 63
1 20 20
132/25 2 12.5 25
56 Raghunathganj 132/33
1 31.5 31.5
1 20 20
1 50 50
57 Raghunathpur 132/33 2 31.5 63
58 Raigunj 132/33
1 31.5 31.5
2 20 40
2 12.5 25
59 Raina 132/33 1 50 50
60 Rampurhat 132/33 2 50 100
61 Ranaghat
132/33 2 50 100
132/66 2 31.5 63
132/25 1 12.5 12.5
1 10 10

Web based Protection Database and Desktop based Protection setting calculation tool – ERPC
69 PRDC Bangalore January 2017
SI.No Name of the SubStation
Voltage level (kV)
Substation details Owned
By No. of units
Capacity of each unit
(MVA)
Total capacity (MVA)
62 Sainthia 132/33 2 50 100
63 Salt lake 132/33 3 50 150
64 Salt lake GIS 132/33 2 50 100
65 Samsi 132/33 3 31.5 94.5
66 Siliguri 132/33 2 50 100
67 Sonarpur 132/33 3 31.5 94.5
132/25 2 20 40
68 Tamluk 132/33 2 50 100
69 Tarakeswar 132/33 1 31.5 31.5
1 50 50
70 Titagarh 132/33 3 50 150
132/25 2 20 40
71 Ukhra 132/33 2 50 100
72 Uluberia 132/33 3 50 150
73 Kuli 132/33 2 50 100
74 Birpara 132/66 3 20 60
75 Chalsa 132/66
1 20 20
1 10 10
132/33 2 20 40
76 Serakol 132/33 2 50 100
77 Belur 132/33 3 50 150
CESC
78 BT Road 132/33 2 75 150
79 B.Garden 132/33 2 50 150
80 Titagarh (TRS) 132/33 5 50 250
81 Dum Dum 132/33 2 75 150
82 Park lane 132/33 2 75 150
83 Jadavpore 132/33 2 50 100
84 Chakmir 132/33 2 55 110
85 Majerhat 132/33 2 75 150
86 BBD Bag 132/33 1 68 136

Web based Protection Database and Desktop based Protection setting calculation tool – ERPC
70 PRDC Bangalore January 2017
SI.No Name of the SubStation
Voltage level (kV)
Substation details Owned
By No. of units
Capacity of each unit
(MVA)
Total capacity (MVA)
87 PRS 132/33 3 50 150
88 East Calcutta 132/33 2 50 100
89 NCGS 132/33 2 50 100
1 75 75
90 SRS 132/33 2 55 110
1 75 75
91 Patuli 132/33 2 75 150
92 A Zone
132/11 1 20 20
DPL
132/11 2 31.5 63
132/33 1 50 50
93 B Zone 132/11 6 31.5 189
132/33 1 50 50
94 AB Zone 132/33 1 50 50
95 C Zone 132/11 3 31.5 94.5
132/33 1 50 50
96 C1 Zone 132/11 2 31.5 63
132/33 2 50 100
97 Bamunara SS 132/34 2 50 100
98 Kalipahari 132/33 1 50 50
DVC
132/33 2 80 160
99 Kharagpur 132/11 1 7.5 7.5
100 Burdwan 132/33 2 50 100
1 80 80
101 Belmuri 132/33
1 50 50
1 31.5 31.5
132/25 2 25 50
102 Purulia 132/33/11 1 50 50
103 ASP 132/33/11 2 50 100
132/33 2 50 100
104 Jamuria 132/33 2 50 100
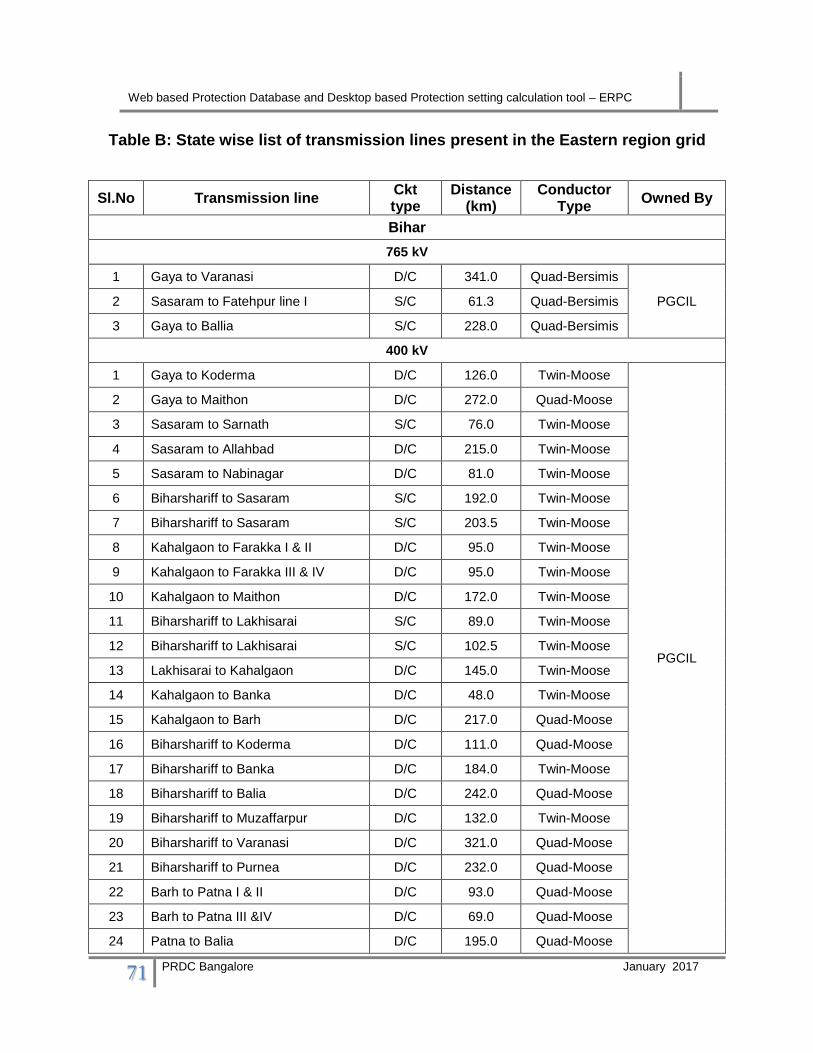
Web based Protection Database and Desktop based Protection setting calculation tool – ERPC
71 PRDC Bangalore January 2017
Table B: State wise list of transmission lines present in the Eastern region grid
Sl.No Transmission line Ckt type
Distance (km)
Conductor Type
Owned By
Bihar
765 kV
1 Gaya to Varanasi D/C 341.0 Quad-Bersimis
PGCIL 2 Sasaram to Fatehpur line I S/C 61.3 Quad-Bersimis
3 Gaya to Ballia S/C 228.0 Quad-Bersimis
400 kV
1 Gaya to Koderma D/C 126.0 Twin-Moose
PGCIL
2 Gaya to Maithon D/C 272.0 Quad-Moose
3 Sasaram to Sarnath S/C 76.0 Twin-Moose
4 Sasaram to Allahbad D/C 215.0 Twin-Moose
5 Sasaram to Nabinagar D/C 81.0 Twin-Moose
6 Biharshariff to Sasaram S/C 192.0 Twin-Moose
7 Biharshariff to Sasaram S/C 203.5 Twin-Moose
8 Kahalgaon to Farakka I & II D/C 95.0 Twin-Moose
9 Kahalgaon to Farakka III & IV D/C 95.0 Twin-Moose
10 Kahalgaon to Maithon D/C 172.0 Twin-Moose
11 Biharshariff to Lakhisarai S/C 89.0 Twin-Moose
12 Biharshariff to Lakhisarai S/C 102.5 Twin-Moose
13 Lakhisarai to Kahalgaon D/C 145.0 Twin-Moose
14 Kahalgaon to Banka D/C 48.0 Twin-Moose
15 Kahalgaon to Barh D/C 217.0 Quad-Moose
16 Biharshariff to Koderma D/C 111.0 Quad-Moose
17 Biharshariff to Banka D/C 184.0 Twin-Moose
18 Biharshariff to Balia D/C 242.0 Quad-Moose
19 Biharshariff to Muzaffarpur D/C 132.0 Twin-Moose
20 Biharshariff to Varanasi D/C 321.0 Quad-Moose
21 Biharshariff to Purnea D/C 232.0 Quad-Moose
22 Barh to Patna I & II D/C 93.0 Quad-Moose
23 Barh to Patna III &IV D/C 69.0 Quad-Moose
24 Patna to Balia D/C 195.0 Quad-Moose

Web based Protection Database and Desktop based Protection setting calculation tool – ERPC
72 PRDC Bangalore January 2017
Sl.No Transmission line Ckt type
Distance (km)
Conductor Type
Owned By
25 Patna to Balia D/C 180.0 Quad-Moose
26 Patna to Kishanganj D/C 347.0 Quad-Moose
27 Muzaffarpur to Gorakhpur D/C 261.0 Quad-Moose Power Links
28 Purnea to Muzaffarpur D/C 240.0 Quad-Moose
29 Malda to Purnea D/C 167.0 Twin-Moose
PGCIL
30 Purnea to Binaguri I & II D/C 168.0 Twin-Moose
31 Purnea to Kishanganj D/C 72.0 Quad-Moose
32 Kishanganj to Binaguri D/C 98.0 Quad-Moose
33 Barh II to Gorakhpur D/C 349.0 Quad-Moose
220 kV
1 Patna PG to Sipara D/C 0.5 Zebra BSPHCL
2 Dehri to Pusauli S/C 65.0 Zebra BSPHCL &
PG
3 Pusauli to Sahupuri (UP) S/C 71.0 Zebra PGCIL
4 Arrah to Khagaul D/C 50.0 Zebra
5 Patratu to Bodhgaya T/C 136.0 Zebra BSPHCL &
JSEB
6 Patna PG to Khagaul S/C 30.5 Zebra BSPHCL
7 Tenughat to Biharshariff S/C 182.0 Twin-Moose BSPHCL &
JSEB
8 Biharshariff (PG) to Biharhariff (BSPHCL)
T/C 1.7 Zebra BSPTCL
9 Muzaffarpur to MTPS (Kanti) D/C 24.0 Zebra POWER LINKS
10 Dehri to Gaya (PG) D/C 95.0 Zebra BSPHCL & PG 11 Bodhgaya to Gaya (PG) D/C 17.0 Zebra
12 Muzaffarpur to Hazipur - I & II D/C 53.0 Zebra
BSPTCL 13 Biharshariff to Fatua D/C 40.0 Zebra
14 Biharshariff to Bodhgaya D/C 80.0 Zebra
15 Purnea to Dalkhola (WB) D/C 41.0 Zebra PGCIL
16 Sipara to Khagaul S/C 39.0 Zebra
BSPTCL
17 MTPS (Kanti) to Gopalganj S/C 101.4 Zebra
18 MTPS (kanti) to Darbhanga S/C 68.5 Zebra
19 Purnea (PG) to Madhepura D/C 100.1 Zebra
20 Biharsariff to Begusarai D/C 75.0 Zebra

Web based Protection Database and Desktop based Protection setting calculation tool – ERPC
73 PRDC Bangalore January 2017
Sl.No Transmission line Ckt type
Distance (km)
Conductor Type
Owned By
21 MTPS to Begusarai D/C 152.0 Zebra
22 Patna (PG) to Fatuha S/C 27.6 Zebra
23 Sipara to Fatuha S/C 26.0 Zebra
24 Pusauli (PG) to Pusauli new S/C 1.7 Zebra
PGCIL
25 Pusauli new to Ara (PG) S/C 116.0 Zebra
26 Pusauli (PG) to Ara (PG) S/C 112.0 Zebra
27 Purnea (PG) to Purnea old D/C 2.0 Zebra
28 Kishanganj to Siliguri D/C 108.0 Zebra
29 Kishanganj to Dalkhola PG D/C 31.0 Zebra
132 kV
1 Kahalgao to KhSTPP S/C 6.0 Panther PGCIL
2 KhSTPP to lalmatya S/C 47.0 Panther
BSPTCL
3 Arrah (PG) to Arrah BS S/C 2.1 Panther
4 Arrah (PG) to Dumraon S/C 61.5 Panther
5 Purnea (PG) to Purnea (BS) T/C 1.3 Panther
6 Purnea (OLD) to Kishanganj S/C 70.0 Panther
7 Karmansa to Sahupuri S/C 131.0 Panther
BSPHCL & UPPCL
8 Karmansa to Chandauli S/C 25.0 Panther
9 Sonenagar to Rihand S/C 188.0 Panther
10 Japla to Sonenagar S/C 56.0 Panther BSPTCL
11 Kahalgao to Sabour S/C 19.0 Panther PGCIL
12 Kahalgao to Lalmatia S/C 60.0 Panther NTPC
13 Banka to Sabour S/C 40.7 Panther
BSPTCL
14 Banka (PG) to Banka (New) S/C 12.5 Panther
15 Chandauti to Sipara S/C 90.0 Panther
16 Chandauti to Belaganj S/C 20.0 Panther
17 Belaganj to Jehanabad S/C 30.0 Panther
18 Jehanabad to Masaudhi S/C 30.0 Panther
19 Masaudhi to Sipara S/C 24.0 Panther
20 Jehanabad to Ataula S/C 28.0 Panther
22 Chandauti to Sonenagar (L - 30) S/C 76.0 Panther
23 Chandauti to Rafiganj (L - 31) S/C 41.0 Panther
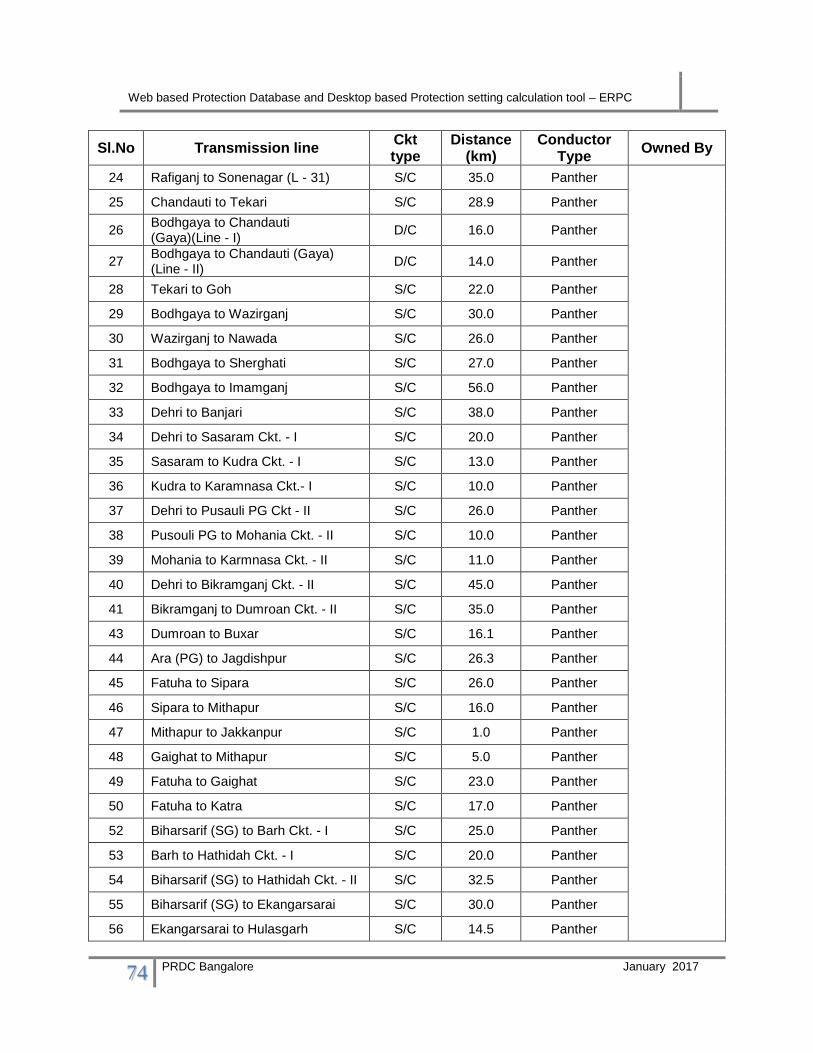
Web based Protection Database and Desktop based Protection setting calculation tool – ERPC
74 PRDC Bangalore January 2017
Sl.No Transmission line Ckt type
Distance (km)
Conductor Type
Owned By
24 Rafiganj to Sonenagar (L - 31) S/C 35.0 Panther
25 Chandauti to Tekari S/C 28.9 Panther
26 Bodhgaya to Chandauti (Gaya)(Line - I)
D/C 16.0 Panther
27 Bodhgaya to Chandauti (Gaya) (Line - II)
D/C 14.0 Panther
28 Tekari to Goh S/C 22.0 Panther
29 Bodhgaya to Wazirganj S/C 30.0 Panther
30 Wazirganj to Nawada S/C 26.0 Panther
31 Bodhgaya to Sherghati S/C 27.0 Panther
32 Bodhgaya to Imamganj S/C 56.0 Panther
33 Dehri to Banjari S/C 38.0 Panther
34 Dehri to Sasaram Ckt. - I S/C 20.0 Panther
35 Sasaram to Kudra Ckt. - I S/C 13.0 Panther
36 Kudra to Karamnasa Ckt.- I S/C 10.0 Panther
37 Dehri to Pusauli PG Ckt - II S/C 26.0 Panther
38 Pusouli PG to Mohania Ckt. - II S/C 10.0 Panther
39 Mohania to Karmnasa Ckt. - II S/C 11.0 Panther
40 Dehri to Bikramganj Ckt. - II S/C 45.0 Panther
41 Bikramganj to Dumroan Ckt. - II S/C 35.0 Panther
43 Dumroan to Buxar S/C 16.1 Panther
44 Ara (PG) to Jagdishpur S/C 26.3 Panther
45 Fatuha to Sipara S/C 26.0 Panther
46 Sipara to Mithapur S/C 16.0 Panther
47 Mithapur to Jakkanpur S/C 1.0 Panther
48 Gaighat to Mithapur S/C 5.0 Panther
49 Fatuha to Gaighat S/C 23.0 Panther
50 Fatuha to Katra S/C 17.0 Panther
52 Biharsarif (SG) to Barh Ckt. - I S/C 25.0 Panther
53 Barh to Hathidah Ckt. - I S/C 20.0 Panther
54 Biharsarif (SG) to Hathidah Ckt. - II S/C 32.5 Panther
55 Biharsarif (SG) to Ekangarsarai S/C 30.0 Panther
56 Ekangarsarai to Hulasgarh S/C 14.5 Panther

Web based Protection Database and Desktop based Protection setting calculation tool – ERPC
75 PRDC Bangalore January 2017
Sl.No Transmission line Ckt type
Distance (km)
Conductor Type
Owned By
57 Baripahari to Harnaut S/C 26.0 Panther
58 Harnaut to Fatuha S/C 45.0 Panther
59 Biharsarif (SG) to Barhi (DVC) (L - 28)
S/C 142.0 Panther BSPTCL &
DVC
60 Barhi (DVC) to Rajgir (L - 29) S/C 16.0 Panther
BSPTCL
61 Rajgir to Biharsarif (L - 29) S/C 126.0 Panther
62 Biharsarif (SG) to Nawada S/C 41.0 Panther
63 Hathidah to Lakhisarai S/C 28.0 Panther
64 Hathidah to Shekhpura S/C 28.0 Panther
65 Lakhisarai to Jamui S/C 35.0 Panther
66 Biharsarif (SG) to Shekhpura S/C 39.5 Panther
67 Shekhpura to Jamui S/C 49.0 Panther
68 Lakhisarai to Jamalpur S/C 45.0 Panther
69 Sultanganj to Jamalpur S/C 38.0 Panther
70 Sabour to Sultanganj Ckt I S/C 30.0 Panther
71 Sabour to Sultanganj Ckt II S/C 31.0 Panther
72 Sultanganj to Deoghar S/C 105.0 Panther
73 KhSTPP to Sabour S/C 25.0 Panther
74 Purnia(bs) to Naugachia (L - 16) S/C 70.0 Panther
75 Naugachia to BTPS (L- 16) S/C 136.0 Panther
76 Purnia(bs) to Khagaria (L - 23) S/C 150.0 Panther
77 Khagaria to BTPS (L - 23) S/C 60.0 Panther
78 Purnia(BS) to Katihar S/C 29.0 Panther
79 Purnia(BS) to Saharsa S/C 101.2 Panther
80 Purnia (BS) to Farbisganj S/C 85.0 Panther
81 Kishanganj to Dalkola (WB) S/C 26.0 Panther
82 Kishanganj to Farbisganj S/C 88.6 Panther
83 Farbisganj to Kataya (Kosi) Ckt. - II (Old)
S/C 50.9 Panther
84 Madhepura to Saharsa S/C 50.0 Panther
85 Madhepura to Sonebarsa S/C 50.0 Panther
86 Saharsa to UdaKishanganj S/C 50.4 Panther
87 Begusarai to Samastipur (L - 9) S/C 57.0 Panther

Web based Protection Database and Desktop based Protection setting calculation tool – ERPC
76 PRDC Bangalore January 2017
Sl.No Transmission line Ckt type
Distance (km)
Conductor Type
Owned By
88 Begusarai to Dalsingsarai (L - 10) S/C 34.0 Panther
89 Dalsingsarai to Samastipur (L - 10) S/C 23.0 Panther
90 KBUNL to Muzaffarpur Ckt - I S/C 15.5 Panther
91 KBUNL to Muzaffarpur Ckt - II S/C 16.7 Panther
92 KBUNL to SKMSH S/C 14.1 Panther
93 Samastipur to Darbhanga S/C 40.0 Panther
94 Samastipur to Hazipur LILO at Jandaha
S/C 92.0 Panther
95 Hazipur to Sheetalpur S/C 30.0 Panther
96 Chapra to Sheetalpur S/C 40.0 Panther
97 Muzaffarpur to Vaishali D/C 30.1 Panther
98 Chapra to Siwan S/C 70.0 Panther
99 Chapra/Siwan to Ekma S/C 0.6 Panther
100 Gopalganj to Siwan S/C 40.0 Panther
101 Gopalganj to Masrakh to Siwan S/C 74.9 Panther
102
Gopalganj to Bettia D/C 60.8 Panther
Gopalganj/Bettia Ckt- I LILO at Sidhwalia SM
S/C 12.0 Panther
103 MTPS to Motihari S/C 70.0 Panther
104 Bettia to Motihari S/C 45.0 Panther
105 Bettia to Ramnagar S/C 41.5 Panther
106 Bettia to Raxaul S/C 37.1 Panther
107 Ramnagar to BHPC, Valmikinagar S/C 77.8 Panther
108 BHPC, Valmikinagar to Nepal (Surajpura)
S/C 7.2 Panther
109 Motihari to Dhaka S/C 24.0 Panther
110 Dhaka to Sitamarhi S/C 52.0 Panther
111 Sitamarhi to Runisaidpur(Reminagar)
S/C 21.0 Panther
112 Runisaidpur to SKMCH S/C 35.0 Panther
113 SKMCH to Muzaffarpur S/C 15.0 Panther
114 Darbhanga (220 kV) to Darbhanga (132 kV)
S/C 1.0 Panther
115 Darbhanga to Phoolparas S/C 71.8 Panther
116 Pandaul to Madhubani S/C 16.0 Panther

Web based Protection Database and Desktop based Protection setting calculation tool – ERPC
77 PRDC Bangalore January 2017
Sl.No Transmission line Ckt type
Distance (km)
Conductor Type
Owned By
117 Madhubani to Jainagar S/C 40.0 Panther
118 Jainagar to Phoolparas S/C 55.0 Panther
119 Barauni TPS to Begusarai (L - 9 & L - 10)
D/C 10.0 Panther
120 BHPC Kosi (Kataiya) to Duhabi (Nepal)
D/C 3.5 Panther
121 Biharshariff (BSEB) to Baripahari D/C 5.0 Panther
122 Dehri to Sonenagar D/C 14.5 Panther
123 Khagaul to Bihta D/C 14.5 Panther
124 Khagaul to Digha D/C 16.0 Panther
125 Samastipur to MTPS (Kanti) D/C 85.2 Panther
126 Sheetalpur to Vaishali D/C 30.2 Panther
127 Sonenagar to Aurangabad D/C 21.0 Panther
128 Supaul to Phulparas D/C 31.9 Panther
129 Madhepura to Supaul D/C 30.0 Panther
130 Biharshariff to Hullasgarh S/C 40.0 Panther
131 Ara to Ara TSS S/C 4.0 Panther
132 Dumroan to Dumroan TSS S/C 2.0 Panther
133 Rafiganj to Rafiganj TSS S/C 4.6 Panther
134 Barh/Hathidah line to Mokama TSS S/C 6.0 Panther
135 Lakhisaai to Lakhisarai TSS S/C 6.0 Panther
136 Khagaul to Khagaul TSS S/C 1.0 Panther
137 Fatuha to Khusrupur TSS S/C 7.2 Panther
138 Chapra to Chapra TSS S/C 1.0 Panther
139 Hazipur to Hazipur TSS S/C 2.0 Panther
140 Lakhisari PG to Lakhisarai BSPTCL D/C 15.3 Panther
141 Chandauti to Tehta D/C 15.0 Panther
142 Tehta to Jehanabad D/C 40.0 Panther
143 Sipara to Jakkanpur D/C 18.0 Panther
144 Farbisganj to Kataya Ckt. - I (New) D/C 39.7 Panther
145 Supaul to Kataya D/C 59.6 Panther
146 Samastipur to Hazipur (220 kV) D/C 70.0 Panther
147 Bodhgaya to Paharpur TSS D/C 35.0 Panther

Web based Protection Database and Desktop based Protection setting calculation tool – ERPC
78 PRDC Bangalore January 2017
Sl.No Transmission line Ckt type
Distance (km)
Conductor Type
Owned By
148 Jamui to Jhajha TSS D/C 31.0 Panther
149 Lakhisari PG to Jamui D/C 25.3 Panther
150 Dehri to Kudra S/C 46.0 Panther
151 kudra to Pusauli S/C 25.0 Panther
152 Kudra to kochas S/C 27.0 Panther
153 Banjari to KCL S/C 1.0 Panther
154 Khagaul to Fatuha S/C 35.0 Panther
155 Begusarai to Khusweshthan S/C 65.5 Panther
156 Fatuha to Birpahari S/C 42.0 Panther
157 Nalanda to (L - 28) LILO Point D/C 2.0 Panther
158 (L - 28) Line to Rajgir grid (T - Connection)
S/C 6.0 Panther
159 Muzaffarpur to SKMCH S/C 16.7 Panther
160 Sasaram to Banjari S/C 47.5 Panther
161 Tehata to Belaganj S/C 22.0 Panther
162 Aurangabad to Shree Cement S/C 0.8 Panther
163 Kahalgaon (BSPTCL) to Sultangunj D/C 63.5 Panther
164 Darbhanga to Gangwara GSS D/C 7.3
Panther
165 Gangwara GSS to Pandaul Panther
166 Kisanganj to Forbesganj Circuit- 2 S/C 88.4 Panther
167 Forbesganj to Kataiya Circuit- 3 S/C 39.8 Panther
168 Mithapur to Karbighaia S/C 2.5 Panther
169 Dehri to Kochas S/C 31.6
Panther
170 Kochas to Dumraon Circuit- 1 S/C Panther
171 Banka (PG) to Sultanganj D/C 46.0 Panther
Jharkhand
765 kV
1 Ranchi (New) to Dharamjaygarh S/C 301.0 Qd Bermis PGCIL
2 Ranchi (New) to Dharamjaygarh S/C 344.6 Qd Bermis
400 kV
1 Chaibasa to Bisra (Rourkela) S/C 131.0 Twin-Moose PGCIL
2 Jamshedpur to Chaibasa S/C 46.0 Twin-Moose

Web based Protection Database and Desktop based Protection setting calculation tool – ERPC
79 PRDC Bangalore January 2017
Sl.No Transmission line Ckt type
Distance (km)
Conductor Type
Owned By
3 Jamshedpur to Bisra S/C 182.0 Twin-Moose
4 Jamshedpur to Mejia B S/C 168.0 Twin-Moose
5 Jamshedpur to Maithon S/C 153.0 Twin-Moose
6 Maithon to Mejia B S/C 97.0 Twin-Moose
7 Jamshedpur to DTPS D/C 156.0 Twin-Moose
8 Jamshedpur to Adhunik D/C 0.3 Quad-Moose APNRL
9 Jamshedpur to Parulia S/C 177.0 Twin-Moose
PGCIL
10 Jamshedpur to Baripada S/C 141.0 Twin-Moose
11 Jamshedpur to TISCO S/C 39.0 Twin-Moose
12 TISCO to Baripada S/C 116.0 Twin-Moose
13 Maithon to Maithon RB D/C 31.0 Twin-Moose
14 Maithon to Kahalgaon D/C 172.0 Twin-Moose
15 Maithon to Mejia B D/C 84.0 Twin-Moose
16 Maithon to Gaya D/C 277.0 Quad-Moose
17 Maithon to Durgapur D/C Lapwing
18 Ranchi to Maithon RB D/C 188.0 Twin-Moose
19 Ranchi to Maithon S/C 200.0 Twin-Moose
20 Ragunathpur to Maithon S/C 52.9 Twin-Moose
21 Ranchi to Raghunathpur S/C 169.2 Twin-Moose
22 Ranchi to Sipat D/C 405.0 Twin-Moose
23 Ranchi to Rourkela D/C 145.0 Twin-Moose
24 Ranchi to Ranchi (New) 2XD/C 78.6 Quad-Moose
25 Ranchi (New) to Chandwa (JK Pool)
D/C 69.0 Quad-Moose
26 Koderma to Gaya D/C 82.0 Quad-Moose
27 Koderma to Biharshariff D/C 111.0 Quad-Moose
28 Koderma to BTPS D/C 100.0 Twin-Moose
29 Jharkhand pooling station (Chandwa) to Gaya
D/C 117.0 Quad-Moose
220 kV
1 Farakka to Lalmatia S/C 79.0 Zebra PGCIL
2 Ramchandrapur to Joda S/C 130.0 Zebra OPTCL &
JSEB
3 Chandil to Santadih (STPS) S/C 98.0 Zebra WBSETCL &
JSEB
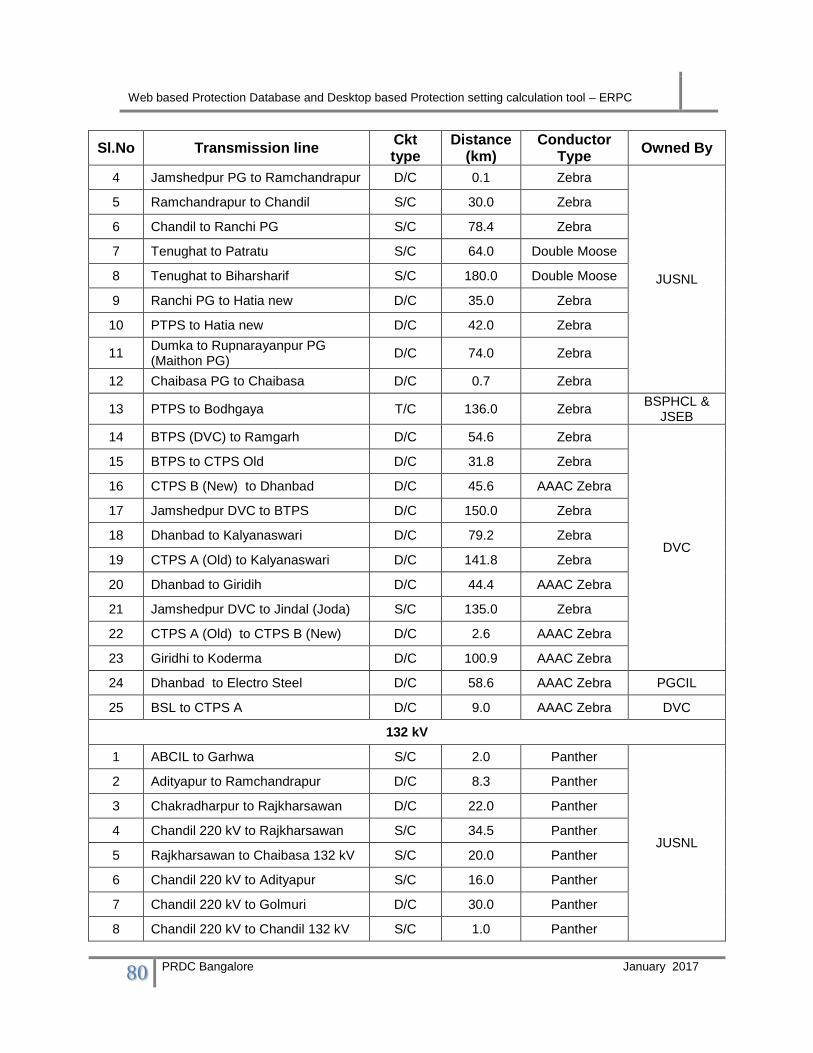
Web based Protection Database and Desktop based Protection setting calculation tool – ERPC
80 PRDC Bangalore January 2017
Sl.No Transmission line Ckt type
Distance (km)
Conductor Type
Owned By
4 Jamshedpur PG to Ramchandrapur D/C 0.1 Zebra
JUSNL
5 Ramchandrapur to Chandil S/C 30.0 Zebra
6 Chandil to Ranchi PG S/C 78.4 Zebra
7 Tenughat to Patratu S/C 64.0 Double Moose
8 Tenughat to Biharsharif S/C 180.0 Double Moose
9 Ranchi PG to Hatia new D/C 35.0 Zebra
10 PTPS to Hatia new D/C 42.0 Zebra
11 Dumka to Rupnarayanpur PG (Maithon PG)
D/C 74.0 Zebra
12 Chaibasa PG to Chaibasa D/C 0.7 Zebra
13 PTPS to Bodhgaya T/C 136.0 Zebra BSPHCL &
JSEB
14 BTPS (DVC) to Ramgarh D/C 54.6 Zebra
DVC
15 BTPS to CTPS Old D/C 31.8 Zebra
16 CTPS B (New) to Dhanbad D/C 45.6 AAAC Zebra
17 Jamshedpur DVC to BTPS D/C 150.0 Zebra
18 Dhanbad to Kalyanaswari D/C 79.2 Zebra
19 CTPS A (Old) to Kalyanaswari D/C 141.8 Zebra
20 Dhanbad to Giridih D/C 44.4 AAAC Zebra
21 Jamshedpur DVC to Jindal (Joda) S/C 135.0 Zebra
22 CTPS A (Old) to CTPS B (New) D/C 2.6 AAAC Zebra
23 Giridhi to Koderma D/C 100.9 AAAC Zebra
24 Dhanbad to Electro Steel D/C 58.6 AAAC Zebra PGCIL
25 BSL to CTPS A D/C 9.0 AAAC Zebra DVC
132 kV
1 ABCIL to Garhwa S/C 2.0 Panther
JUSNL
2 Adityapur to Ramchandrapur D/C 8.3 Panther
3 Chakradharpur to Rajkharsawan D/C 22.0 Panther
4 Chandil 220 kV to Rajkharsawan S/C 34.5 Panther
5 Rajkharsawan to Chaibasa 132 kV S/C 20.0 Panther
6 Chandil 220 kV to Adityapur S/C 16.0 Panther
7 Chandil 220 kV to Golmuri D/C 30.0 Panther
8 Chandil 220 kV to Chandil 132 kV S/C 1.0 Panther

Web based Protection Database and Desktop based Protection setting calculation tool – ERPC
81 PRDC Bangalore January 2017
Sl.No Transmission line Ckt type
Distance (km)
Conductor Type
Owned By
9 Deoghar to Sultanganj S/C 92.0 Panther
10 Deogarh to Jamtara D/C 75.0 Panther
11 Jamtara to Madupur D/C 54.0 Panther
12 Deoghar to Shankarpur Rly S/C 11.0 Panther
13 Deoghar to Dumka 220 kV D/C 68.0 Panther
14 Dumka 132 kV to Lalmatiya D/C 96.0 Panther
15 Goielkera to Goielkera Rly S/C 0.5 Panther
16 Goielkera to Rajkharsawan S/C 55.0 Panther
17 Gumla to Kamdara S/C 62.0 Panther
18 Kamdara to Hatia Old S/C 61.0 Panther
19 Garhwa to Japla S/C 50.0 Panther
20 Hatia old to Sikadari S/C 46.0 Panther
21 Hatia old to HEC D/C 8.0 Panther
22 Hatia New to Lohardanga D/C 62.0 Zebra
23 Chaibasa 132 kV to Kendposi S/C 30.0 Panther
24 Jadugoda to Golmuri S/C 22.0 Panther
25 Lalmatia to Kahalgaon TPP S/C 47.0 Panther POWERGRI
D
26 Kendposi to Noamndi S/C 28.0 Panther JSEB
27 Kendposi to Joda S/C 42.0 Panther JUSNL & OPTCL
28 Lalmatia to Sahebgunj S/C 49.0 Panther
JUSNL 29 Lohardanga to Latehar D/C 56.0 Zebra
30 Latehar to Daltonganj D/C 64.0 Zebra
31 Maithon DVC 132 kV to Jamtara S/C 25.0 Panther DVC & JSEB
32 PTPS to Hatia Old S/C 44.0 Zebra
JUSNL
33 Hatia old to Kanke S/C 28.0 Zebra
34 Kanke to PTPS S/C 28.0 Zebra
35 Rajkharsawan to Adityapur S/C 36.0 Panther
36 Saljhagiri Rly to Golmuri S/C 4.0 Panther
37 Sikkidri (pooling point of SHPS) to Namkum
S/C 34.0 Panther
38 Namkum to Hatia new S/C 27.0 Panther
39 Sonenagar to Japla S/C 49.6 Panther
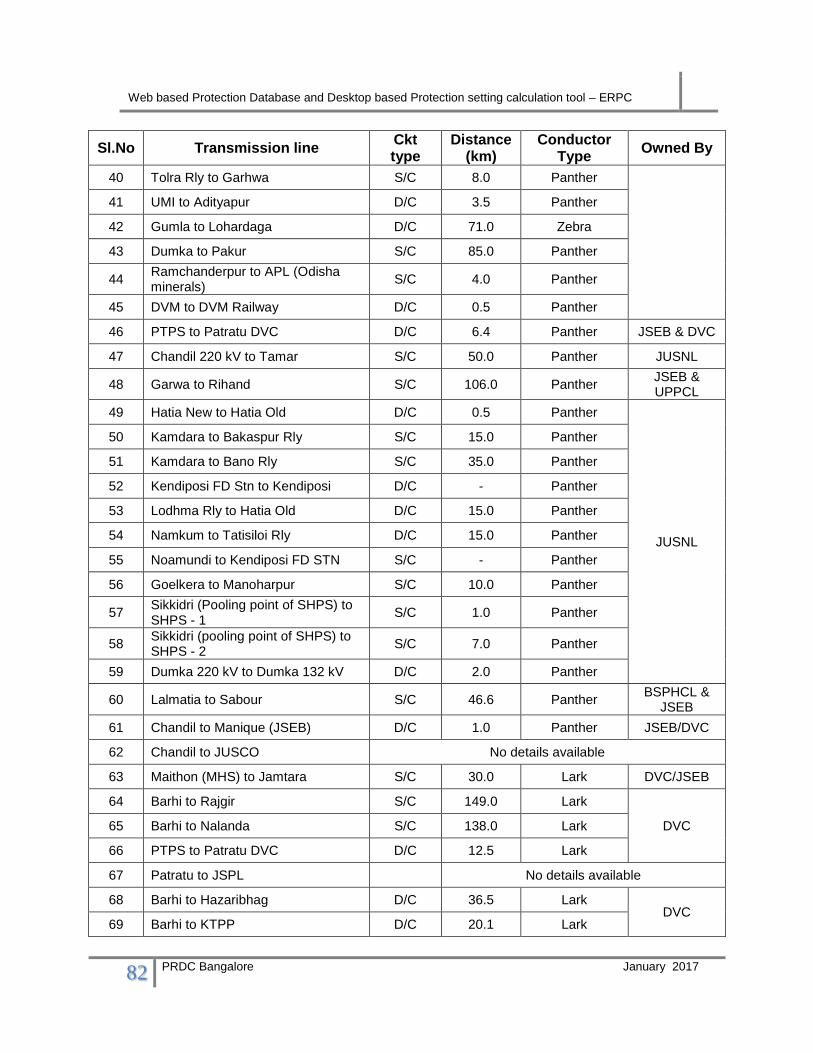
Web based Protection Database and Desktop based Protection setting calculation tool – ERPC
82 PRDC Bangalore January 2017
Sl.No Transmission line Ckt type
Distance (km)
Conductor Type
Owned By
40 Tolra Rly to Garhwa S/C 8.0 Panther
41 UMI to Adityapur D/C 3.5 Panther
42 Gumla to Lohardaga D/C 71.0 Zebra
43 Dumka to Pakur S/C 85.0 Panther
44 Ramchanderpur to APL (Odisha minerals)
S/C 4.0 Panther
45 DVM to DVM Railway D/C 0.5 Panther
46 PTPS to Patratu DVC D/C 6.4 Panther JSEB & DVC
47 Chandil 220 kV to Tamar S/C 50.0 Panther JUSNL
48 Garwa to Rihand S/C 106.0 Panther JSEB & UPPCL
49 Hatia New to Hatia Old D/C 0.5 Panther
JUSNL
50 Kamdara to Bakaspur Rly S/C 15.0 Panther
51 Kamdara to Bano Rly S/C 35.0 Panther
52 Kendiposi FD Stn to Kendiposi D/C - Panther
53 Lodhma Rly to Hatia Old D/C 15.0 Panther
54 Namkum to Tatisiloi Rly D/C 15.0 Panther
55 Noamundi to Kendiposi FD STN S/C - Panther
56 Goelkera to Manoharpur S/C 10.0 Panther
57 Sikkidri (Pooling point of SHPS) to SHPS - 1
S/C 1.0 Panther
58 Sikkidri (pooling point of SHPS) to SHPS - 2
S/C 7.0 Panther
59 Dumka 220 kV to Dumka 132 kV D/C 2.0 Panther
60 Lalmatia to Sabour S/C 46.6 Panther BSPHCL &
JSEB
61 Chandil to Manique (JSEB) D/C 1.0 Panther JSEB/DVC
62 Chandil to JUSCO No details available
63 Maithon (MHS) to Jamtara S/C 30.0 Lark DVC/JSEB
64 Barhi to Rajgir S/C 149.0 Lark
DVC 65 Barhi to Nalanda S/C 138.0 Lark
66 PTPS to Patratu DVC D/C 12.5 Lark
67 Patratu to JSPL No details available
68 Barhi to Hazaribhag D/C 36.5 Lark DVC
69 Barhi to KTPP D/C 20.1 Lark

Web based Protection Database and Desktop based Protection setting calculation tool – ERPC
83 PRDC Bangalore January 2017
Sl.No Transmission line Ckt type
Distance (km)
Conductor Type
Owned By
70 BTPS B to ECR Gomia D/C 6.9 AAAC Panther
71 BTPS B to Barhi D/C 82.0 Panther
72 BTPS B to Konar S/C 23.0 Lark
73 Barhi to Konar S/C 61.0 Panther
74 CTPS A to Gola D/C 36.0 Lark
75 CTPS B to Putki D/C 29.0 Lark
D/C 30.0 Lark
76 CTPS A to Purulia DVC D/C 59.6 Lark
77 CTPS A to Ramkanali S/C 60.0 Lark
78 Ramkanali to DTPS S/C 73.0 AAAC Panther
79 BSL to CTPS A D/C 10.0 Lark
80 BSL (MSDS) to CTPS A D/C 10.0 Lark
81 Gola to Manique (DVC) D/C 86.1 Lark
82 Jamshedpur to Chandil D/C 43.7 Lark
83 Jamshedpur (DVC) to Mosabani D/C 39.6 Lark DVC
84 Jamshedpur to TISCO No details available
85 KTPP to Koderma D/C 18.3 Lark
DVC
86 Koderma JSEB to Koderma DVC D/C 18.3 ACSR Panther
87 Konar to Hazaribhag Road D/C 35.0 Lark
88 Nimiaghat to Putki D/C 45.0 AAAC Panther
89 Nimiaghat to Giridhi (New) D/C 43.6 AAAC Panther
90 Giiridhi (New) to Giridhi (Old) No proper data available
91 Patherdhi to Putki D/C 22.6 Lark
DVC
92 Patherdhi to Sindri D/C 3.2 Lark
93 Pradhankhanda to Sindri D/C 20.0 Lark
94 Patherdhi to Maithon (MHS) D/C 41.0 AAAC Panther
95 Ramgarh to Gola D/C 25.3 Lark
96 Gola to SER Muri D/C 30.3 Lark
97 Ramkanali to Panchet D/C 14.5 Lark
98 Jamshedpur (DVC) to Purulia DVC D/C 87.0 Lark
99 Kalipahari to Kalyanswari D/C 28.8 Lark
100 Kalyanswari to MAL IMPEX S/C 1.5 AAAC Panther
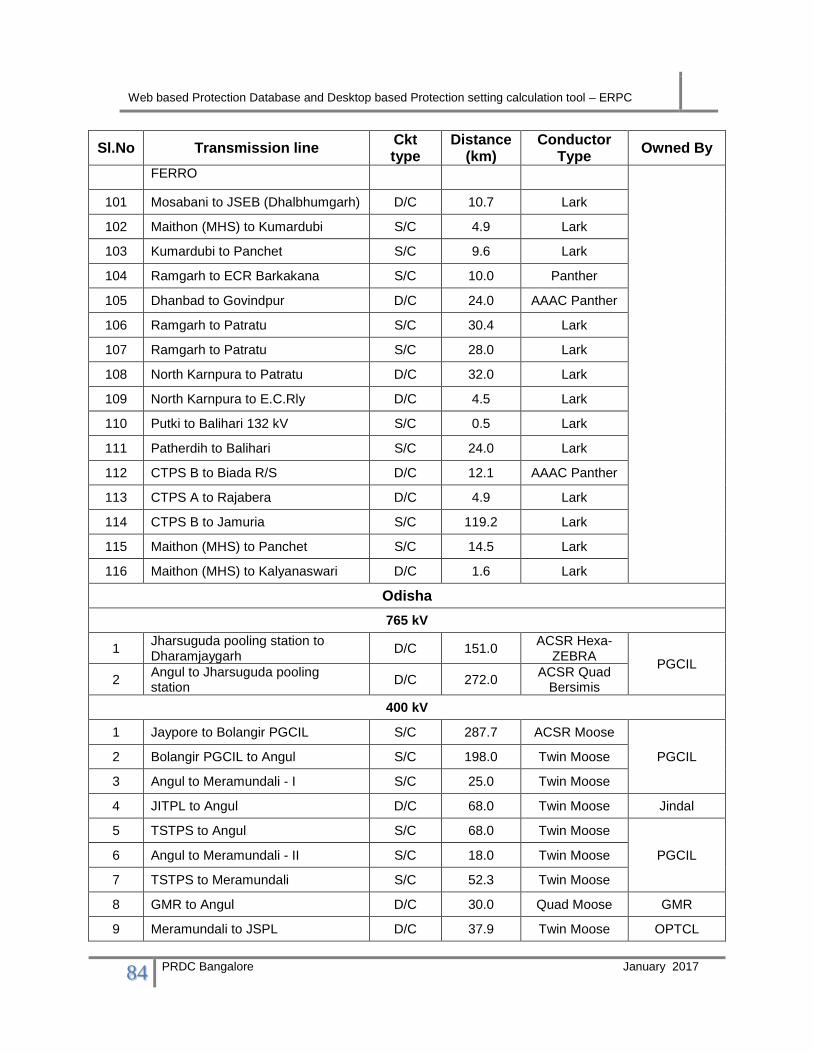
Web based Protection Database and Desktop based Protection setting calculation tool – ERPC
84 PRDC Bangalore January 2017
Sl.No Transmission line Ckt type
Distance (km)
Conductor Type
Owned By
FERRO
101 Mosabani to JSEB (Dhalbhumgarh) D/C 10.7 Lark
102 Maithon (MHS) to Kumardubi S/C 4.9 Lark
103 Kumardubi to Panchet S/C 9.6 Lark
104 Ramgarh to ECR Barkakana S/C 10.0 Panther
105 Dhanbad to Govindpur D/C 24.0 AAAC Panther
106 Ramgarh to Patratu S/C 30.4 Lark
107 Ramgarh to Patratu S/C 28.0 Lark
108 North Karnpura to Patratu D/C 32.0 Lark
109 North Karnpura to E.C.Rly D/C 4.5 Lark
110 Putki to Balihari 132 kV S/C 0.5 Lark
111 Patherdih to Balihari S/C 24.0 Lark
112 CTPS B to Biada R/S D/C 12.1 AAAC Panther
113 CTPS A to Rajabera D/C 4.9 Lark
114 CTPS B to Jamuria S/C 119.2 Lark
115 Maithon (MHS) to Panchet S/C 14.5 Lark
116 Maithon (MHS) to Kalyanaswari D/C 1.6 Lark
Odisha
765 kV
1 Jharsuguda pooling station to Dharamjaygarh
D/C 151.0 ACSR Hexa-
ZEBRA PGCIL
2 Angul to Jharsuguda pooling station
D/C 272.0 ACSR Quad
Bersimis
400 kV
1 Jaypore to Bolangir PGCIL S/C 287.7 ACSR Moose
PGCIL 2 Bolangir PGCIL to Angul S/C 198.0 Twin Moose
3 Angul to Meramundali - I S/C 25.0 Twin Moose
4 JITPL to Angul D/C 68.0 Twin Moose Jindal
5 TSTPS to Angul S/C 68.0 Twin Moose
PGCIL 6 Angul to Meramundali - II S/C 18.0 Twin Moose
7 TSTPS to Meramundali S/C 52.3 Twin Moose
8 GMR to Angul D/C 30.0 Quad Moose GMR
9 Meramundali to JSPL D/C 37.9 Twin Moose OPTCL

Web based Protection Database and Desktop based Protection setting calculation tool – ERPC
85 PRDC Bangalore January 2017
Sl.No Transmission line Ckt type
Distance (km)
Conductor Type
Owned By
10 Meramundali to Vedanta (Sterlite) D/C 222.0 Twin Moose PGCIL
11 GMR to Meramundali S/C 8.5 Twin Moose
OPTCL 12 Meramundali to Mendhasal S/C 106.0 Twin Moose
13 Meramundali to New Duburi D/C 97.0 Twin Moose
14 TSTPS to Rengali D/C 24.0 Twin Moose PGCIL
15 Baripada to Keonjhar S/C 156.3 ACSR Moose OPTCL
16 Keonjhar PGCIL to Rengali S/C 100.3 Twin Moose OPTCL
17 Baripada to Kharagpur S/C 100.3 ACSR Moose WBSETCL &
OPTCL
18 Baripada to Jamshedpur S/C 141.0 ACSR Moose
PGCIL 19 Baripada to TISCO (DVC) S/C 115.0 ACSR Moose
20 Baripada to Pandiabil
S/C 295.0
ACSR Moose Pandiabil to Mendhasal 25.0
21 Baripada to Duburi S/C 190.3 ACSR Moose
OPTCL 22
Dubri to Pandiabil S/C
130.0 Twin Moose
Pandiabil to Mendhasal 25.0
23 Bisra to TSTPS D/C 171.0 Twin Moose
PGCIL 24 Bisra to Ranchi D/C 145.0 ACSR Moose
25 Bisra to Chaibasa S/C 131.5 ACSR Moose
26 Bisra to Sterlite S/C 135.0 ACSR Moose PGCIL& Sterlite 27 Sterlite to Raigarh S/C 147.0 Twin Moose
28 Bisra to Raigarh S/C 230.4 ACSR Moose
PGCIL
29 Bisra to Jharsuguda D/C 145.3 ACSR Twin
Moose
30 Jharsuguda to Raigarh S/C 110.0 ACSR Twin
Moose
31 Jharsugud to Indbarath S/C 62.6 ACSR Twin
Moose
32 Ind Bharath to Raigarh S/C 91.0 Twin Moose
33 Indravati PG to Rengali S/C 356.0 ACSR Moose
34 Indravati PG to Jaypore S/C 72.0 ACSR Moose
35 Indravati PG to Indravati OHPC S/C 4.0 ACSR Moose OPTCL
36 Jaypore to Gazuwaka D/C 225.0 AAAC
PGCIL 37 TSTPS to Kolar
Double pole
1450.0 HVDC

Web based Protection Database and Desktop based Protection setting calculation tool – ERPC
86 PRDC Bangalore January 2017
Sl.No Transmission line Ckt type
Distance (km)
Conductor Type
Owned By
38 Bishra to Jamshedpur S/C 181.4 ACSR Moose
220 kV
1
LILO of Balasore to Duburi new S/C line at Bhadrak
1.4
Zebra
OPTCL
Balasore to Bhadrak S/C 70.0
Bhadrak to New Duburi S/C 70.0
2 Balasore to Baripada D/C 77.0 Zebra
3 Budhipadar to Raigarh S/C 81.0 Zebra
4 Budhipadar to Korba D/C 183.0 Zebra
5 Budhipadar to ITPS D/C 25.3 AAAC MOOSE
6 Budhipadar to ITPS D/C 25.3 AAAC MOOSE
7 Budhipadar to Vedanta D/C 16.8 ACSR MOOSE Vedanta
8 Budhipadar to Bhusan D/C 14.9 Zebra
OPTCL
9 Budhipadar to SPS D/C 7.1 Zebra
10 Budhipadar to Basundhara S/C 35.8
11 Budhipadar to Lapanga
D/C 25.0
Zebra Lapanga to Katapalli 51.0
12 Budhipadar to Tarkera D/C 102.0 Zebra
13 Budhipadar to Aditya Aluminum D/C 20.5 Zebra
14 Balimela to Upper Silleru S/C 24.7 Zebra
15 Balimela to Balimela SC S/C 0.2 Zebra
16 Duburi to New Duburi D/C 6.4 Zebra
17 Duburi to NINL (Nilachal) S/C 5.5 Zebra
18 New Duburi to Paradeep D/C 113.3 ACSR+AAAC
19 New Duburi to JSL D/C 4.8 Zebra JSL
20 New Duburi to Maithan Ispat Nigam Limited
S/C 4.8 Zebra MINL
21 New Duburi to Rohit S/C 4.8 Zebra Rohit
22 New Duburi to Balasore S/C 137.9 Zebra OPTCL
23 New Duburi to Visa S/C 10.5 Zebra Visa
24 New Duburi to Tata steel D/C 4.0 Zebra
25 Meramundali to Dubri D/C 95.6 ACSR Zebra OPTCL
26 Meramundali to TSTPS D/C 42.0 ACSR Zebra

Web based Protection Database and Desktop based Protection setting calculation tool – ERPC
87 PRDC Bangalore January 2017
Sl.No Transmission line Ckt type
Distance (km)
Conductor Type
Owned By
27 Meramundali to TTPS D/C 11.2 ACSR Zebra
28 Meramundali to NALCO D/C 11.5 ACSR Zebra
29 Meramundali to Bhusan steel D/C 2.4 ACSR Zebra
30 Meramundali to Bhanja nagar D/C 139.0 ACSR Zebra
31
Mendhasal to Bhanja nagar
S/C
135.0
Zebra Mendhasal to Nayagarh 69.0
Nayagarh to Bhanja nagar 68.6
32 Mendhasal to Chandaka 4 6.04 & 7.26
ACSR Zebra
33 Meramundali to Bidanasi S/C 92.3 Twin Moose
34 Bidanasi to Mendhasal S/C 31.1
35 Mendhasal to Atri D/C 16.0 Zebra
Atri to Narendrapur S/C 120.0 Zebra
36 Theruvali to Bhanja nagar D/C 171.5 Zebra
37 Theruvali to Narendrapur D/C 196.0 Zebra
38 Theruvali to Indravati D/C 86.0 AAAC Zebra
39 Theruvali to Indravati D/C 91.0 AAAC Zebra
40 Theruvali to Upper Kolab S/C 123.0 Zebra
41
Jaynagar to Laxmi pur
S/C
53.5
Zebra Laxmi pur to Theruvali 70.0
Theruvali to Jaynagar 123.0
42 Jaya nagar to Upper Kolab D/C 6.0 Zebra
43 Jaya nagar to Jaya nagar PGCIL (Jaypore)
D/C 7.7 Zebra
44 Jaya nagar to Balimela S/C 92.0 Zebra
45 Jaya nagar to Balimela D/C 93.0 Zebra
46 Joda to TTPS D/C 154.0 Zebra
47 Joda to chaibasa S/C 90.0 Zebra
48 Joda to JSPL
S/C 12.0
Zebra JSPL to Jamshedpur (DVC) 126.0
49 Joda to TSIL S/C 7.3 Zebra
50 Joda to Ramchandrapur S/C 130.0 Zebra
51 Katapalli to Bolangir D/C 117.8 Zebra

Web based Protection Database and Desktop based Protection setting calculation tool – ERPC
88 PRDC Bangalore January 2017
Sl.No Transmission line Ckt type
Distance (km)
Conductor Type
Owned By
Bolangir to Bolangir PG S/C 3.0
52 Laxmi pur to Aditya Alumina D/C 16.9 Zebra
53 Laxmi pur to Utkal Alumina D/C 14.1 Zebra
54 Paradeep to Essar steel D/C 9.0 Zebra
55 Paradeep to IOCL S/C 6.2 Zebra
56 Rengali PH to TSTPS S/C 29.5 Zebra
57 TSTPS to TTPS S/C 34.5 Zebra
58
Rengali PH to TTPS
S/C
70.0
Zebra Rengali PH to NALCO 62.7
NALCO to TTPS 8.6
59 Rengali Switching Station to Rengali PG
D/C 1.0 Zebra
60 Rengali Switching Station to Rengali PH
D/C 5.0 Zebra
61 Rengali Switching Station to Barkot
S/C 34.7
Zebra Barkot to Tarkera 115.0
62
Rengali Switching Station to Chandiposh S/C
102.0 Zebra
Chandiposh to Tarkera 30.0
63 Tarkera to Bisra PG D/C 15.0 Zebra
64 Tarkera to RSP D/C 10.0 Zebra
65 Vedanta to SEL D/C 6.0 Zebra
66 Atri to Pandiabil (Uttara)
D/C 22.0 Zebra
Pandiabil (Uttara) to Samangara 45.9 Zebra
132 kV
1 Angul to MCL Nandira D/C 10.8 Panther
OPTCL
2 Angul to Boinda S/C 38.5 Panther
3 Angul to Chainpal S/C 14.9 Panther
4 Angul to TTPS S/C 16.0 Panther
5
LILO of TTPS to Duburi S/C line at Jambay Ferro Alloys
0.7
Panther TTPS to Jambay Ferro Alloys S/C
45.0
Jambay Ferro Alloys Duburi 8.0
6 LILO of ICCL to Salipur S/C line at OCL 25.8
Panther ICCL to Mania S/C 22.0

Web based Protection Database and Desktop based Protection setting calculation tool – ERPC
89 PRDC Bangalore January 2017
Sl.No Transmission line Ckt type
Distance (km)
Conductor Type
Owned By
Mania to OCL 5.0
OCL to Salipur 35.0
7
LILO at Kamakhyanagar 1.0
Panther
LILO at Kalarangi 13.0
LILO at OPCL 23.0
TTPS to OPCL
S/C
24.0
Kamakshya Nagar to OPCL 40.0
Kalarangi to Kamakhyanagar 36.0
Duburi to Kalarangi 20.0
8 Chainpal to FCI D/C 7.0 Panther
9 Chainpal to Meramundali D/C 7.8 Panther
10 Chainpal to TTPS 3 3.0 Panther
11
LILO of Chandaka to Choudwar S/C line at Bidanasi
6.8
Panther Choudwar to Bidanasi
S/C
8.6
Bidanasi to BPPL 35.0
BPPL to Chandaka 10.0
12 Choudwar to Kendrapara Road (Traction)
S/C 4.6 Panther
13
LILO at Rawmeet 8.8
Panther
LILO at Nuapatna Tap -
LILO at Arati steel 11.0
Meramundali to Arati steel
S/C
66.0
Nuapatna Tap Arti Steel 20.0
Arti Steel to Rawmet 22.3
Choudwar to Rawmet 27.5
14
LILO at Maheswari 4.9
Panther
LILO at ICCL -
Dhenkanal to Maheswari
S/C
28.0
Maheswari to ICCL 23.5
ICCL to Grid Steel (GSAL) 2.0
Grid Steel (GSAL) to Choudwar 1.9
15 Dhenkanal to Meramundali S/C 43.8 Panther

Web based Protection Database and Desktop based Protection setting calculation tool – ERPC
90 PRDC Bangalore January 2017
Sl.No Transmission line Ckt type
Distance (km)
Conductor Type
Owned By
16 Dhenkanal to Joranda traction S/C 19.4 Panther
17
LILO at Ranasinghpur 1.3
Panther
LILO at Kesura -
Chandaka to Ranasinghpur
S/C
23.6
Ranasinghpur to Kesura 26.4
Kesura to Nimpara 43.2
18 Chandaka to Nimpara S/C 62.0 Panther
19 Chandaka to Mendhasal S/C 36.5 Panther
Mendhasal to Khurda S/C 36.5 Panther
20 Chandaka to Bhubaneswar D/C 5.5 Panther
21
LILO of Bhubaneswar to Cuttack S/C line at Phulnakhara
-
Panther Bhubaneswar to Phulnakhara S/C
23.5
Phulnakhara to Cuttack 20.0
22 Cuttack to Jagatsinghpur S/C 35.2 Panther
23 Jagatsingpur to Paradeep S/C 56.1 Panther
24 Jagatsingpur to Gorakhnath (Traction)
S/C 16.2 Panther
25 Nimpara to Konark S/C 20.3 Panther
26 Puri to Nimpara S/C 30.0 Panther
27 Puri to Samangara S/C 15.0
Panther Samangara to Nimpara S/C 20.0
28
Khurda to Arugul Tap S/C 15.0
Panther Arugul Tap to Arugul S/C 3.9
Arugul Tap to Shamukh S/C 35.6
Shamukh to Puri S/C 18.6
29 Khurda to Kaipadar traction S/C 11.5 Panther
30
LILO at Balugaon 9.1
Panther
LILO at Chandpur 2.3
Khurda to Balugaon T
S/C
68.6
Balugaon T to Chandapur 5.0
Chandapur to Balugaon 30.0
Balugaon to Chatrapur 54.2

Web based Protection Database and Desktop based Protection setting calculation tool – ERPC
91 PRDC Bangalore January 2017
Sl.No Transmission line Ckt type
Distance (km)
Conductor Type
Owned By
Balugaon T to Atri 18.0
Argul to Atri 19.4
Atri to Baki 19.6
31 Balugaon T to Narendrapur S/C 86.0 Panther
32 Balugaon to Solari Rly S/C 15.0 Panther
33 Chatrapur to Ganjam S/C 12.0 Panther
34 Chatrapur to IRE D/C 5.8 Panther
35 Chatrapur to Narendrapur D/C 13.9 Panther
36 Chatrapur to Rambha Traction S/C 28.9 Panther
37 Chatrapur to Aska S/C 43.8 Panther
38
LILO of Aska to Chatrapur S/C line at Purusottampur
2.5
Panther Chatrapur to Purusottampur S/C
22.0
Purusottampur to Aska 24.0
39 Aska to Bhanja nagar D/C 33.0 Panther
40 Bhanja nagar to Phulbani S/C 86.6 Panther
41 Aska to Berhampur S/C 34.0 Panther
42 Berhampur to Narendrapur D/C 11.0 Panther
43
LILO of Berhampur to Mohanan S/C at Digapahandi
1.9
Panther Berhampur to Digapahandi S/C
39.0
Digapahandi to Mohanan 19.0
44 Narendrapur to Jagannathpur traction
S/C 0.5 Panther
45
LILO of Rayagada to Mohana S/C line at Akhusinghi
-
Panther Rayagada to Akhusinghi S/C
65.0
Akhusinghi to Mohana 55.0
46 Akhusinghi to Parlakemundi S/C 76.9 Panther
47 Rayagada to VVC Ferro (JESCO) S/C 0.3 Panther
48 Rayagada to Jayanagar S/C 108.0 Panther
49 Rayagada to Theruvali S/C 20.0 Panther
50 Theruvali to IMFA S/C 2.0 Panther
51 Theruvali to J.K. paper S/C 9.7 Panther
52 LILO of Kesingh to Theruvali S/C line at 12.4 Panther
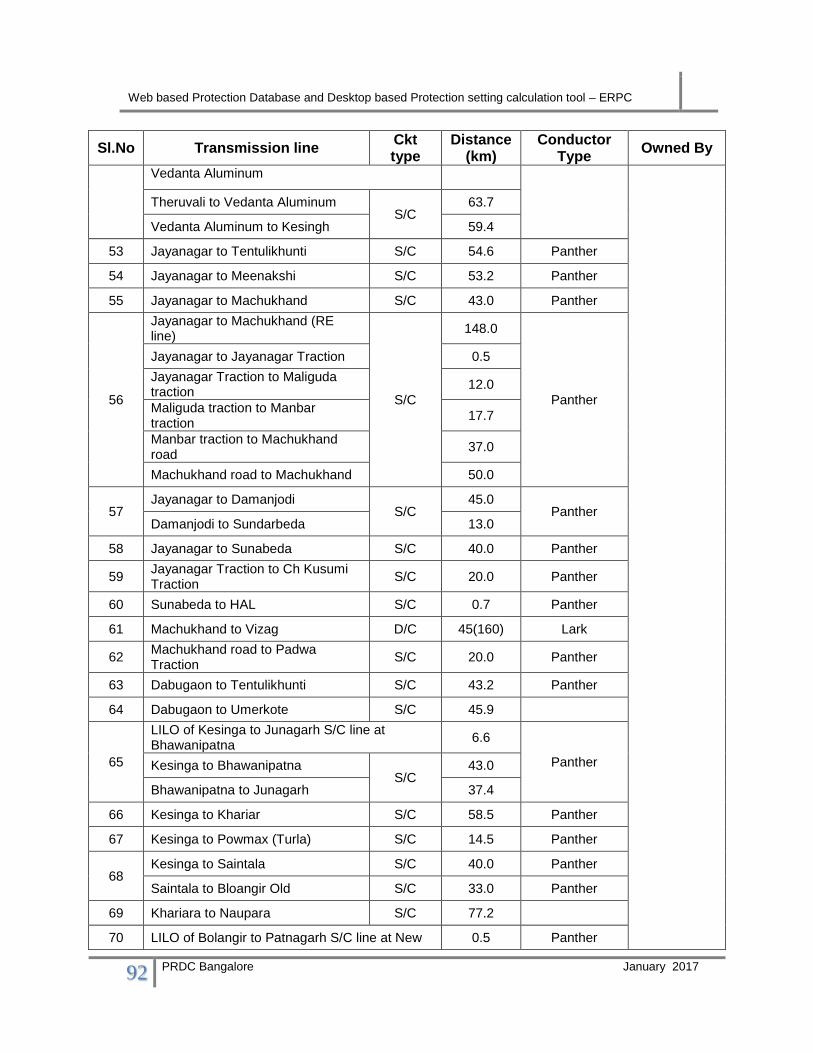
Web based Protection Database and Desktop based Protection setting calculation tool – ERPC
92 PRDC Bangalore January 2017
Sl.No Transmission line Ckt type
Distance (km)
Conductor Type
Owned By
Vedanta Aluminum
Theruvali to Vedanta Aluminum S/C
63.7
Vedanta Aluminum to Kesingh 59.4
53 Jayanagar to Tentulikhunti S/C 54.6 Panther
54 Jayanagar to Meenakshi S/C 53.2 Panther
55 Jayanagar to Machukhand S/C 43.0 Panther
56
Jayanagar to Machukhand (RE line)
S/C
148.0
Panther
Jayanagar to Jayanagar Traction 0.5
Jayanagar Traction to Maliguda traction
12.0
Maliguda traction to Manbar traction
17.7
Manbar traction to Machukhand road
37.0
Machukhand road to Machukhand 50.0
57 Jayanagar to Damanjodi
S/C 45.0
Panther Damanjodi to Sundarbeda 13.0
58 Jayanagar to Sunabeda S/C 40.0 Panther
59 Jayanagar Traction to Ch Kusumi Traction
S/C 20.0 Panther
60 Sunabeda to HAL S/C 0.7 Panther
61 Machukhand to Vizag D/C 45(160) Lark
62 Machukhand road to Padwa Traction
S/C 20.0 Panther
63 Dabugaon to Tentulikhunti S/C 43.2 Panther
64 Dabugaon to Umerkote S/C 45.9
65
LILO of Kesinga to Junagarh S/C line at Bhawanipatna
6.6
Panther Kesinga to Bhawanipatna S/C
43.0
Bhawanipatna to Junagarh 37.4
66 Kesinga to Khariar S/C 58.5 Panther
67 Kesinga to Powmax (Turla) S/C 14.5 Panther
68 Kesinga to Saintala S/C 40.0 Panther
Saintala to Bloangir Old S/C 33.0 Panther
69 Khariara to Naupara S/C 77.2
70 LILO of Bolangir to Patnagarh S/C line at New 0.5 Panther

Web based Protection Database and Desktop based Protection setting calculation tool – ERPC
93 PRDC Bangalore January 2017
Sl.No Transmission line Ckt type
Distance (km)
Conductor Type
Owned By
Bolangir
Bolangir to New Bolangir S/C
3.0
New Bolangir to Patnagarh 39.8
71 Bolangir to Bolangir New S/C 3.0 Panther
72
LILO of New Bolangir to Bargarh S/C line at Barpali
Barpali to Bargarh S/C
26.0 Panther
New Bolangir to Barpali 60.0 Panther
73 Bolangir to Sonepur S/C 54.0 Panther
74 Sonepur to Boudh S/C 51.1 Panther
75 Patnagarh to Padampur S/C 44.6 Panther
76 Baragarh to ACC S/C 3.0 Panther
77
LILO of Chiplima to Bargarh S/C line at Katapali 12.7
Panther Chiplima to Katapali S/C
16.4
Katapali to Bargarh 38.5
78 Burla to Chiplima D/C 20.0 Panther
79
LILO at Katapali 8.5
Panther
LILO at Rairakhole 0.5
Burla to Katapali
S/C
11.1
Katapali to Rairakhole Tap 85.2
Rairakhole Tap to Sambalpur 0.4
Rairakhole Tap to Rairakhole 65.3
Rairakhole to Boinda 89.9
80 Burla to Hindalco D/C 8.3 Panther
81
LILO at Sambhalpur 0.5
Panther
LILO at Shyam DRI 29.4
LILO at Aryan ispat 6.9
Burla to Sambalpur
S/C
19.9
Sambalpur to Shyam DRI 33.0
Shyam DRI to Aryan Steel 10.0
82 Aryan Steel to Lapanga S/C 5.0
83 Lapanga to SMC S/C 12.0 Panther

Web based Protection Database and Desktop based Protection setting calculation tool – ERPC
94 PRDC Bangalore January 2017
Sl.No Transmission line Ckt type
Distance (km)
Conductor Type
Owned By
SMC to Kuchinda 53.3 Panther
Kuchinda to Rajgangpur 100.7 Panther
Burla to Rajganpur Tap to Bamra traction
5.0 Panther
Rajgangpur to Trakera 28.4 Panther
Trakera to Raurkela 3.0 Panther
84 Lapanga to Burla D/C 57.3 Panther
Bhudipadar to Lapanga D/C 16.4 Panther
OPTCL
85 Bhudipadar to Sundargarh D/C 29.9 Panther
86 Bhudipadar to Brajaraj Nagar S/C 11.7 Panther
87 Bhudipadar to MSP S/C 0.6 Panther
88 Bhudipadar to Jharsuguda S/C 7.0 Panther
89
LILO of Bhudipadar to Tarkera S/C Line at Rajgangpur
1.2
Panther Bhudipadar to Rajgangpur S/C
81.0
Rajgangpur to Tarkera 29.0
90 Bhudipadar to Kalugaon S/C 95.0 Panther
Kalugaon to Tarkera S/C 15.0
91 Bhudipadar to MCL D/C 23.0 Panther
92 Jharsuguda to Jharsuguda Traction S/C 0.2 Panther
93 Jharsuguda to Action ispat S/C 1.6 Panther
94 Jharsuguda to L&T D/C 15.7 Panther
95 Rajgangpur to OCL S/C 0.5 Panther
96 Rajgangpur to Rajgangpur Traction D/C 2.1 Panther
97 Tarkera to Rourkela D/C 3.0 Panther
98 Tarkera to RSP 3 11.0 Panther
99 Tarkera to Chhend D/C 6.2 Panther
100 Chhend to NugaonTraction S/C 36.0 Panther
101 Chhend to Adhunik S/C 21.0 Panther
102 Adhunik to Sriganesh S/C 2.0 Panther
103
LILO at Barbil 1.4
Panther OPTCL LILO at Arya 0.5
LILO at Beekey 2.4
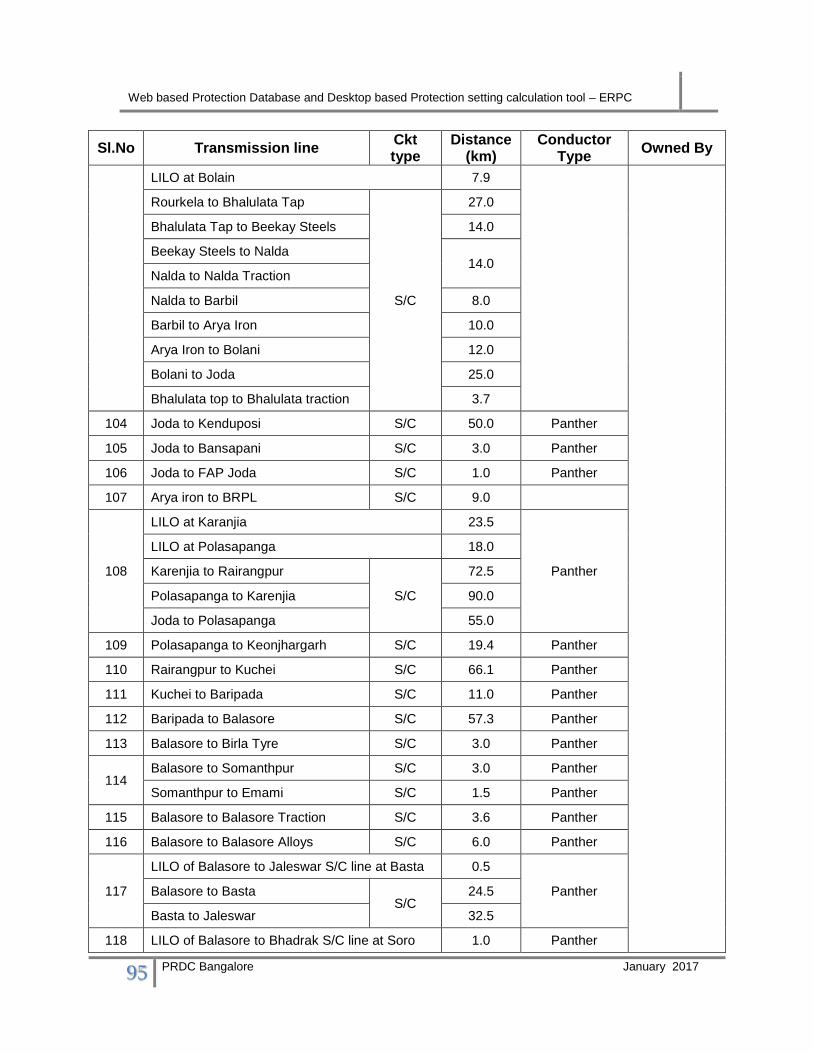
Web based Protection Database and Desktop based Protection setting calculation tool – ERPC
95 PRDC Bangalore January 2017
Sl.No Transmission line Ckt type
Distance (km)
Conductor Type
Owned By
LILO at Bolain 7.9
Rourkela to Bhalulata Tap
S/C
27.0
Bhalulata Tap to Beekay Steels 14.0
Beekay Steels to Nalda 14.0
Nalda to Nalda Traction
Nalda to Barbil 8.0
Barbil to Arya Iron 10.0
Arya Iron to Bolani 12.0
Bolani to Joda 25.0
Bhalulata top to Bhalulata traction 3.7
104 Joda to Kenduposi S/C 50.0 Panther
105 Joda to Bansapani S/C 3.0 Panther
106 Joda to FAP Joda S/C 1.0 Panther
107 Arya iron to BRPL S/C 9.0
108
LILO at Karanjia 23.5
Panther
LILO at Polasapanga 18.0
Karenjia to Rairangpur
S/C
72.5
Polasapanga to Karenjia 90.0
Joda to Polasapanga 55.0
109 Polasapanga to Keonjhargarh S/C 19.4 Panther
110 Rairangpur to Kuchei S/C 66.1 Panther
111 Kuchei to Baripada S/C 11.0 Panther
112 Baripada to Balasore S/C 57.3 Panther
113 Balasore to Birla Tyre S/C 3.0 Panther
114 Balasore to Somanthpur S/C 3.0 Panther
Somanthpur to Emami S/C 1.5 Panther
115 Balasore to Balasore Traction S/C 3.6 Panther
116 Balasore to Balasore Alloys S/C 6.0 Panther
117
LILO of Balasore to Jaleswar S/C line at Basta 0.5
Panther Balasore to Basta S/C
24.5
Basta to Jaleswar 32.5
118 LILO of Balasore to Bhadrak S/C line at Soro 1.0 Panther

Web based Protection Database and Desktop based Protection setting calculation tool – ERPC
96 PRDC Bangalore January 2017
Sl.No Transmission line Ckt type
Distance (km)
Conductor Type
Owned By
Balasore to Soro S/C
34.8
Soro to Bhadrak 40.3
119 Jaleswar to Jaleswar Traction S/C 2.0 Panther
120 Bhadrak to Dhamara Traction S/C 36.0 Panther
121 Bhadrak to Dhamara Port S/C 65.0 Panther
122 Bhadrak to FACOR S/C 4.6 Panther
123 Bhadrak to Bhadrak Traction S/C 8.5 Panther
124
LILO of Bhadrak to Jajpur road S/C at Jajpur Town
10.5
Panther Jajpur road to Jajpur Town S/C
28.0
Jajpur Town to Bhadrak 38.0
125 Jajpur Road to Anadapur S/C 29.4 Panther
126 Jajpur Road to Kendrapara S/C 63.0 Panther
127
LILO of Jajpur Road to Kendrapara S/C line at Chandikhole
1.6
Panther Jajpur Road to Chandikhole S/C
32.0
Chandikhole to Kendrapara 34.1
128 Jajpur Road to Duburi D/C 13.0 Panther
129 Kendrapara to Pattamundai S/C 19.5 Panther
130 Kendrapara to Paradeep S/C 34.8 Panther
131 Kendrapara to Marshghai
S/C 12.0 Panther
Marshghai to Paradeep 31.5 Panther
132 Paradip to IFFCO D/C 7.2 Panther
133 Paradip to PPT D/C 7.7 Panther
134 Paradip to PPL D/C 6.2 Panther
135 Duburi to MISRILAL (MSL) S/C 9.0 Panther
136 Duburi to MESCO S/C 5.0 Panther
137
LILO of Duburi to MESCO S/C line at BRPL 2.8
Panther Duburi to BRPL S/C
4.0
BRPL to MESCO 6.5
138 Duburi to Jakhpur Traction S/C 13.2 Panther
139
LILO of Duburi -TISCO (Bamanipal) S/C Line at B.C.Mohanty
Panther
Duburi to B.C. Mohanty S/C 8.0
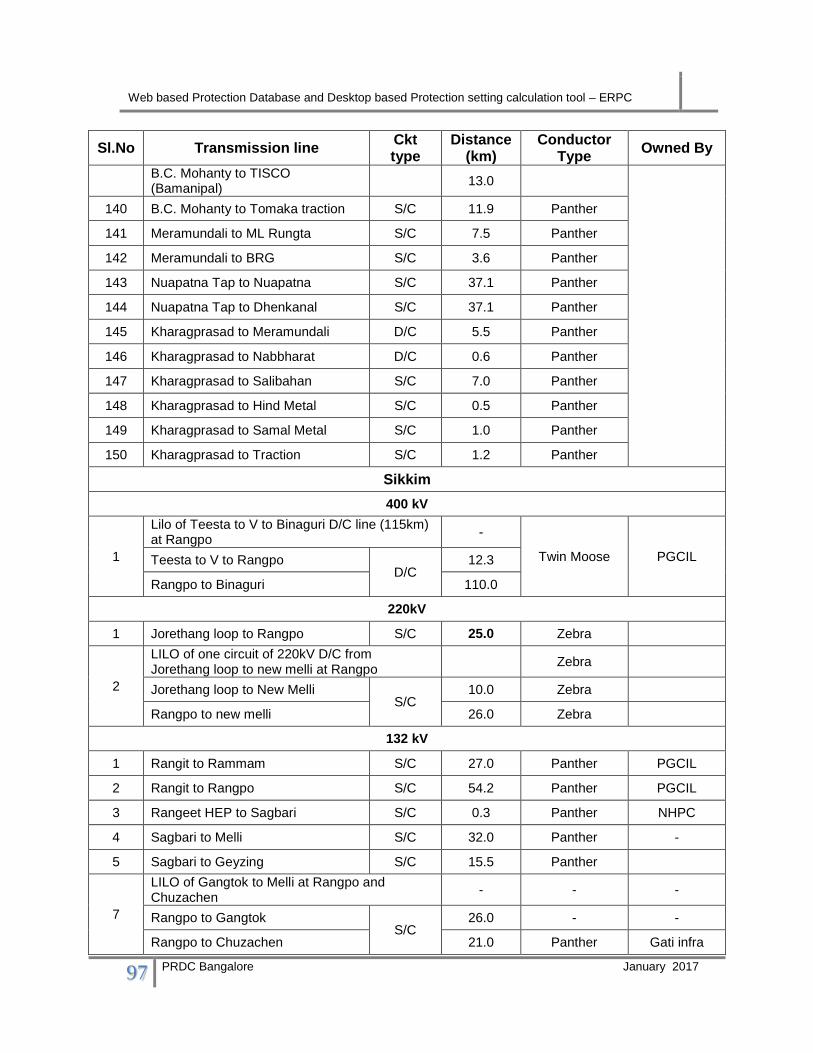
Web based Protection Database and Desktop based Protection setting calculation tool – ERPC
97 PRDC Bangalore January 2017
Sl.No Transmission line Ckt type
Distance (km)
Conductor Type
Owned By
B.C. Mohanty to TISCO (Bamanipal)
13.0
140 B.C. Mohanty to Tomaka traction S/C 11.9 Panther
141 Meramundali to ML Rungta S/C 7.5 Panther
142 Meramundali to BRG S/C 3.6 Panther
143 Nuapatna Tap to Nuapatna S/C 37.1 Panther
144 Nuapatna Tap to Dhenkanal S/C 37.1 Panther
145 Kharagprasad to Meramundali D/C 5.5 Panther
146 Kharagprasad to Nabbharat D/C 0.6 Panther
147 Kharagprasad to Salibahan S/C 7.0 Panther
148 Kharagprasad to Hind Metal S/C 0.5 Panther
149 Kharagprasad to Samal Metal S/C 1.0 Panther
150 Kharagprasad to Traction S/C 1.2 Panther
Sikkim
400 kV
1
Lilo of Teesta to V to Binaguri D/C line (115km) at Rangpo
-
Twin Moose PGCIL Teesta to V to Rangpo D/C
12.3
Rangpo to Binaguri 110.0
220kV
1 Jorethang loop to Rangpo S/C 25.0 Zebra
2
LILO of one circuit of 220kV D/C from Jorethang loop to new melli at Rangpo
Zebra
Jorethang loop to New Melli S/C
10.0 Zebra
Rangpo to new melli 26.0 Zebra
132 kV
1 Rangit to Rammam S/C 27.0 Panther PGCIL
2 Rangit to Rangpo S/C 54.2 Panther PGCIL
3 Rangeet HEP to Sagbari S/C 0.3 Panther NHPC
4 Sagbari to Melli S/C 32.0 Panther -
5 Sagbari to Geyzing S/C 15.5 Panther
7
LILO of Gangtok to Melli at Rangpo and Chuzachen
- - -
Rangpo to Gangtok S/C
26.0 - -
Rangpo to Chuzachen 21.0 Panther Gati infra

Web based Protection Database and Desktop based Protection setting calculation tool – ERPC
98 PRDC Bangalore January 2017
Sl.No Transmission line Ckt type
Distance (km)
Conductor Type
Owned By
Gangtok to Chuzachen 48.6 Panther+Zebra Sikkim
8 Melli to NJP S/C 90.0 Panther
PGCIL 9 Melli to Rangpo S/C 16.6 Panther
10 Rangit to Kurseong S/C 68.0 Panther
66 kV
1 LLHP G/T to Ranipool D/C 0.2 Dog
Sikkim Gov
2 Ranipool to Gangtok PGCIL S/C 0.7 Dog
3 Ranipool to Pakyong S/C 12.0 Dog
4 Pakyong to Rongli S/C 21.0 Dog
5 Ranipool to Topakhani S/C 15.0 Dog
6 Tadong to Gangatok PGCIL S/C 8.0 Dog
7 Tadong to Sichey S/C 5.0 Dog
8 Tadong to Phudong S/C 18.0 Dog
9 Sichey to Bulbuley S/C 4.0 Dog
10 Bulbuley to Gangatok PGCIL S/C 10.0 Dog
11 Mangan to Meyong HEP S/C 12.0 Dog
12 Mangan to Phudong S/C 20.0 Dog
13 Rongli HEP to Rongli S/C 4.9 Dog
14 Rongali to Rhenock S/C 12.0 Dog
15 Geyzing 132kV to Geyzing 66kV S/C 0.2 Dog
16 Geyzing 132kV to Pelling S/C 2.1 Dog
17 Geyzing to Namchi S/C 25.0 Dog
18 Melli 132kV to Melli 66kV S/C 0.1 Dog
19 Melli 66kV to Purano Namchi S/C 22.0 Dog
20 Melli 66kV to Namchi S/C 22.0 Dog
21 Melli 66kV to Mamring S/C 18.0 Dog
22 Melli 66kV To Kalingpong D/C 15.0 Dog
23 Rangit HEP to Ravangla S/C 13.0 Dog
24 Purno Namchi to Rohatak S/C 9.0 Dog
25 Rohtak to Soreng S/C 11.0 Dog
West Bengal
400 kV

Web based Protection Database and Desktop based Protection setting calculation tool – ERPC
99 PRDC Bangalore January 2017
Sl.No Transmission line Ckt type
Distance (km)
Conductor Type
Owned By
1 Jeerat to KTPS S/C 136.0 Twin Moose WBSETCL
2 Jeerat to Bakreswar S/C 163.0 Twin Moose
3 Jeerat to Behrampur S/C 200.0 Twin Moose
PGCIL
4 Jeerat to Subhashgram S/C 80.0 Twin Moose
5 Farakka (NTPC) to Behrampur S/C 73.0 Twin Moose
6 Sagardighi to Behrampur D/C 26.0 HTLS
7 Behrampur to Behramara (Bangladesh)
D/C 71* Twin Moose
8 Subhashgram to Haldia D/C 90.0 Twin Moose CESC
9 Sagardighi to Subhashgram S/C 246.0 Twin Moose PGCIL
10 Farakka (NTPC) to Sagardighi S/C 67.0 Twin Moose
PGCIL 11 Farakka (NTPC) to Kahalgaon I, II, III & IV
4 95.0 Twin Moose
12 Farakka (NTPC) to Malda D/C 40.0 Twin Moose
13 Sagardighi to Parulia (PGCIL) D/C 171.0 Twin Moose
WBSETCL 14 Arambag to KTPS S/C 78.0 Twin Moose
15 KTPS to Kharagpur S/C 95.0 Twin Moose
16 KTPS to Kharagpur S/C 91.0 Twin Moose
17 Kharagpur to Baripada S/C 98.0 Twin Moose WBSETCL &
OPTCL
18 PPSP to Arambag D/C 210.0 Twin Moose
WBSETCL 19 PPSP to Bidhanagar D/C 183.5 Twin Moose
20 Parulia (PGCIL) to Bidhanagar (Durgapur)
D/C 11.0 Twin Moose
21 Parulia (PGCIL) to Jamshedpur S/C 177.0 Twin Moose PGCIL
22 Durgapur (DSTPS) to Raghunathpur (RTPS)
D/C 70.5 Twin Moose DVC
23 Maithon to Raghunathpur (RTPS)
S/C 52.9
Twin Moose DVC & PGCIL Raghunathpur (RTPS) to Ranchi 169.0
24 Raghunathpur (RTPS) to Ranchi D/C 155.0 Quard Moose DVC
25 Durgapur (DSTPS) to Jamshedpur PG
D/C 161.0 Twin Moose DVC & PGCIL
26 Maithon to Mejia B
S/C 84.0
Twin Moose
PGCIL Mejia B to Jamshedpur 168.0
26 Maithon to Mejia B D/C 59.0 Twin Moose
26 Malda (PGCIL) to Purnea D/C 167.0 Twin Moose

Web based Protection Database and Desktop based Protection setting calculation tool – ERPC
100 PRDC Bangalore January 2017
Sl.No Transmission line Ckt type
Distance (km)
Conductor Type
Owned By
27 Binaguri (PGCIL) to Purnia I & II D/C 168.0 Twin Moose
28 Binaguri (PGCIL) to Purnia III & IV D/C 160.0 Quad Moose
29 Binaguri (PGCIL) to Malbase S/C 121* Twin Moose
30 Binaguri (PGCIL) to Rangpo - I S/C 110.0 Twin Moose
31 Binaguri (PGCIL) to Rangpo - II S/C 110.0 Twin Moose
32 Binaguri (PGCIL) to Bongaigaon D/C 217.0 Twin Moose
33 Binaguri (PGCIL) to Bongaigaon D/C 220.0 Quad Moose
34 Binaguri (PGCIL) to Tala IV S/C 98* Twin Moose
35 Binaguri (PGCIL) to Tala I & II D/C 115* Twin Moose
36 Farakka (NTPC) to Parulia (PGCIL) D/C 150.0 Twin Moose
37 Arambag to Bakreswar S/C 130.0 Twin Moose WBSETCL
38 Maithon to Parulia (PGCIL) D/C 70.7 Twin Moose
PGCIL 39 Bidhannagar to Arambag S/C 115.0 Twin Moose
40 KTPS to Chaibasa S/C 70.0 Twin Moose
41 Kharagpur to Chaibasa S/C 161.0 Twin Moose
220 kV
1 Bakreswar to Bidhanagar D/C 40.0 Zebra WBSETCL
2 Bidhanagar to Waria (DTPS) D/C 17.2 ACSR DEER DVC
3 Bidhanagar to DPL D/C 10.0 Zebra
WBSETCL 4 Gokarna to Bakreswar D/C 81.0 Zebra
5 Jeerat to New Town D/C 40.0 Zebra
6 KTPS to Howrah D/C 71.0 Zebra
7 NJP (WB) to Binaguri D/C 6.0 Zebra PGCIL
8 J K nagar to Bidhanagar S/C 40.5 Deer+Zebra WBSETCL/IPCL 9 J K Nagar to STPS S/C 89.9 Deer+Zebra
10 STPS to New Bishnupur S/C 145.5 Zebra
WBSETCL 11 Subhasgram (WB) to Subhasgram (PG)
D/C 0.6 Moose
12 Kharagpur to Midnapur D/C 45.6 Zebra
13 Dalkhola to Dalkhola (PG) D/C 1.0 Zebra
PGCIL 14
Dalkhola PG to Kishanganj D/C 31.0 Zebra
Kishanganj to Siliguri (PG) D/C 108.0 Zebra

Web based Protection Database and Desktop based Protection setting calculation tool – ERPC
101 PRDC Bangalore January 2017
Sl.No Transmission line Ckt type
Distance (km)
Conductor Type
Owned By
15 Dalkhola PG to Purnea D/C 41.0 Zebra
16 Dalkhola PG to Malda D/C 116.0 Zebra
17 Binaguri to Siliguri (PG) D/C 6.0 Zebra
18 Binaguri to Birpara D/C 80.0 Zebra
19 Birpara to Salakati (NER) D/C 160.0 Zebra
20 Birpara to Malbase S/C 40.0 Zebra
21 Birpara to Chukha D/C 38.0 Zebra PGCIL
22 Gokarna to Sagardighi D/C 40.0 Zebra WBSETCL
23 Farakka to Lalmatia S/C 79.0 Zebra PGCIL
24 STPS to Chandil S/C 98.0 Zebra WBSETCL &
JSEB
25 Subhashgram (PG) to Newtown (WBSETCL)
S/C 24.0 Zebra WBSETCL
26 Kasba to EMSS S/C 1.0 Single Core
XLPE
CESC
27 Subhasgram (PG) to EMSS (CESC)
D/C 23.2 ACSR Moose
28 EMSS to Budge Budge G.S (BBGS)
D/C 85.0 Moose
D/C 2.5 800 sqmm,
XLPE
29 NCGS to EMSS D/C 19.0 800 sqmm,
XLPE
30 Arambagh to Midnapore D/C 71.0 Zebra
WBSETCL
31 Arambagh to Rishra S/C 73.0 Zebra
32 Arambag to New Bishnupur D/C 49.0 Zebra
33 Bakreswar to Satgachia D/C 132.0 Zebra
34 Domjur to Arambagh D/C 58.0 Zebra
35 Howrah to Foundry Park D/C 34.0 Zebra
36 Foundry Park to Domjur D/C 14.5 Zebra
37 Jeerat to Satgachia D/C 78.0 Zebra
38 Kasba to Jeerat D/C 55.0 Zebra
39 Kasba to Subhasgram (WB) D/C 22.0 Zebra
40 Krishnanagar to Satgachia D/C 52.0 Zebra
41 NJP (WB) to TLDP‐III S/C 80.8 Zebra
42 NJP (WB) to TLDP‐IV D/C 145.0 Zebra
43 New Haldia to KTPS D/C 56.0 Zebra

Web based Protection Database and Desktop based Protection setting calculation tool – ERPC
102 PRDC Bangalore January 2017
Sl.No Transmission line Ckt type
Distance (km)
Conductor Type
Owned By
44 Bidhanagar to Asansol S/C 114.0 Zebra
45 STPS to Asansol S/C 62.0 Zebra
46 STPS to Hura S/C 45.3 Zebra
47 Hura to New Bishnupur S/C 131.8 Zebra
48 Subhasgram (WB) to Lakshmikantapur
D/C 43.0 Zebra
49 Jeerat to Rishra S/C 70.0 Zebra
50 Jeerat to Dharampur S/C 32.5 Zebra
51 Dharampur to Rishra S/C 32.5 Zebra
52 Malbase to Chukha S/C 36.0 Zebra PGCIL
53 Subhasgram (PG) to Bantala - CLC (WB)
S/C 20.7 Zebra WBSETCL
54 Bantala (CLC) to New town S/C 20.0 Zebra
55 Kalyanisweri to Maithon (Pithakari) PGCIL
D/C 7.6 Zebra PGCIL
56 Maithon(Pithakari) to Dhanbad D/C 52.0 Zebra
57 Mejia to Borjora D/C 8.5 ACSR Zebra
DVC
58 Mejia to Muchipara (Durgapur) D/C 31.5 Zebra
59 Muchipara (Durgapur) to Parulia (DVC)
D/C 14.8 Zebra
60 Parulia (DVC) to Tumla 3 6.0 Zebra
61 Burnpur to IISCO D/C 1.2 AAAC ZEBRA
62 Mejia (DVC) to Waria DTPS (DVC) D/C 42.0 Zebra
63 Waria (DTPS) to Parulia (DVC) D/C 22.0 Zebra
64 Parulia (DVC) to Parulia (PG) D/C 1.0 Zebra
65 Mejia to Kalyanswari S/C 54.9 Zebra
66 Mejia to Burnpur S/C 58.2 Zebra
67 Burnpur to Kalyanswari S/C 22.0 Zebra DVC
68 Gokarna to Krishnanagar D/C 105.0 Zebra WBSETCL
69 Kharagpur to Vidyasagar Park D/C 100.0 Zebra
132 kV
1 Adisaptagram to Belmuri D/C 32.0 Panther
WBSETCL 2 Adisaptagram to BTPS D/C 10.0 Panther
3 Alipurduar to Coochbehar S/C 19.0 Panther
4 Amtala to Debagram D/C 40.5 Panther
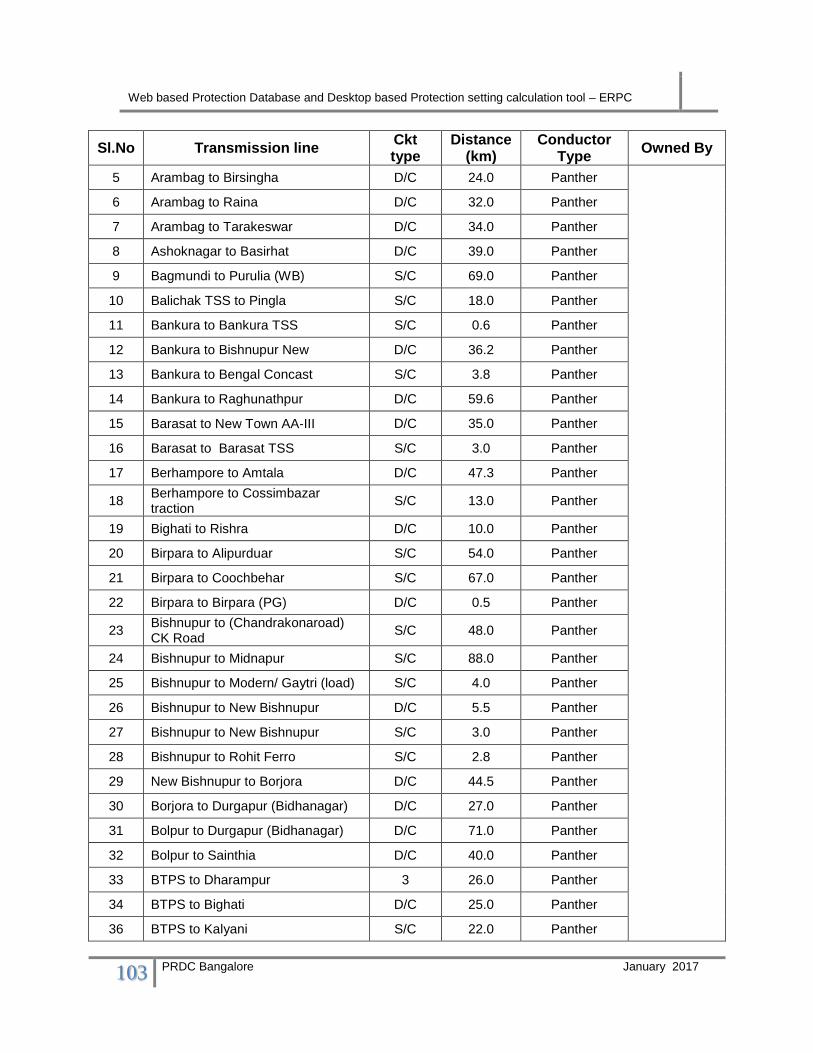
Web based Protection Database and Desktop based Protection setting calculation tool – ERPC
103 PRDC Bangalore January 2017
Sl.No Transmission line Ckt type
Distance (km)
Conductor Type
Owned By
5 Arambag to Birsingha D/C 24.0 Panther
6 Arambag to Raina D/C 32.0 Panther
7 Arambag to Tarakeswar D/C 34.0 Panther
8 Ashoknagar to Basirhat D/C 39.0 Panther
9 Bagmundi to Purulia (WB) S/C 69.0 Panther
10 Balichak TSS to Pingla S/C 18.0 Panther
11 Bankura to Bankura TSS S/C 0.6 Panther
12 Bankura to Bishnupur New D/C 36.2 Panther
13 Bankura to Bengal Concast S/C 3.8 Panther
14 Bankura to Raghunathpur D/C 59.6 Panther
15 Barasat to New Town AA‐III D/C 35.0 Panther
16 Barasat to Barasat TSS S/C 3.0 Panther
17 Berhampore to Amtala D/C 47.3 Panther
18 Berhampore to Cossimbazar traction
S/C 13.0 Panther
19 Bighati to Rishra D/C 10.0 Panther
20 Birpara to Alipurduar S/C 54.0 Panther
21 Birpara to Coochbehar S/C 67.0 Panther
22 Birpara to Birpara (PG) D/C 0.5 Panther
23 Bishnupur to (Chandrakonaroad) CK Road
S/C 48.0 Panther
24 Bishnupur to Midnapur S/C 88.0 Panther
25 Bishnupur to Modern/ Gaytri (load) S/C 4.0 Panther
26 Bishnupur to New Bishnupur D/C 5.5 Panther
27 Bishnupur to New Bishnupur S/C 3.0 Panther
28 Bishnupur to Rohit Ferro S/C 2.8 Panther
29 New Bishnupur to Borjora D/C 44.5 Panther
30 Borjora to Durgapur (Bidhanagar) D/C 27.0 Panther
31 Bolpur to Durgapur (Bidhanagar) D/C 71.0 Panther
32 Bolpur to Sainthia D/C 40.0 Panther
33 BTPS to Dharampur 3 26.0 Panther
34 BTPS to Bighati D/C 25.0 Panther
36 BTPS to Kalyani S/C 22.0 Panther

Web based Protection Database and Desktop based Protection setting calculation tool – ERPC
104 PRDC Bangalore January 2017
Sl.No Transmission line Ckt type
Distance (km)
Conductor Type
Owned By
37 BTPS to Khanyan S/C 18.0 Panther
38 BTPS to Satgachia S/C 55.0 Panther
39 Chanditala to Rishra D/C 6.0 Panther
40 CK Road to Ck Road Traction S/C 5.0 Panther
41 Contai to Egra S/C 32.0 Panther
42 Contai to New Haldia S/C 77.0 Panther
43 Dalkhola to Raigaunj D/C 51.0 Panther
44 Dalkhola to TCF PS ‐ III D/C 95.0 Panther
45 Dankuni to Hind Motor S/C 7.0 Panther
46 Dankuni to Liluah S/C 8.0 Panther
47 Debagram to Debagram TSS S/C 6.0 Panther
48 Debagram to Katwa D/C 35.0 Panther
49 Dharampur to Kalyani S/C 10.0 Panther
50 Dharampur to Ranaghat D/C 26.0 Panther
51 Dharampur to Titagarh D/C 29.0 Panther
52 Dhulian to Farakka S/C 22.0 Panther
53 Domjur to Jangipara D/C 17.0 Panther
54 Domjur to Uluberia D/C 27.0 Panther
55 Durgapur (Bidhanagar) to DPL D/C 10.0 Panther
56 Durgapur (Bidhanagar) to Mankar D/C 30.0 Panther
57 Durgapur (Bidhanagar) to Ukhra D/C 22.5 Panther
58 Egra to New Haldia S/C 100.0 Panther
59 Gangarampur to Balurghat S/C 35.0 Panther
60 Gokarna to Katwa D/C 57.0 Panther
61 Gokarna to Berhampore D/C 18.0 Panther
62 Gokarna to Lalgola S/C 46.8 Panther
63 Gokarna to Lalgola S/C 67.0 Panther
64 Lalgola to Raghunathganj S/C 27.0 Panther
65 Gokarna to Raghunathganj S/C 42.0 Panther
66 Gokarna to Rampurhat S/C 63.0 Panther
67 Gokarna to Kuli S/C 23.6 Panther
68 Haldia to Haldia NIZ D/C 22.0 Panther
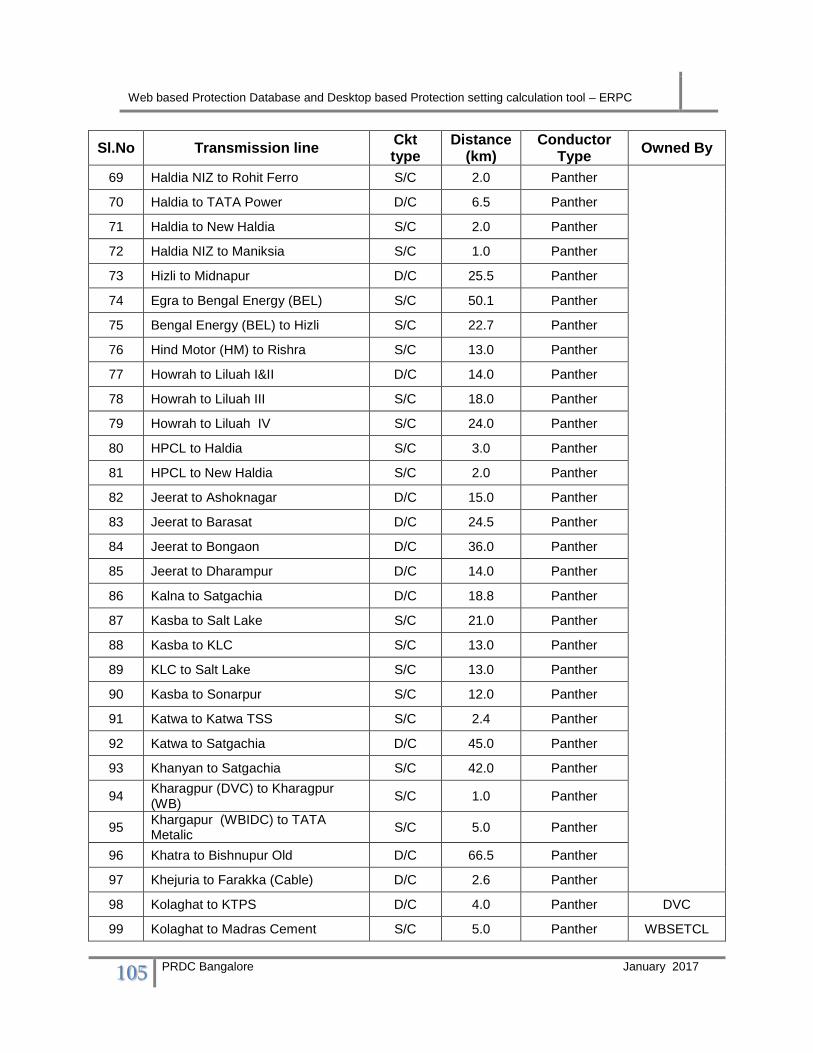
Web based Protection Database and Desktop based Protection setting calculation tool – ERPC
105 PRDC Bangalore January 2017
Sl.No Transmission line Ckt type
Distance (km)
Conductor Type
Owned By
69 Haldia NIZ to Rohit Ferro S/C 2.0 Panther
70 Haldia to TATA Power D/C 6.5 Panther
71 Haldia to New Haldia S/C 2.0 Panther
72 Haldia NIZ to Maniksia S/C 1.0 Panther
73 Hizli to Midnapur D/C 25.5 Panther
74 Egra to Bengal Energy (BEL) S/C 50.1 Panther
75 Bengal Energy (BEL) to Hizli S/C 22.7 Panther
76 Hind Motor (HM) to Rishra S/C 13.0 Panther
77 Howrah to Liluah I&II D/C 14.0 Panther
78 Howrah to Liluah III S/C 18.0 Panther
79 Howrah to Liluah IV S/C 24.0 Panther
80 HPCL to Haldia S/C 3.0 Panther
81 HPCL to New Haldia S/C 2.0 Panther
82 Jeerat to Ashoknagar D/C 15.0 Panther
83 Jeerat to Barasat D/C 24.5 Panther
84 Jeerat to Bongaon D/C 36.0 Panther
85 Jeerat to Dharampur D/C 14.0 Panther
86 Kalna to Satgachia D/C 18.8 Panther
87 Kasba to Salt Lake S/C 21.0 Panther
88 Kasba to KLC S/C 13.0 Panther
89 KLC to Salt Lake S/C 13.0 Panther
90 Kasba to Sonarpur S/C 12.0 Panther
91 Katwa to Katwa TSS S/C 2.4 Panther
92 Katwa to Satgachia D/C 45.0 Panther
93 Khanyan to Satgachia S/C 42.0 Panther
94 Kharagpur (DVC) to Kharagpur (WB)
S/C 1.0 Panther
95 Khargapur (WBIDC) to TATA Metalic
S/C 5.0 Panther
96 Khatra to Bishnupur Old D/C 66.5 Panther
97 Khejuria to Farakka (Cable) D/C 2.6 Panther
98 Kolaghat to KTPS D/C 4.0 Panther DVC
99 Kolaghat to Madras Cement S/C 5.0 Panther WBSETCL

Web based Protection Database and Desktop based Protection setting calculation tool – ERPC
106 PRDC Bangalore January 2017
Sl.No Transmission line Ckt type
Distance (km)
Conductor Type
Owned By
100 Krishnanagar to Bongaon D/C 53.0 Panther
101 Krishnanagar to Debagram D/C 46.0 Panther
102 Krishnanagar to Ranaghat D/C 33.4 Panther
103 KTPS to Tamluk D/C 19.0 Panther
104
KTPS to Uluberia
S/C
29.0
Panther KTPS to Bagnan 16.0
Bagnan to Uluberia 21.0
105 Kuli to Sainthia S/C 35.6 Panther
106 Laxmikantapur to Falta D/C 34.0 Panther
107 Laxshmikantapur to Kakdwip D/C 53.5 Panther
108 Liluah to BTPS S/C 58.0 Panther
109 Liluah to Rishra S/C 19.5 Panther
110 Liluah to Rishra S/C 36.0 Panther
111 Mahachanda to Mankar D/C 43.0 Panther
112 Mahachanda to Satgachia D/C 54.0 Panther
113 Malda to Balurghat Tap point S/C 98.4 Panther
114 Malda to Khejuriaghat D/C 35.0 Panther
115 Malda to Malda (PG) D/C 7.0 Panther
116 Malda to Raigaunj S/C 85.0 Panther
117 Malda to Samsi S/C 55.0 Panther
118 Midnapur to Khargapur (WBIDC) S/C 18.0 Panther
119 Midnapur to Balichak TSS S/C 26.0 Panther
120 Midnapur to Chandrakonaroad (CK Road)
S/C 46.0 Panther
121 Midnapur to Jhargram D/C 48.0 Panther
122 Midnapur to Pingla S/C 41.0 Panther
123 Moinaguri to Birpara S/C 43.0 Panther
124 Moinaguri to Mathabhanga S/C 50.0 Panther
125 Mathabhanga to Birpara S/C 83.8 Panther
126 Moinaguri to Chalsa S/C 43.0 Panther
127 Gokarna to Sonar Bangla S/C 47.2 Panther
128 Sonar Bangla to Lalgola S/C 28.4 Panther

Web based Protection Database and Desktop based Protection setting calculation tool – ERPC
107 PRDC Bangalore January 2017
Sl.No Transmission line Ckt type
Distance (km)
Conductor Type
Owned By
129 New Town AA‐III to New Town AA‐I S/C 8.3 Panther
130 New Town AA‐III to Salt Lake GIS S/C 15.0 Panther
131 New Town AA‐I to Salt Lake GIS S/C
S/C 11.1 Panther
132 NBU to Lebong S/C 66.0 Panther
133 NBU to NJP (PG) S/C 15.0 Panther
134 NBU to Rammam S/C 69.0 Panther
135 NBU to TCF PS ‐ I S/C 18.0 Panther
136 NJP (WB) to Chalsa S/C 78.0 Panther
137 NJP (WB) to Moinaguri S/C 41.0 Panther
138 NJP (WB) to TCF PS ‐ I S/C 16.0 Panther
139 Purulia (WB) to STPS D/C 35.0 Panther
140 Raghunathganj to Dhulian S/C 22.0 Panther
141 Raghunathganj to Farakka S/C 44.0 Panther
142 Raigaunj to Gangarampur S/C 75.0 Panther
143 Rampurhat to Sainthia S/C 38.0 Panther
144 Reshmi to TATA Metalic S/C 6.0 Panther
145 Samsi to Raigaunj S/C 68.0 Panther
146 Satgachia to Debagram TSS S/C 18.0 Panther
147 Siliguri to NJP (WB) D/C 16.0 Panther
148 Tamluk to Haldia NIZ D/C 46.0 Panther
149 Tarakeswar to Belmuri D/C 18.0 Panther
150 TCF PS ‐ I to TCF PS ‐ II S/C 16.0 Panther
151 TCF PS ‐ I to TCF PS ‐ III S/C 34.0 Panther
152 TCF PS ‐ II to TCF PS ‐ III S/C 20.0 Panther
153 Hura to Purulia(WB) D/C 15.9 Panther
154 Howrah to Foodpark S/C 20.0 Panther
155 Foodpark to Kolaghat S/C 37.0 Panther
156 Vidyasagarpark to Hizli TSS S/C 90.0 Panther
157 Vidyasagarpark to Hizli S/C 80.0 Panther
158 Hizli to Hizli TSS S/C 1.1 Panther
159 Midnapur to BRG steel Tap S/C 2.5 Panther
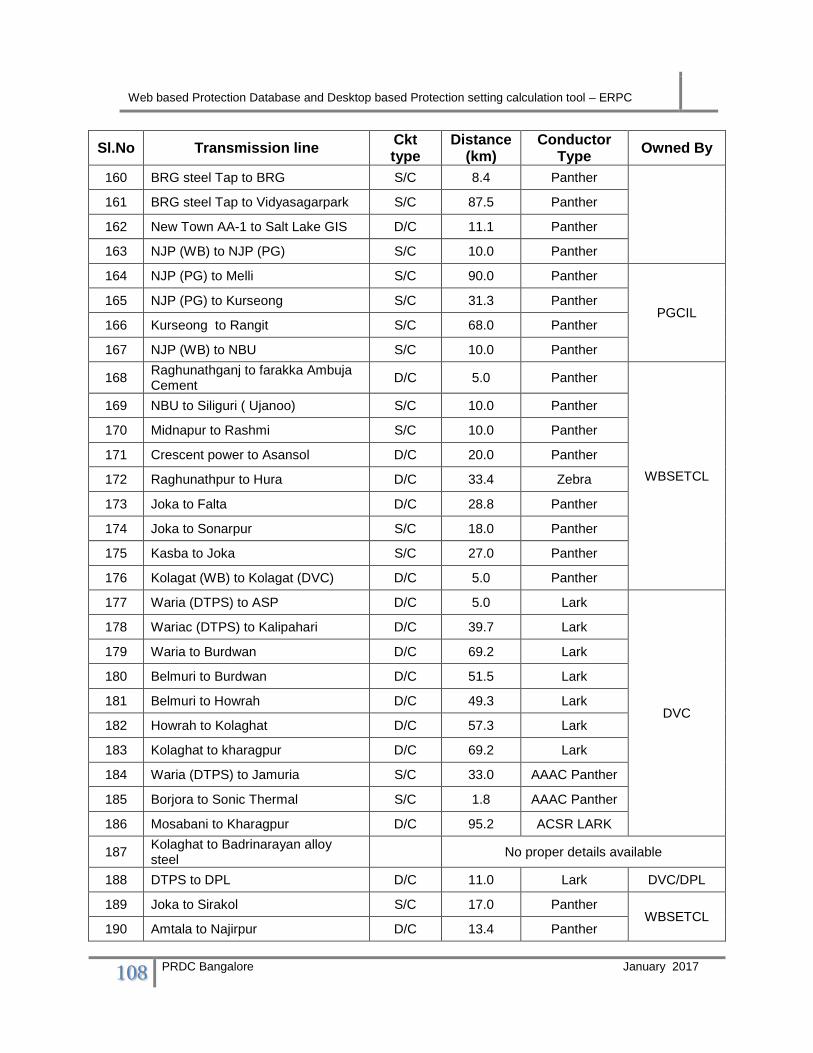
Web based Protection Database and Desktop based Protection setting calculation tool – ERPC
108 PRDC Bangalore January 2017
Sl.No Transmission line Ckt type
Distance (km)
Conductor Type
Owned By
160 BRG steel Tap to BRG S/C 8.4 Panther
161 BRG steel Tap to Vidyasagarpark S/C 87.5 Panther
162 New Town AA-1 to Salt Lake GIS D/C 11.1 Panther
163 NJP (WB) to NJP (PG) S/C 10.0 Panther
164 NJP (PG) to Melli S/C 90.0 Panther
PGCIL 165 NJP (PG) to Kurseong S/C 31.3 Panther
166 Kurseong to Rangit S/C 68.0 Panther
167 NJP (WB) to NBU S/C 10.0 Panther
168 Raghunathganj to farakka Ambuja Cement
D/C 5.0 Panther
WBSETCL
169 NBU to Siliguri ( Ujanoo) S/C 10.0 Panther
170 Midnapur to Rashmi S/C 10.0 Panther
171 Crescent power to Asansol D/C 20.0 Panther
172 Raghunathpur to Hura D/C 33.4 Zebra
173 Joka to Falta D/C 28.8 Panther
174 Joka to Sonarpur S/C 18.0 Panther
175 Kasba to Joka S/C 27.0 Panther
176 Kolagat (WB) to Kolagat (DVC) D/C 5.0 Panther
177 Waria (DTPS) to ASP D/C 5.0 Lark
DVC
178 Wariac (DTPS) to Kalipahari D/C 39.7 Lark
179 Waria to Burdwan D/C 69.2 Lark
180 Belmuri to Burdwan D/C 51.5 Lark
181 Belmuri to Howrah D/C 49.3 Lark
182 Howrah to Kolaghat D/C 57.3 Lark
183 Kolaghat to kharagpur D/C 69.2 Lark
184 Waria (DTPS) to Jamuria S/C 33.0 AAAC Panther
185 Borjora to Sonic Thermal S/C 1.8 AAAC Panther
186 Mosabani to Kharagpur D/C 95.2 ACSR LARK
187 Kolaghat to Badrinarayan alloy steel
No proper details available
188 DTPS to DPL D/C 11.0 Lark DVC/DPL
189 Joka to Sirakol S/C 17.0 Panther WBSETCL
190 Amtala to Najirpur D/C 13.4 Panther

Web based Protection Database and Desktop based Protection setting calculation tool – ERPC
109 PRDC Bangalore January 2017
Sl.No Transmission line Ckt type
Distance (km)
Conductor Type
Owned By
191 Rammam to Rangit S/C 27.0 Panther
192 Laxmikantapur to Sirakol D/C 35.2 Panther
193 Siliguri to Siliguri ( Ujanoo) S/C 10.0 Panther
194 Dalkhola to Kishengunj S/C 26.0 Panther
195 Lebong (Darjeling) to Rammam S/C 20.0 Panther
196 DPPS to B Zone D/C 1.6 Panther
DPL
197 DPPS to A Zone S/C 6.4 Panther
198 DPPS to C Zone D/C 4.8 Bison
199 DPPS to C1 Zone D/C 5.5 Panther
200 DPPS to AB Zone D/C 1.2 Panther
201 A Zone to Bamunara D/C 3.6 Panther
202 BBGS to Chakmir D/C 20.1 ACSR Moose
CESC
203 BBGS to Chakmir D/C 18.7 ACSR Moose
204 Chakmir to Majerhat D/C 6.1 XLPE 630
sqmm
205 Chakmir to Taratala D/C 5.4 XLPE 630
sqmm
206 Taratala to BBD Bag S/C 10.4 XLPE 630
sqmm
207 Taratala to PRS S/C 11.0 XLPE 630
sqmm
208 Majerhat to Taratala S/C 0.9 XLPE 630
sqmm
209 Jadavpore to Majerhat S/C 5.6 XLPE 630
sqmm
210 Majerhat to Southern D/C 6.4 XLPE 400
sqmm
211 Majerhat to PRS S/C 9.0 XLPE 400
sqmm
212 WBSETCL (Howrah) to Southern S/C 3.0 GF 161 sqmm
213 Botanical Garden to Southern D/C 2.2
XLPE 800 sq.mm( 1st
circuit) 2 x GF 161 sq.mm.
Cu.( 2nd circuit)
214 WBSETCL (Howrah) to B.Garden D/C 1.1
XLPE 630 sq.mm( 1st
circuit) 2 x GF 161 sq.mm.
Cu.( 2nd circuit)

Web based Protection Database and Desktop based Protection setting calculation tool – ERPC
110 PRDC Bangalore January 2017
Sl.No Transmission line Ckt type
Distance (km)
Conductor Type
Owned By
215 BBD Bag to PRS D/C 1.4 XLPE 630
sqmm
216 East Calcutta to PRS S/C 6.6 XLPE 630
sqmm
217 PRS to Park lane S/C 2.1 XLPE 800
sqmm
218 East Calcutta to BT road S/C 9.6 XLPE 630
sqmm
219 BT road to NCGS S/C 1.5 GF 260 sq.
mm. Cu
220 BT road to NCGS S/C 2.5 XLPE 800
sqmm
221 BT road to Titagarh S/C 9.3 XLPE 800
sqmm
222 Dum dum to BT road S/C 7.5 XLPE 800
sqmm
223 NCGS to Titagarh S/C 13.4 XLPE 400
sqmm
224 WBSETCL (Titagarh) to Titagarh D/C 0.5 GF 225 sq.
mm. Al.
225 WBSETCL (Lilooah) to Belur T/C 4.4 GF 161 sq.mm.
Cu
226 WBSETCL (Rishra) to Rishra D/C 6.4 XLPE 800
sqmm
227 EMSS to East Calcutta S/C 7.8 XLPE 800
sqmm
228 EMSS to PRS S/C 9.8 XLPE 800
sqmm
229 WBSETCL (Kasba) to EMSS T/C 0.4 XLPE 800
sqmm
230 EMSS to Jadavpore S/C 11.0 XLPE 630
sqmm
231 EMSS to Park lane S/C 7.0 XLPE 800
sqmm
232 EMSS to Patuli S/C 7.0 XLPE 800
sqmm
233 EMSS to DDSS S/C 17.3 XLPE 800
sqmm

Web based Protection Database and Desktop based Protection setting calculation tool – ERPC
111 PRDC Bangalore January 2017
Table C: State wise list of generators present in the Eastern region grid
Sl.No Name of the power station
Power station details
Owned By No. of units
Capacity of each
unit (MW)
Total capacity
(MW)
Bihar
State Sector
1 Barauni (BTPS) 2 110 220 BSPGCL
2 Muzaffarpur (Kanti) 2 110 220 Joint venture of
NTPC & BSEB 1 195 195
3 Eastern gandak canal HEP (Valmikinagar)
3 5 15 BSHPGCL
Central sector
1 Khalgoan 4 210
2340 NTPC 3 500
2 Barh STPP, St-II 2 660 1320
Jharkhand
State Sector
1 PTPS 1 110 110
2 TTPS 2 210 420
3 Subernrekha (SHPS) 2 65 130
DVC
1 Bokaro 'B' 3 210 630
DVC 1 500 500
2 Chandrapur 3 140
920 DVC 2 250
3 Koderma TPS 2 500 1000 DVC
4 Tiliya 2 2 4 DVC
5 Maithon dam 1 23.2
63.2 DVC 2 20
6 Panchet 2 40 80 DVC
7 MGT gen (Gas based) 3 27.5 82.5 DVC
CPP
1 Jojobera 3 120 427.5 Tata Steel

Web based Protection Database and Desktop based Protection setting calculation tool – ERPC
112 PRDC Bangalore January 2017
Sl.No Name of the power station
Power station details
Owned By No. of units
Capacity of each
unit (MW)
Total capacity
(MW)
1 67.5
2 Inland Power 1 70 70
3 Usha Martin Ltd. (Adityapur)
3 30
130 1 25
1 15
4 Usha Martin Ltd. (Ranchi) 2 10 20
5 Rungta mines 2 20 40
6 ABCIL 2 30 60
IPP
1 Adhunik Power Co. Ltd. 2 270 540
2 Maithon RB (MPL) 2 525 1050 Joint venture of DVC & TATA
Odisha
State sector
1 Burla power house (Hirakud-I)
2 49.5
275.5 OHPC 2 32
3 37.5
2 Chiplima power house (Hirakud-II)
3 24 72 OHPC
3 Balimela power house (HPS) 6 60
510 OHPC 2 75
4 Rengali power house (HPS) 5 50 250 OHPC
5 Upper Kolab power house (HPS) 4 80 320 OHPC
6 Upper Indravati hydro electric (HPS)
4 150 600 OHPC
7 Machhkund power house (HPS) 3 17
115.5 OHPC 3 21.5
8 IB thermal power station 2 210 420 OPGC
9 TTPS (NTPC- State dedicated) 4 60
460 NTPC 2 110
Central sector
1 Talcher super thermal power-I 2 500 3000 NTPC

Web based Protection Database and Desktop based Protection setting calculation tool – ERPC
113 PRDC Bangalore January 2017
Sl.No Name of the power station
Power station details
Owned By No. of units
Capacity of each
unit (MW)
Total capacity
(MW)
Talcher super thermal power-II 4 500
CPP
1 NALCO (Angul) 10 120 1200
2 RSP (Rourkela) 2 60
220 4 25
3 ICCL (IMFA), (Choudwara)
2 54
258 2 60
1 30
4 HPCL(HINDALCO), (Hirakud) 1 67.5
467.5 4 100
5 KMCL (NINL), (Duburi) 1 24
62.5 2 19.25
6 NBVL (Meramundali) 1 30
94 1 64
7 Bhusan Power & Steel, Jharsuguda
1 60
506 1 40
3 130
2 8
8 Vedanta (Lanjigarh) 3 30 90
9 Tata sponge iron (Joda) 1 18.5
26 1 7.5
10 Shyam DRI (Pandoli, Sambalpur) 1 33 33
11 Aarti steel (Ghantikhal, Cuttak) 1 40 40
12 Bhusan steel and strips (Meramundali)
1 33
410 1 77
2 150
13 Jindal stainless Ltd. (Duburi) 2 125
263 1 13
14 Vedanta (Jharsuguda) 9 135 1215
15 Visa steel (New Duburi) 3 25 75

Web based Protection Database and Desktop based Protection setting calculation tool – ERPC
114 PRDC Bangalore January 2017
Sl.No Name of the power station
Power station details
Owned By No. of units
Capacity of each
unit (MW)
Total capacity
(MW)
16 IFFCO (Paradeep) 2 55 110
17 SMC power generation Ltd. 1 8
33 1 25
18 Action ispat and power Ltd.
1 12
123 1 25
2 43
19 Aryan ispat and power Ltd. 1 18 18
20 EMAMI 1 15
20 1 5
21 Shree Ganesh 1 32 32
22 ACC ( Baragarh) 1 30 30
23 Jindal steel and power Ltd. (Angul)
6 135 810
24 Maithan ispat nigam Ltd. (Jajpur road)
1 30 30
25 MSP mettallics Ltd. 1 25 25
26 OCL India Ltd. 2 27 54
27 FACOR 1 45 45
1 55 55
28 HINDALCO (AAL) (Budhipadar) 4 150 600
29 Maheswari Ispat Pvt Ltd 2 12 24
IPP
1 Meenakshi power (Jayanagar) 3 4
37 2 12.5
2 Odisha power consortium Ltd. (Samal)
4 5 20
3 Aarati steel (Ghantikhal) 1 50 50
4 Sterlite energy Ltd. (Jharsuguda) 4 600 2400
5 GMR Kamalanga 3 350 1050
6 JITPL (Derang) 2 600 1200
7 Ind-Barath 1 350 350
Sikkim
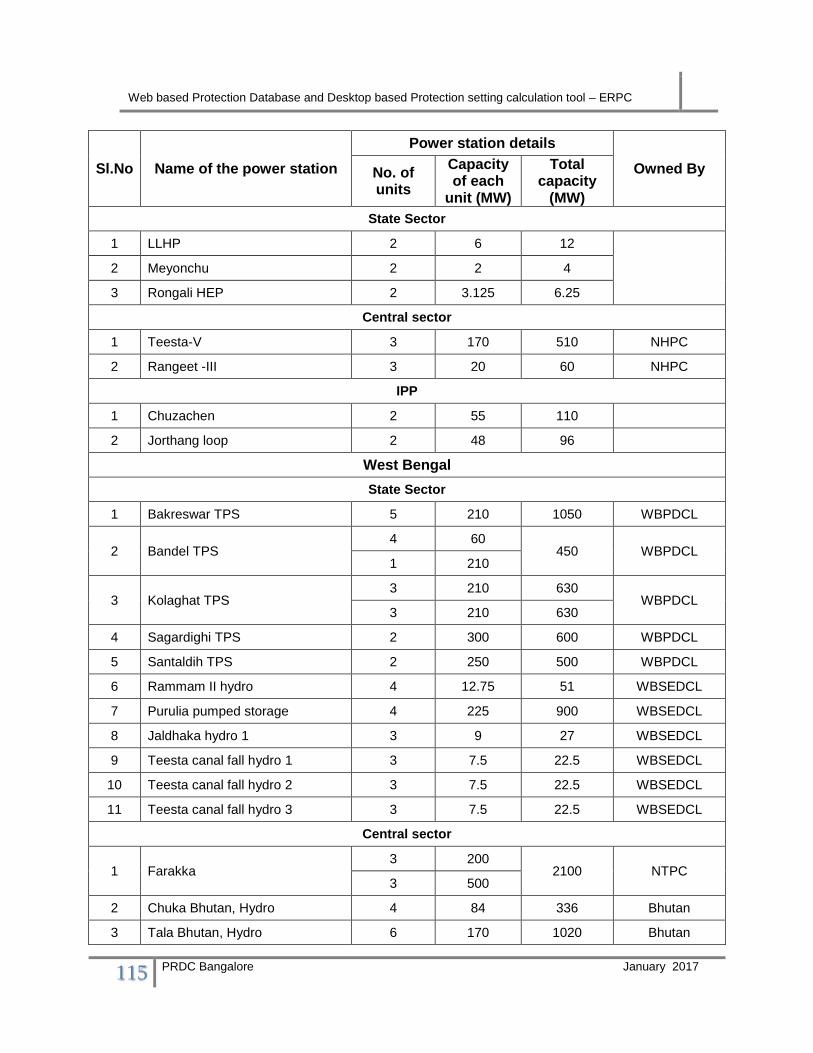
Web based Protection Database and Desktop based Protection setting calculation tool – ERPC
115 PRDC Bangalore January 2017
Sl.No Name of the power station
Power station details
Owned By No. of units
Capacity of each
unit (MW)
Total capacity
(MW)
State Sector
1 LLHP 2 6 12
2 Meyonchu 2 2 4
3 Rongali HEP 2 3.125 6.25
Central sector
1 Teesta-V 3 170 510 NHPC
2 Rangeet -III 3 20 60 NHPC
IPP
1 Chuzachen 2 55 110
2 Jorthang loop 2 48 96
West Bengal
State Sector
1 Bakreswar TPS 5 210 1050 WBPDCL
2 Bandel TPS 4 60
450 WBPDCL 1 210
3 Kolaghat TPS 3 210 630
WBPDCL 3 210 630
4 Sagardighi TPS 2 300 600 WBPDCL
5 Santaldih TPS 2 250 500 WBPDCL
6 Rammam II hydro 4 12.75 51 WBSEDCL
7 Purulia pumped storage 4 225 900 WBSEDCL
8 Jaldhaka hydro 1 3 9 27 WBSEDCL
9 Teesta canal fall hydro 1 3 7.5 22.5 WBSEDCL
10 Teesta canal fall hydro 2 3 7.5 22.5 WBSEDCL
11 Teesta canal fall hydro 3 3 7.5 22.5 WBSEDCL
Central sector
1 Farakka 3 200
2100 NTPC 3 500
2 Chuka Bhutan, Hydro 4 84 336 Bhutan
3 Tala Bhutan, Hydro 6 170 1020 Bhutan

Web based Protection Database and Desktop based Protection setting calculation tool – ERPC
116 PRDC Bangalore January 2017
Sl.No Name of the power station
Power station details
Owned By No. of units
Capacity of each
unit (MW)
Total capacity
(MW)
4 Teesta low dam 3 4 33 132 NHPC
5 Teesta low dam 4 2 40 220 NHPC
Private Sector and DVC
1 DPL
1 110
DPL 1 250
1 300
2 Mejia 4 210
1340 DVC 2 250
3 Waria TPS (DTPS) 1 140
350 DVC 1 210
4 Mejia TPS phase-II 2 500 1000 DVC
5 Durgapur steel TPS 2 500 1000 DVC
6 Budge Budge 2 250 500
CESC 1 250 250
7 Southern generating station 2 67.5 135 CESC
8 Haldia TPP 2 300 600 CESC
9 Raghunathpur TPS 2 600 1200 DVC
CPP
1 Tata power 2 45
120 1 30
2 Crescent power 2 20 40

Web based Protection Database and Desktop based Protection setting calculation tool – ERPC
117 PRDC Bangalore January 2017
Table D: State wise list of Bus reactor present in the Eastern region grid
Sl No Name of the substaion Voltage level
(kV)
Existing reactor details
no of units
capacity of each unit
(MVAr)
Total capacity (MVAr)
Bihar
1 Gaya 765 2 240 480
400 2 125 250
2 Biharshariff
400 1 125 125
400 1 50 50
400 1 80 80
3 Kahalgaon 400 2 50 100
4 Muzaffarpur 400 2 125 250
5 Patna 400 1 80 80
400 2 125 250
6 New Purnea 400 2 125 250
7 Barh 400 1 80 80
8 Banka 400 1 80 80
9 Lakhisarai 400 1 80 80
10 Pusauli 765 1 330 330
400 2 125 250
11 Kishanganj 400 1 125 125
Jharkhand
1 Ranchi (New) 400 2 125 250
765 2 240 480
2 Maithon 400 1 50 50
3 Maithon RB (MPL I & II) 400 2 50 100
4 Jamshedpur 400 2 50 100
5 Ranchi 400 1 80 80
400 1 125 125
6 Koderma 400 2 50 100
7 Chaibasa 400 1 80 80
8 Chandwa (Jharkhand Pooling ) 400 2 125 250
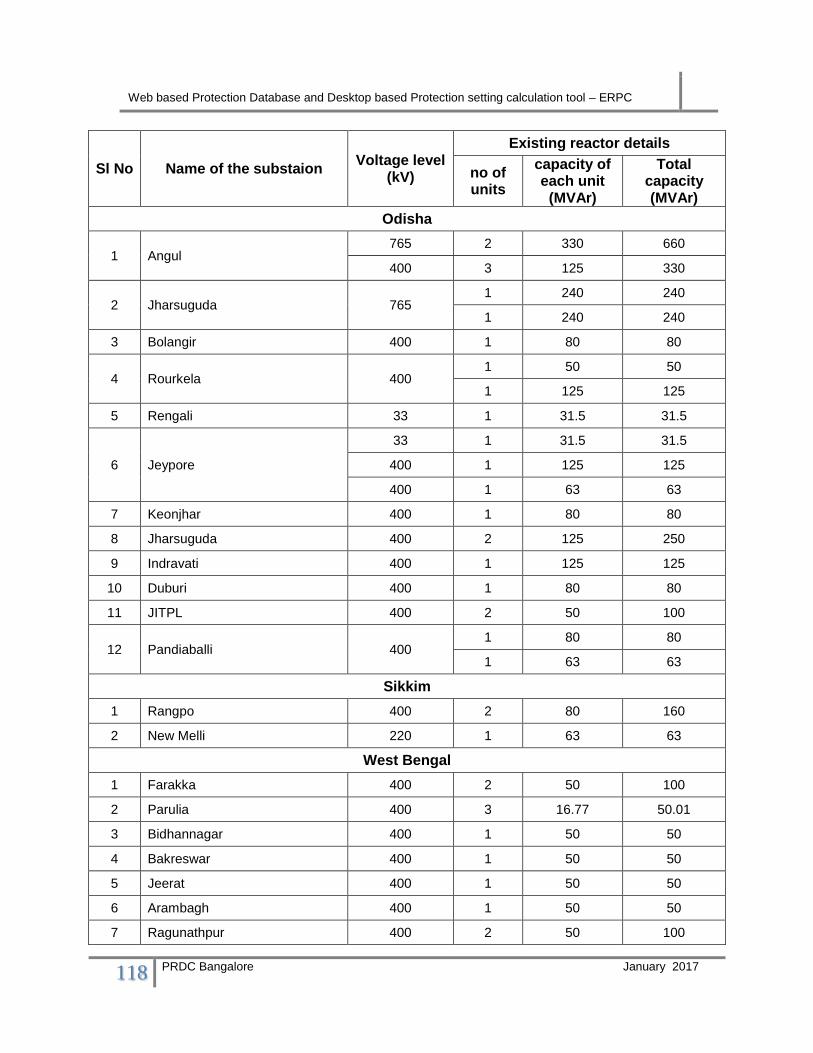
Web based Protection Database and Desktop based Protection setting calculation tool – ERPC
118 PRDC Bangalore January 2017
Sl No Name of the substaion Voltage level
(kV)
Existing reactor details
no of units
capacity of each unit
(MVAr)
Total capacity (MVAr)
Odisha
1 Angul 765 2 330 660
400 3 125 330
2 Jharsuguda 765 1 240 240
1 240 240
3 Bolangir 400 1 80 80
4 Rourkela 400 1 50 50
1 125 125
5 Rengali 33 1 31.5 31.5
6 Jeypore
33 1 31.5 31.5
400 1 125 125
400 1 63 63
7 Keonjhar 400 1 80 80
8 Jharsuguda 400 2 125 250
9 Indravati 400 1 125 125
10 Duburi 400 1 80 80
11 JITPL 400 2 50 100
12 Pandiaballi 400 1 80 80
1 63 63
Sikkim
1 Rangpo 400 2 80 160
2 New Melli 220 1 63 63
West Bengal
1 Farakka 400 2 50 100
2 Parulia 400 3 16.77 50.01
3 Bidhannagar 400 1 50 50
4 Bakreswar 400 1 50 50
5 Jeerat 400 1 50 50
6 Arambagh 400 1 50 50
7 Ragunathpur 400 2 50 100

Web based Protection Database and Desktop based Protection setting calculation tool – ERPC
119 PRDC Bangalore January 2017
Sl No Name of the substaion Voltage level
(kV)
Existing reactor details
no of units
capacity of each unit
(MVAr)
Total capacity (MVAr)
8 Kharagpur 400 1 80 80
9 Binaguri 400 2 125 160
10 Behrampur 400 1 80 80
11 KTPS 400 2 50 50
12 Durgapur 400 1 50 50
\

Web based Protection Database and Desktop based Protection setting calculation tool – ERPC
120 PRDC Bangalore January 2017
Table E: State wise list of Line reactor present in the Eastern region grid
Sl No
Name of the transmission line
Voltage level (kV)
Existing reactor details
Remarks no of units
capacity of each
unit (MVAr)
Total capacity (MVAr)
End
Bihar
1 Maithon to Gaya I & II 400 2 50 100 Gaya Switchable
400 2 50 100 Maithon Switchable
2 Purnea to Kishanganj-I 400 1 63 63 Purnea -
3 Purnea to Binaguri-III 400 1 63 63 Purnea -
4 Purnea to Muzaffarpur I & II
400 2 63 126 Purnea Switchable
400 2 63 126 Muzaffarpur
5 Muzaffarpur to Gorakhpur I 400 1 63 63 Muzaffarpur Switchable
6 Muzaffarpur to Gorakhpur II
400 1 50 50 Muzaffarpur Switchable
7 Biharshariff to Balia I & II 400 2 50 100 Balia -
8 Pasuali-Fatehpur 765 1 310 240 Pasuali -
765 1 330 330 Fatehpur -
9 Banka to Biharshariff I & II 400 2 50 100 Banka -
10 Biharshariff to Purnea I & II 400 2 80 160 Biharshariff -
11 Lakhisarai to Biharshariff I & II
400 1 50 50 Biharshariff -
12 Barh to Patna I & II 400 2 50 100 Patna -
13 Lakhisarai to Kahalgaon I & II
400 2 50 100 Lakhisarai -
14 Biharshariff to Tenughat 220 1 50 50 Tenughat -
15 Biharshariff to Pusauli I 400 1 50 50 Biharshariff Switchable
16 Pasauli to Allahabad 400 1 63 63 Pasauli Switchable
17 Pasauli to Sarnath 400 1 63 63 Pasauli Switchable
18 Patna to Balia III & IV 400 2 63 126 Balia -
19 Pasauli to Biharshariff I & II
400 2 63 126 Pasauli -
20 Patna to Krishanganj I & II 400 1 63 63 Patna Switchable
1 63 63 Patna Switchable
21 Patna to Krishanganj I & II 400 1 63 63 Kishangaunj

Web based Protection Database and Desktop based Protection setting calculation tool – ERPC
121 PRDC Bangalore January 2017
Sl No
Name of the transmission line
Voltage level (kV)
Existing reactor details
Remarks no of units
capacity of each
unit (MVAr)
Total capacity (MVAr)
End
1 63 63 Kishangaunj
22 Biharshariff to Varanasi I & II
400 2 50 100 Biharshariff Switchable
23 Gaya to Balia 765 1 240 240 Gaya Switchable
1 330 330 Balia -
24 Gaya to Varanasi-I 765 1 240 240 Gaya Switchable
25 Gaya to Varanasi-II 765 2 240 480 Gaya Switchable
Jharkhand
26 Ranchi (New) to Dharmjaygarh I
765
1 240 240 Ranchi Switchable
1 330 330 Dharamjaygarh -
27 Ranchi (New) to Dharmjaygarh II
1 240 240 Ranchi Switchable
1 330 330 Dharamjaygarh -
28 Ranchi to Sipat-I & II 400 2 80 160 Ranchi -
2 80 160 Sipat -
29 Maithon RB (MPL) to Ranchi I & II
400 2 50 100 MPL
- 2 50 100 Ranchi
30 Maithon to Kahalgaon-I & II
400 2 50 100 Maithon -
31 Maithon to Mejia I 400 1 50 50 Maithon Switchable
32 Kharagpur to Chaibasa 400 1 63 63 Chaibasa
Odisha
33 Jharsuguda to Angul-I & II 765 2 240 480 Jharsuguda Switchable
2 240 480 Angul -
34 Jeypore to Gajuwaka I & II 400 2 80 160 Gajuwaka Switchable
35 Pandiabill to Mendhasal 400 1 63 63 Mendasal
- Baripada to Pandiabill 400 1 63 63 Baripada
36 Rourkel to Jharsuguda I 400 1 63 63 Rourkela -
37 Rourkel to Sterlite I 400 1 63 63 Rourkela -
38 Meramundali to Angul I 400 1 80 80 Meramundali -
Meramundali to Vedanta 400 2 50 100 Meramundali
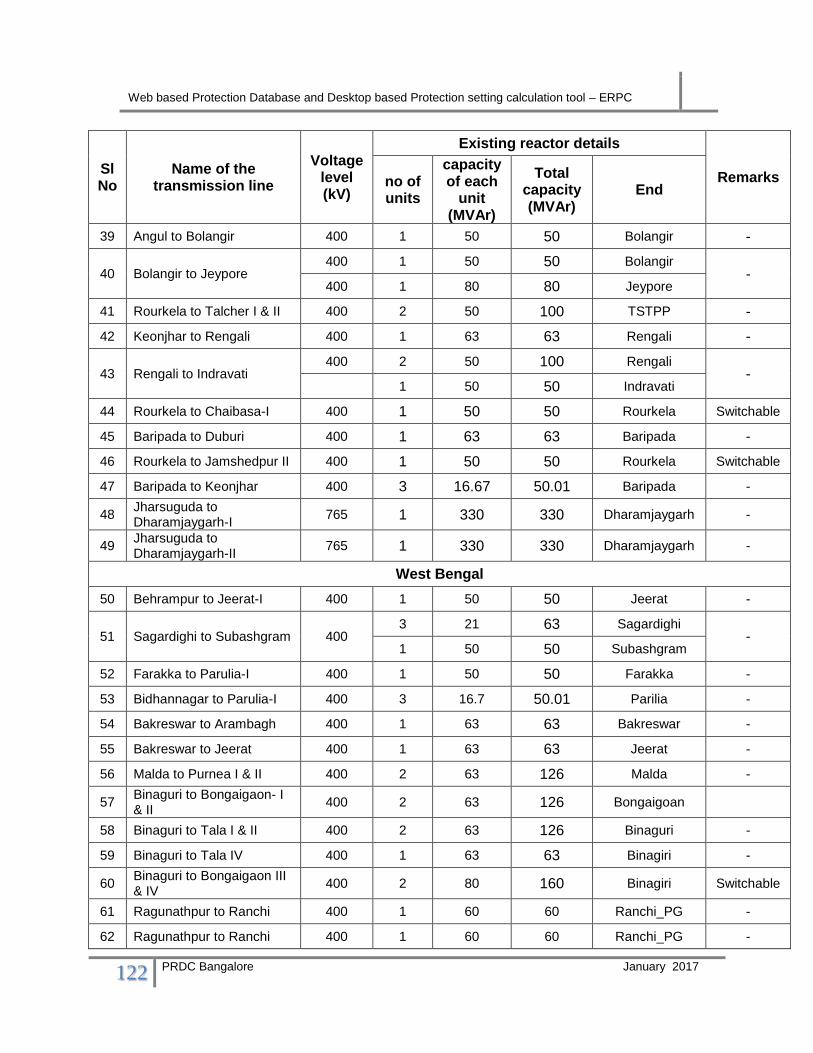
Web based Protection Database and Desktop based Protection setting calculation tool – ERPC
122 PRDC Bangalore January 2017
Sl No
Name of the transmission line
Voltage level (kV)
Existing reactor details
Remarks no of units
capacity of each
unit (MVAr)
Total capacity (MVAr)
End
39 Angul to Bolangir 400 1 50 50 Bolangir -
40 Bolangir to Jeypore 400 1 50 50 Bolangir
- 400 1 80 80 Jeypore
41 Rourkela to Talcher I & II 400 2 50 100 TSTPP -
42 Keonjhar to Rengali 400 1 63 63 Rengali -
43 Rengali to Indravati 400 2 50 100 Rengali
- 1 50 50 Indravati
44 Rourkela to Chaibasa-I 400 1 50 50 Rourkela Switchable
45 Baripada to Duburi 400 1 63 63 Baripada -
46 Rourkela to Jamshedpur II 400 1 50 50 Rourkela Switchable
47 Baripada to Keonjhar 400 3 16.67 50.01 Baripada -
48 Jharsuguda to Dharamjaygarh-I
765 1 330 330 Dharamjaygarh -
49 Jharsuguda to Dharamjaygarh-II
765 1 330 330 Dharamjaygarh -
West Bengal
50 Behrampur to Jeerat-I 400 1 50 50 Jeerat -
51 Sagardighi to Subashgram 400 3 21 63 Sagardighi
- 1 50 50 Subashgram
52 Farakka to Parulia-I 400 1 50 50 Farakka -
53 Bidhannagar to Parulia-I 400 3 16.7 50.01 Parilia -
54 Bakreswar to Arambagh 400 1 63 63 Bakreswar -
55 Bakreswar to Jeerat 400 1 63 63 Jeerat -
56 Malda to Purnea I & II 400 2 63 126 Malda -
57 Binaguri to Bongaigaon- I & II
400 2 63 126 Bongaigoan
58 Binaguri to Tala I & II 400 2 63 126 Binaguri -
59 Binaguri to Tala IV 400 1 63 63 Binagiri -
60 Binaguri to Bongaigaon III & IV
400 2 80 160 Binagiri Switchable
61 Ragunathpur to Ranchi 400 1 60 60 Ranchi_PG -
62 Ragunathpur to Ranchi 400 1 60 60 Ranchi_PG -

Web based Protection Database and Desktop based Protection setting calculation tool – ERPC
123 PRDC Bangalore January 2017
Table F: State wise list of load data considered for the study present in the
Eastern region grid
SI.No Name of the Sub-
Station Voltage
level (kV)
Substation details
Owned By
33 KV lump load
No. of
units
Capacity of each
unit (MVA)
Total capacity (MVA)
MW MVAr
Bihar
1 Arrah 132/33 1 20 20
BSPTCL
13.01 4.27 3 50 150
2 Ataula (Arwal) (Karpi) 132/33 2 20 40 25.27 8.30
3 Aurangabad 132/33 2 20 40 12.20 2.83
4 Banjari 132/33 3 20 60 5.29 1.74
5 Banka 132/33 3 20 60 17.45 7.75
6 Barauni TPS 132/33 1 50 50
39.03 12.82 2 20 40
7 Barh 132/33 1 20 20
34.48 11.32 1 50 50
8 Baripahari 132/33 2 50 100 25.90 8.50
9 Belaganj 132/33 2 20 40 14.87 4.88
10 Bettiah 132/33 2 20 40
29.74 9.77 1 50 50
11 Bihta 132/33 3 50 150 60.00 19.72
12 Bikramganj 132/33 2 20 40
18.24 5.99 1 50 50
13 Buxar 132/33 2 20 40
18.59 6.10 1 50 50
14 Chandauti (Gaya) 132/33 2 50 100 20.43 6.71
132/25 2 13.35 26.7 0.00 0.00
15 Chhapra 132/33 2 20 40
26.49 8.70 1 50 50
16 Darbhanga (old) 132/33 2 50 100 37.17 12.21
17 Dhaka 132/33 3 20 60 15.51 5.09
18 Dalsingsarai 132/33 2 20 40 21.75 7.14
19 Digha 132/33 3 50 150 52.28 16.95

Web based Protection Database and Desktop based Protection setting calculation tool – ERPC
124 PRDC Bangalore January 2017
SI.No Name of the Sub-
Station Voltage
level (kV)
Substation details
Owned By
33 KV lump load
No. of
units
Capacity of each
unit (MVA)
Total capacity (MVA)
MW MVAr
20 Dumraon 132/33 1 20 20
20.45 6.71 1 50 50
21 Ekma 132/33 1 20 20 13.01 4.27
22 Ekanga Sarai (Ekanagar)
132/33 3 20 60 24.63 8.09
23 Forbeshganj 132/33 1 20 20
54.71 17.97 1 50 50
24 Goh 132/33 2 20 40 10.95 3.60
25 Gangwara 132/33 2 50 100 26.18 8.60
26 Gaighat 132/33 2 50 100 45.81 19.58
27 Hazipur 132/33 3 50 150 53.36 17.53
28 Hulasganj 132/33 2 20 40 12.77 4.19
29 Harnaut 132/33 2 20 40 8.49 4.11
30 Hathidah 132/33 3 20 60 13.04 3.62
31 Imamganj 132/33 2 20 40 13.68 4.49
32 Jagdishpur 132/33 2 20 40 18.59 6.10
33 Jandaha 132/33 2 20 40 24.54 8.06
34 Jainagar 132/33 3 20 60 5.56 1.83
35 Jakkanpur 132/33 4 50 200
91.00 33.60 1 20 20
36 Jamalpur 132/33 2 50 100 32.55 10.70
37 Jamui 132/33 2 20 40 28.00 9.20
38 Jehanabad 132/33 2 20 40 26.50 8.72
Jehanabad TSS Railway feeder 3.00 0.99
39 Kahalgaon 132/33 2 20 40
27.88 9.16 2 50 100
40 Karmnasa
132/33 2 50 100
19.00 6.24 1 20 20
132/25 1 21.6 21.6
6.00 1.86 1 20 20
41 Kataiya 132/33 3 20 60 20.60 3.37
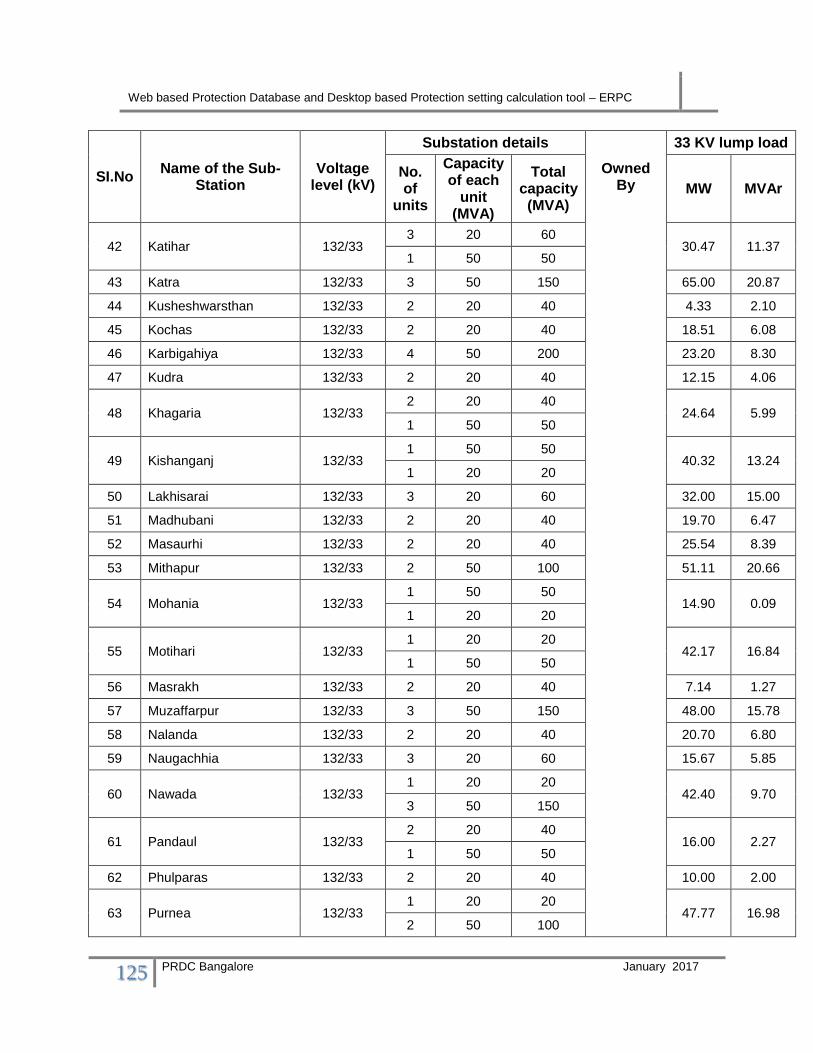
Web based Protection Database and Desktop based Protection setting calculation tool – ERPC
125 PRDC Bangalore January 2017
SI.No Name of the Sub-
Station Voltage
level (kV)
Substation details
Owned By
33 KV lump load
No. of
units
Capacity of each
unit (MVA)
Total capacity (MVA)
MW MVAr
42 Katihar 132/33 3 20 60
30.47 11.37 1 50 50
43 Katra 132/33 3 50 150 65.00 20.87
44 Kusheshwarsthan 132/33 2 20 40 4.33 2.10
45 Kochas 132/33 2 20 40 18.51 6.08
46 Karbigahiya 132/33 4 50 200 23.20 8.30
47 Kudra 132/33 2 20 40 12.15 4.06
48 Khagaria 132/33 2 20 40
24.64 5.99 1 50 50
49 Kishanganj 132/33 1 50 50
40.32 13.24 1 20 20
50 Lakhisarai 132/33 3 20 60 32.00 15.00
51 Madhubani 132/33 2 20 40 19.70 6.47
52 Masaurhi 132/33 2 20 40 25.54 8.39
53 Mithapur 132/33 2 50 100 51.11 20.66
54 Mohania 132/33 1 50 50
14.90 0.09 1 20 20
55 Motihari 132/33 1 20 20
42.17 16.84 1 50 50
56 Masrakh 132/33 2 20 40 7.14 1.27
57 Muzaffarpur 132/33 3 50 150 48.00 15.78
58 Nalanda 132/33 2 20 40 20.70 6.80
59 Naugachhia 132/33 3 20 60 15.67 5.85
60 Nawada 132/33 1 20 20
42.40 9.70 3 50 150
61 Pandaul 132/33 2 20 40
16.00 2.27 1 50 50
62 Phulparas 132/33 2 20 40 10.00 2.00
63 Purnea 132/33 1 20 20
47.77 16.98 2 50 100
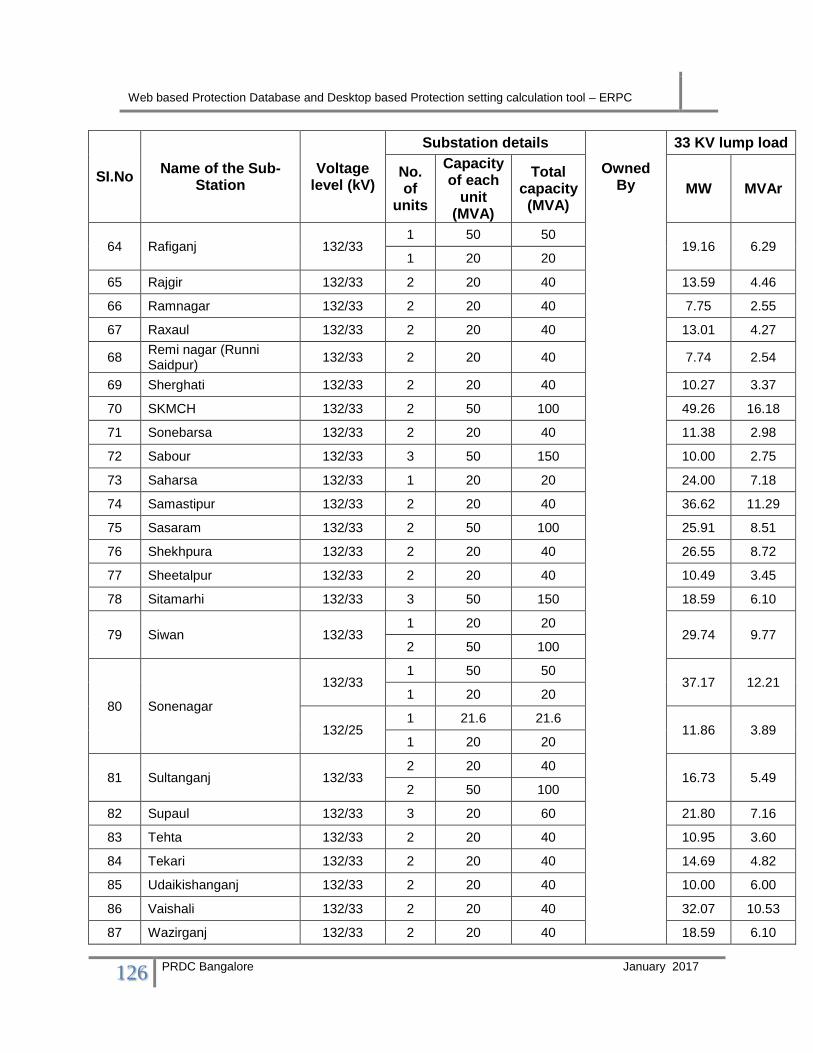
Web based Protection Database and Desktop based Protection setting calculation tool – ERPC
126 PRDC Bangalore January 2017
SI.No Name of the Sub-
Station Voltage
level (kV)
Substation details
Owned By
33 KV lump load
No. of
units
Capacity of each
unit (MVA)
Total capacity (MVA)
MW MVAr
64 Rafiganj 132/33 1 50 50
19.16 6.29 1 20 20
65 Rajgir 132/33 2 20 40 13.59 4.46
66 Ramnagar 132/33 2 20 40 7.75 2.55
67 Raxaul 132/33 2 20 40 13.01 4.27
68 Remi nagar (Runni Saidpur)
132/33 2 20 40 7.74 2.54
69 Sherghati 132/33 2 20 40 10.27 3.37
70 SKMCH 132/33 2 50 100 49.26 16.18
71 Sonebarsa 132/33 2 20 40 11.38 2.98
72 Sabour 132/33 3 50 150 10.00 2.75
73 Saharsa 132/33 1 20 20 24.00 7.18
74 Samastipur 132/33 2 20 40 36.62 11.29
75 Sasaram 132/33 2 50 100 25.91 8.51
76 Shekhpura 132/33 2 20 40 26.55 8.72
77 Sheetalpur 132/33 2 20 40 10.49 3.45
78 Sitamarhi 132/33 3 50 150 18.59 6.10
79 Siwan 132/33 1 20 20
29.74 9.77 2 50 100
80 Sonenagar
132/33 1 50 50
37.17 12.21 1 20 20
132/25 1 21.6 21.6
11.86 3.89 1 20 20
81 Sultanganj 132/33 2 20 40
16.73 5.49 2 50 100
82 Supaul 132/33 3 20 60 21.80 7.16
83 Tehta 132/33 2 20 40 10.95 3.60
84 Tekari 132/33 2 20 40 14.69 4.82
85 Udaikishanganj 132/33 2 20 40 10.00 6.00
86 Vaishali 132/33 2 20 40 32.07 10.53
87 Wazirganj 132/33 2 20 40 18.59 6.10
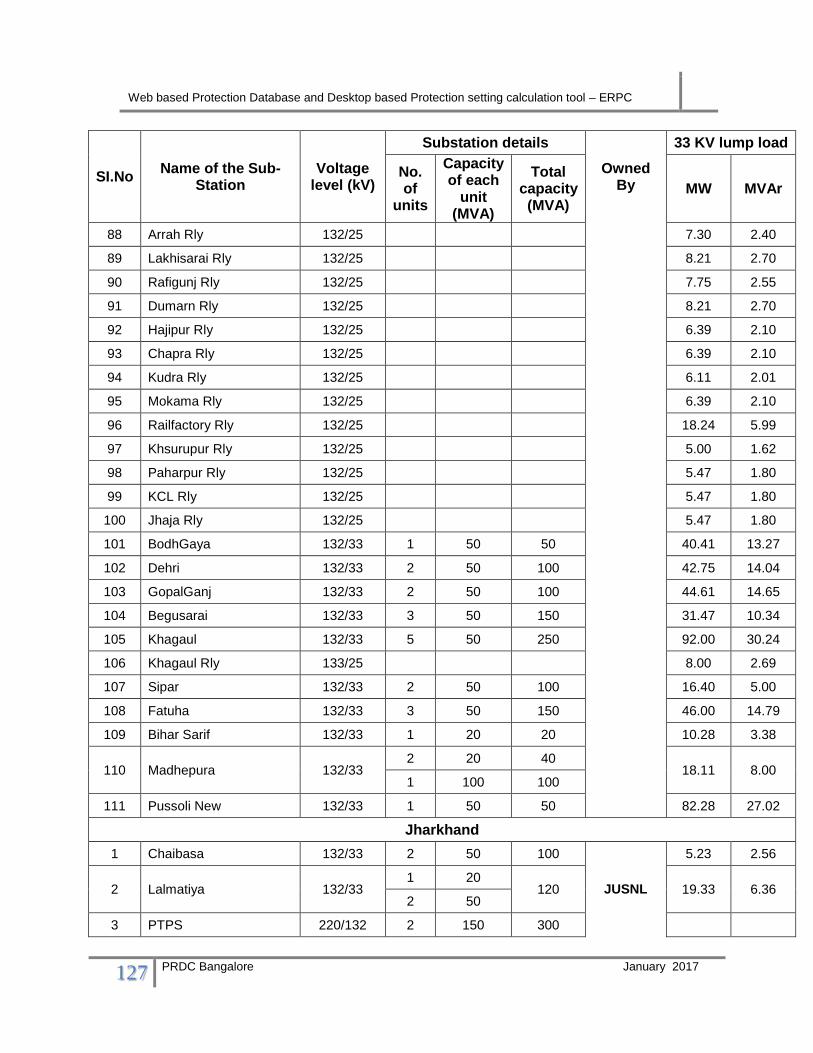
Web based Protection Database and Desktop based Protection setting calculation tool – ERPC
127 PRDC Bangalore January 2017
SI.No Name of the Sub-
Station Voltage
level (kV)
Substation details
Owned By
33 KV lump load
No. of
units
Capacity of each
unit (MVA)
Total capacity (MVA)
MW MVAr
88 Arrah Rly 132/25 7.30 2.40
89 Lakhisarai Rly 132/25 8.21 2.70
90 Rafigunj Rly 132/25 7.75 2.55
91 Dumarn Rly 132/25 8.21 2.70
92 Hajipur Rly 132/25 6.39 2.10
93 Chapra Rly 132/25 6.39 2.10
94 Kudra Rly 132/25 6.11 2.01
95 Mokama Rly 132/25 6.39 2.10
96 Railfactory Rly 132/25 18.24 5.99
97 Khsurupur Rly 132/25 5.00 1.62
98 Paharpur Rly 132/25 5.47 1.80
99 KCL Rly 132/25 5.47 1.80
100 Jhaja Rly 132/25 5.47 1.80
101 BodhGaya 132/33 1 50 50 40.41 13.27
102 Dehri 132/33 2 50 100 42.75 14.04
103 GopalGanj 132/33 2 50 100 44.61 14.65
104 Begusarai 132/33 3 50 150 31.47 10.34
105 Khagaul 132/33 5 50 250 92.00 30.24
106 Khagaul Rly 133/25 8.00 2.69
107 Sipar 132/33 2 50 100 16.40 5.00
108 Fatuha 132/33 3 50 150 46.00 14.79
109 Bihar Sarif 132/33 1 20 20 10.28 3.38
110 Madhepura 132/33 2 20 40
18.11 8.00 1 100 100
111 Pussoli New 132/33 1 50 50 82.28 27.02
Jharkhand
1 Chaibasa 132/33 2 50 100
JUSNL
5.23 2.56
2 Lalmatiya 132/33 1 20
120 19.33 6.36 2 50
3 PTPS 220/132 2 150 300

Web based Protection Database and Desktop based Protection setting calculation tool – ERPC
128 PRDC Bangalore January 2017
SI.No Name of the Sub-
Station Voltage
level (kV)
Substation details
Owned By
33 KV lump load
No. of
units
Capacity of each
unit (MVA)
Total capacity (MVA)
MW MVAr
4 Adityapur 132/33 4 50 200 71.03 39.48
5 Chakradharpur 132/33 1 20 20 6.10 2.97
6 Dalbhumgarh 132/33 2 50
100 41.84 13.32
Railway feeder 5.40 2.62
7 Chaibasa 132/33 1 25 25 1.15 0.35
8 Chandil II/ Maniq 132/33 2 50 100 16.56 5.47
9 Deogarh 132/33 3 50
150 42.71 13.37 Railway feeder
10 Dumka (Maharo) 132/33 2 50 100 23.89 6.43
11 Garhwa Road 132/33
1 50 70
17.43 2.40 1 20
Railway feeder
12 Goielkara 132/33 1 20 20 8.00 4.27
3.49 1.81
13 Golmuri 132/33 2 50 100 38.36 12.48
14 Gumla 132/33 2 20 40 12.46 4.07
15 Hatia old 132/33 4 50
200 70.96 23.12 Railway feeder
16 Tamar 132/33 2 50 100 10.46 3.04
17 Madhupur 132/33 2 50 100 14.99 5.59
18 Jadugoda 132/33 2 20
90 20.92 1.92 1 50
19 Jamtara 132/33
1 50
70 23.54 5.62
1 20
Railway feeder 4.00 0.97
20 Japla 132/33 2 20 40 6.10 2.09
21 Kamdara 132/33
2 20 60 10.46 3.47
1 20
Railway feeder 0.00 0.00
22 Kanke 132/33 2 50 100 10.34 2.98

Web based Protection Database and Desktop based Protection setting calculation tool – ERPC
129 PRDC Bangalore January 2017
SI.No Name of the Sub-
Station Voltage
level (kV)
Substation details
Owned By
33 KV lump load
No. of
units
Capacity of each
unit (MVA)
Total capacity (MVA)
MW MVAr
23 Kendposi 132/33
2 20
90 15.59 5.06
1 50
Railway feeder 7.08 2.33
24 Latehar 132/33 2 50 100 8.73 2.88
25 Lohardaga 132/33 2 50 100 25.19 9.05
26 Namkum 132/33 4 50
200 75.14 24.41 Railway feeder
27 Nowamundi 132/33 1 50 50
5.54 1.73
28 Nowamundi Tata Steel 132 20.80 7.80
29 Pakur 132/33 2 50 100 30.86 9.92
30 Rajkharsawan 132/33 2 50
100 6.97 1.84
Railway feeder 6.00 2.91
31 Sahebgunj 132/33 2 50 100 22.94 1.38
32 Daltonganj 132/33 2 50 100 17.43 3.46
33 Saljagiri Rly 132/25 - - - 0.00 0.00
34 Shankarpur Rly 132/25 - - - 3.00 0.65
35 Tatisiloi RLY 132/25 - - - 5.70 1.60
36 Tolra Rly 132/25 - - - 12.00 5.81
37 Lodhma Rly 132/25 - - - 0.49 0.24
38 Bakaspur Rly 132/25 - - - 3.00 0.99
39 Chakradharpur Rly 132/25 - - - 1.00 0.48
40 Bano Rly 132/25 - - - 0.00 0.00
41 Umi Rly 132/25 - - - 2.75 1.66
42 HEC Hatia 132 6.60 2.93
43 Ushamartin 132 13.96 4.78
44 APL Ramchandrapur 132 18.63 9.02
45 Patherdih 132/33
2 80 160
DVC
59.08 24.05 1 50 50
132/25 2 12.5 25 4.85 1.19
46 Pattratu 132/33 1 31.5 32 6.92 3.35

Web based Protection Database and Desktop based Protection setting calculation tool – ERPC
130 PRDC Bangalore January 2017
SI.No Name of the Sub-
Station Voltage
level (kV)
Substation details
Owned By
33 KV lump load
No. of
units
Capacity of each
unit (MVA)
Total capacity (MVA)
MW MVAr
47 Gola 132/33 2 50 100 19.23 5.44
48 K'Dubi 132/33
2 50 100 34.50 16.55
1 80 80
132/25 2 25 50 8.10 3.91
49 Konar 132/33 1 20
20 8.31 2.03
Railway feeder 6.36 2.09
50 Biada 132/33 2 80 160 20.72 5.44
51 BTPS B 132/33 2 50 100 31.36 10.31
52 Dhanbad 220/33 2 80 160 33.30 7.98
53 Jamshedpur 132/33 3 45 135 14.93 3.98
54 Koderma 132/33 1 80 80 75.00 24.65
1 50 50 14.53 5.58
55 Ramgarh 132/33 2 80 160
111.00 30.41 132/33 1 50 50
56 Mosabani 132/33 2 20
52 27.27 10.48 1 32
57 Girdhi 132/33 2 80 160 68.88 21.06
220/33 1 80 80 19.49 5.61
58 North Karanpura 132/33 2 50 100 12.71 6.00
59 Govindpur 132 29.60 7.97
60 Hazaribag 132/33 2 50 100 34.60 12.20
61 Nimghat 132/33 2 31.5 63 50.00 16.43
62 Putki 132/33 3 80 240 127.05 41.76
63 Barhi 132/33 1 50
81.5 23.00 8.00 1 31.5
64 CTPS 132/33 2 80 160 73.91 27.24
65 MHS-RB3 132/33 2 50 100 29.88 12.05
66 Panchet 132/33 1 50 50 0.00 0.00
67 Maniq Rly 132 12.32 4.04
68 Jamshedpur 220/132 139.13 17.27

Web based Protection Database and Desktop based Protection setting calculation tool – ERPC
131 PRDC Bangalore January 2017
SI.No Name of the Sub-
Station Voltage
level (kV)
Substation details
Owned By
33 KV lump load
No. of
units
Capacity of each
unit (MVA)
Total capacity (MVA)
MW MVAr
69 JSPL 132 12.52 0.81
70 TISCO 400/132 237.00 17.03
71 Maniq 132 31.25 -0.43
72 ECRBR-D 132 0.00 0.00
73 EC Rly North Karanpura 132 9.06 4.39
74 BSL 132 66.80 25.56
75 Elctr DVC /Dhanbad 220 5.17 1.70
76 Nimiaghat Rly 132/25 26.22 10.08
77 ECR Gomia 132 0.52 0.25
78 MAL-Impex 132 34.05 4.31
79 Sermuri 132 10.26 4.49
80 Pradhankant 132 4.29 1.43
81 BSLGD 132 33.44 12.78
82 Rajbera 132 9.11 4.41
83 Manoharpur 132/33 2 50 100 JUSNL
4.36 1.41
84 Sikidri 132/33 2 20 40 0.00 0.00
Odisha
1 Mendhasal 220/33 1 20 20
OPTCL
0.02 0.00
2 Balasore 132/33
2 63
166 61.63 18.63
1 40
Railway Feeder 10.94 2.70
3 Bhadrak 132/33
2 63
166 54.31 15.73
1 40
Railway Feeder 4.83 -0.13
4 Bidanasi 132/33 2 63
166 71.98 29.26
1 40
5 Budhipadar 132/33 1 20 20 3.80 1.25
6 Chandaka 132/33
2 63
166 91.00 33.00 1 40
Railway Feeder

Web based Protection Database and Desktop based Protection setting calculation tool – ERPC
132 PRDC Bangalore January 2017
SI.No Name of the Sub-
Station Voltage
level (kV)
Substation details
Owned By
33 KV lump load
No. of
units
Capacity of each
unit (MVA)
Total capacity (MVA)
MW MVAr
7 Jayanagar
132/33 2 20
52.5 20.37 7.18
1 12.5
Railway Feeder 9.61 3.16
ChakusTrac 0.00 0.00
8 Joda 132/33 3 20
100 13.91 3.70 1 40
9 Narendrapur
220/132 1 100
520 27.80 9.14
2 160
132/33 2 40
1 20
Railway Feeder (JagnathTrac) 3.90 1.89
10 Paradip 132/33 2 20
52.5 22.40 6.13 1 12.5
11 Theruvali 132/33 2 12.5 25 8.00 1.34
12 Balimela 220/33 1 20
60 15.60 3.20 1 40
13 Barkote 220/33 2 40 80 16.87 -4.66
14 Nayagarh 220/33 1 40
80 27.00 6.70 2 20
15 Duburi 220/33 2 40 80 8.00 3.02
16 Akhusingh 132/33 2 12.5 25 8.85 2.66
17 Anandapur 132/33 2 12.5
45 11.40 3.19 1 20
18 Angul 132/33 2 40
100 20.25 6.79 1 20
19 Argul 132/33 1 40
60 1.60 -0.70 1 20
20 Atri 132/33 1 20 20 0.00 0.00
21 Aska 132/33 3 40 120 29.30 9.27
22 Balugaon 132/33 1 40 72.5 23.93 6.81

Web based Protection Database and Desktop based Protection setting calculation tool – ERPC
133 PRDC Bangalore January 2017
SI.No Name of the Sub-
Station Voltage
level (kV)
Substation details
Owned By
33 KV lump load
No. of
units
Capacity of each
unit (MVA)
Total capacity (MVA)
MW MVAr
1 20
1 12.5
Railway feeder (Solar Trac) 10.10 3.38
23 Banki 132/33 2 20 40 6.00 1.20
24 Barbil 132/33 2 12.5
25 12.64 4.15
Railway Feeder 2.19 0.72
25 Baragarh 132/33 3 40 120 53.22 26.46
26 Baripada 132/33 3 40 120 45.00 12.00
27 Barpalli 132/33 1 20
60 34.00 16.87 1 40
28 Berhampore 132/33 2 40
100 21.80 10.63 1 20
29 Basta 132/33 1 12.5
32.5 8.50 2.28 1 20
30 Bhanjanagar 132/33 2 40
96 18.22 5.00 1 16
31 Bhawanipatna 132/33 2 12.5 25 7.93 2.69
32 Bhubaneswar (BBSR) 132/33 3 63 189 94.00 30.00
33 Boinda 132/33 1 20
45 13.89 3.70 2 12.5
34 Boudh 132/33 1 20 20 4.90 1.40
35 Bolangir 132/33 2 40
92.5 21.00 7.60 1 12.5
36 Brajrajnagar 132/33
1 40 100 22.26 6.70
3 20
132/11 1 12.5 12.5 4.45 1.96
37 Chainpal 132/33 2 40
100 34.40 9.60 1 20
38 Chandikhole 132/33 3 20 60 17.80 5.20
39 Chhandpur 132/33 2 12.5 25 7.30 2.70

Web based Protection Database and Desktop based Protection setting calculation tool – ERPC
134 PRDC Bangalore January 2017
SI.No Name of the Sub-
Station Voltage
level (kV)
Substation details
Owned By
33 KV lump load
No. of
units
Capacity of each
unit (MVA)
Total capacity (MVA)
MW MVAr
40 Chhatrapur 132/33 3 20
60 15.17 5.53
Railway Feeder (Ramba Trac) 10.97 4.85
41 Chhend 132/33 3 40
120 47.91 8.44
Railway Feeder (Naugaon Trac) 0.58 0.19
42 Choudwar 132/33
1 20
100 42.00 14.74
2 40
Railway Feeder (Kendpur Trac) 5.00 -0.18
43 Cuttack 132/33 3 40 120 24.90 5.00
44 Dabugaon 132/33 2 12.5 25 2.69 0.19
45 Dhenkanal 132/33 3 40
120 41.07 -5.65
Railway Feeder (Jornda Trac) 5.90 0.05
46 Digapahandi 132/33 2 20
52.5 20.51 6.38 1 12.5
47 Ganjam
132/33 2 12.5 25 10.30 1.30
48 Bulk industrial Load 10.30 1.30
49 Jagatsinghpur
132/33 2 20
80 22.23 5.21 1 40
Railway Feeder (Goreknath Trac)
10.50 5.40
50 Jajpur road 132/33 2 40
100 24.79 10.03 1 20
51 Jajpur town 132/33 2 40
100 22.68 5.70 1 20
52 Jaleswar 132/33
2 31.5
75.5 20.41 7.48
1 12.5
Railway Feeder 12.72 6.94
53 Jharsuguda
132/33 1 40
72.5
9.50 3.24
132/11 1 20
3.60 1.10 1 12.5
Railway Feeder 10.00 4.40
54 Junagarh 132/33 3 20 60 19.12 5.28

Web based Protection Database and Desktop based Protection setting calculation tool – ERPC
135 PRDC Bangalore January 2017
SI.No Name of the Sub-
Station Voltage
level (kV)
Substation details
Owned By
33 KV lump load
No. of
units
Capacity of each
unit (MVA)
Total capacity (MVA)
MW MVAr
55 Kalarangi 132/33 2 12.5
45 14.13 3.70 1 20
56 Kalunga 132/33 2 40 80 25.25 1.25
57 Kamakshyanagar 132/33 1 20
45 14.57 3.08 2 12.5
58 Karanjia 132/33 2 12.5
45 7.32 2.02 1 20
59 Kendrapara 132/33 2 40
92.5 21.07 6.61 1 12.5
60 Kesinga 132/33 1 40
80 30.60 1.32 2 20
61 Kesura/Badagada 132/33 1 63
103 21.21 7.34 1 40
62 Khariar 132/33 2 40 80 28.70 9.30
63 Khurda 132/33 3 40
120 53.71 2.37
Railway Feeder ( Kaipad Trac) 7.88 1.37
64 Konark 132/33 2 20 40 5.80 1.60
65 Kuchinda 132/33 2 20 40 11.04 3.14
66 Lapanaga 132/33 1 20 20 0.20 0.07
67 Mancheswar 132/33 3 63 189
68 Mania 132/33 1 12.5 12.5 0.00 0.00
69 Marshaghai 132/33 2 20 40 10.50 2.40
70 Mohana 132/33 2 12.5 25 2.92 1.00
71 Nimapara 132/33 2 40
92.5 37.23 12.24 1 12.5
72 Nuapara 132/33 2 20 40 8.20 3.20
73 Nuapatna 132/33
1 40
72.5
28.22 9.48
1 20
1 12.5
74 Padampur 132/33 1 20 20 11.20 3.68

Web based Protection Database and Desktop based Protection setting calculation tool – ERPC
136 PRDC Bangalore January 2017
SI.No Name of the Sub-
Station Voltage
level (kV)
Substation details
Owned By
33 KV lump load
No. of
units
Capacity of each
unit (MVA)
Total capacity (MVA)
MW MVAr
75 Parlakhemundi 132/33 3 12.5 37.5 9.80 3.05
76 Patnagarh 132/33 1 40
80 13.07 5.40 2 20
77 Pattamundai 132/33 2 20
52.5 15.13 4.30 1 12.5
78 Phulbani 132/33 2 12.5
65 12.07 2.65 1 40
79 Phulnakhara 132/33 2 20 40 14.22 4.37
80 Polasapanga 132/33
1 40
80 21.67 6.05
2 20
Railway Feeder 8.31 -0.79
81 Puri 132/33 3 40 120 37.50 11.40
82 Purusottampur 132/33 2 12.5 25 10.43 3.33
83 Rairakhole 132/33 2 12.5 25 7.09 1.60
84 Rairangpur 132/33 2 20
52.5 6.50 0.80 1 12.5
85 Rajgangpur 132/33 3 40 120 41.52 3.48
Railway Feeder 0.93 0.31
86 Ranasinghpur 132/33 2 63
166 38.00 12.49 1 40
87 Rayagada 132/33 2 12.5 25 10.09 3.57
88 Rourkela 132/33 4 35
140 36.60 9.43
Railway Feeder 3.30 -0.57
89 Saintala 132/33
1 10 22.5
1.82 0.05 1 12.5
Railway Feeder
90 Salipur 132/33 2 20
52.5 19.70 6.83 1 12.5
91 Sambalpur 132/33 2 31.5
103 53.63 21.04 1 40

Web based Protection Database and Desktop based Protection setting calculation tool – ERPC
137 PRDC Bangalore January 2017
SI.No Name of the Sub-
Station Voltage
level (kV)
Substation details
Owned By
33 KV lump load
No. of
units
Capacity of each
unit (MVA)
Total capacity (MVA)
MW MVAr
92 Shamuka 132/33 2 31.5 63 10.99 1.91
93 Somnathpur 132/33 1 12.5 12.5 0.00 0.00
94 Sonepur 132/33 3 20 60 34.95 10.38
95 Soro 132/33 1 40
80 28.46 10.72 2 20
96 Sunabeda 132/33 3 12.5 37.5 17.00 3.50
97 Sundargarh 132/33 1 40
60 20.10 5.08 1 20
98 Tentulikhunti 132/33 1 20
32.5 9.69 2.94 1 12.5
99 Tarkera 132/33 1 12.5 40 0.00 0.00
100 Umerkote 132/33 2 20 40 9.00 2.00
101 Bolani 132/11 2 10 20 1.62 -0.49
102 Nandira 132 16.73 0.13
103 REN 220/33 2 20 40 5.05 1.08
104 Sterling 400 0.00 0.00
105 Laksmipur 220/33 1 20 20 4.08 0.76
106 Chiplma 132/11 19.16 6.30
107 Katpali 132/33 1 40
80 24.40 9.70 2 20
108 SPS 220 2.00 0.66
109 Bolangir New 132/33 1 12.5 12.5 4.60 0.30
110 Salibani 132 16.71 2.93
111 Rengli 132 2 20 40 5.05 1.08
112 Samangara 132/33 1 20 20 0.10 0.05
113 Rajgangpur Rly 0.02 0.01
114 Bhulta Rly 132 5.48 1.80
115 Meramandali Rly 132 7.40 1.90
116 Jakhpur Rly ( Dubri ) 132 4.00 1.31

Web based Protection Database and Desktop based Protection setting calculation tool – ERPC
138 PRDC Bangalore January 2017
SI.No Name of the Sub-
Station Voltage
level (kV)
Substation details
Owned By
33 KV lump load
No. of
units
Capacity of each
unit (MVA)
Total capacity (MVA)
MW MVAr
117 Dharma Rly 132 0.25 0.12
118 Tomka Rly 132 0.00 0.00
119 Padwa Rly 132 5.00 1.64
120 Manbar Rly 132 5.00 1.64
121 Maling Rly 132 5.00 1.64
122 Keonjhar Rly 132 7.19 -3.20
123 Bamra Rly 132 0.00 0.00
Bulk Load
124 IMFA1 132 24.00 11.62
125 Damanjod 132 37.70 22.00
126 IRE 132 6.38 1.90
127 FCI 132 0.40 0.19
128 Baminpl 132 18.00 5.92
129 Balasore Alloy 132 50.96 0.34
130 BirlaTyr 132 3.02 0.17
131 PPL 132 0.06 0.03
132 L&T Cem co 132 8.00 0.10
133 Power Max 132 0.22 0.11
134 MCL 132 15.00 0.20
135 Chandiposh 220 18.00 0.50
136 J K Paper 132 0.04 0.02
137 FAP Joda 132 15.58 4.22
138 HAL 132 10.11 4.39
139 BRG 132 6.00 0.85
140 M L Rungta 132 0.33 0.16
141 PPT 132 7.62 1.04
142 RAW MET 132 21.56 7.08
143 Hind Metalic 132 0.00 0.00
144 MESCO 132 3.59 1.18
145 ROHIT 220 20.00 8.00

Web based Protection Database and Desktop based Protection setting calculation tool – ERPC
139 PRDC Bangalore January 2017
SI.No Name of the Sub-
Station Voltage
level (kV)
Substation details
Owned By
33 KV lump load
No. of
units
Capacity of each
unit (MVA)
Total capacity (MVA)
MW MVAr
146 Adhunik 132 32.67 10.74
147 Dahmra Prt 132 4.80 0.76
148 OCL TA 132 7.84 2.58
149 Saliban (Bhuvi Profile) 132 1.50 0.50
150 ESSAR 220 19.10 1.40
151 IOCL 220 0.60 0.20
152 Jabamaye Ferro 132 0.00 0.00
153 Beekay Steels 132 7.84 2.58
154 Arya 132 6.53 2.15
155 Bansapani 132 2.28 -0.93
156 BC Monty 132 18.00 1.00
157 Saintla 132 0.00 0.00
158 Tata Steel 220 70.00 13.00
159 BRPL 132 13.07 4.30
160 MSL 132 3.11 0.79
161 VVC 132 0.00 0.00
162 JSPL 220 32.67 10.74
163 Greed Steel 132 0.00 0.00
164 BRP-Steel 132 13.07 4.30
165 Basundra 220 2.00 0.97
166 Utkal Aluminum 220 0.00 0.00
167 Adity Aluminum 220 0.00 0.00
Sikkim
1 Phodong 66/11 1 5 5
Sikkim Gov
1.08 0.26 1 2.5 2.5
2 Bulbuley 66/11 2 10 20 3.76 0.91
3 Sichey 66/11 2 10 20
6.45 1.55 1 5 5
4 Tadong 66/11 3 5 15 3.76 0.91
5 Rongly 66/11 2 2.5 5 0.81 0.20

Web based Protection Database and Desktop based Protection setting calculation tool – ERPC
140 PRDC Bangalore January 2017
SI.No Name of the Sub-
Station Voltage
level (kV)
Substation details
Owned By
33 KV lump load
No. of
units
Capacity of each
unit (MVA)
Total capacity (MVA)
MW MVAr
6 Mamring 66/11
1 10 10
5.11 1.28 1 7.5 7.5
1 15 15
7 Melli 66/11 2 5 10 1.61 0.41
8 Namchi 66/11 2 2.5 5 0.81 0.21
9 Rabangla 66/11 1 5 5 1.61 0.40
10 Rothak 66/11 2 2.5 5 0.81 0.20
11 Soreng 66/11 2 2.5 5 0.81 0.20
12 Geyzing 66/11 2 2.5 5 0.81 0.21
13 Purano Namchi 66/11 2 7.5 15 2.15 0.54
14 Pakyong 66/11 1 10 10 3.76 0.91
15 Pelling 66/11 1 5 5 1.61 0.41
16 Rhenock 66/11 1 5 5 1.61 0.39
17 Mangan 66/11 2 5 10 2.15 0.52
18 Ranipool 66/11 2 7.5 15 2.15 0.53
19 Topakhani 66/11 1 7.5 7.5
2.15 0.53 66/11 1 5 5
Westbengal
1 Arambagh 132/33 3 50 150
WBSETCL
67.25 22.11
2 Bakreswar 220/33 1 50 50 10.91 6.18
3 Asansol 132/33 3 50 150 90.15 29.62
4 New Bishnupur 132/33 2 31.5 63 20.01 11.12
5 Dalkhola 132/33 3 20 60 21.20 6.97
6 Dharampur 132/33 2 50 100 63.60 11.22
7 Domjur 132/33 3 50 150 71.14 17.79
8 Gokarna 132/33 3 50 150 59.25 19.48
9 Howrah 132/25 2 20 40 9.12 2.66
10 Krishnagar 132/33 2 50 100
81.95 26.93 1 31.5 31.5
11 Laxmikantpur 132/33 1 31.5 81.5 76.70 25.21

Web based Protection Database and Desktop based Protection setting calculation tool – ERPC
141 PRDC Bangalore January 2017
SI.No Name of the Sub-
Station Voltage
level (kV)
Substation details
Owned By
33 KV lump load
No. of
units
Capacity of each
unit (MVA)
Total capacity (MVA)
MW MVAr
1 50
Laxmikantpur Rly 132/25 2 12.5 25 3.34 1.10
12 New Haldia 132/33 1 31.5 31.5
32.01 10.53 132/33 1 50 50
13 New Jalpaiguri 132/33 2 50 100 53.36 17.54
14 New town action area-III 220/33 2 50 100 53.36 11.12
15 Rishra 132/33 3 50 150 56.45 18.55
16 Satgachia 132/33
2 50
131.5 44.46 14.62 1 31.5
Railway Feeder
17 Subhashgram 132/33 2 31.5 63 46.04 19.94
18 Hura 132/33 2 50 100 5.80 1.90
19 Foundry park 132/33 2 50 100 19.75 6.47
20 Midnapur 132/33 2 50 100 37.79 18.31
21 Kolkata leather complex (KLC)
132/33 3 50 150 76.15 23.34
22 Adisapthagram 132/33
2 50 131.5 111.16 36.54
1 31.5
132/25 2 20 40 24.46 8.04
23 Alipurduar 132/66
2 16 52 27.90 9.17
1 20
132/33 1 31.5 31.5 5.34 1.76
24 Amtala 132/33 1 31.5 31.5
50.02 21.12 1 50 50
25 Asoknagar 132/33 2 50 100 54.47 17.90
132/25 2 7.5 15 3.34 1.10
26 Bagnan GIS 132/33 2 50 100 40.35 13.26
27 Bagmundi 132/33 1 20 20 2.60 1.26
28 Balurghat 132/33 4 12.5 50 19.00 9.20
29 Bankura 132/33 2 50
100 33.46 1.22
Railway Feeder 11.23 5.11

Web based Protection Database and Desktop based Protection setting calculation tool – ERPC
142 PRDC Bangalore January 2017
SI.No Name of the Sub-
Station Voltage
level (kV)
Substation details
Owned By
33 KV lump load
No. of
units
Capacity of each
unit (MVA)
Total capacity (MVA)
MW MVAr
30 Barasat 132/33 3 50
150 115.61 37.99
Railway Feeder 8.89 4.30
31 Behala / Joka 132/33 3 50 150 66.57 19.42
32 Basirhat 132/33 2 50 100 48.81 8.88
33 Belmuri 132/33 2 31.5 63 17.79 5.85
34 Berhampore 132/33 3 50 150 108.94 32.97
35 Bighati 132/33 2 50 100 28.46 3.11
36 Birsingha 132/33 2 50 100 43.24 15.23
37 Bishnupur (old) 132/33 1 50 50
26.69 7.67 132/33 1 31.5 31.5
38 Bolpur 132/33 3 50 150 47.80 15.71
Bolpur Prantik TSS 132/25 1.22 0.39
39 Bongaon 132/33 3 31.5 94.5 31.13 10.23
40 Barjora 132/33 2 31.5 63 12.45 3.19
41 Chanditala 132/33 2 50 100 30.38 14.71
42 Chandrakora road 132/33
1 50
81.5 37.11 14.88
1 31.5
Railway Feeder 2.40 0.78
43 Contai 132/33 2 50
100 75.12 26.45
Railway 0.67 0.32
44 Coochbehar 132/33 3 50 150 73.40 24.13
45 Darjeeling 132/33 3 10 30 3.71 1.22
46 Debogram 132/33
1 20
101.5 31.13 0.82 1 31.5
1 50
Railway Feeder 3.78 0.29
47 Dhulian 132/33 2 31.5 63 21.79 7.23
48 Egra 132/33 3 50 150 50.36 4.56
49 Falta 132/33 2 31.5 63
62.25 20.45 1 50 50

Web based Protection Database and Desktop based Protection setting calculation tool – ERPC
143 PRDC Bangalore January 2017
SI.No Name of the Sub-
Station Voltage
level (kV)
Substation details
Owned By
33 KV lump load
No. of
units
Capacity of each
unit (MVA)
Total capacity (MVA)
MW MVAr
50 Gangarampur 132/33 3 20
72.5 33.60 16.41 1 12.5
51 Haldia
132/33 1 50
104
30.79 10.12 1 31.5
132/25 1 10
3.34 1.10 1 12.5
52 Haldia NIZ 132/33 2 31.5 63 1.78 0.58
53 Hizli 132/33
1 31.5 81.5 42.24 10.44
1 50
132/25 2 10 20 14.45 4.75
54 Jangipara 132/33 2 31.5 63 22.38 7.36
55 Jhargram 132/33 1 31.5 31.5
30.42 6.57 1 50 50
56 Kurseong 132/33 3 10 30 0.90 0.50
57 Kakdwip 132/33 2 31.5 63 31.13 10.00
58 Kalan 132/33 2 31.5 63 38.46 18.45
59 Kalyani 132/33 1 31.5
81.5 49.11 17.84 1 50
60 Khatra 132/33 2 50 100 23.57 7.44
61 Katwa 132/33
2 31.5 63 47.82 20.44
1 50 50
Railway Feeder 0.20 0.07
62 Khanyan 132/33 2 31.5 63 27.70 12.23
63 Kharagpur 132/33 2 31.5 63
Kharagpur TSS 132/33 0.06 0.03
64 Khejuria GIS 132/33 2 50 100 19.12 5.55
65 Kolaghat 132/33 3 50 150 40.02 13.15
132/25 2 12.5 25 5.11 2.22
66 Lalgola 132/33 2 31.5 63 17.79 8.89
67 Lilooah 132/33 3 50 150 103.38 33.98

Web based Protection Database and Desktop based Protection setting calculation tool – ERPC
144 PRDC Bangalore January 2017
SI.No Name of the Sub-
Station Voltage
level (kV)
Substation details
Owned By
33 KV lump load
No. of
units
Capacity of each
unit (MVA)
Total capacity (MVA)
MW MVAr
132/25 2 20 40 31.13 10.23
68 Mahachanda 132/33 2 31.5 63
59.35 24.71 1 50 50
69 Mathabhanga 132/33 1 50 50
21.40 4.50 1 31.5 31.5
70 Malda 132/33 3 50 150 94.49 27.40
71 Mahishpota 132/33 2 31.5 63
72 Mankar 132/33 3 31.5 94.5 45.51 14.06
73 Maynaguri 132/33
1 31.5
141.5 28.12 9.25
1 50
2 30
74 Nazirpur 132/33 2 31.5 63 23.79 8.48
75 North Bengal university (NBU)
132/33 2 31.5
113 36.47 17.66 1 50
76 New Town AA 1 132/33 2 50 100 42.91 8.44
77 Pingla 132/33 3 50 150 56.26 18.49
78 Purulia (WB) 132/33
2 31.5 83 39.90 0.99
1 20
132/25 2 12.5 25 7.78 2.56
79 Raghunathganj 132/33
1 31.5
101.5 58.92 35.35 1 20
1 50
80 Raghunathpur 132/33 2 31.5 63 12.54 4.27
81 Raigunj 132/33
1 31.5
96.5 44.00 21.31 2 20
2 12.5
82 Raina 132/33 1 50 50 94.26 25.01
83 Rampurhat 132/33 2 50 100 49.19 12.11
Railway Feeder 1.67 1.06
84 Ranaghat 132/33 2 50 100 67.62 32.75

Web based Protection Database and Desktop based Protection setting calculation tool – ERPC
145 PRDC Bangalore January 2017
SI.No Name of the Sub-
Station Voltage
level (kV)
Substation details
Owned By
33 KV lump load
No. of
units
Capacity of each
unit (MVA)
Total capacity (MVA)
MW MVAr
132/66 2 31.5 63 10.00 4.59
132/25 1 12.5
22.5 8.89 0.03 1 10
85 Sainthia 132/33 2 50 100 51.36 6.89
86 Salt lake 132/33 3 50 150 77.15 25.36
87 Salt lake GIS 132/33 2 50 100 47.91 15.00
88 Samsi 132/33 3 31.5 94.5 46.38 15.24
89 Siliguri 132/33 2 50 100 40.02 13.15
90 Sonarpur 132/33 3 31.5 94.5 48.91 16.07
132/25 2 20 40 10.89 3.58
91 Tamluk 132/33 2 50 100 39.24 11.78
92 Tarakeswar 132/33 1 31.5
81.5 44.91 14.76 1 50
93 Titagarh 132/33 3 50 150 101.58 29.35
Titagarh Rly 132/25 2 20 40 13.21 6.23
94 Ujaano (NBU New) 132/33 2 31.5 63 28.90 9.50
95 Ukhra 132/33 2 50 100 48.52 8.67
96 Uluberia 132/33 3 50 150 83.48 19.45
97 Kuli 132/33 2 50 100 32.24 15.61
98 Food Park 132/33 2 50 100 21.69 6.97
99 Birpara 132/66 3 20 60 30.90 14.97
100 Chalsa 132/66
1 20 30 19.38 6.36
1 10
Chalsa 132/33 2 20 40 6.23 -1.66
101 Serakol 132/33 2 50 100 26.05 9.10
102 Cossipur Rly 132 0.45 0.22
103 Balichak Rly 132 22.14 7.28
104 Dhatrigram Rly 132 4.45 2.22
105 Kalingpong 66/33 16.00 5.26
106 WBIDC 132/33 2 31.5 63 38.54 9.06

Web based Protection Database and Desktop based Protection setting calculation tool – ERPC
146 PRDC Bangalore January 2017
SI.No Name of the Sub-
Station Voltage
level (kV)
Substation details
Owned By
33 KV lump load
No. of
units
Capacity of each
unit (MVA)
Total capacity (MVA)
MW MVAr
107 Resmi Bulk 132 29.52 9.70
108 Tata Metalic 132 6.16 2.02
109 SonarLal 132 18.79 2.89
110 HNIZ 132 22.23 10.77
111 Ambuja Frakka 132 40.02 13.15
112 Hind Motor 132 5.00 1.64
113 HPCL 132 9.26 3.05
114 Madras Cement 132 4.45 1.11
115 Rohit Ferro1 132 0.00 0.00
116 Manaksia 132 0.00 0.00
117 Bencon 132 0.00 0.00
118 Rohit Ferro 132 0.00 0.00
119 Modern 132 10.45 5.02
120 BEL 132 15.00 7.27
121 JK Nagar 220/33 2 100 200 IPCL 46.43 7.99
122 A Zone
132/11 1 20 20
DPL
11.64 3.69 132/11 2 31.5 63
132/33 1 50 50 0.00 0.00
123 B Zone 132/11 6 31.5 189 60.36 19.05
132/33 1 50 50 0.00 0.00
124 AB Zone 132/33 1 50 50 42.00 13.38
125 C Zone 132/11 3 31.5 94.5 16.65 5.29
132/33 1 50 50 17.59 5.56
126 C1 Zone 132/11 2 31.5 63 3.15 1.01
132/33 2 50 100 21.80 6.92
127 Bamunara SS 132/34 2 50 100 44.20 13.84
128 Burnpur 220/33 2 50 100
DVC
1.60 0.12
129 Purulia 132/33 1 50 50 15.25 1.21
130 ASP 132 4 50 200 41.80 9.43
131 Jamuria 132/33 2 50 100 39.00 4.50

Web based Protection Database and Desktop based Protection setting calculation tool – ERPC
147 PRDC Bangalore January 2017
SI.No Name of the Sub-
Station Voltage
level (kV)
Substation details
Owned By
33 KV lump load
No. of
units
Capacity of each
unit (MVA)
Total capacity (MVA)
MW MVAr
132 Kalipahari 132/33 2 80 160 51.14 19.52
133 Kalyaneswari 132/33 2 50 100 64.99 18.28
134 Mejia TPS 220/33 2 80 160 56.70 23.31
135 Barjora
220/33 1 100 100
83.52 6.42 220/33 1 80 80
220/33 1 50 50
136 Durgapur 220/33 1 50 50
107.00 35.17 220/33 2 80 160
137 Waria 132/33 3 50 150 10.20 1.26
138 Waria Rly 132/25 2 25 50 15.43 5.06
139 Belmuri 132/33 1 50
81.5 0.48 0.23
1 31.5
140 Belmuri Rly 132/25 2 25 50 15.06 5.75
141 Burdwan 132/33 2 50
180 48.00 5.00
1 80
142 Burdwan Rly 132/25 3.00 1.45
143 Rumkanali Rly 132/25 7.00 2.00
144 Tamla Rly 220 21.00 6.90
145 IISCOD 220 99.40 -10.40
146 Sonic thermal 132 56.94 2.14
147 Badrinarayan Alloy 132 36.32 11.93
148 Parulia 220/33 2 80 160 76.00 24.98
149 Howrah 132/33 2 55 110 0.09 0.04
150 EMSS 220/132 /33 5 160 800
CESC
53.00 22.58
18.00 7.67
18.00 7.67
59.00 25.13
46.00 19.60
151 Belur 132/33 3 50 150 132.50 13.14
152 BT Road 132/33 1 75 150 27.00 9.10
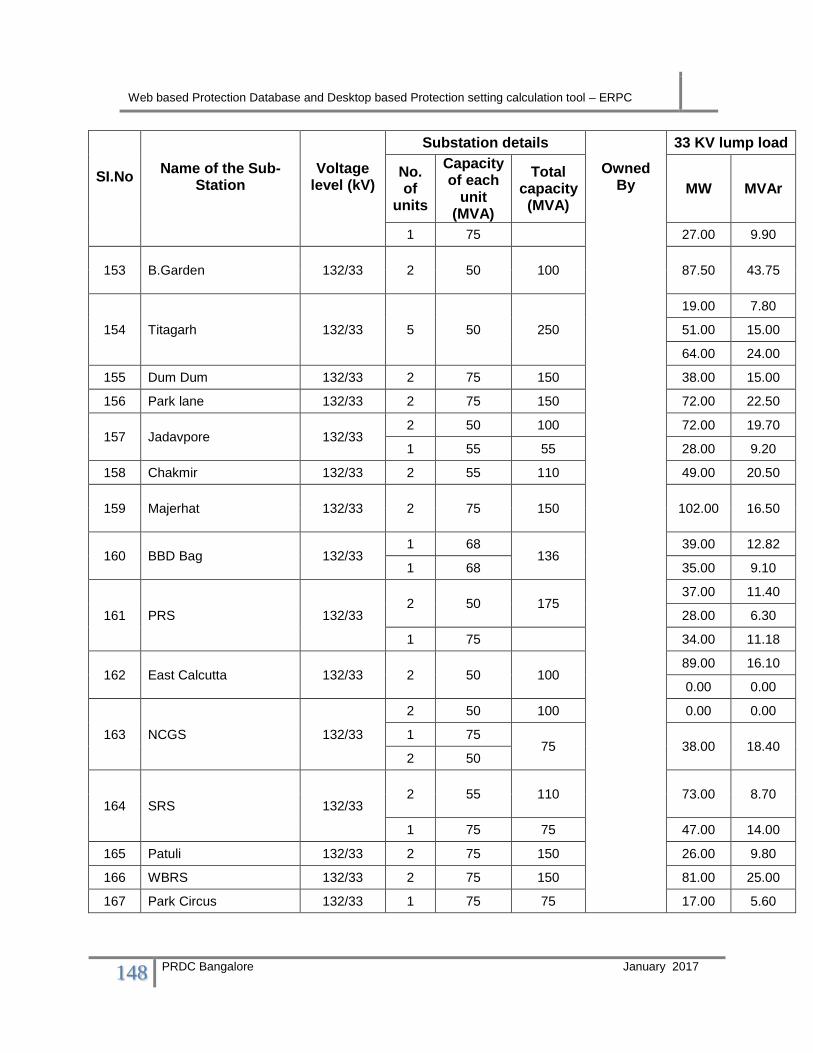
Web based Protection Database and Desktop based Protection setting calculation tool – ERPC
148 PRDC Bangalore January 2017
SI.No Name of the Sub-
Station Voltage
level (kV)
Substation details
Owned By
33 KV lump load
No. of
units
Capacity of each
unit (MVA)
Total capacity (MVA)
MW MVAr
1 75 27.00 9.90
153 B.Garden 132/33 2 50 100 87.50 43.75
154 Titagarh 132/33 5 50 250
19.00 7.80
51.00 15.00
64.00 24.00
155 Dum Dum 132/33 2 75 150 38.00 15.00
156 Park lane 132/33 2 75 150 72.00 22.50
157 Jadavpore 132/33 2 50 100 72.00 19.70
1 55 55 28.00 9.20
158 Chakmir 132/33 2 55 110 49.00 20.50
159 Majerhat 132/33 2 75 150 102.00 16.50
160 BBD Bag 132/33 1 68
136 39.00 12.82
1 68 35.00 9.10
161 PRS 132/33 2 50 175
37.00 11.40
28.00 6.30
1 75 34.00 11.18
162 East Calcutta 132/33 2 50 100 89.00 16.10
0.00 0.00
163 NCGS 132/33
2 50 100 0.00 0.00
1 75 75 38.00 18.40
2 50
164 SRS 132/33 2 55 110 73.00 8.70
1 75 75 47.00 14.00
165 Patuli 132/33 2 75 150 26.00 9.80
166 WBRS 132/33 2 75 150 81.00 25.00
167 Park Circus 132/33 1 75 75 17.00 5.60

Web based Protection Database and Desktop based Protection setting calculation tool – ERPC
149 PRDC Bangalore January 2017
ANNEXURE II – POWER MAP OF ER GRID AND ITS CONSTITUENTS STATES AND LINE LOADING DETAILS

JHARKHAND
WEST BENGAL
ORISSA
SIKKIM
BIHAR
Jeypore
# 5, 11th cross, 2nd Stage,West of chord Road,Bangalore-560086.INDIATel :+91-80-4245 5555E-mail:[email protected]
LEGEND
Baripada(Kuchei)
Haldia
Malda_PGCIL
Jeerat
Subashgram
Rangpo
Indravati
Display NotationInjection into the bus : +veDrawl away from the bus : -veVoltage Mag/(Ang) in pu /degreeFlows in MW and (Mvar)
765 kV S/S
400 kV line
TM
Power Research & Development ConsultantsPrivate Limited
MiP-PSCT
Gaya
Farakka
Maithon-RB
Barh
Balia
Bakreshwar
Behrampur
Mejia
Nabinagar
TSTPS
Kahalgaon
Chaibasa
Rengali
Bidhanagar
Ranchi
APPROVED
Sipat
Gorakhpur
Dharmjayagarh
Ranchi new
Adhunik
Biharshariff
Kolar
Sterlite
Sasaram
Arambagh
Keonjhar(PGCIL)
Angul
Bolangir_PGCIL
JITPL
BisraKharagpur
Tala
KTPS
Teesta 5
KodermaMaithon
GMR
Jharsuguda
TISCO(DVC)
Raigarh
Indravati(PGCIL)
DRAWN USING :
Existing
Jamshedpur
4km
225 km, Twin Moose
Sagardighi
DSTPS
PPSP
Muzaffarpur
Allahabad
JSPL
Bongaigaon(NER)
356
km, T
win
Moo
se
2X350 MW
Meramundali
2X600 MW
6X135 MW
3X600 MW1X600 MW
6X500 MW
2X300 MW
3X210 MW
TALA6X170 MW
4X225 MW
FARAKKA3X500 MW3X200 MW
4X210 MW+3X500 MW
2X500 MW
2X300 MW
2X210 MW
2X270 MW
Patna
288k
m
72km
Mendhasal
GMR-3rd unit
1X350 MW
Ind-Bharath
RaghunathpurParullia
Banka
2X525 MW
Binaguri
Bheramara(Bangladesh)
Purnea
TEESTA3X170 MW
2X500 MW
2X500 MW
Lakhisarai
232 km, Quad Moose
240 km, Quad Moose
48 k
m
217 km, Quad Moose
184 km, Twin Moose
192 km, Twin Moose
132
km
89, 102.5 km
321 km, Quad Moose
Fathepur
228 km Quad Bersimris215 km, Twin Moose
76 km, Twin Moose
Saranath(Varnasi)
356 km, Quad Bersimiris
195km, Quad Moose
2X660 MW
261 km, Quad Moose
400 kV S/S
765 kV line
Thermal generationHydro generationPumped storage plant
198 km, Twin Moose
68km
18, 25km
52.3km
99km
171
km, T
win
Mo
ose
100km
156 km, Twin Moose135km
230.4 km, Twin Moose
24km
120 km, Twin Moose
147 km, Twin Moose
110 km, Twin Moose
62.5
km
91 km, Twin Moose
272 km, Q
uad Bersimiris
151 km, Hexa Zebra
182 km, Twin Moose
145
km, T
win
Moo
se
39km
116km
141 km, Tw
in Moose 100km
46 km
0.3km
161 km
177 km
168 km
153k
m
78.6 km
200 km, Twin Moose
405 km, Twin Moose
155,169 km
53km
188 km, Twin Moose
31km
126 km
111k
m
172k
m
277km
84,9
7km
70.7km
70.5 km
185 km, Twin Moose210 km, Twin Moose
80km
90km78km
136 k
m, T
win
Moose
130km
163 km, Twin Moose
200 km, Tw
in Moose
8 0km
11km
246 km, Tw
in Moose
171k
m
150
km, T
win
Mo
ose
26km
73 km, Tw
in M
oose 71km-Indian portion
67 km
95 km, Twin Moose
40 k
m
167 km, Tw
in Moose
168km, Twin Moose
110 km, Twin Moose
Malbase
98,115 km
121k
m
50km
217 km, Twin Moose
12km
81 km, Twin M
oose
Bokaro
220 km, Quad Moose
115km
1X350 MW
Duburi 192k
m
97km
REVIEWED CHECKED DRAWN DESCRIPTION REV DATE REMARKS
Twin
Mo
ose
619
(64) -623
(-21)324(
289)
(-165)
-326
0.98
0.99
Kishanganj
(4)211
-212(61)
0(0)
(0)0
457(148)
-460 (-116)
-274
(1)
273
(99)
1.00
72 k
m
274(111) -274 (26)72 km, Quad Moose
0(0)
0
(0)
347 km, Quad Moose
180 km, Quad Moose
1.01
-139(64)
-151(46)
93,69 km, Quad Moose
710 (282) -711 (-231)
-314 (194)
349 km, Quad Moose
656(66)-660(191)
405
(75) 1.02
-590
(-5)
589(
43)
1.01
1859
(-330)
145 km, Twin Moose
-20(
-24)
20(7
5)
-21
(-23
)21
(75)
Twin
Mo
ose
85(169)
-86 (49)
619(-33) -624 (49)
1.01
1.02
-430(135)429(-139)
-563(31)
558 (26)
1.01
-280
(181
)
280
(-24
)Q
uad
Mo
ose
-6 (381)
347(30)-349(18)
-108 (254)
197 (295)
-43 (-37)
-192(41)
1.00
-0(90)
0(-0)
1.00/
1.00
0.99
-290(167)
-229 (330)
100 (-4)
-100(187)
1.00
501(192)
-504(-27)
/
272 km, Quad Moose
-230 (29)
341 km, Quad Bersimiris
1.01
1.00
1.00
(-122
)
714
-717(95)
0 (0) 0 (0)
1.01
-240
(-5)
239
(59)
1.00 -444 (122)
442(-23)
1.00
329
(-3)
-329
(15)
330(11)
720
(-34
)
0(0)
0 (0)0
(0)
438(0)
0.00
2X500 MW
100 km, Quad Moose
-489 (67)
416(117)
1.03
74(-69)
-74 (95)
-538(91)
536 (-28)-72 (98)
72 (14)
-344
(65)
343 (-47)
301 km, Quad Berm
iris
344.6 km, Quad Berm
iris
1.00
-308(-180)
307 (407)
1.001.01
315 (-70)
/ /-78 (36)
78 (183)
/
215(60)
-215
(97)
1.03
706 (137)-709 (-10)
-25(
57)
25(33)
74 (160)
1.02-314(95)
313(79)
389
(0)
1.03
1.03
147(48)
-148(44)
861(47)
1.03
84(49)
-84(52)
-221(13)1.03
222(-2)
Twin Moose
211(11)
-211
(8)
110(57)
-111(22)
64(54)
-64 (12) 1.03
236
(68)
-237(-46)
1.02
-190
(63)
189(-18)
341(-48)
-344(44)
131 km
Twin Moose
1.01
-3 (17)
3(200)
-296(36)
295(193)
300(-43)
1.04
1.01
848
(123
)
1960
(190)
357
(-12)
-384(33)
382(-12)
1.02
-115
(28)
115
(8)
-115
(75)
115 (
8)
1.02-308 (25)308(3) 1.02
266(
43)
-270(-51)80(1
40)
-80
(57)
1.00
78(-33)
-78(47)
256(-5)
-258(16)
364
(55)
-419(10)
-270
(0)
268
(37)
495
(40)
1.03-526(32)
1.03
0.99262(26)
-264
(25)
1.02
-105(-10)
105
(52)
297(
94)
-299 (-44)
106(-9)
0.98
-535
(78)
533 (-9)
538
(-18)0.98
1.02
-17(34)
17(18)
1.02
342(59)
-223
(21)
222
(27)
1.02
217(-85)
-219(110)
1.00
-220 (81) 219 (-37)1.00
0 (0)
0(0
)
0.98
0.96
163(30)
-16 4(-
19)
153
( -28
)
-153(123)
351(-31)
-352
(118
)
1.00
-42
(333)
99(-70)
-99
(466
)
-120
(-63)
120(96)
1.03
1.02
0(0)
173(22)
0 (0)
0(0
)
0 (0)
222 km, Twin Moose
273(-22)
-276(52)
0.98
-891 (168)890 (-234)
384(137)
-384
(-98)
30 km
317(
-57)
-323 (33)
0.98
Twin
Mo
ose
0.99
-535(200)
529(-170) 1.00
-224
(46)
223 (-1
5)
0.98
81(-58)
-81(60)
0.98
-311(28)
304
(4)
758(45)
-763(-1)
Twin Moose
0.99
-480
(178
)
242
(-44)
-243
(72)
68 k
m
136 (-30)
-136(56)
8.5k
m
2309(194) 385
(123)
0.99
0.99151
(25)
-151 (-21
)15
1(26
)0
(0)0
(0)
0.99
-124(-54)
124 (95)
0.99
37.9km
695
(244)
0.99
1.00
-113
4(-3
9)
1126
(21)
1140(154)
/
Eastern Region existing network (August-16) geographical map14, Golf Club Road, Tollygunge,Kolkata, West Bengal 700033
Eastern Regional Power Committee
LOA details: ERPC/PR_DBASE/2016/3567 Dated 30 March 2016 DWG. NO. : Geographical Power Map\August-2016\ER
2(41)
-212 (-86)
-212(-86)
-310(155)
-202 (24)
294(132)
294(132)
176 (192)
120
(63)
R0 20/12/2016
Gazuwakka
-195
6
(-27
7)
Chandawa0.99
851
(- 13)
117 km
Qu
ad M
oose
//
69km
Quad M
oose
//
//
166 (43)
-167(41) 161.5km
Twin moose
403(1)
-405(17) 70.5km
Twin moose
Pandiabil0.97314 (49)
25km
-538 (-6)
531
(-8)
130k
mTw
in m
oose
0(0
)
0(0
)T w
in m
oos
e29
5km
//
//

Kaimur
BHAGALPUR
SAMASTIPUR
PURBA CHAMPARAN
SHEIKHPURNalanda
LAKHISARAI
VAISHALI
MADHEPUR
NAWADA
AURANGABAD
BUXAR
BHOJPUR
BEGUSARAI
PATNA
MUZAFFARPUR
NALANDA
KHAGARIA
SITAMARHI
GOPALGANJ
PASCHIM CHAMPARAN
SIWAN
SARAN
SHEOHAR
MADHUBANI
SUPAULARARIA
KISHANGANJ
PURNIA
KATIHAR
JAHANABAD
ROHTAS
GAYAJAMUI
DARBHANGA
MUNGER
SAHARSA
7.2 km Panther
MUSHRAKH
MOTIHARI
DHAKA
MTPS
BEGUSARAI
MADHUBANI
KODERMA
Lakhisarai TSS
KHAGARIA
UDAKISHANGANJ
SONEBARSA
KAHALGAON (BSEB)
PANDAUL
Baripahari
JANDAHA
GAYA-PG
DEHRI
HAJIPUR TSS
SASARAM
CHANDAULI
ARRAH RLY MITHAPUR
HFCL BIOFUELSUGAULI
SWADESHI SUGAR MILL
SURAJPURA (HEP) (NEPAL)
VALMIKI NAGAR HEP
MUZAFFARPUR-PG
DARBHANGA OLD
JAINAGAR
PULPARAS
PURNEA
FORBESHGANI
Kataiya
EKANGASARAI
MASAURHI
Digha
GOH
RAFIGANJ TSS
TENUGAT TPS
KARMNASA
SONENAGAR
Panther
11 km
38 k
m P
anth
er
188 km Panther
BIHARSHARIFF
SASARAM-PG
20 k
m
IMAMGANJ
- 16(-2)
(3)
30 km Pant her
5 (-1)
40 k
m P
anth
er
77.8km Panther
Sipara BS
4 km
17 k
m
40km
Pan
ther
60.8
km
Pan
the r
MOKAMA RLY
NAWADA
95 km, Twin Moose
1 km
16 k
m
31.9 km Panther
3.5 km Pan
ther
50.35 km
1.33 km
50.9 km Panther
89 km Twin Moose
SABOUR
56 k
m P
anth
er
111 k m, Q
ua d Moo se
1 X 18 MW
1 x 195 MW
4 x 210 MW
-91
MOHANIA
AURANGABAD
NEW PURNEA-PGARRAH
KATIHAR
1.7 k
m
1 05
k m P
anth
er
TO DEOGHAR
5 km
26 kmPanther
30 k
m
16
Fatuah
KUDRA TSS
ARWAL
BARAUNI
BUXAR
RAMNAGAR
RAXAUL
GANGWARA
KISHANGANJ
41.5 km Panther
37.1 km Panther
61.5 km Panther
3 x 500 MW
12.5 km Panther
BETTIAH
45 km Panther
Ekma
101.35 km Zebra
RUNNISAUDPUR
JAGADISHPUR
DUMRAON RLY
BIKRAMGANJ
TEHTA
TEKARI
JAHANABAD
WAJIRGANJ
HULASGANJ
62(18
)
NALANDA
PATNA
(0)
HAJIPUR
Harnaut
SKMCH
SAHARSA
KHUSRUPUR RLY
JAKANPUR
KATRA
BHARAT SUGAR MILL
BODHGAYA
SHERGHATITAP
BELAGANJ
SITAMARHI
Vaishali
RAFIGANGJ
126
km
RIHAND
341 km, Quad Bersimis
4.6km
2 x 110 MW
JAPLA
GOPALGANJ
SIWAN
HAJIPUR NEW
DALSINGSARAI
CHHAPRA TSS
NAUGACHIA
55 km Panther
BIHTAGaighat
3 X 5 MW
1 X 10 MW
1 X 20 MW
BARIPAHARI
KHUSRUPURRLY
BIHARSHARIF BSEB
KHAGAUL TSS
93 km Quad Moose
26 km Zebra
SIPARA
FATUHA
PATNA-PG
HARNAUT
KATRA
GAIGHAT
ARRAH-PGBALIA-PG
JAHANABAD
DIGHAKHAGAUL
BARH-NTPC
BARH-NTPC
BARAHI
MAINTHAN
52 km Panther
35km Panther16 k
m
12 km
0.6 km
1km
27 km Panther
11 km
26km
14.5
km
2 km
16.1 km
Pant
her
35 k
m
22 km
14.5
km
10 km
10 km Panther
95 km Zebra
20 km Panther
21 km Panther
23 k
m
30 km
28.9 km
40 km Panther
30 km Panther
10 km Panther
152 km Zebra
Panther
60 km Panther
101.2 km PantherPanther
MADHEPURA
50km
Pan
ther
150 km Panther
50 km
5 km
1km
5 km
Pan
ther
2km
16 km
23 km P
anther
40 km
Panther
17 k
m P
anth
er
28 km Zebra
30 k
m P
anth
er
7.2km
242 km, QUAD M
OOSE
35 km
LAKHISARAI-PG
232 km, Quad Moose
2 X 110 MW
70 km Panther
76 km Panther
195 km, Quad Moose
BANKA NEW
68.5 km Zebra
198 km, Twin Moose
126 km, Q
uad Moose
QUAD MOOSE
MASAURHI
167, Twin Moose
217 km, Quad Moose
272 km Quad Moose
2 x 660 MW
40 km Panther
6 km
Pan
ther
131Km
10 km28 km Panther
70km
Pan
ther
2 km
50km
85 km Panther
70 km
Pan
ther
18 km
195 km
50 km
38km Panther
35 km Panther
19 km
SULTANGANJ
DARBHANGA NEW
Geographical Diagram of Existing Bihar Network (August-16)
DALKHOLA-PG
BANKA
184 km, Twin Moose
BANKA-PG
88.6 km Panther
98 k
m, Q
uad
Moo
se
SARNATH
220kV S.S
132kV S.S
220kV Line
400kV S.S
Hydro Generation
400kV Line
Thermal Generation
132kV Line
LEGEND
765kV S.S
765kV Line
Load
BALIA-PG
GORAKHAPUR-PG
41 k
m P
anth
er
28 k
m
LAKHISARAI
SHEIKHPURA
BINAGURI-PG
MALDA
FATEHPUR
182 km, Twin M
oose
SUPAUL
BANJARI
41 km
145 km, Twin Moose
40 k
m P
anth
er
24 km
Panther
21 k
m P
anth
er
100 km Zebra
356 km, Quad Bersimis
ALLAHABAD
349
km, Q
uad
Moo
se
168
km, T
win
Moo
se
240 km, Quad Moose
48 km, Tw
in Moose
53 k
m Z
ebra
29km Panther
SAHUPURI
228 km, Q
uad Bersim
is
FARAKKANTPC
BIHTA
197 (295)
76 km, Twin Moose
Duhabi(nepal)
Zebra
41 km Zebra
80 km Zebra
65km Zebra
112k
m Zeb
ra
Zebra
0.5 km Zebra
JAKKANPUR
MITHAPUR
JAMALPUR
ARRAH-PG
DUMRAON
HATIDAH
CHHAPRA
60 km Panther
136km Panther
10km
57 km Panther
34 km Panther
23 k
m
SAMASTIPUR
25 k
m
33 km Panther
6km Panther
6km
15 k
m
172
km, T
win
Moo
se
APPROVED REVIEWED CHECKED DRAWN DESCRIPTION REV
20/12/2016
Bihar state existing network (August-16) geographical map
DRAWN IN : MiP-PSCTTM
Power Research & Development ConsultantsPrivate Limited
#5, 11th Cross, 2nd Stage,West of Chord Road,Bangalore- 560086, INDIAPh : +91-080-4245 5555E-mail : [email protected]
Display Notation:Injection into the bus : +veDrawl away from the bus : -veVoltage Mag in PUFlows in MW and (MVAr)
SYMBOL
13 2 k m T w
in Moo se
215 km, Twin Moose
17 k
m
45 K
m P
anth
er
55 k
m P
anth
er
75km Zebra 6km
71 km, Zebra
26 km Panther
59.6
km P
anth
er
27km Panther
15km
Chandauti
Pan
ther
41 km Panther
24km
35 km Panther
30.2
km P
anth
er
45 km
70 km Panther
15km15.5km
16.7km71
.8 km Panther
85.2km Panther
28 km
30 km Panther
16km
1km
90 k
m P
anth
e r
Chaundathi (Gaya)
40 km
39.7 km
35 k
m P
anth
er
49 km Panther
Jamui
45 km Panther
25km
1km
KCL
Paharpur TSS
35km Panther
Jhaja TSS
31 km Panther
47km Panther
16/14 km
Khagul
-424
(-173)
1
-623 (-21)
619 (64)
324
(289
)
-326 (-1
65)
211(
4)
457 (148)1
0(0)
0 (0)
558
-563
(31)
(26)
-430 (135)429 (-139)
2 8 0( -24 )
(8)
(72)
347 (30)
-349
(18)
-108(254)
1.01
0.99
290
(343
)
-290(167)
-100 (187)
501 (192)
1.00
-192 (41)
-43 (-37)
1.00 1.00
619 (-33)
-624 (49)
1.01
589
(43)
-590 (-5)
1
(84)
1
656 (66)
-660 (191)
1.02
710 (282)
(-27)
(-231)
1.01
289
(341)
-289
(109)
289
( 341)
-160(-9)
158
(24)
83 (26)
0.98
0.96
0.96
-96 (-3)
95 (7)
0.97
-131 (-6)
129(3)
0.95
22 (32)
0.97
0.97
0.98
-202
(-12)
-22
1.00
(31)0.99
0.99
-2(-9)
1(18) 0.99
39
-164 (30)
39
(-27)
94
(8)
0.99
-280(-44)
13(5)
15(5)
-123 (-8)
123(9)
187
(-17)
54 (-0)
14 (1)
1.01-21 (8)-1 (-0)
1(1)1
(-1)
-1 (3)
1.01
17(8)
-18
(-8)
1.01
1.01
0.99
0(0)
0(0)
33 (12)
-33 (-11)
0.99
46(-12)
0.98
8 (3)0.98
-121
(-20
)
0(0
)1.000.96
-7(1
)
7(0
)
0.98
-33 (4)
32 (-3)
-20 (16)0 (0)
-1 (3)1 (4)
0(0)
0(0)
38
(11)
0.97
46 (-6)
-48
(6)-57 (5)
56 (-6)
0.97
0.96
(7)
0.96
9(0
)
-9(2
)
(10)
-12
18(3)
-18(-1)
0.95
-62 (10)
60 (-12)
0.95
0.95
18(6
)
-18
(-5)
0.93
-13 (
-0)
13
(3)
-45 (10)
44 (-10)0.93
-6 (-2)
(7)
0.93
0.94
26(-
2)
-27
(3)
0.94
25(-1)
-26 (5)
0.94
-18
(12)
18(-9
)
1.02
-31
(-13)
31 (14)0.95
-71(-4)
67(-
3)
-26 (4)
26 (-1)
220 (15)
0.97
-19
(-2)
19(5
)
0.97
0.95-53(1)
51(-3)
75(10)
-24 (2)
-38(4)
38 (-1)
0.95-2(3)
2
0(0)
0 (0)
0.93
0.95
-22(-7
)
21 (8)
0.93
-119(2)
117(-5)
11(-22)
-12(24) 0.94
-83(-1
1)
81(11)
0.90
-122
(-17)
0.94
-40(-5)
12(12)
13(-10)
-14(12)
0.95
8 (-3)
-8(5
)
-12
(6)
12 (-5)
0.95
-28(11) 28
(-10) 0.95
-55
(9)
55 (-9)
0.95
-46 (3)
45 (-1)
0.94
MUZAFFARPUR0.95
18(3)
111
(2)
-72
(-5)
72 (3)
0.96
0.93
-3(3)
3(-2)
0.93
7 (-11)
-7 (13)
-13(2)
12 (-0)
0.93
-31(4
)31
(-3)
0.94
-40 (6)
39(-5
)
13
(0)
-13 (1)
0.93
0.93
8(-7)
-8(9)
0.94
0 (-0)
-0(4)
-0(1)
0(-0)
0.94
0.94
(0)-0
0.93
0.99
22 (8)
16(6
)
0(0
)
3(2
)
0.98
0(0)
1.01
-43(-11) 42
(11)
0.94
-63 (-20)
0.95
174
(- 22)
0.98
0.97
0.97
15 (-7)
-16 (10)28(-8)
31 (-1)
26 (0)
-4 (2)
4 (2)
0.98
0.98
0.97
0.97
11(-4)0.97
0.98
-1 (9)1 (-8)
8(3)
0.980.98
-12 (3)
12(-2)
0.98
-5( 2
)
0 (0)
(0)
50 (8)
-11 (-2
)
11
(4)
-16 (12)16(-11)
-29
(-4)
29(6
)
0.97
-11
(1)
11 (1)
0.98
0.99
0.99
(-6)
-9(-
3)
9(4
)
0.99
0(0)
0 (0)
17 (4)
-17(-4)
25(5)
0.99
2 (4)
-2 (-4)
0.99
0.97-19(-6)19 (6)
-8
(-3)
8(3)
0.97
0.96 26 (0)
-27 (2)
-19
(-1)
19(2
)
0.98
7 (2)
0.98
-13
(-4)
0.98
0.99 0.98
0.97-26(-2)
25(3)
0.96
37
(3)
2 (0)
0.97
(-1)
0.98
(2)
4
-23(5)
97(1
7)
0.96
5 (-1)
0.96
-14 (5
)
0.96
-61
(-3)
60 (3)
0.96
0.980.99
5(2) 0.98
-12 (2)0.98
-21
(7)
0.98
0.98 0.97 0.96
60(2
3)
0.96
0.93
0.94
0.95
0.91
0.99
-67 (3)
66(-
2)25
.3 k
m P
anth
er
0(0
)
19(-3)
-19(5)
2 km
27 k
m
37 (-2)
35km Panther
0.97
-4
(1)
4 (2)
66 k
m P
anth
er
Khuswesthan
5(2)
-5(-2)
0.98
-26 (6)
Panther
0(0)
0.99
-5 (1)
5(2)-5 (2)
5(2)
0.98
Patratu
-8(-2)
-13(-4)
-30(-9)
-42
(-16
)
-16
(-5)
-19(-6
)
-8(-2)
-6(-2)
-20(-6)
-10(-2)
-22
(-7)
-18
(-8)
-24(-7)
-11(-3)
-16 (-2
)
-26(-8)
-37(-12)
-49(-15)
-55(-17)
-21(-3)
-48
(-16
)
-30
(-11
)
-40(-13)
-10
(-6)
-25
(-6)
-4(-2)
-22(-7
)
-37
(-11)
-25
(-8)-6
(-2)
-32 (-1
0)
-18(-6)
-10(-3)
-26
(-8)
-6(-2)
-7(-1)
-13
(-4)
-30(-9)
-45(-14)
-13 (-4)
-7(-2)
-19(-6)
-20(-7)
-19(-6)
-8(-3)
-18(-6)
-12
(-4)
-15(-0)
-6 (-2)
-26
(-9)
-5 (-2)
-12(-4
)
-12
(-3)
-8(-3)
-19
(-6)
-11
(-4)
-15
(-5) -15(-5)
-20(-7)
-40(-13)
-10(-3)
-14(-4)
-19(-6)
-42(-9)
-14(-5)
-13(-4)
-11
(-4)
-25(-8)
-27 (-8
)
-25
(-8)
-27
(-8)
-8(-3)
-28
(-9)
-17(-8)
-33
(-10
)-32
(-14)
-39
(-12)
-6(-2)
-31(-10)
-17
(-6)
-28
(-9)
-16(-6)
-46
(-19
)
(-16)
-60(-19)
-51
(-20)
-8(-4)
-26(-8)
-5(-2)
(-5)
-26 (-8)
8(3)
0.97
0.95
14.11 km
-4 (0)
4 (3)
27km
149
km P
anth
er
BIHARSHARIF-PG
0.97
-6
274
1.00
0
0.98
RAJGIR
12(1)14
2 km
6 km
12(-12)30/31 km
(-168)552KAHALGAON-NTPC
1298
(-346)
-10(-3)
404
(61)
(-0)
(20)
0(0)
-34
199
(8)
0 (0)
122(11)2 km
6(2)
PAHIYA KARKHANA RAIL
-126
(19)
125
(-9)
0(0)
100(38)
-338 (25)
53 (-4)
-55(2)
12(-2)
0.94
0.94
261 km, Q
uad Moose
SHEETALPUR
-711
72-173 (-3)
-16
(29) (-2)
90 k
m P
a nth
er
26 km Panther
52
(4) -52
-28
2(0
)
-91
(-32)
-40
55(9
)
30.5 km
179
-128(-2
)
0(0)
REMARKSDATE
(4)
-310-190
48
30.1 km
0.95
0.98
0.97
-0(-0)
0(-0)
-0(0)
Panther8 km
HARINAGAR SUGAR MILL
0.94
-0(-0)
1 X 14.5 MW
1 X 14.5 MW
0(-0
)-0 (0)
10 k
mPa
nthe
r
0.94
HFCL BIOFUEL LAURIYA
43(-
3)
-44 (7
)
0.991.00 321 km, Quad Moose
1.00NABINAGAR RLY
0(-0)
-0(90)
1 X 250 MW
0(0
)
81 k
mTw
in M
oose
1.00 0.99Pusauli New
(-9)
128 (9)
-140.98
KUDRA
-2 (-4)
2(5) Panther
46 km25 km
Panther
VARANASI
-459 (359)
-7
(5)
7(-1)
46 km Panther
-314(194)
0 (0)
0(0)
-34
(-11)
102.5 km Twin Moose
203 km, Twin Moose (381)
85
40(1
50)
1.01
-33(9)
LalmatiyaJUSNL
0.97
24 km
336(-30)
Dhalkebar(Nepal)
126
km T
riple
Sno
wbird
-53(0)
KISHANGANJ-PG1.00
0.98OLD PURNEA-PG
DALKHOLA
-157(-7) 2 km
69 km Quad Moose
180 km QUAD MOOSE
KISHANGANJ-PG
0 (0)
347 km Quad Moose
347 km Quad Moose
0 (0)
280 (44)
Zebra
0.99 98 km, Twin Moose
274 (
111)
14(17
)
128
(9)
(-9)
-128(-2
7)
26.3
km
-0(-9)
-173 (-27)
Pant
her
1.02
20 (-15)
39.5 km
-72 (4)
40 km
136 km, Zebra
-24(-6)
24 (6)
(-12) -12
KOCHAS0.98
-20
(3)
116 k
m Zeb
ra
20 (-0)
Zebra
45 km42 km
-46(-14)
-37 (3)
-66(-2
6)
65 (25)
Panther
0(-0)
-0(1)Zebra
-0(-0)
-13(3)
13(-0
)60 km
-6 (2)
6(1)
52 k
m
(-5)-95
(40)Zebra
-92
(-29
)
Pant
her
39 km-4(2)
Panther-98 (-17)
7 (0)
Panther
30 km
PATNA
Pant
her
Panther
-48
(-3)
-28 (10)-0(-0)
-11
(-6)
11
1 X 10 MW
-0(-0)
HASANPURSMG
0.97
Panther
-11
(-4)
11(7
)55
km
Pan
ther
Ekma Tap0.9313
(-2)
2 (4)
35 k
m
-53
(-17
)
SHERGHATI
0.9728 km
14(5)
-10(-3)
0 (0) 6 (2)(1)-6
4 (4)
-4 (2)
Panther
63.5 km Panther
17
(6)-17
-19(-6)
-65(-20)
KARBIGAHIYA0.96
13(1)
2.5
km
Cabl
e
-12(-4)
10 km
-0 (-0)
0(-
0)-0
(0)
10
km
Pan
ther
-48
(-15
)
9(-1)
138
km P
anth
er
0(0
) -21(-7)
Pant
her
14 (-12)
34(-
6)
0
-37(-12)
CGP
PARTICULARS
DWG. NO. : Geographical Power Map\ER\August-16\Bihar
14 Golf Club Road, Tollygunge,Kolkata, West Bengal 700033
Eastern Regional Power Committee
LOA details: ERPC/PR_DBASE/2016/3567 Dated 30 March 2016
-274 (1)
273 (9
9)
-102(-17) 31 km, Zebra Dalkhola (PG)
(17)
102
108 km, Zebra Shiliguri (PG)
6
(2)
-19
(-6) -10 (-3
)
-23 (4)
23 (-4) -10 (-4)
10(4) -43 (-14)
-5 (-2)
-5 (-2)
-5
(-2)
-8
(-3)
R0
N
CGP
CGP
CGP
CGP
CGP
CGP
CGP
-10(-5) 10
(6)
-11(8)

EASTSINGHBHUM
DHANBAD
KODERMA
HAZARIBAGH
RANCHI
LOHARDAGA
SARAIKELA
GUMLA
TOWARDSFARAKKA
TOWARDS JODA
TOWARDSDHARMAJAYAGARH
RAJKHARSAWAN
TOWARDSKAHALGAON
TOWARDSMEJIA
TOWARDSJAMURIA
1 km
34 km, Panther
72.5 km, Twin Moose
1 km
98 km, Zebra
105
km,
Pan
ther
79 km, Zebra
47 km, Panther
22 km, Zebra
7.6
km,
Zeb
ra
42 km, Zebra
60 km, Lark
45 kmHAZARIBAGH
153 km, Twin Moose
HYDRO
APPROVED
Geographical Diagram of Existing Jharkhand Network (AUGUST-16)
MiP-PSCTTM
PAKUR
KENDPOSI
Power Research and Development Consultants Pvt. Ltd .
Jharkhand state existing network (August-16) geogra phical map
DRAWN IN :
TOWARDSGAYA
GARHWA
JAPLA
43.6 km, Panther
KAMDARA
95.5 km, Lark
50 km
25.3 km, Lark
RANCHI_PG
53 km
, Twin M
oose
DUMKA
RAGHUNATHPUR
57 km, Lark
31 km, Twin Moose
169 km, Twin Moose
116
km, T
win
Moo
se
TOWARDSDSTPS
177 km, Twin Moose
71 k
m, P
anth
er
CHAIBASA
RAMCHANDRAPUR
DALTONGANJ
16 km, Panther
405 km, Twin Moose
100 km, Tw
in Moose
126 km, Quad Moose
765 kV
GENERATION
N
KODERMA_D
182
km,
Twin
Moo
se
BARHI
43.74 km, Panther20
km
, Pan
ther
CHARADHARPUR
4 km, Panther
156 km, Twin Moose
34.5
km
, Zeb
ra
36.5
km
, Pan
ther
44 k
m, Z
ebra
139
km, L
ark
20.1
km
, Pan
ther
100.92 km, Zebra
54 km, Panther
10 k
m
95 k
m, P
anth
er
Lark
7 km, Panther
ADHUNIK IPP2X270 MW
TOWARDSBARIPADA
NOAMUNDI
0.3 kmQuad Moose
141
km, T
win
Mo
ose
NAMKUM
30 km, P
anth
er
ADITYAPUR
TTPS
42 k
m, P
anth
er
46 k
m, P
anth
er
131 km, Twin Moose
JAMTARA
54.9 km, Zebra
SALGAJHARI_R
TOWARDS SULTANGANJ
#5, 11th Cross, 2nd Stage,West of Chord Road,Bangalore- 560086, INDIAPh : +91-080-4245 5555E-mail : [email protected]
56 km, Zebra
85 km, Panther
182 km, Twin Moose
LOHARDANGA
55 km, Panther
168 km, Twin Moose
22 km, Panther
0.1
km
TOWARDSSIPAT
MAITHON RB2X525 MW
200 km, Twin Moose
TOWARDS ROURKELA
172
km, T
win
Moo
se
301 km
56 km, Panther
TOLRA_R
8 km
HEC
HATIA_O
STPS
12.5
km
, Lar
k
32 km, Lark
PATRATU_D
KONAR
LATEHAR
RAMGARH_D
MAITHON_B1
TOWARDS BURNPUR
CHANDIL
39 k
m, T
win
Mo
ose
GOLMURI
JAMSHEDPUR_PG
PTPS
NORTH KARANPUR
HATIA_N
145
km, T
win
Mo
ose
JADUGUDA
MOSABANI
39.6 km, LarkJAMSED_D
GOIELKERA
MANIQUI
SIKKIDIRI
SHANKARPUR
78.6
km
, Qua
d M
oose
RANCHI (NEW)_PG
PATARDIHI
BTPS GEN1X500 MW MAITHON_B2
1X23.2 MW2X20 MW
97 km, Twin Moose
RAMKANALI
BTPS B
(-2)
(1)
31
(22)
-111
-211
PALAMU
SIMDEGA
GIRIDIH
CHATRA
WESTSINGHBHUM
DEOGARH
BOKARO
JAMTARA
DUMKA
SAHIBGANJ
PAKAUR
GODDA
64 km, Zebra
84 km, Twin M
oose
277 km, Quad Moose
TOWARDSBIHARSHARIFF
TVNL2X210 MW
BOKARO_D
PTPS2X100 4X50 1X110 MW MW MW
TILIYA2X2 MW
74 km, Twin M
oose
62 km, Zebra
78.4 km, Zebra
64 km, Twin Moose
35 km, Zebra
LALMATIA
TOWARDSKAHALGAON
62 km, Panther
4 2 k
m, Z
ebr a
TOWARDSKHARAGPUR
4 km, Panther
10.75 km
CTPS3X140 MW
NIMIAGHAT
P.KANTHA
BALIHARI_D
SINDRI
DHANBAD
KALYANASWARI
DALBHUMGARH
GOLA
GIRIDHI
35 km, Zebra
50 k
m, P
anth
er
111
km,
Qua
d M
oose
106 km, Panther
(-4)
100
-280
0
1.01 0.99//(181
)
(0)
/
(-180
)
/
-308
(-70
) (60)
315 21
5
(160)
(65)
-344
74
1.03
313
-84 (52)
(79)
(8)
(48)147
(33)
25
(0)0
(67)
1.03
1.03
-489 (57)
-25
(-27)
-504
222(-2)
1.01
(32)
7 6
-76
( -2 1
)
-180
178(-26)
(22)
1.00
77
(-4) -77
-76
1.00-37
1.02
-98
97(13)
(-11)
(15)
(-7)
1.01
1.02 40 (4)
(-6)(12) -193
192
0.97109
-110(-15)
(37)
0
0(0)1.00
(0)
0.00
(23)
-81
80
(-3)
-35
(-48
)
-251
0.98
0.981
-1(6
)
(-4)
5
0.98
(2)
-11 (
1)
11
0.96
(-11
)35
(14)
-35
82 km, P
anther
(2)
(2)
61 k
m, P
anth
er
15
-15
0.97
(4)-38
(-2)
38
0.96
0.9525-25 (-6) (9)
22 km, Panther
50 (3)
47-47(1)
(-0)
-2222 (2) (1)
0.99
-3
3 (4)
(-3)
0.99
1.00
1.01
(4)
-4(-1)
3
16
-16
(2)
(5)
1.02
(-8)
(14)
26
-26
1.02
(11)
(-5)
-17
17
0.94
-20
20(24)(-20)
0.95
24 k
m, L
ark
30 km
, Pan
ther
0.95
22.6
km
4 km
(1)-4
0.95
4
-4
(1)
4 km
0.98
1.021.02
130 km, Zebra
1.01
SHPS2X65 MW
1.01
0.97
1.001.01
1.01
1.00
1.00
1.00
0.99
0.98
0.98
1.00
0.95
1.00
0.001.00
0.99
Kanke
28 k
m, Z
ebra
5 km, Panther
Tamar
53 km
0.98
1.00
-11(-1)
1.00
100
(13)
-13(-10)
13(11)
36 km, Panther-28 (6)
28 (-5)
60 (0)
-60
(2)
(3)
36(7
)
-36
(-7)
16(7)
-16 (-5)
6(-5)
KEND FD STN
0.99
30 km, Panther 28(1
)
-28 (0
)
76 (13)
21(-5)
0 (0)
1.02
8.3
km
(11)
-17
10 k
m, P
anth
er
27 (1)
-27 (-0)
-27
(-1)
26(1
)
-34
(-8)
1.02 1.02CHAIBASA
-6(-2)
-17
(-2)
-12(-5)
12(6) 0
(0)
ABCIL2X30MW
-17(-3)
-9(-3)
-25(-9)
-68(17)
68(-
14)
-12
(-4)
344.6 km
155 km, Quad Moose -21 (15)
21 (25)
-57 (20)
57 (158)
-72 (98)
72(1
4)
74(-69)
-74 (95)
341
(-48)
46 km
, Twin
Moo
se
189(-1
8)
236
(68)
-237
(-46)
-64 (12)
211 (11)
1.03Adhunik TPP
221(-12)
343
(-47
)
-21
(-23)
-20 (-2
4)
188 km, Twin Moose
Panther
61 km, Panther
-10(11)
10
(-8)
-10
(-3)
37 (-1)
-7
(-3)
7(3)
0(0)
-54
(-0)
54(-1
)-3
(-0)
3(3
)-83
(-4)
81(1)
-7 (-3)
1.01/
-71(-23)
-48
(-1)
48(1
) 28 k
m, Z
ebra
LODHNA_R
-12(-6)
15 k
m,
Pan
ther
-0(1
)0
(0)
0.990.99
-6 (-2)
TATISILOI_R
-6 (-1)
6 (2)
15 k
m
Pan
ther
-75(-24)
TOWARDS RIHAND
0.99
0 (0)
-9 (-4)
INLAND 1X70 MW
0(0)
0(0)
-10(-3)
1.00
0 (0)
USHA MARTIN 2X10 MW
30.4 km, Lark
-7 (-3)
-13
(-6)
0.970.97
ECR_R_D
9(4)
-9
(-4)
10 k
m
Lark
(-0)-0
JSPL
Panther
-15
0.00ECRBR_D
0 (0)
-0(-0)
18.3 kmPanther
Lark
-111(-30)
0.98 0.98
0(0
)
180(-14)
55
(-10)
-55
(11)
0.97
438(0)
KODERMA_D
90(37)
-91(-38)
32 km
0 (0)
(-5)
0(0)
BTPS 3X210 MW148
(36) CTPS_N
BSL
0.99
0.99 0.97(23)-207
(-20)206
305(26) -305(-26)
2.6 kmZebra
81(15)
-81(-11)
225
(19)
CTPS2X250 MW
-150(-5
0)
148
(51)
(7)
-58
(-5)
570.95
PUTKI
(-2)
-12
(3)
(-2)
45 km, Panther
12 12
-69(-20)
25(-
5)-2
5(7)
105
(16)
-21(-5)
0.99
CTPS_OLD
-0(5)
179
(77)
RAJBERA_D 0.97
TOWARDSPARULIA
-21(-5)
21 (6)
0.98
BAIDA_D
-16(0)
119.2 km, Lark
4(5)
-59
(-23)-74 (-26)
-9(-4)
9
(4)
12.1 km
4.9km, Lark
-127(-40)
(-16)-50
24 (-1)
-24(3)
141.8 km, Zebra
31.84 km, Zebra
SAHIBGANJ
-3(-1)
33(-8)20
(-5)-23
(-1)
23(3)
1.00
Panther-19
(-6)
50
(-11)
(18)
-511.01
-23
(-1)
0.98
(-10
)-3
1
1.00
0 (0)
0.99DEOGHAR
0.99
-9 (-2)
9 (6)
75 k
m
(-6)-24
-3(-0)
3(1)
-43(-13)
68 km, Panther
30 k
m, P
anth
er
-24(-6)
23(-1
)
Pan
ther
0.97
0.980(0)
-7(-2)
26 k
m
4 km, P
anther
-7 (-2)
CHAIBASA
CGP
IPP
CGP
1.01
1.00
CGP
/
41(-4)
-42 (7)
0.980.96
-75
(-23
)
-9 (7)
-14(18)
149
km, L
ark
TOW
AR
DS
RA
JGIR
TOW
AR
DS
NA
LND
A
13 kmZebra
BSLG1 X 31 MW
0.97BSLT
-67
(-25
)-6
7 (-2
5)33(12)
0.97
Panther
Panth
er
-5
(-3)
-5(-
2)
1 km
-1(-0)0
(0)RUNGTA2X20 MW
IPP
-6(-3)
0.98MANOHAR
-4(-1)
4(1
)
0.99
-1(-0)
CHAKRADHARPUR_R
-3 (-2)
GUMIA_R
-31
(-10
)
0.99 0.99
26(0)
-26(1)
0 (0)
-8(-2)
40(5)
-40(17)
80 km, Zebra
1.02
TISCO1.03
TOWARDSJODA
-237
(-17
) 90 (0)
JOJOBERA3X120 MW 1X67.5 MW
1.02
0.97
TOWARDSJSPL
117
(-5)
86(31)
-87
(5) 1(0)
-1 (-0)ECRGMD
6.9 km
0.96MANIQUI_D
86.14 km, P
anth
er
20 (7)
-20
(0)
0(0)
0.5 km
24(-4)
-24(8)
0.96MANIQUI_R
-12
(-4)
12(4) 4 km
-11(-6
)
11
(9)
36.02
km, L
ark
54.6 km, Zebra54.6 km, Zebra
-19(-5)
0.97-10(-4)
SERMURI
10 (4)
30.29 km, Lark
-31
(0) -1
7(-
5)
-27
(-10
)
-42
(-13
)5
(3)
0.95
-5 (-3)
DALBHUMGARH_R
-139
(-10
)
TOWARDSPARULIA
1(12)
87 km, Lark
10 (3)
-10(-3)
50 km, Panther
1.00APL
4 km
-19(-9)
-0(-0)
-21(-2)
-38
(-12
)
-71
(-39
)
1.00
3.5 km, Panther
-14
(-5)
USHA MARTIN 3X300 MW 1X25 MW 1X15 MW
0(0)
0(0)
0(0)
0.98
416(117)
212
(46)
-538
(91)
495
(90)
-110
(6)
109(7)
-328
(-68
)
(67)
327
52 km, Zebra
62(6
)
-62
(18)
0.97
-15
(-6)
15 (6)
MADHUPUR
11 km, Panther
56(-20)
0.98
-108(-17)
105 (16)
1.6 km, Panther
-34
(6)
33(-6
)
-108
(-18)
41 km, Panther
-30 (-12)
0.98
0.98
MAITHON_D
15
(0)
-15(0)
-25(3)
-29
(-7)
14.4 km, Lark
9.7
km,
Pan
ther
-0(-0)
-35
(-16)
-8 (-4)
(-2)-7
K'DUBI
PANCHET
70(11)
PANCHET2X38.4 MW
-13(-14)
1.03 1.01
6(1)
73 km, Panther
IPP
CGP
CGP
CGP
CGP
CGP
CGP
CGP
-23(-8)
0(0)
KTPS2X500 MW
-35(-12)
-3 (-1)
1.00
0.000(0)
-0 (-0)
3 (1)
BANO_R
BAKASPUR_R 61 km, Panther35 km, Panther
0.99CHANDWA_JHK_POOL
69 km, Quad Moose
-0 (-0)
0.5 km
-26
(-9)
-5 (-1)
(0)
0.95
0.99
30
(8)
-5 (-2)
GOVINPUR_D 1.01
24 k
m, P
anth
er
5(2)
58.62 km, ZebraELECTROSTEEL_D
TOWARDSKALAPAHARI
-19(-10)
-34(-4)
MALIMPEX FERRO
34 (4)
( 13)
0.98
1.00
/
/
USHA MARTIN
-7 (-2)
-4 (-1)
-16(-5)
-15
(-4)
(-8)-3
3
-4 (-1)
TOWARDSSONENAGAR
0.99
-3 (-2)USHA
MARTIN 3(2)
27 km, Panther
0.99
6 (3)
-6(-3) 5 km, Panther
RAJKHARSAWAN_R
22(3)
THERMAL
THERMAL-CGP
THERMAL-IPP
SUB STATION
400 kV
220 kV
132 kV
TRANSMISSION LINE
765 kV
400 kV
220 kV
132 kV132 kV
LOAD
Load
1(0)
22 km, Panther
(-9)
-26
(-4)-14
14(5)
-101 (-13
)
251
(48)
-19
(-9)
(9)19
-30
(-8)
1.00
489(-39)
-15 (-1)
55 (-2)
-56 (7)-32
(-1)
31
(4)
0(0)
BSLG
-9(-4)
0
(0)
0
(0)
-65
(-18)
14, Golf Club Road, Tollygunge,Kolkata, West Bengal 700033
Eastern Regional Power Committee
LOA details: ERPC/PR_DBASE/2016/3567 Dated 30 Marc h 2016 DWG. NO. : Geographical Power Map\ER\August-2016\Jh arkhandREVIEWED CHECKED DRAWN REVISIONDESCRIPTION DATE
20/12/2016
REMARKS
R0
LEGEND
-855
(2)
TOWARDSKTPS
-167(41)-405(17)

KHURDA
NAYAGARH
RAYAGADA
BHADRAK
MALKANGIRI
GANJAM
SAMBALPUR
BALASORE
MAYURBHANJ
DHENKANAL
KENDRAPARA
BARGARH
JAGATSINGHPUR
JAJPUR
CUTTACK
PURI
SUNDARGARH
JHARSUGUDA
DEOGARH
KORAPUT
KALAHANDI
KANDHAMAL
CHILIKA LAKE
KEONJHAR
BOLANGIR
SONEPUR
NUAPARA
NABARANGPUR
GAJAPATI
BOUDH
BAY OF B
ENGAL
MCL
Barkote
Chandikhol
Pattamundai
IREL
Dabugaon
Digaphandi
Mohana
4x80MW
Jagatsinghpur
Salepur
Solari traction
Bhanjanagar
Shamuka
Akhusingh
Bhawanipatna
Khariar
HAL
Machhkund road traction
Meenakshi power
Saintala
Rayagada
Vedanta
Damanjodi
Ch. Kusumitraction
Chattrapur
Bidanasi
ParadeepIFFCO
Facor
Keonjhar
Jaleswar
Balasore alloys
Zebra
6 km
Twin Moose
Twin Moose
198 km
JK paper
Zebra
Boinda
Rengali_PGCIL
Rengali_OS
Rairangpur
Twin M
oose
Barbil
Boudh
BUDHIPADAR
1km
Raigarh
Katapalli
Zebra
Adhunikmetallics
Twin
Mo o
s e
THERMAL
132 kV
TRANSMISSION LINE
400 kV
220 kV
220 kV
132 kV
TMAPPROVED DRAWN IN :
#5, 11th Cross, 2nd Stage,West of Chord Road,Bangalore- 560086, INDIAPh : +91-080-2319 2209,2159Fax: +91-080-2319 2210E-mail : [email protected]
Power Research & Development ConsultantsPrivate Limited
Orissa state existing network (August-16) geographical map
LEGEND
DVC-Jamshedpur
34.5 km
126 km
GENERATION
HYDRO
SUB STATION
130 km
Zebr
a
7.23 km
Zebra
Zebra
135 km
Zebra
OCL
15.34 km
81 km
Rajgangpur
Burla
Eastern Regional Power Committee14, Golf Club Road, Tollygunge,Kolkata, West Bengal 700033
102
km
4km
Zebra
Theruvalli
400 kV
Ranchi
Soro
356 km
Rawmet
145
kmTw
i n M
oose
93.4
6 km
IMFA
Jayanagar traction
Zebra196km
Angul
Chandiposh
Zebr
a
Zebra
Kuchei
Zebra
Manbar traction
Vizag
Ganjam
Purushottampur
Choudwar
ICCL
TTPS
Bolani
Arya steel
Rourkela
Ramchandpur
Indravati PGCIL
Maheshwari
Nuagaon traction
Shyam DRI
Nuapara
Jayanagar OPTCL
Balasore
Sunabeda
Rairakhol
7.3 km
116 km
100 km
24km
Korba
181 km
Bhadrak
Chiplima
115
km
5 km13
7.9 km
70 km
135 km
Upper Kolab
172 km
Karanjia
Kejohar Traction
Cuttack
POWMEX
Padwa traction
Narendrapur
Barpalli
MiP-PSCT
Bhalulata traction
2 X 600 MW
WEST BENGAL
JHARKHAND
DWG. NO. : Geographical Power Map\ER\August-2016\Odisha
Rengali_PH
OCL
Kesinga
Joda
KARADAGADIACHANDPUR
Bhadraktraction
CHANDAKA2
Nimapara
Birla tyres
Phulbani
Tarkera
Patnagarh
Junagarh
Sonepur
Baripada
Maliguda traction
Umerkote
FMP JODA
Konark
Tentulikhunti
Balimela
Dhamara Traction
Emami paper
69.28 km
30 k
m
76.86 km
Twin
Moo
se
72 km
72.2
8km
288
km
Gazuwakka
131
km
Chaibasa
230 Km 100 k
m
70 K
m
70 km
53.5
2 km
156
Km
39.8 Km
54 Km
30 Km
54.6
Km
45 Km
20 K
m
65 Km
55 Km
76.9 Km
19 km
15 K
m
80 Km
38.5km
Beekay steels
86.56 km P
anther
40.753 Km
Jayanagar PGCIL
Indravati
Twin Moose
Twin
Moos
e
Twin Moose
Twin
Moose
Twin
Moo
se
141 KmTwin MooseTw
in M
oose
{Dharamjaygarh151 Km
Hexa Zebra
Twin Moose
Qu
a d M
oo
os e
1 71
km
6 X 60+2 X 75 MW
INDRAVATI4 X 150 MW
49.92 Km
Kenduposhi
Puri
3 X 17 MW+3 X 21.25 MW
Goreknath Traction
3 X 4 MW+2 X 12.5 MW
Machhkund
2 X 49.5 MW+3 X 37.5 MW+2 X 32 MW
4X 100 MW +1 X 67.5 MW
1 X 30 MW
765 kV
765 kV
5 X 50 MW
Budhipadar
Sterlite
Lapanga
Jharsuguda
Hexa Zebra
Dharamjaygarh {151 Km
Angul
Twin Moose145 Km
Vedanta
IBTPS
SPS
2 X 210 MW
Bhushan
Korba
Raigarh
109 km
Jharsuguda
JharsugudaTraction
L&T CEMCO
Aryan ispat
Kuchinda
181 Km
MSP
MCL
Sundargarh
Shyam DRI
Meramundali
NALCO
TTPS
Navchrome
1 X 30 MW+1 X 65 MW
Chainpal
4 X 60 MW+2 X 110MW
OPCL
4 X 5 MW
29.5
km
Mendhasal
Chandaka
Khurda
Nuapatna Tap
Kaipadar
1 X 60MW+1 X 40MW+2 X 130MW+
2 X 8MW
ML Rungta
Angul
9 X 135 MW
1 X 40 MW
1 X 20 MW
Jajpur town
TSIL
Kaniha-NTPC
Zebr
a
Zebr
a
Zebra
Zebra
Twin M
oose
Zebra
Zebra
Zebr
a
Zebr
a
Zebra
Zebra
Zebra
Zebra
Panther
Panther
Pan the r
Pan
ther
Panther
Panther
Pan
ther Panther
Panther
Panther
Panther
Pan
ther
Panther
Panther
Panther
Panther
62 KmPanther
Panther
Pant
her
Zebr
a
Lakshmipur
Twin M
oose
151 Km
91 Km Zebra
86km
Nayagarh
68.69 km Zebra
Sambalpur
Baragarh
Nalda
Polasponga
Paralakhemundi
Twin Moose
{
62.5 Km
Ind_Bhartath
Bolangir_PGCIL
ANGUL
Kolar
272 KmQUAD BERSIMIRIS
TSTPS6 X 500 MW
1 X 350 MW
4X 150 MW
92.0
7 km
Zebr
a
MENDHASAL
JHARSUGUDA
Berhampur
134
kmZe
bra
31.12 K
m
3 X 350 MW
Brajrajnagar
ZEBRA
81 Km
ZEBRA
SMC 20.5 KmZEBRA
30 KmZEBRA
6 Km
ZEBRA
14.06 Km ZEBRA
23 k
m
ZEB
RA
Hindalco
25 K
mZ
EB
RA
51 KmZEB
RA
Katapalli
109 Km ZEBRATarkera
29.92 km
Panther
Panther
26, 2
5.38
km
Panth
er
130km Panther
7 Km
Burla
57.3
3km
Pan
ther
Rajgangpur
10km
Pan
ther
12km 38km
Panther
60km
Pan
ther
0.15 Km
13 Km
Panther
81 Km Panther
BRG steel
GMR
Bhushan
Kharagprasad switching station
Hind metals
Meramundalitraction
68 K
mTw
in M
oose
18 K
mTw
in M
oose
52.3 Km Tw
in Moos e
213 Km
Twin Moose
25 K
mTw
in M
oose
37.9 KmTwin Moose
30 K
mTw
in M
oose
8.5K
mTw
in M
oose
106 KmTwin Moose
1 X 33 MW+1 X 77 MW+2 X 150 MW
3.3
Km
Zeb
ra
11.47 KmZebra
11.1
5Km
Z eb r
a
42. 52 Km
Zebra
134
kmZe
bra
Dhenkanal
95.6 Km Zebra
Rengali_PH
70kmZebra
Joda
154K
mZe
bra
34.5Km
Zebra
66kmPanther
Arati
2 Km
6.78 KmPanther
5 Km
7.47 KmPanther
3.55 Km
Panther
43.78 KmPanther
5 KmPanther
FCI
1.7 3 Km
Panther
6.83 Km
Panther
Angul
14.93
KmPan
ther
3 Km
Panther
Jabmaye ferro alloy
45kmPanther
16 K
mPan
ther
Kamakhyanagar
24K
m
Pant
her
23.8Km Panther
Arugul Tap
Bhubaneswar
Ranasinghpur
Kesura
Phulnakara
106 Km
Bidanasi
31.1
24 K
mTw
in M
oose
Bhanjanagar
Nayagarh
135 Km
Zebra 69
.28 Km
Zebra
68.69 KmZeb
ra
Narendrapur
90kmZebra
7.26
Km
Zebr
a
7.26
Km
Zebr
a
36.5
Km
Pant
her
5. 5 Km
AC
CC
Casabalanca
Cuttack
19.9
5 Km
Pant
her
AC
CC
Ca s
aba l
a nca
23.6
Km
26.36 KmPanther
Nimapara
46kmP
anther
62 Km Panther
Twi n M
oose
11.5
Km
Panthe
r
Chandpur
5km Panther
15kmPanther
Shamuka35.6km Panther
14km
Panther
Arati steels
20km
Panther
Dhenkanal
37.1
2 K
m
Pan
ther
28km
Panther
37.12km
Panther
Maheshwari
225km
Duburi new
97 Km Twin Moose
140
Km
Twin
Moo
se
273
KmTw
in M
oose
96 Km Twin moose
273
Km
Twin
Mo
ose
190
Km
Twin
Moo
se
Duburi new
Duburi
Nilanchal
Maithan ispat
Rohit ferro tech ltd
Tata steel
MESCO
Visa steel
Jindal steelJabmayee ferro alloys
TISCO Bamanipal
BC Mohanty traction
Kalarangi
Jakhapura traction
Jajpur road
130
Km
, Tw
in m
oo
se
190
Km
Twin
moo
se
295
Km
Twin
moo
se
6.4 Km
Zebra
10 KmZebra
4 K
m
Zebr
a
4.78 Km
Zebra
4.752 KmZebra
10.55 Km
Zebra
Paradeep
114 KmZebra
70 K
mZebra 13
7.9 Km
Zebra
Bhadrak
Balasore
5.5
KmZe
bra
Meramundali B
95.6 km ZebraTTPS
Bolangir new
Hindalco
95.6
Km
Zebra
8.86km Zebra
113.4 km
Zebra
70 km Zebra
70 km
Zebra
Zebra
1 54
kmZe
bra
34.6
8 km
Zebr
a
10 km
Zebra
117k
mZe
bra
3km
8 K
mP
anth
er
12.794 KmPanther
12.54 Km Panther
63kmP
anther
KendraparaChandikhole
32km
Pan
ther
Jajpur town
29.34 Km
Panther
Anandpur
40 K
m
Pan
ther
10 Km
Panther
13.2 Km
Panther
43 K
mPa
nthe
r
50 Km
Panther
20 Km
40 Km
Panther
37 K
mPa
nthe
r
45 KmPanther
13 Km
Panther
53.2km
Panther
0.54
km
17.7 Km
Panther
12 Km
Panther
20 KmPanther
0.7
km
108kmPanther
Kamakhyanagar
36 K
mP
anth
er
20 Km Panther
45km Panther8 Km Panther
19 Km Panther
11 Km
Panther
13.9 Km
Panther
Jagannathpur traction
5.8
Km
29.7
Km
Pant
her
12 Km
Rambhatraction
54.1
9 Km
Pant
her
Balugaon
Chandpur
30 K
mPanther
24 KmPanther
22 Km
Panther
43.82kmPanther
33 .96 Km
Pan ther
Aska
33 Km
Panther
35.6kmPanther
18.6
Km
Panth
er
30k m
Pan
t her
20.3
1 K
mPan
ther
22 K
m
43.17kmPanther
KesuraPhulnakara
23.5 Km
19.95 Km
Panther
35.15 KmPanther16.53 Km
Panther56.07 Km Panther
9.7
Km
2 Km
59 .4km
Panther
5 9.4 Km
Pan the r
42.5
93 K
m
Panthe
r
37.40
3 Km
Panther
14.5 Km
58.5 KmPanther
33.3
Km
Pan
ther
39.8
kmP
anth
er
Bolangir
3 K
mPa
nthe
r
51.05 Km Panther
Hirakud station
26km
Pant
her
52km
Pan
ther
3km
ACC 20k m
12.6
6km
16.9kmPanther
5km
Rairakhol tap
57.3
3km
Pan
ther
15km
34.8km
0.386km
Panther
18kmPanther
10.8
Km
JITPL
JSPL
23km
Pan
ther
Kuchinda
Rajgangpur traction
Chhend
Banspani traction
53.33km Panther
60km
Pan
ther
2.1km
0.5km
81km Panther
15kmPanther
28.38kmPanther
130kmPanther
35km
Pan
t her
20kmPanther
Bhalulata tap27 km
3.272kmPanther
14kmPanther
8km
10km
10km Panther
25km
1km
2.8k
m
Pan
ther
90km Panther
55km Panther
19.43km
Panther
72. 4
6km
Pan
ther
66.1kmPanther
Balasore traction
Anandpur
Basta
Jaleswartraction
6km
3km
8.57km
3.565km
3km
Panther
57.3km Panther
2.34km
24.5k
m
Panth
er
32.5k
m
Panth
er
34.8k
m
Pant
her
40.30
5km
Panth
er
27km
Panthe
r
4.6km 8.5km
Kendrapara
PPLPPT
Kendrapara PHtraction
Dhenkanal
64.7kmPanther
19.5km
Panther
33.11kmPanther
Panther
34.8kmPanther
7.2km
6kmPanther
Panther7.65km
34kmPanther2.72km
Aarti steels
20km
Panther 20.2km 23km
8.61
km
44km
28kmPanther
23.5km
37.12kmP
anther
14.6km
23.8kmPanther
Joranda traction
19.35km
3 X 24 MW
CGP
IPPIPP1 X 50 MW
HYDRO-IPP
THERMAL-IPP
THERMAL-CGPCGP
IPP
IPP
IPP
IPP
IPP
IPP
IPP
CGP
CGP
CGP
CGP
CGP 2 X 54MW + 1 X 30MW
CGP
2 X 55 MW
CGP
2 X 125 MW+
1X13 MW
CGP6 X 135 MW
CGP
2 X 19.25 MW + 1 X 24 MW
CGP
2 X 12MW
CGP
1 X 25 MW
CGP
10 X 120 MW
CGP
CGP
Rathisteels
3km
CGP
2 X 60MW+4 X 25MW
CGP
1 X 30 MW
CGP
CGP
50km
Panther
Kamakhyanagar
45km Panther
MERAMUNDALI
MENDHASAL
DUBURI
JHARSUGUDA
REVIEWED CHECKED DRAWN DESCRIPTION REVISION DATE REMARKS
R0 20.12.2016
To upper Sileru
LOA details: ERPC/PR_DBASE/2016/3567 Dated 30 March 2016
24.7
6 km
Z ebr
a
HVDC
135 km Twin Moose
} Bisra
222 km Twin Moose
147km Twin Moose
147km Twin Moose
110km Twin Moose
110km Twin Moose
91km Twin Moose
91km Twin M
oose
Bhanja Nagar
92.32km Twin Moose
92.32km Twin Moose
Bidanasi
Argul
Balugaon T
68
.57k
m P
anth
er
Essar
IOCL 6km
Zebra
Balimela PH
0.2kmZebra
49.6km Panther
Nuapatna
35.7kn Panther
Dhamara
Jharsuguda Tap
49.5
km P
anth
er
RSP
11.04km
Panther
Tomaka Traction11.86km Panther
VVC ferro
0.3km Panther
80km
Pan
ther
Action ispat
1.6km
Panther
Bhuvi4kmPanther
CGP
3 X 25 MW
4 X 600 MWIPP
1 X 350 MW
Mendhasal
Duburi
Pandiabil
Angul
TSTPS
JSPL
Bolangir
Meramundali
Kharagpur
TISCO
Jamshedpur
Meramundali
Baripada
CGP
1 X 30 MW
JSPL
Zebr
a
Pandiabil
MERAMUNDALI
DUBURI
Bisra
230 km Twin Moose
Raigarh
Balugaon T
86 K
m
Pant
her
1.00 1.01/
-20.98
(166.60)20.98(235.90)
-20.98 (166.60)
20.98(235.90)
49.55 (-34.76)
-49.66(233.12)
-352.43(118.41) (-30.76)
350.77
-119.75
(-62.90)
119.51(96.05)
1.01 1.01/
(5.54)
29.83
-30.00(45.73)
-388
.10
(-14.
84)
386.
67(2
1.99
)
-143.0
0(9.51)
140.07 (-11.72)
-2.00
2.00
2.64
(32.47)
(3.1
8)
-29
1.0
3
(-4.50)289.54
393.75(45.15)
-395.74
(-50.84)
1.01-44.46
(54.65)
(-49.14)
44.39
35.12
(-7.42)
-36.13(9.16)
-20.25(-3
.79)
(6.7
2)
20.19
-26.87
(-9.57)
26.78
(9.96)
15.00
(0.20)
-17.511.00
0.000.00
1.00
1.01
1.01
1.02
1.00
1.00
1.01
1.02
1.02
1.00
-10.00(-4.41)
10.00(4.41)
-8.00
8.00(0.10)
-3.4
0
(4.36)
3.40
1.00
1.00
44.02
(-10.39)
-45.06
(10.63)
-16.
09
(1.9
9)
16.
07
(-1.
53)
32.96
(-10.60)
-32.
96
(10.
60)
1.02/1.03
163.50
(30.24)
-164.21
(-18.61)-174.00(56.21)
(21.63)173.21
53.8
9(-
1.3
5)-5
6.05
(-0.
67)
0.96
0.93
-9.9
8(6
.90)
9.87(-3.07)
0.00
(0.00)
0.00(0.00)
-292
.49(-3
4.35)
292
.27(
36.3
7)
0.94
-60.
34(0.
32)
59.4
4 (-1
.41
)
0.93
7.77
(4.4
2)
-7.82 (-1.69)
-25.
09(9
.76)
24.9
4(-9
.22)
21.2
4(0
.57
)
-21.37 (0.28)
0.00
( 0.0
0)
0.00(0.00)
-72.
44(-1
7.13
)
72.33
(20.54)
0.00
(0.00)
0.00 (0.00)
-59.06
(-6.49)
58.67(13.26)
0.00
(0.0
0)
0.0
0(0
.00)
0.97
-7.89
(-0.81)
7.88
(1.33)
0.96
-86.92
(-9.66)
86.12
(14.30)
1.00 1.01/
-54.23(6.87)
53.93(1.42)
-50.
61 (18.
60)
50.4
7(-
14.5
2)
-88.23(-63.05)
88.1
3(6
5.65
)
220.
90
(-17
.83)
-226
.57
(28.
71)
53.
37
(2.9
4)-5
4.02
(-3.
25)
67.26(-2.21)
-69.24(-0.23)
-31
.27
(-3.
60)
31.13
(4.07)
0.99
1.01
1.01
42.25(-0.78)
-42.95(1.11)
-0.40(0.17)
0.40(0.19)
-27.24
(-2.51)
27.13
(3.03)
0.99
-7.40(-1.83)
-62.
17(-
13.3
2)
(13.
50)
62.1
2
0.991.50(0.50)
-1.50(-0.15) 0.99-0.00
(0.03)
-6.84(-30.27) 6.82
(30.76)
0.99
0.99
(0.0
0)
(0.0
0)
0.00
0.0
0
-6.00(-0.67)
0.99
-0.33(0.22)
0.33(0.16)
0.99
-48.03(4.47)
47.07(-4.59)
1.00
1.00 1.00/
0.00(0.00)
757.81(45.15)
-763.21(-1.05)
-150
.82(-
21.4
4)
150.
78(2
5.63
)
136.
28
(-29
.83)
-136
.48
(56.
05)
-373
.10
(72.
20)
372.
42(-1
37.2
7)
-518
.20
(95.
75)
517.
24(-9
6.61
)
241.
76(-
44.4
3)-2
42.5
6(7
2.46
)
-123.69(-54.12)
123.61(94.59)
-170.02
(1.49)
168.02(13.59)
0.99
273.50
(-21.56)
-276.39
(52.16)
0.99
1.00
0.98
1.61(7.52)
-1.61(-6.77)
-145.50
(4.39)
145.40
(-3.21)
0.980.98/
0.00(0.00)
0.00(0.00)0.00
-20.00(-7.27) 20.00
(7.91)
0.98
8.18
(11.86)-8.19
(-10.43)
0.99
37.26
(-18.39)
-37.27
(19.66)
0.98
-70.02
(-11.8
5)
70.00
(12.85)
0.97
-101.21
(28.02)
100.09(-24.81)
67.24(-12.19)
-68.25
(25.43)
-150.68(15.44)
148.62(4.47)
97 K
mTw
in m
oos e
(45.15)
-763
.21
0.00
(0.00)
0.00
(0.0
0)
0.00(0.00)
0.00(0.00)
0.98/
-1.6
9(4
.11
)
1.69 (-3.15)66.91(-2.66)
-67.
26(2
.21
)
0.98
67.26(-2.21)-69.24
(-0.23)
0.97
15.8
5(0
.12)
-15.
94(1
.41
)
-4.0
0(-
0.65
)
4.00(1.29)
0.97
36.0
5(5
.68
)
-36.
15(-5
.55)
0.97
0.97
-11
.47
(5.7
1)11
.42
(-4.
41)
0.00(0.00)
0.00
(0.0
0)
0.0
0(0
.00)
0.00
(0.0
0)
0.00
(0.0
0)
0.00
(0.0
0)
0.97
0.00(0.00)
0.0
0(0
.00)
28.31(10.78)
-28.65(-9.84)
28.65(9.84)
-28.83
(-9.29)
0.95
0.00(0.00)
0.00
(0.0
0)
-20.98 (166.60)
29.83(5.54)
173.21 (21.63)
1.01 1.00/
163.50(30.24)
-164.21 (-18.61)
-352
.43
(118
.41)
350.77(-30.76)
145km Twin Moose
-215
.44
(97.
36)
(60.
46)
214.
83
340.91(-47.71)
-343
.80(
44.3
1)15
2.79
(-2
8.3
3)
(122
.80)
-153
.39
80.141.00 1.00
280.14
-286.01
(19.03)
-8.5
5(1
3.2
1)
8.54(-9.02)
0.8
3
-0.83(0.93)
-109
.11
(-50
.47)
-9.4
7(4.8
9)
9.4
6(9
.52)
-17.
75
(10
.01
)
17.73(-5.17)
0.99
-16.98(-2.14)
0.99
0.99
0.00
35.1
2(-
7.42
)
-36.13(9.16)
-81
.00 80.81(14.85)
0.99
31.97(6.12)
0.58
(0.1
9)
0.9944.02(-10.39)
-45.06(10.63)
1.01
16.9
6(6
.93)
(-5.
48)
1.00
16.0
7(-1
.53)
-37.10(-1.09)36.85(1.50)
1.00
1.00
-8.3
6(0
.05)
5km
Pan
ther
1.00
-32.55(-4.04)
32.38
0.00(-0
.00)
-0.00
(0.2
6)
213.26
-8.511.00
0.00(0.00)
1.00
0.00(0.00)
0.00
(0.00)
0.99
-7.15 (2.54)
7.10(1.85)
0.9921.07(1.70)
-21.23(-0.13)
1.00
-54.
69(-1
4.81)
53.52(13.90)
0.96
0.95
-0.13(0.19)
0.13
(-0.05)
0.96
34.1
4(4
.33)
-34.
87(-
3.23
)
-24.66(-6.85)24.40
(8.13)
0.96 102.82
(-8.89)
0.97
-40.
89
(5.5
7)
40.34(-5.30)
-40.90
(3.60)
40.010.96
0.96
-38.
52(5
.37)
37.9
2(-
4.92
)
0.99
-60.
50(1
1.0
2)
58.4
6(-
12.8
3)
1.0132.4
5(-
19.2
6)
-33.
32(2
0.47
)
-167.76
(-12.82)
0.98/0.97/
317.
47(-5
7.27
)
-323.2
7
(33.18)
-276.39(52.16)
273.50(-21.56)
-27.57
(6.82)
27.24
(-5.45)
-37.92(4.92)
37.05(-4.31)
0.94 0.99
-8.2
7
(-0
.00)
8.21
(3.3
0) 0.93
0.99
19.16
(-1.99)
-19.30
(3.52)
0.98
-223
.63
(45.
63)
222.
93(-1
4.76
)
0.98
0.99
529.00
(-170.08)
0.99/
0.950.99 /
-5.06
-535.33
0.00 (-0.00)
-6.36(-10.57)
6.34 (25.43)
-7.1
6(-0.
05)
7.15(1
3.00)
14.37(25.99)
-14.
39(-
0.2 4
)
-38.61(-20.88) 37.70
(20.73)
81.8
2(-
5.32
)
-84.
58(0
.98
)
0.94
11.75(0.48)
-11.81(1.31)
0.94
-9.0
6
(-0.
26)
9.02
(2.2
1)
39.92
(0.07)
-40.78
(0.40)
0.98
0.93
15.0
3
(1.4
1)
0.95-0.00
(0.93)
0.00 (-0.
00)0.95
0.95
0.94
10.11(4.20)
0.00(0.00)
0.92
1.02
0.00
(0.0
0)
0.00(0.00)
0.00
(0.00)
0.00(0.00)
0.95
-5.0
1
(-0.
68)
5.00
(1.5
8)
0.95
5.01
(0.68)
-5.0
2(1
.00) 0.95
10.02(0.59)
-10.03
(0.18)
1.00
-0.0
0(3
.48)
0.00 (-0
.00
)
0.95
0.93
0.00 (0.00)
0.00
0.0
0
24.00(11.62)
1.00
0.0
4(0
.02)
1.00
1.001.00 /
-9.9
0
(-0.
10)
9.82 (3
.28)
2.92(1.00)
-2.93(1.43)
0.93
0.92
0.95
20.57(7.33)
-20.76(-5.96)
0.9649.22(-10.49)
-49.94
(30.10)
-20.77 (4.02) 20.62 (22.11)
-20.77 (4.02) 20.62 (22.11)
41.38(-6.79)
-41.51(30.14)41.38
(-6.79)-41.51(30.14)
0.990.9880.84(-58.03)
-80.85(60.09) /
304.
48(3
.94)
-310.99
(28.16)
-4.92(0.82)
4.91(1.53)
0.95
-55. 67 (4. 08)
54.68(-4.84)
-55.67(4.08)
54.68(-4.84)
-12.25(9.08)
12.0
9(-
5.20
)
0.99
0.980.98/ 0.00(0.00)
0.00(0.00)
-86.92(-9.66)
86.12(14.30)
0.97
-59.06
(-6.49)
0.00
(0.0
0)
0.00
(0.0
0)
0.97
-38.37(5.18)
37.72(-4.66)
-41.65(6.83)
41.22(-6.70)
0.96 -30.76(2.70)
42.59
(9.36)
(9.36)
27.49(16.65)
3.90
(1.8
4)
0.97
0.96
-9.9
8(6
.90) 0.96
53.8
9(-1
.35)
-56.
05(-0.
67)
0.00(0.00)
0.00
(0.00)
Pant
her
5 Km
68.5
7 K
m
Panther
0.970.98/
20.63
(3.11)0.95
(1.84)
6.38
-11
.01
(-3.
44)
10.9
7
(4.69)0.95
-42.
48(-
3.82
)
41.47
(3.88)
10.10(3.21)0.93
-7.33
(2.85)
7.31
(-1.57
)
0.93
0.93
-10.
11
(-4.
20)
0.94
-37.70(-20.73)
-9.61
(-3.06)
-0.0
4
(-0
.02)
-24.
00
(-11
.62)
-0.2
2(-
0.11
)
-25.
70
(-8.2
3)
-19
.16
(-6
.31)
-0.0
0
(-0.
00)
-16.
73
(-0
.13
)
-3.9
0(-
1.84
)
-6.38(-1.84)
-10.
97
(-4
.69
)
0.05
Hexa Zebra(-34.76)49.55
-49.66(233.12)
-189
.83(
62.7
6)
188.53(-1
8.50)Jamshedpur
182
km
-479.66
(178.11)
-219.70
(81.49)
218.73
(-36.75)
217.23(-8
5.17)
-218.73
(109.86)
110
.37
(56.
76)
-110.68
(22.02)
63.6
4(5
4.0
6)
-63.73 (12.48)
-222.76
(21.
24)
221.87
(26.52)
0.00
(0.0
0)
0.98 0.99/
-373.10 (72.
20)
(95.7
5)-518
.20
1.00
-1134
.26(-38.71)
1126
.02
(21.
14)
-383.80
(-98.46)
-383
.80
(-98
.46)
383.
57(1
37.5
0)
-123.69(-54.12)
0.99
694.80
(243.92)
Sterlite 0.00(0.00)
0.00(0.00)
222 KmTwin Moose
222 KmTwin M
oose
230 km Twin Moose
Meramundali(0.00)
0.00
0.00
(0.00)
New Duburi
(-1.
05)
757.81
1.00 1.01
1.02
/
0.96 0.95/ /
/
1.00 1.00/
0.991.00
/ 1.011.01/
-1956.00
(-277.23)
0.99-17.94
(-0.39)
0.99 0.99/
0.99
0.99
-152
.38
0.99
2.28 (-0.
93)
0.980.97
0.97
0.97
0.99
0.99
0.99
1.00
1.00
1.00
22.94(-6.21)
-23.30(8.76)
0.98 0.98
0.98
0.98
0.97
0.95
0.95
0.96
0.98
0.99
0.99
0.99
0.99
0.99
0.99/
0.98 0.98
0.99
0.980.97
0.98
0.95
0.94 0.970.97
0.97/
0.970.970.97
0.97
0.95
0.95
0.970.95
0.96
0.96
0.95
0.98
0.98
0.94
/
0.980.98
0.99
1.00
1.00
Narendrapur
0.97
0.00(0.00)
0.00(0.00)
25km
Atri
51.1
3 (-9
.07)
-51
.66
(22.
12)
120
km, Z
ebra
0.97
Pandiabil
126.21
(-31.
02)
-126
.50
(35.
22)
22 km
0.97Smangra
-89
.99
(4.6
8)89
.70
(5.8
2) 45.9
Km
, Zeb
ra
0.97/
66.0
3 (-6
.23)
-66.
82
(5.2
0)18
km, P
anth
er
0.97Baki
Atri
0.00(0.00)
-6.02(4.42)
6.01(-3.50)
19.6 km Panther
19.4 km
Pan
ther
-0.00(-0.00)
67.24
-32.82(15.25)
32.70 (-6
.25)
-42.
51
(-0.98
)
42.07(1.14)
0.00(0.00)
0.00(0.00)
3.02
(0.1
7)
-51.11(-0.41)
-10.94(-2.49)
-0.29(-4.27)
-61.63(-18.26)
100.09(-24.81)
-4.83
-0.25
0.25 (0.12)
4.80
(0.76)
-4.81(2.47)
0.00(0.00)
0.00
(0.00)
-20.07(-5.13)
-54.
31
(-1
5.62
)
72.33(20.54)
0.00(0.00)
-71.
98
(-27
.73)
-94.60(-14.09)
94.34(13.96)
-91.00
(-31.38)
33.70
(25.24)
-33.97
(-8.26)
220
.90
(-17
.83
)
-28.61(15.10)
28.0
8(-
13.6
0)
-22.80 (3.11)
-36.
65
-13.91(-3.66)
-15.58
429.20(110.00)
-36.40
(-4.16)36.32
(5.21)
BRPL
MSL
0.97
0.97
-16.67(-4.90)
16.66(5.07)
-3.11(-0.34)
3.11(0.78)
3.59(1.16)
-3.59
(-0.85)
-8.00(-2.98)
-3.11(-0.78)
-13.
07
(-4.
22)
Kalugaon0.99
-35.87
34.7
0(-7
.59)
-9.40 (9.85) 9.38(-9.15)
-25.25(-1.24)
-3.80
(-1.25)
0.98 0.98
-4.60(-0.29)
123
km Z
ebra
-4.35(4.24)
4.34 (12.92)
-20.
37
(-6
.85
)
-214.94
(1.61)
55.28-0.00
(4.31)
-24.
40(-
9.48
)
/
//-1
.99
(-2.59)
15.09
(-0.79)
-44.39(9.21)
-0.2
0
(-0
.07)
18.98(-7.06)
-19.13 (8.42)
36.5 Km, P
anther
-0.02
(-0.00)
-27.80(-8.90)
-150
.68
148.62(4.47)
34.38(1.12)
-34.80(-0.47)
-33.45(-2.27)
32.82(3.40)
0.58(12.08)
-0.06(0.27)-7.62(-0.66)
0.96Marshgai
30.46(1.62)31.5 km
panther
-22.
40(-
5.93
)
-21.48(10.73)-21.48
(10.73)9.38
(-9.15)
-0.00(-0.00)
-8.0
0
(-1.
33)
-143.70(7.62)
139.56(-12.04)
139.56(-12.04)
-143.70(7.62)
-143.70(7.62)
-143.70(7.62)
-18
.22
(-4.
91)
0.96/
43.93
(0.08)
-44.33(-0.09)
20 km, Panther
44.63(-1.10)
-44.94(1.07)
15 km, Panther
37.20(0.92)
-15.60
(-3.18)
-16
.87
(4.7
0)
-27.
00
(-6
.48)
0.00Utkal AL
0.00(0.00)
0.00(0.00) 0.00
0.00 (0.00)
0.00 (0.00)Aditya AL
10.44(11.43)
-4.08(-0.76)
-0.0
0
(-0.
00)
(-24.78)-68.84(-11.52)
-51.6783.94-54.23
(6.87)
213.00
(58.60)
-5.0
5
(-1.
08)
-22.03
(0.48)
21.71(1.68)
-8.85
(-2.51)
0.97
11.42
(-4.4
1)
-11
.40
(-3
.15
)
31.13(4.07)
27.13(3.03)
-16.75(0.36)
-20.25(-6.75)
0.00
(0.00)
0.00
(0.00)
-1.60(1.62)
Atri
1.60(-0.68)
-1.60 (1.62)
-1.60
(0.69)
-29.30
(-9.04)
-7.30(-2.58)
-10.12(-2.59)
-23.93(-6.42)
-6.00(-1.19)
14.88(5.29) -2.19
(-0.32)
-12.64
(-3.98)
-53
.22
(-25
.49)
45.12(14.19) -45.00
(-11.86)
0.0
0(0
.00)
0.00(0.00)
-34.
00
(-1
6.1
6)
-21.80
(-10.31)
-33.55(-6.53)
33.17(7.15)
-8.50
(-2.26)
-7.93
(-2.68)
-94.00
(-28.53)
-13.89
(-3.65)
-4.90(-1.34)
-21.00
(-7.45)
-26.71
(-8.56)
-34.40
(-9.54)
17.84(-1.78)
-17.95(3.09)
0.00(0.00)
-17.
80
(-5
.04
)
-15.17(-5.37)
-47.
91
(-8
.32)
-45.20(25.23)
44.49(-25.57) 0.00
(0.00)
-5.00(0.40)
2.65(42.16)
-42.
00(-
14.3
2)
0.94
24.94(-9.22)
0.00(0.00)
0.00(0.00)
-24.90(-4.82)
-2.6
9
(-0.
18)
47.07(-4.59)-5.91(0.88)
0.00(0.00)
0.00(0.00)
-41.07
(5.57)
0.00(0.00)
0.00
(0.00)
-20.
51
(-6.
07)
-20.
60(-2
.51)
-10.52(-4.51)
-22.23
(-5.03)
-24.79(-9.71)
0.00
(0.00)
-22.
68
(-5
.65)
-12.72(-6.63)
-20.41
(-7.22)
-13.10 (-4.32)
-19.12
(-5.23)
-14.13
(-3.60)
-15.94(1.41)
42.25(-0.78)
-14
.57
(-3.
01)
16.24
(-3.86)
-16
.44
(7.1
1)
8.84
(3.43) -8.91
(0.97)
-7.3
2
(-2.
03)
0.00(0.00)
19.89(-0.65) -19.94(1.10)
12km
-15.21 (3.64)15.16
(-2.84)
-0.22(0.62)
0.22(0.11)
-30.
60
(-1.3
2) 0.00(0.00)
0.00(0.00)
21.24(0.57)
-21.21(-6.95)
-28.70
(-8.95)
-11.09(7.87)
11.06(-7.22)
-53.
71
(-2.
25)
-5.8
1(-
0.74
)5.
81
(1.6
6)
-5.80(-1.54)
B TAP1.000
.00
(-0.
25)
-0.0
0(3
.32)
0.00
0.00(0.00)
1.00Bamra traction
-0.00
(0.25)0.00
-11
.04
(-3.
10)
Mania0.98
-27.76(-0.89)
-0.0
0
(-0.
00)27.76
(0.89)
-10.50(-2.32)
-2.9
2
(-0.
95)
-7.05
7.03
(1.27)
7.77(4.42)
-7.82
(-1.69)
-37.23
(-11.84)
-8.20
(-3.02)
-28.22
(-9.05)
0.95Padampur
-11.31(-2.58)
11.25 (4.49)
46 Km
-11.20
(-3.48) -13.07
(-5.21)
-9.80(-2.86)
-15.13
(-4.19)
-12.
07
(-2.
64)
0.94
39.35(-12.22)
-39.77(12.28)
-14
.22
(-4.
21)
-7.20(4.13)
7.19(-3.18)
0.00(0.00)
-37.50(-11.04)
-10.43
(-3.29)
-7.09
(-1.57)
-6.5
0
(-0.80)
-38.00
(-11.88)
-33.31(-1.14)
-10.
09
(-3
.39)
53.37-13.38
-39.90(-8.73)
-1.82(-0.05)
-19.88(1.49)
19.75(-0.12)
-19.70
(-6.69)
-53.63
(-20.81)
-11.06(7.22)
11.01(-5.67)
-10.99(-1.88)
-34.
9 5
(-10
.10)
0.98Somnathpur
-0.00(-0.00)
0.29(4.27)
-0.30(-4.20)
-0.29 (-4.27)
-28.46
(-10.27)
-17.00
(-3.32)
-20.
10
(-4.
99)
-21.
78(0
.06)
21.52(1.82)-9.69
(-2.80)
-9.0
0
(-1.
90)
-1.62
(0.48)
-34.
68
108.00(16.30)
0.00(0.00)
0.00(0.00)
33.90(0.00)
390.00(52.82)
2308.80
(194.32)
998.00(271.54)
154.
00(9
7.77
)
163.70(92.19)
280.50
(85.59)
0.99
81.50(2.40)
89.40
(47.58)
872.89(270.00)
215.40(40.22)
355.50
(48.25)25.70
(15.35)
28.00(27.07)
40.00(13.24)
174.60
(37.41)
64.20
(29.06)
25.60(20.00)
1 X 25 MW1x8
23.90
(6.07)
91.40
(24.57)
15.00
(3.41)
12.80
(8.40)
25.70(10.87)
0.00
(0.00)
12.80
(5.22)
46.0
0(1
2.12
)
34.2
0
(10
.27)
6.80
(0.0
0)
41.00
(4.00)
9.60
(2.9
9)
151
.00
(25.
00)38
5.00
(122
.53)
1140.00(153.56)
0.00(0.00)
CGP
77.1
0
(25
.50)
-49.00(-16.32)
-70.02(-11.85)
0.98-70.00
(-12.85)
-3.5
9
(-1.
16)
-56.
00
(-1
8.39
)
-13
6.70
(-44
.40)
42.70(20.37)-41.08
(-13.49)
-0.00
(0.57)
0.00
(-0.00) 0.97
-18.05(-5.27)
18.00(5.79)
0.97
-18.
00
(-5.
79)
-0.0
0
(-0.
00)
66.03(-6.23)
18km Panther
-151.89(8.47)
151.70(-6.33)
-846.00
(-277.84)
12.42(-13.62)
-12.42(14.29)
-28.46(-9.41)
73.86(-28.45)
0.99
-14.00
(-4.60)
-218.00
(-71.94)
-474.00
(-157.87)
-9.00
(-3.02)
0.00
(-0.00)
-88.00(-2
8.90)
-263.00
(-103.97)
-18.00(-0.50)
0.93
-7.84(-2.54)
68 K
m
-571
.00
(-18
7.5
3)
-12.50(-4.11)
-14.10
(-4.63)
-21.07(-6.36)
-0.10(2.18)
-6.70
(-2.16)
-103
-45.00(-14.88)
-0.00(-0.00)
(-35.34)
24.67(3.05)
-5.0
0
(-1.
59)
-5.0
0
(-1.
59)
-0.0
0
(-0.
00)
-10.10(-3.21)
7.85(11.81)
-7.86(-3.19)
62 k
m Zeb
ra
0.96
Jharsuguda
0.99
CGP
STPS
TTPS
-20.00(-6.54)CGP
CGP
CGP
CGP
CGP
CGP
CGP
0.92
0.95
BBSR spltChandaka splt
BPPL
0.9439.35
(-12.22)
-39.77
(12.28)23.45 Km
Panther
0.94
-14.
22(-
4.21
)
5.5 KmPanther
-39.87 39.77
(-12.28)
0.94
0.94
0.00(0.00)
-0.00(-0.00)
-0.00(0.45)
35 Km P
anther
10 Km Panther
32.9
6( -
10.6
0)
-32.9
6
10km
Pan
ther
0.97
Pandiabil
-313.8
9(-26.2
5)
Twin m
oose
530.67(-7.73)
-538.02
(-5.77)
130 km, Twin Moose
-538
.02
(-5.
77)
530.67(-7.73)
295
Km
, Tw
in M
oo
se
0.97
126.21(-31.02)
-126.50(35.22)
22km, Zebra//
//-89.99
(4.68)
89.70
(5.82)
46km, Zebra
(6.94
)
217.
55
-221
.74
(1.73
)
0.97
-313.89
(-26.25)
Mendhasal
313.65
(49.34)
0 .00
(0.0
0)
530.
67(-7
. 73 )
0.97
-89.99(4.68)
-126.50(35.22)
Samangra
Atri
-20.98
(166.60)
119.75
(62.90)
-120.00
(-12.62)
-85.01(0.75)84.01(6.80)
-85.01 (0.75) 84.01(6.80)
98.8
1(52.19)
-99.
46
(-34
.08)
18.79(-25.95)
Twin
Moo
se
-2.00 (88.29)
1.97(40.79)
-0.58
(-0.19)0.99
-32.67
(-10.61)
0.98
Sri Ganesh
0.98
CGP
25.7
0(1
2.68
)
-0.7
0(-4
.40)
2 km
Panther
-25.00
(-8.21)
1 X 525 MW
2 X 30 MW
0.99
0.995.48
(1.79)
-5.48 (-1.79)
7.84(2.56)
-7.85 (-1.88)
-7.84
(-2.5
6)
-2.1
9(-0
.70)
95 Km Panther
-29.00(-9.52)
(10.6
0)
(0.30)-41.54
(-3.46)
-29.
98(-5
.24)
-7.19(3.18)
-2.28
(0.93)
-10.94(-2.66)
-3.02(-0.17)
0.99
1.001.00
-0.93
(-0.30)
-0.00
(-0.00)
-40.90
(3.60)-99.32(466.25)
(72.
46)
-242
.56
-0.25
(-0.1
2)
-4.80(-0.76)
-10.50(-5.19)
-20.00(-7.91)
-4.0
0(-
1.29
)
-18.
00
(-0.
98)
-0.40
(-0.19)
-6.00
(-0.85)
-7.40(-1.89)
-0.33(-0.16)
-1.5
0(-
0.50
)
-15.00(-0.20)
-117.62
(-13.63)
116.00
(15.80)
-5.13(1.82)
(9.65)
-10.00
(-4.41)
-8.00(-0.10)
-5.90(-0.05)

South Sikkim
PHODONG
NEW MELLI-PG
GEYZING
TOWARDSKALIMPONG
RONGLI
RANGPO-PG
BULBULEY
SICHEY
2 X 6 MWGANGTOK-PG
NAMCHI
MAMRING
TOWARDSBINAGURI
RABANGLA
JORTHANG
RANGEET-I II3X20 MW
SAGBARI
SORENG
ROTHAK
MELLI
10 km
18 km
Dog
49 km Panther
21 km Panther
27 km Panther
25 km Dog
54 km Panther
12.32 km Twin Moose
26 km
17 km
Panth
er
110 k
m Tw
in Mo
ose
11 km Dog
22 kmDog
26 km Zebra
13 km
Dog
20 km Dog
Geographical Diagram of Existing Sikkim Network (AUGUST-16)
DATEREV.DESCRIPTIONCHECKEDREVIEWEDAPPROVED
IPP Hydro Generation
66 kV Line
66 kV SS
400 kV SS
220 kV SS
220 kV Line
400 kV Line
132 kV Line
132 kV SS
#5, 11th Cross, 2nd Stage,West of Chord Road,Bangalore- 560086, INDIAPh : +91-080-4245 5555E-mail : [email protected]
Power Research and Development
Consultants Pvt. Ltd.
DRAWN IN : MiP-PSCTTM
West Sikkim
East Sikkim
North Sikkim
22 kmDog
15 km
Dog
(15)
-329
(122)
(-3)
(-3)
-444
(3)
35
(-21)-35
(-23)(23)
41 -42
(3)
(-2)
-1
1
329
(-5)
70
-70
1.01
1.02
1.00
1.002X48 MW
87 (31)
-23 (1)
1.00
TEESTA-V3X170 MW
330(11)
1.02
CHUZACHEN2 X 55 MW
100(15)
1.00 1.00/
62 (9)
1.01
1.011.00
1.00
1.02
1.02
1.02 1.02
1.01
1.01
1.02
1.02
1.01
1.02
0.99
0.99
0.99
0.99
1.02GEYZING
1.02MELLI
TADONG0.99
NAMCHI OLD1.02
PELLING1.02
0.99PAKYONG
RHENOK0.99
MANGAN0.98
1.00
LLHPRANIPOOL1.00
TOPAKHANI0.99
51 (5)
-51 (-2)25 km Zebra
Pant
her
0
0
(0)
(0)
29 (4)
-29 (-2)
8 (2)
-8(-2)
10 km
11(2)
0.7 km Dog
-10(-2)
8 km
-42(12)
41(-12)
32 km Panther
TOWARDSNJP
-17(1)
90 km
Panth
er
-24(11)
5(1)
-5 (-1) 18 km
Dog3
(-2)
-3(2)
-16
(16)
-4(-1)
4 (1)
(15)
48(-15)
-48 0.3 km
-6(2)
6(-2)
15.5 km Panther
2(0)
-2(-0)2 kmDog
4(-2)
RAMMAM
KURSEONG
-30 (5)68 km Panther -2
2
(-0)
(0)
2(0)
-2 (-0)
-3
(-0)
3
(0)
4(1)
4 km-3(-1)
3(1) Dog
5 kmDog
2(0)
21 km Do
g
-2 (-0)
-2 (-0)
2(0)
Dog
5 km
12 km
0.99-0 (0)
RONGLI-HEP2 X 3.125 MW
0(0)
-4(3)
4(-2)
-2(-0)
2(0)
9 km Dog
-1(-0)
1(0)
-66
(-1)
(1)
12 km Dog
0.98
MEYONG HEP
12 kmDog-0
0(0)
(0)
0(0)
2 X 2 MW
0
(0)
0(0)
2(1)
15 km Dog
-1(-0)
-4(-1)
-6 (-2)
-4(-1)
-1(-0)
-5(-1)
-2(-0)
-1(-0)
-2(-0)
-1 (-0)
-1(-0)
-1(-0)
-2 (-1)
-4(-1)
-2(-0)
-2(-0)
-2 (-1)
-2(-1)
-2 (-1)
PARTICULARS SYMBOL
Load
LEGEND
DRAWN REMARKS
20/12/2016
Sikkim state existing network (August-16) geographical map.
-35 (7)
Eastern Regional Power Committee14, Golf Club Road, Tollygunge,Kolkata, West Bengal 700033
PO details: ERPC/PR_DBASE/2016/3567 Dated 30 March 2016 DWG. NO. : Geographical Power Map\ER\August-2016\Sikkim
Hydro Generation
IPP
IPP
IPP
R0

HAORA
UTTAR DINAJPUR
EAST MEDINIPUR
WEST MEDINIPUR
SOUTH 24 PARAGANAS
NADIA
DARJEELING
DAKSHIN DINAJPUR
Salakatti
Dalkola(PGCIL)
Behrampur
Gokarna
Raina
KTPS
Baripada
Basirhat
Krishnagar
Tamluk
Sonarpur
Pingla
arambag
PPSP
Birsingha
Sagardighi
MALDA
Birpara
Rangit
Coochbehar
Chukha
Kerseong
TCF I MoinaguriTCF II
TCF III
Balurghat
Raiganj
Gangarampur
Purnia
Khejuria
Ambuja
Amtala
Bakreswar
Sainthia
Rampurhat
Kuli
Bolpur
Debagram
Parulia
Ukhra
Purulia
Bagmundi
Bishnupur Old
Khatra
CK Road
Mahachanda
Bankura
Raghunathpur
DPL Mankar
Katwa TSS
Satgachia
Kalna
Khanyan
Belmuri DVC
UluberiaBalichak
Bagnan
Ranaghat
Bongaon
Falta
CESCHaldia Laxmikantpur
Tatapower
Kakdip
Contai
BEL CPP
Midnapore
Jhargram
Kolaghat(DVC)
Midnapur
HNIZ
HPCL
DSTPS
STPS
Chandil
Mainthan
Crescent
Bidhannagar
Dhulian
Lalgola
KLY
Samsi
Khlgaon split
Dalkola
Chalsa
Alipurduar
TLD 3
Rangpo
Lebong
Tala
Ramam II
Bongaon
Parklane
Barasat
NTAA-III
Salt lake
Howrah
Kasba
CLC
Jeerat
NTAA-I
Rishra
Jayashree
Bighati
Ashoknagar
BTPS
Dharampur
Bakreswar
Hind Motor
LILU
Botanicalgarden
Belur
Subhashgram-WB
Ranchi
Raghunathpur (DVC)
NJP
SiliguriPG
Siliguri Tala
Kurseong
Ujanoo
TLD3
TCF I
Chalsa
Rangpo
BinaguriBongigaon(NER)
LabongRamam III
NBU
Birpara(PGCIL)
Birpara(PG)
Hizlee
RM Bulk
Kharagpur (DVC)
TM Bulk
CK Road
Arambag
Balichak
Jhargram
KTPS
Adisapthagram
Jangipara
Domjur
Malda PG
Kahalgaon
Behrampur
Jamshedpur
Barjora
Waria DVC
Egra
BEL CPP
Belmuri
Arambag
F PARK
Uluberia
Khanyan
Ranaghat
Haldia
JOKA
South R S
Falta
Laxmikantpur
Kakdwip
Baripada
#5, 11th Cross, 2nd Stage,WOC Road,Bangalore-560 086, INDIA.Tel : +91-080-23192159,23192168,E-mail : [email protected]
Power Research and Development Consultants Pvt. Ltd.
MiP-PSCTTMCHECKEDREVIEWEDAPPROVED DATEDRAWN DESCRIPTION REV.
20.12.2016
Display NotationInjection into the bus : +veDrawl away from the bus : -veVoltage Mag/(Ang) in Pu /degreeFlows in MW and (Mvar)
PARTICULARS
400 kV Line
SYMBOL
220 kV Line
Subhashgram-PGCIL
Hura
LALMATIYA
Katwa
New Bishnupur
Tarakeswar
132 kV Line
Farakka
Raghunathgunj
New HaldiaHaldia
Dankuni
0.98
0.99
1.02
1.02
0.98
1.02
1.04
1.02
1.03
1.03
1.03
1.00
1.02
1.02
1.02
1.01
1.00
1.00
1.00
1.00
1.01
0.99
0.99
1.00
1.02
1.00
0.98
1.00
1.00
1.02
1.01
0.98
0.97
1.00
1.01
1.01
1.00
0.96
0.99
0.99
0.98
0.98
0.98
0.97
0.98
0.98
0.96
1.01
1.01
1.00
0.98
1.00
0.97
0.970.00
0.00
0.98
0.97
0.95
0.97
0.980.97
0.96
0.95
0.93
0.93
0.95
0.950.96
0.95
0.93
0.93
0.96
0.950.94
1.01
1.02
1.02
0.98
0.99
1.03
0.99
0.99
0.98
0.99
0.97
1.00
0.99
0.96
0.98
0.98
0.99
0.99
0.95
0.94
0.97
0.99
0.99
0.97
1.00
0.97
0.97
0.96
1.01
0.95
0.99 0.97
0.940.99
0.99
0.99
0.98
0.99
0.97
0.97
1.00
1.001.00 1.00
0.99
0.99
0.99
1.00
0.99
0.98
0.99
0.98
0.98
0.99
0.98 0.97
0.96
0.96
0.97
0.98 0.98
0.98
0.96
0.96
0.960.98
0.93
0.97
0.95
0.94
0.96
0.97
0.97
0.96
0.98
0.96
0.98
8 km
16km Panther
10 km Panther31
.3 k
m P
anth
er
16km
66km
69km
pan
ther
45 k
m
50 k
m
69km
65.5 km
20km
27 km
43km
Pan
ther
43 km Panther
0.8
km
54 km Panther
18km Panther
16km
Pan
ther
34km Panther 20
km P
anth
er
8 km
55 k
m
51 k
m P
anth
er
75 km Panther
68km
Pan
ther
75km Panther
7km Panther
35km
Pan
ther
22 k
m
38 k
m P
anth
er
27km
67km
Pan
ther
18km Panther
38km Panther
20 km Panther
47.3km
40.5
km P
anth
er
46km Panther
35km
54km Panther
4 5 km P
a nth
er30km Panther
18.75km
42km P
anther
55km P
anther
53km Panther
27km Panther
20 km
15.9 km Panther
35 k
m P
anth
er
59.62 km
32km
Panth
er
24km
Pan
ther
46km P
anther
88km P
anther
4 4.5km P
anth
e r
66.5km Panther
88km
Pan
ther
46km
Pan
ther
41km Panther
48 km panther
26km Panther
18km
Pan
ther
5 km
25.5km P
anther
22.7km
48 km
41km
29km Panther
53.5
km P
anth
er
34 km
34 km Panther
29km Panther
53.5
km P
anth
er
18km Panther
35km P
anth
er
20 k
m Z
ebra8.
3km
Pan
ther
15 km P
anther
21km Panther
15 km panther
36km
Pan
ther
26km
Pan
ther
10 k
m P
anth
er
10 k
m
25km
Pan
ther
26km Panther
58 k
m P
anth
e r
32km Panther
18km
18km
36km P
ant her
17 km P
anther
10 k
m P
anth
er
18 km Panther
1.1k
m
27 k
m P
anth
er
121 km Twin Moose
1 10 k
m T
win
mo
ose
168
km Q
uad
Moo
se
98 k
m T
win
Moo
se
167
km T
win
Moo
se
95km
Tw
inM
oose
40km
Tw
in M
oose
150
km T
win
Mo
ose
67km Tw
inm
oo
se
26km
Tw
inm
oose
70.7km Twinmoose
130
km T
win
Mo
ose
163km Tw
inmoose
115km Tw
inMo
ose
183.5 km TwinMoose
210km TwinMoose
98km TwinMoose
90 km Twin Moose
0.4
km P
anth
er43
km Z
ebra
58 km Zeb
r a
108
km Z
ebra
6km
80km Zebra
80km Zebra
67 km Panther
41km Zebra
220 km Quad Moose
1 kmZebra
79km Zebra
81km Zebra
62 km Zebra
105km Zebra
49 km Zebra
52km Zebra
78 km Zebra
73km Zebra
58KM Zebra
56km
Zeb
ra
55km Panther
34 km Panther
69km Panther
22.7
km
19km Panther
32km Panther
77 k
m P
anth
er
100km Panther
217km TwinMoose
217km Twin Moose
95 k
m T
win
Moo
se
53 k
m T
win
Mo
ose
177 km TwinMoose
78km Tw
inM
oose
163km Twinmoose
78km Zebra
136k
m T
winm
oose
55km
Zeb
ra
73km Zebra
20.7
km
Zeb
ra
0.6 km Zebra
14.5 km Zebra
71 km Zebra
80.8
km Z
ebra
6 km Zebra
38 km Z
ebra
116k
m Z
ebra
80.8 km Z
ebra
132km Zebra
40km
Zeb
ra
45.3
km
Zeb
ra
71km
Zeb
ra
18km
26km
Pan
ther
35.2 km
39 km
90km TwinMoose29 km
Chanditala
33.4 km panther
70km zebra
24 km Zebra
22km
zeb
ra
Burdwan
Binaguri
Behrampur
200k
m T
win
Moo
se
19km
Pan
ther
73km Tw
inmoose
169 km Twin Moose
5X210 MW
6X210 MW
2X300 MW
2X250 MW
3X500 MW
2X500 MW
2X300MW
4X225 MW
4X33 MW
1X110 MW 1X300 MW1X250 MW 3X75 MW
1X140 MW1X210 MW
98 km Twin Moose
Sagardighi
171km Twinmoose
11 km
161 km Twin Moose
19km
Muchipara(Durgapur)
40km
m Z
ebra
34 km Zebra
Purnea
168
km Q
uad
Moo
se
168
km T
win
Moo
se
200km Tw
inMoose
4X12.75 MW
3X7.5 MW
3X7.5 MW
3X7.5 MW
4X60MW1X210 MW
3X9 MW
2X4 MW
2X20 MW
2X500MW
Basirhat
6 km Panther
Kolaghat
1km
27 km
Panthe
r
8 km
10 km Panther
Purulia DVC
Debagram TSS
Melli
48k m P
a nth
e r
KTPS
80km
Tw
in M
oo
se246
km T
win
Mo
ose
246k
m T
win
Moo
se
115
km T
win
Mo
ose
121
km T
win
Moo
se
220km Quad Moose
Malbase
Mejia
168km TwinMoose
97km
Tw
inM
oose
84km
Tw
inM
oose
17km Zebra10km
131.8 km Zebra
145km Zebra
119k
m Z
ebra
40km
Zeb
ra
Parulia(DVC)
22km
71km
Zeb
ra
29km
Pan
ther
14km
Pan
ther
78km
Pan
ther
41km PantherMoinguri
90km
pan
ther
Melli
90km P
anther
95km
Pan
ther
42km
Pan
ther
57km
pan
ther
63km Panther
35.6km
40km panther 2.4km
6km
55km
Satgachia43km Panther
5.5k
m, 3
km
6km
16km Panther
21km
22km
24.5
km P
anth
er 40km panther
12 k
m P
anth
er
8km
7km
13 k
m P
anth
er
3 km
46km Panther
18km
Pan
ther
110 km Tw
in M
oo
se
Chanditala
JALPAIGURI
KOCH BIHAR
BARBHUM
MALDAH
MURSHIDABAD
BURDWAN
HOOGLI
BANKURA
NORTH 24 PARGNAS
PURULIYA
50.1km Panther
297(94)
256(-5)
-258(16)
-105
(-10
)
105
(52)
268
(37)
-270(0)
-384
(33)
382(-12)
( 3)
-308
(25)
308
-535 (78)
533(
-9)
266(4
3)
-270(-51)
-358 (33)
357
(-12
)
-43(24)
43(85)
-42(25)
42(84)
-850
(-106
)
-668(257)
-715 (204)
264(-45)
489 (-84)239
(59)
-460 (-58)
457(
148)
-231
(103
)
230(
15)
80 (140)
-80
(57)
536(
-28)
74 (160)
-21 (15)
21(25)
-344
(65)
-314
(95)
84 (49)
-3 (17)
3(2
00)
262
(26)
-264
(25)
78(-
33)
-78
(47)
-296 (36)
(193)295
106
(-9)
-106(52)
-223 (21)
222 (
27)
442(
-23)
525
1.03
-148
(44)
-57
(26)
-709
(-10
)
-32
(7)
32 (4)
(7)
1.00
254(8)
-258(-8)
40km
Zeb
ra
347
(58)
-351
(-68)
(-16)
170(
2 2)
-171
349(
23)0
(0)
0 (0)20 (7)
-20
(-3)
-112
(-1)
111(
13)
(-13
)
-42
42
(19)
(-34)
271
(31)
-273
-63
(-3)
63(5
)
-4(1)
-134 (-19)
132(18)
199
(27)
-201(-20)
-134(-19)
-17
(6)
17(14)
-67(-2)
67 (15)
64 (0)
-65(16)
-28 (-10)
-68(34)
67 (-29)
48 (10)
-49(6)
37(2
)
-29(15)
(-27)
112(38)
-113
251 (-13)
-257 (13)
139
(10)
-141
(13)
-158 (-18)
158 (19)
(6)
-137(-5)
137
11 (13)
-11 (10)
-150 (34)
235(
4)66(-
23)
-84(-16)
-132
(5)
131(
5)
1.00
42km Zebra
4X210MW2X250MW
-111(-32)
111(37)
1.00
-244(-112)
244(112)
-38(1)
38(2
)
-40 (6)
90(-
6)
-90
(20)
31.5km
4(-1)
-34(-7)
34 (8)
Patuli
24 km Zebra
1.01
-43 (-7)
Kharagpur
Kharagpur
(0)
0 (0)
0
0(0)
0(0
)
74(-7
)
-75 (
8)
110 (1
5)
-111 (-16)
-49
(3)
48(1
)
-31(-
5)
30(5)
57.3km
69.2km69.2km 49.7
km
Howrah(dvc)
51.5km Panther
Kolghat DVC
BBGS
Chakmir
20.0
9km
D/C
Moo
se18
.7km
D/C
Moo
se
Tartala
5.4k
m
Majerhat
6.1km
0.86km
5.56km11
km Panther
4.4km
Titagarh WB
TRS
NCGS
PRSBBD bag
10.96
km
9km
9.8k
m
1 6. 2
km
Ze b
r a
0.5k
m
13.3
6km
Pan
ther
Dumdum
9.3k
m
2.5km Panther
8.5km
BT road
East kolkata
7.8
km P
anth
e r
6.56km
9.62
km
EMSS
Jadavpur
2.2k
m
2X45 MW1X30MW
1X250MW
BRG Steel Tap
ALIPURDUAR
57.3 km
Bishnupur Old
59(1
1)
-60(-1
0)
(-24)
33 (-2)
-34 (2)
-30(3)
29(-1)
28(-2)
-28 (3)
37(-2)
-38(3)
13(4
)
-14
(-0)
-12(0)
1 2(2 )
38 (4)
-35 (5)
34 (-4)
0.96FKK-s
-52
(-8)
51 (7)
-20 (-1
)
-53 (-4)
51 (3)
0.94
0 (0)(0)0
-4 (-0)
0(0)
0( 0)
0(0)
(0)
0-88
(-9)
87(9)
31(4
)
63(-1
3)
-111
109
(16)
(-17)
0.95
-2 (4)2 (-2)
-54(10)
53(-8)
-107(5)
103 (-7)
-1 (-25)
-13
49 (-5)
-49
(7)
0 (0)
0(0
)
-108 (2)
-60 (4)
60 (-2)
0(0)
0 (0)
-39 (4)
43(1
0)
-35
(-11)
-51
(13)
0.97
0 (0)0 (0)
-101
(-9)
40(2)
0(0)
0(0)
0(0)
30 (-0)
-21(0)
0.99
-157
(0)0
-39 (4)
0(0)
84
(2)
0(0)
24
(6)
-52
(-11
)-8
(0)
-1 (-3)
-7(5)
31(7)
-32
(-5)
45 (13)
-46(-13)
-45(-3)
44(3)
-29
(-3)
-26
88(-1)
(-3)
-90 (1)
0.94
-32
( -1)
31(5
)
23 (0)
29 (-2)
141
(16)
-53
53(4)
0 (0)
0(0)
4 (-1)
0 (0)
0(0
)
0(0
)-5
9(4
)
(-1)
58
(-13)
0(0
)
0 (0)
47(11)
-14(-0)-39
(-4)
-53 (-7)53 (7)
-25(-8)
28(-
2)
17(3)
-4(2)
-36(-1
)29
(-1)
37 (-2)
-6 (1) Banarhat
0.99
-4 (1)
35km panther
-48(-12)
0(0
)
-31(-1)
24 (-11)
Belmuri DVC0.98
0.98
0.98
0.98
-45(15)
-20(10)
-4(12)
4(-
7)
45(-1
3)
-10 (2)
10 (3)
36 (5)
-36 (-4)
4 (20)
Mathabanga0.96
00
(0)
(0)
-22 (-3)
21(5)
0.97
0 (0)
0 (0)
-15(5)
15 (-5)
49
(-0)
-4 (-1)
-1 (-1)
-36
(-18
)
-29
(-10
)
-40
(-13
)
6 (-0)
-53 (-
18)
-67
(22 )
TLD 4
TLD4
145km Zebra
1.02
0( -0)
-0(41)
145k
m Z
ebra
160km Zebra
-13
(8)
13(-
4)
-96(-14)
95(1
4)
0.98
0.98
0.98-1
20(1
6)32
.5km
Zeb
ra
82(-
44)
107(13)
82(3
1)-8
3(-
31)
55 (-151)
22.5km Panther
71km Panther
91km TwinMoose
91 km TwinMoose
136km Twin Moose
-299(-44)
1.00
71km Zebra
-355 (-40)0(0)-41
(1)
( -14
)
1.00
Vidysagar Park
-105(-0) 0 (0)
90km Panther 46 k
m Z
ebra
32.5 km Zebra
0.99
70.5km Twin Moose 389(0)
495
(40)Bangladesh Bheramra
-419
(10)
71 k
m T
win
Mo
ose
(-22)
(123
)
848
-244
3X200 MW
148 8
(140
)
472
(50)
-438(7)
-362 (-34)
168
km T
win
Moo
se
(61)-212
-274 (26)
Kishanganj
-78(36)
78(183)
155 km Quad Moose
2X600 MW
350
(-140
)
102(
17)
-103
(8)
Kishanganj
-274 (26)
211
(61)
274 (1
11)
-212
(4)
442
(-23
)
217km Twin Moose 308 (-51)
308 (-51)
115 km Twin Moose
Malbase
-240
(-5)
-491 (62)
-265 (28)
Bongigaon(NER)
-444
(122
)
222
(27)
-0(1
1 )
0(-0)
(-20)
67
78 km Panther
41 km Panther
0.99
83.8
km
Pan
ther
(-5)
-31(-15)-56 (7)
55(-8)
26 km Panther
102(24)
-21
(-7)
-176 (14)
174(0)
105 km Zebra
110(-21)
(18 )-113
-82
(-27
)(13) -24
30
-30 (13)
(-12)
Dhatri T0.99
-4(-
1)
-4(-2)
18 k
m P
anth
e r-4
4(-
15)
-35(13)
35
(-5)
19. 5 km P
anthe r0
(0)0
(0)
0(0
)
0 (0)
0 (0)
-29(
-3)
(-2)
-85
-22 (1
) -71(-18)
24 km Panther
14 k
m P
anth
er
1.01
0(0
)
0(0)
-79
(0)
42(-4)
-42(4)
-42 (4)
42(-4)
-114 (11)-9(-3)
-20
(-6)
0(0
)20(-4
2)0
(0)
-60
(-17
)
-42(-10)
31(12)
-31(-11)13 km Panther
19
(-3)
-44
(-0)
-92
(-14)
-53(-11)
-19
(5)
13 km P
anth
er
-36(-5)-76
(-23)
-23(9
)39(48) 0
(0)
-117
(-9)
-64(-11)
-46
(-20)
-32(
-1)
-90 (1) -77(-25)
-3 (-1)
0.94Sirakol
-68 (2)
35.2 km Panther
0.990.98
-266 (-36)
(58)
266
3.5 km 80
0sqmm XLPE
434 (-24)
(42 )
-174
19 k
m Z
ebra
1.01
0(0
)
0.97
-72(-21)
-64(28)
0.97
1 7.3
km
Pan
ther
0.97
-37(-3)
0.98
-26
(-3)
7 km
Pan
ther
0.98
-72 (23)
P Circus
-79 (7)0.98
7km Panther
4.3km Panther
0.970.97
1 74
(4)
1.5km Panther-40 (-10)
-41 (-17)
-0
(-0)
0.97
-55
(8)
-2 (-7)
177
(-38
)
4X120 MW
0 (0)
1.011.01
1.01
-442
(41)
243(55)
85 km 800sqmm XLPE
2X250MW476
(0)
35
(13)
-31 (5)
0(0
)
(0)0
1.01
0(0
)
0.98
0.97WBIIDC
0 (0)
0(0
)
-38(-18)
-13(1)
-45 (-5)
36.2 km Panther
-20(-11)
33.4
km
Pa n
ther
-6
(-2)
-20
(-1)
46.8
km P
ant h
er
0.95SonarLal
-19(-1)
47.2
km P
anth
er
-59
(-19
)
-32
(-11
)
1(29)
10km
0.99
-6(2)
25(3
)
21(-
4)
-73
(-24)
-21
(-4)
50km Panther
-28
(-9)
0(0)
0 (0)
0(0)
20 (-3)
-44
(-21)
0 (0)
0(0)
-34
(-16)
98.4 km panther
-40
(14)
10km P
anth
er
-19
(-9)
-94(-27)
0.93-46
(-15)
-19(-6)
30 (6)-59
(-35)
0 (0)
0(0
)-18 (-9)
19 (3)
-19
(-3)
-49(-12)
-51
(-7)
-32
(-16
)
Cossim Bazar TSS
0.95
-0(0)
0(0)
-109
(-33
)
-0
(-0)
13km
-48(-20)
0.95
-0(0
)0
(0)
-0
(-0)
-31
(-1)
-4(-0)
-48(-16)
-49
(-9)
-59
(-25
)
106 (-3)
-46
(-14
)
-38
(-18
)
-13(-4)
50(-
10)
-3 (8)
3(-
4)
-3 (-1)45 (8)
(-6)-4
5
-40
(-1)
-33
(-11)
40
(-14)
12(4)
-12(-3)
-94(-25)
-40(-1)
-24(-2)
24 (8)
-24
(-7)
-37(-15)
-43
(-15
)
-45
(-15
)
-64
(14)
-18
(-6)
-0(-0
)
-28
(-12
)
0(0
)
(-37
)
-78
-31
(-10)
-49(-9)
49(8
)
-30
(-7)
43(7)
-56
(-18)
-40
(-13) -40
(-13)
-83
(-19
)
-39
(-12
)
-62
(-20
)
(3)
1
(-0)8
52(1
2)
-3(-1)
-24
(-4)
1.01
52 (14)
-2(-1)
0(0)
-15(-7)
-50(-5)
-75
(-26
)
45(15)-45(-15)
-39(-13)39 (13)
52 (-3)-53
(8)
Mosabani DVC
-52(4)95.2 km Panther
-194(-83)
0(0)
0.99
-73 (20)
71 (-17)
69.22 km L
AR
K
-31 (-10)
31(5
)
41(4
)
-41(-4)17
km -26(-9)67(-1)
0
(0)
0 (0)
-67
(-19)
26 (5)
0(0)
438
(-58)
1.01 1.01
208
(-37)
(45)-208
-49 (-21)189
(-29)
(38)-189
17(12)
-17(-12)
-97
(26)
96(-1
8)
-95(23
)
94(-1
6)
10.36
km
28 (-0)
-28
(5) 6.
4km
-28 (4)28
(0)
-102 (-17
) 72(-1
5)
-100
(-29
)
-49
(-16
)60
(16)-26
(-10)
26(1
0)
0(0
)
-47
(-14
)
0.97
1.01
1.37km-20(35)
-74
(-22)-2
2
(-7)
-62
(9)
62(-4
)
5.4k
m
-17
(-6)
79 (-3)
0 (0)
-72
(-23)
-71
(-23
)
KTPS
5(-
3)
-5 (4)
-125(48)
-26
(-8)
25(1
0)
-31
(-10
)
-162
(-27
)
0.96
5
(-3)
-5 (3) -5(-2)
11.1 km
41(1
1)
36(6)
-77(-25)
1.01
27(-4
1)
-89(-16)
-43
(-8)
26
(-19)
-79 (-1
)-2
7(-
9)
-38(-15)
-124(-42)
(0)
0
-70(-23)
-102 (-29)
-54
(-18
)
-49(-5)
-30(-15)
0(0
)
-28
(-3)
91(4
0)
-111
(-37
)
26 (15) -49
(-18
)
2(-8)
24 (-11)
-92
(-40)
0(0
)
-39 (-44)
-26 (-14)
188
(138)
115
(7)
Barjora DVC
ASP
Ramkanali0.98
-6 (2)6
(1)
73km
0.98
-42 (-11)
43(-
11)
-43
(11)
-32
(-5)
32 (9)
-26
(-6)
11km
100 (-1)
(11)-1
00
1.00
-35(-45)
35 (49)
14.75km Zebra
1.00
-76
(-24
)
-107 (-34
)-73 (14)73(-6)
1.001.00
-84(-6)
141(14)
-141
(-13
)
-42
(-9)
-66
Burnpur
Jamuria1.00
Asansol
0.99
1.00JK Nagar
1.00 Asansol
32 (9)
Kalipahari
0.98
0.9843(-11)
27(1
8)-9
0
(-30
)
28(0
)
89.89 km Zebra
44 (-12)
-44(15)
40.49km
114km
2 (17)
IICSOWaria (DVC)
35
(14)
1.00
STPS
Bidhannagar
CTPS-B1
Mejia
39.7 km LARK
33 km Panther
19(13)
-51
(-19
)
-4 (1)
119.
2 km
LA
RK
-39
(-4)
35 (6)
22 k
m
-99(11)
66(-17)
-2
(-0)58.23 km
89.8
9 km
Zeb
ra
40.4
9 km
Zeb
ra
62 km Zebra114 km Zebra
1.00
CTPS-B1 Panchet
-24(3) 25 (-2)
-7 (-2)
60 km LARK
14.5
km
LA
RK
87km
LA
RK
59.6
3 km
Pan
ther
-15(-1)
-1(-
4)
16 (5)
300
(-43)
861
(47)
-74 (-78)
A
BAB
C1CBmn
274 (-90)
0.98
0.980.98
0.980.98
-12
(-4)
-44
(-13
)
0.98
-42
(-13
)-6
0
(-19
)-3
4
(-11
)-2
5
(-8)
Kalyaneshwari
-39(-4)
CTPS-A1
Kalyaneshwari
54.9
km
(23)
58.2
3 km
-74
(-30
)
496
(1)
-57 (-22)
0(0)
2X40 MW
0
(0)
90km P
anth
e r
-77
-21(6) 19(-4)
-19(8)
-22
(-1)
0(0
)
899
(69)
Tamla1.00
-21
(-7)
-6(-2)
-30(-10)
29 (3)
0(0)
-42(-10)
-0(-0)
538(-18)
-535
(78)
-9(-3)
Kolaghart T0.98
-31
(-11)
5 (1)
-36
(-12
)
-5(1)
-8(-
3)
8(5)
-48
(-5)
0 (0)
West Bengal state existing network (August-16) geographical map
DWG. NO. : Geographical Power Map\ER\May-2016\West Bengal
14, Golf Club Road, Tollygunge,Kolkata, West Bengal 700033
Eastern Regional Power Committee
LOA details: ERPC/PR_DBASE/2016/3567 Dated 30 March 2016 DRAWN IN:
Load
400 kV S.S
220 kV S.S
132 kV S.S
Thermal Generation
Hydro Generation
3X60MW
0
(0)
-24(-8)
-3
(-1)
-5
(-2)
-31
(-10
)
-103
(-34
)
-40(-1)
-9
(-0)
-11 (-4
)
-13(-6)
-3 (-1)
-15(-6)
-37(-13)
REMARKS
-96(-48)
(-14)
-108
-22
(-7)
672
(83)
107 (
10)
-67
(-22
)
-68 (2)
-111(-40)
R0
25km
Pan
ther
CGP
CGP
CGP
IPP
IPP
IPP
IPP
IPP
-31
(-10)
-77(-25)
-3 (-1)
IPPIPP
CGPCGP
6km
2 .6k
m
0.97Balurghat_Tap
0.96Ambuja Tap
40
(13)
0(0) -4
0(-
13)
0(0)
0(0)
22 k
m P
anth
er
1.5km-40
(-13)
17(18)
-17(34)16
6(4
3 )
-167 (41)Chaibasa
17
(18)-17(34)
403 (1)
-405(17)
70,5km TwinMoose
Chaibasa
-29(1)
28(1) 13(-5)
0(0)
0 (0)
1.00 1.00/
-22
(-7)
HizleeTSS
-14(-5)
Egra
98km TwinMoose
53.5
km Z
ebra
-133 (-7)
132
(19)
53.5km Zebra
132 (1
9)
-133
(-7)
Kolaghat DVC
Food ParkFood ParkTap 0.98
0.98
15(7)
-15(-5)
15(7)
-15(-5)
7 (1)
-22(-8)
22(8)
-22(-7)
37.5km Panther
20km
Pan
the r
75 (25)
-75 (-26) 0.99 0.99
-0(5)
-0(0)
0(-0)
0(0
)
Pingla
BRG Steel
0.96Bolpur TS
-1 (-0)
1 (0)
-1(-0)
0.98
Chanditala
-0 (0)0(-0)
161.5km TwinMoose
0.93Nazirpur
-24
(4)
24
(-3)
-24
(-8)

Web based Protection Database and Desktop based Protection setting calculation tool – ERPC
156 PRDC Bangalore January 2017
Table G: 765 kV, 400 kV, 220 kV, 132 kV and 66kV line flow (simulated result) of Eastern region grid
Sl.No
No. of Ckts.
From Station To Station
Power Flow (Forward) %
Loading Owned by
MW MVAr
Bihar
765 kV
1 1 Fathepur Sasaram 197.
0
-515.53
8 14.5
PGCIL
2 1 Balia Gaya -
290.0
-342.86
1 11.8
3 1 Gaya Varanasi -
229.4
50.472 6.2
4 1 Gaya Varanasi 229.
0
-329.79
3 13
400 kV
1 1 Varanasi Biharshariff -3.1 6.021 10.70
PGCIL
2 1 Varanasi Biharshariff -2.9 -6.896 10.70
3 1 Banka Biharshariff 281.
7 -
15.697 31.90
4 1 Banka Biharshariff 281.
7 -
15.697 31.90
5 1 Biharshariff Muzaffarpur 162.
9 82.696 25.40
6 1 Biharshariff Muzaffarpur 162.
9 82.696 25.40
7 1 Biharshariff Purnea 0.0 0 0.00
8 1 Biharshariff Purnea 0.0 0 0.00
9 1 Biharshariff Lakhisarai -
229.5
74.765 27.30
10 1 Biharshariff Lakhisarai -
229.5
74.765 27.30
11 1 Biharshariff Balia 54.3 -126.9 7.80
12 1 Balia Biharshariff -
53.8 -7.747 7.80
13 1 Sasaram Biharshariff -
178.6
-7.843 20.60
14 1 Sasaram Biharshariff -
178.-7.843 20.60

Web based Protection Database and Desktop based Protection setting calculation tool – ERPC
157 PRDC Bangalore January 2017
Sl.No
No. of Ckts.
From Station To Station
Power Flow (Forward) %
Loading Owned by
MW MVAr
6
15 1 Barh Kahalgaon -
327.8
-33.063
19.30
16 1 Barh Kahalgaon -
327.8
-33.063
19.30
17 1 Kahalgaon Banka 295.
2 2.325 33.30
18 1 Kahalgaon Banka 295.
2 2.325 33.30
19 1 Farraka Kahalgaon 21.6 -
12.157 5.40
20 1 Farraka Kahalgaon 21.6 -
12.157 5.40
21 1 Farraka Kahalgaon 21.2 -
12.397 5.30
22 1 Farraka Kahalgaon 21.2 -
12.397 5.30
23 1 Lakhisarai Kahalgaon -
309.5
16.661 35.20
24 1 Lakhisarai Kahalgaon -
309.5
16.661 35.20
25 2 Patna Kishanganj 0.0 0 0.00
26 1 Patna Barh -
212.0
-124.85
9 14.00
27 1 Patna Barh -
212.0
-124.85
9 14.00
28 1 Patna Barh -
212.0
-124.85
9 14.00
29 1 Patna Barh -
212.0
-124.85
9 14.00
30 1 Balia Patna -
69.4 -
63.989 5.40
31 1 Balia Patna -
69.4 -
63.989 5.40
32 1 Balia Patna -
69.4 -
63.989 5.40
33 1 Balia Patna -
69.4 -
63.989 5.40
34 1 Balia Biharsarif -
53.8 -7.747 7.80

Web based Protection Database and Desktop based Protection setting calculation tool – ERPC
158 PRDC Bangalore January 2017
Sl.No
No. of Ckts.
From Station To Station
Power Flow (Forward) %
Loading Owned by
MW MVAr
35 1 Barh Gorakhpur 156.
8 -
97.175 12.40
36 1 Barh Gorakhpur 156.
8 -
97.175 12.40
37 1 Sarnath Sasaram -
191.0
4.852 22.40
38 1 Nabinagar Rly Sasaram 0.0 0 5.10
39 1 Nabinagar Rly Sasaram 0.0 0 5.10
40 1 Allhabad Sasaram -
43.0 -94.99 12.20
41 1 Muzaffarpur Gorakhpur 212.
0 86.358 17.10
Power link
42 1 Muzaffarpur Gorakhpur 212.
0 86.358 17.10
43 1 Muzaffarpur Purnea -
309.4
-31.864
18.00
44 1 Muzaffarpur Purnea -
309.4
-31.864
18.00
45 2 Kishanganj Purnea 273.
6 -1.102 8.40
PGCIL
46 1 Kishanganj Binaguri -
136.8
-55.639
8.50
47 1 Kishanganj Binaguri -
136.8
-55.639
8.50
48 1 Malda Purnea 230.
1 58.227 27.70
49 1 Malda Purnea 230.
1 58.227 27.70
50 1 Binaguri Purnea 105.
8 -
30.435 12.60
51 1 Binaguri Purnea 105.
8 -
30.435 12.60
220 kV
1 1 Bodhgaya Biharshariff 0.0 -
15.477 7.30
BSPTCL 2 1 Bodhgaya Biharshariff 0.0 -
15.477 7.30
3 1 MTPS Gopalganj 131.
5 5.509 63.60
4 1 MTPS Muzaffarpur -
167.8
15.243 81.60 Power link
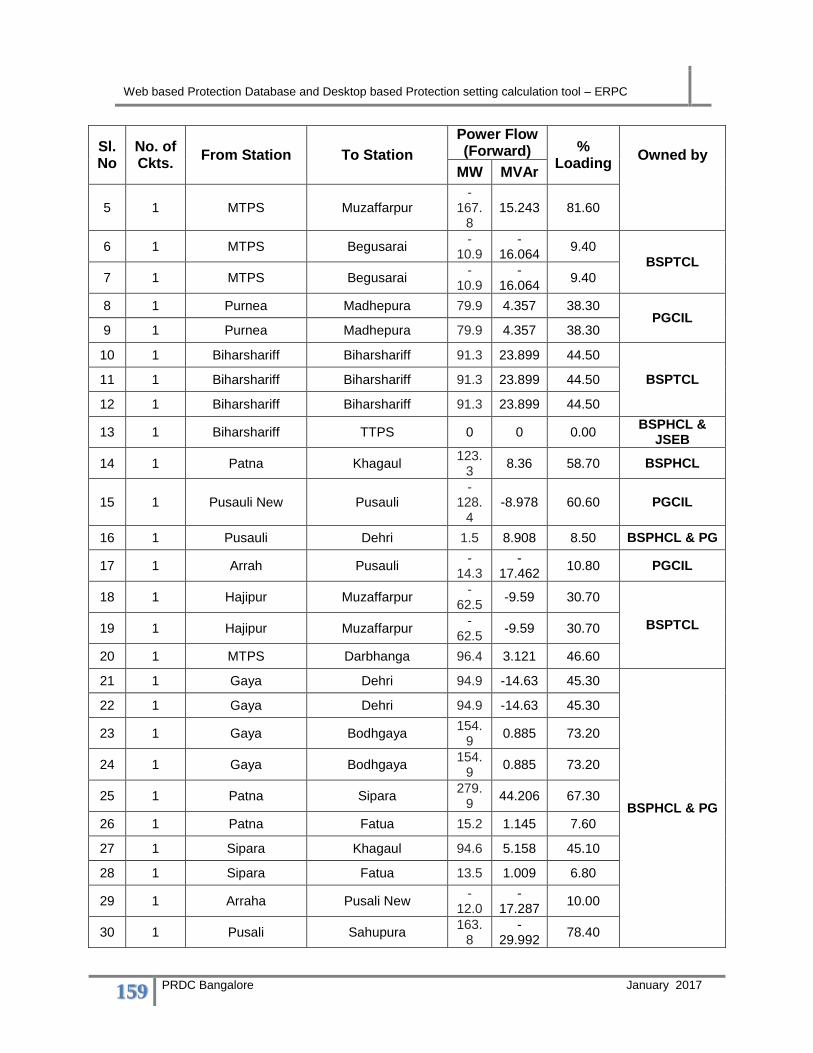
Web based Protection Database and Desktop based Protection setting calculation tool – ERPC
159 PRDC Bangalore January 2017
Sl.No
No. of Ckts.
From Station To Station
Power Flow (Forward) %
Loading Owned by
MW MVAr
5 1 MTPS Muzaffarpur -
167.8
15.243 81.60
6 1 MTPS Begusarai -
10.9 -
16.064 9.40
BSPTCL
7 1 MTPS Begusarai -
10.9 -
16.064 9.40
8 1 Purnea Madhepura 79.9 4.357 38.30 PGCIL
9 1 Purnea Madhepura 79.9 4.357 38.30
10 1 Biharshariff Biharshariff 91.3 23.899 44.50
BSPTCL 11 1 Biharshariff Biharshariff 91.3 23.899 44.50
12 1 Biharshariff Biharshariff 91.3 23.899 44.50
13 1 Biharshariff TTPS 0 0 0.00 BSPHCL &
JSEB
14 1 Patna Khagaul 123.
3 8.36 58.70 BSPHCL
15 1 Pusauli New Pusauli -
128.4
-8.978 60.60 PGCIL
16 1 Pusauli Dehri 1.5 8.908 8.50 BSPHCL & PG
17 1 Arrah Pusauli -
14.3 -
17.462 10.80 PGCIL
18 1 Hajipur Muzaffarpur -
62.5 -9.59 30.70
BSPTCL 19 1 Hajipur Muzaffarpur -
62.5 -9.59 30.70
20 1 MTPS Darbhanga 96.4 3.121 46.60
21 1 Gaya Dehri 94.9 -14.63 45.30
BSPHCL & PG
22 1 Gaya Dehri 94.9 -14.63 45.30
23 1 Gaya Bodhgaya 154.
9 0.885 73.20
24 1 Gaya Bodhgaya 154.
9 0.885 73.20
25 1 Patna Sipara 279.
9 44.206 67.30
26 1 Patna Fatua 15.2 1.145 7.60
27 1 Sipara Khagaul 94.6 5.158 45.10
28 1 Sipara Fatua 13.5 1.009 6.80
29 1 Arraha Pusali New -
12.0 -
17.287 10.00
30 1 Pusali Sahupura 163.
8 -
29.992 78.40

Web based Protection Database and Desktop based Protection setting calculation tool – ERPC
160 PRDC Bangalore January 2017
Sl.No
No. of Ckts.
From Station To Station
Power Flow (Forward) %
Loading Owned by
MW MVAr
132 kV
1 1 Chandauti Karamnasa 0.0 0 0.00 BSPHCL &
UPPCL
2 1 Bodhgaya Wajirganj 62.9 19.862 80.80
BSPTCL
3 1 Sonenagar Japla 4.6 -1.707 6.10
4 1 Sonenagar Chandauti -
15.4 7.24 23.10
5 1 Sonenagar Aurangabad 12.3 -2.619 15.30
6 1 Sonenagar Aurangabad 12.3 -2.619 15.30
7 1 Jehanabad Arwal 25.6 1.867 31.90
8 1 Rafiganj Sonenagar 0.8 -9.454 11.70
9 1 Rafiganj Rafiganj_R 7.8 2.289 10.10
10 1 Dehri Banjari 10.8 1.73 13.90
11 1 KCL Banjari -5.5 -1.776 7.10
12 1 Dehri Sasaram 15.8 -12.27 24.30
13 1 Dehri Sonenagar 25.0 3.324 30.80
14 1 Dehri Sonenagar 25.0 3.324 30.80
15 1 Dehri Bikramganj 29.3 4.417 36.20
16 1 Biharshariff Rajgir 0.0 0 0.00
17 1 Biharshariff Barh 0.0 0 0.00 BSPTCL &
DVC
18 1 Biharshariff Hathidah -
20.0 15.007 31.80
BSPTCL
19 1 Biharshariff Nalanda 12.2 -5.141 16.20
20 1 Biharshariff Ekangasarai 22.1 6.555 28.80
21 1 Biharshariff Nawada 0.0 0 0.00
22 1 Biharshariff Sheikhpura -
11.8 11.753 22.10
23 1 Hathidah Sheikhpura 6.6 -0.947 8.10
24 1 Hathidah Lakhisarai -
46.2 11.824 59.00
25 2 Lakhisarai Jamui 66.7 -2.851 40.30
26 2 Jamui Jhajha_R 5.5 -1.303 3.50
27 1 Lakhisarai Lakhisarai_R 8.2 2.381 10.60
28 1 Jamui Sheikhpura 32.5 -3.969 39.90

Web based Protection Database and Desktop based Protection setting calculation tool – ERPC
161 PRDC Bangalore January 2017
Sl.No
No. of Ckts.
From Station To Station
Power Flow (Forward) %
Loading Owned by
MW MVAr
29 1 Rajgir Barhi -
13.6 12.329 25.40
30 1 Jamalpur Sultanganj 0.0 0 0.00
31 1 Sultanganj Sabour -3.2 -1.082 4.10
32 1 Jamalpur Lakhisarai -
32.6 -
11.915 42.70
33 2 Lakhisarai Lakhisarai -
120.4
-18.998
74.30
34 1 Lakhisarai Jamui 0.0 0 0.00
35 1 Sabour Kahalgaon -
13.8 -1.28 16.50 PGCIL
36 1 Dumraon Arrah -
26.2 -0.469 32.70
BSPTCL
37 1 Dumraon Dumraon_R 8.2 2.543 10.70
38 1 Dumraon Buxar 18.7 5.825 24.70
39 1 Arrah_PG Arrah_BSEB 13.0 4.24 16.80
40 1 Arrah_PG Arrah_R 7.3 2.175 9.40
41 1 Arrah_PG Jagdishpur 18.7 1.117 23.10
42 1 Purnea_BSEB Saharsa 26.3 -4.127 33.10
43 1 Purnea_BSEB Forbesganj 71.0 3.775 88.30
44 1 Saharsa Udakishanganj 0.0 0 0.00
45 1 Saharsa Madhepura 1.5 -2.565 3.80
46 1 Khagaul Purnea -
24.7 0.648 32.60
47 1 Muzaffarpur SKMCH 17.7 2.414 22.80
48 1 Samastipur Begusarai -
46.5 6.181 59.50
49 1 Samastipur Hajipur 4.4 -0.05 6.90
50 1 Pandauli Madhubani 12.1 -5.592 16.90
51 1 Hajipur Hajipur 6.4 1.934 8.50
52 1 Gopalganj Mashrakh 12.9 -2.632 16.80
53 1 Chhapra Chhapra 6.4 1.956 8.70
54 1 Siwan Gopalganj -
26.5 2.342 34.40
55 1 Ekma Ekma 13.1 -2.058 17.10
56 1 Motihari Dhaka 3.1 -2.578 5.30

Web based Protection Database and Desktop based Protection setting calculation tool – ERPC
162 PRDC Bangalore January 2017
Sl.No
No. of Ckts.
From Station To Station
Power Flow (Forward) %
Loading Owned by
MW MVAr
57 1 Bettiah Motihari -7.3 11.081 19.30
58 1 Bettiah Gopalganj -
21.7 1.3 28.40
59 1 Bettiah Gopalganj -
21.7 1.3 28.40
60 1 Ramnagar Bettiah -7.8 7.06 15.20
61 1 Ramnagar Swadesi_G 0.0 -0.635 0.8*
62 1 Nalanda Barhi -8.8 1.074 12.70
63 1 Darbhanga Darbhanga -
40.2 -
11.607 52.90
64 1 Darbhanga Samastipur -9.2 -0.001 11.90
65 2 Darbhanga Pulparas 12.2 5.313 10.80
66 1 Kahalgaon Sabour 1.3 0.417 2.30
67 1 Kahalgaon Lalmatia 33.5 -9.086 41.10
68 1 Kahalgaon Lalmatia 20.7 -7.856 26.30
69 1 Belaganj Chandauli -
31.0 0.767 38.40
70 1 Belaganj Hjehanabad 16.1 1.617 20.30
71 1 MTPS Samastipur -5.9 0.926 9.60
72 1 MTPS Samastipur -5.9 0.926 9.60
73 1 Sitalpur Chhapra 44.7 -
10.165 58.80
74 1 Jainagar Pulparas -
13.3 10.352 23.50
75 1 Madhubani Jainagar -7.7 2.865 11.50
76 1 Pulparas Supaul -5.7 10.931 17.40
77 1 Pulparas Supaul -5.7 10.931 17.40
78 1 Supaul Katiya 41.6 5.738 54.10
79 1 Mohania Karmansa -
17.2 -4.1 21.50
80 1 Dehri Kochas 20.4 -2.639 25.10
81 1 Bikranganj Dumraon 10.7 -0.67 13.30
82 1 Forbesganj Katiya 24.4 -2.097 32.40
83 2 Forbesganj Katiya 24.4 -2.097 32.40
84 1 Barh Hathidah_R 0.0 0 0.00
85 1 Pusauli Sasaram 10.3 3.903 13.60
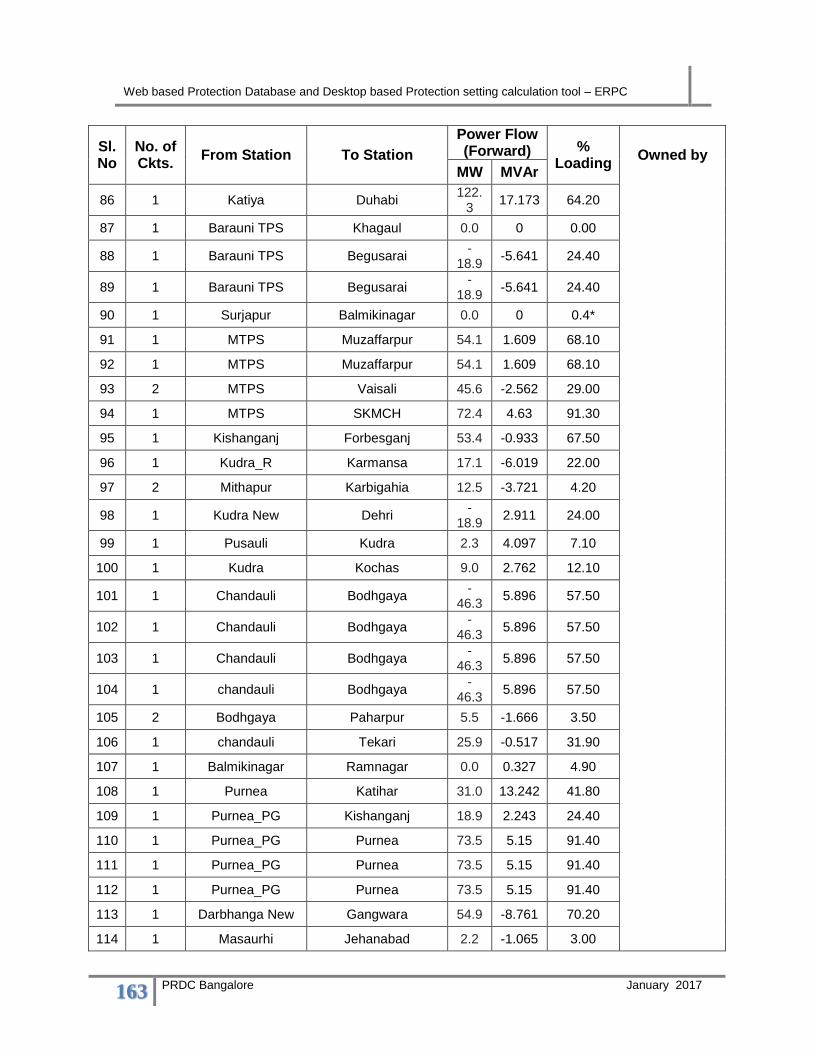
Web based Protection Database and Desktop based Protection setting calculation tool – ERPC
163 PRDC Bangalore January 2017
Sl.No
No. of Ckts.
From Station To Station
Power Flow (Forward) %
Loading Owned by
MW MVAr
86 1 Katiya Duhabi 122.
3 17.173 64.20
87 1 Barauni TPS Khagaul 0.0 0 0.00
88 1 Barauni TPS Begusarai -
18.9 -5.641 24.40
89 1 Barauni TPS Begusarai -
18.9 -5.641 24.40
90 1 Surjapur Balmikinagar 0.0 0 0.4*
91 1 MTPS Muzaffarpur 54.1 1.609 68.10
92 1 MTPS Muzaffarpur 54.1 1.609 68.10
93 2 MTPS Vaisali 45.6 -2.562 29.00
94 1 MTPS SKMCH 72.4 4.63 91.30
95 1 Kishanganj Forbesganj 53.4 -0.933 67.50
96 1 Kudra_R Karmansa 17.1 -6.019 22.00
97 2 Mithapur Karbigahia 12.5 -3.721 4.20
98 1 Kudra New Dehri -
18.9 2.911 24.00
99 1 Pusauli Kudra 2.3 4.097 7.10
100 1 Kudra Kochas 9.0 2.762 12.10
101 1 Chandauli Bodhgaya -
46.3 5.896 57.50
102 1 Chandauli Bodhgaya -
46.3 5.896 57.50
103 1 Chandauli Bodhgaya -
46.3 5.896 57.50
104 1 chandauli Bodhgaya -
46.3 5.896 57.50
105 2 Bodhgaya Paharpur 5.5 -1.666 3.50
106 1 chandauli Tekari 25.9 -0.517 31.90
107 1 Balmikinagar Ramnagar 0.0 0.327 4.90
108 1 Purnea Katihar 31.0 13.242 41.80
109 1 Purnea_PG Kishanganj 18.9 2.243 24.40
110 1 Purnea_PG Purnea 73.5 5.15 91.40
111 1 Purnea_PG Purnea 73.5 5.15 91.40
112 1 Purnea_PG Purnea 73.5 5.15 91.40
113 1 Darbhanga New Gangwara 54.9 -8.761 70.20
114 1 Masaurhi Jehanabad 2.2 -1.065 3.00

Web based Protection Database and Desktop based Protection setting calculation tool – ERPC
164 PRDC Bangalore January 2017
Sl.No
No. of Ckts.
From Station To Station
Power Flow (Forward) %
Loading Owned by
MW MVAr
115 1 Masaurhi Sipara -
27.9 -1.697 34.60
116 1 Pusauli Mohania -2.3 -4.097 5.70
117 1 Kahalgaon TPP Kahalgaon 53.9 -0.061 63.80 PGCIL
118 1 Hathidah_R Mokama_R 6.4 1.779 8.30
BSPTCL
119 1 Hathidah_R Hathidah -6.4 -1.779 8.20
120 1 Nalanda Rajgir 0.0 0 0.00
121 1 Raxaul Bettiah -
13.0 -0.373 17.00
122 1 Runisaudpur Sitamarhi 31.3 -3.636 40.60
123 1 SKMCH Runisaudpur 39.7 -5.584 51.10
124 1 Tekari Goh 11.0 -5.045 15.00
125 1 Wazirganj Nawada 43.0 11.111 56.20
126 1 Ekangasarai Hulasganj -2.7 -1.704 4.00
127 1 Biharshariff Hulasganj 15.6 3.974 20.40
128 1 Gangwara Pandauli 28.4 -
10.889 38.50
129 1 Madhepura Supaul 59.4 -1.241 75.30
130 1 Madhepura Supaul 59.4 -1.241 75.30
131 1 Madhepura Sonbhadra 21.7 6.605 29.70
132 1 Mashrakh Siwan 5.6 -1.757 7.60
133 1 Dalsingsarai Siwan 33.8 -6.701 43.20
134 2 Jehanabad Tehta -
36.9 -2.83 23.00
135 1 Begusarai Dalsingsarai 56.7 -5.156 70.40
136 1 Jandaha Samastipur -
17.7 -2.524 22.70
137 1 Hazipur Jandaha 7.0 -1.99 9.20
138 1 Begusarai Kuswesthan 4.3 -1.013 6.00
139 1 Sherghati Sherghati 10.3 2.624 13.60
140 1 Sherghati Bodhgaya -
24.1 -6.466 30.80
141 1 Immamganj Sherghati -
13.7 -5.052 18.20
142 1 Purnea naughat 18.5 -
11.767 27.20
143 1 Railfactory Sitalpur - -5.721 24.70

Web based Protection Database and Desktop based Protection setting calculation tool – ERPC
165 PRDC Bangalore January 2017
Sl.No
No. of Ckts.
From Station To Station
Power Flow (Forward) %
Loading Owned by
MW MVAr
18.2
144 1 Muzaffarpur Dhalkera 53.5 -0.191 12.80
145 1 Khagul Bihta 60.5 22.21 40.10
146 1 Khagul Fatua -
36.6 2.124 45.80
147 1 Digha Khagul -
52.4 -4.245 32.80
148 1 Khagul Khagaul Rail 8.0 2.585 10.50
149 1 Mithapur Gaighat -
13.9 4.664 18.40
150 1 Katra Fatua -
65.3 -
24.715 87.40
151 1 Sipara Mithapur 55.0 9.684 69.00
152 1 Jakkanpur
(Patna) Mithapur -4.6 1.032 5.90
153 1 Jakkanpur
(Patna) Sipara
-97.5
-16.56 61.60
154 1 Khusrupur RLY Fatua -5.0 -1.596 6.50
155 1 Fatua Harnuth -
11.9 0.087 14.90
156 1 Fatua Sipara 22.5 -4.666 28.30
157 1 Harnuth Baripahari -
20.5 5.937 26.60
158 1 Baripahari Biharshariff -
72.1 3.322 44.20
159 1 Baripahari Fatua 25.6 -5.874 32.20
160 1 Sabour Banka PG -1.3 0.841 3.90
161 1 Rafiganj Chandauti (Gaya) -
27.7 8.344 36.40
162 1 Karmnasa Sahupura -
25.2 -4.94 30.40
163 1 Fatua Gaighat 60.7 3.424 74.80
164 1 Naugachhia Baruni TPS 1.4 -2.892 4.90
165 1 Sitamarahi Dhaka 12.5 -2.22 16.50
166 1 Hazipur Sheetalpur 61.7 -
10.293 79.30
167 1 Hazipur Hazipur New -
121.6
-11.343
77.40
168 1 Chapra Ekma Tap 10.9 -7.385 17.00
169 1 Motihari MTPS -
52.8 4.064 69.30

Web based Protection Database and Desktop based Protection setting calculation tool – ERPC
166 PRDC Bangalore January 2017
Sl.No
No. of Ckts.
From Station To Station
Power Flow (Forward) %
Loading Owned by
MW MVAr
170 1 Vaishali Sheetalpur 13.1 0.391 8.60
171 1 Banka Banka PG -
17.5 -8.315 23.10
172 1 Kishanganj Dalkhola -
75.3 -
10.408 95.80
173 1 Chandauti (Gaya) Sipara 4.1 -1.898 5.90
174 1 Sultanganj Kahalgaon -3.8 -4.147 3.40
175 1 Ekma Traction Siwan -2.3 -3.92 5.90
176 1 Banka PG Sultanganj 6.5 -5.373 5.00
177 1 Kochas Dumaraon 10.6 4.428 15.70
178 1 Pusali Kudra Rail 23.2 -4.4 28.70
179 1 Karbigahiya Jakkanpur (Patna) -
10.7 8.417 17.00
180 1 Naugachhia Begusarai 1.1 -
12.453 15.50
181 1 Sonebarsha Udakishanganj 10.1 4.891 15.30
182 1 Jehanabad Jehanabad Traction 3.0 0.921 3.90
Jharkhand
765 kV
1 1 Ranchi New Dharamjaygarh -
293.6
-132.40
8 11.7
PGCIL
2 1 Ranchi New Dharamjaygarh -
293.6
-132.40
8 11.7
400 kV
1 1 Aadhunik Jamshedpur 110.
7 -6.309 6.2
APNRL
2 1 Aadhunik Jamshedpur 110.
7 -6.309 6.2
3 1 Maithon Jamshedpur 25.4 -
56.607 6.9
PGCIL
4 1 Jamshedpur Durgapur (DSTPS) -
156.3
-39.702
18.2
5 1 Jamshedpur Durgapur (DSTPS) -
156.3
-39.702
18.2
6 1 Jamshedpur Mejia B -
147.2
-47.732
17.2
7 1 Chaibasa Jamshedpur - - 27.5
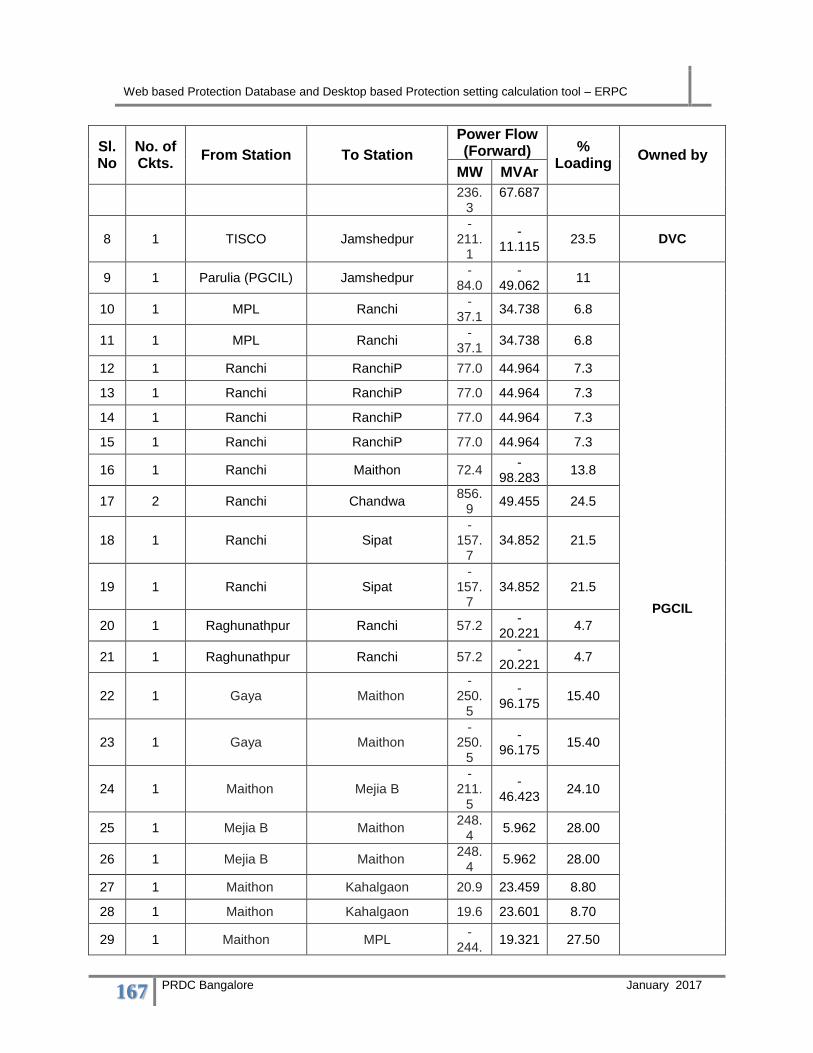
Web based Protection Database and Desktop based Protection setting calculation tool – ERPC
167 PRDC Bangalore January 2017
Sl.No
No. of Ckts.
From Station To Station
Power Flow (Forward) %
Loading Owned by
MW MVAr
236.3
67.687
8 1 TISCO Jamshedpur -
211.1
-11.115
23.5 DVC
9 1 Parulia (PGCIL) Jamshedpur -
84.0 -
49.062 11
PGCIL
10 1 MPL Ranchi -
37.1 34.738 6.8
11 1 MPL Ranchi -
37.1 34.738 6.8
12 1 Ranchi RanchiP 77.0 44.964 7.3
13 1 Ranchi RanchiP 77.0 44.964 7.3
14 1 Ranchi RanchiP 77.0 44.964 7.3
15 1 Ranchi RanchiP 77.0 44.964 7.3
16 1 Ranchi Maithon 72.4 -
98.283 13.8
17 2 Ranchi Chandwa 856.
9 49.455 24.5
18 1 Ranchi Sipat -
157.7
34.852 21.5
19 1 Ranchi Sipat -
157.7
34.852 21.5
20 1 Raghunathpur Ranchi 57.2 -
20.221 4.7
21 1 Raghunathpur Ranchi 57.2 -
20.221 4.7
22 1 Gaya Maithon -
250.5
-96.175
15.40
23 1 Gaya Maithon -
250.5
-96.175
15.40
24 1 Maithon Mejia B -
211.5
-46.423
24.10
25 1 Mejia B Maithon 248.
4 5.962 28.00
26 1 Mejia B Maithon 248.
4 5.962 28.00
27 1 Maithon Kahalgaon 20.9 23.459 8.80
28 1 Maithon Kahalgaon 19.6 23.601 8.70
29 1 Maithon MPL -
244.19.321 27.50
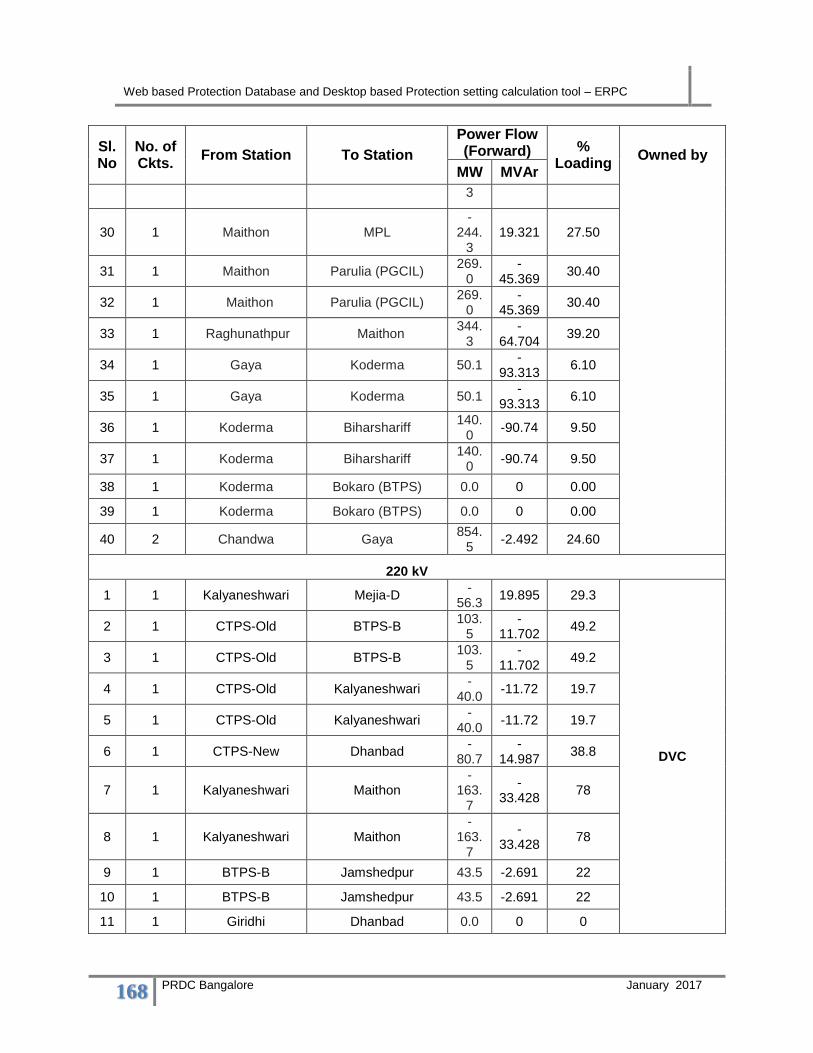
Web based Protection Database and Desktop based Protection setting calculation tool – ERPC
168 PRDC Bangalore January 2017
Sl.No
No. of Ckts.
From Station To Station
Power Flow (Forward) %
Loading Owned by
MW MVAr
3
30 1 Maithon MPL -
244.3
19.321 27.50
31 1 Maithon Parulia (PGCIL) 269.
0 -
45.369 30.40
32 1 Maithon Parulia (PGCIL) 269.
0 -
45.369 30.40
33 1 Raghunathpur Maithon 344.
3 -
64.704 39.20
34 1 Gaya Koderma 50.1 -
93.313 6.10
35 1 Gaya Koderma 50.1 -
93.313 6.10
36 1 Koderma Biharshariff 140.
0 -90.74 9.50
37 1 Koderma Biharshariff 140.
0 -90.74 9.50
38 1 Koderma Bokaro (BTPS) 0.0 0 0.00
39 1 Koderma Bokaro (BTPS) 0.0 0 0.00
40 2 Chandwa Gaya 854.
5 -2.492 24.60
220 kV
1 1 Kalyaneshwari Mejia-D -
56.3 19.895 29.3
DVC
2 1 CTPS-Old BTPS-B 103.
5 -
11.702 49.2
3 1 CTPS-Old BTPS-B 103.
5 -
11.702 49.2
4 1 CTPS-Old Kalyaneshwari -
40.0 -11.72 19.7
5 1 CTPS-Old Kalyaneshwari -
40.0 -11.72 19.7
6 1 CTPS-New Dhanbad -
80.7 -
14.987 38.8
7 1 Kalyaneshwari Maithon -
163.7
-33.428
78
8 1 Kalyaneshwari Maithon -
163.7
-33.428
78
9 1 BTPS-B Jamshedpur 43.5 -2.691 22
10 1 BTPS-B Jamshedpur 43.5 -2.691 22
11 1 Giridhi Dhanbad 0.0 0 0

Web based Protection Database and Desktop based Protection setting calculation tool – ERPC
169 PRDC Bangalore January 2017
Sl.No
No. of Ckts.
From Station To Station
Power Flow (Forward) %
Loading Owned by
MW MVAr
12 1 Giridhi Dhanbad 0.0 0 0
13 1 Kalyaneshwari Dhanbad 20.2 -8.541 10.2
14 2 Ramgarh BTPS-B -
191.9
-12.203
45.8
15 1 CTPS-Old CTPS-New -
152.5
-13.102
71.6
16 1 CTPS-Old CTPS-New -
152.5
-13.102
71.6
17 1 Kalyaneshwari Dhanbad 20.2 -8.541 10.2
18 2 BSL CTPS-New 0.0 0 1.2
19 1 CTPS-New Dhanbad -
80.7 -
14.987 38.8
20 1 Ramchandapur Jamshedpur -
125.7
-23.919
59.1
JUSNL
21 1 Ramchandapur Jamshedpur -
125.7
-23.919
59.1
22 1 PTPS-TPS Hatia 37.9 -
15.777 19.1
23 1 PTPS-TPS Hatia 37.9 -
15.777 19.1
24 1 PTPS-TPS TTPS -
178.3
25.804 37.5
25 1 KTPP Giridhi 54.9 7.369 27.7
26 1 KTPP Giridhi 54.9 7.369 27.7
27 1 RanchiTG Chandil 77.4 -
14.919 36.6
28 1 Maithon Dumka 31.1 -9.019 6.7
29 1 Maithon Dumka 31.1 -9.019 6.7
30 2 RanchiTG Hatia 75.9 3.579 17.9
31 1 Chandil Ramchandapur -
97.2 -
13.375 45.4
32 2 Chaibasa Chaibasa 5.2 2.406 1.3
33 2 Maithon Dhanbad 109.
7 -5.618 25.6
34 2 PTPS-TPS Bodhgaya 0.0 0 0 BSPHCL &
JSEB
35 1 PTPS-TPS Bodhgaya 0.0 0 0 BSPHCL &

Web based Protection Database and Desktop based Protection setting calculation tool – ERPC
170 PRDC Bangalore January 2017
Sl.No
No. of Ckts.
From Station To Station
Power Flow (Forward) %
Loading Owned by
MW MVAr
JSEB
36 1 Chandil STPS 37.0 -11.33 18 WBSETCL &
JSEB
37 2 Dhanbad Elctro Steel 5.2 -
14.984 3.7 PGCIL
132 kV
1 2 Manique D Gola D -
19.6 -7.389 13.1
DVC
2 2 Manique D Jamshedpur -
24.0 4.052 15.9
3 1 CTPS-B Putki 38.2 12.733 44.1
4 1 CTPS-B Putki 38.2 12.733 44.1
5 1 CTPS-B Putki 38.2 12.733 44.1
6 1 CTPS-B Putki 38.2 12.733 44.1
7 1 BTPS-B-D ECR-Gom D 0.5 -0.093 0.7*
8 1 BTPS-B-D ECR-Gom D 0.5 -0.093 0.7*
9 1 CTPS-A Purulia D 8.1 -0.084 9.4
10 1 CTPS-A Purulia D 8.1 -0.084 9.4
11 1 Jamshedpur Mosabani D 12.3 2.761 14.5
12 1 Jamshedpur Mosabani D 12.3 2.761 14.5
13 1 CTPS-A Gola D 5.7 2.831 7.9
14 1 CTPS-A Gola D 5.7 2.831 7.9
15 1 Ramgarh Gola D 19.1 -1.822 20.9
16 1 Ramgarh Gola D 19.1 -1.822 20.9
17 1 Patratu D North karnpura D 10.9 -0.354 13.6
18 1 Patratu D Ramgarh -
21.5 2.289 23.9
19 1 Patratu D Ramgarh -
21.5 2.289 23.9
20 1 Patratu D North karnpura D 10.9 -0.354 13.6
21 2 Patratu D JSPL 12.5 -7.083 7.9
22 1 Maithon D Kumardubi D 13.5 13.933 24
23 1 Klyaneshwari Maithon D 54.1 17.85 61.6
24 1 Maithon D Panchet -
15.0 -0.291 18.4
25 1 Kumardubi D Panchet -
29.2 -7.199 36.8

Web based Protection Database and Desktop based Protection setting calculation tool – ERPC
171 PRDC Bangalore January 2017
Sl.No
No. of Ckts.
From Station To Station
Power Flow (Forward) %
Loading Owned by
MW MVAr
26 1 Maithon D Patherdhi D 53.8 8.692 66.8
27 1 Maithon D Patherdhi D 53.8 8.692 66.8
28 1 Patherdhi D Sindri D 2.1 -0.381 2.8
29 1 Patherdhi D Sindri D 2.1 -0.381 2.8
30 1 Patherdhi D Putki 12.6 -3.582 14.6
31 1 Patherdhi D Putki 12.6 -3.582 14.6
32 1 Putki Nimiaghat 28.8 -3.4 36.6
33 1 Putki Nimiaghat 28.8 -3.4 36.6
34 1 Nimiaghat Giridhi D -9.9 -
11.953 19.9
35 1 Nimiaghat Giridhi D -9.9 -
11.953 19.9
36 1 Barhi D BTPS-B-D -
15.3 -1.877 19
37 1 Barhi D Konar -
11.0 -1.688 13.7
38 1 Barhi D KTPP -
27.4 4.937 34.7
39 1 Barhi D Hazaribhag 17.5 5.348 23.3
40 1 Barhi D Hazaribhag 17.5 5.348 23.3
41 1 Barhi D KTPP -
27.4 4.937 34.7
42 1 Konar BTPS-B-D -
25.7 -0.01 31.6
43 2 Ramkanali D Panchet -
25.3 1.842 15.6
44 1 CTPS-B Ramkanali D -
23.5 0.53 26
45 1 CTPS-B Jamuria -3.5 -4.791 6.5
46 2 Mosabani D Kharagpur D -
50.3 -2.597 28.1
47 2 Koderm D KTPP -
90.0 -
37.291 60.6
48 1 Sindri D Pradhankhanda 2.1 -0.232 2.8
49 1 Sindri D Pradhankhanda 2.1 -0.232 2.8
50 2 Dhanbad Govndr D 29.7 5.753 18.6
51 1 CTPS-A BSL-DVC 33.5 12.337 38.9
52 1 CTPS-A BSL-DVC 33.5 12.337 38.9
53 1 CTPS-A Rajbera DVC 9.1 4.111 11

Web based Protection Database and Desktop based Protection setting calculation tool – ERPC
172 PRDC Bangalore January 2017
Sl.No
No. of Ckts.
From Station To Station
Power Flow (Forward) %
Loading Owned by
MW MVAr
54 2 CTPS-B Biada DVC 20.8 4.589 11.8
55 2 Putki Balhr DVC -
11.7 2.34 6.7
56 1 Ramgarh ECR Barkakana 0.0 0 0
57 2 EC-Rly DVC North karnpura D -9.1 -4.291 5.5
58 1 Klyaneshwari Maithon D 54.1 17.85 61.6
59 1 CTPS-A CTPS-B 0.0 0 0
60 1 BSLG D CTPS-B -
33.4 -
12.482 44.3
61 1 Patherdhi D Balhr DVC 11.7 -3.412 13.6
62 2 Gola D SER Muri 10.3 1.524 6.1
63 2 Klyaneshwari MAL-Impex ferro 34.1 4.133 21
64 1 Manique D Manique Rly 12.3 3.755 16.2
65 1 CTPS-A Rajbera DVC 9.1 4.111 11
66 1 Garhwa Japla 1.5 -6.113 7.8
JUSNL
67 2 Dhalbhumgarh Dhalbhumgarh Rly 5.4 2.349 3.8
68 1 Lohardaga Gumla 8.0 -1.041 10.1
69 1 Lohardaga Gumla 8.0 -1.041 10.1
70 1 Kamdara Gumla -3.5 -3.672 6.1
71 1 Hatia Old Sikadari 2.8 0.23 4.6
72 1 Hatia New Namkum 82.8 3.544 99
73 1 Hatia Old Kamdara 10.1 -
10.899 18
74 1 Kamdara Bakaspur Rly 3.0 0.228 3.8
75 1 Kamdara Bano R 0.0 0 0
76 1 Hatia Old Hatia New 0.0 0 0
77 1 Hatia Old Hatia New 0.0 0 0
78 1 Namkum Sikadari -2.8 -4.208 6.1
79 1 PTPS Kanke 47.9 1.284 37.4
80 1 PTPS Hatia Old 54.4 0.125 42.4
81 1 Deoghar Sultanganj 0.0 0 0
82 1 Deoghar Jamtara 9.3 2.43 12
83 1 Deoghar Shankarpur Rly 3.0 0.098 3.7
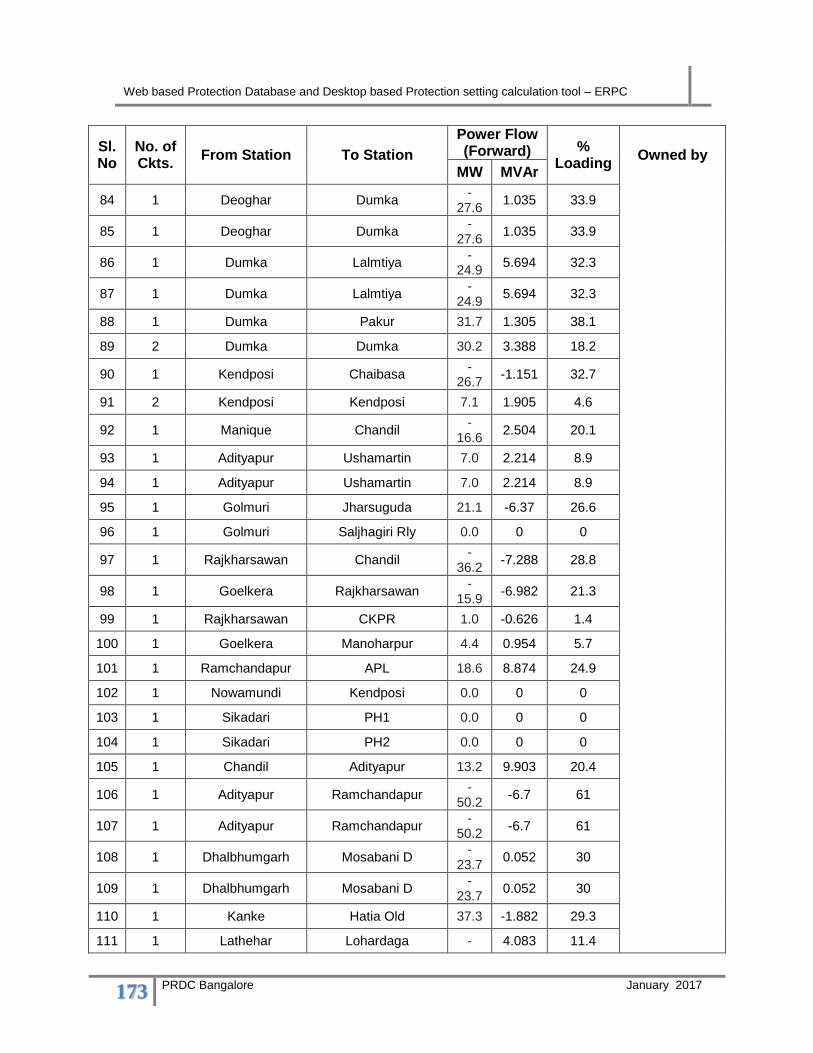
Web based Protection Database and Desktop based Protection setting calculation tool – ERPC
173 PRDC Bangalore January 2017
Sl.No
No. of Ckts.
From Station To Station
Power Flow (Forward) %
Loading Owned by
MW MVAr
84 1 Deoghar Dumka -
27.6 1.035 33.9
85 1 Deoghar Dumka -
27.6 1.035 33.9
86 1 Dumka Lalmtiya -
24.9 5.694 32.3
87 1 Dumka Lalmtiya -
24.9 5.694 32.3
88 1 Dumka Pakur 31.7 1.305 38.1
89 2 Dumka Dumka 30.2 3.388 18.2
90 1 Kendposi Chaibasa -
26.7 -1.151 32.7
91 2 Kendposi Kendposi 7.1 1.905 4.6
92 1 Manique Chandil -
16.6 2.504 20.1
93 1 Adityapur Ushamartin 7.0 2.214 8.9
94 1 Adityapur Ushamartin 7.0 2.214 8.9
95 1 Golmuri Jharsuguda 21.1 -6.37 26.6
96 1 Golmuri Saljhagiri Rly 0.0 0 0
97 1 Rajkharsawan Chandil -
36.2 -7.288 28.8
98 1 Goelkera Rajkharsawan -
15.9 -6.982 21.3
99 1 Rajkharsawan CKPR 1.0 -0.626 1.4
100 1 Goelkera Manoharpur 4.4 0.954 5.7
101 1 Ramchandapur APL 18.6 8.874 24.9
102 1 Nowamundi Kendposi 0.0 0 0
103 1 Sikadari PH1 0.0 0 0
104 1 Sikadari PH2 0.0 0 0
105 1 Chandil Adityapur 13.2 9.903 20.4
106 1 Adityapur Ramchandapur -
50.2 -6.7 61
107 1 Adityapur Ramchandapur -
50.2 -6.7 61
108 1 Dhalbhumgarh Mosabani D -
23.7 0.052 30
109 1 Dhalbhumgarh Mosabani D -
23.7 0.052 30
110 1 Kanke Hatia Old 37.3 -1.882 29.3
111 1 Lathehar Lohardaga - 4.083 11.4

Web based Protection Database and Desktop based Protection setting calculation tool – ERPC
174 PRDC Bangalore January 2017
Sl.No
No. of Ckts.
From Station To Station
Power Flow (Forward) %
Loading Owned by
MW MVAr
13.1
112 1 Lathehar Lohardaga -
13.1 4.083 11.4
113 1 Lathehar Daltanganj 8.7 -5.645 8
114 1 Lathehar Daltanganj 8.7 -5.645 8
115 1 Garhwa Tolrah Rly 12.0 5.353 16.4
116 1 Lalmtiya Sahebganj 23.3 1.006 27.7
117 1 Hatia New Lohardaga 34.1 -8.549 27.2
118 1 Hatia New Lohardaga 34.1 -8.549 27.2
119 1 Namkum Tatisiloi Rly 5.7 0.852 7.2
120 1 Namkum Tatisiloi Rly 5.7 0.852 7.2
121 1 Namkum UMIRa 2.8 1.397 3.9
122 1 Hatia Old Lodhma Rly 0.5 -0.518 0.9*
123 1 Hatia Old Lodhma Rly 0.5 -0.518 0.9*
124 1 Adityapur Rajkharsawan 28.3 -6.292 35
125 1 Golmuri Chandil -
29.8 -0.162 36
126 1 Golmuri Chandil -
29.8 -0.162 36
127 1 Rajkharsawan Chakradharpur 6.1 -6.342 10.7
128 1 Rajkharsawan Chakradharpur 6.1 -6.342 10.7
129 1 Hazaribhag Road Konar -3.2 -1.03 4.1
130 1 Hazaribhag Road Konar -3.2 -1.03 4.1
131 1 Tamar Chandil -
10.5 -3.205 13.2
132 1 Hatia Old HEC 6.6 2.521 8.8
133 2 Jamtara Madhupur 15.1 1.023 10.1
134 1 Chaibasa Rajkharsawan -
28.0 -0.519 34.1
135 1 Manique ManiqueD 0.0 0 0
136 1 ABCILG Garhwa 0.0 0 0
137 1 Jamtara Jamtara Rly 4.0 0.714 5.1
138 1 Rajkharsawan Rajkharsawan Rly 6.0 2.646 8.1
139 1 Hatia Old HEC 6.6 2.521 8.8
140 1 Deoghar Jamtara 9.3 2.43 12

Web based Protection Database and Desktop based Protection setting calculation tool – ERPC
175 PRDC Bangalore January 2017
Sl.No
No. of Ckts.
From Station To Station
Power Flow (Forward) %
Loading Owned by
MW MVAr
141 1 Goelkera GoelkeraT 8.0 4.113 11.1
142 1 Maithon D Jamtara 33.8 -6.232 42.1 DVC & JSEB
143 1 Kendposi Nowamundi 26.5 0.579 32.6 JSEB
144 2 Patratu D PTPS 0.0 0 0 JSEB & DVC
145 1 Garhwa Rihand -
31.0 2.196 39
JSEB & UPPCL
Odisha
765 kV
1 1 Jharsuguda Dharamjaygarh 21.0 -
166.604
5.3
PGCIL 2 1 Jharsuguda Dharamjaygarh 21.0
-166.60
4 5.3
3 1 Jharsuguda Angul -
49.5 34.756 6.2
4 1 Jharsuguda Angul -
49.5 34.756 6.2
400 kV
1 1 Jaypore Bolangir -
317.5
57.266 37.8
PGCIL 2 1 Jaypore Gazuwaka
267.7
-100.24
9 33.2
3 1 Jaypore Gazuwaka 267.
7
-100.24
9 33.2
4 1 Indravati PG Jaypore 223.
6 -
45.634 26.6
5 1 Indravati OHPC Indravati PG -
80.8 58.03 11.7 OPTCL
6 1 Rengali Indravati PG 311.
0 -
28.159 35.9
PGCIL
7 1 Bolangir Angul -
273.5
21.562 32.6
8 1 Angul JITPL -
563.0
-10.571
65.2
Jindal
9 1 Angul JITPL -
563.0
-10.571
65.2
10 1 Angul Meramundali 518.
2 -
95.753 61.1 PGCIL

Web based Protection Database and Desktop based Protection setting calculation tool – ERPC
176 PRDC Bangalore January 2017
Sl.No
No. of Ckts.
From Station To Station
Power Flow (Forward) %
Loading Owned by
MW MVAr
11 1 Angul Meramundali 518.
2 -
95.753 61.1
12 2 TSTPS Angul -
241.8
44.434 29.3
13 1 Angul GMR -
191.8
-68.748
11.8
GMR
14 1 Angul GMR -
191.8
-68.748
11.8
15 1 Sterlite Meramundali 0.0 0 0 PGCIL
16 1 Sterlite Meramundali 0.0 0 0
17 1 JSPL Meramundali 61.8 27.058 9
OPTCL
18 1 JSPL Meramundali 61.8 27.058 9
19 1 GMR Meramundali 150.
8 21.436 17.7
20 2 Duburi Meramundali -
757.8
-45.149
44.1
21 1 TSTPS Meramundali -
136.3
29.826 17.1
22 1 Meramundali Mendhasal 0.0 0 0
23 2 Pandibl Mendhasal 313.
9 26.246 18.8
OPTCL & PGCIL
24 1 Duburi Pandiabil 538.
0 5.773 62.8 PGCIL
25 1 Duburi Baripada 0.0 0 0 OPTCL
26 1 Pandibl4 Baripada 0.0 0 0
PGCIL 27 1 Baripada Jamshedpur -
110.4
-56.761
13.9
28 1 Baripada TISCO -
63.6 -
54.065 9.4
29 1 Baripada Kharagpur 222.
8 -
21.235 25.1
OPTCL & WBSETCL
30 1 Baripada Keonjhar -
217.2
85.174 27.9 OPTCL
31 1 Rengali Keonjhar 219.
7 -
81.492 26.9
32 1 TSTPS Rengali 239.
8 -
89.057 29.5
PGCIL
33 1 TSTPS Rengali 239. - 29.5

Web based Protection Database and Desktop based Protection setting calculation tool – ERPC
177 PRDC Bangalore January 2017
Sl.No
No. of Ckts.
From Station To Station
Power Flow (Forward) %
Loading Owned by
MW MVAr
8 89.057
34 1 Bisra TSTPS -
76.4 14.165 11.3
35 1 Bisra TSTPS -
76.4 14.165 11.3
36 1 Bisra Jamshedpur 189.
8 -
62.755 22.6
37 1 Chaibasa Bisra -
340.9
47.712 39.2
38 1 Bisra Ranchi 107.
7 -
48.678 13.4
39 1 Bisra Ranchi 107.
7 -
48.678 13.4
40 1 Bisra Raigarh -2.0 -
40.786 10.1
41 1 Bisra Sterlite -
163.5
-30.243
18.8 PGCIL& Sterlite
42 1 Jharsuguda Bisra 176.
2 -
59.204 21.1
PGCIL
43 1 Jharsuguda Bisra 176.
2 -
59.204 21.1
44 1 Ind-Bharath Jharsuguda 119.
7 62.898 17.4
45 1 Jharsuguda Raigarh -
175.9
-191.74
9 29.5
46 1 Ind-Bharath Raigarh -
119.7
-62.898
15.2
47 1 Sterlite Raigarh -
173.2
-21.631
20.3 PGCIL& Sterlite
220 kV
1 1 Balimela Upper Silleru 0.0 -3.478 1.6
OPTCL
2 1 Budhipadar Bhusan 1.3 14.115 7.6
3 1 Upper Kolab Jaynagar 0.0 0 0.4*
4 1 Theruvali Bhanjanagar -
49.2 10.486 27.9
5 1 Theruvali Narendrapur 20.8 -4.024 14.5
6 1 Bhanjanagar Mendhasal 0.0 0 0
7 1 Bhanjanagar Nayagarh 86.9 9.665 41.8
8 1 Nayagarh Mendhasal 59.1 6.494 29.6
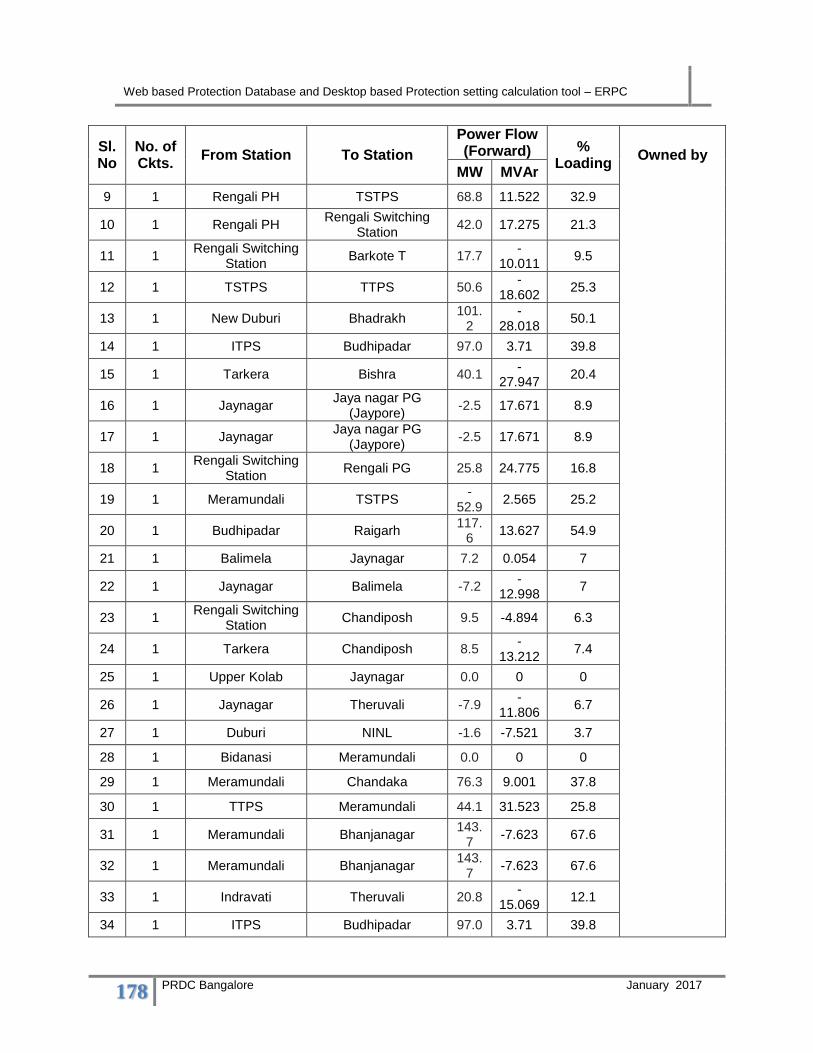
Web based Protection Database and Desktop based Protection setting calculation tool – ERPC
178 PRDC Bangalore January 2017
Sl.No
No. of Ckts.
From Station To Station
Power Flow (Forward) %
Loading Owned by
MW MVAr
9 1 Rengali PH TSTPS 68.8 11.522 32.9
10 1 Rengali PH Rengali Switching
Station 42.0 17.275 21.3
11 1 Rengali Switching
Station Barkote T 17.7
-10.011
9.5
12 1 TSTPS TTPS 50.6 -
18.602 25.3
13 1 New Duburi Bhadrakh 101.
2 -
28.018 50.1
14 1 ITPS Budhipadar 97.0 3.71 39.8
15 1 Tarkera Bishra 40.1 -
27.947 20.4
16 1 Jaynagar Jaya nagar PG
(Jaypore) -2.5 17.671 8.9
17 1 Jaynagar Jaya nagar PG
(Jaypore) -2.5 17.671 8.9
18 1 Rengali Switching
Station Rengali PG 25.8 24.775 16.8
19 1 Meramundali TSTPS -
52.9 2.565 25.2
20 1 Budhipadar Raigarh 117.
6 13.627 54.9
21 1 Balimela Jaynagar 7.2 0.054 7
22 1 Jaynagar Balimela -7.2 -
12.998 7
23 1 Rengali Switching
Station Chandiposh 9.5 -4.894 6.3
24 1 Tarkera Chandiposh 8.5 -
13.212 7.4
25 1 Upper Kolab Jaynagar 0.0 0 0
26 1 Jaynagar Theruvali -7.9 -
11.806 6.7
27 1 Duburi NINL -1.6 -7.521 3.7
28 1 Bidanasi Meramundali 0.0 0 0
29 1 Meramundali Chandaka 76.3 9.001 37.8
30 1 TTPS Meramundali 44.1 31.523 25.8
31 1 Meramundali Bhanjanagar 143.
7 -7.623 67.6
32 1 Meramundali Bhanjanagar 143.
7 -7.623 67.6
33 1 Indravati Theruvali 20.8 -
15.069 12.1
34 1 ITPS Budhipadar 97.0 3.71 39.8

Web based Protection Database and Desktop based Protection setting calculation tool – ERPC
179 PRDC Bangalore January 2017
Sl.No
No. of Ckts.
From Station To Station
Power Flow (Forward) %
Loading Owned by
MW MVAr
35 1 Budhipadar Tarkera 143.
0 -9.513 66.5
36 1 Budhipadar SPS 1.0 -0.692 0.6*
37 1 TSIL Joda 17.9 0.393 8.5
38 1 Duburi New Duburi 72.8 -2.194 34.7
39 1 ITPS Budhipadar 97.0 3.71 39.8
40 1 Budhipadar SPS 1.0 -0.692 0.6*
41 1 Balasore Kuchei -
49.4 -
26.094 26.4
42 1 Indravati Theruvali 20.8 -
15.069 12.1
43 1 Katapali Bolangir 0.0 0 0
44 1 Mendhasal Chandaka 76.3 9.001 37.8
45 1 Balasore New Duburi -
67.2 12.189 34.7
46 2 New Duburi Paradeep 150.
7 -
15.435 32.1
47 2 Paradeep Essar 19.1 -1.016 4.6
48 1 Upper Kolab Jaynagar 0.0 0 0.4*
49 1 Theruvali Bhanjanagar -
49.2 10.486 27.9
50 1 Theruvali Narendrapur 20.8 -4.024 14.5
51 1 Rengali PH Rengali Switching
Station 42.0 17.275 21.3
52 1 ITPS Budhipadar 97.0 3.71 39.8
53 1 Tarkera BISRA 40.1 -
27.947 20.4
54 1 Rengali Switching
Station Rengali PG 25.8 24.775 16.8
55 1 Meramundali TSTPS -
52.9 2.565 25.2
56 1 Budhipadar Korba -
14.9 -2.769 12.8
57 1 Budhipadar Korba -
14.9 -2.769 12.8
58 1 Indravati Theruvali 20.8 -
15.069 12.1
59 1 Indravati Theruvali 20.8 -
15.069 12.1
60 1 Meramundali Duburi 85.0 -0.747 39.9
61 1 Budhipadar Tarkera 143.
0 -9.513 66.5

Web based Protection Database and Desktop based Protection setting calculation tool – ERPC
180 PRDC Bangalore January 2017
Sl.No
No. of Ckts.
From Station To Station
Power Flow (Forward) %
Loading Owned by
MW MVAr
62 1 Duburi New Duburi 72.8 -2.194 34.7
63 1 Balasore Kuchei -
49.4 -
26.094 26.4
64 1 Katapali Bolangir 0.0 0 0
65 1 Mendhasal Chandaka 76.3 9.001 37.8
66 1 Mendhasal Chandaka 76.3 9.001 37.8
67 1 New Duburi Jindal -
18.6 9.195 10.1
JSL
68 1 New Duburi Jindal -
18.6 9.195 10.1
69 1 New Duburi Visa -8.2 -
11.859 6.9 VISA
70 1 New Duburi Rohit 20.0 7.273 10.3 Rohit
71 1 Budhipadar Vedanta -
196.9
-22.574
81.5
VEDANTA
72 1 Budhipadar Vedanta -
196.9
-22.574
81.5
73 1 DubriNew Maithan 0.0 0 0
OPTCL
74 1 Mendha Bidanasi 72.4 17.132 16.5
75 1 Bhadrak Balasore 32.8 -
15.246 17.2
76 1 Balimela Balimela Splt 15.6 3.689 7.5
77 1 Theruvali Lakshmipur 10.5 -8.197 3.6
78 1 Lakshmipur Jaynagar 6.4 10.566 6.2
79 1 Theruvali Jaynagar 4.3 -4.239 6.4
80 1 Narendrapur Aatri -
51.1 9.071 27.2
81 1 Mendhasal Aatri 0.0 0 0
82 1 Tarkera Barkote -0.8 -
15.343 7.2
83 1 Rengali Hydro TTPS 54.2 -6.871 25.5
84 1 JSPL Jamshedpur 119.
3 -7.128 56.7
85 1 Joda Ramchandrapur -
33.7 -
25.244 19.9
86 1 Bolagir New Bolagir 167.
8 12.822 40.2
87 1 NALCO Meramundali 151.
9 -8.467 35.7

Web based Protection Database and Desktop based Protection setting calculation tool – ERPC
181 PRDC Bangalore January 2017
Sl.No
No. of Ckts.
From Station To Station
Power Flow (Forward) %
Loading Owned by
MW MVAr
88 1 BSSL Meramundali -
12.4 13.622 4.4
89 1 Joda JSPL 152.
4 4.2 72.1
90 1 Paradeep IOCL 0.6 -0.635 0.4*
91 1 Basundhora Budhipadar -2.0 -0.977 2.2
92 1 Lakshmipur Utkal Aluminium 0.0 0 0
93 1 Atri Pandibil -
126.2
31.023 31.8
94 1 Pandibil Samangara 90.0 -4.683 21.8
95 1 Lakshmipur Aditya Aluminium 0.0 0 0
96 1 Jayanagar Traction
Jayanagar 7.9 11.806 7
132 kV
1 1 Balimela Upper Silleru 0.0 -3.478 1.6
OPTCL
2 1 Theruvali Rayagada 0.0 0 0
3 1 Jayanagar Damanjodi 38.6 20.88 55.4
4 1 Theruvali IMFA 24.0 11.549 32.1
5 1 Vedanta Kesinga 60.5 -
11.017 73.4
6 1 Rayagada Akhusinghi 22.0 -0.481 28
7 1 Digha Berhampore -
20.6 -7.328 27.7
8 1 Bhanjanagar Aska 55.7 -4.085 68.5
9 1 Bhanjanagar Phubani 12.3 -9.078 18.7
10 1 Aska Berhampore 0.0 0 0
11 1 Aska Chatrapur 38.4 -5.181 48.2
12 1 Chatrapur Ganjam 20.7 2.681 26.4
13 1 Chatrapur IRE 6.4 1.578 8.4
14 1 Chatrapur Balugaon 42.5 3.824 53.7
15 1 Mendhasal Chandaka 0.0 0 0
16 1 Chandaka Bhubaneswar 94.6 14.088 61.1
17 1 ChandSpl Bhubaneswar 39.9 -
12.286 53.3
18 1 Phulnakhara Bhubaneswar -
39.4 12.222 53.2

Web based Protection Database and Desktop based Protection setting calculation tool – ERPC
182 PRDC Bangalore January 2017
Sl.No
No. of Ckts.
From Station To Station
Power Flow (Forward) %
Loading Owned by
MW MVAr
19 1 Chandaka Ranasinghpur 60.3 -0.32 77.1
20 1 Kalarangi Duburi 1.7 -4.114 5.5
21 1 Kalarangi Kamakhyanagar -
15.9 -0.125 19.7
22 2 TTPS Chainpal 62.2 13.322 38
23 1 TTPS Angul 31.3 3.598 37.6
24 1 Angul Nandira 16.8 -0.356 20.2
25 1 Chainpal FCI 0.4 -0.167 0.5*
26 1 Meramundali Dhenkanal 48.0 -4.474 58.5
27 1 Kamakhyanagar OPCL -
42.3 0.781 52.1
28 1 Dhenkanal Nuapatna Tap 0.0 0 0
29 1 ICCL Maheswari -0.1 1.022 2.7
30 1 Grid Steel (GSAL)
Choudwar 2.7 42.148 51.9
31 1 Choudwar Bidanasi 0.0 0 0
32 1 BPPL Bidanasi 0.0 0 0
33 1 Cuttack Jagatsinghpur 0.0 0 0
34 1 Duburi Jambay Ferro -
66.9 2.656 82.8
35 1 B.C. Mohanty TISCO (Bamanipal) 18.0 5.273 23.5
36 1 Duburi Jajpur Road 18.2 2.079 22.7
37 1 Chandikhole Kendapra -
17.8 1.777 22.9
38 1 Kendapra Ptamundi 15.2 -3.638 19.7
39 1 Nuapatna Tap Arati Steel -
28.6 -9.837 37.5
40 1 Paradip PPL 0.0 0 0
41 1 Jajpur Road Jajpur Town 0.0 0 0
42 1 Bhadrak Soro 0.0 0 0
43 1 Balasore Soro 28.9 11.009 38.8
44 1 Balasore Basta 42.5 0.984 52.4
45 1 Balasore Birla Tyre 3.0 0.024 3.7
46 1 Balasore Balasore Alloys 51.1 0.406 63
47 1 Bhadrak FACOR -
20.1 -5.314 25.2
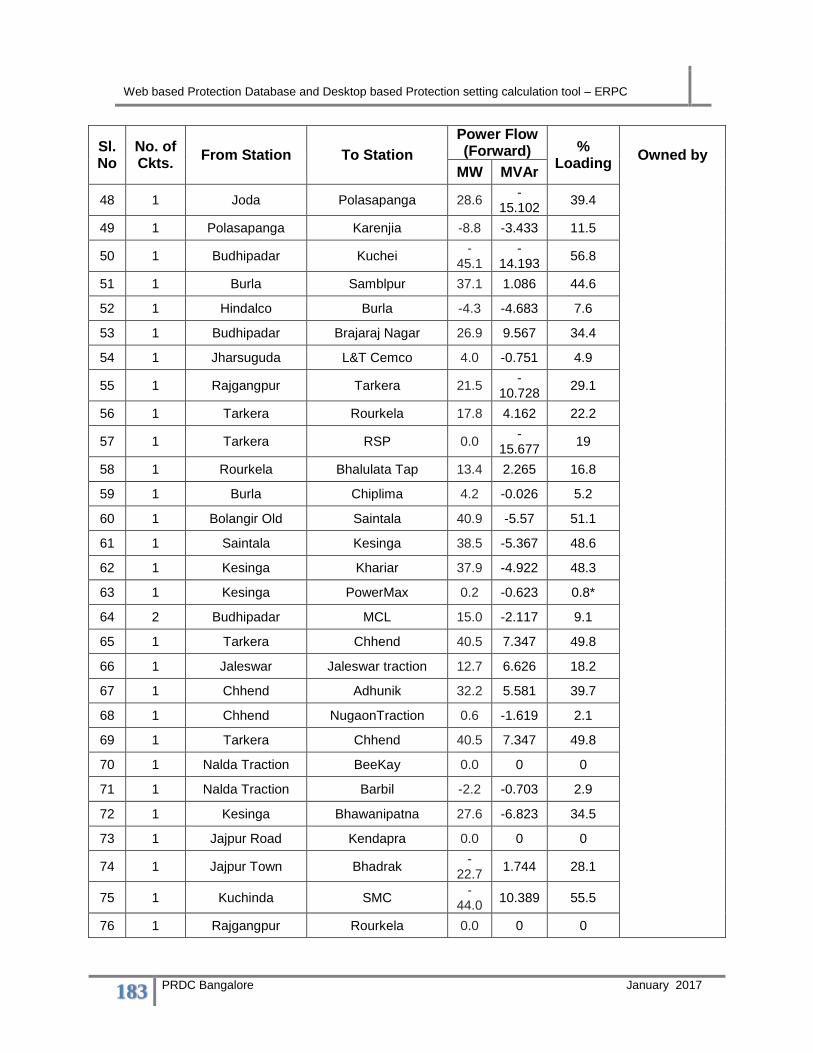
Web based Protection Database and Desktop based Protection setting calculation tool – ERPC
183 PRDC Bangalore January 2017
Sl.No
No. of Ckts.
From Station To Station
Power Flow (Forward) %
Loading Owned by
MW MVAr
48 1 Joda Polasapanga 28.6 -
15.102 39.4
49 1 Polasapanga Karenjia -8.8 -3.433 11.5
50 1 Budhipadar Kuchei -
45.1 -
14.193 56.8
51 1 Burla Samblpur 37.1 1.086 44.6
52 1 Hindalco Burla -4.3 -4.683 7.6
53 1 Budhipadar Brajaraj Nagar 26.9 9.567 34.4
54 1 Jharsuguda L&T Cemco 4.0 -0.751 4.9
55 1 Rajgangpur Tarkera 21.5 -
10.728 29.1
56 1 Tarkera Rourkela 17.8 4.162 22.2
57 1 Tarkera RSP 0.0 -
15.677 19
58 1 Rourkela Bhalulata Tap 13.4 2.265 16.8
59 1 Burla Chiplima 4.2 -0.026 5.2
60 1 Bolangir Old Saintala 40.9 -5.57 51.1
61 1 Saintala Kesinga 38.5 -5.367 48.6
62 1 Kesinga Khariar 37.9 -4.922 48.3
63 1 Kesinga PowerMax 0.2 -0.623 0.8*
64 2 Budhipadar MCL 15.0 -2.117 9.1
65 1 Tarkera Chhend 40.5 7.347 49.8
66 1 Jaleswar Jaleswar traction 12.7 6.626 18.2
67 1 Chhend Adhunik 32.2 5.581 39.7
68 1 Chhend NugaonTraction 0.6 -1.619 2.1
69 1 Tarkera Chhend 40.5 7.347 49.8
70 1 Nalda Traction BeeKay 0.0 0 0
71 1 Nalda Traction Barbil -2.2 -0.703 2.9
72 1 Kesinga Bhawanipatna 27.6 -6.823 34.5
73 1 Jajpur Road Kendapra 0.0 0 0
74 1 Jajpur Town Bhadrak -
22.7 1.744 28.1
75 1 Kuchinda SMC -
44.0 10.389 55.5
76 1 Rajgangpur Rourkela 0.0 0 0

Web based Protection Database and Desktop based Protection setting calculation tool – ERPC
184 PRDC Bangalore January 2017
Sl.No
No. of Ckts.
From Station To Station
Power Flow (Forward) %
Loading Owned by
MW MVAr
77 1 Joda Kendposi 22.8 -3.105 28
78 1 Chatrapur Narendra Pur -
27.5 -
16.651 40.5
79 1 Berhampore Narendra Pur -
21.3 -4.682 27.3
80 1 Berhampore Narendra Pur -
21.3 -4.682 27.3
81 1 Puri Nimpara 7.1 -0.084 9
82 1 Sunabeda Damanjodi 0.0 0 0
83 1 Jayanagar Tentulik 21.8 -0.056 27.5
84 1 Burla Katapali 55.6 7.257 67.4
85 1 Theruvali JK Paper 0.0 -0.478 0.6*
86 1 Rajgangpur OCL -
17.0 -2.158 20.7
87 2 Rajgangpur Rajgangpur Traction 0.9 0.093 0.6*
88 1 Paradip IFFCO 0.0 0 0
89 1 Boinda Rairakhole 7.1 -2.545 9.2
90 1 Mohana Akhusinghi -2.9 -1.005 4.2
91 1 Akhusinghi Parlakemundi 9.9 0.097 13.5
92 1 Bolangir Old Sonepur 40.9 -3.601 50.8
93 1 Bolangir New Patnagarh 24.7 6.853 32.3
94 1 Patnagarh Padamapur 11.3 2.576 15.4
95 1 Khurdah Balugaon Tap -
53.9 1.345 70.1
96 1 Balugaon Tap Narendra Pur 10.0 -6.903 15.2
97 1 Tarkera Rajgangpur -
20.9 9.413 28.5
98 1 Nuapatna Nuapatna Tap -
28.3 -
10.783 38.3
99 1 OPCL TTPS -
53.4 -2.935 64.7
100 1 Chainpal Angul 27.2 2.506 32.7
101 2 Machkhnd Vizag 0.0 0 0
102 1 Joda FAP Joda 15.6 4.141 19.7
103 1 Chatrapur Rambha Traction 11.0 3.442 15.1
104 1 Digha Mohana 0.0 0 0
105 1 Budhipadar Sundargarh 10.1 1.894 12.8
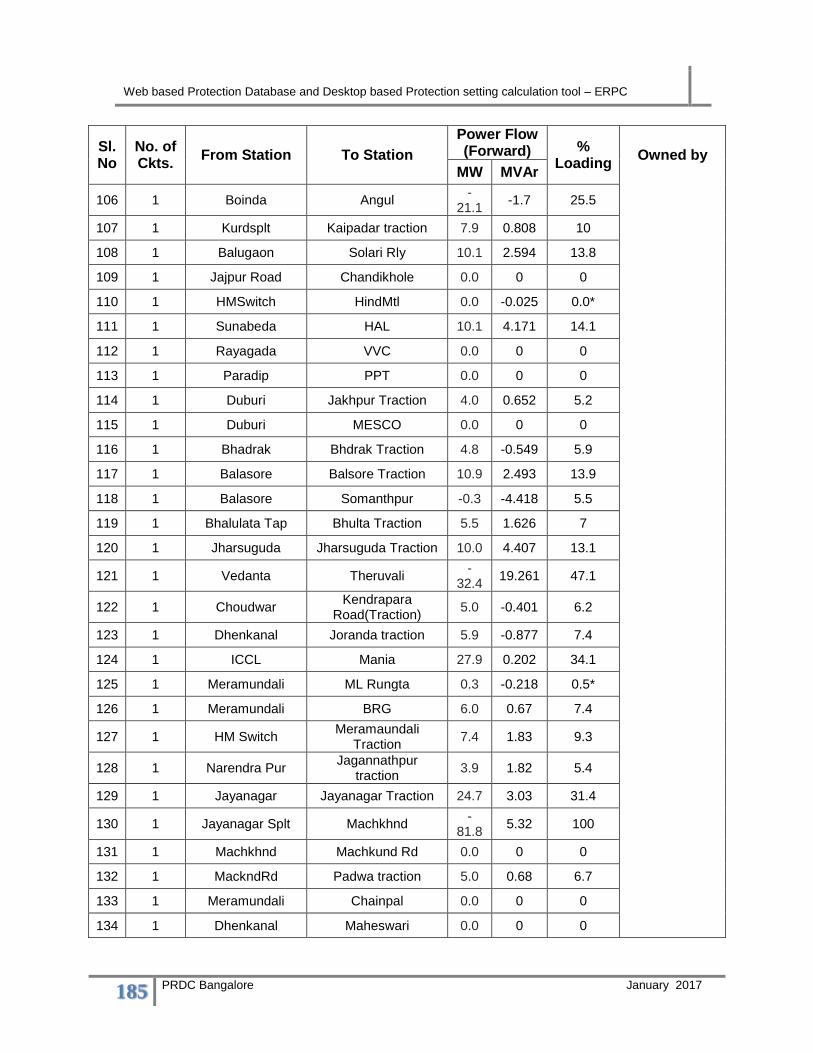
Web based Protection Database and Desktop based Protection setting calculation tool – ERPC
185 PRDC Bangalore January 2017
Sl.No
No. of Ckts.
From Station To Station
Power Flow (Forward) %
Loading Owned by
MW MVAr
106 1 Boinda Angul -
21.1 -1.7 25.5
107 1 Kurdsplt Kaipadar traction 7.9 0.808 10
108 1 Balugaon Solari Rly 10.1 2.594 13.8
109 1 Jajpur Road Chandikhole 0.0 0 0
110 1 HMSwitch HindMtl 0.0 -0.025 0.0*
111 1 Sunabeda HAL 10.1 4.171 14.1
112 1 Rayagada VVC 0.0 0 0
113 1 Paradip PPT 0.0 0 0
114 1 Duburi Jakhpur Traction 4.0 0.652 5.2
115 1 Duburi MESCO 0.0 0 0
116 1 Bhadrak Bhdrak Traction 4.8 -0.549 5.9
117 1 Balasore Balsore Traction 10.9 2.493 13.9
118 1 Balasore Somanthpur -0.3 -4.418 5.5
119 1 Bhalulata Tap Bhulta Traction 5.5 1.626 7
120 1 Jharsuguda Jharsuguda Traction 10.0 4.407 13.1
121 1 Vedanta Theruvali -
32.4 19.261 47.1
122 1 Choudwar Kendrapara
Road(Traction) 5.0 -0.401 6.2
123 1 Dhenkanal Joranda traction 5.9 -0.877 7.4
124 1 ICCL Mania 27.9 0.202 34.1
125 1 Meramundali ML Rungta 0.3 -0.218 0.5*
126 1 Meramundali BRG 6.0 0.67 7.4
127 1 HM Switch Meramaundali
Traction 7.4 1.83 9.3
128 1 Narendra Pur Jagannathpur
traction 3.9 1.82 5.4
129 1 Jayanagar Jayanagar Traction 24.7 3.03 31.4
130 1 Jayanagar Splt Machkhnd -
81.8 5.32 100
131 1 Machkhnd Machkund Rd 0.0 0 0
132 1 MackndRd Padwa traction 5.0 0.68 6.7
133 1 Meramundali Chainpal 0.0 0 0
134 1 Dhenkanal Maheswari 0.0 0 0

Web based Protection Database and Desktop based Protection setting calculation tool – ERPC
186 PRDC Bangalore January 2017
Sl.No
No. of Ckts.
From Station To Station
Power Flow (Forward) %
Loading Owned by
MW MVAr
135 1 Rawmeet Choudwar 45.2 -
25.229 63.8
136 1 Macknd Road Manbar Traction -5.0 -0.68 6.5
137 1 Manbar Traction Maliguda Traction -
10.0 -0.589 12.7
138 1 Jayanagar Traction
Maliguda Traction 15.1 0.915 19.1
139 1 Jayanagar Traction
Ch Kusumi Traction 0.0 -0.929 1.2
140 1 Chiplima Katapali 32.5 4.035 39.4
141 1 Barpali Bolangir New -
34.1 -4.329 43.3
142 1 Rajgangpur Budhipadar -
35.1 7.416 44.6
143 1 Rairakhole Rairakhole Tap 0.0 0 0
144 1 Samblpur Rairakhole Tap 0.0 0 0
145 1 Kendapra Paradip -
34.4 -1.124 43.2
146 1 Rairakhole Tap Katapali 0.0 0 5.2
147 1 Budhipadar Budhipadar 62.1 11.238 31.4
148 1 Bolangir New Bolangir Old 51.5 -4.405 63.9
149 1 Phulnakhara Cuttack 25.1 -9.761 34.5
150 1 Arya Bolani -
34.5 -
10.788 44.8
151 1 Karenjia Rairangpur -
16.2 3.862 21.5
152 1 Jayanagar Meenakshi -
39.9 -0.066 50.4
153 1 Dhmra Port Bhadrak -4.8 -0.755 6.6
154 1 Budhipadar MSP 0.0 0 0
155 1 OCL Salipur 19.9 -1.493 24.6
156 1 Jajpur Road Anandpr 11.5 -5.714 15.9
157 1 Basta Jaleswar 33.6 6.531 42.6
158 1 Samblpur Shyam DRI -
17.0 -6.929 22.2
159 1 Bhanjanagar Aska 55.7 -4.085 68.5
160 1 Chatrapur IRE 6.4 1.578 8.4
161 1 TTPS Chainpal 62.2 13.322 38
162 1 Angul Nandira 16.8 -0.356 20.2

Web based Protection Database and Desktop based Protection setting calculation tool – ERPC
187 PRDC Bangalore January 2017
Sl.No
No. of Ckts.
From Station To Station
Power Flow (Forward) %
Loading Owned by
MW MVAr
163 1 Chainpal FCI 0.4 -0.167 0.5*
164 1 Tarkera RSP 0.0 -
15.677 19
165 1 Tarkera RSP 0.0 -
15.677 19
166 1 Chatrapur Narendra Pur -
27.5 -
16.651 40.5
167 1 Paradip IFFCO 0.0 0 0
168 1 NBVL HM Switch 9.4 -
12.999 19.5
169 1 Budhipadar Sundargarh 10.1 1.894 12.8
170 2 Meramundali HM Switch 6.8 30.267 19.2
171 1 Paradip PPT 0.0 0 0
172 1 Duburi BRPL 16.7 4.903 21.5
173 1 MESCO BRPL -3.6 -1.158 4.7
174 1 Bolangir New Bolangir Old 51.5 -4.405 63.9
175 1 Duburi Jajpur Road 18.2 2.079 22.7
176 1 Paradip PPL 0.0 0 0
177 1 Hindalco Burla -4.3 -4.683 7.6
178 1 Jharsuguda L&TCemco 4.0 -0.751 4.9
179 1 Tarkera Rourkela 17.8 4.162 22.2
180 1 SMC Lapanga -
44.2 9.127 54.2
181 1 Lapanga Budhipadar 2.6 -0.91 1.6
182 1 Jayambee Ferro TTPS -
67.3 2.209 82.8
183 1 BeeKay Steel Bhulta Tap -7.8 -2.558 10.1
184 1 Chandaka Nimpara -7.8 -4.419 11.4
185 1 Joda Bansapani 2.3 -1.074 3.1
186 1 Barbil Arya -
14.9 -5.294 19.7
187 1 Saliban HM Switch -1.5 -0.497 1.9
188 1 Jagatsingpur Goreknata Rly 10.5 4.506 14.9
189 1 Paradip Jagatsingpur 33.4 2.268 41.7
190 1 Aska Purusattampur 41.6 -6.828 52.5
191 1 Chatrapur Purusattampur -
30.5 2.169 38.7

Web based Protection Database and Desktop based Protection setting calculation tool – ERPC
188 PRDC Bangalore January 2017
Sl.No
No. of Ckts.
From Station To Station
Power Flow (Forward) %
Loading Owned by
MW MVAr
192 1 Balugaon Chandpur 7.3 -2.849 10.2
193 1 Chandpur Balugaon Tap 0.0 0 0
194 1 Balugaon Tap Atri -
66.0 6.231 83
195 1 Arati Steel Rawmeet 67.8 -
16.864 85.6
196 1 Nimapara Konark 5.8 0.745 7.7
197 1 Nimapara Kesura 0.0 0 0
198 1 Nimapara Samangara -
43.9 -0.081 55.6
199 1 Khariar Nuapara 8.3 0.003 11.5
200 1 Argul Tap Shamuka 11.1 -7.223 16.5
201 1 Sonepur Boudh 4.9 -0.818 6.5
202 1 Junagarh Bhawanipatna -
19.2 1.993 24
203 1 Shamuka Puri 0.0 0 0
204 1 Puri Samangara -
44.6 1.096 56.4
205 1 Dabugaon Tentulikhunti -
11.7 -0.482 15.2
206 1 Dabugaon Umerkote 9.1 0.258 12
207 1 Joda Bolani 36.6 9.708 46.2
208 1 Jayanagar Sunabeda 27.5 7.298 35.9
209 1 Polasponga Keonjhar Traction 7.2 -4.131 10.1
210 1 Rairangpur Kuchi -
22.9 6.206 29.8
211 1 Katapali Bargarh 54.7 14.806 68.6
212 1 Bargarh Barpalli 0.0 0 0
213 1 Bargarh ACC 0.1 -0.192 0.3*
214 1 Budhipadar Kahalgaon 35.9 -9.655 44.4
215 1 Burla-Rajganpur
Tap Kuchinda 0.0 0.254 4
216 1 Aryan Steel Shyam DRI 16.1 -1.991 19.4
217 1 Baripada Balasore 0.0 0 0
218 1 Kendrapra Marshghai -
19.9 0.652 25.1
219 1 Arati Steel Meramundali -
73.9 28.455 98.3

Web based Protection Database and Desktop based Protection setting calculation tool – ERPC
189 PRDC Bangalore January 2017
Sl.No
No. of Ckts.
From Station To Station
Power Flow (Forward) %
Loading Owned by
MW MVAr
220 1 BC Mohanty Duburi -
36.0 -5.683 45.2
221 1 Budhipadar Jharsuguda 17.5 7.515 23
222 1 Khurdah Split Argul Tap 11.1 -7.869 17
223 1 Argul Tap Argul 0.0 0 0
224 1 Rayagarh Split Jayangr splt -
32.2 -3.568 40.6
225 1 Action Ishpat Jharsiguda 3.4 -4.359 6.6
226 1 Rathi Chiplima 0.0 0 0.3*
227 1 Adhunik Sri ganesh -0.7 -4.496 5.6
228 1 Kesura Ranasinghpur -
21.2 -0.565 27.7
229 1 Grid Steel ICCL -2.7 -
42.148 51.7
230 1 Mania OCL Tap 27.8 0.893 34.2
231 1 BPPL Chandaka Split 0.0 0 0.6*
232 1 Kurda Split Mendhasal -
19.0 7.061 26.1
233 1 Aryan Steel Lapanga -
15.1 0.789 18.1
234 1 Burla-Rajganpur
Tap Rajganpur 0.0 0 0
235 1 Burla-Rajganpur
Tap Bamra Traction 0.0 -0.254 0.3*
236 1 Kalugaon Tarkera 9.4 -9.846 16.5
237 1 Somnathpur EMAMI -0.3 -4.272 5.3
238 1 Bhadrak Dhamra Traction 0.2 -1.689 2.1
239 1 Marshghai Paradeep -
30.5 -1.618 38.2
240 1 Duburi MSL 3.1 0.342 4
241 1 BC Mohanty Tomka Traction 0.0 -0.571 0.7*
242 1 HM Switch Samal Metalics 0.0 -0.052 0.1*
243 1 Arya BRP-St 13.1 3.81 17.1
244 1 Argul Atri -1.6 0.681 2.8
245 1 Atri Baki 6.0 -4.421 9.2
246 1 Rajganpur Kuchinda -
33.0 10.596 41.9
247 1 Duburi Kamakhyanagar -
11.6 0.672 14.9
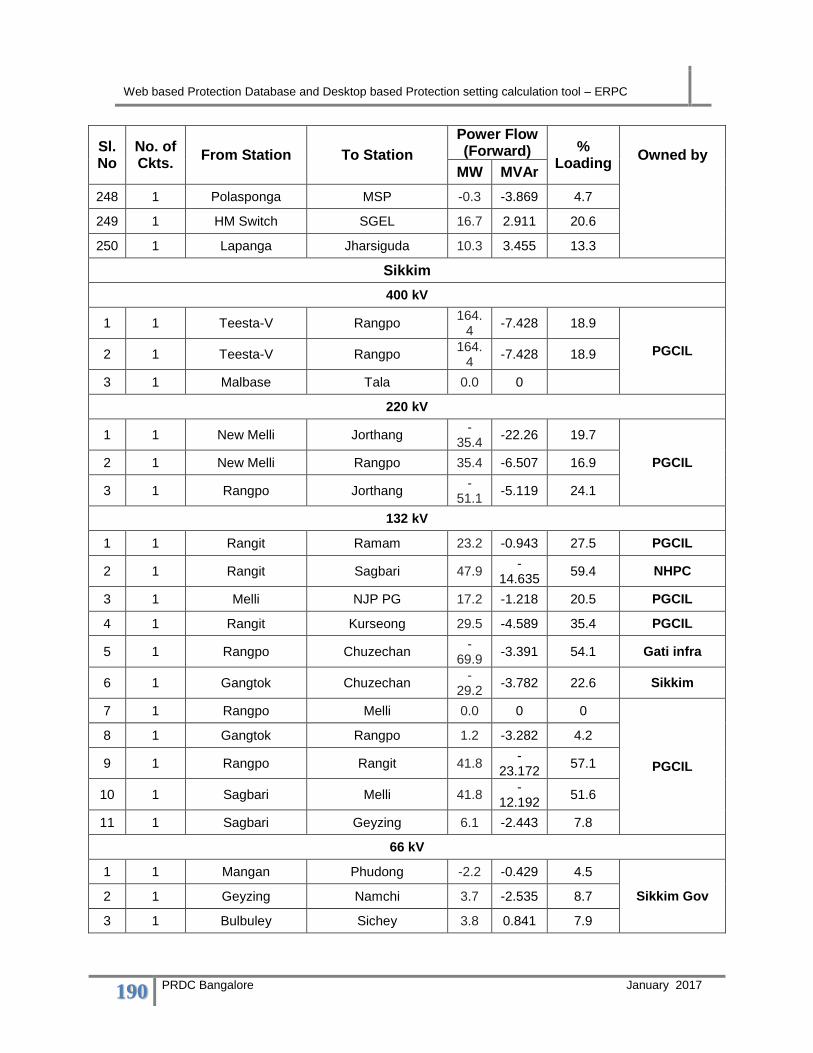
Web based Protection Database and Desktop based Protection setting calculation tool – ERPC
190 PRDC Bangalore January 2017
Sl.No
No. of Ckts.
From Station To Station
Power Flow (Forward) %
Loading Owned by
MW MVAr
248 1 Polasponga MSP -0.3 -3.869 4.7
249 1 HM Switch SGEL 16.7 2.911 20.6
250 1 Lapanga Jharsiguda 10.3 3.455 13.3
Sikkim
400 kV
1 1 Teesta-V Rangpo 164.
4 -7.428 18.9
PGCIL 2 1 Teesta-V Rangpo 164.
4 -7.428 18.9
3 1 Malbase Tala 0.0 0
220 kV
1 1 New Melli Jorthang -
35.4 -22.26 19.7
PGCIL 2 1 New Melli Rangpo 35.4 -6.507 16.9
3 1 Rangpo Jorthang -
51.1 -5.119 24.1
132 kV
1 1 Rangit Ramam 23.2 -0.943 27.5 PGCIL
2 1 Rangit Sagbari 47.9 -
14.635 59.4 NHPC
3 1 Melli NJP PG 17.2 -1.218 20.5 PGCIL
4 1 Rangit Kurseong 29.5 -4.589 35.4 PGCIL
5 1 Rangpo Chuzechan -
69.9 -3.391 54.1 Gati infra
6 1 Gangtok Chuzechan -
29.2 -3.782 22.6 Sikkim
7 1 Rangpo Melli 0.0 0 0
PGCIL
8 1 Gangtok Rangpo 1.2 -3.282 4.2
9 1 Rangpo Rangit 41.8 -
23.172 57.1
10 1 Sagbari Melli 41.8 -
12.192 51.6
11 1 Sagbari Geyzing 6.1 -2.443 7.8
66 kV
1 1 Mangan Phudong -2.2 -0.429 4.5
Sikkim Gov 2 1 Geyzing Namchi 3.7 -2.535 8.7
3 1 Bulbuley Sichey 3.8 0.841 7.9

Web based Protection Database and Desktop based Protection setting calculation tool – ERPC
191 PRDC Bangalore January 2017
Sl.No
No. of Ckts.
From Station To Station
Power Flow (Forward) %
Loading Owned by
MW MVAr
4 1 Bulbuley Gangtok -7.6 -1.83 15.7
5 2 Ranipool LLHP 0.0 -0.005 0.0*
6 1 Rongli Pakyong -2.4 -0.464 5
7 1 Mamring Melli -5.1 -1.39 10.4
8 1 Rangit Rabangla 1.6 0.302 3.3
9 1 Ranipool Pakyong 6.2 1.185 6.8
10 1 Melli Namchi -2.8 2.243 7.4
11 1 Pelling Geyzing -1.6 -0.461 3.3
12 1 Purani Namchi Rothak 1.6 0.189 3.2
13 1 Rothak Soreng 0.8 0.081 1.6
14 2 Melli Kalingpong 16.3 -
15.846 22.2
15 1 Melli Melli 24.0 -
11.423 51.9
16 1 Melli Purani Namchi 3.8 0.521 7.6
17 1 Gangtok Tadong 9.7 2.132 20
18 1 Ranipool Gangtok -
10.5 -2.139 21.5
19 1 Tadong Sichey 2.7 0.839 5.7
20 1 Tadong Phudong 3.3 0.297 6.6
21 1 Rongli Rhenock 1.6 0.31 3.4
22 1 Geyzing Geyzing 4.5 -2.318 9.9
23 1 Ranipool Topakhani 2.2 0.396 4.5
24 1 Mangan Meyong HEP 0.0 -0.137 0.3
25 1 Rongli RongliH 0.0 -0.057 0.1
West Bengal
400 kV
1 1 Malbase Binaguri 240.
0 5 28.1
PGCIL
2 1 Rangpo Binaguri 222.
1 -
60.897 26.4
3 1 Rangpo Binaguri 222.
1 -
60.897 26.4
4 1 TALA Binaguri 225.
9 -33.08 26
5 1 TALA Binaguri 225.
9 -33.08 26

Web based Protection Database and Desktop based Protection setting calculation tool – ERPC
192 PRDC Bangalore January 2017
Sl.No
No. of Ckts.
From Station To Station
Power Flow (Forward) %
Loading Owned by
MW MVAr
6 1 TALA Binaguri 225.
9 -33.08 26
7 1 Binaguri Bongaigaon (NER) 155.
2 -
77.674 19.9
8 1 Binaguri Bongaigaon (NER) 155.
2 -
77.674 19.9
9 1 Binaguri Bongaigaon (NER) 155.
2 -
77.674 19.9
10 1 Binaguri Bongaigaon (NER) 155.
2 -
77.674 19.9
11 1 Farraka Malda PG 425.
1 53.227 48.1
12 1 Farraka Malda PG 425.
1 53.227 48.1
13 1 Farraka Parulia (PGCIL) 115.
4 -
28.031 13.3
14 1 Farraka Parulia (PGCIL) 115.
5 -
75.205 15.5
15 1 Farraka Behrampur 383.
9 -
32.911 43.2
16 1 Farraka Sagardighi 358.
5 -
33.184 40.4
17 1 Sagrdghi Behrampur 153.
9 -
12.472 17.3
18 1 Sagrdghi Behrampur 153.
9 -
12.472 17.3
19 1 Sagrdghi Parulia (PGCIL) -
40.1 -
69.858 9.1 WBSETCL
20 1 Sagrdghi Parulia (PGCIL) -
40.1 -
69.858 9.1 WBSETCL
21 1 Subhashgram Sagardighi -
266.2
-42.809
30.8
PGCIL 22 1 Behrampur
Behramara (Bangladesh)
209.6
-4.889 23.8
23 1 Behrampur Behramara
(Bangladesh) 209.
6 -4.889 23.8
24 1 Behrampur Jeerat 270.
5 -0.032 30.4
25 1 Haldia Subhashgram 267.
5 -
39.004 31.4
CESC
26 1 Haldia Subhashgram 267.
5 -
39.004 31.4
27 1 Jeerat Subhashgram 105.
4 10.453 13.6 PGCIL
28 1 Jeerat Bakreswar -
256.0
5.06 29.5 WBSETCL

Web based Protection Database and Desktop based Protection setting calculation tool – ERPC
193 PRDC Bangalore January 2017
Sl.No
No. of Ckts.
From Station To Station
Power Flow (Forward) %
Loading Owned by
MW MVAr
29 1 Jeerat KTPS -
296.8
-93.869
36
30 1 KTPS Kharagpur -
17.1 -
18.399 4.3
31 1 KTPS Kharagpur -
17.1 -
18.399 4.3
32 1 KTPS Chaibasa -
403.0
-0.888 45.4 PGCIL
33 1 Arambag KTPS -
106.0
9.303 13.3
WBSETCL
34 1 Arambag Bidhannagar -
262.4
-25.733
29.5
35 1 Arambag Bakreswar -
77.8 33.403 10.4
36 1 PPSP Arambag 148.
2 -
18.152 19.7
37 1 PPSP Arambag 148.
2 -
18.152 19.7
38 1 PPSP Bidhannagar 1.5 -8.658 11.1
39 1 PPSP Bidhannagar 1.5 -8.658 11.1
40 1 Parulia (PGCIL) Bidhannagar 262.
8 -
16.022 29.3
41 1 Parulia (PGCIL) Bidhannagar 262.
8 -
16.022 29.3
42 1 Khargpur Chaibasa -
166.1
-42.787
19.3 PGCIL
43 1 Durgapur (DSTPS)
Raghunathpur 36.9 39.143 9.8 DVC
44 1 Durgapur (DSTPS)
Raghunathpur 36.9 39.143 9.8 DVC
220 kV
1 1 STPS Asansol 27.5 9.515 15.4
WBSETCL
2 1 Subhasgram PG CLC 63.0 2.85 30.4
3 1 Kasba Subhasgram WB -
20.9 6.736 11.1
4 1 Jeerat Satgachia 2.1 -0.433 5
5 1 Arambag Domjur 100.
4 9.878 47
6 1 Arambag Domjur 100.
4 9.878 47

Web based Protection Database and Desktop based Protection setting calculation tool – ERPC
194 PRDC Bangalore January 2017
Sl.No
No. of Ckts.
From Station To Station
Power Flow (Forward) %
Loading Owned by
MW MVAr
7 1 Arambag Midnapur 8.5 -2.91 5.2
8 1 Arambag Midnapur 8.5 -2.91 5.2
9 1 Bakreshwar Bidhanagar 16.1 -3.379 7.8
10 1 Bakreshwar Bidhanagar 16.1 -3.379 7.8
11 1 Bidhanagar DPL -
27.7 75.297 38.4
12 1 Bidhanagar DPL -
27.7 75.297 38.4
13 1 Howrah KTPS -
174.4
-11.324
83.6
14 1 Howrah KTPS -
174.4
-11.324
83.6
15 1 Jeerat Kasba 55.9 0.732 26.9
16 1 Jeerat Kasba 55.9 0.732 26.9
17 1 Parulia WB Parulia D 121.
8 56.02 62.8
18 1 Parulia WB Parulia D 121.
8 56.02 62.8
19 1 Bidhanagar DTPS-D 6.4 -3.683 3.5
20 1 Bidhanagar DTPS-D 6.4 -3.683 3.5
21 1 STPS Hura 67.6 -
33.798 35.2
22 1 BishnupurNew Arambag -
33.6 -7.328 16.1
23 1 BishnupurNew Arambag -
33.6 -7.328 16.1
24 1 Laxmikantapur Subhasgram WB -
135.5
-15.688
66.2
25 1 Laxmikantapur Subhasgram WB -
135.5
-15.688
66.2
26 1 Bakreshwar Satgachia 128.
7 -6.73 60.7
27 1 Bakreshwar Satgachia 128.
7 -6.73 60.7
28 1 Subhasgram PG Subhasgram WB 180.
9 17.068 77.5
29 1 Subhasgram PG Subhasgram WB 180.
9 17.068 77.5
30 1 Kasba Subhasgram WB -
20.9 6.736 11.1

Web based Protection Database and Desktop based Protection setting calculation tool – ERPC
195 PRDC Bangalore January 2017
Sl.No
No. of Ckts.
From Station To Station
Power Flow (Forward) %
Loading Owned by
MW MVAr
31 1 Kharagpur Midnapur 66.0 -2.382 30.7
32 1 Kharagpur Midnapur 66.0 -2.382 30.7
33 1 Subhasgram PG NTAA 38.4 -1.314 18.4
34 1 NTAA Jeerat -
85.2 -
10.878 41.1
35 1 TLD NJP 0.0 0 5.4
36 1 NJP TLD 0.0 -20.72 9.7
37 1 NJP TLD 0.0 -20.72 9.7
38 1 Gokarna Bakreshwar -
126.8
-4.231 60.6
39 1 Gokarna Bakreshwar -
126.8
-4.231 60.6
40 1 Gokarna Sagardighi -
173.7
-28.861
83.9
41 1 Gokarna Sagardighi -
173.7
-28.861
83.9
42 1 Foundry Park Domjur -9.9 -3.603 5
43 1 Foundry Park Domjur -9.9 -3.603 5
44 1 Howrah Foundry Park 0.0 0 0
45 1 Howrah Foundry Park 0.0 0 0
46 1 Krishnanagar Satgachia -
56.0 -
18.885 28.6
47 1 Krishnanagar Satgachia -
56.0 -
18.885 28.6
48 1 Asansol Bidhanagar -
28.5 -0.339 15.2
49 1 NTAA CLC 19.2 2.531 9.6
50 1 Bishnupr New STPS -
64.0 -0.106 31.1
51 1 New Haldia KTPS -
44.8 2.932 21.5
52 1 New Haldia KTPS -
44.8 2.932 21.5
53 1 Bishnupr New Hura -
48.4 -10.29 23.1
54 1 Subhasgram PG EMSS 219.
0 -3.719 43
55 1 Subhasgram PG EMSS 219.
0 -3.719 43
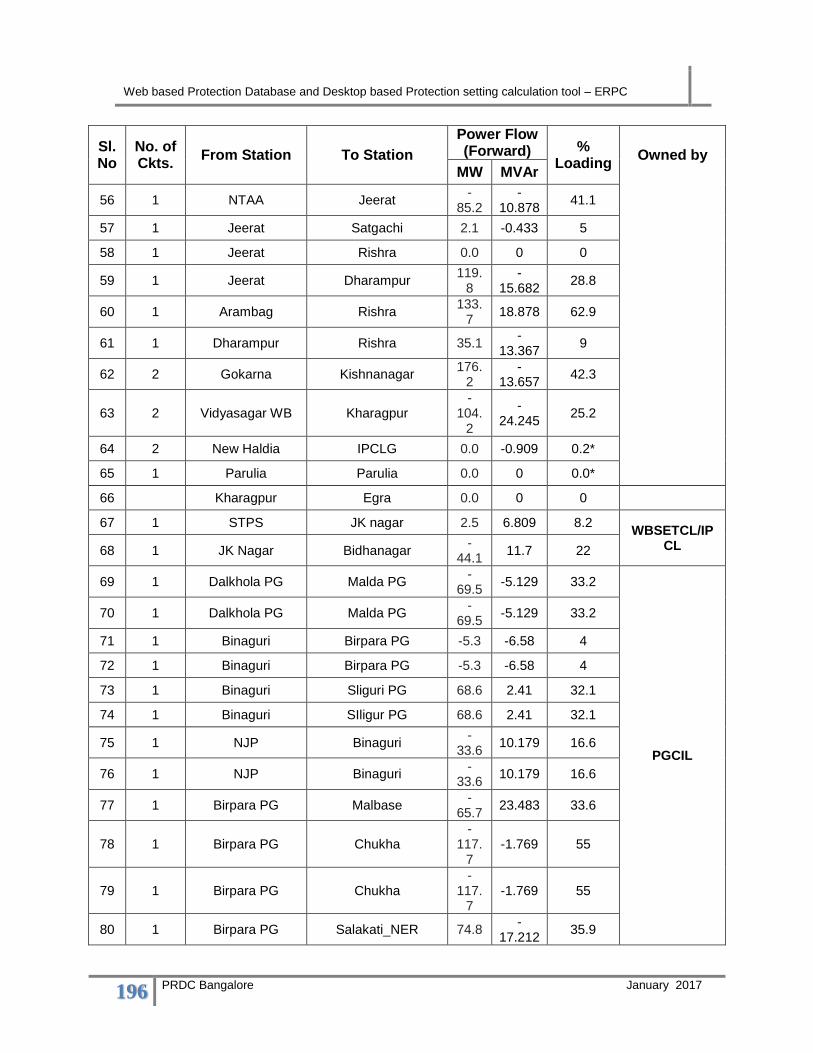
Web based Protection Database and Desktop based Protection setting calculation tool – ERPC
196 PRDC Bangalore January 2017
Sl.No
No. of Ckts.
From Station To Station
Power Flow (Forward) %
Loading Owned by
MW MVAr
56 1 NTAA Jeerat -
85.2 -
10.878 41.1
57 1 Jeerat Satgachi 2.1 -0.433 5
58 1 Jeerat Rishra 0.0 0 0
59 1 Jeerat Dharampur 119.
8 -
15.682 28.8
60 1 Arambag Rishra 133.
7 18.878 62.9
61 1 Dharampur Rishra 35.1 -
13.367 9
62 2 Gokarna Kishnanagar 176.
2 -
13.657 42.3
63 2 Vidyasagar WB Kharagpur -
104.2
-24.245
25.2
64 2 New Haldia IPCLG 0.0 -0.909 0.2*
65 1 Parulia Parulia 0.0 0 0.0*
66 Kharagpur Egra 0.0 0 0
67 1 STPS JK nagar 2.5 6.809 8.2 WBSETCL/IP
CL 68 1 JK Nagar Bidhanagar -
44.1 11.7 22
69 1 Dalkhola PG Malda PG -
69.5 -5.129 33.2
PGCIL
70 1 Dalkhola PG Malda PG -
69.5 -5.129 33.2
71 1 Binaguri Birpara PG -5.3 -6.58 4
72 1 Binaguri Birpara PG -5.3 -6.58 4
73 1 Binaguri Sliguri PG 68.6 2.41 32.1
74 1 Binaguri SIligur PG 68.6 2.41 32.1
75 1 NJP Binaguri -
33.6 10.179 16.6
76 1 NJP Binaguri -
33.6 10.179 16.6
77 1 Birpara PG Malbase -
65.7 23.483 33.6
78 1 Birpara PG Chukha -
117.7
-1.769 55
79 1 Birpara PG Chukha -
117.7
-1.769 55
80 1 Birpara PG Salakati_NER 74.8 -
17.212 35.9

Web based Protection Database and Desktop based Protection setting calculation tool – ERPC
197 PRDC Bangalore January 2017
Sl.No
No. of Ckts.
From Station To Station
Power Flow (Forward) %
Loading Owned by
MW MVAr
81 1 Birpara PG Salakati_NER 74.8 -
17.212 35.9
82 1 Dalkhola PG Purnea 41.8 8.116 20.9
83 1 Dalkhola PG Purnea 41.8 8.116 20.9
84 1 Dalkhola PG Dhalkhola WB 78.8 9.25 37.7
85 1 Dalkhola PG Dhalkhola WB 78.8 9.25 37.7
86 1 Farakka Lalmatiya 40.5 -6.436 18.9
87 1 Siliguri Krishanganj 51.6 -4.128 24.6
88 1 Siliguri Krishanganj 51.6 -4.128 24.6
89 2 Dhalkhola Krishanganj -
102.2
-24.473
25
90 1 JK Nagar JK Nagar 2.4 17.329 9.2 IPCL
91 1 JK Nagar JK Nagar -
44.1 9.811 21.5
92 1 Burnpur D Mejia D -
66.1 16.825 33
DVC
93 1 Burnpur D Kalyaneshwari -
35.0 -6.239 16.6
94 2 Mejia Durgapur 72.6 -
13.668 17.4
95 2 Parulia D Durgapur 35.0 45.117 14.2
96 2 Barjora Mejia -
140.8
-14.385
33.3
97 1 DTPS-D Mejia -
50.0 0.374 23.7
98 1 DTPS-D Mejia -
50.0 0.374 23.7
99 1 Parulia-D Tamla D 7.0 1.456 3.5
100 1 Parulia-D Tamla D 7.0 1.456 3.5
101 1 Parulia-D Tamla 7.0 1.456 3.5
102 2 DTPS-D Parulia D -
111.0
-36.703
27.5
103 2 IISCO D Burnpur D -
99.4 10.421 23.4
104 1 EMSS NCGS 0.0 0 0
CESC 105 1 EMSS NCGS 0.0 0 0
106 1 EMSS EMSS 0.0 0 0

Web based Protection Database and Desktop based Protection setting calculation tool – ERPC
198 PRDC Bangalore January 2017
Sl.No
No. of Ckts.
From Station To Station
Power Flow (Forward) %
Loading Owned by
MW MVAr
107 1 BBGS BBG 134.
1 14.266 53.3
108 1 BBGS BBG 134.
1 14.266 53.3
109 1 BBG EMSS 133.
1 18.136 51.5
110 1 BBG EMSS 133.
1 18.136 51.5
111 1 EMSS Kasba 0.0 0 0
112 1 EMSS EMSS 0.0 0 0
132kV
1 1 Howrah B. Garden 26.5 -0.018 54.6
WBSETCL
2 1 Howrah B. Garden 26.5 -0.018 54.6
3 1 Howrah SRS 0.0 0 0
4 1 Lilooah Belur 41.6 -
16.017 92.5
5 1 Lilooah Belur 41.6 -
16.017 92.5
6 1 Lilooah Belur 41.6 -
16.017 92.5
7 1 Titagarh Titagarh 0.0 0 0
8 1 Titagarh Titagarh 0.0 0 0
9 1 Kasba EMSS 6.6 -
14.554 10.2
10 1 Kasba EMSS 6.6 -
14.554 10.2
11 1 Howrah B. Garden 26.5 -0.018 54.6
12 1 Rishra Rishra 40.6 -3.054 26.1
13 1 Rishra Rishra 40.6 -3.054 26.1
14 1 Alipurduar Birpara -
54.6 8.13 68.6
15 1 Midnapur Balichauk 43.1 6.94 52.6
16 1 Pingla Balichauk -
20.4 -0.578 25.1
17 1 CK Road Midnapur 0.0 0 0
18 1 Leobong NBU 29.6 -3.061 35.7
19 1 Leobong Ramam -
33.3 1.646 40.1
20 1 Dharampur Kalyani 23.4 -8.564 30.7
21 1 Dhulian Farakka 0.0 0 0

Web based Protection Database and Desktop based Protection setting calculation tool – ERPC
199 PRDC Bangalore January 2017
Sl.No
No. of Ckts.
From Station To Station
Power Flow (Forward) %
Loading Owned by
MW MVAr
22 1 Joka Sonarpur 0.0 0 0
23 1 Lalgola Raghunathpur 30.5 5.169 39.4
24 1 Gokarna Rampurhat 52.8 4.027 66.3
25 1 Gokarna Kuli GIS 30.7 4.539 38.8
26 1 HM Dankuni -5.0 2.988 7.5
27 1 Dankuni Lilooah -5.0 3.315 7.8
28 1 HM Rishra 0.0 0 0
29 1 Khanyan Satgachia -
30.1 11.642 40.3
30 1 Malda Samsi 47.8 11.747 60.9
31 1 Satgachia Dhatri Rly 4.5 1.34 6.1
32 1 NBU TCF-1 4.4 -2.293 6.1
33 1 NJP TCF-1 -4.4 0.61 5.7
34 1 Samsi Raigunj 0.0 0 0
35 1 Saintia Rampurhat 0.0 0 0
36 1 TCF-1 TCF-2 0.0 0 0
37 1 TCF-1 TCF-3 0.0 0 0
38 1 TCF-2 TCF-3 0.0 0 0
39 1 NBU NJP 15.1 -5.155 19.4
40 1 New Haldia Haldia 7.3 -5.127 10.7
41 1 New Haldia HPCL 8.5 -0.33 10.2
42 1 Haldia HPCL 0.8 3.121 4
43 2 Rishra CTOLA 0.0 0 0
44 1 Raigunj Gangarampur 34.6 -5.377 43.7
45 1 Cooch Bihar Alipurduar -
21.1 4.464 27
46 1 Chalsa Maynaguri 11.9 -0.394 14.8
47 1 Chalsa NJP -
13.5 -3.538 17.2
48 1 Contai New Haldia -
31.1 -6.757 38.6
49 1 Contai Egra -
45.1 -
13.253 57.8
50 1 Gokarna Raghunathpur 52.0 7.661 65.8
51 1 CLC Kasba - - 40.6

Web based Protection Database and Desktop based Protection setting calculation tool – ERPC
200 PRDC Bangalore January 2017
Sl.No
No. of Ckts.
From Station To Station
Power Flow (Forward) %
Loading Owned by
MW MVAr
30.7 11.686
52 1 Kasba Joka 0.0 0 0
53 1 TMBLK RMBLK -
45.0 -
15.323 59
54 1 RMBLK Midnapur 0.0 0 0
55 1 CK Road Bishnupur Old -
39.6 -2.069 48.9
56 1 Basirhat Ashoknagar -
24.5 -3.913 31
57 1 Basirhat Ashoknagar -
24.5 -3.913 31
58 1 Arambag Raina 48.1 7.214 58.9
59 1 Arambag Raina 48.1 7.214 58.9
60 1 Arambag Tarakeshwar 55.4 -8.048 67.7
61 1 Arambag Tarakeshwar 55.4 -8.048 67.7
62 1 Ashoknagar Jeeerat -
53.7 -6.701 67.4
63 1 Ashoknagar Jeeerat -
53.7 -6.701 67.4
64 1 Bankura Bishnupur New -
22.4 -3.881 27.7
65 1 Bankura Bishnupur New -
22.4 -3.881 27.7
66 1 Barasat Jeeerat -
40.8 -
15.435 54.4
67 1 Barasat Jeeerat -
40.8 -
15.435 54.4
68 1 Birpara BRP PG -
70.3 -8.025 85.8
69 1 Birpara BRP PG -
70.3 -8.025 85.8
70 1 Birpara Maynaguri 0.0 0 0
71 1 Birpara Mathabhanga 0.0 0 0
72 1 Bolpur Saintia 27.0 -5.213 34.6
73 1 Bolpur Saintia 27.0 -5.213 34.6
74 1 Bongaon Krishnanagar 0.0 0 0
75 1 Bongaon Krishnanagar 0.0 0 0
76 1 Dlkhola Raigunj 29.6 -2.152 33.7
77 1 Dlkhola Raigunj 29.6 -2.152 33.7
78 1 Debagram Katwa 0.0 0 0

Web based Protection Database and Desktop based Protection setting calculation tool – ERPC
201 PRDC Bangalore January 2017
Sl.No
No. of Ckts.
From Station To Station
Power Flow (Forward) %
Loading Owned by
MW MVAr
79 1 Debagram Katwa 0.0 0 0
80 1 Debagram Debagram TSS 3.8 0.022 4.9
81 1 Dharampur Titagarh 58.6 4.326 72.5
82 1 Dharampur Titagarh 58.6 4.326 72.5
83 1 Domjour Uluberia 42.4 1.018 52
84 1 Domjour Uluberia 42.4 1.018 52
85 1 Bidhannagar DPL 1.4 25.233 31.4
86 1 Bidhannagar DPL 1.4 25.233 31.4
87 1 Bidhannagar Mankar 53.8 -0.867 65.6
88 1 Bidhannagar Mankar 53.8 -0.867 65.6
89 1 Falta Laxmikantapur -
44.2 0.388 56.8
90 1 Falta Laxmikantapur -
44.2 0.388 56.8
91 1 Gokarna Katwa 24.4 -1.377 30.6
92 1 Gokarna Katwa 24.4 -1.377 30.6
93 1 Joka Sirkl -
40.9 -4.223 53.1
94 1 Jeeerat Bongaon 15.7 0.448 19.5
95 1 Jeeerat Bongaon 15.7 0.448 19.5
96 1 NTAA SaltLak 0.0 0 0
97 1 Kasba SaltLak 41.7 10.453 53.1
98 1 Katwa Satgachia 0.0 0 0
99 1 Katwa Satgachia 0.0 0 0
100 1 KTPS Kolaghat WB 78.7 7.123 95.5
101 1 KTPS Kolaghat WB 78.7 7.123 95.5
102 1 KTPS TMLK 19.7 -2.119 24
103 1 KTPS TMLK 19.7 -2.119 24
104 1 KTPS Uluberia 0.0 0 0
105 1 KTPS Bagnan 40.7 -1.099 49.2
106 1 Lilooah Rishra 0.0 0 0
107 1 Lilooah Howrah -
41.6 3.994 52.3
108 1 NJP Siliguri 16.9 3.255 21.1

Web based Protection Database and Desktop based Protection setting calculation tool – ERPC
202 PRDC Bangalore January 2017
Sl.No
No. of Ckts.
From Station To Station
Power Flow (Forward) %
Loading Owned by
MW MVAr
109 1 NJP Siliguri 16.9 3.255 21.1
110 1 STPS Purulia WB 25.4 -6.341 31.2
111 1 STPS Purulia WB 25.4 -6.341 31.2
112 1 NJP PG Kurseong -
27.9 1.791 33.9
113 1 Domjour Jangipara 11.2 -0.544 13.8
114 1 Domjour Jangipara 11.2 -0.544 13.8
115 1 Arambag Birsingha 21.8 4.007 27.1
116 1 Arambag Birsingha 21.8 4.007 27.1
117 1 Tarakeshwar Belmuri 31.8 -7.176 39.9
118 1 Tarakeshwar Belmuri 31.8 -7.176 39.9
119 1 Bishnupur New Borjora 6.3 -0.443 7.9
120 1 Bishnupur New Borjora 6.3 -0.443 7.9
121 1 Borjora Bidhannagar 0.0 0 0
122 1 Borjora Bidhannagar 0.0 0 0
123 1 RGP Bankura 0.0 0 0
124 1 RGP Bankura 0.0 0 0
125 1 Mankar Mahachanda 30.2 -2.048 37.4
126 1 Mankar Mahachanda 30.2 -2.048 37.4
127 1 Mahachanda Satgachia 0.0 0 0
128 1 Mahachanda Satgachia 0.0 0 0
129 1 TATA Power Haldia 25.9 5.591 31.8
130 1 TATA Power Haldia 25.9 5.591 31.8
131 1 Cresent Asansol 17.4 5.535 22.5
132 1 Cresent Asansol 17.4 5.535 22.5
133 1 Krishnanagar Ranaghat 44.1 4.586 56
134 1 Krishnanagar Ranaghat 44.1 4.586 56
135 1 Debagram Amtala 37.7 -4.063 48.6
136 1 Debagram Amtala 37.7 -4.063 48.6
137 1 Berhampur Amtala 0.0 0 0
138 1 Berhampur Amtala 0.0 0 0
139 1 Hizli Midnapur 0.0 0 0

Web based Protection Database and Desktop based Protection setting calculation tool – ERPC
203 PRDC Bangalore January 2017
Sl.No
No. of Ckts.
From Station To Station
Power Flow (Forward) %
Loading Owned by
MW MVAr
140 1 Hizli Midnapur 0.0 0 0
141 1 Midnapur Pingla 36.5 4.127 44.2
142 1 Jhargram Midnapur -
15.2 0.07 18.7
143 1 Jhargram Midnapur -
15.2 0.07 18.7
144 1 NTAA III SaltLak 0.0 0 0
145 2 NTAA III Barasat 43.9 0.322 27.4
146 1 Ukhra Bidhannagar -
24.3 2.714 30.1
147 1 Ukhra Bidhannagar -
24.3 2.714 30.1
148 1 TCF-3 Dlkhola 0.0 0 0
149 1 TCF-3 Dlkhola 0.0 0 0
150 1 Rishra Bighati 14.3 1.666 17.8
151 1 Rishra Bighati 14.3 1.666 17.8
152 1 Bishnupur New Bishnupur Old 26.5 2.195 32.1
153 1 Bishnupur New Bishnupur Old 26.5 2.195 32.1
154 1 Bishnupur New Bishnupur Old 26.5 2.195 32.1
155 1 Howrah Lilooah 72.0 -6.443 89.6
156 1 Howrah Lilooah 72.0 -6.443 89.6
157 1 Howrah Lilooah 72.0 -6.443 89.6
158 1 Dhulian Khejuria GIS 0.0 0 0
159 1 Khejuria GIS Malda -
29.7 -5.674 37.5
160 1 Bishnupur Old Khatra 11.9 1.025 15.3
161 1 Bishnupur Old Khatra 11.9 1.025 15.3
162 1 Satgachia Kalna 19.4 -2.132 23.8
163 1 Satgachia Kalna 19.4 -2.132 23.8
164 1 Laxmikantapur Kakdwip 15.8 0.42 20.2
165 1 Laxmikantapur Kakdwip 15.8 0.42 20.2
166 1 Dharampur Jeeerat -
40.9 22.161 57.7
167 1 Dharampur Jeeerat -
40.9 22.161 57.7
168 1 Hura Purulia WB 0.0 0 0

Web based Protection Database and Desktop based Protection setting calculation tool – ERPC
204 PRDC Bangalore January 2017
Sl.No
No. of Ckts.
From Station To Station
Power Flow (Forward) %
Loading Owned by
MW MVAr
169 1 Hura Purulia WB 0.0 0 0
170 2 Hura RGP 12.6 -7.707 3.4
171 1 Bagnan Uluberia 0.0 0 0
172 1 Kharagpur Hizli 0.0 0 0
173 1 Saintia Kuli GIS 1.9 -3.607 5.2
174 1 Malda Khejuria GIS 30.0 4.764 37.5
175 1 Raghunathpur Farakka 0.0 0 0
176 1 Bengal Energy Egra -
44.2 -2.798 54.7
177 1 SonarLal Lalgola 0.0 0 0
178 2 Ambuja FR Raghunathpur 0.0 0 0
179 1 Raghunathpur Dhulian 22.0 0.54 28.3
180 1 Malda PG Malda 122.
0 12.148 58.8
181 1 Malda PG Malda 122.
0 12.148 58.8
182 1 Berhampur Gokarna -
55.0 -7.425 70.2
183 1 Berhampur Gokarna -
55.0 -7.425 70.2
184 1 Berhampur Cossim bazar TSS 0.4 -0.383 0.7*
185 1 Ranaghat Dharampur 0.0 0 0
186 1 Ranaghat Dharampur 0.0 0 0
187 1 NTAA III NTAA 91.6 13.588 57.8
188 1 Bidhannagar Bolpur 53.5 -2.495 65.3
189 1 Bidhannagar Bolpur 53.5 -2.495 65.3
190 1 Ujanoo NBU -
35.4 -1.666 43.3
191 1 NJP PG NBU 25.3 7.739 32.3
192 1 Ujanoo Siliguri 6.5 -0.951 8
193 1 Adisaptagram BTPS -
45.6 -
20.104 61
194 1 Adisaptagram BTPS -
45.6 -
20.104 61
195 1 Lilooah Rishra 0.0 0 0
196 1 NJP PG NJP 53.2 7.101 64.9
197 1 NJP Maynaguri 38.6 3.716 47.2

Web based Protection Database and Desktop based Protection setting calculation tool – ERPC
205 PRDC Bangalore January 2017
Sl.No
No. of Ckts.
From Station To Station
Power Flow (Forward) %
Loading Owned by
MW MVAr
198 1 Balurghat Balurghat Tap -
19.1 4.147 26
199 1 Balurghat Gangarampur 0.0 0 0
200 1 Gokarna SonarLal 19.0 1.095 24.1
201 1 Debagram Krishnanagar -
55.2 10.385 72.5
202 1 Debagram Krishnanagar -
55.2 10.385 72.5
203 1 Haldia Hizil 12.0 2.095 14.9
204 1 Haldia Hizil 12.0 2.095 14.9
205 1 TMLK Hizil 0.0 0 0
206 1 TMLK Hizil 0.0 0 0
207 1 Falta Joka 13.0 1.577 17.1
208 1 Falta Joka 13.0 1.577 17.1
209 1 Ramam NBU 38.2 -3.164 45.7
210 1 Sonarpur Kasba -
60.0 -
16.392 77.5
211 1 New Haldia Egra 9.8 -2.304 12.1
212 1 Bengal Energy Hizli 29.2 2.83 36.3
213 1 Raigunj Balurghat Tap -
20.5 2.94 26.7
214 1 Lalgola Gokarna -
19.9 -3.533 25.7
215 1 Lalgola Gokarna -
19.9 -3.533 25.7
216 1 PuruliaW Bagmundi 2.6 -7.57 9.6
217 1 Belmuri Adisaptagram 22.7 -7.584 29.4
218 1 Belmuri Adisaptagram 22.7 -7.584 29.4
219 1 Balurghat Tap Malda -
40.3 13.692 52.8
220 2 Hizil Rohit Ferro 0.0 0 0
221 1 Hizil Mankar 0.0 0 0
222 1 CK Road CK Road-Rly 2.4 0.534 3.1
223 2 Sirkol Laxmikantapur -
67.4 0.519 43.1
224 1 Maynaguri Mathabhanga 21.7 3.358 27.8
225 2 Amtala Najirpur 23.9 -4.303 15.8

Web based Protection Database and Desktop based Protection setting calculation tool – ERPC
206 PRDC Bangalore January 2017
Sl.No
No. of Ckts.
From Station To Station
Power Flow (Forward) %
Loading Owned by
MW MVAr
226 1 SaltLak CLC -
36.1 -5.57 45.6
227 1 Bankura Bengal concast 0.0 0 0
228 1 Cooch Bihar Birpara -
52.5 -3.553 25.3
229 1 Katwa Katwa Tss 0.2 -0.045 0.3*
230 1 Bankura Bankura T 11.2 5.086 15.1
231 1 Bishnupur Old Midnapur 0.0 0 0
232 1 Bishnupur Old Modern 10.5 4.827 14.1
233 1 Bishnupur Old Rohit Ferro 0.0 0 0
234 1 Midnapur WBIDC 0.0 0 0
235 1 Barasat Barsat Tap 8.9 4.169 12.4
236 1 Kolaghat WB Madras cement 4.4 0.863 5.6
237 1 TMBLK WBIDC 38.8 13.299 51
238 1 Chanditola BTPS -
30.4 0.008 37.3
239 1 Raghunathpur Khejuria GIS 0.0 0 0
240 1 Bolpur Bolpur Trac 1.2 0.331 1.6
241 1 Rishra Jayshree 0.0 -0.102 0.1*
242 1 Howrah DVC Foundry Park Tap 6.5 -0.363 8
243 1 Foundry Park Tap Kolaghat DVC -
15.2 -6.992 20.6
244 1 Vidyasagar Park BRG Steel Tap 0.0 -4.78 5.8
245 1 BRG Steel Tap BRG Steel 0.0 -0.423 0.5*
246 1 BRG Steel Tap Midnapur 0.0 0 0
247 1 Vidyasagar Park Hizli 0.0 0 0
248 1 Vidyasagar Park HIZLI TSS 28.7 -1.471 35.1
249 1 HizliI TSS Hizli 13.4 -5.477 18.2
250 1 Khejuria GIS Farakka Switching 40.2 12.939 26.5
251 1 Farakka
Switching Ambuja Cement Tap 40.2 13.128 53.1
252 1 Ambuja Cement
Tap Raghunathganj 0.0 0 0
253 1 Ambuja Cement
Tap Ambuja Cement 40.0 13.149 53.2
254 1 Kharagpur DVC Kharagpur Traction 0.1 0.028 0.1*

Web based Protection Database and Desktop based Protection setting calculation tool – ERPC
207 PRDC Bangalore January 2017
Sl.No
No. of Ckts.
From Station To Station
Power Flow (Forward) %
Loading Owned by
MW MVAr
255 1 Foundry Park Tap Food Park 21.7 7.589 28.4
256 1 BTPS Kalyani 26.2 13.956 36.7
DVC
257 1 BTPS Lilooah 25.9 7.766 34
258 1 BTPS Khanyan -2.3 8.39 11.6
259 1 BTPS Satgachia -
23.7 11.293 33.5
260 1 BTPS Bighati 0.0 0 0
261 1 BTPS Bighati 0.0 0 0
262 3 BTPS Dharampur 39.0 44.487 25.2
263 1 Kolaghat D Kolaghat WB -
53.5 -5.189 65.3
264 1 Kolaghat D Kolaghat WB -
53.5 -5.189 65.3
265 1 DTPS-D ASP 21.0 5.638 23.5
266 1 DTPS-D Kalipahari 16.1 2.546 18
267 1 DTPS-D Kalipahari 16.1 2.546 18
268 1 DTPS-D ASP 21.0 5.638 23.5
269 1 Kharagpur D Kolaghat D -
25.8 1.75 28.6
270 1 Kharagpur D Kolaghat D -
25.8 1.75 28.6
271 1 Kolaghat D Kolaghat Tap 31.5 10.558 35.7
272 1 Kolaghat D Howrah D 7.6 2.583 10
273 1 Howrah D Belmuri D -2.1 3.419 6.7
274 1 Howrah D Belmuri D -2.1 3.419 6.7
275 1 Belmuri D Burdwan -9.9 2.383 12
276 1 Belmuri D Burdwan -9.9 2.383 12
277 1 Burdwan DTPS-D -
35.5 8.668 40.7
278 1 Burdwan DTPS-D -
35.5 8.668 40.7
279 1 Kalipahari Klyaneshwari -9.7 -6.492 14.4
280 1 Kalipahari Klyaneshwari -9.7 -6.492 14.4
281 2 Purulia D Jamshedpur 0.9 3.603 7.4
282 1 Jamur DTPS-D -
42.7 10.651 48.1
283 1 DTPS-D Ramkanali D 5.6 -2.093 7.3

Web based Protection Database and Desktop based Protection setting calculation tool – ERPC
208 PRDC Bangalore January 2017
Sl.No
No. of Ckts.
From Station To Station
Power Flow (Forward) %
Loading Owned by
MW MVAr
284 1 SonicTD Barjora -
56.9 -2.132 61
285 1 Kolaghat Tap Howrah D -5.1 -0.612 5.7
286 1 Kolaghat Tap Badrinarayan AS 36.4 11.656 41.5
287 2 DPL DTPS-D -1.4 -
29.241 15.8 DVC/DPL
288 1 B. Garden SRS 0.0 0 0
CESC
289 1 B. Garden SRS 0.0 0 0
290 1 SRS Majerhat 0.0 0 0
291 1 SRS Majerhat -
28.1 0.287 28.4
292 1 Majerhat Taratala -
16.7 -
12.342 15.9
293 1 Majerhat Chakmir -
94.3 14.309 73.5
294 1 Majerhat Chakmir -
94.3 14.309 73.5
295 1 Majerhat Jadavpur 28.0 -4.086 21.6
296 1 PRS PLN 0.0 0 0
297 1 Taratala Chakmir -
103.9
18.667 81.2
298 1 Taratala Chakmir -
103.9
18.667 81.2
299 1 Taratala PRS 96.5 -
25.606 76.2
300 1 Taratala BBD Bag 94.5 -
23.381 74.3
301 1 Chakmir BBGS -
107.5
14.167 59.8
302 1 Chakmir BBGS -
107.5
14.167 59.8
303 1 Chakmir BBGS -
107.5
14.167 59.8
304 1 Chakmir BBGS -
107.5
14.167 59.8
305 1 EMSS PKL 72.3 21.377 49.8
306 1 Jadavpur EMSS -
72.1 14.7 59.6

Web based Protection Database and Desktop based Protection setting calculation tool – ERPC
209 PRDC Bangalore January 2017
Sl.No
No. of Ckts.
From Station To Station
Power Flow (Forward) %
Loading Owned by
MW MVAr
307 1 BBD Bag PRS 57.2 -
25.247 47.8
308 1 BBD Bag PRS -
37.1 -9.605 30.2
309 1 Titagarh Gen BT Road 0.0 0 0
310 1 Titagarh NCGS -
55.0 -1.437 57.5
311 1 NCGS BT Road 40.9 16.688 29.2
312 1 BT Road East Calcutta -
27.0 40.554 42.1
313 1 PRS PRS 0.0 0 0
314 1 East Calcutta EMSS 0.0 0 0
315 1 East Calcutta PRS -
116.2
45.757 96.9
316 1 EMSS Kasba -6.6 14.126 10.2
317 1 Park Circus PRS 62.1 -9.225 40.2
318 1 SRS SRS 0.0 0 0
319 1 B. Garden SRS 0.0 0 0
320 1 BT Road Dumdum -
25.8 19.099 24.1
321 1 Park Circus EMSS -
79.2 3.051 50.9
322 1 EMSS Patuli 26.0 3.022 18
323 1 NCGS BT Road 39.8 10.338 53.9
324 1 NCGS NCGS -
95.0 44.406 30.9
325 1 BBD Bag BBD Bag 0.0 0 0
326 1 Titagarh Titagarh 19.0 8.987 9.5
327 1 EMSS EMSS 131.
6 56.303 64.1
328 1 East Calcutta EMSS 0.0 0 6.8
329 1 EMSS Dumdum 64.0 -
28.018 45.2
330 1 EMSS Dumdum 0.0 0 0
331 1 BT Road BT Road 0.0 0 0
332 1 PRS Majerhat 0.0 0 0
333 1 Majerhat Majerhat -
47.1 12.999 21.2

Web based Protection Database and Desktop based Protection setting calculation tool – ERPC
210 PRDC Bangalore January 2017
Sl.No
No. of Ckts.
From Station To Station
Power Flow (Forward) %
Loading Owned by
MW MVAr
334 1 PLN PKL -
44.1 -26.67 15.1
335 1 East Calcutta East Calcutta 0.0 0 0
336 1 Jadavpur Jadavpur 0.0 0 0
337 1 EMSS EMSS 0.0 0 0
338 1 PRS PRS 0.0 0 0
339 1 EMSS PRS 37.1 3.299 25.5
340 1 Titagarh Titagarh Gen 64.2 30.788 32.2
341 1 BT Road Titagarh 79.5 1.289 51.8
342 1 SRS Majerhat 0.0 0 0
343 1 PRS PRS -
28.0 16.838 14.7
344 2 DPL DPLB 60.6 21.899 39.5
DPL
345 1 DPL DPLA 56.3 20.178 73.3
346 2 DPL DPLC 34.3 11.62 22.3
347 2 DPL DPLC 25.0 7.993 16.2
348 2 DPL DPLAB 42.2 1.888 25.9
349 2 DPLA DPL-Bamunara 44.4 16.071 29.2

Web based Protection Database and Desktop based Protection setting calculation tool – ERPC
211 PRDC Bangalore January 2017
ANNEXURE III – SHORT CIRCUITS STUDY RESULTS

Web based Protection Database and Desktop based Protection setting calculation tool – ERPC
212 PRDC Bangalore January 2017
Table H: State wise 3-Ph and SLG results of Eastern region grid
Sl. No Substation Name Rated
Voltage (kV)
3-Ph to Ground fault SLG fault
Fault MVA
Fault Current
(kA)
Fault MVA
Fault Current
(kA)
Bihar
1 Sasaram
765 10402.9 7.85 7896.8 5.96
400 14749.9 21.29 10806.4 15.60
132 2371.1 10.37 1606.1 7.03
2 Gaya
765 25181.8 19.01 17670.7 13.34
400 25422.7 36.70 18087.4 26.11
220 8463.8 22.21 8396.7 22.04
3 Purnea_PG
400 16749.0 24.18 10908.0 15.74
220 5469.0 14.35 5396.0 14.16
400 6606.0 9.54 9950.2 14.36
4 Purnea old_PG 220 5409.7 14.20 5205.3 13.66
132 2912.5 12.74 2692.8 11.78
5 Lakhisarai
400 11540.7 16.66 6959.6 10.05
132 2364.1 10.34 1571.8 6.88
132 3159.7 13.82 2595.8 11.35
6 Muzzafarpur_PG
400 16550.4 23.89 11470.2 16.56
220 7356.5 19.31 7557.9 19.83
132 713.0 3.12 715.8 3.13
7 Patna 400 17133.0 24.73 11310.2 16.33
220 7841.6 20.58 7275.0 19.09
8 kishanganj
400 13462.8 19.43 8042.2 11.61
220 3928.9 10.31 2841.1 7.46
132 1451.9 6.35 945.1 4.13
9 Banka_PG 400 15204.6 21.95 9924.0 14.32
132 3560.7 15.57 3036.2 13.28
10 Barh 400 16738.2 24.16 15222.5 21.97
132 2686.4 11.75 2644.3 11.57
11 Biharshariff_PG 400 20254.7 29.24 14636.8 21.13
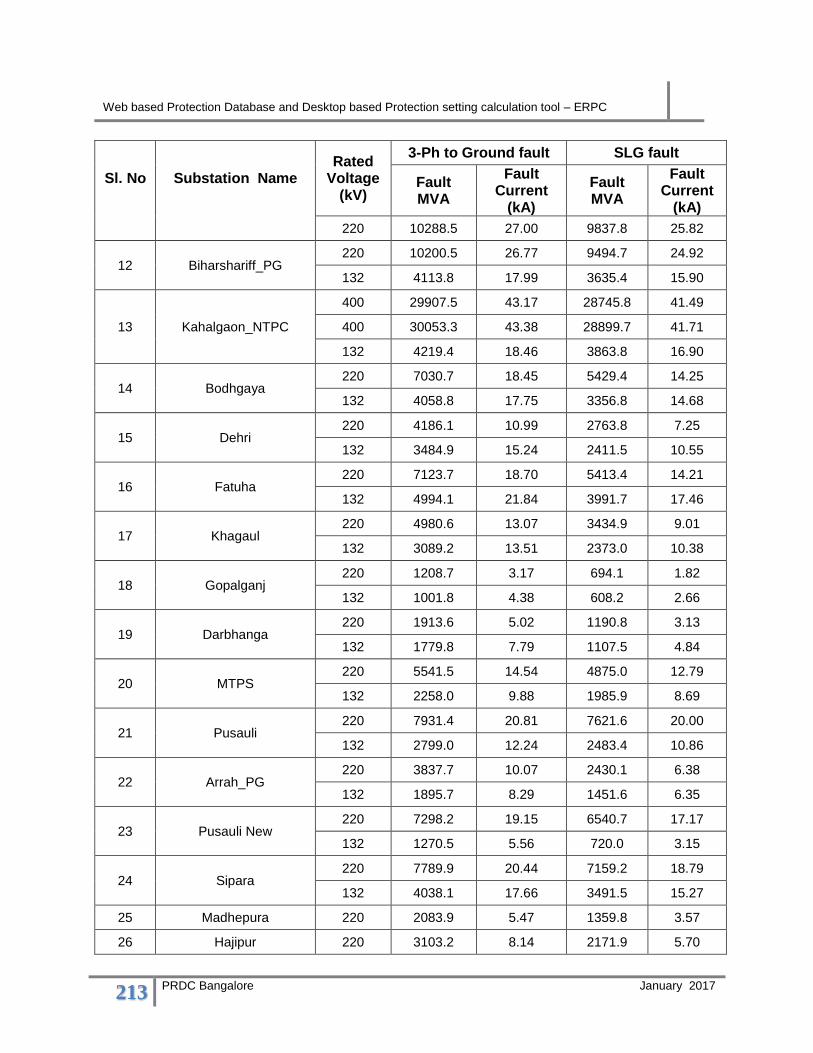
Web based Protection Database and Desktop based Protection setting calculation tool – ERPC
213 PRDC Bangalore January 2017
Sl. No Substation Name Rated
Voltage (kV)
3-Ph to Ground fault SLG fault
Fault MVA
Fault Current
(kA)
Fault MVA
Fault Current
(kA)
220 10288.5 27.00 9837.8 25.82
12 Biharshariff_PG 220 10200.5 26.77 9494.7 24.92
132 4113.8 17.99 3635.4 15.90
13 Kahalgaon_NTPC
400 29907.5 43.17 28745.8 41.49
400 30053.3 43.38 28899.7 41.71
132 4219.4 18.46 3863.8 16.90
14 Bodhgaya 220 7030.7 18.45 5429.4 14.25
132 4058.8 17.75 3356.8 14.68
15 Dehri 220 4186.1 10.99 2763.8 7.25
132 3484.9 15.24 2411.5 10.55
16 Fatuha 220 7123.7 18.70 5413.4 14.21
132 4994.1 21.84 3991.7 17.46
17 Khagaul 220 4980.6 13.07 3434.9 9.01
132 3089.2 13.51 2373.0 10.38
18 Gopalganj 220 1208.7 3.17 694.1 1.82
132 1001.8 4.38 608.2 2.66
19 Darbhanga 220 1913.6 5.02 1190.8 3.13
132 1779.8 7.79 1107.5 4.84
20 MTPS 220 5541.5 14.54 4875.0 12.79
132 2258.0 9.88 1985.9 8.69
21 Pusauli 220 7931.4 20.81 7621.6 20.00
132 2799.0 12.24 2483.4 10.86
22 Arrah_PG 220 3837.7 10.07 2430.1 6.38
132 1895.7 8.29 1451.6 6.35
23 Pusauli New 220 7298.2 19.15 6540.7 17.17
132 1270.5 5.56 720.0 3.15
24 Sipara 220 7789.9 20.44 7159.2 18.79
132 4038.1 17.66 3491.5 15.27
25 Madhepura 220 2083.9 5.47 1359.8 3.57
26 Hajipur 220 3103.2 8.14 2171.9 5.70

Web based Protection Database and Desktop based Protection setting calculation tool – ERPC
214 PRDC Bangalore January 2017
Sl. No Substation Name Rated
Voltage (kV)
3-Ph to Ground fault SLG fault
Fault MVA
Fault Current
(kA)
Fault MVA
Fault Current
(kA)
132 1728.2 7.56 1280.0 5.60
27 Begusarai 220 4106.4 10.78 2627.3 6.90
132 3033.3 13.27 2117.9 9.26
28 Banka 132 1736.4 7.60 1081.6 4.73
29 Kahalgaon 132 3356.3 14.68 2401.9 10.51
30 Muzzafarpur 132 1831.9 8.01 1337.1 5.85
31 Purnea 132 2869.6 12.55 2587.4 11.32
32 Sugauli 132 705.2 3.08 380.0 1.66
33 Lauriya 132 389.2 1.70 196.8 0.86
34 Sone nagar 132 2703.0 11.82 1621.4 7.09
35 Karmansa 132 1507.1 6.59 913.7 4.00
36 Jehanabad 132 1896.2 8.29 1069.0 4.68
37 Rafiganj 132 1464.5 6.41 792.6 3.47
38 Hathidah 132 2066.9 9.04 1226.0 5.36
39 Jamui 132 1916.1 8.38 1191.3 5.21
40 Sheikhpura 132 1811.7 7.92 1049.9 4.59
41 Nawada 132 629.5 2.75 335.0 1.47
42 Jamalpur 132 665.8 2.91 357.5 1.56
43 Sultanganj 132 2523.5 11.04 1574.8 6.89
44 Sabour 132 2857.8 12.50 1854.1 8.11
45 Dumraon 132 1226.1 5.36 667.4 2.92
46 Jakkanpur 132 3013.6 13.18 2058.2 9.00
47 Saharsa 132 832.4 3.64 457.6 2.00
48 Khagaria 132 242.3 1.06 116.4 0.51
49 Nuagachhia 132 3031.8 13.26 2116.3 9.26
50 Sitamarhi 132 697.7 3.05 379.0 1.66
51 Samastipur 132 2218.6 9.70 1360.2 5.95
52 Pandauli 132 828.9 3.63 431.2 1.89
53 Hajipur New 132 1767.2 7.73 1333.1 5.83
54 Chhapra 132 760.8 3.33 401.5 1.76

Web based Protection Database and Desktop based Protection setting calculation tool – ERPC
215 PRDC Bangalore January 2017
Sl. No Substation Name Rated
Voltage (kV)
3-Ph to Ground fault SLG fault
Fault MVA
Fault Current
(kA)
Fault MVA
Fault Current
(kA)
55 Siwan 132 736.1 3.22 396.8 1.74
56 Motihari 132 848.8 3.71 464.7 2.03
57 Betiah 132 773.3 3.38 413.7 1.81
58 Ramnagar 132 429.4 1.88 217.3 0.95
59 Rajgir 132 224.5 0.98 99.6 0.44
60 Darbhanga New 132 1775.5 7.77 1112.8 4.87
61 Katihar 132 962.0 4.21 563.9 2.47
62 Belaganj 132 1713.1 7.49 969.2 4.24
63 Vaishali 132 1419.9 6.21 887.9 3.88
64 Sitalpur 132 1365.0 5.97 830.3 3.63
65 Dhaka 132 700.8 3.07 375.1 1.64
66 Jainagar 132 715.3 3.13 367.0 1.61
67 Madhubani 132 735.3 3.22 373.7 1.63
68 Phulparas 132 1403.9 6.14 801.1 3.50
69 Supaul 132 1570.0 6.87 944.8 4.13
70 Mohania 132 1328.6 5.81 769.6 3.37
71 Bikramganj 132 1129.9 4.94 610.8 2.67
72 Forbeshganj 132 1114.3 4.87 598.7 2.62
73 Udakishanganj 132 396.2 1.73 211.1 0.92
74 Baripahari 132 3672.1 16.06 2824.3 12.35
75 Banjari 132 835.3 3.65 447.1 1.96
76 KCL 132 818.9 3.58 437.7 1.91
77 Kataiya 132 1108.2 4.85 597.2 2.61
78 Barauni TPS 132 2252.8 9.85 1422.9 6.22
79 Kudra 132 1475.9 6.46 827.4 3.62
80 Chandauti 132 3605.0 15.77 2532.1 11.08
81 Kochas 132 1374.6 6.01 753.5 3.30
82 Balmikinagar 132 236.7 1.04 118.5 0.52
83 Masaurhi 132 1779.1 7.78 1014.0 4.44
84 Bihta 132 2021.0 8.84 1303.8 5.70

Web based Protection Database and Desktop based Protection setting calculation tool – ERPC
216 PRDC Bangalore January 2017
Sl. No Substation Name Rated
Voltage (kV)
3-Ph to Ground fault SLG fault
Fault MVA
Fault Current
(kA)
Fault MVA
Fault Current
(kA)
85 Gaighat 132 2699.1 11.81 1717.8 7.51
86 Mithapur 132 3018.1 13.20 2059.6 9.01
87 Rafiganj_R 132 1260.6 5.51 674.8 2.95
88 Arrah 132 1734.6 7.59 1268.5 5.55
89 Lakhisarai 132 1768.3 7.73 1083.7 4.74
90 Raxaul 132 454.5 1.99 233.0 1.02
91 Runisaudpur 132 813.9 3.56 457.9 2.00
92 SKMCH 132 1576.5 6.90 1087.1 4.76
93 Buxar 132 831.8 3.64 440.5 1.93
94 Aurangabad 132 1141.2 4.99 610.1 2.67
95 Tekari 132 1023.5 4.48 549.6 2.40
96 Goh 132 659.5 2.88 340.5 1.49
97 Arwal 132 826.8 3.62 428.7 1.88
98 Hulasganj 132 1340.9 5.87 778.9 3.41
99 Wajirganj 132 1037.9 4.54 575.7 2.52
100 Nalanda 132 515.3 2.25 259.5 1.14
101 Ekanagarsarai 132 1419.3 6.21 832.4 3.64
102 Digha 132 1941.4 8.49 1230.4 5.38
103 Katra 132 1651.6 7.22 940.0 4.11
104 Gangawara 132 1277.4 5.59 728.7 3.19
105 Madhepura 132 1670.4 7.31 1142.1 5.00
106 Sonbarsa 132 555.1 2.43 303.7 1.33
107 Mashrakh 132 584.4 2.56 316.8 1.39
108 Dalsingsarai 132 1570.3 6.87 887.2 3.88
109 Kusheshwarnath 132 525.2 2.30 275.7 1.21
110 Jagdispur 132 865.0 3.78 508.3 2.22
111 harbauth 132 1730.1 7.57 977.1 4.27
112 Jandaha 132 1163.7 5.09 665.8 2.91
113 Imamganj 132 638.8 2.79 340.2 1.49
114 Tetha 132 2454.3 10.74 1496.9 6.55

Web based Protection Database and Desktop based Protection setting calculation tool – ERPC
217 PRDC Bangalore January 2017
Sl. No Substation Name Rated
Voltage (kV)
3-Ph to Ground fault SLG fault
Fault MVA
Fault Current
(kA)
Fault MVA
Fault Current
(kA)
115 Sherghati tap 132 1120.9 4.90 626.9 2.74
116 Sherghati 132 692.1 3.03 370.5 1.62
117 Paharpur 132 1508.7 6.60 881.0 3.85
118 Ekma 132 664.9 2.91 347.3 1.52
119 Rail Pahiya karkhana 132 877.4 3.84 495.3 2.17
Jharkhand
120 Ranchi New_PG 765 18278.9 13.80 12577.4 9.49
400 22861.8 33.00 14387.5 20.77
121 Jamshedpur_PG 400 21274.5 30.71 18004.6 25.99
220 6104.9 16.02 6352.5 16.67
122 Maithon
400 32198.7 46.48 25377.9 36.63
400 31938.6 46.10 25223.8 36.41
220 9527.6 25.00 9618.4 25.24
123 MPL 400 21155.1 30.54 18581.9 26.82
124 Chaibasa_PG 400 13887.9 20.05 8998.4 12.99
220 3698.2 9.71 3231.6 8.48
125 Koderma_D
400 16982.6 24.51 15803.0 22.81
220 4815.3 12.64 5358.5 14.06
132 2201.8 9.63 2237.2 9.79
126 Ranchi_PG 400 26656.2 38.48 16932.2 24.44
220 3977.2 10.44 4087.8 10.73
127 Chandawa 400 16005.4 23.10 9186.5 13.26
128 Adhunik 400 21185.6 30.58 17927.2 25.88
129 TISCO 400 10430.9 15.06 8257.8 11.92
132 4815.1 21.06 5468.8 23.92
130 Ramchandrapur 220 6099.6 16.01 6334.2 16.62
132 2577.5 11.27 2410.3 10.54
131 Chandil 220 4383.8 11.50 3200.7 8.40
132 2865.6 12.53 2310.9 10.11
132 Hatia New 220 2910.7 7.64 2636.1 6.92

Web based Protection Database and Desktop based Protection setting calculation tool – ERPC
218 PRDC Bangalore January 2017
Sl. No Substation Name Rated
Voltage (kV)
3-Ph to Ground fault SLG fault
Fault MVA
Fault Current
(kA)
Fault MVA
Fault Current
(kA)
132 1703.3 7.45 1622.8 7.10
133 PTPS 220 2435.8 6.39 2415.9 6.34
132 1322.7 5.79 1292.3 5.65
134 TTPS 220 2378.6 6.24 2980.2 7.82
135 Lalmatia 220 1733.9 4.55 1214.8 3.19
132 2136.3 9.34 1376.3 6.02
136 Chaibasa 220 3659.0 9.60 3178.4 8.34
132 1526.8 6.68 1436.3 6.28
137 Dumka 220 3246.5 8.52 2069.4 5.43
132 1990.2 8.71 1474.1 6.45
138 CTPS old 220 7346.1 19.28 7087.6 18.60
132 3857.0 16.87 3478.1 15.21
139 Kalyanaswari 220 9443.3 24.78 8823.8 23.16
132 4990.9 21.83 5301.4 23.19
140 Jamshedpur_D 220 2552.7 6.70 2130.5 5.59
132 2097.1 9.17 2159.1 9.44
141 BTPS_D 220 6474.3 16.99 6739.8 17.69
132 2248.9 9.84 2184.1 9.55
142 CTPS New 220 7241.9 19.01 7190.6 18.87
143 Giridih 220 2045.5 5.37 1828.4 4.80
132 1586.3 6.94 1721.5 7.53
144 Dhanbad_D 220 5546.8 14.56 4677.9 12.28
132 984.8 4.31 953.5 4.17
145 Ramgarh 220 3120.6 8.19 2355.0 6.18
132 2107.1 9.22 1777.9 7.78
146 Garwah 132 660.1 2.89 340.1 1.49
147 Lahardaga 132 827.6 3.62 558.4 2.44
148 Gumla 132 611.2 2.67 368.0 1.61
149 Kamdara 132 570.4 2.50 334.8 1.46
150 Hatia old 132 952.3 4.17 702.9 3.07

Web based Protection Database and Desktop based Protection setting calculation tool – ERPC
219 PRDC Bangalore January 2017
Sl. No Substation Name Rated
Voltage (kV)
3-Ph to Ground fault SLG fault
Fault MVA
Fault Current
(kA)
Fault MVA
Fault Current
(kA)
151 Namkum 132 946.8 4.14 740.1 3.24
152 Jamatara 132 1341.5 5.87 776.1 3.40
153 Deoghar 132 1041.0 4.55 849.0 3.71
154 Dumka 132 1972.1 8.63 1444.8 6.32
155 Goelkhera 132 513.3 2.25 278.9 1.22
156 Kendposi 132 1005.5 4.40 946.1 4.14
157 Manique 132 2685.7 11.75 2081.3 9.10
158 Adityapur 132 2513.9 11.00 2048.6 8.96
159 Golmuri 132 1408.1 6.16 850.5 3.72
160 Jaduguda 132 803.1 3.51 439.9 1.92
161 Rajkharsawa 132 1597.3 6.99 1073.0 4.69
162 Noamundi 132 594.7 2.60 408.5 1.79
163 Sikidiri 132 772.3 3.38 515.6 2.26
164 Chakradharpur 132 863.3 3.78 494.9 2.17
165 Bakaspur 132 473.5 2.07 269.8 1.18
166 Kanke 132 900.3 3.94 681.0 2.98
167 Chaibasa 132 1159.4 5.07 791.0 3.46
168 Latehar 132 528.3 2.31 327.1 1.43
169 Japla 132 800.6 3.50 410.5 1.80
170 Sahebganj 132 607.8 2.66 324.5 1.42
171 Pakur 132 384.8 1.68 197.2 0.86
172 Hazaribag 132 855.3 3.74 542.7 2.37
173 Daltonganj 132 374.1 1.64 221.2 0.97
174 Kendposi FD 132 959.3 4.20 867.5 3.80
175 Tamar 132 647.7 2.83 353.2 1.55
176 Madhupur 132 715.5 3.13 385.5 1.69
177 Manoharpur 132 457.0 2.00 246.0 1.08
178 ECR-Gomia 132 1650.1 7.22 1274.0 5.57
179 Patratu 132 1205.2 5.27 957.3 4.19
180 Mosabani 132 1349.0 5.90 1171.5 5.12

Web based Protection Database and Desktop based Protection setting calculation tool – ERPC
220 PRDC Bangalore January 2017
Sl. No Substation Name Rated
Voltage (kV)
3-Ph to Ground fault SLG fault
Fault MVA
Fault Current
(kA)
Fault MVA
Fault Current
(kA)
181 Maithon 132 4882.1 21.35 4936.9 21.59
182 Kumardubi 132 3570.8 15.62 3005.3 13.15
183 Panchet 132 3368.4 14.73 2838.1 12.41
184 Patherdih 132 2821.3 12.34 1849.9 8.09
185 Putki 132 3233.9 14.15 2385.5 10.43
186 Nimiaghat 132 1703.8 7.45 1650.1 7.22
187 Barhi 132 1889.7 8.27 1566.4 6.85
188 Koderma 132 1494.3 6.54 1233.2 5.39
189 Konar 132 1334.0 5.84 997.7 4.36
190 North karanpur_D 132 819.6 3.59 544.4 2.38
191 Gola 132 2256.5 9.87 1919.0 8.39
192 Hazaribag 132 1036.4 4.53 660.7 2.89
193 Ramkanali_D 132 2709.3 11.85 1961.7 8.58
194 Manique_D_SW 132 1450.1 6.34 976.0 4.27
195 Biada_D 132 2485.1 10.87 1736.9 7.60
196 BSL_D 132 2120.2 9.27 1797.3 7.86
197 Balihari_D 132 3184.9 13.93 2329.9 10.19
Odisha
198 Angul_PG 765 23614.0 17.82 20001.8 15.10
400 28569.8 41.24 24499.7 35.36
199 Jharsuguda_PG 765 28314.9 21.37 19521.8 14.73
400 22238.5 32.10 15346.9 22.15
200 Jaypore_PG 400 4162.0 6.01 4214.9 6.08
220 4389.4 11.52 5076.4 13.32
201 Indravati_PG 400 3946.9 5.70 4124.1 5.95
202 Indravati_Hydro 400 3883.0 5.61 4137.0 5.97
203 Rengali_PG 400 19512.2 28.16 15939.5 23.01
220 9111.4 23.91 9239.9 24.25
204 GMR_3rd 400 19148.8 27.64 17253.3 24.90
205 STPS 400 28894.8 41.71 30883.6 44.58

Web based Protection Database and Desktop based Protection setting calculation tool – ERPC
221 PRDC Bangalore January 2017
Sl. No Substation Name Rated
Voltage (kV)
3-Ph to Ground fault SLG fault
Fault MVA
Fault Current
(kA)
Fault MVA
Fault Current
(kA)
220 11492.2 30.16 11103.4 29.14
206 Bisra 400 23544.0 33.98 15380.8 22.20
220 7677.1 20.15 7511.7 19.71
207 Baripada
400 9659.2 13.94 7428.7 10.72
220 4372.7 11.48 4665.1 12.24
132 1721.1 7.53 1873.8 8.20
208 Meramundali
400 27108 39.01 24817.48 35.82
220 8989 23.59 8557 22.45
132 2616 11.44 2647 11.57
220 12163 31.92 12284 32.23
209 Sterlite
400 5805.8 8.38 5789.9 8.36
400 3319.9 4.79 3273.4 4.73
220 9022.9 23.68 8958.9 23.51
210 Dubri New 400 9906.4 14.30 8256.9 11.92
220 8166.3 21.43 8754.7 22.98
211 Keonjhar 400 5966.6 8.61 4670.1 6.74
220 2793.2 7.33 3020.9 7.93
212 Bolangir 400 4216.3 6.09 3702.0 5.34
220 3214.0 8.43 3520.7 9.24
213 Ind Bharat 400 9680.9 13.97 5001.8 7.22
214 JITPL 400 12960.1 18.71 13426.2 19.38
215 GMR 400 18677.3 26.96 16052.3 23.17
216 Mendhasal
400 3087.8 4.46 3537.2 5.11
220 2235.6 5.87 2878.3 7.55
132 576.8 2.52 637.8 2.79
217 JSPL 400 15845.7 22.87 14757.2 21.30
218 Pandiabil 400 3299.0 4.76 3794.4 5.48
220 2632.4 6.91 3299.3 8.66
219 RSP 220 5891.6 15.46 4526.5 11.88
132 3629.3 15.87 3723.9 16.29
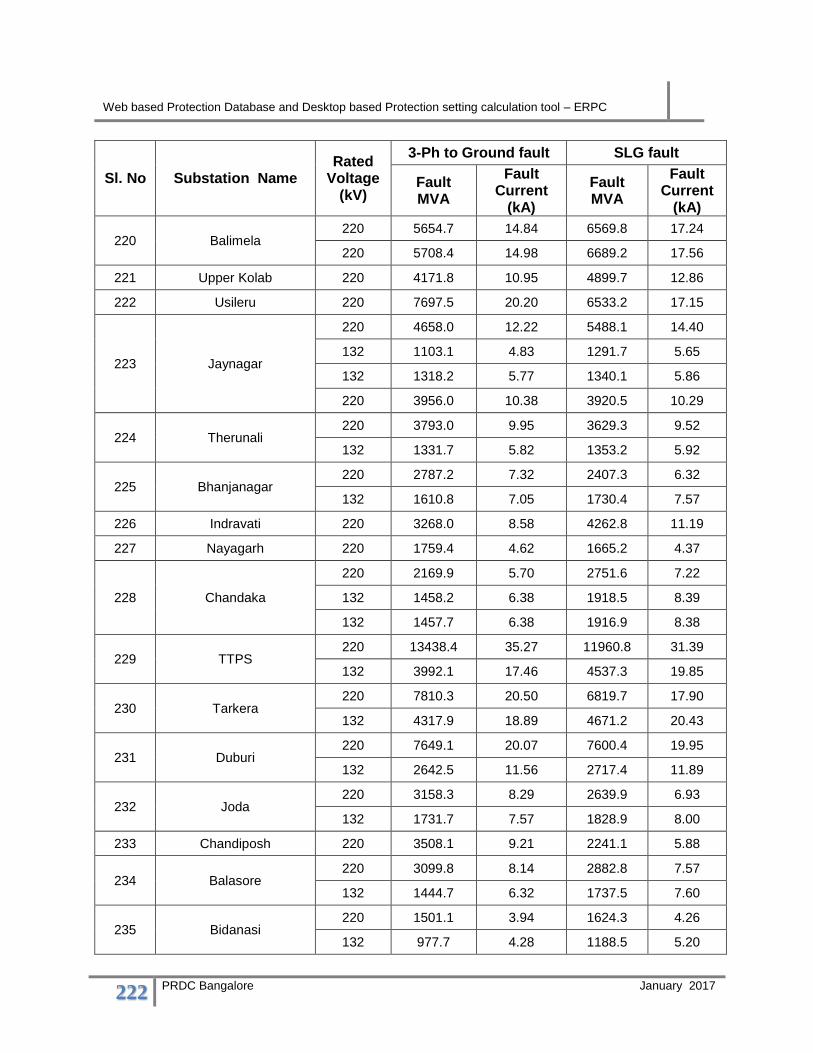
Web based Protection Database and Desktop based Protection setting calculation tool – ERPC
222 PRDC Bangalore January 2017
Sl. No Substation Name Rated
Voltage (kV)
3-Ph to Ground fault SLG fault
Fault MVA
Fault Current
(kA)
Fault MVA
Fault Current
(kA)
220 Balimela 220 5654.7 14.84 6569.8 17.24
220 5708.4 14.98 6689.2 17.56
221 Upper Kolab 220 4171.8 10.95 4899.7 12.86
222 Usileru 220 7697.5 20.20 6533.2 17.15
223 Jaynagar
220 4658.0 12.22 5488.1 14.40
132 1103.1 4.83 1291.7 5.65
132 1318.2 5.77 1340.1 5.86
220 3956.0 10.38 3920.5 10.29
224 Therunali 220 3793.0 9.95 3629.3 9.52
132 1331.7 5.82 1353.2 5.92
225 Bhanjanagar 220 2787.2 7.32 2407.3 6.32
132 1610.8 7.05 1730.4 7.57
226 Indravati 220 3268.0 8.58 4262.8 11.19
227 Nayagarh 220 1759.4 4.62 1665.2 4.37
228 Chandaka
220 2169.9 5.70 2751.6 7.22
132 1458.2 6.38 1918.5 8.39
132 1457.7 6.38 1916.9 8.38
229 TTPS 220 13438.4 35.27 11960.8 31.39
132 3992.1 17.46 4537.3 19.85
230 Tarkera 220 7810.3 20.50 6819.7 17.90
132 4317.9 18.89 4671.2 20.43
231 Duburi 220 7649.1 20.07 7600.4 19.95
132 2642.5 11.56 2717.4 11.89
232 Joda 220 3158.3 8.29 2639.9 6.93
132 1731.7 7.57 1828.9 8.00
233 Chandiposh 220 3508.1 9.21 2241.1 5.88
234 Balasore 220 3099.8 8.14 2882.8 7.57
132 1444.7 6.32 1737.5 7.60
235 Bidanasi 220 1501.1 3.94 1624.3 4.26
132 977.7 4.28 1188.5 5.20
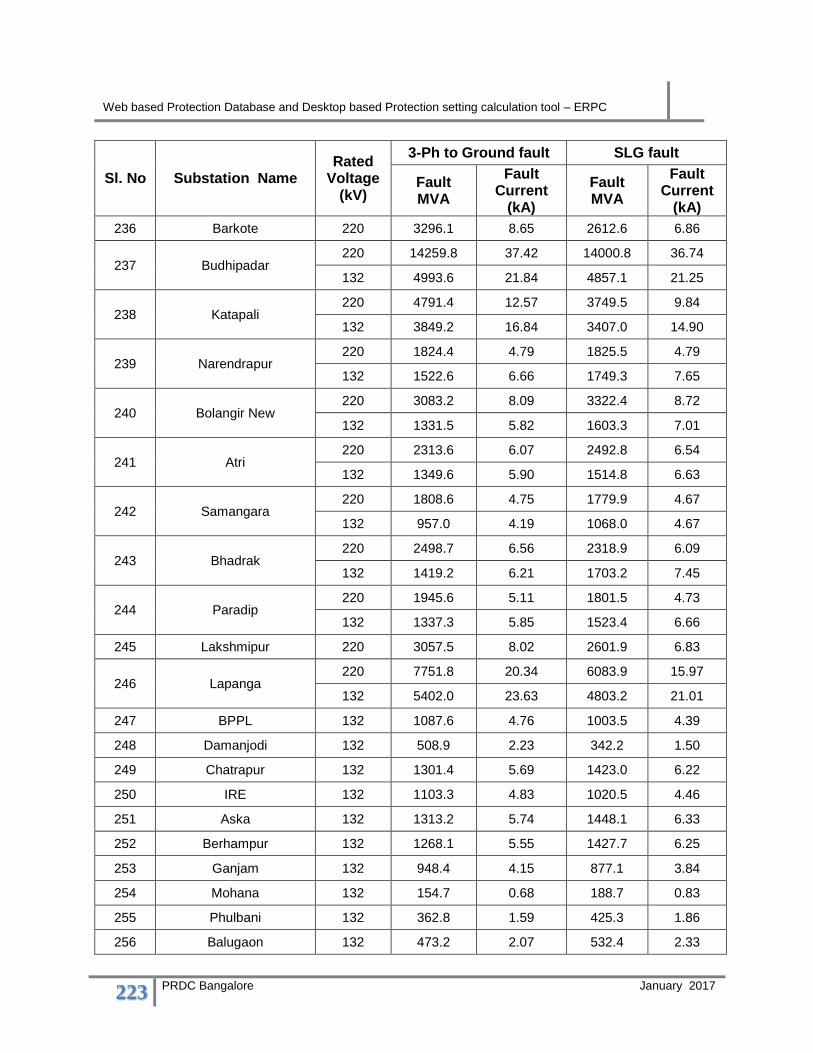
Web based Protection Database and Desktop based Protection setting calculation tool – ERPC
223 PRDC Bangalore January 2017
Sl. No Substation Name Rated
Voltage (kV)
3-Ph to Ground fault SLG fault
Fault MVA
Fault Current
(kA)
Fault MVA
Fault Current
(kA)
236 Barkote 220 3296.1 8.65 2612.6 6.86
237 Budhipadar 220 14259.8 37.42 14000.8 36.74
132 4993.6 21.84 4857.1 21.25
238 Katapali 220 4791.4 12.57 3749.5 9.84
132 3849.2 16.84 3407.0 14.90
239 Narendrapur 220 1824.4 4.79 1825.5 4.79
132 1522.6 6.66 1749.3 7.65
240 Bolangir New 220 3083.2 8.09 3322.4 8.72
132 1331.5 5.82 1603.3 7.01
241 Atri 220 2313.6 6.07 2492.8 6.54
132 1349.6 5.90 1514.8 6.63
242 Samangara 220 1808.6 4.75 1779.9 4.67
132 957.0 4.19 1068.0 4.67
243 Bhadrak 220 2498.7 6.56 2318.9 6.09
132 1419.2 6.21 1703.2 7.45
244 Paradip 220 1945.6 5.11 1801.5 4.73
132 1337.3 5.85 1523.4 6.66
245 Lakshmipur 220 3057.5 8.02 2601.9 6.83
246 Lapanga 220 7751.8 20.34 6083.9 15.97
132 5402.0 23.63 4803.2 21.01
247 BPPL 132 1087.6 4.76 1003.5 4.39
248 Damanjodi 132 508.9 2.23 342.2 1.50
249 Chatrapur 132 1301.4 5.69 1423.0 6.22
250 IRE 132 1103.3 4.83 1020.5 4.46
251 Aska 132 1313.2 5.74 1448.1 6.33
252 Berhampur 132 1268.1 5.55 1427.7 6.25
253 Ganjam 132 948.4 4.15 877.1 3.84
254 Mohana 132 154.7 0.68 188.7 0.83
255 Phulbani 132 362.8 1.59 425.3 1.86
256 Balugaon 132 473.2 2.07 532.4 2.33

Web based Protection Database and Desktop based Protection setting calculation tool – ERPC
224 PRDC Bangalore January 2017
Sl. No Substation Name Rated
Voltage (kV)
3-Ph to Ground fault SLG fault
Fault MVA
Fault Current
(kA)
Fault MVA
Fault Current
(kA)
257 Khurda 132 375.0 1.64 481.3 2.11
258 Puri 132 799.4 3.50 957.2 4.19
259 Cuttack 132 524.3 2.29 652.1 2.85
260 Nimapada 132 884.8 3.87 1046.7 4.58
261 Bhubaneswar 132 1330.2 5.82 1675.7 7.33
262 Chowdhwar 132 1507.8 6.60 1683.1 7.36
263 Dhenkanal 132 717.5 3.14 828.3 3.62
264 Chainpal 132 3527.1 15.43 3719.3 16.27
265 Angul 132 2267.2 9.92 2194.9 9.60
266 Nandira (MCL) 132 1430.8 6.26 1027.8 4.50
267 Nuapatna 132 479.4 2.10 544.7 2.38
268 BAMINPL 132 1141.8 4.99 730.3 3.19
269 Jajpur Road 132 1878.0 8.21 1842.2 8.06
270 Kendrapara 132 820.5 3.59 982.4 4.30
271 Jaleswar 132 479.6 2.10 557.7 2.44
272 Baripada 132 1195.0 5.23 1301.2 5.69
273 Rairangpur 132 625.7 2.74 643.4 2.81
274 Palaspanga 132 744.4 3.26 817.4 3.58
275 Nalda_R 132 528.3 2.31 441.5 1.93
276 Rourkela 132 3923.6 17.16 4006.2 17.52
277 Grid_Steel 132 1549.1 6.78 1764.6 7.72
278 Jharsuguda 132 3813.9 16.68 3503.6 15.32
279 Brajrajnagar 132 2084.8 9.12 1746.4 7.64
280 Rajgangpur 132 2783.5 12.18 2749.5 12.03
281 Sambalpur 132 2082.1 9.11 1868.1 8.17
282 Burla 132 5026.6 21.99 5277.7 23.08
283 Somnathpur 132 1329.0 5.81 1456.3 6.37
284 Bolangir 132 1331.5 5.82 1603.3 7.01
285 Saintala 132 619.5 2.71 594.0 2.60
286 Khariar 132 233.9 1.02 308.3 1.35

Web based Protection Database and Desktop based Protection setting calculation tool – ERPC
225 PRDC Bangalore January 2017
Sl. No Substation Name Rated
Voltage (kV)
3-Ph to Ground fault SLG fault
Fault MVA
Fault Current
(kA)
Fault MVA
Fault Current
(kA)
287 Tentulikhunti 132 451.9 1.98 508.4 2.22
288 Kalugaon 132 2017.8 8.83 1736.6 7.60
289 Dighapahari 132 580.8 2.54 604.8 2.65
290 Jagatsinghpur 132 472.9 2.07 507.3 2.22
291 Marshaghai 132 832.4 3.64 903.5 3.95
292 Rairakhol 132 281.5 1.23 288.3 1.26
293 FAP_Joda 132 1664.2 7.28 1683.0 7.36
294 Junagarh 132 199.2 0.87 260.4 1.14
295 Sundargarh 132 1795.4 7.85 1319.5 5.77
296 Boinda 132 729.6 3.19 712.0 3.11
297 Chend 132 3376.6 14.77 3277.9 14.34
298 Chandikhol 132 486.8 2.13 549.0 2.40
299 Umerkote 132 228.7 1.00 276.0 1.21
300 Soro 132 661.3 2.89 728.3 3.19
301 Pattamundai 132 590.4 2.58 648.6 2.84
302 Akhusingarh 132 195.1 0.85 245.4 1.07
303 HM Switch
(Kharagprasad) 132 2524.3 11.04 2403.1 10.51
304 Paralakhemundi 132 142.6 0.62 182.6 0.80
305 Sonepur 132 467.2 2.04 535.3 2.34
306 Ranasinghpur 132 788.0 3.45 988.5 4.32
307 Kalarangi 132 1459.7 6.39 1258.3 5.50
308 Kamakhyanagar 132 1436.6 6.28 1212.9 5.31
309 Jajpur 132 618.0 2.70 718.3 3.14
310 Bolani 132 852.6 3.73 769.2 3.36
311 Sunabeda 132 541.8 2.37 574.2 2.51
312 Patnagarh 132 590.2 2.58 680.1 2.98
313 Padampur 132 361.6 1.58 356.4 1.56
314 Bolangir 132 1268.2 5.55 1513.5 6.62
315 EMAMI 132 1278.0 5.59 1345.8 5.89
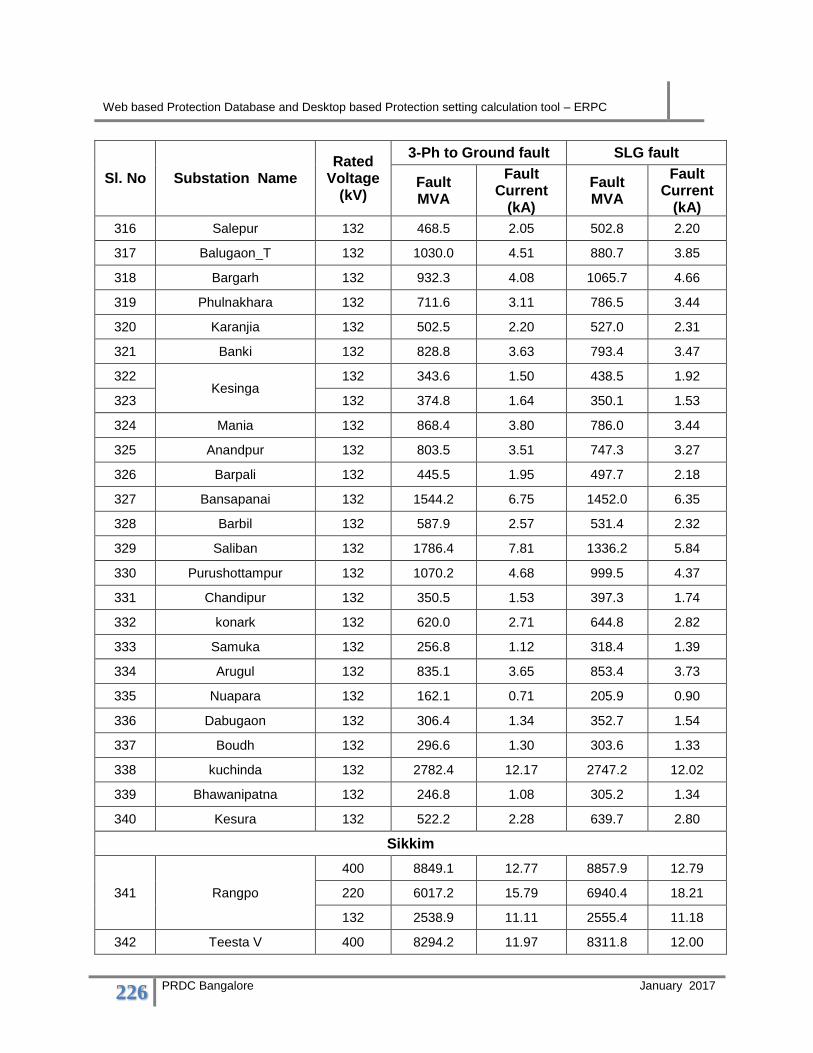
Web based Protection Database and Desktop based Protection setting calculation tool – ERPC
226 PRDC Bangalore January 2017
Sl. No Substation Name Rated
Voltage (kV)
3-Ph to Ground fault SLG fault
Fault MVA
Fault Current
(kA)
Fault MVA
Fault Current
(kA)
316 Salepur 132 468.5 2.05 502.8 2.20
317 Balugaon_T 132 1030.0 4.51 880.7 3.85
318 Bargarh 132 932.3 4.08 1065.7 4.66
319 Phulnakhara 132 711.6 3.11 786.5 3.44
320 Karanjia 132 502.5 2.20 527.0 2.31
321 Banki 132 828.8 3.63 793.4 3.47
322 Kesinga
132 343.6 1.50 438.5 1.92
323 132 374.8 1.64 350.1 1.53
324 Mania 132 868.4 3.80 786.0 3.44
325 Anandpur 132 803.5 3.51 747.3 3.27
326 Barpali 132 445.5 1.95 497.7 2.18
327 Bansapanai 132 1544.2 6.75 1452.0 6.35
328 Barbil 132 587.9 2.57 531.4 2.32
329 Saliban 132 1786.4 7.81 1336.2 5.84
330 Purushottampur 132 1070.2 4.68 999.5 4.37
331 Chandipur 132 350.5 1.53 397.3 1.74
332 konark 132 620.0 2.71 644.8 2.82
333 Samuka 132 256.8 1.12 318.4 1.39
334 Arugul 132 835.1 3.65 853.4 3.73
335 Nuapara 132 162.1 0.71 205.9 0.90
336 Dabugaon 132 306.4 1.34 352.7 1.54
337 Boudh 132 296.6 1.30 303.6 1.33
338 kuchinda 132 2782.4 12.17 2747.2 12.02
339 Bhawanipatna 132 246.8 1.08 305.2 1.34
340 Kesura 132 522.2 2.28 639.7 2.80
Sikkim
341 Rangpo
400 8849.1 12.77 8857.9 12.79
220 6017.2 15.79 6940.4 18.21
132 2538.9 11.11 2555.4 11.18
342 Teesta V 400 8294.2 11.97 8311.8 12.00

Web based Protection Database and Desktop based Protection setting calculation tool – ERPC
227 PRDC Bangalore January 2017
Sl. No Substation Name Rated
Voltage (kV)
3-Ph to Ground fault SLG fault
Fault MVA
Fault Current
(kA)
Fault MVA
Fault Current
(kA)
343 Jorethang 220 3817.2 10.02 3491.4 9.16
344 New Melli 220 3684.4 9.67 3152.2 8.27
345 Chuzachen 132 1700.4 7.44 1725.9 7.55
346 Rangit 132 1792.1 7.84 1552.2 6.79
66 147.0 1.29 145.1 1.27
347 Sagbari 132 1774.9 7.76 1523.6 6.66
348 Geyzing 132 1087.3 4.76 737.5 3.23
66 243.0 2.13 205.9 1.80
349 Gangtok 132 1267.8 5.55 960.6 4.20
66 490.6 4.29 470.7 4.12
350 Melli 132 1040.8 4.55 644.2 2.82
66 484.4 4.24 374.5 3.28
351 Melli 66 482.4 4.22 372.3 3.26
352 Tadong 66 375.9 3.29 316.0 2.76
353 Bulbuley 66 365.6 3.20 304.1 2.66
354 Sichey 66 358.9 3.14 296.5 2.59
355 Rongly 66 175.0 1.53 117.7 1.03
356 Mamring 66 238.9 2.09 163.7 1.43
357 Namchi 66 285.5 2.50 209.7 1.84
358 Rabangla 66 122.1 1.07 108.2 0.95
359 Rothak 66 173.3 1.52 115.9 1.01
360 Soreng 66 140.5 1.23 93.0 0.81
361 Lower LHP 66 470.9 4.12 449.7 3.93
362 Phodong 66 208.7 1.83 151.2 1.32
363 Geyzing 66 243.0 2.13 205.6 1.80
364 Purano Namchi 66 214.0 1.87 145.2 1.27
365 Pakyong 66 308.3 2.70 222.1 1.94
366 Pelling 66 229.4 2.01 190.5 1.67
367 Rhenock 66 139.6 1.22 92.5 0.81
368 Mangan 66 138.4 1.21 95.4 0.83

Web based Protection Database and Desktop based Protection setting calculation tool – ERPC
228 PRDC Bangalore January 2017
Sl. No Substation Name Rated
Voltage (kV)
3-Ph to Ground fault SLG fault
Fault MVA
Fault Current
(kA)
Fault MVA
Fault Current
(kA)
369 Rnipool 66 473.3 4.14 452.2 3.96
370 Topakhani 66 260.9 2.28 198.7 1.74
371 Meyong 66 115.0 1.01 78.1 0.68
372 Rongli 66 158.7 1.39 105.9 0.93
West Bengal
373 Jeerat
400 10261.2 14.81 9703.4 14.01
220 8635.1 22.66 9777.9 25.66
132 4400.2 19.25 5094.1 22.28
374 Arambag
400 12692.0 18.32 11055.4 15.96
220 8103.8 21.27 9114.9 23.92
132 3131.2 13.70 3869.7 16.93
375 Durgapur 400 14484.6 20.91 12134.4 17.51
376 Kharagpur
400 8950.8 12.92 7186.2 10.37
220 4785.1 12.56 5261.1 13.81
132 1668.4 7.30 1989.2 8.70
377 Raghunathpur 400 19280.5 27.83 15968.6 23.05
378 Purullia pump storage 400 9800.5 14.15 9864.2 14.24
379 Bidhannagar
400 21978.4 31.72 17065.4 24.63
220 13268.5 34.82 13621.0 35.75
132 4799.0 20.99 5452.1 23.85
380 Kolaghat
400 14476.2 20.90 13860.5 20.01
220 6984.9 18.33 8347.9 21.91
132 2894.9 12.66 3592.8 15.71
381 Bakreswar 400 8755.2 12.64 8667.1 12.51
220 10179.9 26.72 11033.3 28.96
382 sagardighi 400 17046.8 24.61 14716.6 21.24
220 5769.6 15.14 6142.4 16.12
383 Haldia 400 6186.6 8.93 6359.0 9.18
384 Parulia 400 24895.5 35.93 19248.9 27.78
400 24895.1 35.93 19249.9 27.79

Web based Protection Database and Desktop based Protection setting calculation tool – ERPC
229 PRDC Bangalore January 2017
Sl. No Substation Name Rated
Voltage (kV)
3-Ph to Ground fault SLG fault
Fault MVA
Fault Current
(kA)
Fault MVA
Fault Current
(kA)
220 10336.7 27.13 10393.5 27.28
220 10336.7 27.13 10393.5 27.28
385 Malda
400 16733.8 24.15 12517.1 18.07
220 5119.4 13.44 5593.6 14.68
132 1852.1 8.10 2298.3 10.05
386 Binaguri 400 21805.5 31.47 15470.2 22.33
220 7199.3 18.89 7621.5 20.00
387 Subhasgarm_PG 400 8005.9 11.56 8511.8 12.29
220 6752.5 17.72 8311.1 21.81
388 Mejia 400 15793.1 22.80 14397.1 20.78
389 Farakka 400 29277.9 42.26 29135.7 42.05
220 4829.0 12.67 5413.5 14.21
390 Dharampur 220 5111.4 13.41 4664.1 12.24
132 4404.8 19.27 4230.7 18.50
391 Domjur 220 2677.9 7.03 2828.5 7.42
132 1127.8 4.93 1490.4 6.52
392 Gokarna 220 5273.5 13.84 5247.2 13.77
132 2678.1 11.71 3398.2 14.86
393 Howrah 220 2610.8 6.85 2828.6 7.42
132 1957.6 8.56 2533.9 11.08
394 Kasba 220 5759.1 15.11 6101.9 16.01
132 3795.9 16.60 4950.1 21.65
395 Laxmikantapur 220 2940.7 7.72 3057.7 8.02
132 1586.9 6.94 2059.5 9.01
396 Midnapur 220 4123.7 10.82 4016.8 10.54
132 1953.5 8.54 2436.1 10.66
397 New Jalpaigudi 220 6183.4 16.23 6162.9 16.17
132 3033.8 13.27 3622.6 15.85
398 New Haldia 220 3200.3 8.40 2872.4 7.54
132 2164.6 9.47 2414.6 10.56

Web based Protection Database and Desktop based Protection setting calculation tool – ERPC
230 PRDC Bangalore January 2017
Sl. No Substation Name Rated
Voltage (kV)
3-Ph to Ground fault SLG fault
Fault MVA
Fault Current
(kA)
Fault MVA
Fault Current
(kA)
399 Rishra 220 3804.6 9.99 3620.1 9.50
132 1484.1 6.49 1969.9 8.62
400 Satgachia 220 4821.6 12.65 4265.9 11.20
132 2511.6 10.99 2917.1 12.76
401 Santhaldih 220 4944.9 12.98 5205.9 13.66
132 1322.4 5.78 1439.0 6.29
402 Asansol 220 2411.3 6.33 2246.8 5.90
132 1377.0 6.02 1630.1 7.13
403 krishnagar 220 3288.0 8.63 3112.5 8.17
132 1317.8 5.76 1700.4 7.44
404 Bisnupur 220 3898.4 10.23 3784.5 9.93
132 1897.2 8.30 2406.3 10.53
405 Calcutta Leather
Complex
220 4758.2 12.49 4544.6 11.93
132 2955.5 12.93 3437.6 15.04
406 Subhasgarm 220 6687.6 17.55 8144.4 21.37
132 1844.2 8.07 2260.9 9.89
407 New Town Action Area-
3
220 5738.6 15.06 5739.7 15.06
132 2484.1 10.87 2863.6 12.53
408 Hura 220 2245.9 5.89 2191.4 5.75
132 1177.5 5.15 1484.5 6.49
409 Foundary Park 220 2304.0 6.05 2409.9 6.32
132 1214.4 5.31 1526.9 6.68
410 Dalkhola 220 4723.9 12.40 4060.4 10.66
132 2117.7 9.26 2416.3 10.57
411 DTPS (Waria) 220 11844.1 31.08 10467.7 27.47
132 6038.8 26.41 6262.5 27.39
412 Barjora 220 8256.1 21.67 7797.5 20.46
132 1860.1 8.14 1835.7 8.03
413 Parullia_D 220 10455.7 27.44 10438.1 27.39
414 J K Nagar 220 3328.8 8.74 3008.8 7.90
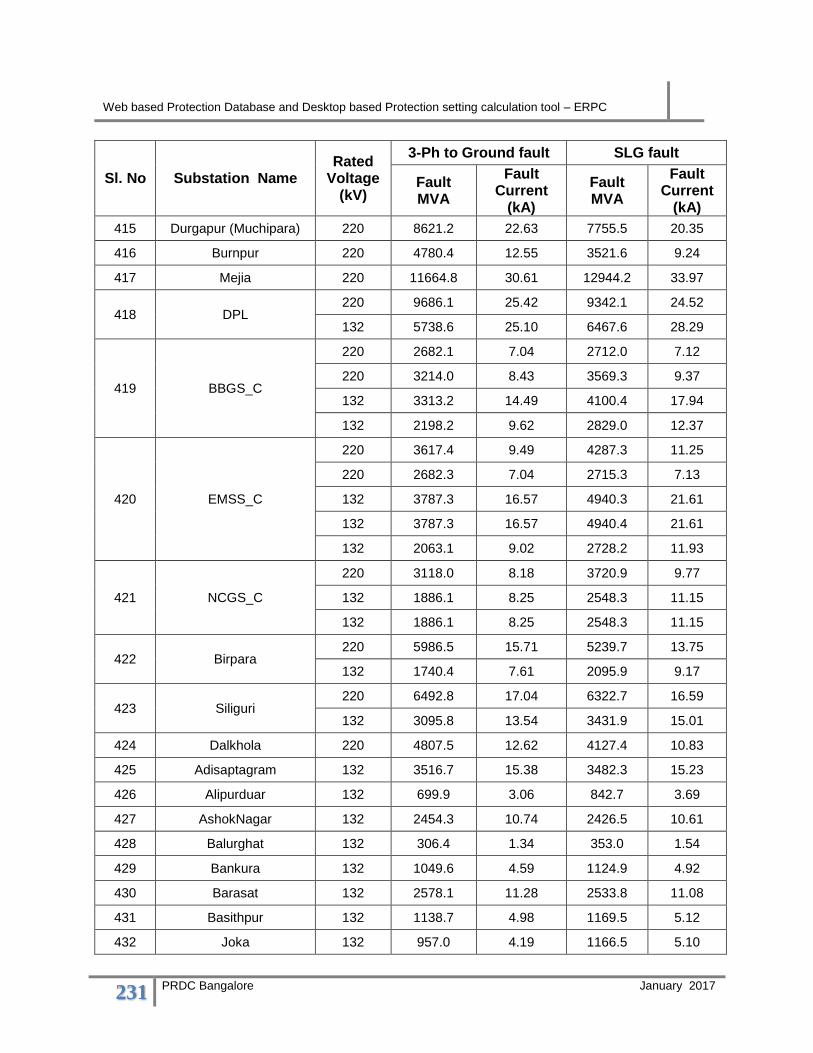
Web based Protection Database and Desktop based Protection setting calculation tool – ERPC
231 PRDC Bangalore January 2017
Sl. No Substation Name Rated
Voltage (kV)
3-Ph to Ground fault SLG fault
Fault MVA
Fault Current
(kA)
Fault MVA
Fault Current
(kA)
415 Durgapur (Muchipara) 220 8621.2 22.63 7755.5 20.35
416 Burnpur 220 4780.4 12.55 3521.6 9.24
417 Mejia 220 11664.8 30.61 12944.2 33.97
418 DPL 220 9686.1 25.42 9342.1 24.52
132 5738.6 25.10 6467.6 28.29
419 BBGS_C
220 2682.1 7.04 2712.0 7.12
220 3214.0 8.43 3569.3 9.37
132 3313.2 14.49 4100.4 17.94
132 2198.2 9.62 2829.0 12.37
420 EMSS_C
220 3617.4 9.49 4287.3 11.25
220 2682.3 7.04 2715.3 7.13
132 3787.3 16.57 4940.3 21.61
132 3787.3 16.57 4940.4 21.61
132 2063.1 9.02 2728.2 11.93
421 NCGS_C
220 3118.0 8.18 3720.9 9.77
132 1886.1 8.25 2548.3 11.15
132 1886.1 8.25 2548.3 11.15
422 Birpara 220 5986.5 15.71 5239.7 13.75
132 1740.4 7.61 2095.9 9.17
423 Siliguri 220 6492.8 17.04 6322.7 16.59
132 3095.8 13.54 3431.9 15.01
424 Dalkhola 220 4807.5 12.62 4127.4 10.83
425 Adisaptagram 132 3516.7 15.38 3482.3 15.23
426 Alipurduar 132 699.9 3.06 842.7 3.69
427 AshokNagar 132 2454.3 10.74 2426.5 10.61
428 Balurghat 132 306.4 1.34 353.0 1.54
429 Bankura 132 1049.6 4.59 1124.9 4.92
430 Barasat 132 2578.1 11.28 2533.8 11.08
431 Basithpur 132 1138.7 4.98 1169.5 5.12
432 Joka 132 957.0 4.19 1166.5 5.10

Web based Protection Database and Desktop based Protection setting calculation tool – ERPC
232 PRDC Bangalore January 2017
Sl. No Substation Name Rated
Voltage (kV)
3-Ph to Ground fault SLG fault
Fault MVA
Fault Current
(kA)
Fault MVA
Fault Current
(kA)
433 Berhampore 132 1689.9 7.39 1828.2 8.00
434 Birpara 132 1722.2 7.53 2058.5 9.00
435 Bishnupur 132 1781.3 7.79 2157.4 9.44
436 Bolpur 132 1315.2 5.75 1457.0 6.37
437 Bongaon 132 1517.0 6.64 1435.3 6.28
438 C k Road 132 572.5 2.50 645.8 2.83
439 Lebong 132 1158.2 5.07 773.5 3.38
440 Debagram 132 722.4 3.16 823.1 3.60
441 Dhulian 132 662.1 2.90 719.5 3.15
442 Egra 132 1791.3 7.84 2165.9 9.47
443 Falta 132 1052.1 4.60 1238.3 5.42
444 Haldia 132 2078.2 9.09 2301.3 10.07
445 Hizlee 132 677.4 2.96 788.2 3.45
446 Kalyani 132 2813.5 12.31 2398.7 10.49
447 Katwa 132 929.1 4.06 1019.2 4.46
448 Khanyan 132 2061.8 9.02 1704.6 7.46
449 Kolaghat 132 2698.7 11.80 3087.7 13.51
450 Lilooah 132 1797.8 7.86 2266.0 9.91
451 Malda 132 1658.9 7.26 2018.4 8.83
452 Mankar 132 1722.3 7.53 1719.6 7.52
453 Myanaguri 132 964.3 4.22 1081.6 4.73
454 North Bengal University 132 2636.7 11.53 2791.3 12.21
455 Pingla 132 976.5 4.27 1130.0 4.94
456 Purulia 132 849.8 3.72 981.2 4.29
457 Raiganj 132 1155.7 5.06 1146.4 5.01
458 Raina 132 1413.2 6.18 1408.2 6.16
459 Rampurhat 132 516.2 2.26 613.7 2.68
460 Ranaghat 132 845.6 3.70 1038.9 4.54
461 Mathabang 132 446.1 1.95 530.1 2.32
462 SaltLake 132 2174.8 9.51 2223.5 9.73

Web based Protection Database and Desktop based Protection setting calculation tool – ERPC
233 PRDC Bangalore January 2017
Sl. No Substation Name Rated
Voltage (kV)
3-Ph to Ground fault SLG fault
Fault MVA
Fault Current
(kA)
Fault MVA
Fault Current
(kA)
463 Samsi 132 515.6 2.26 626.8 2.74
464 Siliguri 132 2188.7 9.57 2250.7 9.84
465 Sonarpur 132 1826.5 7.99 1831.5 8.01
466 Tamluk 132 1747.5 7.64 1742.6 7.62
467 Tarkeshwar 132 2228.0 9.75 2045.3 8.95
468 Titagarh 132 1710.4 7.48 1821.0 7.97
469 Ukhra 132 2089.3 9.14 2068.6 9.05
470 Uluberia 132 821.3 3.59 1006.7 4.40
471 Sirakol 132 1051.0 4.60 1212.6 5.30
472 Cossipur 132 1109.2 4.85 855.8 3.74
473 Balichak 132 1061.1 4.64 943.0 4.12
474 TCF-1 132 1903.6 8.33 1484.1 6.49
475 Hind Motor 132 1091.2 4.77 1096.1 4.79
476 Dankuni 132 1337.1 5.85 1352.5 5.92
477 Debagram 132 654.8 2.86 665.8 2.91
478 Balurghat 132 1335.3 5.84 1201.5 5.26
479 Modern 132 1528.1 6.68 1531.3 6.70
480 Jangipara 132 919.9 4.02 1043.9 4.57
481 Chanditala 132 1238.0 5.42 1225.6 5.36
482 Gangarampur 132 352.3 1.54 406.2 1.78
483 Birsingha 132 1654.0 7.23 1625.2 7.11
484 Coochbehar 132 674.6 2.95 847.5 3.71
485 Belmuri 132 2283.6 9.99 2013.0 8.81
486 Barjora 132 950.6 4.16 943.7 4.13
487 Chalsa 132 830.5 3.63 816.9 3.57
488 Mechand 132 887.7 3.88 991.1 4.34
489 Raghunathpur 132 803.9 3.52 884.3 3.87
490 Amtala 132 513.1 2.24 647.9 2.83
491 Contai 132 1059.0 4.63 1104.1 4.83
492 Haldia NIZ 132 1348.4 5.90 1274.3 5.57

Web based Protection Database and Desktop based Protection setting calculation tool – ERPC
234 PRDC Bangalore January 2017
Sl. No Substation Name Rated
Voltage (kV)
3-Ph to Ground fault SLG fault
Fault MVA
Fault Current
(kA)
Fault MVA
Fault Current
(kA)
493 Jhargram 132 921.2 4.03 960.2 4.20
494 Lalgola 132 1164.2 5.09 1162.9 5.09
495 Najirpur 132 472.0 2.07 584.5 2.56
496 Bighati 132 1266.9 5.54 1486.6 6.50
497 RMBLK 132 883.6 3.87 616.5 2.70
498 TMBL 132 785.1 3.43 524.0 2.29
499 Farakka 132 950.8 4.16 1001.2 4.38
500 Khatri 132 739.3 3.23 829.0 3.63
501 Kalna 132 1597.2 6.99 1514.1 6.62
502 Kakdwip 132 785.7 3.44 809.8 3.54
503 Kurseong 132 1255.3 5.49 776.8 3.40
504 Bagnan 132 1369.8 5.99 1377.7 6.03
505 Sonarlal 132 666.6 2.92 391.0 1.71
506 Saintia 132 1143.1 5.00 1224.6 5.36
507 New Town Action Area-
1 132 1993.4 8.72 2075.2 9.08
508 Ujanu 132 2044.2 8.94 2074.5 9.07
509 BEL CCp 132 759.6 3.32 827.1 3.62
510 Belmuri 132 1259.9 5.51 1052.1 4.60
511 Burdwan 132 1437.2 6.29 1161.1 5.08
512 Bagmundi 132 349.2 1.53 329.6 1.44
513 Kharagpur 132 1224.7 5.36 761.2 3.33
514 Howrah 132 1523.2 6.66 1075.1 4.70
515 Kalapahari 132 3091.6 13.52 1955.0 8.55
516 Purulia 132 1433.2 6.27 915.8 4.01
517 Bandel 132 4978.1 21.77 5563.7 24.34
518 Jamuria 132 1322.9 5.79 709.9 3.11
519 ASP 132 4452.0 19.47 3587.4 15.69
520 DPL A Zone 132 3066.6 13.41 2553.8 11.17
521 DPL B Zone 132 5243.8 22.94 5541.9 24.24

Web based Protection Database and Desktop based Protection setting calculation tool – ERPC
235 PRDC Bangalore January 2017
Sl. No Substation Name Rated
Voltage (kV)
3-Ph to Ground fault SLG fault
Fault MVA
Fault Current
(kA)
Fault MVA
Fault Current
(kA)
522 DPL AB Zone 132 5306.9 23.21 5456.7 23.87
523 DPL C Zone 132 4331.4 18.95 3995.9 17.48
524 DPL C1 Zone 132 4181.1 18.29 3707.2 16.22
525 Bamunara 132 2709.3 11.85 2093.6 9.16
526 NCGS_C 132 1886.1 8.25 2548.3 11.15
527 SRS_C 132 2247.1 9.83 2830.7 12.38
132 2163.3 9.46 2735.5 11.97
528 TRS_C 132 1743.8 7.63 2338.6 10.23
132 1743.8 7.63 2338.6 10.23
529 Majerhat_C 132 2443.6 10.69 3149.7 13.78
530 BT Road_C 132 1710.9 7.48 2150.7 9.41
132 1885.7 8.25 2551.4 11.16
531 Princep Street_C
132 1793.5 7.84 2327.6 10.18
132 2966.7 12.98 3780.8 16.54
132 2966.7 12.98 3780.8 16.54
132 2195.2 9.60 2828.3 12.37
532 East calcutta_C 132 1967.6 8.61 2518.3 11.02
132 1788.7 7.82 2317.0 10.13
533 Rishra_C 132 1431.7 6.26 1897.1 8.30
534 Taratala_C 132 2440.0 10.67 3144.2 13.75
535 Chakmir_C 132 2505.6 10.96 3212.6 14.05
536 Jadavpur_C 132 2867.9 12.54 3614.7 15.81
132 2217.2 9.70 2821.3 12.34
537 BBD Bag_C 132 2147.1 9.39 2757.4 12.06
538 Botanical garden_C 132 1942.5 8.50 2513.6 10.99
539 Belur_C 132 1737.5 7.60 2193.3 9.59
540 Park Lane_C 132 3165.8 13.85 4049.5 17.71
132 3165.8 13.85 4049.5 17.71
541 DumDum_C 132 1906.4 8.34 2575.4 11.26
542 Patuli_C 132 3165.8 13.85 4049.2 17.71
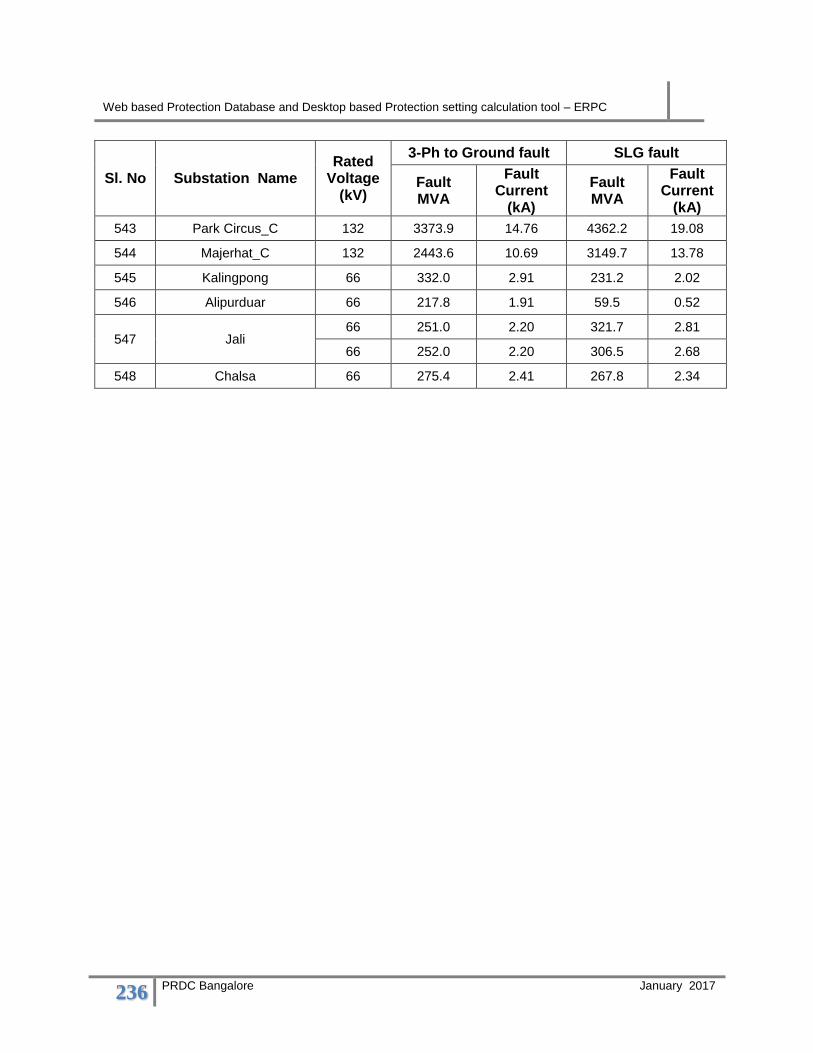
Web based Protection Database and Desktop based Protection setting calculation tool – ERPC
236 PRDC Bangalore January 2017
Sl. No Substation Name Rated
Voltage (kV)
3-Ph to Ground fault SLG fault
Fault MVA
Fault Current
(kA)
Fault MVA
Fault Current
(kA)
543 Park Circus_C 132 3373.9 14.76 4362.2 19.08
544 Majerhat_C 132 2443.6 10.69 3149.7 13.78
545 Kalingpong 66 332.0 2.91 231.2 2.02
546 Alipurduar 66 217.8 1.91 59.5 0.52
547 Jali 66 251.0 2.20 321.7 2.81
66 252.0 2.20 306.5 2.68
548 Chalsa 66 275.4 2.41 267.8 2.34