eastern new york renter summary 1988 - cornell...
TRANSCRIPT

August 1989 A.E. Ext. 89-19
EASTERN NEW YORK RENTER SUMMARY
1988
Linda Putnam Stuart F. Smith

1988 EASTERN NEW YORK DAIRY FARM RENTER BUSINESS SUMMARY
INTRODUCTION
Dairy farmers throughout New York State submit business records for summarization and analysis through Cornell Cooperative Extension's Farm Business Management Program. Averages from a compilation of the individual farm reports are published in eight regional summaries and in one statewide summary.l
Accrual procedures have been used to provide the most accurate accounting of farm receipts and farm expenses for measuring farm profits. An explanation of these procedures is found on pages 3-5. Four measures of farm profits are calculated on pages 6 and 7. The balance sheet and cash flow statement are featured on pages 8-13. The dairy program analysis includes data on the costs of producing milk (pages 16 and 17).
This special Eastern New York Dairy Summary is an average of 24 businesses that are renting substantially all of the farm real estate. The farm income, financial summary, and business analysis sections of this report include comparisons with average data on 138 owned dairy farms in the region. This report is prepared in workbook form for farm renters to use in the systematic study of their farm business operations.
Business records for 24 farms in Albany, Columbia, Delaware, Rensselaer, Schoharie, Sullivan, and Washington Counties are summarized in this publication. The Eastern New York region consists of these counties plus Greene, Herkimer, Montgomery, Otsego, Schenectady, and Ulster Counties which do not have dairy farm business summary participants that classify as renters. The 138 owned dairy farms summarized in this publication include farms from the entire region.
Use Comparative Profitability Data With Caution
The profitability analysis on page 7 where labor and management income is calculated implies that renting a dairy farm is more profitable than owning one. Concessionary rental rates set by some land owners is a major factor. The farm owners are often father and mother and other landlords who are willing to accept a very low return for their investment. Total real estate costs including depreciation and interest on equity capital averaged $148 per tillable acre on the owned dairy farms compared to only $111 on the rented farms. This accounts for a $15,100 difference in costs between owned and rented farms.
ISmith, Stuart F., Wayne A. Knoblauch, and Linda D. Putnam, Dairy Farm Management Business Summary. New York. 1988, A.E. Res. 89-12, August 1989.

2
SUMMARY AND ANALYSIS OF THE FARM BUSINESS
Business Characteristics and Resources Used
Recognition of important business characteristics and identification of the farm resources used is necessary for evaluating management performance. The combination of resources and management practices is known as farm organization. Important farm business characteristics, the number of farms reporting these characteristics, and a listing of the average labor, land, and dairy cattle resources used are presented in the following table.
BUSINESS CHARACTERISTICS AND RESOURCES USED 24 Eastern New York Dairy Farm Renters, 1988
T~Re of Busine§s Single proprietorship Partnership
Milkins S~stem Dumping station Pipeline Herringbone parlor Other parlor
T~e Qf ~arn Stanchion Freesta11 Combination
Dair~ R~cord§ S~:!:.Yic~
Numb~r 17
7
Number 1
19 2 2
Num:b~I 21
2 1
Number DHIC 29 DHIC Owner-Sampler 2 None 3
Busin~ss R~cord S~stem Number
Labor Force Operator 1. Operator 2. Operator 3. Family paid Family unpaid Hired
Total
Worker equivalent (total + 12)
Operator/Manager Equivalent (Oper. mo. + 12)
Land Use Total acres rented Tillable acres rented
Number of CQws
My: Farm Averase mo. mo. mo. mo. mo. mo. mo.
M~ Farm
11.58 3.42 0.50 0.92 1.71
11.33 29.46
2.45
1.29
Averase
Account Book 5 Beg. year (owned) 63 Agrifax (mail-in only) 7 End year (owned & ELFAC 1 leased) 67 Other 9 Average for year On-farm computer 2 (owned & leased) 66
383 214
MI Farm Average
Predominate business characteristics of the 24 rented farms include the single proprietorship, pipeline milking system, stanchion or conventional stall barn, DHIC herd records and an "other" business record system. They are very similar to owned dairy farms in this respect.
The average size of the labor force on the rented farms was 11 percent less than the 2.76 worker equivalent on owned farms. The rented farms averaged 214 tillable acres and 66 cows compared to 263 tillable acres and 86 cows on the 138 owned dairy farms in the same region. Land and labor resources were being used more effecient1y by dairy farm owners.

3
Income Statement
The accrual income statement begins with an accounting of all farm business expenses.
CASH AND ACCRUAL FARM EXPENSES 24 Eastern New York Dairy Farm Renters, 1988
Change in Inventory
Cash or Prepaid Change in Accrual Expense Item Paid + Expense + Accounts Payable Expenses
Hired Labor $ 10,840 Feed Dairy grain & conc. 39,954 Dairy roughage 2,832 Other livestock 83 Machinery Mach. hire, rent/lease 1,451 Machinery repairs/parts 6,710 Auto expense (farm share) 323 Fuel, oil & grease 3,509 Livestock Replacement livestock 2,834 Breeding 2,500 Vet & medicine 2,825 Milk marketing 8,588 Cattle lease/rent 500 Other livestock expense 7,318 Crops Fertilizer & lime 4,127 Seeds &plants 1,799 Spray, other crop expo 1,396 Real Estate Landjbldg./fence repair 991 Taxes 1,565 Rent & lease 12,306 Other Insurance 2,342 Telephone (farm share) 598 Electricity (farm share) 4,258 Interest paid 5,102 Miscellaneous 1. 730 Total Operating $126,481 Expansion livestock $1,509 Machinery depreciation Building depreciation
TOTAL ACCRUAL EXPENSES
$ 0«
·735 188
0
0« -18
0« 24
0« 133 ·24
0« 0«
-60
111 71
-18
-30 0« 0«
0« 0« 0« 0«
---2J.. $-331
$0«
$ 4
156 213
0
0 237
0 38
83 6
-25 -5 0 7
263 113 127
125 0
25
0 0
28 0 Q
$1,395 $0
$ 10,844
39,375 3,233
83
1,451 6,929
323 3,571
2,917 2,639 2,776 8,583
500 7,265
4,501 1,983 1,505
1,086 1,565
12,331
2,342 598
4,286 5,102 1. 757
$127,545 $1,509 $7,146 $1,051
$137.251
Cash paid is the actual amount of money paid out during the year and does not necessarily represent the cost of goods and services actually used.
Change in inventory: An increase in inventory is subtracted in computing accrual expenses because it represents purchased inputs not actually used during the year. A decrease in inventory is added to expenses because it represents the cost of inputs purchased in a prior year and used this year.

4
Changes in prepaid expenses apply to non-inventory categories (noted by ~ in the tables). Include any expenses that have been paid for in advance of their use, for example, 1989 rent paid in 1988. A positive change is the amount the prepayment account declined from beginning to end year, a negative change indicates an increase in the account.
Change in accounts payable: An increase in payables is added and a decrease is subtracted when calculating accrual expenses.
Accrual expenses are the costs of inputs actually used in this year's production.
Worksheets are provided to enable any dairy farmer to compute his or her accrual farm expenses and compare them with the averages on the previous page.
CASH AND ACCRUAL FARM EXPENSES WORKSHEET
Change in Inventory
Cash or Prepaid Change in Accrual Expense Item Paid + Expense + Accounts Payable - Expenses
Hired Labor Feed
$_- $----~ $_- $_-
Dairy grain & conc. Dairy roughage Other livestock Machinery Mach. hire, rent/lease -----~ Machinery repairs/parts Auto expense (farm share)______ ~---- Fuel, oil & grease Livestock Replacement livestock Breeding Vet & medicine Milk marketing
-----~ Cattle lease/rent ~--- Other livestock expense Crops Fertilizer & lime Seeds & plants Spray, other crop expo Real Estate Landjbldg./fence repair Taxes ~ ------ Rent & lease ----~ Other Insurance
----~ Telephone (farm share) ~---- Electricity (farm share) ~ ------ Interest paid
-----~ Miscellaneous Total Operating Expansion livestock
$___ $_- $_- $_-
Machinery depreciation Building depreciation TOTAL ACCRUAL EXPENSES $

5
CASH AND ACCRUAL FARM RECEIPTS 24 Eastern New York Dairy Farm Renters, 1988
Change in Cash Change in Accounts Accrual
Recei:et Item Recei:ets + Inv~ntor;:! + Reclil1vable RIil£ei:ets
Milk sales $141,151 $161 $141,312 Dairy cattle 9,100 $3,601 0 12,701 Dairy calves 2,629 0 2,629 Other livestock 0 107 0 107 Crops 1,279 2,271 0 3,550 Government receipts 1,340 0* 0 1,340 Custom machine work 521 0 521 Gas tax refund 80 0 80 Other 1,469 0 1,469 . Nonfarm noncash capital (-)__0** (.) 0 Total Accrual Receipts $157,569 $5,979 $161 $163,709
*Change in advanced government receipts. **Gifts or inheritances of cattle or crops included in inventory.
Cash reclili:ets include the gross value of milk checks received during the year plus all other payments received from the sale of farm products, services, and government programs. Nonfarm income is not included in calculating farm profitability.
Changes in inventor;:! are calculated by subtracting beginning of year values from end of year values excluding a:epreciation. Increases in livestock inventory caused by herd growth and/or quality are added and decreases caused by herd reduction and for quality are subtracted. Changes in inventories of crops grown are also calculated. Changes in advanced government receipts are calculated by subtracting the end year balance from the beginning year balance (balances are listed with the current liabilities on the Balance Sheet).
Changes in accounts receivabllil are calculated by subtracting beginning year balances from end year balances. The January milk check for this December's marketings compared with the previous January's check is included as a change in accounts receivable.
Accrual receipts represent the value of all farm commodities produced and services actually generated by the farmer during the year.
CASH AND ACCRUAL FARM RECEIPT WORKSHEET
Change in Cash Change in Accounts Accrual
Receipt Item RIil£eipts + InvelltoI;:! + Rec!iliv§:ble Receipts
Milk sales $ $ $ Dairy cattle $ Dairy calves Other livestock Crops Government receipts Custom machine work Gas tax refund Other Less gifts of cattle & crops (-) (-) Total Accrual Receipts $ $ $ $

6
Profitability Analysis
Farm owners/operators contribute labor, management, and capital to their businesses and the best combination of these resources maximizes income. Farm profitability can be measured as the return to all family resources or as the return to one or more individual resources such as labor and management.
Net farm income is the total combined return to the farm operator(s) and other unpaid family members for their labor, management, and equity capital. It is the farm family's net annual return from working, managing, financing, and owning the farm business. This is not a measure of cash available from the year's business operation. Cash flow is evaluated later in this report.
Net farm income is computed with and without appreciation. Appreciation represents the change in values caused by annual changes in prices of livestock, machinery, real estate inventory, and stocks and certificates (other than FLB and PCA). Appreciation is a major factor contributing to changes in farm net worth and must be included for a complete profitability analysis.
NET FARM INCOME Eastern New York Dairy Farm Renters and Owners, 1988
24 Dairy 138 Dairy Item Farm Renters Farm Owners My Farm
Total accrual receipts + Appreciation: Livestock
Machinery Real Estate Other Stock/Cert.
- Total Including Appreciation - Total accrual expenses
Net Farm Income (with appreciation) Net Farm Income (without appreciation)
$163,709 3,065
-476 980 975
$168,253 137.251
$ 31,002 $ 26,458
$216,913 4,504 1,105
15,884 299
$238,705 185.496
$ 53,209 $ 31,417
$_-
$_-
$_-$_-
Return to operators' labor. management. and equity capital measures the total business profits for the farm operator(s). It is calculated by deducting a charge for unpaid family labor from net farm income. Operators' labor is not included in unpaid family labor. Return to operators' labor, management, and equity capital has been calculated with and without appreciation. Appreciation is considered an important part of the return to ownership of farm assets.
RETURN TO OPERATOR(S') LABOR, MANAGEMENT, AND EQUITY Eastern New York Dairy Farm Renters and Owners, 1988
24 Dairy 138 Dairy Item Farm Renters Farm Owne;[s My Farm
Net farm income (with appreciation) $31,002 $53,209 $ - Family labor unpaid @$700 per month 1,196 1,872
Return to operators' labor, management, &equity (with appreciation) $29,806 $51,337 $
- Appreciation 4,544 21,792 Return to operators' labor, management,
& equity (without appreciation) $25,262 $29,545 $

7
Labor and mana&ement income is the return which farm operators receive for their labor and management used in operating the farm business. Appreciation is not included as part of the return to labor and management because it results from ownership of assets rather than management of the farm business. Labor and management income is calculated by deducting the opportunity cost of using equity capital at a real interest rate of five percent, from the return to operators' labor, management, and equity capital excluding appreciation. The interest charge of five percent reflects the long-term average rate of return that a farmer might expect to earn in comparable risk investments in a low inflation economy.
LABOR AND MANAGEMENT INCOME Eastern New York Dairy Farm Renters and Owners, 1988
24 Dairy 138 Dairy Item Farm Renters Farm Owners My Farm
Return to operators' labor, mgmt., & equity without appreciation $25,262 $29,545 $
- Real interest @ 5% on average equity capital 7.823 20,386
- Labor & Management Income $17,440 $ 9,159 $ Labor & Management Income per
Operator/Manager $13,519 $ 6,542 $
Return on equity capital measures the net return remaining for the farmer's equity or owned capital after a charge has been made for the owner-operator's labor and management. The earnings or amount of net farm income allocated to labor and management is the opportunity cost of operators' labor and management estimated by the cooperators. Return on equity capital is calculated with and without appreciation. The rate of return on equity capital is determined by dividing the amount returned by the average farm net worth or equity capital. Return on total capital is calculated by adding interest paid to the return on equity capital and then dividing by average farm assets to calculate the rate of return on total capital.
RETURN ON EQUITY CAPITAL AND RETURN ON TOTAL CAPITAL Eastern New York Dairy Farm Renters and Owners, 1988
24 Dairy 138 Dairy Item Farm Renters Farm Owners My Farm
Return to operators' labor, mgmt., & equity capital with apprec. $29,806 $51,337 $
- Value of operators' labor & mgmt. 23,812 25,285 Return on equity capital with apprec. $ 5,994 $26,052 $
+ Interest paid 5,102 13,575 Return on total capital with apprec. $11,096 $39,627 $
Return on equity capital without apprec. $ 1,450 $ 4,260 $ Return on total capital without apprec. $ 6,552 $17,835 $ Rate of return on average equity capital:
with appreciation 3.8% 6.4% % without appreciation 0.9% 1.0% %
Rate of return on average total capital: with appreciation 5.0% 6.9% % without appreciation 2.9% 3.1% %

8
Farm and Family Financial Status
The first step in evaluating the financial status of the farm is to construct a balance sheet which identifies all the assets and liabilities of the business. The second step is to evaluate the relationship between assets, liabilities, and net worth and changes that occurred during the year.
1988 FARM BUSINESS & NONFARM BALANCE SHEET 24 Eastern New York Dairy Farm Renters, 1988
Farm Liabilities Farm Assets Jan. 1 Dec. 31 ~ Net Worth Jan, 1 Dec. 31
Current Current Farm cash, checking Accounts payable $ 2,077 $ 3,472 & savings $ 5,420 $ 4,068 Operating debt 3,153 3,679
Accounts rec. 11,615 13,235 Short-term 979 1,454 Prepaid expo 0 0 Advanced govt. rec. 0 0 Feed & supplies 28,075 30,616 Total $ 6,209 $ 8,605
Total $ 45,110 $ 47,979 Intermediate Intemedj.ate Dairy cows: owned $ 56,021 $ 60,250 Structured debt
leased 2,434 2,146 1-10 years $ 48,208 $ 49,421 Heifers 19,554 21,933 Financial lease Bulls/other lvstk. 240 404 (cattle/mach. ) 2,661 2,311 Mach./eq. owned 73,016 74,415 FLB/PCA stock 1,166 1,051 Mach./eq. leased 227 165 FLB/PCA stock 1,166 1,051 Total $ 52,035 $ 52,784 Other stock/cert. 4,281 5,318
Total $156,939 $165,682 Long lem Long-Term Structured debt Landjbuildings : 2::10 years $ 5,322 $ 8,107
owned $ 13,358 $ 16,899 Financial lease leased 0 0 (structures) 0 0 Total $ 13,358 $ 16,899 Total $ 5,322 $ 8,107
Total Farm Assets $215,407 $230,560 Total Farm Liab. $ 63,567 $ 69,496 FARM NET WORTH $151,840 $161,065
(Average for 12 farms reporting) Nonfarm Liabilities* Nonfarm Assets* Jan, 1 Des.:, :n ~ Net Worth Ja.n , 1 Dec, 31
Personal cash, chkg. Nonfarm Liab. $ 4,567 $ 4,149 & savings $ 3,051 $ 3,549 NONFARM NET WORTH $30,275 $35,053
Cash value life ins. 812 1,217 Nonfarm real estate 17,183 21,375 EARM ~ NO:HEARM* Jin. 1 De$.'l:, Jl Auto (personal sh.) 2,758 2,121 Total Assets $250,249 $269,761 Stocks & bonds 1,681 2,417 Total Liabilities 68,134 73,645 Household furn. 7,958 7,125 All other 1,398 1,397 TOTAL FARM & NON-
Total Nonfarm $34,842 $39,201 FARM NET WORTH $182,115 $196,116 *Assumes that average nonfarm assets and liabilities for the nonreporting
farms were the same as for those reporting.
Financial lease obligations are included in the balance sheet. The present value of all future payments is listed as a liability since the farmer is committed to make the payments by signing the lease. The present value is also listed as an asset, representing the future value the item has to the business.

----
9
Advanced government receipts are included as current liabilities. Government payments received in 1988 that are for participation in the 1989 program are the end year balance and payments received in 1987 for participation in the 1988 program are the beginning year balance.
Date
1988 FARM BUSINESS & NONFARM BALANCE SHEET
Farm Liabilities Farm Assets Jan. 1 Dec, 31 & Net Worth Jan. 1 Dec. 31
Current Farm cash, checking & savings
Accounts rec. Prepaid expense Feed & supplies
Total
Intermediate Dairy cows:
owned leased
Heifers Bulls/other lvstk. Mach./eq. owned Mach./eq. leased FLB/PCA stock Other stock/cert.
Total
Long-Term Land/buildings:
owned leased
Total
Total Farm Assets
Current Accounts payable Operating debt:
Short Term:
Adv. govt. rec. Total
Intermediate
Financial lease (cattle/mach.)
FLB/PCA stock Total
Long-Term
Financial lease (structures) Total
Total Farm Liab. FARM NET WORTH
Nonfarm Liabilities Nonfarm Assets Jan. 1 Dec, 31 & Net Worth Jan. 1 Dec. 31
Personal cash, chkg. & savings
Cash val. life ins. Nonfarm real est. Auto (pres. share) Stocks &bonds Household fum. All other Total Nonfarm
Nonfarm Liab.:
Total Nonfarm Liabili ties
Nonfarm Net Worth
TOTAL FARM & NONFARM Jan, 1 Dec. 31 Total Farm & Nonfarm Assets Less Total Farm & Nonfarm Liabilities Farm & Nonfarm Net Worth
10
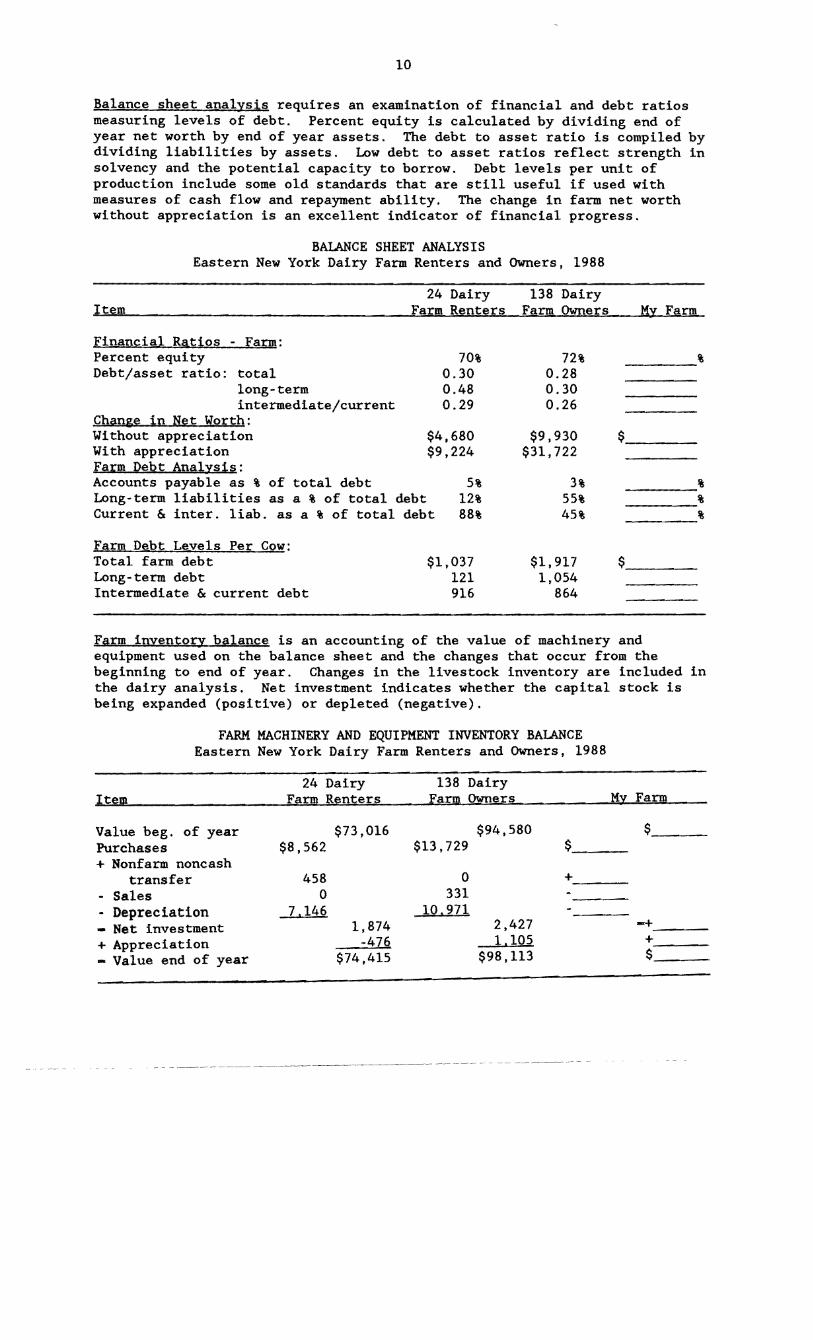
Balance sheet analysis requires an examination of financial and debt ratios measuring levels of debt. Percent equity is calculated by dividing end of year net worth by end of year assets. The debt to asset ratio is compiled by dividing liabilities by assets. Low debt to asset ratios reflect strength in solvency and the potential capacity to borrow. Debt levels per unit of production include some old standards that are still useful if used with measures of cash flow and repayment ability. The change in farm net worth without appreciation is an excellent indicator of financial progress.
BALANCE SHEET ANALYSIS Eastern New York Dairy Farm Renters and Owners, 1988
24 Dairy 138 Dairy Item Farm Renters Farm Owners My Farm
Financial Ratios - Farm: Percent equity 70% Debt/asset ratio: total 0.30
long-term 0.48 intermediate/current 0.29
Chan~e in Net Worth: Without appreciation $4,680 With appreciation $9,224 Farm Debt Analysis: Accounts payable as % of total debt 5% Long-term liabilities as a % of total debt 12% Current & inter. liab. as a % of total debt 88%
Farm Debt Levels Per Cow: Total farm debt $1,037 Long-term debt 121 Intermediate & current debt 916
72% 0.28 0.30 0.26
$9,930 $31,722
$
3% 55% 45%
% % %
$1,917 1,054
864
$
Farm inventory balance is an accounting of the value of machinery and equipment used on the balance sheet and the changes that occur from the beginning to end of year. Changes in the livestock inventory are included in the dairy analysis. Net investment indicates whether the capital stock is being expanded (positive) or depleted (negative).
FARM MACHINERY AND EQUIPMENT INVENTORY BALANCE Eastern New York Dairy Farm Renters and Owners, 1988
24 Dairy 138 Dairy Item Farm Renters Farm Owners My Farm
Value beg. of year $73,016 $94,580 $_-Purchases $8,562 $13,729 $ + Nonfarm noncash
transfer 458 0 + - Sales 0 331 - Depreciation - Net investment
7,146 1,874
10.971 2,427 -+---
+ Appreciation - Value end of year
-4Z6 $74,415
1,105 $98,113
+$--

11
Cash Flow Statement
Completing an annual cash flow statement is an important step in understanding the sources and uses of funds for the business. Understanding last year's cash flow is the first step toward planning and managing cash flow for the current and future years.
The annual cash flow statement is structured to compare all the cash inflows with all the cash outflows for the year. A complete list of cash inflows and cash outflows are identified in the following table. By definition, total cash inflows must equal total cash outflows when beginning and ending balances are included. Any imbalance is, therefore, the error from incorrect accounting of cash inflows and cash outflows.
ANNUAL CASH FLOW STATEMENT Eastern New York Dairy Farm Renters and Owners, 1988
24 Dairy l38 Dairy Item Farm Renters Farm Owners My Farm
Cash Inflows
Beg. farm cash, checking & savings $ 5,420
Cash farm receipts 157,569
Sale of assets: Machinery 0
Real estate 0
Other stock & cert. 0
Money borrowed (inter. & long-term) 20,877
Money borrowed (short-term) 1,571
Increase in operating debt 525
Nonfarm income 2,667
Cash from nonfarm cap. used in the business 3,353
Money borrowed - nonfarm o Total $191,982
Cash Outflows
Cash farm expenses $126,477
Capital purchases: Expansion livestock 1,509
Machinery 8,562
Real estate 4,160
Other stock & cert. 62
Principal payments (inter. & long-term) 16,879
Principal payments (short-term) 1,096
Decrease in operating debt o Personal withdrawals & family expenditures,
including nonfarm debt payments 27,301
Ending farm cash, checking & savings 4.068
Total $190,114
Imbalance (error) $ 1,868
$ 6,123
210,821
331
3,102
129
19,597
1,543
1,02l
3,771
2,832
1.027
$250,297
$166,888
1,208
13,729
7.721
621
24,371
1,303
0
26,947
6.Z88
$249,576
$ 721
$_--
$_--
$
$
$

12
Repayment Analysis
The second step in cash flow analysis is to compare the debt payments planned for the last year with the amount actually paid. The measures listed below provide a number of different perspectives on the repayment performance of the business. However, the critical question to many farmers and lenders is whether planned payments can be made in 1989. The cash flow projection worksheet on the next page can be used to estimate repayment ability, which can then be compared to planned 1989 debt payments shown below.
FARM DEBT PAYMENTS PLANNED Same 20 Eastern New York Dairy Farm Renters, 1988*
Averj!ge My Farm
Debt P!!yment§
Long-term Intermediate-term Short-term Operating (net red.) Accounts payable
(net reduction) Total
Per cow Per cwt. 1988 milk Percent of total
1988 receipts Percent of 1988
milk receipts
1988 fayment§ f1anned Made
$ 188 $ 1,261 13,850 20,561
468 1,115 121 ° 810
$16,643 $23,003° $234 $323
$1.43 $1. 98
10% 13%
11% 15%
Planned 1988 Payments Planned 1989 Planned Made 1989
$ 1,969 $_-- $_-_$_-15,435
438 933
840 $19,614 $_- $_-_$_-
$_- $_-$_- $_-
*Farms that completed Dairy Farm Business Summaries for both 1981 and 1988.
The cash flow coverage rj!tio measures the ability of the farm business to meet its planned debt payment schedule. The ratio shows the percentage of planned payments that could have been made with last year's available cash flow. report
Farmers that did not participate in DFBS last year will find in their a cash flow coverage ratio based on planned debt payments for 1989.
CASH FLOW COVERAGE RATIO Eastern New York Dairy Farm Renters and Owners, 1988
Same 20 Same 104 Item Fj!rm Renters Farm Owners My Farm
Cash farm receipts $169,558 - Cash farm expenses 135,489 + Interest paid 5,419 - Net personal withdrawals from farm* 28.005
(A) - Amount Available for Debt Service $ 11 ,483 (B) - Debt Payments Planned for 1988
(as of December 31, 1981) $16,643 (A + B) - Cash Flow Coverage Ratio for 1988 0.69
$215,512 110,013
13 ,080 23.039
$ 35,480
$32,118 1.08
$_--
$_--
$_--
*Persona1 withdrawals and family expenditures less nonfarm income and nonfarm money borrowed. If family withdrawals are excluded the cash flow coverage ratio will be incorrect.

13
ANNUAL CASH FLOW WORKSHEEET
24 Dairy My Farm Expected 1989 Item Farm Renters Total Per Cow Change Projection
(per cow) Average number of cows 66 Accrual Oper. Receipts Milk $2,132 $___ $_-- ---_$_--Dairy cattle 192 Dairy calves 40 Other livestock 2 Crops 53 Misc. receipts 51
Total $2,470 $___ $_- ---_$_--
Accrual Oper. Expenses Hired labor $ $164 $_ $_--Dairy grain & cone. 594 -- Dairy roughage 49 Other lvstk. feed 1 Mach. hire/rent/lease 22 Mach. rpr./parts & auto 109 Fuel, oil & grease 54 Replacement lvstk. 44 Breeding 40 Vet &medicine 42 Milk marketing 129 Cattle lease 8 Other lvstk. expo 110 Fertilizer & lime 68 Seeds & plants 30 Spray/other crop expo 23 Land, bldg. ,fence repair 16 Taxes 24 Real est. rent/lease 186 Insurance 35 Utilities 74 Miscellaneous 26
Total Less Int. Paid $1,847 ---_$_--Net Accrual Operating Income (total)
(without interest paid) $41,266 $_-- $_--- Change in lvstk./crop inv. 5,979
Change in accts. rec. 161 + Change in feed/supply inv. -331 + Change in accts. payable* 1.395 NET CASH FLOW $36,190 $_-- $_--- Net personal withdrawals &
family expenditures 24.634 Available for Farm Debt Payments
& Investments $11,556 $_-- $_--- Farm debt payments 22.695 Available for Farm Investments $-11,139 $_-- $_--- Capital purchases: cattle,
machinery & improvements $14,293 Additional Capital Needed $_-- $_--
*Excludes change in interest account payable.

14
Cropping Program Analysis
The cropping program is an important part of the dairy farm business and sometimes it is overlooked and neglected. A complete evaluation of available land resources, how they are being used, how well crops are producing and what it costs to produce them, is required to evaluate alternative cropping and feed purchasing choices.
LAND RESOURCES AND CROP PRODUCTION 24 Eastern New York Dairy Farm Renters, 1988
Item Average of Farms Reporting My Farm
Crop Yield§ Hay crop Corn silage
Other forage Total forage Corn grain Oats Wheat Other crops Tillable pasture Idle
Total Tillable Acres
Farms Acres Pro!'UAcre* 23 140 2.52 tn OM 23 43 12.84 tn
4.40 tn OM 3 24 1.49 tn OM
23 186 2.86 tn OM 9 42 103.50 bu 3 10 44.83 bu 0 0 0.0 bu 2 25 4· 61 6 23
24 214
Acres ProdLAcre tn OM tn tn OM tn OM tn OM bu bu bu
--
*1988 average yields for 138 dairy farm owners in Eastern New York included: all hay crops, 2.6 tons dry matter per acre; corn silage, 13.9 tons per acre.
Average crop acres and yields compiled for the region are for the number of farms reporting each crop. Yields of forage crops have been converted to tons of dry matter using dry matter coefficients reported by the farmers. Grain production has been converted to bushels of dry grain equivalent based on dry matter information provided.
The following measures of crop management indicate how efficiently the land resource is being used and how well total forage requirements are being met.
CROP MANAGEMENT FACTORS Eastern New York Dairy Farm Renters and Owners, 1988
Item 24 Dairy
Farm Renters 138 Dairy
Farm Owners My Farm
Total tillable acres per cow Total forage acres per cow Harvested forage dry matter, tons per cow
3.22 2.69 7.71
3.04 2.49 7.81
15
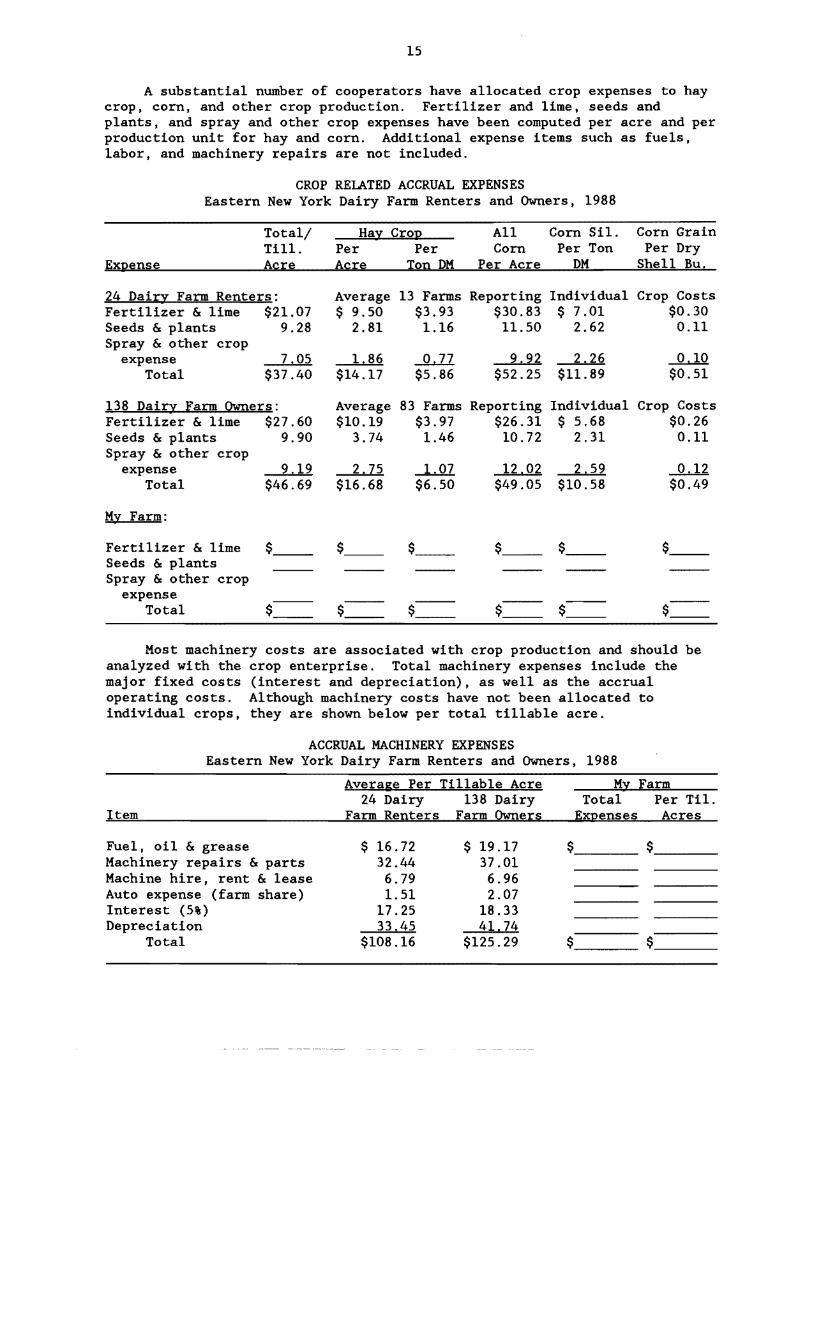
A substantial number of cooperators have allocated crop expenses to hay crop, corn, and other crop production. Fertilizer and lime, seeds and plants, and spray and other crop expenses have been computed per acre and per production unit for hay and corn. Additional expense items such as fuels, labor, and machinery repairs are not included.
CROP RELATED ACCRUAL EXPENSES Eastern New York Dairy Farm Renters and Owners, 1988
EXI!ense
Total/ Till. Acre
Ha)!: CroI! Per Per Acre Ton DM
All Corn
Per Acre
Corn Sil. Per Ton
DM
Corn Grain Per Dry
Shell Bu.
24 Dair)!: Farm Renters: Fertilizer & lime $21.07 Seeds & plants 9.28 Spray & other crop
expense 7,05 Total $37.40
Average 13 Farms $ 9.50 $3.93
2.81 1.16
1.86 ...Q..ll $14.17 $5.86
Reporting Individual Crop Costs $30.83 $ 7.01 $0.30 11.50 2.62 0.11
2,22 2,26 0.10 $52.25 $11.89 $0.51
138 Dair)!: Farm Owners: Fertilizer & lime $27.60 Seeds & plants 9.90 Spray & other crop
expense Total
9.19 $46.69
Average 83 Farms $10.19 $3.97
3.74 1.46
2.Z5 -L...Ql $16.68 $6.50
Reporting Individual Crop Costs $26.31 $ 5.68 $0.26 10.72 2.31 0.11
12,02 2,59 --2....11 $49.05 $10.58 $0.49
M)!: Farm:
Fertilizer & lime Seeds & plants Spray & other crop
$_ $_ $_
expense Total $_ $_ $_
Most machinery costs are associated with crop production and should be analyzed with the crop enterprise. Total machinery expenses include the major fixed costs (interest and depreciation), as well as the accrual operating costs. Although machinery costs have not been allocated to individual crops, they are shown below per total tillable acre.
ACCRUAL MACHINERY EXPENSES Eastern New York Dairy Farm Renters and Owners, 1988
Average Per Tillable Acre M)!: Farm 24 Dairy 138 Dairy Total Per Til.
Item Farm Renters Farm Owners EXI!enses Acres
Fuel, oil & grease Machinery repairs & parts Machine hire, rent & lease Auto expense (farm share) Interest (5%) Depreciation
Total
$ 16.72 32.44 6.79 1.51
17.25 33,45
$108.16
$ 19.17 37.01 6.96 2.07
18.33 41,74
$125.29
$_--

16
Dairy Pro&ram Analysis
Analysis of the dairy enterprise can tell a great deal about the strengths and weaknesses of the dairy farm business. Information on this page should be used in conjunction with DHI and other dairy production information. Changes in dairy herd size and market values that occur during the year are identified in the table below. The change in inventory value without appreciation is attributed to physical changes in herd size and quality. This increase in inventory is included as an accrual farm receipt when calculating profitability without appreciation impacts.
DAIRY HERD INVENTORY Eastern New York Dairy Farm Renters and Owners, 1988
Dairy Cow§ Heifer§ ~r~d ~en Qa1.yes
Item No. value No. yalue No. Value No. Value
24 Dairy FaIm Renters: Beg. year (owned) 63 $56.021 15 $10,196 16 $6.346 18 $3,013
+ Change wlo apprec. 2,205 1,160 54 181 + Appreciation 2,024 415 29:2 327 End year (owned) 66 $60.250 16 $11,771 16 $6,642 19 $3,521 End incl. leased 67 Average number 66 50 (all age groups)
138 Da1ry FaIm Owners: Beg. year (owned) 87 $75,778 24 $15,924 21 $8,223 21 $3,906
+ Change wlo apprec. 227 330 538 312 + Appreciation 2,832 652 240 4Q5 End year (owned) 87 $78,837 24 $16,906 21 $9,301 22 $4,623 End incl. leased 87 Average number 86 66 (all age groups)
My FaJ;:m: Beg. of year (owned) $_ $_ $_ $_
+ Change wlo apprec. + Appreciation End of year (owned) $== $== $== $== End including leased Average number (all age groups)
Total milk sold and milk sold per cow are extremely valuable measures of productivity on the dairy farm. These measures of milk output are based on pounds of milk marketed during the year. Farm managers on DHI should compare milk sold per cow with rolling herd average on the test date nearest December 31.
MILK PRODUCTION Eastern New York Dairy Farm Renters and Owners, 1988
Item 24 Dairy
FaJ;:m Renters 138 Dairy
Farm OwneJ;:s My FaJ;:m
Total milk sold, 1bs. Milk sold per cow, 1bs. Average milk plant test, % butterfat
1,078,132 16,263
3.69
1,382,557 16,010
3,66

17
The cost of producin& milk has been compiled using the whole farm method, and is featured in the following table. Accrual receipts from milk sales are compared with the accrual costs of producing milk per hundredweight of milk. Using the whole farm method, operatin& costs of producing milk are estimated by deducting nonmilk accrual receipts from total accrual operating expenses plus expansion livestock purchased. Total costs of producing milk include the operating costs plus depreciation on machinery and buildings, the value of operator(s') labor and management, and an interest charge for using equity capital. Note that the cost of labor, management, and equity capital has been excluded in the intermediate compilation.
ACCRUAL RECEIPTS FROM DAIRY AND COST OF PRODUCING MILK Eastern New York Dairy Farm Renters and Owners, 1988
Item 24 B,enteI§
Total Per Cwt, 138 Owners
Total PeI Cwt. M~
Total Fam
Per Cwt.
Accr!.H!l Costs of Producin& Milk Operating costs Total costs with
out opes') labor, mgmt. & capital
Total Costs
$106,657
$116,050 $147,684
$9.89
$10.76 $13.70
$137,977
$157,062 $202,733
$9.98
$11.36 $14.66
$
$ $
$
$ $
ACCI!.H!l B,e~eipts fIsul! Milk $141,312 $13.11 $186,607 $13.50 $ $
The accrual operating expenses most commonly associated with the dairy enterprise are li.sted in the table below. Evaluating these costs per unit of production enables the comparison of different size dairy farms for strengths and areas for improvement.
DAIRY RELATED ACCRUAL EXPENSES Eastern New York Dairy Farm Renters and Owners, 1988
Average Per Cwt. Milk My Farm Item 24 RenteI§ 138 Owners PeI Cwt,
Purchased dairy grain & conc. $3.65 $3.89 $ Purchased dairy roughage 0.30 0.13
Total Purchased Dairy Feed $3.95 $4.02 $ Purchased grain & conc. as % of milk receipts 28% 29%
Purchased feed & crop expo $4.69 $4.91 $ Purchased feed & crop expo as % of milk receipts 36% 36% %
Breeding $0.24 $0.20 $ Veterinary & medicine 0.26 0.26 Milk marketing 0.80 0.83 Cattle lease 0.05 0.00 Other livestock expense 0.67 0.59
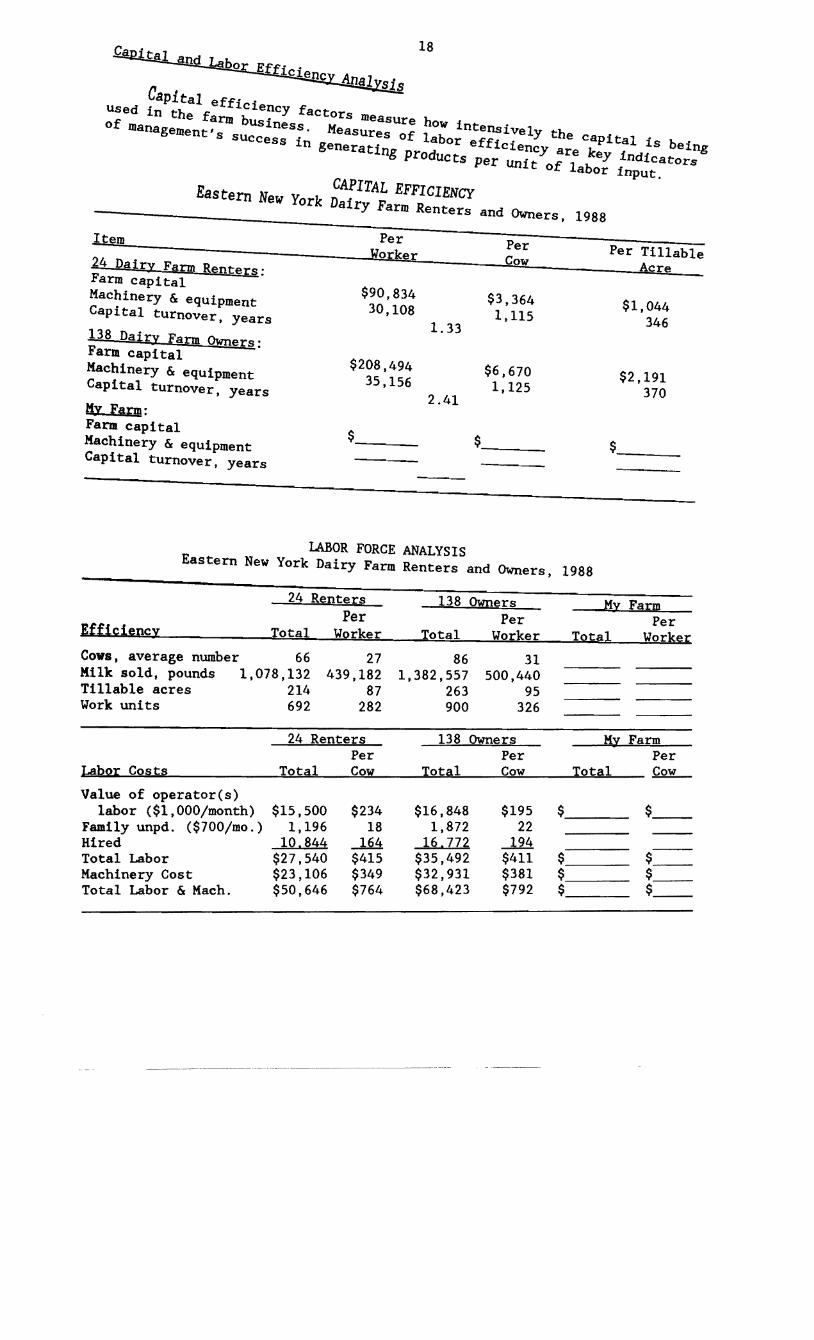
Capttal anQ Labor Ef~A~ 18
Capital efficiency factors measure how intensively the capital is being USed in the farm business. Measures of labor efficiency are key indicators of management's sUccess in generati~ prodUcts per unit of labor input.
CAPITAL EFFICIENCYEastern New York Dairy Farm Renters
and Owners, 1988
tem Per
24 Dairy Farm Renters: Farm capital Machinery & equipment Capital turnover, years
138 DailY Farm Owners: Farm capital Machinery & equipment Capital turnover, years
My Farm: Farm capital Machinery & equipment Capital turnover, years
Cow
$90,834 $3,36430,108 1,115
1. 33
$208,494 $6,67035,156 1,125
2.41
$,--- $_--
Per Tillable c e
$1,044 346
$2,191 370
$_--
LABOR FORCE ANALYSISEastern New York Dairy Farm Renters and Owners, 1988
24 Renters 138 Owners My FarmPer Per Per
Efficiency Total Yorker Total Yorker Total Yorkel ber 66 27 86 31Cows, average num 1 078 132
Milk sold, pounds , '214 439,182 1 382,557 500,440 , 263Tillable acres 692 87 95
York units 282 900 326
138 Owners My Farm Per
Total Cow
$15,500 $234 $16,848 $195 1,196 18 1,872 22
10,844 164 16,772 194 $27,540 $415 $35,492 $411 $. -- $ $23,106 $349 $32,931 $381 $ $ --$50,646 $764 $68,423 $792 $ $ -

19
PROGRESS OF THE FARM BUSINESS
Comparing your business with average data from regional DFBS cooperators that participated in both of the last two years is one part of a business checkup. It is equally important for you to determine the progress your business has made over the past two or three years and to set targets or goals for the future.
PROGRESS OF THE FARM BUSINESS Same 20 Eastern New York Dairy Farm Renters, 1987 and 1988
Average My Farm Selected Factors 1987 1988 1987 1988 Goal
Size of Business Average number of cows Average number of heifers Milk sold, 1bs. Yorker equivalent Total tillable acres
Rates of Production Milk sold per cow, 1bs. Hay DM per acre, tons Corn silage per acre, tons
Labor Efficiency Cows per worker Milk sold per worker, 1bs.
Cost Control Grain & conc. purchased
as % of milk sales Dairy feed & crop expo
per cwt. milk Labor & mach. costs/cow
Capital Efficiency* Farm capital per cow Mach. & equip. per cow Capital turnover, years
Profitability Net farm inc. w/o apprec. Net farm inc. w/apprec. Labor & mgmt. income
per operator/manager Rate of return on eq.
capital w/apprec. Rate of return on all
capital w/apprec.
Financial Summary Farm net worth Debt to asset ratio Farm debt per cow
*Average for the year.
71 71 54 55
1,132,406 1,163,566 2.61
227
15,994 2.5
15
27 433,457
23%
$4.18 $761
$3,300 $1,149
1.3
$32,163 $39,503
$23,286
8.8%
8.6%
$175,055 0.28 $940
2.65 232
16,342 2.5
13
27 439,082
28%
$4.69 $780
$3,504 $1,183
1.4
$26,331 $31,628
$16,266
3.4%
4.6%
$181,039 0.29
$1,045
--_%
$___ $___
$___ $___
$___ $___
$___
---_%
---_%
$_-
$_-
---_% --_%
$ $_-$_-_$_-
$_-_$_-$ $_-
$_-_$_-$_-_$_-
$ $_-
--_% ---_%
---_% --_%
$_-- $_-
$_-- $_-

Other Asricultura1 Economics Extension Publications
No. 89-7 National Dairy Markets and Policy and Some A. Novakovic Implications for New York
No. 89-8 Dairy Farm Business Summary, Northern S. Smith New York, 1988 L. Putnam
No. 89-9 Dairy Farm Business Summary, Western Plain S. Smith Region, 1988 L. Putnam
No. 89-10 Dairy Farm Business Summary, Northern S. Smith Hudson Region, 1988 L. Putnam
No. 89-11 Dairy Farm Business Summary, Eastern R. Milligan Plateau Region, 1988 L. Putnam
C. Crispell J. Mierek G. LeClar
No. 89-12 Dairy Farm Business Summary, Oneida-Mohawk E. LaDue Region, 1988 G. Andrew
B. Aldrich
No. 89-13 Dairy Farm Business Summary, Central New W. Knoblauch York and Central Plain Regions, 1988 L. Putnam
No. 89-14 Dairy Farm Business Summary, Western G. Casler Plateau Region, 1988
No. 89-15 Dairy Farm Business Summary, Southeastern S. Smith New York, 1988 L. Putnam
No. 89-16 Income Tax Consequences of Farm Debt G. Casler Cancellation and Bankruptcy
No. 89-17 Factors Affecting Profitability on Limited B. Stanton Resource Dairy Farms, New York, 1986
No. 89-18 Staying Competitive Into the 21st Century: O. Forker Issues and Challenges Facing the New York A. Novakovic State Dairy Industry