eas 161: milk and milk products - public.resource.org · iso 2859-1 describes plans for use in all...
TRANSCRIPT

≠ EDICT ±OF
GOVERNMENT In order to promote public education and public safety, equal justice for all, a better informed citizenry, the rule of law, world trade and world peace, this legal document is hereby made available on a noncommercial basis, as it is the right of all humans to know and speak the laws that govern them.
EAS 161 (2000) (English): Milk and milkproducts — Sampling —Inspection byattributes


EAS 161:2000 ICS 67.100.01
© EAS 2000 First Edition 2000
EAST AFRICAN STANDARD Milk and milk products — Sampling – Inspection by attributes
EAST AFRICAN COMMUNITY

EAS 161:2000
ii © EAS 2000 — All rights reserved
Foreword Development of the East African Standards has been necessitated by the need for harmonizing requirements governing quality of products and services in East Africa. It is envisaged that through harmonized standardization, trade barriers which are encountered when goods and services are exchanged within the Community will be removed. In order to achieve this objective, the Partner States in the Community through their National Bureaux of Standards, have established an East African Standards Committee.
The Committee is composed of representatives of the National Standards Bodies in Partner States, together with the representatives from the private sectors and consumer organizations. Draft East African Standards are circulated to stakeholders through the National Standards Bodies in the Partner States. The comments received are discussed and incorporated before finalization of standards, in accordance with the procedures of the Community.
East African Standards are subject to review, to keep pace with technological advances. Users of the East African Standards are therefore expected to ensure that they always have the latest versions of the standards they are implementing.
© East African Community 2000 — All rights reserved*
East African Community
P O Box 1096
Arusha
Tanzania
Tel: 255 27 2504253/8
Fax: 255-27-2504481/2504255
E-Mail: [email protected]
Web: www.each.org
*
© 2000 EAC — All rights of exploitation in any form and by any means reserved worldwide for EAC Partner States’ NSBs.

Reference numbersISO 5538:2004(E)
IDF 113:2004(E)
© ISO and IDF 2004
INTERNATIONAL STANDARD
ISO5538
IDF113
Second edition2004-12-01
Milk and milk products — Sampling — Inspection by attributes
Lait et produits laitiers — Échantillonnage — Contrôle par attributs

ISO 5538:2004(E) IDF 113:2004(E)
PDF disclaimer This PDF file may contain embedded typefaces. In accordance with Adobe's licensing policy, this file may be printed or viewed but shall not be edited unless the typefaces which are embedded are licensed to and installed on the computer performing the editing. In downloading this file, parties accept therein the responsibility of not infringing Adobe's licensing policy. Neither the ISO Central Secretariat nor the IDF accepts any liability in this area.
Adobe is a trademark of Adobe Systems Incorporated.
Details of the software products used to create this PDF file can be found in the General Info relative to the file; the PDF-creation parameters were optimized for printing. Every care has been taken to ensure that the file is suitable for use by ISO member bodies and IDF national committees. In the unlikely event that a problem relating to it is found, please inform the ISO Central Secretariat at the address given below.
© ISO and IDF 2004 All rights reserved. Unless otherwise specified, no part of this publication may be reproduced or utilized in any form or by any means, electronic or mechanical, including photocopying and microfilm, without permission in writing from either ISO or IDF at the respective address below.
ISO copyright office International Dairy Federation Case postale 56 • CH-1211 Geneva 20 Diamant Building • Boulevard Auguste Reyers 80 • B-1030 Brussels Tel. + 41 22 749 01 11 Tel. + 32 2 733 98 88 Fax + 41 22 749 09 47 Fax + 32 2 733 04 13 E-mail [email protected] E-mail [email protected] Web www.iso.org Web www.fil-idf.org
Published in Switzerland
ii © ISO and IDF 2004 – All rights reserved

ISO 5538:2004(E) IDF 113:2004(E)
© ISO and IDF 2004 – All rights reserved iii
Contents
Foreword............................................................................................................................................................ iv Introduction ....................................................................................................................................................... vi 1 Scope...................................................................................................................................................... 1 2 Normative references ........................................................................................................................... 1 3 Terms and definitions........................................................................................................................... 1 4 Sampling plans...................................................................................................................................... 2 5 Selection of sampling plan................................................................................................................... 2 5.1 Classification of defects....................................................................................................................... 2 5.2 Choice of inspection level and AQL.................................................................................................... 3 6 Records .................................................................................................................................................. 4 7 Selection of units .................................................................................................................................. 4 Annex A (normative) Statistical theory .......................................................................................................... 11 Annex B (normative) Critical defects ............................................................................................................. 12 Annex C (informative) Drawing of samples ................................................................................................... 14 Bibliography ..................................................................................................................................................... 20

ISO 5538:2004(E) IDF 113:2004(E)
iv © ISO and IDF 2004 – All rights reserved
Foreword
ISO (the International Organization for Standardization) is a worldwide federation of national standards bodies (ISO member bodies). The work of preparing International Standards is normally carried out through ISO technical committees. Each member body interested in a subject for which a technical committee has been established has the right to be represented on that committee. International organizations, governmental and non-governmental, in liaison with ISO, also take part in the work. ISO collaborates closely with the International Electrotechnical Commission (IEC) on all matters of electrotechnical standardization.
International Standards are drafted in accordance with the rules given in the ISO/IEC Directives, Part 2.
The main task of technical committees is to prepare International Standards. Draft International Standards adopted by the technical committees are circulated to the member bodies for voting. Publication as an International Standard requires approval by at least 75 % of the member bodies casting a vote.
Attention is drawn to the possibility that some of the elements of this document may be the subject of patent rights. ISO shall not be held responsible for identifying any or all such patent rights.
ISO 5538IDF 113 was prepared by Technical Committee ISO/TC 34, Food products, Subcommittee SC 5, Milk and milk products, and the International Dairy Federation (IDF), in collaboration with AOAC International. It is being published jointly by ISO and IDF and separately by AOAC International.
This edition of ISO 5538IDF 113 cancels and replaces ISO 5538:1987, of which it constitutes a minor revision. Only editorial changes have been made.
ISO 5538:2004(E) IDF 113:2004(E)
© ISO and IDF 2004 – All rights reserved v
Foreword
IDF (the International Dairy Federation) is a worldwide federation of the dairy sector with a National Committee in every member country. Every National Committee has the right to be represented on the IDF Standing Committees carrying out the technical work. IDF collaborates with ISO and AOAC International in the development of standard methods of analysis and sampling for milk and milk products.
Draft International Standards adopted by the Action Teams and Standing Committees are circulated to the National Committees for voting. Publication as an International Standard requires approval by at least 50 % of the National Committees casting a vote.
ISO 5538IDF 113 was prepared by Technical Committee ISO/TC 34, Food products, Subcommittee SC 5, Milk and milk products, and the International Dairy Federation (IDF), in collaboration with AOAC International. It is being published jointly by ISO and IDF and separately by AOAC International.
All work was carried out by the Joint ISO/IDF/AOAC Group of Experts, Selection of samples (E26), under the aegis of its chairman, Mr D.C. Bettes (GB).
This edition of ISO 5538IDF 113 cancels and replaces IDF 113A:1990. Only editorial changes have been made.

ISO 5538:2004(E) IDF 113:2004(E)
vi © ISO and IDF 2004 – All rights reserved
Introduction
The sampling theory used in this International Standard is based on classifying a unit as “good” or “defective”. A “good” unit is one which meets the requirements of a specification, while a “defective” unit is one which does not. It is essential that the sample be taken at random. If it is not, the sampling plans will not give the stated protection. See Annex A.

INTERNATIONAL STANDARD ISO 5538:2004(E)IDF 113:2004(E)
© ISO and IDF 2004 – All rights reserved 1
Milk and milk products — Sampling — Inspection by attributes
1 Scope
1.1 This International Standard specifies sampling plans for the inspection by attributes of milk and milk products. It is intended to be used to choose a sample size for any situation where it is required to measure the conformity to a specification of a lot of a dairy product by examination of a representative sample.
1.2 This International Standard is applicable to the sampling of all milk products submitted in discrete lots, irrespective of whether the lots are from the same production. The acceptance or otherwise of any lot is a matter for the parties to a contract and is outside the scope of this International Standard.
1.3 This International Standard is intended to be used in all cases where attribute sampling plans are required for a dairy product, except that if specific compositional standards, specifications or contracts include different sampling schemes, those schemes are to be used.
1.4 This International Standard is not applicable to sampling for microbiological defects, unless otherwise agreed by the interested parties.
NOTE Methods of sampling for milk and milk products are given in ISO 707.
2 Normative references
The following referenced documents are indispensable for the application of this document. For dated references, only the edition cited applies. For undated references, the latest edition of the referenced document (including any amendments) applies.
ISO 2859-1:1999, Sampling procedures for inspection by attributes — Part 1: Sampling schemes indexed by acceptance quality limit (AQL) for lot-by-lot inspection
ISO 3534-1, Statistics — Vocabulary and symbols — Part 1: Probability and general statistical terms
ISO 3534-2, Statistics — Vocabulary and symbols — Part 2: Applied statistics
3 Terms and definitions
For the purposes of this document, the terms and definitions given in ISO 3534-1, ISO 3534-2 and the following apply.
3.1 acceptance quality limit AQL quality level that is the worst tolerable process average when a continuing series of lots is submitted for acceptance sampling
[ISO 2859-1:1999, definition 3.1.29]

ISO 5538:2004(E) IDF 113:2004(E)
2 © ISO and IDF 2004 – All rights reserved
4 Sampling plans
ISO 2859-1 describes plans for use in all situations, and gives an account of the theoretical background to the sampling tables. The plans are indexed by batch or lot size and acceptance quality limit (AQL).
5 Selection of sampling plan
5.1 Classification of defects
5.1.1 General
Before selection of a sampling plan, the contract or specification shall clearly define all critical, major and minor defects in such a way that they are unambiguously understood by all users of the contract, specification or document containing or referring to the sampling plan.
5.1.2 Critical defect
This is a defect that would make the product unacceptable. For the purposes of this International Standard, critical defects relate to the presence of toxic contaminants at a critically high level. Examples include heavy metals and pesticide residues.
In this case, the method to be adopted shall be that described in Annex B. It is necessary to decide on an acceptable risk of not detecting a certain percentage of defectives, where a defective is a unit which contains more than the critical level of the contaminant. It is impossible to guarantee freedom from contamination.
5.1.3 Major defect
This is a defect that is likely to make the product unfit for use; i.e. in the case of milk and milk products, unfit for sale to the consumer. A major defect would result in the product spoiling or becoming unfit for sale or processing. Examples include
a) composition defect, where this would affect keeping quality,
b) contamination with inhibitory substances,
c) integrity of packaging, and
d) visible contamination with dirt.
Sampling plans for major defects shall be selected from the Tables using an AQL of not more than 6,5 %.
5.1.4 Minor defect
This is a failure to comply with a specification, but which does not make the unit unfit for use and sale, nor cause it to spoil. Examples include
a) a unit, the chemical composition or net content of which falls outside, but close to, a specification limit, and
b) small abnormalities in appearance.
Sampling plans for minor defects shall be selected from Tables 1 to 24 using an AQL of not more than 10 %.

ISO 5538:2004(E) IDF 113:2004(E)
© ISO and IDF 2004 – All rights reserved 3
5.2 Choice of inspection level and AQL
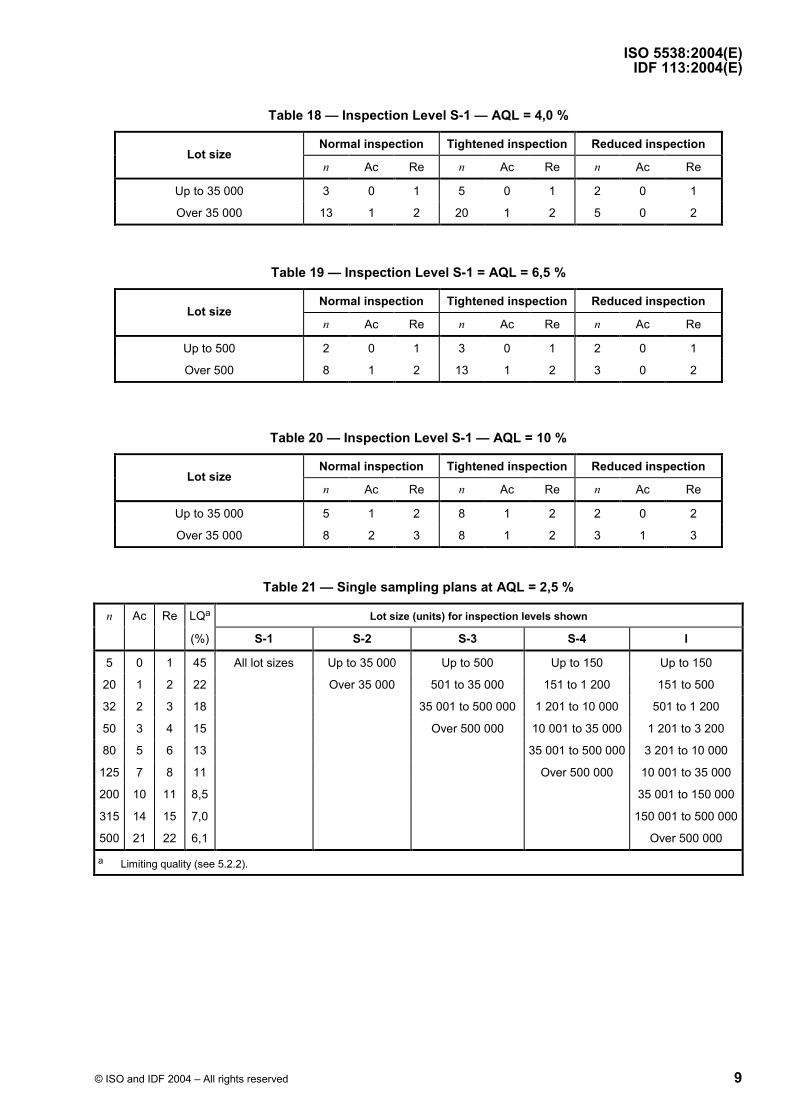
5.2.1 The sampling plan shall be selected from Tables 1 to 24, using the lot size and the agreed AQL.
In these Tables, n is the sample size, Ac is the acceptance number, and Re is the rejection number.
EXAMPLE For a sample size of n = 13, Ac = 0 and Re = 1, this means that if a sample of 13 units contains no defectives, the lot shall be accepted; if the sample contains 1 defective, the lot shall be rejected.
Tables 1 to 20 are derived from ISO 2859-1 and refer to Inspection Levels I, S-4, S-3, S-2 and S-1. Inspection Level I is preferred.
Using any of the S plans will result in increased risks, and they shall not be used without first checking that the associated risk is acceptable. Details of these risks are given in 5.2.2.
5.2.2 Inspection Levels S-4, S-3, S-2 and S-1 may be used where relatively small sample sizes are necessary and large sample risks may or must be tolerated. As a consequence of using these special levels, there is an increased probability of making a wrong decision. First, the consumer's risk increases. This is illustrated in Tables 21 to 24. Table 21 refers to plans with an AQL of 2,5 %, Table 22 to an AQL of 4,0 %, Table 23 to an AQL of 6,5 % and Table 24 to an AQL of 10 %.
Each Table contains
the sample size (n) and the appropriate lot size at the separate inspection levels,
maximum number of defective units permitted in the sample, i.e. the acceptance number (Ac),
minimum number of defective units required in the sample to reject the lot, i.e. the rejection number (Re), and
the limiting quality (LQ).
If the sample size is small, the LQ is high; if the sample size increases, the LQ is reduced at the same AQL.
For example, in Table 6, the inspection plan in which the sample size is 5 and LQ = 45 % appears in all the inspection levels but only at S-1 level can all lot sizes be inspected.
At the S-4 and I Inspection Levels, the sample size of 5 may only be taken when the lot size does not exceed 150.
The fact that the consumer's risk (and at the same time the LQ) becomes smaller as the size of the inspected lot becomes greater, is justified on economic grounds.
Inspection plans in which the LQ is several times greater than the AQL are unsuitable for both the consumer and producer. If a lot of 35 000 units is considered, Inspection Level I would require a sample size of 125, giving an LQ of 11 % (i.e. 95 % of lots containing 11 % of defects would be rejected). S-1 would require a sample size of 5, giving an LQ of 45 %. An LQ of 45 % is so much greater than the AQL of 2,5 % that the concept of AQL has become meaningless. Furthermore, the sample of 5 would wrongly reject more than 10 % of lots containing 2,5 % of defects.
Increasing the sample size increases both the protection to the consumer, and the discrimination of the sampling plan; this increased discrimination is one of the major reasons for relating sample size to lot size. Users of this International Standard will find full operating characteristics for each plan in ISO 2859-1; these relate the probability of acceptance to percent defective in the lot.
ISO 5538:2004(E) IDF 113:2004(E)
4 © ISO and IDF 2004 – All rights reserved
6 Records
Successful operation of this type of sampling plan requires the maintenance of comprehensive records of the results of inspection, and the plan in use. Interchange of information between both parties is useful, and it is recommended that each party make such information available to the other as required.
7 Selection of units
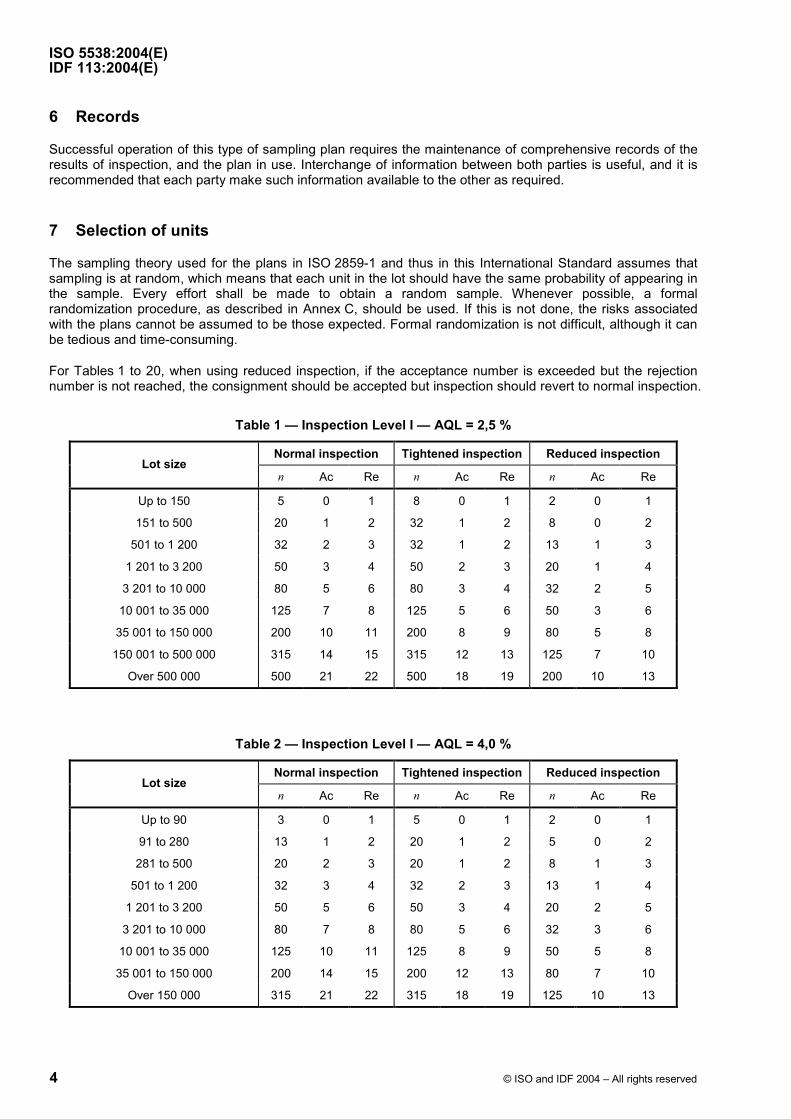
The sampling theory used for the plans in ISO 2859-1 and thus in this International Standard assumes that sampling is at random, which means that each unit in the lot should have the same probability of appearing in the sample. Every effort shall be made to obtain a random sample. Whenever possible, a formal randomization procedure, as described in Annex C, should be used. If this is not done, the risks associated with the plans cannot be assumed to be those expected. Formal randomization is not difficult, although it can be tedious and time-consuming.
For Tables 1 to 20, when using reduced inspection, if the acceptance number is exceeded but the rejection number is not reached, the consignment should be accepted but inspection should revert to normal inspection.
Table 1 — Inspection Level I — AQL = 2,5 %
Normal inspection Tightened inspection Reduced inspection Lot size
n Ac Re n Ac Re n Ac Re
Up to 150 5 0 1 8 0 1 2 0 1
151 to 500 20 1 2 32 1 2 8 0 2
501 to 1 200 32 2 3 32 1 2 13 1 3
1 201 to 3 200 50 3 4 50 2 3 20 1 4
3 201 to 10 000 80 5 6 80 3 4 32 2 5
10 001 to 35 000 125 7 8 125 5 6 50 3 6
35 001 to 150 000 200 10 11 200 8 9 80 5 8
150 001 to 500 000 315 14 15 315 12 13 125 7 10
Over 500 000 500 21 22 500 18 19 200 10 13
Table 2 — Inspection Level I — AQL = 4,0 %
Normal inspection Tightened inspection Reduced inspection Lot size
n Ac Re n Ac Re n Ac Re
Up to 90 3 0 1 5 0 1 2 0 1
91 to 280 13 1 2 20 1 2 5 0 2
281 to 500 20 2 3 20 1 2 8 1 3
501 to 1 200 32 3 4 32 2 3 13 1 4
1 201 to 3 200 50 5 6 50 3 4 20 2 5
3 201 to 10 000 80 7 8 80 5 6 32 3 6
10 001 to 35 000 125 10 11 125 8 9 50 5 8
35 001 to 150 000 200 14 15 200 12 13 80 7 10
Over 150 000 315 21 22 315 18 19 125 10 13
ISO 5538:2004(E) IDF 113:2004(E)
© ISO and IDF 2004 – All rights reserved 5
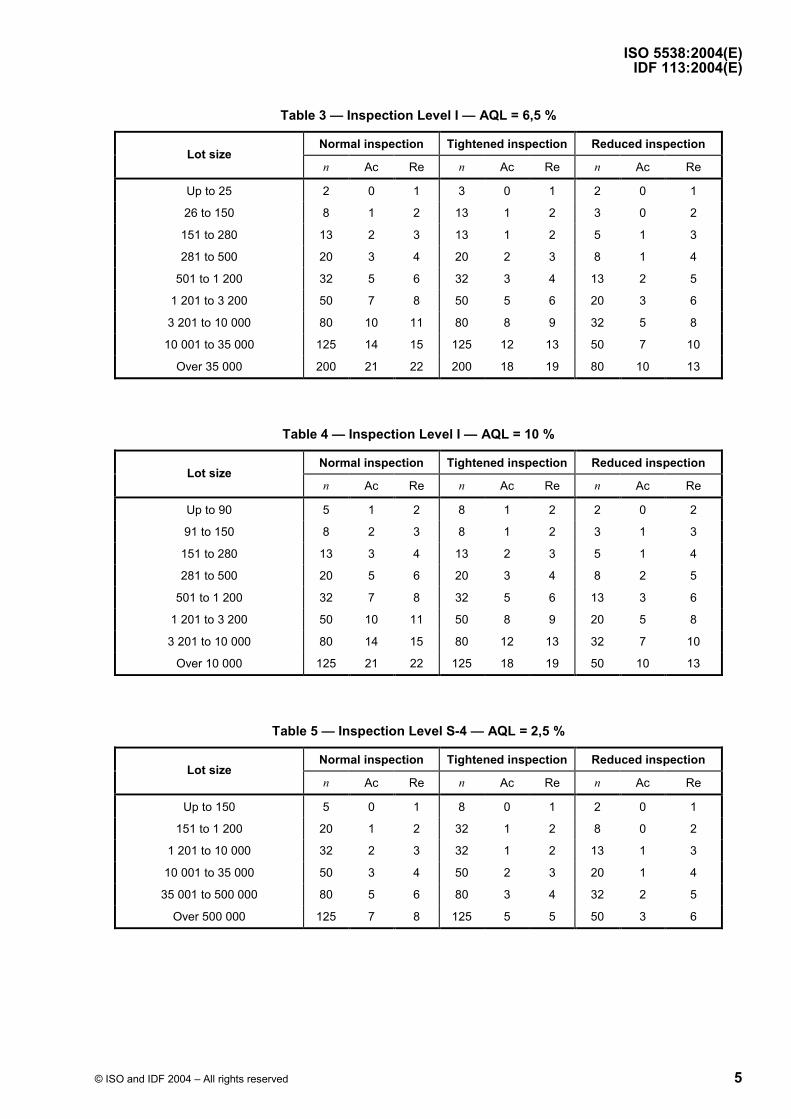
Table 3 — Inspection Level I — AQL = 6,5 %
Normal inspection Tightened inspection Reduced inspection Lot size
n Ac Re n Ac Re n Ac Re
Up to 25 2 0 1 3 0 1 2 0 1
26 to 150 8 1 2 13 1 2 3 0 2
151 to 280 13 2 3 13 1 2 5 1 3
281 to 500 20 3 4 20 2 3 8 1 4
501 to 1 200 32 5 6 32 3 4 13 2 5
1 201 to 3 200 50 7 8 50 5 6 20 3 6
3 201 to 10 000 80 10 11 80 8 9 32 5 8
10 001 to 35 000 125 14 15 125 12 13 50 7 10
Over 35 000 200 21 22 200 18 19 80 10 13
Table 4 — Inspection Level I — AQL = 10 %
Normal inspection Tightened inspection Reduced inspection Lot size
n Ac Re n Ac Re n Ac Re
Up to 90 5 1 2 8 1 2 2 0 2
91 to 150 8 2 3 8 1 2 3 1 3
151 to 280 13 3 4 13 2 3 5 1 4
281 to 500 20 5 6 20 3 4 8 2 5
501 to 1 200 32 7 8 32 5 6 13 3 6
1 201 to 3 200 50 10 11 50 8 9 20 5 8
3 201 to 10 000 80 14 15 80 12 13 32 7 10
Over 10 000 125 21 22 125 18 19 50 10 13
Table 5 — Inspection Level S-4 — AQL = 2,5 %
Normal inspection Tightened inspection Reduced inspection Lot size
n Ac Re n Ac Re n Ac Re
Up to 150 5 0 1 8 0 1 2 0 1
151 to 1 200 20 1 2 32 1 2 8 0 2
1 201 to 10 000 32 2 3 32 1 2 13 1 3
10 001 to 35 000 50 3 4 50 2 3 20 1 4
35 001 to 500 000 80 5 6 80 3 4 32 2 5
Over 500 000 125 7 8 125 5 5 50 3 6
ISO 5538:2004(E) IDF 113:2004(E)
6 © ISO and IDF 2004 – All rights reserved
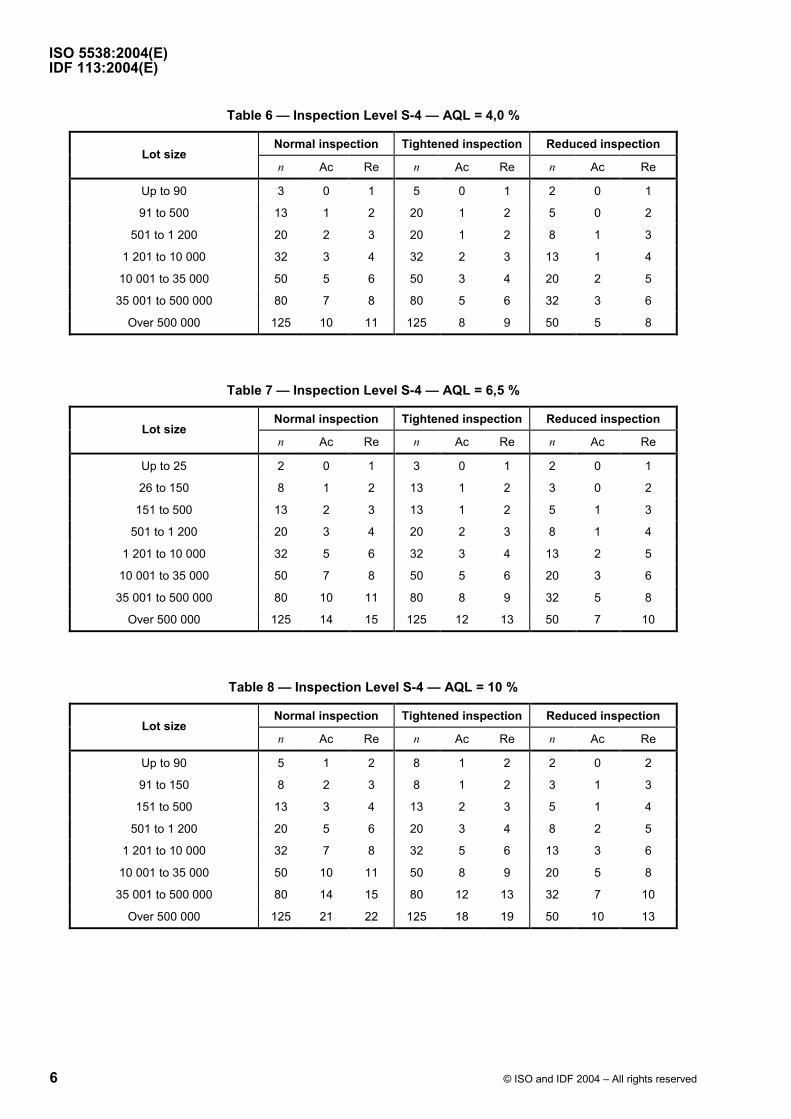
Table 6 — Inspection Level S-4 — AQL = 4,0 %
Normal inspection Tightened inspection Reduced inspection Lot size
n Ac Re n Ac Re n Ac Re
Up to 90 3 0 1 5 0 1 2 0 1
91 to 500 13 1 2 20 1 2 5 0 2
501 to 1 200 20 2 3 20 1 2 8 1 3
1 201 to 10 000 32 3 4 32 2 3 13 1 4
10 001 to 35 000 50 5 6 50 3 4 20 2 5
35 001 to 500 000 80 7 8 80 5 6 32 3 6
Over 500 000 125 10 11 125 8 9 50 5 8
Table 7 — Inspection Level S-4 — AQL = 6,5 %
Normal inspection Tightened inspection Reduced inspection Lot size
n Ac Re n Ac Re n Ac Re
Up to 25 2 0 1 3 0 1 2 0 1
26 to 150 8 1 2 13 1 2 3 0 2
151 to 500 13 2 3 13 1 2 5 1 3
501 to 1 200 20 3 4 20 2 3 8 1 4
1 201 to 10 000 32 5 6 32 3 4 13 2 5
10 001 to 35 000 50 7 8 50 5 6 20 3 6
35 001 to 500 000 80 10 11 80 8 9 32 5 8
Over 500 000 125 14 15 125 12 13 50 7 10
Table 8 — Inspection Level S-4 — AQL = 10 %
Normal inspection Tightened inspection Reduced inspection Lot size
n Ac Re n Ac Re n Ac Re
Up to 90 5 1 2 8 1 2 2 0 2
91 to 150 8 2 3 8 1 2 3 1 3
151 to 500 13 3 4 13 2 3 5 1 4
501 to 1 200 20 5 6 20 3 4 8 2 5
1 201 to 10 000 32 7 8 32 5 6 13 3 6
10 001 to 35 000 50 10 11 50 8 9 20 5 8
35 001 to 500 000 80 14 15 80 12 13 32 7 10
Over 500 000 125 21 22 125 18 19 50 10 13

ISO 5538:2004(E) IDF 113:2004(E)
© ISO and IDF 2004 – All rights reserved 7
Table 9 — Inspection Level S-3 — AQL = 2,5 %
Normal inspection Tightened inspection Reduced inspection Lot size
n Ac Re n Ac Re n Ac Re
Up to 500 5 0 1 8 0 1 2 0 1
501 to 35 000 20 1 2 32 1 2 8 0 2
35 001 to 500 000 32 2 3 32 1 2 13 1 3
Over 500 000 50 3 4 50 2 3 20 1 4
Table 10 — Inspection Level S-3 — AQL = 4,0 %
Normal inspection Tightened inspection Reduced inspection Lot size
n Ac Re n Ac Re n Ac Re
Up to 150 3 0 1 5 0 1 2 0 1
151 to 3 200 13 1 2 20 1 2 5 0 2
3 201 to 35 000 20 2 3 20 1 2 8 1 3
35 001 to 500 000 32 3 4 32 2 3 13 1 4
Over 500 000 50 5 6 50 3 4 20 2 5
Table 11 — Inspection Level S-3 — AQL = 6,5 %
Normal inspection Tightened inspection Reduced inspection Lot size
n Ac Re n Ac Re n Ac Re
Up to 50 2 0 1 3 0 1 2 0 1
51 to 500 8 1 2 13 1 2 3 0 2
501 to 3 200 13 2 3 13 1 2 5 1 3
3 201 to 35 000 20 3 4 20 2 3 8 1 4
35 001 to 500 000 32 5 6 32 3 4 13 2 5
Over 500 000 50 7 8 50 5 6 20 3 6
Table 12 — Inspection Level S-3 — AQL = 10 %
Normal inspection Tightened inspection Reduced inspection Lot size
n Ac Re n Ac Re n Ac Re
Up to 150 5 1 2 8 1 2 2 0 2
151 to 500 8 2 3 8 1 2 3 1 3
501 to 3 200 13 3 4 13 2 3 5 1 4
3 201 to 35 000 20 5 6 20 3 4 8 2 5
35 001 to 500 000 32 7 8 32 5 6 13 3 6
Over 500 000 50 10 11 50 8 9 20 5 8

ISO 5538:2004(E) IDF 113:2004(E)
8 © ISO and IDF 2004 – All rights reserved
Table 13 — Inspection Level S-2 — AQL = 2,5 %
Normal inspection Tightened inspection Reduced inspection Lot size
n Ac Re n Ac Re n Ac Re
Up to 35 000 5 0 1 8 0 1 2 0 1
Over 35 000 20 1 2 32 1 2 8 0 2
Table 14 — Inspection Level S-2 — AQL = 4,0 %
Normal inspection Tightened inspection Reduced inspection Lot size
n Ac Re n Ac Re n Ac Re
Up to 1 200 3 0 1 5 0 1 2 0 1
Over 1 200 13 1 2 20 1 2 5 0 2
Table 15 — Inspection Level S-2 — AQL = 6,5 %
Normal inspection Tightened inspection Reduced inspection Lot size
n Ac Re n Ac Re n Ac Re
Up to 150 2 0 1 3 0 1 2 0 1
151 to 35 000 8 1 2 13 1 2 3 0 2
Over 35 000 13 2 3 13 1 2 5 1 3
Table 16 — Inspection Level S-2 — AQL = 10 %
Normal inspection Tightened inspection Reduced inspection Lot size
n Ac Re n Ac Re n Ac Re
Up to 1 200 5 1 1 8 1 2 2 0 2
1 201 to 35 000 8 2 3 8 1 2 3 1 3
Over 35 000 13 32 4 13 2 3 5 1 4
Table 17 — Inspection Level S-1 — AQL = 2,5 %
Normal inspection Tightened inspection Reduced inspection Lot size
n Ac Re n Ac Re n Ac Re
All lot sizes 5 0 1 8 0 1 2 0 1
ISO 5538:2004(E) IDF 113:2004(E)
© ISO and IDF 2004 – All rights reserved 9
Table 18 — Inspection Level S-1 — AQL = 4,0 %
Normal inspection Tightened inspection Reduced inspection Lot size
n Ac Re n Ac Re n Ac Re
Up to 35 000 3 0 1 5 0 1 2 0 1
Over 35 000 13 1 2 20 1 2 5 0 2
Table 19 — Inspection Level S-1 = AQL = 6,5 %
Normal inspection Tightened inspection Reduced inspection Lot size
n Ac Re n Ac Re n Ac Re
Up to 500 2 0 1 3 0 1 2 0 1
Over 500 8 1 2 13 1 2 3 0 2
Table 20 — Inspection Level S-1 — AQL = 10 %
Normal inspection Tightened inspection Reduced inspection Lot size
n Ac Re n Ac Re n Ac Re
Up to 35 000 5 1 2 8 1 2 2 0 2
Over 35 000 8 2 3 8 1 2 3 1 3
Table 21 — Single sampling plans at AQL = 2,5 %
n Ac Re LQa Lot size (units) for inspection levels shown
(%) S-1 S-2 S-3 S-4 I
5 0 1 45 All lot sizes Up to 35 000 Up to 500 Up to 150 Up to 150
20 1 2 22 Over 35 000 501 to 35 000 151 to 1 200 151 to 500
32 2 3 18 35 001 to 500 000 1 201 to 10 000 501 to 1 200
50 3 4 15 Over 500 000 10 001 to 35 000 1 201 to 3 200
80 5 6 13 35 001 to 500 000 3 201 to 10 000
125 7 8 11 Over 500 000 10 001 to 35 000
200 10 11 8,5 35 001 to 150 000
315 14 15 7,0 150 001 to 500 000
500 21 22 6,1 Over 500 000
a Limiting quality (see 5.2.2).

ISO 5538:2004(E) IDF 113:2004(E)
10 © ISO and IDF 2004 – All rights reserved
Table 22 — Single sampling plans at AQL = 4,0 %
n Ac Re LQa Lot size (units) for inspection levels shown
(%) S-1 S-2 S-3 S-4 I
3 0 1 63 Up to 35 000 Up to 1 200 Up to 150 Up to 90 Up to 90
13 1 2 32 Over 35 000 Over 1 200 151 to 3 200 91 to 500 91 to 280
20 2 3 28 3 201 to 35 000 501 to 1 200 281 to 500
32 3 4 23 35 001 to 500 000 1 201 to 10 000 501 to 1 200
50 5 6 20 Over 500 000 10 001 to 35 000 1 201 to 3 200
80 7 8 16 35 001 to 500 000 3 201 to 10 000
125 10 11 14 Over 500 000 10 001 to 35 000
200 14 15 11 35 001 to 150 000
315 21 22 9,6 Over 150 000
a Limiting quality (see 5.2.2).
Table 23 — Single sampling plans at AQL = 6,5 %
n Ac Re LQa Lot size (units) for inspection levels shown
(%) S-1 S-2 S-3 S-4 I
2 0 1 78 Up to 500 Up to 150 Up to 50 Up to 25 Up to 25
8 1 2 47 Over 500 151 to 35 000 51 to 500 26 to 150 26 to 150
13 2 3 41 Over 35 000 501 to 3 200 151 to 500 151 to 280
20 4 5 34 3 201 to 35 000 501 to 1 200 281 to 500
32 5 6 30 35 001 to 500 000 1 201 to 10 000 501 to 1 200
50 7 8 25 Over 500 000 10 001 to 35 000 1 201 to 3 200
80 10 11 20 35 001 to 500 000 3 201 to 10 000
125 14 15 18 Over 500 000 10 001 to 35 000
200 21 22 15 Over 35 000
a Limiting quality (see 5.2.2).
Table 24 — Single sampling plans at AQL = 10 %
n Ac Re LQa Lot size (units) for inspection levels shown
(%) S-1 S-2 S-3 S-4 I
5 1 2 66 Up to 35 000 Up to 1 200 Up to 150 Up to 90 Up to 90
8 2 3 60 Over 35 000 1 201 to 35 000 151 to 500 91 to 150 916 to 150
13 3 4 50 Over 35 000 501 to 3 200 151 to 500 151 o 280
20 5 6 46 3 201 to 35 000 501 to 1 200 281 oo 500
32 7 8 37 35 001 to 500 000 1 201 to 10 000 501 o 1 200
50 10 11 32 Over 500 000 10 001 to 35 000 1 201 o 3 200
80 14 15 26 35 001 to 500 000 3 201 o 10 000
125 21 22 24 Over 500 000 Over 10 000
a Limiting quality (see 5.2.2).
ISO 5538:2004(E) IDF 113:2004(E)
© ISO and IDF 2004 – All rights reserved 11
Annex A (normative)
Statistical theory
A.1 The sampling plans included in ISO 2859-1, from which these plans are drawn, are based on either Poisson or binomial distribution theory.
Binomial distribution is used for the smaller sizes, and Poisson distribution for those schemes where this distribution is an adequate approximation to the binomial. ISO 2859-1 gives more details.
A.2 It is only necessary to satisfy two requirements in order to use the sampling theory. Firstly, an individual unit can only be “good” or “defective” as defined in the Introduction. Secondly, the sample must be drawn at random as defined in ISO 2859-1:1999, Clause 8. It is not necessary to make any assumptions about the distribution of defectives within the lot.

ISO 5538:2004(E) IDF 113:2004(E)
12 © ISO and IDF 2004 – All rights reserved
Annex B (normative)
Critical defects
Critical defects form a special category. It is impossible to choose any value of percent defective for these defects and say: “This percentage of defectives is tolerable.”
The solution generally adopted, where non-destructive inspection is involved, is to lay down that critical features are to be inspected using a sample size equal to the lot size and an acceptance number of zero. This is 100 % inspection, but it should be noted that it is not the traditional 100 % sorting. Here there is no attempt to sort the articles into the good and the bad, but an attempt to check that there are no bad ones. If a critical defective is found, this does not merely mean that it is put into a different box and the inspection continues; it means that the whole lot is rejected (although rejection does not necessarily mean scrapping).
Whenever possible, it should also mean that production is stopped while a thorough investigation takes place to attempt to discover how the defect arose and to devise methods to prevent another occurrence. The reason for this procedure is to try to prevent the production of critical defectives and to avoid giving the manufacturer the impression that, since the inspector will sort them out for him, it will not matter too much if he produces some. Even the best inspector may occasionally fail to notice a defect, so it is only by preventing critical defectives from being made that it can be ensured that none will get through to the customer.
If it is ever thought that any particular critical defect does not warrant this procedure, then serious consideration should be given to having it reclassified as a major defect. Critical defects really must be critical, then no amount of effort is too great.
According to the definition of a critical defect (see 5.1.2), this classification should be used for a defect that is likely to cause hazardous or unsafe conditions for individuals using, maintaining, or depending upon the product.
The wording “is likely to” is important. There is sometimes a tendency to replace these words by “could possibly” and hence to classify everything as critical, since it is always possible to make up a story in which some trivial happening at the beginning leads to catastrophe at the end.
If this approach is adopted, the main result is to devalue the critical classification, and the genuine critical defects may not be treated as severely as they should be.
The critical classification is also available for a defect that is likely to prevent performance of the practical function of a major end item. Again, the italicized words are important if the critical classification is not to be devalued.
Where the only possible inspection for critical defects is destructive, the search for ways of preventing them from ever being made at all is even more important. In this case, we cannot have a sample which is 100 % of the lot, and it is necessary to decide what sample should be taken for inspection for critical defects. This can be done using a simple formula connecting the percent defective for which, if it were present, we would wish to be almost certain of finding at least one defective in the sample, the sample size, and the risk we are prepared to take of failing to find a defective.
The formula is
= FnD

ISO 5538:2004(E) IDF 113:2004(E)
© ISO and IDF 2004 – All rights reserved 13
where
n is the sample size;
F is a factor depending upon the risk;
D is the percent defective it is wished to detect if present.
The factor F depends upon the risk of failing to find a defective in the sample, as follows:
Risk Factora
1 in 10 230,26 1 in 100 460,52
1 in 1 000 690,78 1 in 10 000 921,04
1 in 100 000 1 151,30 1 in 1 000 000 1 381,56
a The factor of other values of the risk, if required, can be calculated as
1230,26 lg
risk
.
As found from this formula, the sample size will often not be as whole number. It is best to round up to the next higher whole number, rather than round to the nearest whole number.
The acceptance number is, of course, always zero in this context.
This formula is accurate only for small values of percent defective, say, not greater than 10, but this is not disadvantageous since it is never needed to consider high values of percent defective for critical defects anyway.
If the formula were used for, say, 20 % or 50 % defective, it would over-estimate the sample size needed.
EXAMPLE For a certain product, inspection for critical defects is destructive, and it is decided that if a lot were to contain as many as 2 % of critical defectives, a risk of only 1 in 10 000 should be taken of failing to find a defective in the sample.
The formula gives:
921,04460,52
2n = =
The sampling plan for criticals is:
sample size: 461
acceptance number: 0 defective
rejection number: 1 defective
An alternative plan for critical defects, where the defect is something that can be measured rather than a pure attribute, is to sample with a safety margin. Thus, if the minimum allowable breaking load for some component were 2 000 kg, it might be possible, instead of saying that the limit was 2 000 kg and the defect was critical, to say that the limit was 2 500 kg and the defect was major. Just where the limits should be set, and what plan is allowable, depends upon some past knowledge of the amount of variability observed in the strength of the components in question. When this approach is possible, it can give much more satisfactory results for all concerned than seeking for critical defectives (and hoping that there are none present) can do.
ISO 5538:2004(E) IDF 113:2004(E)
14 © ISO and IDF 2004 – All rights reserved
Annex C (informative)
Drawing of samples
In acceptance sampling, a lot is sentenced on the quality of sample. If this is to be a rational procedure, it is obviously important that the sample should be representative of the lot, and not a biased sample in any way. Some inspectors pride themselves on their ability, given a lot from which to draw a sample, to pick all the bad ones. If the purpose is to demonstrate that there are some bad ones, or to improve the lot by rejecting the bad ones found, then this ability is a desirable characteristic. But it is not what is required here. For a correct sentencing of the lot, it is desired that the sample be of the same quality as the lot — neither better nor worse.
There is no known way of ensuring that the sample is just the same quality as the lot, unless the quality of the lot is already known, in which case there would be no need to draw a sample to sentence it. There are, however, sampling methods which give unbiased samples in the sense that, although some samples will be worse and some better than their lots, on the average they will be just right and only the inevitable variability of sampling will lead to discrepancies. Furthermore, these methods allow one to calculate the variability of the sample in relation to the quality of the lot, and it is upon these calculations that the drawing of operating characteristic curves depends.
Such a method is simple random sampling: all possible samples of the required size have an equal chance of being the sample drawn. Tables 1 to 24, describing the sampling plans, presume that the samples (single, double or multiple) are drawn following this method. It is very important that this is in fact the case.
EXAMPLE Suppose the lot size is 4, and the sample size is 2. If each item in the lot is given a letter of the alphabet as its “name”, the lot consists of the 4 items A, B, C and D. There are 6 possible ways of making up the sample size of 2.
These are:
A and B
or A and C
or A and D
or B and C
or B and D
or C and D
For simple random sampling, each of these 6 possibilities must be given an equal chance. In this particular case, an ordinary six-sided dice could be thrown to choose A and B if the dice showed one pip, but A and C if it showed 2 pips, and so on.
In this example, the problem of simple random sampling is relatively easily solved, since the numbers involved were deliberately chosen to be very small, leading to only 6 possibilities for the sample. But it is clear that number of possibilities very rapidly increases as lot size and sample size increase. For instance, for a sample of 5 from a lot of 20, there are 15 504 possibilities; for a sample of 7 from a lot of 30, there are over 2 million possibilities; for a sample of 10 from a lot of 50, there are over 10 000 million; and these are still fairly small sample sizes and lot sizes. It is clear therefore that simple random sampling, with lot sizes and sample sizes such as those most often used in practice, is not easy, but an attempt must be made to make as nearly a random a choice as possible.
The one really vital requirement is that the entire lot must be presented to the inspector for him to draw the sample. Cases have been heard of where a manufacturer has offered an inspector a ready-made sample while keeping back the rest of the lot, and cases even where a manufacturer has offered the sample as soon as the number of articles in the sample size had been made, informing the inspector that the remainder of the

ISO 5538:2004(E) IDF 113:2004(E)
© ISO and IDF 2004 – All rights reserved 15
lot would not be manufactured until the sampling results were known. Clearly, in such circumstances there is no reason to suppose that the sample is in any way representative of the lot, and no lot should ever be sentenced on the basis of such a sample.
It should be made clear that this does not prohibit the submission of a pre-production sample. It is quite common and reasonable for the manufacturer to submit, or be required to submit, a sample before bulk production starts, for approval of the article he is intending to procedure.
This is not the same thing as the submission of a sample for acceptance or rejection of a lot.
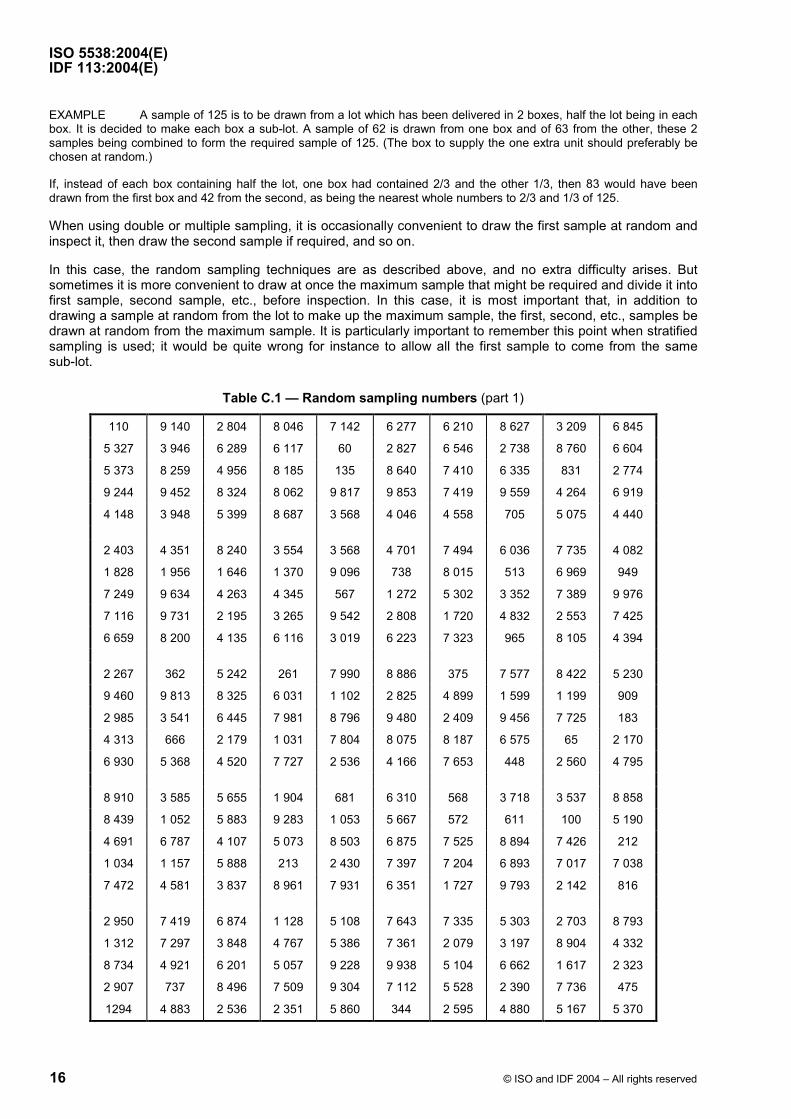
Sometimes it is possible to give each article in the lot a number, either physically by writing the number on it or beside it, or mentally by some device such as noting that “Article No. 124” means “1st row, 2nd box, 4th article inside the box”. If this can be done, it is then possible to draw a random sample by using a table of random numbers. Examples of such a table are given as Tables C.1 to C.4.
EXAMPLE A sample size of 8 is to be drawn from a lot of 5 000. The articles in the lot are labelled with numbers from 1 to 5 000, and starting at the top of the first column of Table C.1, the articles to be drawn for the samples are numbers 110, 4 148, 2 403, 1 828, 2 267, 2 985, 4 313 and 4 691 (the numbers 5 327, 5 373, 9 244, etc. are ignored since corresponding articles would not be found in the lot).
Three points should be noted with regard to the use of a table of random sampling numbers, as follows.
a) It is not correct always to start at the top of the first column. For each sample to be drawn, the best procedure is to start from where the previous sample finished and thus work through the table.
b) It is permissible, having worked through the table, to return to the beginning and work through again, but it is better, if possible, to proceed to a new table rather than to repeat the old one.
c) There is no need to read the numbers as having 4 figures. If the lot size were 1 000 or less, the first 3 figures would be adequate, and would be read as 11, 532, 537, etc. Sometimes 2 figures are enough, sometimes more than 4 are required. As many or as few as desired may be combined.
There is nothing difficult about the use of random numbers, provided that the articles can be numbered, but it is often argued that their use is not worth the trouble, and an intuitively random sample is as good. In many cases this may be true, but the intuitively random sample is often very far from being random in fact. For example, people drawing items supposedly at random from a box will usually draw too many from the middle and the corners will not be adequately represented. When it is pointed out that they are taking too few from the corners, they will then often start to take too many from the corners. The simple randomness of giving every combination an equal chance is very elusive, and the extra trouble of using random numbers where possible is undoubtedly worthwhile.
It should be recognized, however, that the use of random numbers is not always easy. If the lot consists of a large box of small articles, it may be quite impracticable to give each one a number. In such circumstances, intuitively random sampling is probably all that can be done, but if intuition is modified by knowledge of what would be done if it were possible, this will help to obtain better results.
Knowing that every possible combination must have an equal chance makes it clear at once that the articles must be taken out of the box to make them all equally available before the sample is drawn, and also that any apparent quality of the articles should be ignored. There must not be deliberate choosing of articles which appear good or bad.
There is one alternative to simple random sampling which is allowable, indeed desirable, where appropriate, and it may be used whether or not random numbers are used.
This alternative is known as stratified sampling (also referred to as “representative sampling”). This is appropriate whenever a lot can be split into sub-lots according to some logical criterion. Note that the criterion must be a logical one; splitting into sub-lots at random will not help. The sample is drawn by taking a sub-sample from each sub-lot proportional in size to the size of the sub-lot. The sub-samples must be drawn at random from within the sub-lot (using random numbers, if possible) and finally the sub-samples are combined to make up the complete sample before inspection. However, see ISO 2859-1 for a warning about difficulties that may arise if 2 or more sources of supply are mixed.
ISO 5538:2004(E) IDF 113:2004(E)
16 © ISO and IDF 2004 – All rights reserved
EXAMPLE A sample of 125 is to be drawn from a lot which has been delivered in 2 boxes, half the lot being in each box. It is decided to make each box a sub-lot. A sample of 62 is drawn from one box and of 63 from the other, these 2 samples being combined to form the required sample of 125. (The box to supply the one extra unit should preferably be chosen at random.)
If, instead of each box containing half the lot, one box had contained 2/3 and the other 1/3, then 83 would have been drawn from the first box and 42 from the second, as being the nearest whole numbers to 2/3 and 1/3 of 125.
When using double or multiple sampling, it is occasionally convenient to draw the first sample at random and inspect it, then draw the second sample if required, and so on.
In this case, the random sampling techniques are as described above, and no extra difficulty arises. But sometimes it is more convenient to draw at once the maximum sample that might be required and divide it into first sample, second sample, etc., before inspection. In this case, it is most important that, in addition to drawing a sample at random from the lot to make up the maximum sample, the first, second, etc., samples be drawn at random from the maximum sample. It is particularly important to remember this point when stratified sampling is used; it would be quite wrong for instance to allow all the first sample to come from the same sub-lot.
Table C.1 — Random sampling numbers (part 1)
110 9 140 2 804 8 046 7 142 6 277 6 210 8 627 3 209 6 845
5 327 3 946 6 289 6 117 60 2 827 6 546 2 738 8 760 6 604
5 373 8 259 4 956 8 185 135 8 640 7 410 6 335 831 2 774
9 244 9 452 8 324 8 062 9 817 9 853 7 419 9 559 4 264 6 919
4 148 3 948 5 399 8 687 3 568 4 046 4 558 705 5 075 4 440
2 403 4 351 8 240 3 554 3 568 4 701 7 494 6 036 7 735 4 082
1 828 1 956 1 646 1 370 9 096 738 8 015 513 6 969 949
7 249 9 634 4 263 4 345 567 1 272 5 302 3 352 7 389 9 976
7 116 9 731 2 195 3 265 9 542 2 808 1 720 4 832 2 553 7 425
6 659 8 200 4 135 6 116 3 019 6 223 7 323 965 8 105 4 394
2 267 362 5 242 261 7 990 8 886 375 7 577 8 422 5 230
9 460 9 813 8 325 6 031 1 102 2 825 4 899 1 599 1 199 909
2 985 3 541 6 445 7 981 8 796 9 480 2 409 9 456 7 725 183
4 313 666 2 179 1 031 7 804 8 075 8 187 6 575 65 2 170
6 930 5 368 4 520 7 727 2 536 4 166 7 653 448 2 560 4 795
8 910 3 585 5 655 1 904 681 6 310 568 3 718 3 537 8 858
8 439 1 052 5 883 9 283 1 053 5 667 572 611 100 5 190
4 691 6 787 4 107 5 073 8 503 6 875 7 525 8 894 7 426 212
1 034 1 157 5 888 213 2 430 7 397 7 204 6 893 7 017 7 038
7 472 4 581 3 837 8 961 7 931 6 351 1 727 9 793 2 142 816
2 950 7 419 6 874 1 128 5 108 7 643 7 335 5 303 2 703 8 793
1 312 7 297 3 848 4 767 5 386 7 361 2 079 3 197 8 904 4 332
8 734 4 921 6 201 5 057 9 228 9 938 5 104 6 662 1 617 2 323
2 907 737 8 496 7 509 9 304 7 112 5 528 2 390 7 736 475
1294 4 883 2 536 2 351 5 860 344 2 595 4 880 5 167 5 370

ISO 5538:2004(E) IDF 113:2004(E)
© ISO and IDF 2004 – All rights reserved 17
Table C.2 — Random sampling numbers (part 2)
430 5 819 7 017 4 512 8 081 9 198 9 786 7 388 704 138
5 632 752 8 287 8 178 8 552 2 264 658 2 336 4 912 4 268
7 960 67 7 837 9 890 4 490 1 619 6 766 6 148 370 8 322
5 138 6 660 7 759 9 633 924 1 094 5 103 1 371 2 874 5 400
8 615 7 292 1 010 9 987 2 993 5 116 7 876 7 215 9 714 3 906
4 968 8 420 5 016 1 391 8 711 4 118 3 881 9 840 5 843 751
9 228 3 232 5 804 8 004 773 7 886 146 2 400 6 957 8 968
9 657 9 617 1 033 469 3 564 3 799 2 784 3 815 3 611 8 362
9 270 5 743 8 129 8 655 4 769 2 900 6 421 2 788 4 858 5 335
8 206 3 008 7 396 240 524 3 384 6 518 4 268 5 988 9 096
1 562 7 953 607 6 254 132 3 860 6 630 2 865 9 750 9 397
1 528 4 342 5 173 3 322 26 7 513 1 743 1 299 1 340 6 470
5 697 9 273 8 609 8 442 1 780 1 961 7 221 5 630 8 036 4 029
3 186 656 3 248 341 9 308 9 853 5 129 3 956 4 717 7 594
3 275 7 697 1 415 5 573 9 661 16 4 090 2 384 7 698 4 588
7 931 1 949 1 739 3 437 6 157 2 128 6 026 2 268 5 247 2 987
5 956 2 912 2 698 5 721 1 703 2 321 8 880 3 288 7 420 2 121
1 866 7 901 4 279 4 715 9 741 2 674 7 148 8 392 2 497 8 018
2 673 7 071 4 948 8 100 7 842 8 208 3 256 3 217 8 331 7 256
7 824 5 427 957 6 076 2 914 336 3 466 631 5 249 7 289
2 251 864 373 7 808 1 256 1 144 4 152 8 262 4 998 3 315
7 661 8 813 5 810 2 612 3 237 2 829 3 133 4 833 7 826 1 897
6 651 6 718 1 088 2 972 673 8 440 3 154 6 962 199 2 604
2 917 4 989 9 207 4 484 916 9 129 6 517 889 137 9 055
5 970 3 582 2 346 8 356 780 4 899 7 204 1 042 8 795 2 435

ISO 5538:2004(E) IDF 113:2004(E)
18 © ISO and IDF 2004 – All rights reserved
Table C.3 — Random sampling numbers (part 3)
1 564 8 048 6 359 8 802 2 860 3 546 3 117 7 357 9 945 5 739
6 022 9 676 5 768 3 388 9 918 8 897 1 119 9 441 8 934 8 555
8 418 9 906 19 550 4 223 5 586 4 842 8 786 855 5 650
5 948 1 652 2 545 3 981 2 102 3 523 7 419 2 359 381 8 457
6 945 3 629 7 351 3 502 1 760 550 8 874 4 599 7 809 9 474
370 1 165 8 035 4 415 9 812 4 312 3 524 1 382 4 732 2 303
6 702 6 457 2 270 8 611 8 479 1 419 835 1 866 1 307 4 211
3 740 4 722 3 002 8 020 182 4 451 9 389 1 730 3 394 7 094
3 833 3 356 9 025 5 749 4 780 6 042 3 829 8 458 1 339 6 948
8 683 7 947 4 719 9 403 7 863 701 9 245 5 960 9 257 2 588
6 794 1 732 4 809 9 473 5 893 1 154 67 899 1 184 8 630
5 054 1 532 9 498 7 702 544 87 9 602 6 259 3 807 7 276
1 733 6 560 9 758 8 586 3 253 2 532 6 668 2 888 1 404 3 887
6 609 6 263 9 160 600 4 304 2 784 1 089 7 321 5 618 6 172
3 970 7 716 8 807 6 123 3 748 1 036 516 607 2 710 3 700
9 504 2 769 534 758 9 824 9 536 7 825 2 985 3 824 3 449
668 9 636 6 001 9 372 8 746 1 579 6 102 7 990 4 526 3 429
4 364 606 4 355 2 395 2 070 8 915 8 461 9 820 6 811 5 873
8 875 3 041 7 183 2 261 7 210 6 072 7 128 825 8 281 6 815
4 521 3 391 6 695 5 986 2 416 7 979 8 106 7 759 6 379 2 101
5 066 1 454 9 642 8 675 8 767 582 410 5 515 2 697 1 575
9 138 5 003 8 633 2 670 7 575 4 021 391 118 9 493 2 291
975 1 836 7 629 5 136 7 824 3 916 542 2 614 6 567 3 015
1 049 9 925 3 408 3 029 7 244 1 766 1 013 221 8 492 3 801
682 1 343 7 454 8 600 8 598 9 953 5 773 6 482 4 439 6 708

ISO 5538:2004(E) IDF 113:2004(E)
© ISO and IDF 2004 – All rights reserved 19
Table C.4 — Random sampling numbers (part 4)
263 4 909 9 832 627 1 155 4 007 446 6 988 4 699 1 740
2 733 3 398 7 630 3 824 734 7 736 8 465 849 459 8 733
1 441 2 684 1 116 758 5 411 3 365 4 489 6 241 6 413 3 615
5 014 5 616 1 721 8 772 4 605 388 1 399 5 993 7 459 4 445
3 745 5 956 5 512 8 577 4 178 31 3 090 2 296 124 5 896
8 384 8 727 5 567 5 881 3 721 1 896 3 758 7 236 6 860 1 740
9 944 8 361 7 050 8 783 3 815 9 768 3 247 1 706 9 355 3 510
3 045 2 466 6 640 6 804 1 704 8 665 2 539 2 320 9 831 9 442
5 939 5 741 7 210 872 3 279 3 177 6 021 2 045 163 3 706
4 294 1 777 5 386 7 182 7 238 8 408 7 674 1 719 9 068 9 921
3 787 2 516 2 661 6 711 9 240 5 994 3 068 5 524 932 5 520
4 764 2 339 4 541 5 415 6 314 7 979 3 634 5 320 5 400 6 714
292 9 574 285 4 230 2 283 5 232 8 830 5 662 6 404 2 514
7 876 1 662 2 627 940 7 836 3 741 3 217 8 824 7 393 7 306
3 490 3 071 2 967 4 922 3 658 4 333 6 452 9 149 4 420 6 091
3 670 8 960 6 477 3 671 9 318 1 317 6 355 4 982 6 815 814
3 665 2 367 8 144 9 663 990 6 155 4 520 294 7 504 223
3 792 557 8 489 8 446 8 082 1 122 1 181 8 142 7 119 3 200
2 618 2 204 9 433 2 527 5 744 9 330 721 8 866 3 695 1 081
8 972 8 829 962 5 597 8 834 5 857 9 800 7 375 9 209 630
7 305 8 852 1 688 3 571 3 393 2 990 9 488 8 883 2 476 9 136
1 794 4 551 1 262 4 845 4 039 7 760 1 565 4 745 1 178 8 370
3 179 1 304 7 767 4 769 7 373 5 195 5 013 6 894 5 734 5 852
2 930 3 828 7 172 3 188 7 487 2 191 1 225 7 770 3 999 6
8 418 9 627 7 948 6 243 1 176 9 393 2 252 377 9 798 8 648

ISO 5538:2004(E) IDF 113:2004(E)
20 © ISO and IDF 2004 – All rights reserved
Bibliography
[1] ISO 707, Milk and milk products — Guidance on sampling1)
1) Equivalent to IDF 50.


ISO 5538:2004(E) IDF 113:2004(E)
ICS 67.100.01 Price based on 20 pages
© ISO and IDF 2004 – All rights reserved