earthquake seismology, exploration seismology, and ... · earthquake seismology, exploration...
TRANSCRIPT
6th International Conference & Exposition on Petroleum Geophysics “Kolkata 2006”
(1387)
Earthquake seismology case study
The August 1999 earthquake with 7.4 magnitudecaused a severe damage within the municipality of Izmit, 170km east of Istanbul. A survey of the damaged buildings wasmade by the municipal authorities shortly after theearthquake. The Municipal Government decided to conducta pilot seismic zonation project to determine whether thecause of the damage was poor construction materials andmethods or weak soil conditions. In this project, weinvestigated the soil conditions with two objectives in mind:(1) to estimate the seismic model of the soil column at eachdistrict so as to determine the geotechnical earthquakeengineering parameters, and (2) to map active faults withinthe municipal area.
We determined the seismic model of the soil columnon a district basis within the Municipality of Izmit. Specifically,we conducted refraction seismic survey at 16 locations andestimated the P- and S-wave velocity-depth profiles down
Earthquake Seismology, Exploration Seismology, andEngineering Seismology: How Sweet It is --- Listening to the
Earth
Oz YilmazAnatolian Geophysical, Istanbul, Turkey, and GeoTomo LLC, Houston, TX, USA
Summary
The seismic method has three applications with different requirements for band-width and depth-width:(1) Earthquake seismology with a bandwidth up to 10 Hz and a depth of interest down to 100 km,(2) Exploration seismology with a bandwidth up to 100 Hz and a depth of interest down to 10 km, and(3) Engineering seismology with a bandwidth up to 1000 Hz and a depth of interest down to 1 km.
Each of the three categories of seismology makes use of a specific wave type:(1) In earthquake seismology, dispersion of surface waves is used to delineate velocity-depth models for the oceanic
and continental crusts.(2) In exploration seismology, reflected and diffracted waves are used to derive an image of the subsurface.(3) In engineering seismology, refracted waves are used to derive a velocity-depth model for the near-surface.
For a specific category of seismology, the associated wave type is considered signal, while other wave types areconsidered noise. For instance, surface waves are essential for earthquake seismology, while they are treated as coherent linearnoise in exploration seismology --- ground roll in land seismic exploration and guided waves in marine seismic exploration.
I shall present a case study for each of the three categories of seismology:(1) Earthquake seismology case study: A seismic microzonation to determine soil amplification and liquefaction
probability within a municipal area;(2) Engineering seismology case study: A site characterization survey to determine P- and S-wave velocities, and
delineate geometry of layers within the soil column;(3) Exploration seismology case study: A large-offset sesimic survey to image complex structures in thrust belts.
to a depth of 30 m. We then combined the seismic velocitieswith the geotechnical borehole information about thepedology and lithology of the soil column and determinedthe geotechnical earnthquake engineering parameters foreach district. Specifically, we computed the soil amplificationand its effective depth range, design spectrum periods TA-TB, and liquefaction probability and depth range.
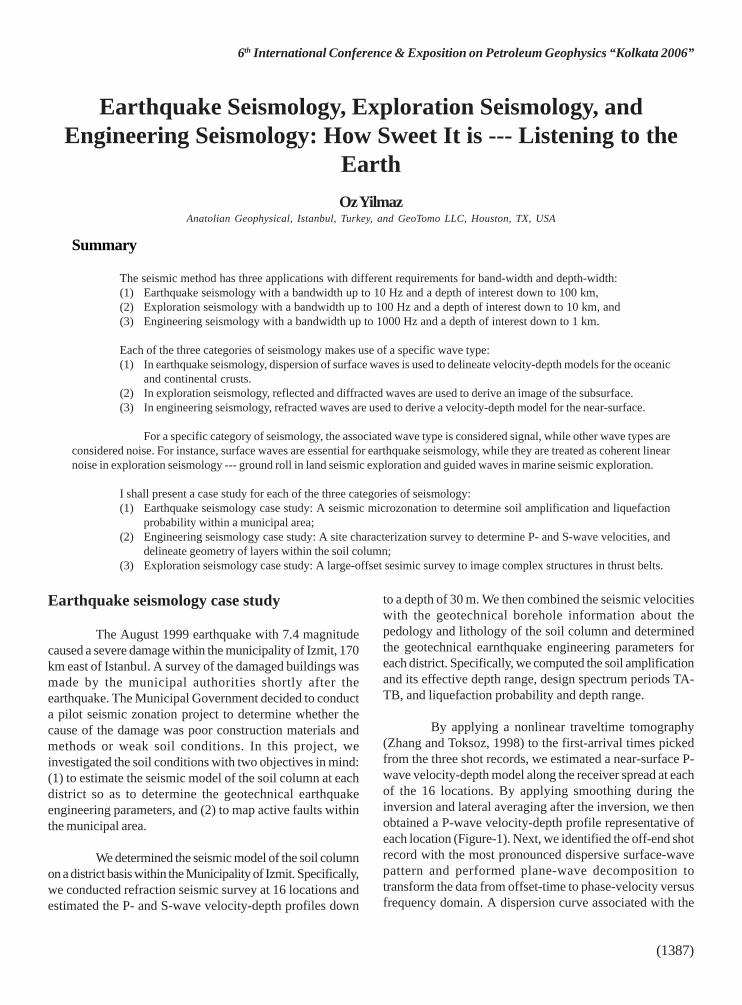
By applying a nonlinear traveltime tomography(Zhang and Toksoz, 1998) to the first-arrival times pickedfrom the three shot records, we estimated a near-surface P-wave velocity-depth model along the receiver spread at eachof the 16 locations. By applying smoothing during theinversion and lateral averaging after the inversion, we thenobtained a P-wave velocity-depth profile representative ofeach location (Figure-1). Next, we identified the off-end shotrecord with the most pronounced dispersive surface-wavepattern and performed plane-wave decomposition totransform the data from offset-time to phase-velocity versusfrequency domain. A dispersion curve associated with the
(1388)
fundamental mode of Rayleigh-type surface waves waspicked in the transform domain based on the maximum-energy criterion and inverted to estimate the S-wave velocityas a function of depth as shown in Figure-1 (Park et al.,1999; Xia et al., 1999). The velocity estimation from surfaceseismic data represents a lateral average over the receiverspread length in contrast with the velocity estimation fromborehole seismic measurements which are influenced bylocalized lithologic anomalies and borehole conditions.
To determine the geotechnical earthquakeengineering parameters, we began with an SH accelerogramassociated with the August 1999 earthquake recorded at arock site within the municipal area. Given the seismogram atthe rock site, we extrapolated it through the soil columnknowing the S-wave velocity-depth profile and thegeotechnical borehole information to model the seismogramat the soil site corresponding to the 16 district locations. Foreach district, we computed the maximum acceleration as afunction of depth (Schnabel et al., 1972; Kramer, 1996), anddetermined the soil amplification factor at the ground leveland the depth range for which amplification is significant.
Next, we computed the design spectra --- responseof buildings with a range of natural periods to the modeledground motion at the soil site and the actual ground motionat the rock site (Kramer, 1996). The building structure isdefined as a spring system with a single-degree of freedom.From the design spectra, we determined the design spectrumperiods TA and TB.
We extended the relationship between the S-wavevelocity and maxium acceleration (Stokoe, 1988) to accountfor water saturation in the soil column. Provided certain soilconditions are also met, the liquefaction process occurs whenthe medium becomes fully saturated, in which case the P-wave velocity increases while the S-wave velocity isunchaged (Yilmaz, 2001). By correlating the Vp/Vs ratio withthe maximum ground acceleration and the S-wave velocity,all as a function of depth, we determined the liquefactionprobability or earthquake-induced settlement and its depthrange of occurrence at each of the 16 sites. In this analysis,we also took into account the fines content information fromthe geotechnical borehole data.
The geotechncial earthquake engineeringparameters estimated for the districts of the Izmit Municipalityindicate that the cause of the severe damage by the August1999 earthquake is primarily soil amplification in addition toliquefaction at certain localities. In most districts of themunicipality, the soil conditions are such that soil remediationwould be very costly. Therefore, use of timber and steel,rather than heavy concrete, for construction material wouldreduce the structural mass of the buildings and provide saferhabitation for the municipal residents.
In addition to geotechnical characterization of thesoil column at each district, we also conducted shallowreflection seismic surveys at 10 locations within the municipalarea along line traverses with an average length of 450 mprimarily in the EW direction and derived seismic imagesdown to a depth of 100 m. In contrast with a comprehensiveprocessing sequence applied to reflection seismic data usedin exploration for oil and gas fields (Yilmaz, 2001), shallowreflection seismic data usually require a simple processingsequence (Steeples and Miller, 1990) that includes applicationof a bandpass filter and AGC. Aside from deriving a seismicsection thatrepresents the subsurface image down a depth of 100 m, wealso estimated the near-surface P-wave velocity-depth model,again using the nonlinear traveltime tomography, for each ofthe 10 line traverses.
From the interpretation of the seismic sections, wedelineated several faults most of which reach the surfaceand cause significant lateral velocity variations within thenear-surface as verified by the first-arrival tomographysolution for P-wave velocity-depth models along the linetraverses. The fault patterns observed on the seismicsections are oblique to the North Anatolian right-lateralstrike-slip fault system with EW orientation in the area. Suchfault patterns, combined with the strike-slip fault system, are
Fig. 1 : Earthquake seismology case study: The P-wave velocity-depth(left) and the S-wave velocity-depth (right) profiles down to 30-m depth.
6th International Conference & Exposition on Petroleum Geophysics “Kolkata 2006”
(1389)
often associated with pull-apart tectonism. Therefore, theIzmit area, which is the eastern tip of the Marmara Basin, is atransition zone from the dominant strike-slip regime alongthe North Anatolian Fault System to the pull-apart tectonicregime of the Marmara Basin.
Engineering seismology case study
We present a unified workflow for analysis ofshallow seismic data to estimate a near-surface model definedby layer geometries within the soil column, and the P- and S-wave velocities of the layers themselves.
In the unified workflow for engineering seismology presentedhere, we make use of all three wave types --- reflected,refracted, and surface waves:
(1) Apply a simple conventional processing sequence toobtain a CMP stack associated with the reflected waves.
(2) Perform inversion of traveltimes associated with therefracted waves to estimate a near-surface P-wavevelocity-depth model and use it to delineate the geometryof the layers within the soil column and the geometry ofthe soil-bedrock interface.
(3) Perform inversion of the Rayleigh waves to derive an S-wave velocity profile in depth.
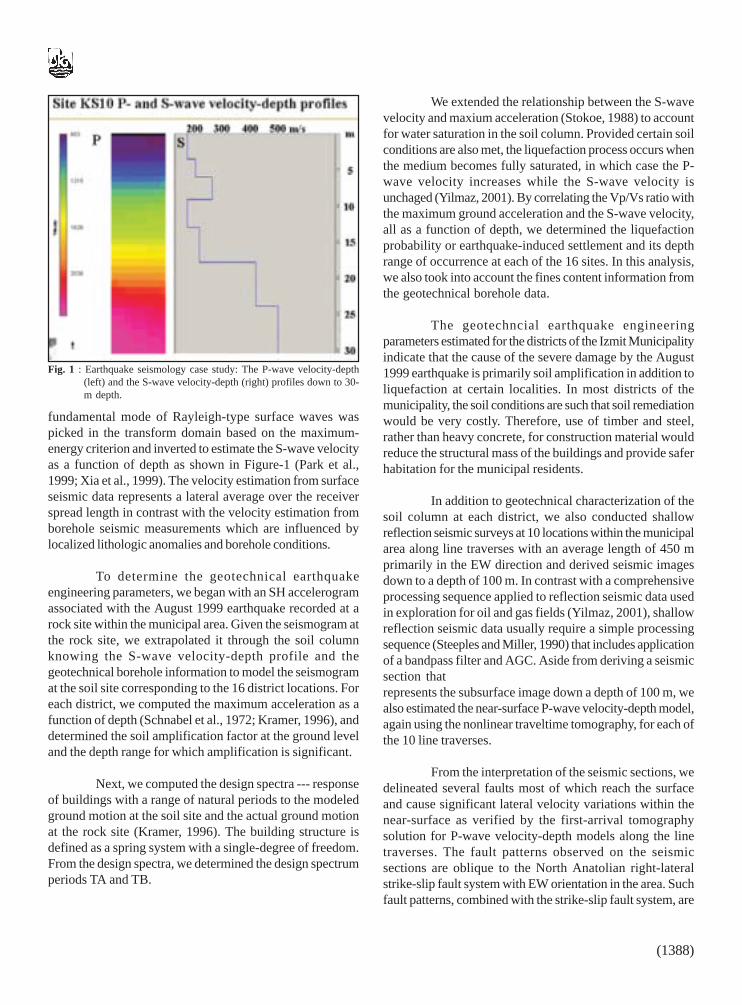
A site investigation for determination of the seismicparameters of the soil column based on the unified workflowoutlined above led to the discovery of a buried lake deposits(Figure-2) near the shores of the Marmara Sea, west ofIstanbul.
The shallow reflection seismic data were acquiredwith common-spread recording geometry using a 48-channelseismic recording system with 10-Hz geophones and anexplosive source that uses a pipe-gun placed in a 30-cmhole. Both the receiver and shot station intervals are 2-m. Atotal of more than 2,000 m reflection profiling was conductedalong three line traverses over the survey area (Figure-2).
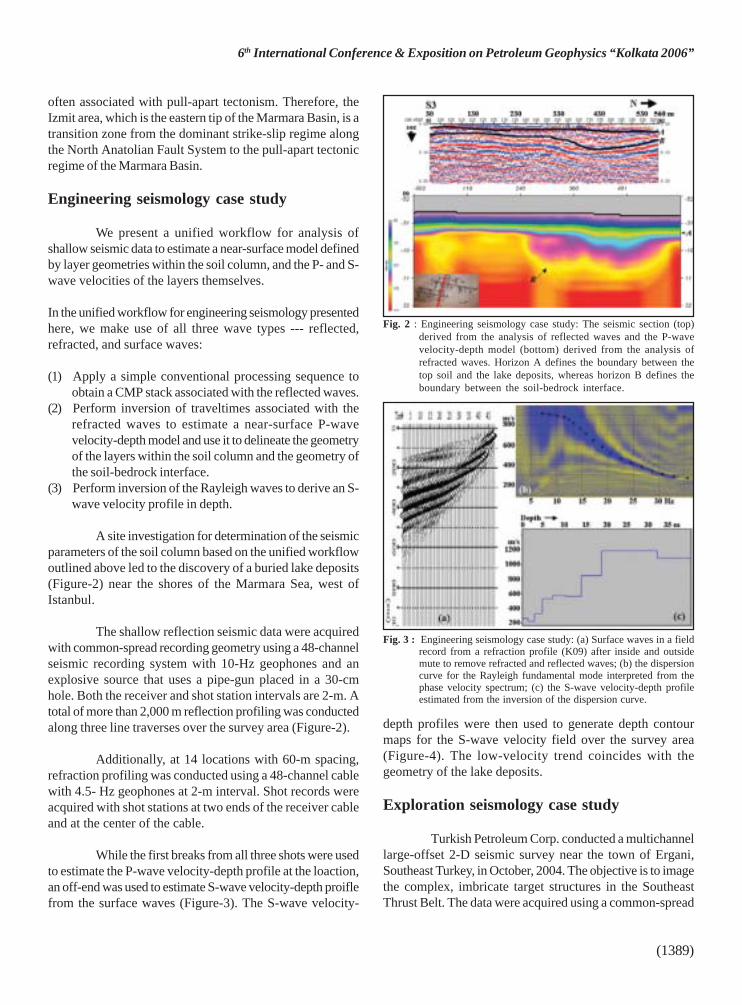
Additionally, at 14 locations with 60-m spacing,refraction profiling was conducted using a 48-channel cablewith 4.5- Hz geophones at 2-m interval. Shot records wereacquired with shot stations at two ends of the receiver cableand at the center of the cable.
While the first breaks from all three shots were usedto estimate the P-wave velocity-depth profile at the loaction,an off-end was used to estimate S-wave velocity-depth proiflefrom the surface waves (Figure-3). The S-wave velocity-
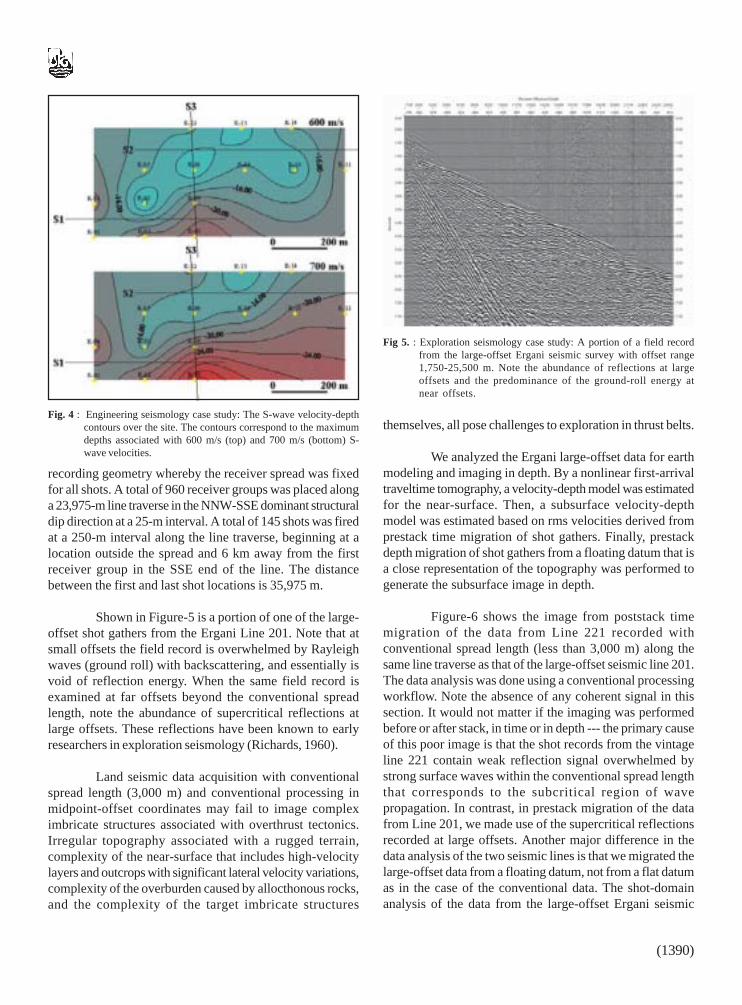
depth profiles were then used to generate depth contourmaps for the S-wave velocity field over the survey area(Figure-4). The low-velocity trend coincides with thegeometry of the lake deposits.
Exploration seismology case study
Turkish Petroleum Corp. conducted a multichannellarge-offset 2-D seismic survey near the town of Ergani,Southeast Turkey, in October, 2004. The objective is to imagethe complex, imbricate target structures in the SoutheastThrust Belt. The data were acquired using a common-spread
Fig. 2 : Engineering seismology case study: The seismic section (top)derived from the analysis of reflected waves and the P-wavevelocity-depth model (bottom) derived from the analysis ofrefracted waves. Horizon A defines the boundary between thetop soil and the lake deposits, whereas horizon B defines theboundary between the soil-bedrock interface.
Fig. 3 : Engineering seismology case study: (a) Surface waves in a fieldrecord from a refraction profile (K09) after inside and outsidemute to remove refracted and reflected waves; (b) the dispersioncurve for the Rayleigh fundamental mode interpreted from thephase velocity spectrum; (c) the S-wave velocity-depth profileestimated from the inversion of the dispersion curve.
(1390)
recording geometry whereby the receiver spread was fixedfor all shots. A total of 960 receiver groups was placed alonga 23,975-m line traverse in the NNW-SSE dominant structuraldip direction at a 25-m interval. A total of 145 shots was firedat a 250-m interval along the line traverse, beginning at alocation outside the spread and 6 km away from the firstreceiver group in the SSE end of the line. The distancebetween the first and last shot locations is 35,975 m.
Shown in Figure-5 is a portion of one of the large-offset shot gathers from the Ergani Line 201. Note that atsmall offsets the field record is overwhelmed by Rayleighwaves (ground roll) with backscattering, and essentially isvoid of reflection energy. When the same field record isexamined at far offsets beyond the conventional spreadlength, note the abundance of supercritical reflections atlarge offsets. These reflections have been known to earlyresearchers in exploration seismology (Richards, 1960).
Land seismic data acquisition with conventionalspread length (3,000 m) and conventional processing inmidpoint-offset coordinates may fail to image compleximbricate structures associated with overthrust tectonics.Irregular topography associated with a rugged terrain,complexity of the near-surface that includes high-velocitylayers and outcrops with significant lateral velocity variations,complexity of the overburden caused by allocthonous rocks,and the complexity of the target imbricate structures
themselves, all pose challenges to exploration in thrust belts.
We analyzed the Ergani large-offset data for earthmodeling and imaging in depth. By a nonlinear first-arrivaltraveltime tomography, a velocity-depth model was estimatedfor the near-surface. Then, a subsurface velocity-depthmodel was estimated based on rms velocities derived fromprestack time migration of shot gathers. Finally, prestackdepth migration of shot gathers from a floating datum that isa close representation of the topography was performed togenerate the subsurface image in depth.
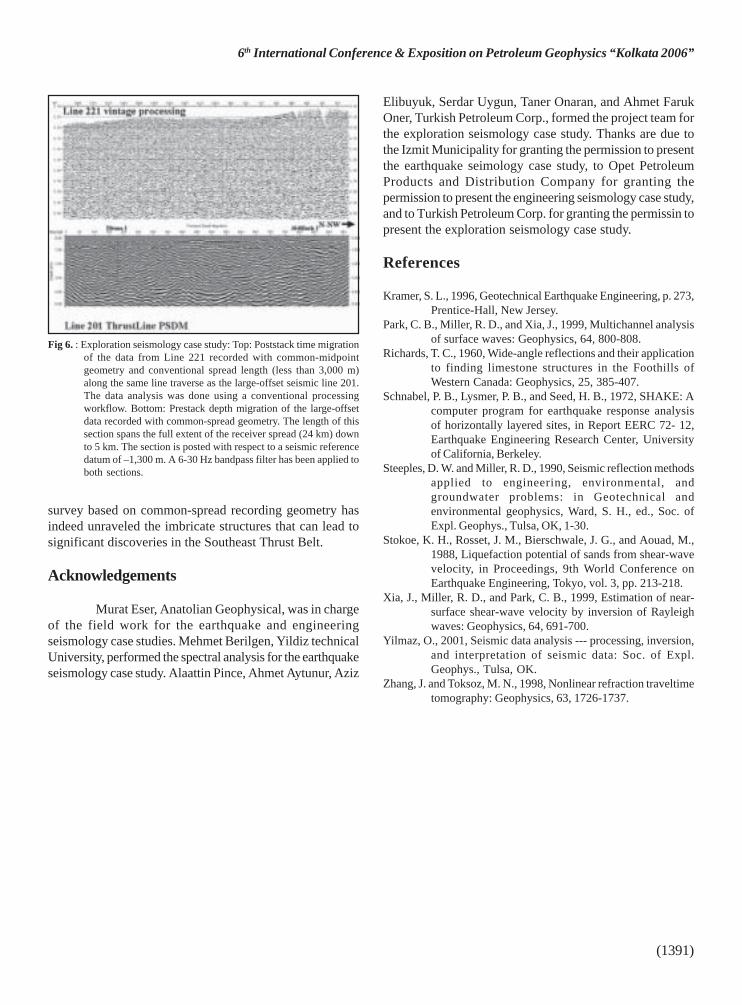
Figure-6 shows the image from poststack timemigration of the data from Line 221 recorded withconventional spread length (less than 3,000 m) along thesame line traverse as that of the large-offset seismic line 201.The data analysis was done using a conventional processingworkflow. Note the absence of any coherent signal in thissection. It would not matter if the imaging was performedbefore or after stack, in time or in depth --- the primary causeof this poor image is that the shot records from the vintageline 221 contain weak reflection signal overwhelmed bystrong surface waves within the conventional spread lengththat corresponds to the subcritical region of wavepropagation. In contrast, in prestack migration of the datafrom Line 201, we made use of the supercritical reflectionsrecorded at large offsets. Another major difference in thedata analysis of the two seismic lines is that we migrated thelarge-offset data from a floating datum, not from a flat datumas in the case of the conventional data. The shot-domainanalysis of the data from the large-offset Ergani seismic
Fig. 4 : Engineering seismology case study: The S-wave velocity-depthcontours over the site. The contours correspond to the maximumdepths associated with 600 m/s (top) and 700 m/s (bottom) S-wave velocities.
Fig 5. : Exploration seismology case study: A portion of a field recordfrom the large-offset Ergani seismic survey with offset range1,750-25,500 m. Note the abundance of reflections at largeoffsets and the predominance of the ground-roll energy atnear offsets.
6th International Conference & Exposition on Petroleum Geophysics “Kolkata 2006”
(1391)
survey based on common-spread recording geometry hasindeed unraveled the imbricate structures that can lead tosignificant discoveries in the Southeast Thrust Belt.
Acknowledgements
Murat Eser, Anatolian Geophysical, was in chargeof the field work for the earthquake and engineeringseismology case studies. Mehmet Berilgen, Yildiz technicalUniversity, performed the spectral analysis for the earthquakeseismology case study. Alaattin Pince, Ahmet Aytunur, Aziz
Elibuyuk, Serdar Uygun, Taner Onaran, and Ahmet FarukOner, Turkish Petroleum Corp., formed the project team forthe exploration seismology case study. Thanks are due tothe Izmit Municipality for granting the permission to presentthe earthquake seimology case study, to Opet PetroleumProducts and Distribution Company for granting thepermission to present the engineering seismology case study,and to Turkish Petroleum Corp. for granting the permissin topresent the exploration seismology case study.
References
Kramer, S. L., 1996, Geotechnical Earthquake Engineering, p. 273,Prentice-Hall, New Jersey.
Park, C. B., Miller, R. D., and Xia, J., 1999, Multichannel analysisof surface waves: Geophysics, 64, 800-808.
Richards, T. C., 1960, Wide-angle reflections and their applicationto finding limestone structures in the Foothills ofWestern Canada: Geophysics, 25, 385-407.
Schnabel, P. B., Lysmer, P. B., and Seed, H. B., 1972, SHAKE: Acomputer program for earthquake response analysisof horizontally layered sites, in Report EERC 72- 12,Earthquake Engineering Research Center, Universityof California, Berkeley.
Steeples, D. W. and Miller, R. D., 1990, Seismic reflection methodsapplied to engineering, environmental, andgroundwater problems: in Geotechnical andenvironmental geophysics, Ward, S. H., ed., Soc. ofExpl. Geophys., Tulsa, OK, 1-30.
Stokoe, K. H., Rosset, J. M., Bierschwale, J. G., and Aouad, M.,1988, Liquefaction potential of sands from shear-wavevelocity, in Proceedings, 9th World Conference onEarthquake Engineering, Tokyo, vol. 3, pp. 213-218.
Xia, J., Miller, R. D., and Park, C. B., 1999, Estimation of near-surface shear-wave velocity by inversion of Rayleighwaves: Geophysics, 64, 691-700.
Yilmaz, O., 2001, Seismic data analysis --- processing, inversion,and interpretation of seismic data: Soc. of Expl.Geophys., Tulsa, OK.
Zhang, J. and Toksoz, M. N., 1998, Nonlinear refraction traveltimetomography: Geophysics, 63, 1726-1737.
Fig 6. : Exploration seismology case study: Top: Poststack time migrationof the data from Line 221 recorded with common-midpointgeometry and conventional spread length (less than 3,000 m)along the same line traverse as the large-offset seismic line 201.The data analysis was done using a conventional processingworkflow. Bottom: Prestack depth migration of the large-offsetdata recorded with common-spread geometry. The length of thissection spans the full extent of the receiver spread (24 km) downto 5 km. The section is posted with respect to a seismic referencedatum of –1,300 m. A 6-30 Hz bandpass filter has been applied toboth sections.