earth system model. beyond the boundary a mathematical representation of the many processes that...
TRANSCRIPT

Earth System Model

Beyond the boundary

• A mathematical representation of the many processes that make up our climate.
• Requires:
– Knowledge of the physical laws that govern climate
– Mathematical expressions for those laws– Numerical methods to solve the mathematical
expressions on a computer (if needed)– A computer of adequate size to carry out the
calculations
Model

Observations
Hypotheses
Numerical Simulations
Why?
• Understanding of cause and effect• Predictive skill: our main tool to make predictions for the future

Evolution of Climate Science

There is no unique definition of which processes must be represented before a climate
model becomes an Earth System Model (ESM), but typically such models have at least
an interactive carbon cycle component. The development of this capability was
motivated by suggestions that the ability of terrestrial ecosystems and the ocean to
remove carbon dioxide from the atmosphere will be limited by future climate change
(e.g., Friedlingstein et al. 2006).
Definition

Climate-Carbon Feedback
[Friedlingstein et al. 2006]

if the warming leads to enhanced rates of decay of organic matter in soils, or a reduction in oceanic carbon uptake, then the concentration of CO2 in the atmosphere will rise more rapidly than it would in the absence of such (positive) feedbacks, and the rate of warming will be greater as well.
if increased CO2 in the atmosphere enhances photosynthesis and the storage of carbon in plants and soils, then CO2 levels will rise less rapidly than in the absence of this (negative) feedback, and climate change will also be slower as a result.
Climate-Carbon Feedback
Positive feedback
Negative feedback

Earth System Model (ESM)
Land physicsand hydrologyOcean circulation
Atmospheric circulation and radiation
Land physicsand hydrology
Ocean ecology andchemistry
Atmospheric circulation and radiation
Allows Interactive CO2
Ocean circulation
Plant ecology, land use, and Biogeochemistry
Climate Model
Earth System Model
Sea Ice
Sea Ice

CO2CO2
Diagnostic Prognostic
Global Climate Model Earth System Model
Carbon cycle

11
Bonan (2008) Ecological Climatology, 2nd ed (Cambridge Univ. Press)
Terrestrial ecosystems influence climate through physical, chemical, and biological processes that affect planetary energetics, the hydrologic cycle, and atmospheric composition
Earth system science spans traditional disciplines
Three examplesAnthropogenic land cover changePhotosynthesis-transpirationLeaf area index
Multi-disciplinary Science

History

Heterogenity

Dynamic Global Vegetation Model (DGVM)
autotrophic respiration(RA)
Net Primary Production(GPP- RA )
Net CO2(GPP-RA-RH)
heterotrophic respiration (RA)
Xnot coupled
yet
BIOGEOCHEMISTRY (LPJ)
PHENOLOGY (IBIS)
Daily Leaf Area Index
Plant Functional TypeHeight
Plant CarbonLitter and Soil
Carbon
ECOPHYSIOLOGYAllocationTurnoverMortality
COMPETITON LightWater
SOILLitter
Soil organic matter
FIREOccurrence (moisture, fuel load)
Mortality (fire resistance)Combustion
ESTABLISHMENTPotential rateCanopy Gap
Frost toleranceHeat stress
Winter chillingGrowing season warmth
Low precipitation
VEGETATION DYNAMICS (LPJ)
ANNUAL STATISTICSFire season length
NPP,GPP and potential GPP Minimum monthly temperature Growing degree-days above 5℃
PrecipitationGrowing degree-days above heat stress
DAILY STATISTICS10-day mean temperature
10-day mean photosynthesisGrowing degree-day accumulation
Fire probability
CANOPY PHYSICSRadiation transferEnergy balance
TemperatureAerodynamicsWater balance
CANOPY PHYSIOLOGYPhotosynthesis (GPP)Stomatal conductance
SOIL/ICE/SNOW PHYSICSEnergy and water balance
Temperature
BIOGEOPHYSICS (CLM)
At every time step (~20minute) Daily Yearly
Multi-Time step
At every time step (~20minute) Daily Yearly
Multi-Time step

Vegetation dynamics
Competition (10 days)
Broadleaf Tree
C3 Grass
Shrub
Soil
Plant functional type (PFT)
Deciduous, evergreen treesShrubGrassCrop

Phenology
Spring SummerWinter Autumn Winter
Time
Veg
etat
ion
acti
vity L
AI (M
odel)
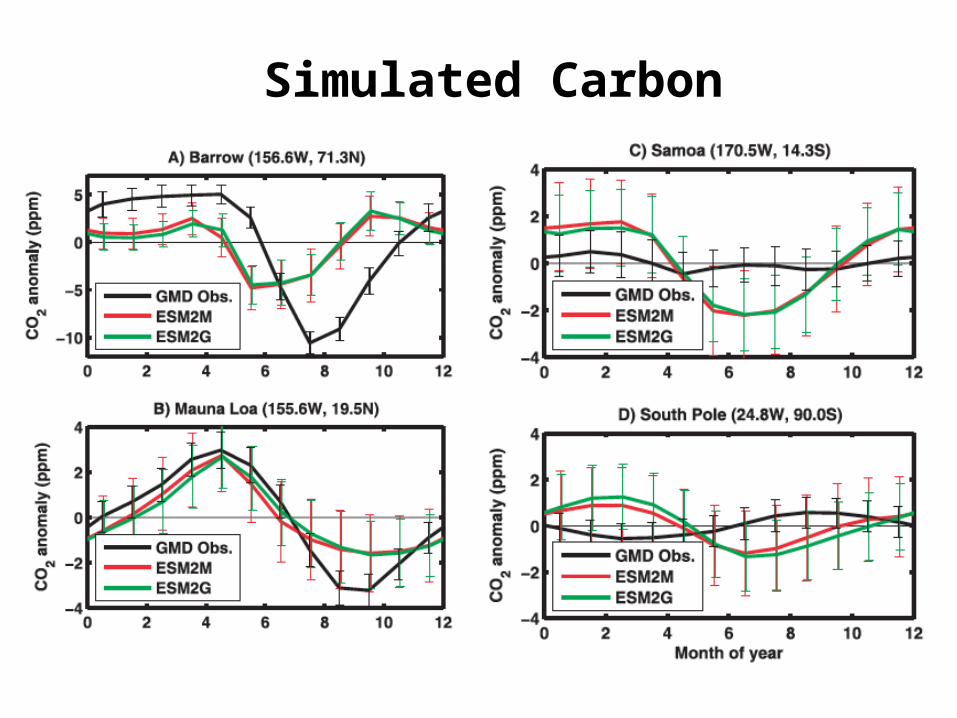
Simulated Carbon

Annual cycle of LAI in ESMsObservation (GIMMS New LAI)
Amplitude of LAI annual cycleclimatology (1982-2005)
[Jeong et al., in preparation]

Poor performance

90 100 110 120 130 140 150-6
-4
-2
0
2
4
Uncertainties in phenology[Optimal parameterization][Optimal parameterization]
[parameter][parameter][structure][structure][hypothesis][hypothesis][species][species][DGVM group1][DGVM group1]
CTREX1EX2EX3EX4EX5EX6EX8EX4mEX5mEX 4mEX 5m
Day of year
Net
eco
syst
em p
rodu
ctiv
ity
Parameter: -1.2 days -1.0 days
Structure: -0.5 days - 0.0 days
Hypothesis: -1.5 days -2.0 days
Species: -9.7 days -11.5 days
DGVMs: -9.2 days -11.1 days
Budburst date Carbon uptake commencement
[DGVM group2][DGVM group2]
[Jeong et al., 2012]

Potential solution
Species
[Jeong et al., 2013b; Jeong and Medvigy, in review]
0
5
10
15
20
25B. papyrifera modelQ. rubra modelA. rubrum modelA. saccharum modelF. grandifolia model
A. rubrum A. saccharumQ. rubraB. papyrifera F. grandifolia
RM
S e
rror
s[d
ays]
Early Mid Late successional species

“ecological realism”
New paradigm

Managed ecosystem

Planting date
Leaf Emergence
Grain Fill
Harvest
0
LAI
Time
Phase 1 Phase 3Phase 2
Crop phenology
Green: climate, fertilization, and irrigationRed: human-decision

Tradeoff between food benefit and climatic cost
1. Extensification (land use)
2. Intensification (Irrigation, fertilization, practices)
Global Climate Model (one way)
Earth System Model (two way)
1. Extensification (land use)
2. Intensification (Irrigation, fertilization, practices)
3. Interactive crop management (planting, harvesting)

Current problem
NCAR CESM 1.0 algorithm
Sacks et al., 2010
Wheat

[Jeong et al., 2013a]
Potential solution

Summary
We need more efforts to implement ecological realism in ESMs.
Human-managed phenology is the initial stage.
We need systematic analysis on phenology and atmospheric CO2 by integrating satellite, ground, and Earth system model.
CO
2 C
on
cen
trat
ion
Veg
etat
ion
Act
ivit
y
How will changes in phenology affect the variations in annual cycle of atmospheric CO2?