earth remote sensing
TRANSCRIPT


Contents
On the cover: Part of the MojaveDesert near Barstow, California,acquired by the SpaceborneImaging Radar-C/X-BandSynthetic-Aperture Radar, whichflew on the space shuttle in April1994. Design by Karl Jacobs.
Departments
2 Headlines
47 Bookmarks
50 Contributors
52 The Back PageJupiter’s Icy Moons
Summer 2004 Vol. 5 No. 2Crosslink Earth Remote Sensing: An OverviewDavid L. Glackin
Spaceborne remote-sensing instruments are used for applications ranging from globalclimate monitoring to combat-theater weather tracking to agricultural and forestry as-sessment. Aerospace has pioneered numerous remote-sensing technologies and contin-ues to advance the field.
The Best Laid Plans: A History of the Manned Orbiting LaboratorySteven R. Strom
In the mid to late ‘60s, an ambitious project to launch an orbital space laboratory forscience and surveillance came to dominate life at Aerospace.
The Infrared Background Signature Survey:A NASA Shuttle ExperimentFrederick Simmons, Lindsay Tilney, and Thomas Hayhurst
The development of remote-sensing systems requires an accurate understanding of thephenomena to be observed. Aerospace research helped characterize space phenom-ena of interest to missile defense planners.
Active Microwave Remote SensingDaniel D. Evans
Active microwave sensing—which includes imaging and moving-target-indicating radar—offers certain advantages over other remote-sensing techniques. Aerospace has beenworking to increase the capability of this versatile technology.
Engineering and Simulation of Electro-Optical Remote-Sensing SystemsStephen Cota
In designing remote-sensing systems, performance metrics must be linked to design parameters to flow requirements into hardware specifications. Aerospace has devel-oped tools that comprehensively model the complex interaction of these metrics andparameters.
Data Compression for Remote Imaging SystemsTimothy S. Wilkinson and Hsieh S. Hou
Remote imaging platforms can generate a huge amount of data. Research at Aero-space has yielded fast and efficient techniques for reducing image sizes for more effi-cient processing and transmission.
4
11
16
20
27
32
On a clear day, you can see forever. On a cloudy day,you can still see a lot from a very great distance. To-day’s remote-sensing systems sample Earth and itsenvironment more often with more spatial resolution
over more of the electromagnetic spectrum than ever before.The Aerospace Corporation has been involved in spaceborne
remote sensing of Earth and its environment for more than 40years. The corporate expertise literally spans the spectrum, fromX ray, ultraviolet, visible, and infrared to microwave wavelengthsand frequencies. This expertise includes physics, phenomenology,and sensing techniques as well as methods for storing, transmit-ting, and analyzing remote-sensing data.
Aerospace work in remote sensing has yielded considerablebenefits for the defense and intelligence communities. But whileAerospace continues to focus on national security concerns, thecompany has also come to play a significant role in applyingremote-sensing technologies to other areas of national interest.
For example, future generations of DOD’s Defense Meteoro-logical Satellite Program (DMSP) and NOAA’s polar-orbiting en-vironmental satellites will be merged into a new NOAA/DOD/NASA program called NPOESS (National Polar-orbiting Opera-tional Environmental Satellite System). This integrated systemwill eventually boast some of the most diverse and sophisticated
sensors ever sent into orbit. Aerospace has been reviewing plansfor NPOESS in terms of both technology and policy. The goal isto help effect a smooth transition while ensuring that the demandsof the military, scientific, and commercial sectors are appropri-ately balanced.
NPOESS is emblematic of a greater change within theremote-sensing field, which has witnessed a remarkable increasein capabilities outside the military sector. In fact, DOD has be-come the largest customer for commercial satellite imagery at1-meter resolution—and this demand is prompting developmentof even finer optical systems. At the same time, instruments suchas the Special Sensor Microwave Imager/Sounder (which flewaboard the latest DMSP satellite) and the Conical-scanningMicrowave Imager/Sounder (which will fly on NPOESS) arepushing the limits of satellite-based sensing. Synthetic-apertureimaging ladar—an area in which Aerospace offers unequalledexpertise—may well usher in the next technology leap.
This issue of Crosslink presents a broad overview of Aero-space work in remote sensing, including historical programs,dominant methodologies, information processing, policymaking,and next-generation techniques. We hope it will provide aninteresting introduction while spotlighting some of Aerospace’svisionary research in the field.
Detecting Air Pollution From SpaceLeslie Belsma
The use of satellite data for air-quality applications has been hindered by a historical lack of collaboration between air-quality and satellite scientists. Aerospace is well positioned to help bridge the gap between these two communities.
Synthetic-Aperture Imaging LadarWalter F. Buell, Nicholas J. Marechal, Joseph R. Buck, Richard P. Dickinson, David Kozlowski, Timothy J. Wright, and Steven M. Beck
Aerospace has been developing a remote-sensing technique that combines ultrawideband coherent laser radar withsynthetic-aperture signal processing. The goal is to achieve high-resolution two- and three-dimensional imaging at longrange, day or night, with modest aperture diameters.
Commercial Remote Sensing and National SecurityDennis Jones
Aerospace helped craft government policy allowing satellite imaging companies to sell their products and services toforeign customers—without compromising national security.
40
45
50
From the Editors
Headlines For more news about Aerospace, visit www.aero.org/news/
2 • Crosslink Summer 2004
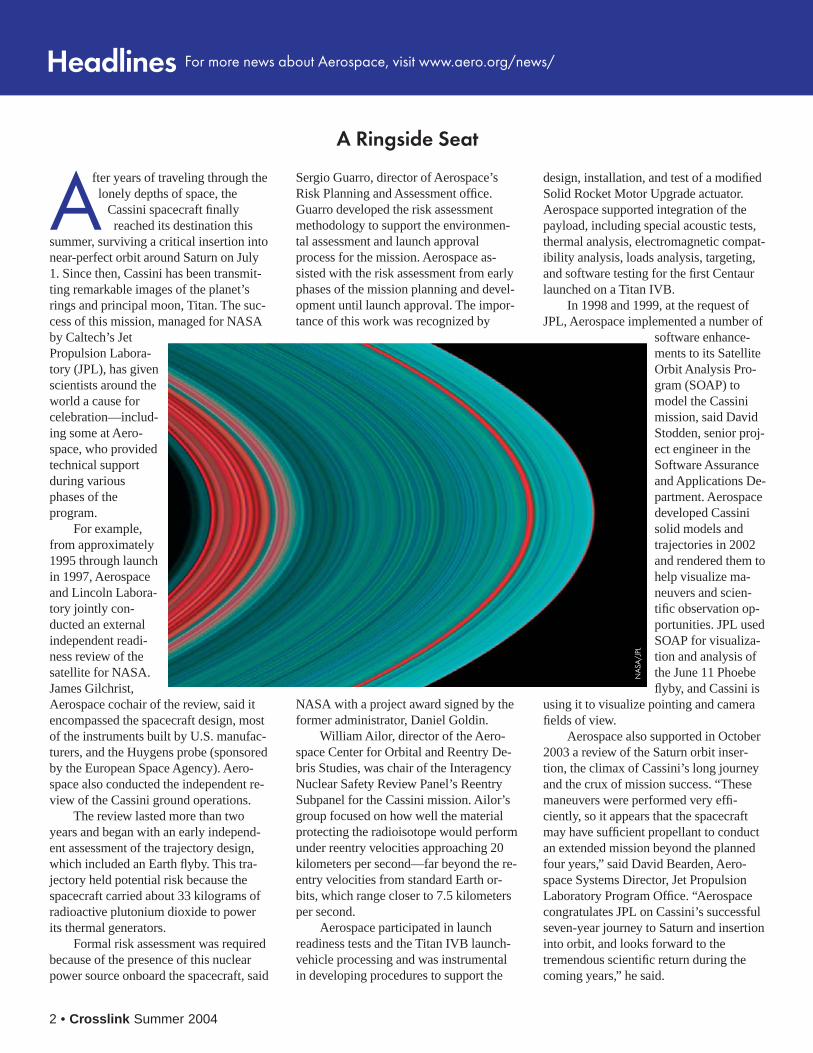
After years of traveling through thelonely depths of space, the
Cassini spacecraft finallyreached its destination this
summer, surviving a critical insertion intonear-perfect orbit around Saturn on July1. Since then, Cassini has been transmit-ting remarkable images of the planet’srings and principal moon, Titan. The suc-cess of this mission, managed for NASAby Caltech’s JetPropulsion Labora-tory (JPL), has givenscientists around theworld a cause forcelebration—includ-ing some at Aero-space, who providedtechnical supportduring variousphases of theprogram.
For example,from approximately1995 through launchin 1997, Aerospaceand Lincoln Labora-tory jointly con-ducted an externalindependent readi-ness review of thesatellite for NASA.James Gilchrist,Aerospace cochair of the review, said itencompassed the spacecraft design, mostof the instruments built by U.S. manufac-turers, and the Huygens probe (sponsoredby the European Space Agency). Aero-space also conducted the independent re-view of the Cassini ground operations.
The review lasted more than twoyears and began with an early independ-ent assessment of the trajectory design,which included an Earth flyby. This tra-jectory held potential risk because thespacecraft carried about 33 kilograms ofradioactive plutonium dioxide to powerits thermal generators.
Formal risk assessment was requiredbecause of the presence of this nuclearpower source onboard the spacecraft, said
Sergio Guarro, director of Aerospace’sRisk Planning and Assessment office.Guarro developed the risk assessmentmethodology to support the environmen-tal assessment and launch approvalprocess for the mission. Aerospace as-sisted with the risk assessment from earlyphases of the mission planning and devel-opment until launch approval. The impor-tance of this work was recognized by
NASA with a project award signed by theformer administrator, Daniel Goldin.
William Ailor, director of the Aero-space Center for Orbital and Reentry De-bris Studies, was chair of the InteragencyNuclear Safety Review Panel’s ReentrySubpanel for the Cassini mission. Ailor’sgroup focused on how well the materialprotecting the radioisotope would performunder reentry velocities approaching 20kilometers per second—far beyond the re-entry velocities from standard Earth or-bits, which range closer to 7.5 kilometersper second.
Aerospace participated in launchreadiness tests and the Titan IVB launch-vehicle processing and was instrumentalin developing procedures to support the
A Ringside Seat
design, installation, and test of a modifiedSolid Rocket Motor Upgrade actuator.Aerospace supported integration of thepayload, including special acoustic tests,thermal analysis, electromagnetic compat-ibility analysis, loads analysis, targeting,and software testing for the first Centaurlaunched on a Titan IVB.
In 1998 and 1999, at the request ofJPL, Aerospace implemented a number of
software enhance-ments to its SatelliteOrbit Analysis Pro-gram (SOAP) tomodel the Cassinimission, said DavidStodden, senior proj-ect engineer in theSoftware Assuranceand Applications De-partment. Aerospacedeveloped Cassinisolid models andtrajectories in 2002and rendered them tohelp visualize ma-neuvers and scien-tific observation op-portunities. JPL usedSOAP for visualiza-tion and analysis ofthe June 11 Phoebeflyby, and Cassini is
using it to visualize pointing and camerafields of view.
Aerospace also supported in October2003 a review of the Saturn orbit inser-tion, the climax of Cassini’s long journeyand the crux of mission success. “Thesemaneuvers were performed very effi-ciently, so it appears that the spacecraftmay have sufficient propellant to conductan extended mission beyond the plannedfour years,” said David Bearden, Aero-space Systems Director, Jet PropulsionLaboratory Program Office. “Aerospacecongratulates JPL on Cassini’s successfulseven-year journey to Saturn and insertioninto orbit, and looks forward to thetremendous scientific return during thecoming years,” he said.
NA
SA/J
PL
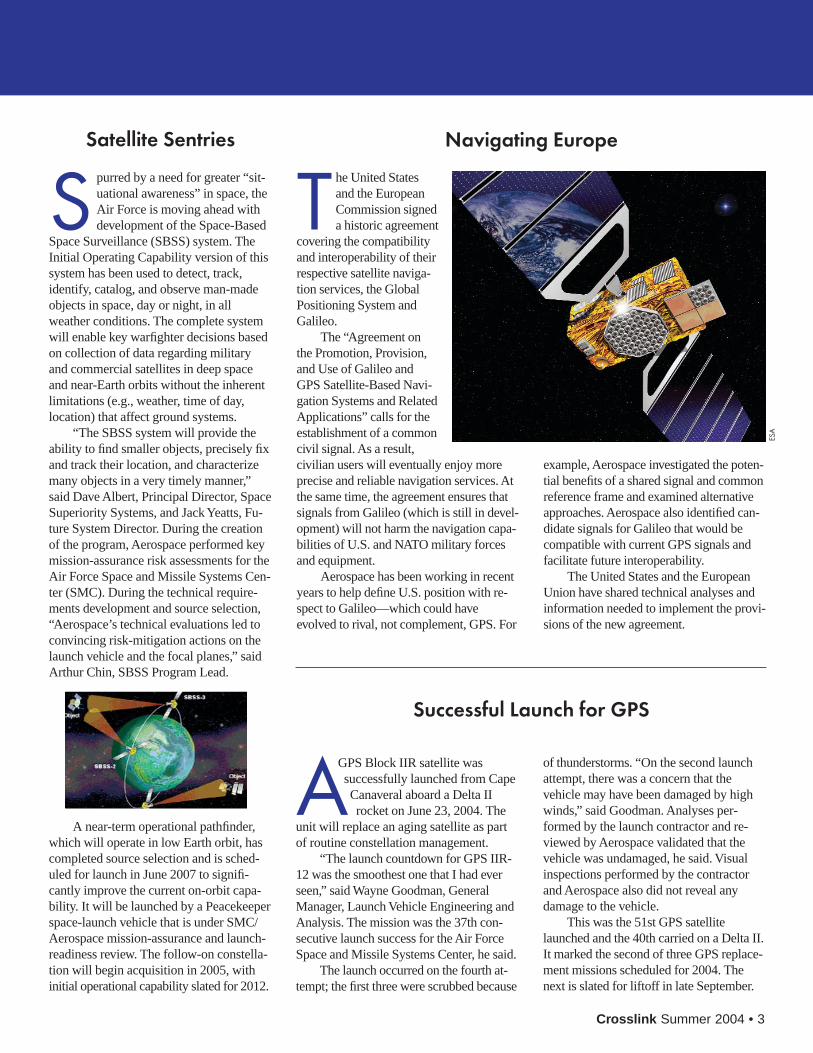
example, Aerospace investigated the poten-tial benefits of a shared signal and commonreference frame and examined alternativeapproaches. Aerospace also identified can-didate signals for Galileo that would becompatible with current GPS signals andfacilitate future interoperability.
The United States and the EuropeanUnion have shared technical analyses andinformation needed to implement the provi-sions of the new agreement.
Crosslink Summer 2004 • 3
S purred by a need for greater “sit-uational awareness” in space, theAir Force is moving ahead withdevelopment of the Space-Based
Space Surveillance (SBSS) system. TheInitial Operating Capability version of thissystem has been used to detect, track,identify, catalog, and observe man-madeobjects in space, day or night, in allweather conditions. The complete systemwill enable key warfighter decisions basedon collection of data regarding militaryand commercial satellites in deep spaceand near-Earth orbits without the inherentlimitations (e.g., weather, time of day,location) that affect ground systems.
“The SBSS system will provide theability to find smaller objects, precisely fixand track their location, and characterizemany objects in a very timely manner,”said Dave Albert, Principal Director, SpaceSuperiority Systems, and Jack Yeatts, Fu-ture System Director. During the creationof the program, Aerospace performed keymission-assurance risk assessments for theAir Force Space and Missile Systems Cen-ter (SMC). During the technical require-ments development and source selection,“Aerospace’s technical evaluations led toconvincing risk-mitigation actions on thelaunch vehicle and the focal planes,” saidArthur Chin, SBSS Program Lead.
Satellite Sentries
T he United Statesand the EuropeanCommission signeda historic agreement
covering the compatibilityand interoperability of theirrespective satellite naviga-tion services, the GlobalPositioning System andGalileo.
The “Agreement onthe Promotion, Provision,and Use of Galileo andGPS Satellite-Based Navi-gation Systems and RelatedApplications” calls for theestablishment of a commoncivil signal. As a result,civilian users will eventually enjoy moreprecise and reliable navigation services. Atthe same time, the agreement ensures thatsignals from Galileo (which is still in devel-opment) will not harm the navigation capa-bilities of U.S. and NATO military forcesand equipment.
Aerospace has been working in recentyears to help define U.S. position with re-spect to Galileo—which could haveevolved to rival, not complement, GPS. For
Navigating Europe
AGPS Block IIR satellite was successfully launched from CapeCanaveral aboard a Delta IIrocket on June 23, 2004. The
unit will replace an aging satellite as partof routine constellation management.
“The launch countdown for GPS IIR-12 was the smoothest one that I had everseen,” said Wayne Goodman, GeneralManager, Launch Vehicle Engineering andAnalysis. The mission was the 37th con-secutive launch success for the Air ForceSpace and Missile Systems Center, he said.
The launch occurred on the fourth at-tempt; the first three were scrubbed because
Successful Launch for GPS
of thunderstorms. “On the second launchattempt, there was a concern that thevehicle may have been damaged by highwinds,” said Goodman. Analyses per-formed by the launch contractor and re-viewed by Aerospace validated that thevehicle was undamaged, he said. Visualinspections performed by the contractorand Aerospace also did not reveal anydamage to the vehicle.
This was the 51st GPS satellitelaunched and the 40th carried on a Delta II.It marked the second of three GPS replace-ment missions scheduled for 2004. Thenext is slated for liftoff in late September.
A near-term operational pathfinder,which will operate in low Earth orbit, hascompleted source selection and is sched-uled for launch in June 2007 to signifi-cantly improve the current on-orbit capa-bility. It will be launched by a Peacekeeperspace-launch vehicle that is under SMC/Aerospace mission-assurance and launch-readiness review. The follow-on constella-tion will begin acquisition in 2005, withinitial operational capability slated for 2012.
ESA
4 • Crosslink Summer 2004
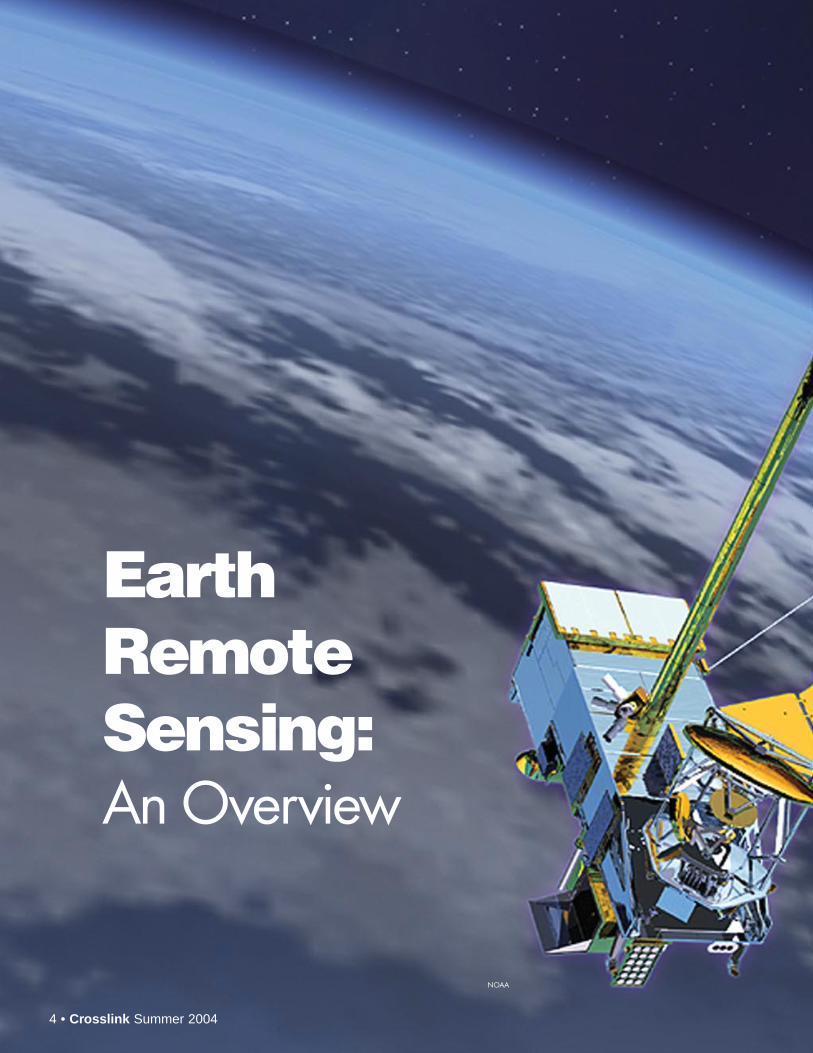
Earth Remote Sensing: An Overview
NOAA
Although the first weather satellite,TIROS I, was launched in 1960,the field of satellite-based remote
sensing of Earth really began totake form in the 1970s. The launches ofLandsat-1 in 1972, Skylab in 1973, Nim-bus-7 in 1978, and Seasat in 1978 set thestage for modern environmental remotesensing.
During these years, the Defense Mete-orological Satellite Program (DMSP) pro-vided many scientists and engineers atAerospace the opportunity to investigatenew phenomenology and instrumentation.For example, the first sensor to remotelymonitor the density of the upper atmo-sphere above 80 kilometers was conceivedand built at Aerospace. The first reportedanalysis of spaceborne imagery of the au-rora was done at Aerospace using DMSPlow-light visible imagery. When a
snow/cloud discrimination sensor flewon DMSP in 1979, Aerospace
demonstrated that the combina-tion of visible and shortwave
infrared imagery could beused not only to discrimi-
nate snow from clouds,but water clouds from
ice clouds as well.Aerospace ana-
lyzed defensesatellite data on
Crosslink Summer 2004 • 5
the eruption of Mt. St. Helens in 1980 andtracked the volcanic plume using stereo ob-servations from two satellites. And in thedays before DMSP, Aerospace built the sec-ond ozone profiler ever to fly in space,which flew in 1962.
Today, Aerospace work in remote sens-ing supports not only the Department ofDefense (DOD), but NASA, NOAA, andother governmental agencies as well. In thecoming years, as these organizations seek tocoordinate their remote-sensing efforts,Aerospace research and analysis will playan important role in determining what typeof systems are developed and deployed.
Remote Sensing in PerspectiveSince the pioneering work of the 1970s, thefield of satellite environmental remote sens-ing has steadily evolved. Before 1990, onlyabout half a dozen nations owned environ-mental satellites, but since then, the numberhas nearly quintupled. Earlier programs pri-marily involved civil and military systemsof high cost and complexity; more recently,the focus has shifted to include missionsinvolving smaller satellites, greater com-mercial involvement, and lower complexityand cost.
The civil, commercial, and militarycommunities all pursue environmental re-mote sensing activities, but these communi-ties have different needs and objectives.
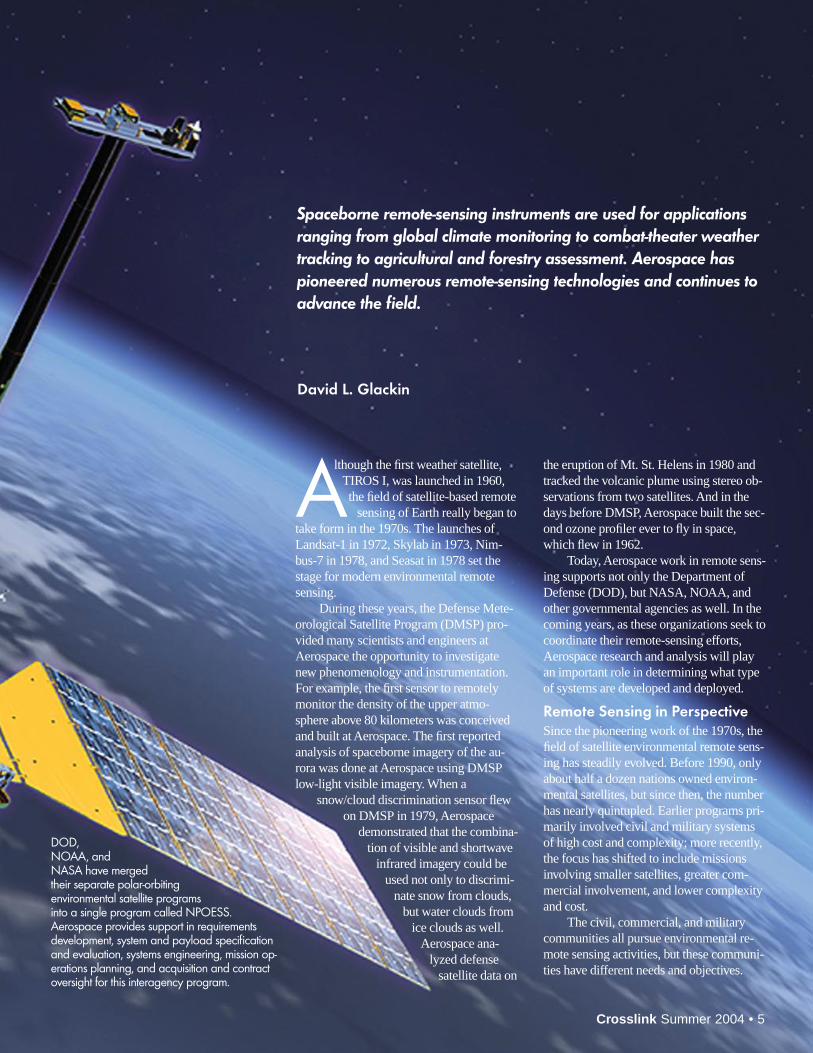
Spaceborne remote-sensing instruments are used for applicationsranging from global climate monitoring to combat-theater weathertracking to agricultural and forestry assessment. Aerospace haspioneered numerous remote-sensing technologies and continues toadvance the field.
David L. Glackin
DOD,NOAA, andNASA have mergedtheir separate polar-orbitingenvironmental satellite programsinto a single program called NPOESS.Aerospace provides support in requirementsdevelopment, system and payload specificationand evaluation, systems engineering, mission op-erations planning, and acquisition and contractoversight for this interagency program.
6 • Crosslink Summer 2004
Civil institutions tend to focus on problemssuch as monitoring and predicting globalclimate change, weather patterns, naturaldisasters, land and ocean resource usage,ozone depletion, and pollution. Commercialorganizations typically invest in systemswith higher spatial resolution whose im-agery can support applications such as map-ping, precision agriculture, urban planning,communications-equipment siting, roadwayroute selection, disaster assessment andemergency response, pipeline and power-line monitoring, real-estate visualization,and even virtual tourism. Military users typ-ically concentrate on weather monitoringand prediction as it directly supports mili-tary operations. The military is also inter-ested in high-resolution imagery, and has infact become the primary customer for com-mercial imagery at resolutions of 1 meter orbetter.
Types of InstrumentsRemote-sensing instruments fall into thegeneral classes of passive and active electro-optical and microwave sensors. Passive de-vices collect and detect natural radiation,while active instruments emit radiation andmeasure the returning signals. Electro-optical devices operate in the ultraviolet,visible, and infrared spectral regions, whilemicrowave (and submillimeter- andmillimeter-wave) devices operate below thefar infrared.
Passive electro-optical instruments in-clude multispectral imagers, hyperspectralimagers, atmospheric profilers or sounders,spectrometers, radiometers, polarimeters,CCD cameras, and film cameras. Activeelectro-optical instruments includebackscatter lidars, differential absorptionlidars, Doppler wind lidars, fluorescencelidars, and Raman lidars (“lidar” is anacronym for “light detection and ranging”).Passive microwave instruments include im-aging radiometers, atmospheric sounders,synthetic-aperture radiometers, andsubmillimeter-wave radiometers. Activemicrowave instruments include radars,synthetic-aperture radars (SARs), alti-meters, and scatterometers.
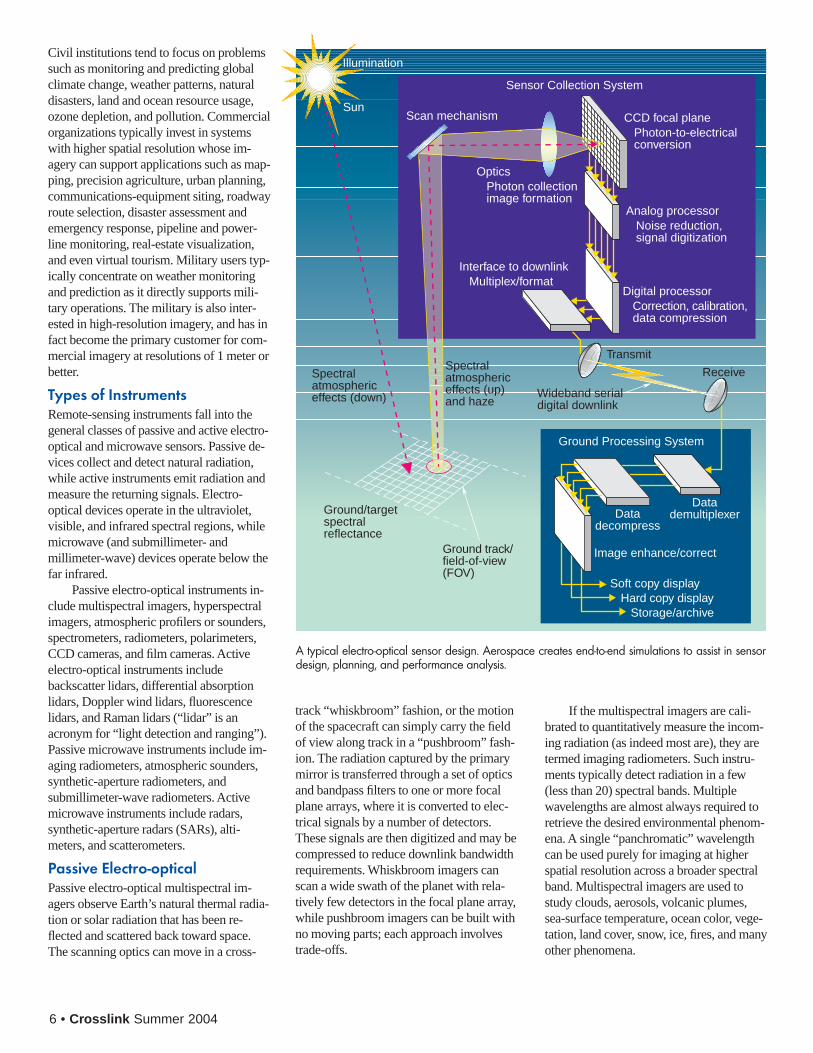
Passive Electro-opticalPassive electro-optical multispectral im-agers observe Earth’s natural thermal radia-tion or solar radiation that has been re-flected and scattered back toward space.The scanning optics can move in a cross-
track “whiskbroom” fashion, or the motionof the spacecraft can simply carry the fieldof view along track in a “pushbroom” fash-ion. The radiation captured by the primarymirror is transferred through a set of opticsand bandpass filters to one or more focalplane arrays, where it is converted to elec-trical signals by a number of detectors.These signals are then digitized and may becompressed to reduce downlink bandwidthrequirements. Whiskbroom imagers canscan a wide swath of the planet with rela-tively few detectors in the focal plane array,while pushbroom imagers can be built withno moving parts; each approach involvestrade-offs.
If the multispectral imagers are cali-brated to quantitatively measure the incom-ing radiation (as indeed most are), they aretermed imaging radiometers. Such instru-ments typically detect radiation in a few(less than 20) spectral bands. Multiplewavelengths are almost always required toretrieve the desired environmental phenom-ena. A single “panchromatic” wavelengthcan be used purely for imaging at higherspatial resolution across a broader spectralband. Multispectral imagers are used tostudy clouds, aerosols, volcanic plumes,sea-surface temperature, ocean color, vege-tation, land cover, snow, ice, fires, and manyother phenomena.
Ground/targetspectralreflectance
Illumination
Spectralatmosphericeffects (down)
Spectralatmosphericeffects (up)and haze
Ground track/field-of-view(FOV)
Sensor Collection System
Wideband serialdigital downlink
Ground Processing System
Transmit
Receive
Scan mechanism
Soft copy displayHard copy display
Storage/archive
Image enhance/correct
DatademultiplexerData
decompress
Digital processorCorrection, calibration,data compression
CCD focal planePhoton-to-electrical conversion
Analog processorNoise reduction, signal digitization
OpticsPhoton collection image formation
Interface to downlinkMultiplex/format
Sun
A typical electro-optical sensor design. Aerospace creates end-to-end simulations to assist in sensordesign, planning, and performance analysis.

Crosslink Summer 2004 • 7
In contrast to multispectral imagers,hyperspectral imagers typically cover 100to 200 spectral bands, producing simultane-ous imagery in all of them. Moreover, thesenarrow bands are usually contiguous, typi-cally extending from the visible throughshortwave-infrared regions. This makes iteasier to discriminate surface types by ex-ploiting fine details in their spectral charac-teristics. Hyperspectral imagery is used formineral and soil-type mapping, precisionagriculture, forestry, and other applications.A few hyperspectral imagers operate in thethermal (mid- to long-wave) infrared, no-tably the Aerospace SEBASS (SpatiallyEnhanced Broadband Array SpectrographSystem), an airborne instrument.
Profilers or sounders monitor severalfrequencies across a spectral band charac-teristic of a particular gas (e.g., the 15-micron band characteristic of carbon diox-ide). Typically operating in the thermalinfrared, they are most often used to meas-ure the vertical profile (a mapping based onaltitude) of atmospheric temperature, mois-ture, ozone, and trace gases.
Spectrometers exploitthe spectral “fingerprints”of environmental species,providing much higherspectral resolution thanmultispectral imagers. Theyuse a grating, prism, ormore sophisticated method(such as Fourier transformspectrometry) to spread theincoming radiation into acontinuous spectrum thatcan be detected and digi-tized. Spectrometers aretypically used for measuring trace speciesin the atmosphere or the composition of theland surface.
The distinction between the variousclasses of instruments is often blurred. Forexample, a sounder might use bandpass fil-ters to observe discrete spectral bands, or itmight employ a spectrometer to observe acontinuous spectrum from which the appro-priate sounding frequencies can be ex-tracted. Similarly, a hyperspectral imagerwill typically use a spectrometer for
spectral discrimination (in which case, it isknown as an imaging spectrometer).
Non-imaging radiometers are typicallyused to study Earth’s energy balance. Theymeasure radiation levels across the spec-trum from the ultraviolet to the far infrared,with low spatial resolution. They can meas-ure such quantities as the incoming solar ir-radiance at the top of the atmosphere andthe outgoing thermal radiation caused bythe sun’s heating of the planet. These are
The portions of the electromagnetic spectrum that are most use-ful for remote sensing can be defined as follows: The ultravioletextends from approximately 0.1 to 0.4 microns, the visible from0.4 to 0.7 microns, the near infrared from 0.7 to 1.0 microns,the shortwave infrared from 1 to 3 microns, the midwave in-frared from 3 to 5 microns, the long-wave infrared from 5 to 15microns, and the far infrared from 15 to 100 microns. Theseranges are typically defined in terms of wavelength, but otherranges can be defined in terms of frequency as well. Thus, thesubmillimeter range encompasses wavelengths from 100 to1000 microns or frequencies from 3 terahertz to 300 giga-hertz. The millimeter range extends from 300 to 30 gigahertzor 1 millimeter to 1 centimeter, and the microwave region from30 to 1 gigahertz or 1 to 30 centimeters.
Within these spectral regimes, there are “window bands” oflow atmospheric absorption (in which imagers typically oper-ate) and “absorption bands” of relatively high atmospheric ab-sorption (in which sounders operate). There are relatively fewapplications for remote sensing in the ultraviolet because of itsstrong absorption by ozone below 0.3 microns (ozone moni-toring is an obvious exception). The midwave infrared is uniquein that, during daytime, it is a confusing mix of reflected solarand emitted thermal radiation. The submillimeter or terahertzregime (between the electro-optical and microwave regimes) isonly beginning to be explored for remote-sensing purposes.
CMIS
CrlS
ATMS
VIIRS
ERBSOMPS
Some of the sensors on NPOESS (National Polar-orbiting Operational Envi-ronmental Satellite System) include: VIIRS (Visible/Infrared Imager/RadiometerSuite), which collects radiometric data of Earth's atmosphere, ocean, and landsurfaces; CMIS (Conical-scanning Microwave Imager/Sounder), which col-lects global microwave radiometry and sounding data; CrIS (Crosstrack Infra-red Sounder), which measures Earth's radiation to determine the verticaldistribution of temperature, moisture, and pressure in the atmosphere; OMPS(Ozone Mapping and Profiler Suite), which collects data for calculating the dis-tribution of ozone in the atmosphere; ATMS (Advanced Technology Micro-wave Sounder), which provides observations of temperature and moistureprofiles at high temporal resolution; and ERBS (Earth Radiation Budget Sensor).
NOAA
The Remote-Sensing Spectrum

8 • Crosslink Summer 2004
two of the principal quantities that deter-mine the net heating and cooling of Earth.
Polarimeters, which can be imaging ornonimaging devices, exploit the polariza-tion signature of the environment. The elec-tromagnetic vector that characterizes theradiation from Earth can be linearly (orelliptically) polarized, depending on thephysics of reflection and scattering. Theresulting information can be used to studyphenomena such as cloud-droplet size dis-tribution and optical thickness, aerosolproperties, vegetation, and other landsurface properties.
Active Electro-OpticalA lidar sends a laser beam into Earth’s envi-ronment and measures what is returned viareflection and scattering. This typically re-quires a large receiving telescope to capturethe returning photons. The returning signalcan be measured either by direct detectionor by heterodyne (coherent) detection. Withdirect detection, the receiving telescope actsas a simple light bucket, which means thatphase information is normally lost. Withheterodyne detection, the returning photonsare combined with the signal from a localoscillator laser, which generates an interme-diate (lower) frequency that is easier to de-tect while maintaining the frequency andphase information.
Few lidars have ever flown in space,owing to limitations involving high power,high cost, and the availability of robust lasersources. Lidar remote sensing is primarilylimited to aircraft (although the shuttle-based Lidar In-space Technology Experi-ment, or LITE, was quite successful).
Lidars can potentially generate high-resolution vertical profiles of atmospherictemperature and moisture because the re-turns can be sliced up or “range gated” intime (and thus space) if they are strongenough. Lidar also has potential for profil-ing winds, determining cloud physics,measuring trace-species concentration, etc.
Backscatter lidar is the simplest in con-cept: A laser beam scatters off of aerosols,clouds, dust, and plumes in the atmosphere.The data can be used to generate verticalprofiles of these phenomena, except wherethe beam is absorbed by clouds. A relateddevice is the laser altimeter, which recordsthe backscatter from Earth’s surface tomeasure features such as ice topographyand the vegetative canopy (e.g., the tops oftrees for biomass studies).
Differential absorp-tion lidar (DIAL) trans-mits at two wavelengths,one near the center of aspectral absorption line ofinterest, the other just out-side it. The difference inthe returned signal can beused to derive speciesconcentration, tempera-ture, moisture, or otherphenomena, dependingon the spectral line se-lected. The differentialtechnique requires no ab-solute calibration, so it’srelatively easy to achievehigh accuracy (e.g., parts-per-million to parts-per-billion for species concen-tration).
Doppler lidar meas-ures the Doppler shift ofaerosols or molecules thatare carried along with thewind. Thus, wind speedand direction can be deter-mined if two separateviews of each atmosphericparcel are acquired tomeasure velocity in thehorizontal plane. In concept, this can bedone with a conically scanning lidar and alarge receiving telescope. The availableaerosol backscatter is too low to measurethe complete wind profile as desired (fromthe surface to 20 kilometers in altitude), butmolecular scattering can be used to coverthe aerosol-sparse regions. Strong competi-tion exists in the United States between twoschools of thought that propose using director heterodyne detection. Although wind li-dar has been studied in the United Statessince 1978, it appears that the first Dopplerlidar in space will be launched by the Euro-pean Space Agency in 2007.
Fluorescence lidar is tuned to a spectralfrequency that is absorbed by the species ofinterest, then reradiated at a different fre-quency, which is detected by a radiometer.A related technology, Raman lidar, exploitsthe Raman scattering from molecules in theair, a process in which energy is typicallylost and the scattered light is reduced in fre-quency. The potential for this type of lidarto fly in space is remote. It is being used byAerospace in a portable ground-based lidarfor ground verification of atmospheric
profiles from microwave instruments onDMSP.
Passive MicrowavePassive microwave imaging radiometers(usually called microwave imagers) collectEarth’s natural radiation with an antennaand typically focus it onto one or more feedhorns that are sensitive to particular fre-quencies and polarizations. From there, it isdetected as an electrical signal, amplified,digitized, and recorded for the various fre-quencies and polarizations (linear or circu-lar). The amount of radiation measured atdifferent frequencies and polarizations canbe analyzed to produce environmental pa-rameters such as soil moisture content, pre-cipitation, sea-surface wind speed, sea-surface temperature, snow cover and watercontent, sea ice cover, atmospheric watercontent, and cloud water content. Unlikevisible imagers, microwave imagers can op-erate day or night through most types ofweather. The natural microwave radiationfrom the environment is not dependent onthe sun, and microwave radiation overbroad ranges of frequencies is quite insensi-tive to water in the atmosphere.
Model of the Conical-scanning Microwave Imager/Sounder (center)with a model of the DMSP Special Sensor Microwave/Imager (right)and a microwave imager for the Tropical Rainfall Measurement Mis-sion (left). CMIS, a multiband radiometer that will be deployed onNPOESS, integrates many features of heritage conical-scanning ra-diometers into a single radiometer. It will offer several new opera-tional products (sea surface wind direction, soil moisture, and cloudbase height) and quantifiable resolution and measurement range im-provements over existing remotely sensed environmental products.
Boei
ng S
pace
Sys
tem
s
Crosslink Summer 2004 • 9
Microwave profilers or sounders, likeelectro-optical sounders, operate in severalfrequencies around a spectral band charac-teristic of a target gas. They are often usedto measure the vertical profiles of tempera-ture and moisture in the atmosphere. Theoxygen band near 60 gigahertz, which be-comes more or less opaque as a function ofatmospheric temperature, is usually used fortemperature sounding, while the water-vapor band at 183 gigahertz is typicallyused for moisture sounding. The advantageof microwave over electro-optical soundingis that it can be done through most forms ofweather and cloud cover.
Passive microwave imagers andsounders generally operate at frequenciesranging from 6 to 183 gigahertz. Higher fre-quencies have recently been used in so-called submillimeter-wave radiometers formeasuring cloud ice content. Lower fre-quencies, around 1 gigahertz, can be used tomeasure soil moisture and ocean salinity;however, such low frequencies are not al-ways practical. For a given antenna size,spatial resolution decreases as the frequencydecreases. Most microwave imagers arelimited to a lower frequency of about 6 giga-hertz because a large antenna would be re-quired at 1 gigahertz to achieve acceptableresolution. This difficulty can be overcomethrough a technique known as aperture
synthesis. In this concept,which has long been usedin radio astronomy, theoperation of a large soliddish antenna is simulatedby using only a sparseaperture or “thinned-array” antenna. In suchan antenna, only part ofthe aperture physicallyexists and the remainderis synthesized by corre-lating the individual an-tenna elements. Thistechnique has beenproven in aircraft flightdemonstrations.
Active MicrowaveActive microwave instru-ments can be broadly di-vided into real-apertureand synthetic-apertureradars. They all transmitmicrowaves towardEarth and measure whatis reflected and scattered
back. Some are interferometric, meaningthat they exploit the signals that are seenfrom two somewhat different locations,which is a powerful means of elevationmeasurement. This can be done using twoantennas separated by a rigid boom, or us-ing a single antenna on a moving spacecraftthat acquires data at two slightly differenttimes, or using similar antennas on twoseparate spacecraft.
Real-aperture radars can be further cat-egorized as atmospheric radars, altimeters,and scatterometers.Atmospheric radarsare useful forstudying precipita-tion and the three-dimensional struc-ture of clouds. Theuse of more thanone frequency isbeneficial for separating the effects of cloudand rain attenuation from those of backscat-ter. Only one atmospheric radar is now fly-ing in space (for measuring tropical rain-fall), but others slated for launch includeNASA’s CloudSat mission, which will per-form the first 3-D profiling of clouds. Thismission is important because clouds andaerosols are the primary unknowns in theglobal climate-change equation.
Altimeters measure surface topogra-phy, and radar altimeters are typically usedto measure the surface topography of theocean (which is not as uniform as one mightthink). They operate using time-of-flightmeasurements and typically use two ormore frequencies to compensate for iono-spheric and atmospheric delays. Altimetershave been flying since the days of Skylab in1973. Aperture synthesis and interferomet-ric techniques can also be employed in al-timeters, depending on the application.
Scatterometers are a form of instru-ment that uses radar backscattering fromEarth’s surface. The most prevalent applica-tion is for the measurement of sea surfacewind speed and direction. This type of in-strument first flew on Seasat in 1978. A spe-cial class of scatterometer called delta-kradar can measure ocean surface currentsand the ocean wave spectrum using two ormore closely spaced frequencies.
Synthetic-aperture radars also flew forthe first time on Seasat. These radars some-times transmit in one polarization (horizon-tal or vertical) and receive in one or theother. A fully polarimetric synthetic-aperture radar employs all four possiblesend/receive combinations. Synthetic-aperture radars are powerful and flexible in-struments that have a wide range of applica-tions, such as monitoring sea ice, oil spills,soil moisture, snow, vegetation, and forestcover.
Aerospace SupportTraditionally, environmental remote sensingactivities at Aerospace supported militaryprograms such as DMSP. In the early
1990s, that began tochange. Aerospace sup-port to NOAA (the Na-tional Oceanic and At-mosphericAdministration) grewto include the GOES-NEXT series of geo-synchronous weather
satellites, AWIPS (the Advanced WeatherInteractive Processing System), and risk as-sessment of a proposed spaceborne globalwind-sensing system. At the same time,Aerospace conducted a series of independ-ent reviews for NASA programs, includingthe Shuttle Imaging Radar, the Total OzoneMapping Spectrometer, and the NASAScatterometer, designed for ocean windmeasurement. In 1992, Aerospace devel-oped the concept for a DMSP digital data
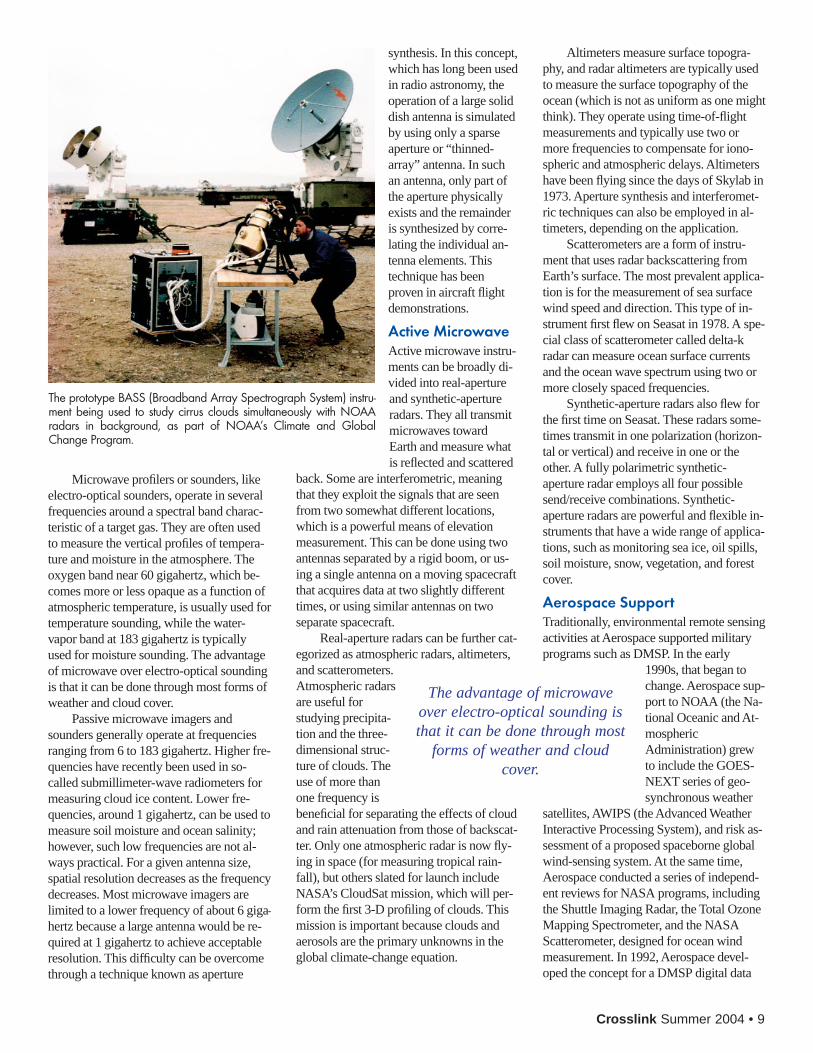
The prototype BASS (Broadband Array Spectrograph System) instru-ment being used to study cirrus clouds simultaneously with NOAAradars in background, as part of NOAA’s Climate and GlobalChange Program.
The advantage of microwaveover electro-optical sounding isthat it can be done through most
forms of weather and cloudcover.
10 • Crosslink Summer 2004
many years to come, requiring support foreverything from basic physics to groundsystems.
As of 2004, Aerospace support in envi-ronmental remote sensing extends to theEarth Science and Technology Directorateof Caltech’s Jet Propulsion Laboratory,NASA’s Earth Science Technology Office,NASA’s Goddard Space Flight Center andthe U. S. Geological Survey on Landsat,NOAA’s Office of Systems Developmenton the future of the geosynchronousweather satellite program, and NASA God-dard on the NPOESS Preparatory Project,which is a bridge between the Earth Ob-serving System and NPOESS. Aerospacemembers serve on the federal InteragencyWorking Group on Earth Observation andthe international Group on Earth Observa-tion, assisting these bodies in their attemptto coordinate future remote-sensing satel-lites and data. Aerospace further supportsthe remote-sensing space policy communityby keeping tabs on the remote-sensingplans of every nation.
Recent Developments atAerospaceIn areas where the company has unique ex-pertise, Aerospace constructs proof-of-concept instruments and collects data infield tests. For example, BASS (the Broad-band Array Spectrograph System) is a
patented infrared spectrometer for ground-based and airborne remote sensing. Underthe aegis of NOAA’s Climate and GlobalChange Program, BASS has been used tosupport efforts to combine infrared andradar reflectivity studies of cirrus clouds tounderstand their physical properties better.Clouds and aerosols are the primary sourcesof uncertainty in global climate-changemodels, so improved understanding of theirphysical properties will advance scientificunderstanding of global change.
Aerospace has advanced the field ofhyperspectral remote sensing through anevolution of BASS called SEBASS (Spa-tially Enhanced BASS). As mentioned ear-lier, hyperspectral instruments typicallyspan the visible through shortwave infrared.SEBASS, on the other hand, operates in thethermal infrared. Although a few otherhyperspectral instruments also cover thisrange, SEBASS does so with greater sensi-tivity. Aerospace has developed severalother instruments that stem from the origi-nal BASS design.
Aerospace is also working on a newremote-sensing technique known as SAIL(synthetic-aperture imaging ladar). Thistechnique, still in its infancy, uses aperturesynthesis to achieve unprecedented spatialresolution with a ladar (or laser radar). Thegroundbreaking work by Aerospace on theSAIL technique has the potential to one dayafford extremely high resolution imaging ofobjects with ladar.
ConclusionFor more than 40 years, Aerospace has pio-neered the design and development of sys-tems for remote sensing of Earth. Aero-space researchers have worked on everymajor type of instrument, as well as user re-quirements, system architecture, modelingand simulation, image compression, imageprocessing, and algorithms for understand-ing the data, in support of programs man-aged by DOD, NASA, JPL, NOAA, andothers. Familiarity with these user commu-nities puts Aerospace in a unique position tohelp coordinate their efforts and ensure thatsensing systems keep pace with the cus-tomers’ changing needs and goals.
Further ReadingD. L. Glackin and G. R. Peltzer, Civil, Com-mercial, and International Remote SensingSystems and Geoprocessing (The AerospacePress and AIAA, El Segundo, CA, 1999).
H. J. Kramer, Observation of the Earth and ItsEnvironment: Survey of Missions and Sensors,Fourth Edition (Springer-Verlag, 2002).
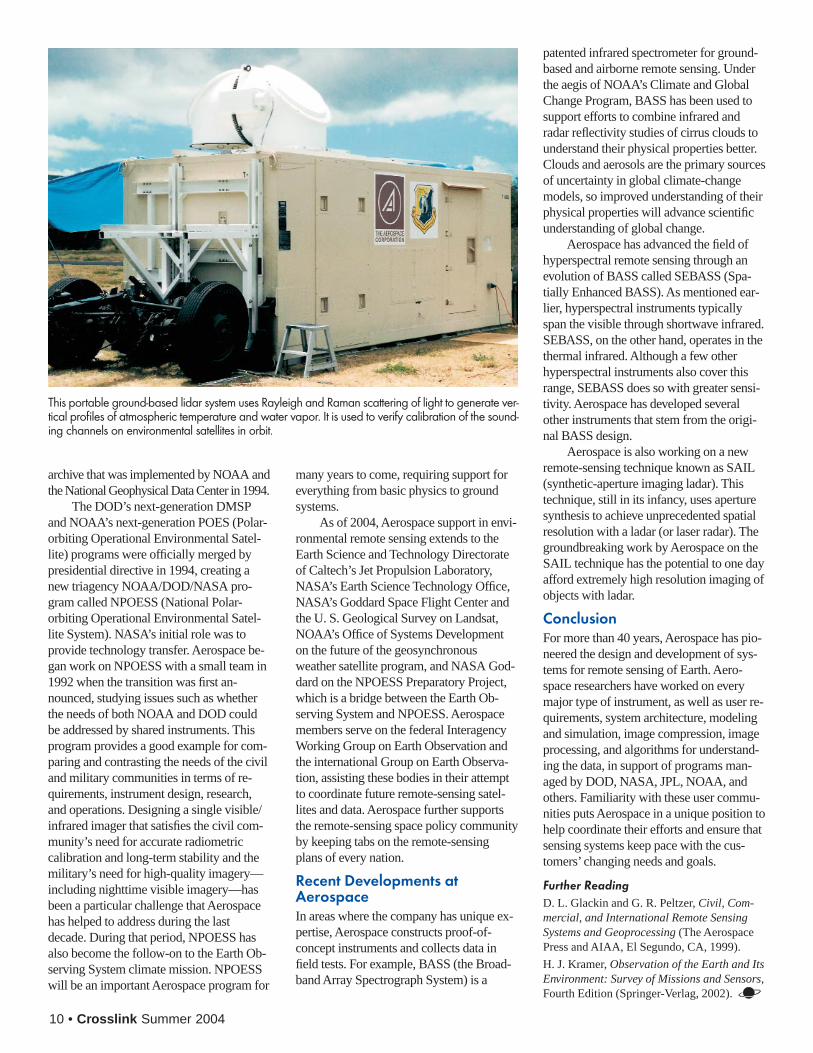
This portable ground-based lidar system uses Rayleigh and Raman scattering of light to generate ver-tical profiles of atmospheric temperature and water vapor. It is used to verify calibration of the sound-ing channels on environmental satellites in orbit.
archive that was implemented by NOAA andthe National Geophysical Data Center in 1994.
The DOD’s next-generation DMSPand NOAA’s next-generation POES (Polar-orbiting Operational Environmental Satel-lite) programs were officially merged bypresidential directive in 1994, creating anew triagency NOAA/DOD/NASA pro-gram called NPOESS (National Polar-orbiting Operational Environmental Satel-lite System). NASA’s initial role was toprovide technology transfer. Aerospace be-gan work on NPOESS with a small team in1992 when the transition was first an-nounced, studying issues such as whetherthe needs of both NOAA and DOD couldbe addressed by shared instruments. Thisprogram provides a good example for com-paring and contrasting the needs of the civiland military communities in terms of re-quirements, instrument design, research,and operations. Designing a single visible/infrared imager that satisfies the civil com-munity’s need for accurate radiometriccalibration and long-term stability and themilitary’s need for high-quality imagery—including nighttime visible imagery—hasbeen a particular challenge that Aerospacehas helped to address during the lastdecade. During that period, NPOESS hasalso become the follow-on to the Earth Ob-serving System climate mission. NPOESSwill be an important Aerospace program for

America’s space programs in the 1960s and foreshadowed leanerbudgets and lower expectations for the years to come.
Concept DevelopmentBy the early 1960s, the demise of Dyna-Soar already seemed immi-nent, and the Air Force was searching for a viable way to continue hu-man activities in space. An orbiting space platform offered opportuni-ties for human surveillance over the Soviet Union and China, whichwas important because American reconnaissance capabilities were se-verely limited after Col. Francis Gary Powers and his U-2 plane werebrought down over Soviet territory in 1960. Remote-sensing satellites,such as Corona, were still limited in their surveillance capabilities.
A few days before Secretary McNamara’s announcement, a teamof representatives from the Air Force Space Systems Division andAerospace flew to Washington, DC, to review several possible imple-mentations of MOL. Consultation with other NASA and Departmentof Defense (DOD) personnel produced a working sketch of theprogram. Planners envisioned a pressurized laboratory module,
The Best Laid Plans: A History of theManned Orbiting Laboratory
D uring one particularly momentous press conference onDecember 10, 1963, Secretary of Defense Robert McNa-mara announced both the death of the Dyna-Soar spaceplane and the birth of the Manned Orbiting Laboratory
(MOL). Like the Dyna-Soar, MOL was a farsighted Air Force pro-gram that explored the potential for piloted space flights. Like theDyna-Soar, it was cancelled before reaching its goal—but not beforemaking some important contributions in the field of spaceflight andspace-station technologies.
MOL had a profound influence on Aerospace for two importantreasons. First, in terms of sheer size, the MOL program office repre-sented an enormous expenditure of corporate funds, human re-sources, intellectual capital, and effort. Second, its cancellation in1969 had a deep psychological impact on all Aerospace personnel—not just those who worked on it—because it was the first time thatthe company was forced to make any sizeable reductions in work-force. The program’s termination represented a stark ending to thelarge budgets and expansive optimism that had characterized
In the mid to late ‘60s, an ambitious project to launch an orbital space laboratory for science and surveillance came to dominate life at Aerospace.
Steven R. Strom
Crosslink Summer 2004 • 11
12 • Crosslink Summer 2004
management office, headed by Col. RichardJacobson. Two days later, Aerospace initi-ated a major organizational restructuring,with Pete Leonard appointed to lead thenewly formed Manned Systems Division.The next month, Walt Williams came toAerospace from NASA to become vicepresident and general manager of this newdivision. By the end of the year, the numberof Aerospace technical staff members as-signed to work directly on MOL had in-creased to 34. These researchers regularlygave presentations and briefings on theirfindings in Washington throughout 1964;still, outside the Defense Department, MOLlacked a committed core of governmentsupporters.
The Air Force assigned more researchcontracts for the MOL laboratory vehicle inearly 1965, and Aerospace continued stud-ies concerning the future of the military inspace. Although the first MOL crew wasscheduled to fly sometime between late1967 and early 1968, full approval of theprogram was contingent on the DOD’sdemonstrating a genuine national need todeploy military personnel in space. To facil-itate approval, the Defense Department af-firmed that NASA’s lunar landing programwould remain the top priority and that du-plicative programs would be avoided, withthe Air Force continuing its use of existinghardware and facilities and cooperationwith NASA on MOL experiments.
The program finally received formalapproval from President Lyndon Johnsonon August 25, 1965. Johnson’s announce-ment included a budget of $1.5 billion forMOL development. The MOL programwould enable the United States to gain“new knowledge of what man is able to doin space,” Johnson said, “and relate thatability to the defense of America.” John-son’s approval marked the formal recogni-tion that the Defense Department had aclear mandate to explore the potential appli-cations of piloted spaceflight to support na-tional security requirements.
Early SuccessesFollowing official approval, the MOL pro-gram immediately began work on Phase I,which extended from September 1, 1965, toMay 1, 1966. After working primarily withthe planning for MOL, including the designconcepts for the spacecraft, Aerospace nowhad formal GSE/TD (general systems engi-neering/technical direction) for both thespacecraft and the Titan IIIC launch vehicle
under contract to Air Force Space SystemsDivision, commanded by Gen. Ben I. Funk.Pete Leonard was appointed head of a newMOL Systems Engineering Office, withWalt Williams as his associate and WilliamSampson as his assistant. The three werecollectively known as “the troika” by Aero-space employees. During Phase I, the Aero-space technical contingent working onMOL more than doubled in size, from 80 to190. The Air Force’s MOL program officehad a complex organizational structure,with Gen. Bernard Schriever serving as pro-gram director in Washington, DC, and Brig.Gen. Russell Berg, who reported directly toSchriever, acting as deputy at the SpaceSystems Division in El Segundo, Califor-nia. To improve administrative efficiency,Aerospace began colocating employeesfrom its MOL Systems Engineering Officewith members of the Air Force MOL pro-gram office in early 1966.
Aerospace Phase I activities were pri-marily directed toward firming up contrac-tor work statements and duties and initiat-ing contractor and in-house studies requiredfor system definition. Aerospace conductednumerous cost analyses to verify the accu-racy of contractor estimates for MOL com-ponents. About halfway through the firstphase, the Air Force and Aerospace re-ceived instructions to design MOL so that itcould also operate without an onboardcrew—just in case the Soviet Union ob-jected to overflight of its territory by mili-tary personnel. Aerospace had already con-ducted automation tests and was able todirect the contractors on necessary changes.The alterations, however, added roughlyone ton to the space-station weight. As a re-sult, Aerospace had to conduct additionalstudies during the next year to determinewhich subsystems could be reduced in masswithout harming the space station’s overallperformance.
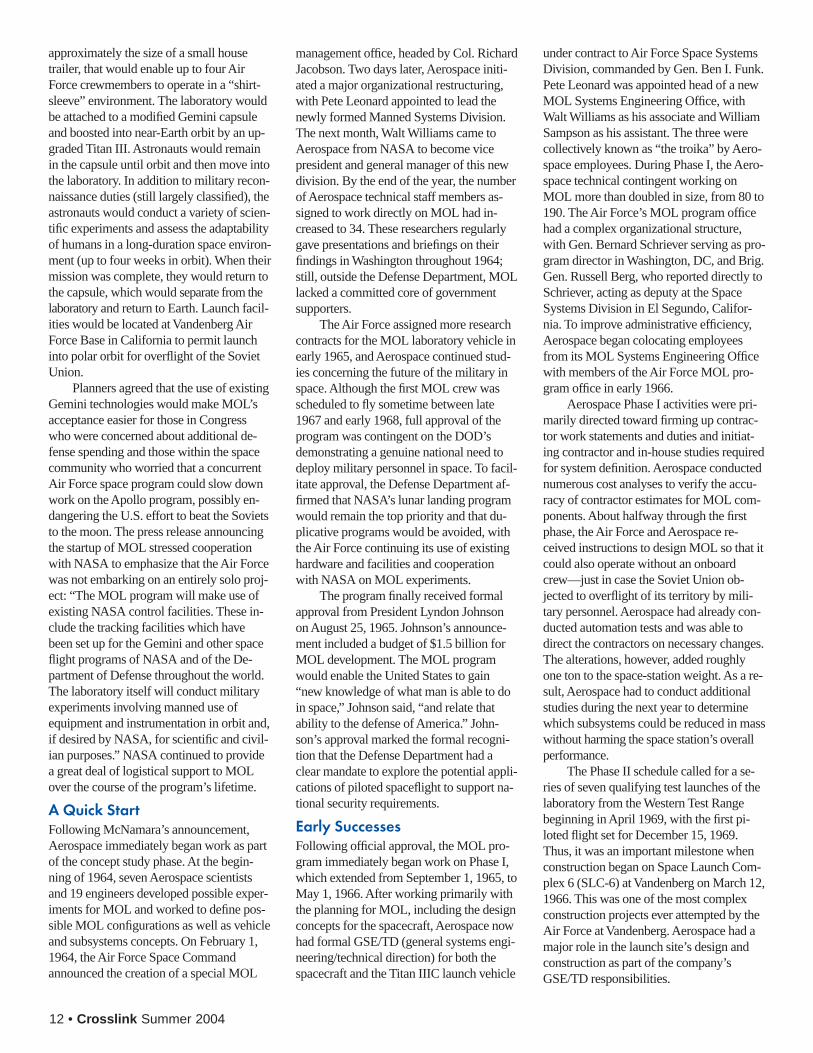
The Phase II schedule called for a se-ries of seven qualifying test launches of thelaboratory from the Western Test Rangebeginning in April 1969, with the first pi-loted flight set for December 15, 1969.Thus, it was an important milestone whenconstruction began on Space Launch Com-plex 6 (SLC-6) at Vandenberg on March 12,1966. This was one of the most complexconstruction projects ever attempted by theAir Force at Vandenberg. Aerospace had amajor role in the launch site’s design andconstruction as part of the company’sGSE/TD responsibilities.
approximately the size of a small housetrailer, that would enable up to four AirForce crewmembers to operate in a “shirt-sleeve” environment. The laboratory wouldbe attached to a modified Gemini capsuleand boosted into near-Earth orbit by an up-graded Titan III. Astronauts would remainin the capsule until orbit and then move intothe laboratory. In addition to military recon-naissance duties (still largely classified), theastronauts would conduct a variety of scien-tific experiments and assess the adaptabilityof humans in a long-duration space environ-ment (up to four weeks in orbit). When theirmission was complete, they would return tothe capsule, which would separate from thelaboratory and return to Earth. Launch facil-ities would be located at Vandenberg AirForce Base in California to permit launchinto polar orbit for overflight of the SovietUnion.
Planners agreed that the use of existingGemini technologies would make MOL’sacceptance easier for those in Congresswho were concerned about additional de-fense spending and those within the spacecommunity who worried that a concurrentAir Force space program could slow downwork on the Apollo program, possibly en-dangering the U.S. effort to beat the Sovietsto the moon. The press release announcingthe startup of MOL stressed cooperationwith NASA to emphasize that the Air Forcewas not embarking on an entirely solo proj-ect: “The MOL program will make use ofexisting NASA control facilities. These in-clude the tracking facilities which havebeen set up for the Gemini and other spaceflight programs of NASA and of the De-partment of Defense throughout the world.The laboratory itself will conduct militaryexperiments involving manned use ofequipment and instrumentation in orbit and,if desired by NASA, for scientific and civil-ian purposes.” NASA continued to providea great deal of logistical support to MOLover the course of the program’s lifetime.
A Quick StartFollowing McNamara’s announcement,Aerospace immediately began work as partof the concept study phase. At the begin-ning of 1964, seven Aerospace scientistsand 19 engineers developed possible exper-iments for MOL and worked to define pos-sible MOL configurations as well as vehicleand subsystems concepts. On February 1,1964, the Air Force Space Commandannounced the creation of a special MOL
Crosslink Summer 2004 • 13
price contracts. These contracts, intended tosave costs, only added to the work of Aero-space, which had to conduct numerousstudies to verify the pricing informationsubmitted by the contractors.
When Project Gemini successfullyconcluded, 22 members of that program of-fice were transferred to MOL, where theirexpert knowledge of Gemini hardwarecould be effectively used. Some veterans ofthe Mercury and Gemini programs weredisappointed that they would not get to sup-port the Apollo program, which would havebeen a logical next step if the Air Force hadnot decided to embark on its own pilotedspace program. In February, Aerospacemade another organizational adjustment,reflecting management’s belief that MOLwould remain a major component of thecompany’s activities. Three directorateswere established under the aegis of theMOL Systems Engineering Office: Engi-neering, led by Sam Tennant, who wouldlater serve as president of Aerospace; Oper-ations, headed by Robert Hansen; and thePlanning, Launch Operations, and Test Di-rectorate, led by Ben Hohmann, who hadachieved such great success with the Mer-cury and Gemini programs.
In a reflection of the growing bureau-cratic and engineering complexity of MOL,by May 1967, Aerospace had 28 MOL
working groups, including software man-agement, environmental control and lifesupport, crew transfer, and ground-systemscoordination. The proliferation of bureau-cracy, not only at Aerospace but in the AirForce as well, sometimes made the trans-mission of information difficult. JoeWambolt, who served as the director oflaunch operations in Ben Hohmann’s direc-torate, remembers that, “It was almost im-possible to find out what another office wasdoing. No one ever seemed to know the ‘bigpicture’of what was going on. A lot of peo-ple knew a great deal about what was hap-pening in their particular offices, but theonly person who ever understood every-thing that was going on in the entire MOLprogram, in my opinion, was Sam Tennant.”
A Shrinking BudgetA variety of problems surfaced in 1967.The year began with the tragic Apollo 1 fireon January 27, in which three astronautsdied testing their Apollo capsule on theground. The fire prompted several reviewsof the Aerospace decision to use a mixtureof 70 percent oxygen and 30 percent heliumonboard MOL, but as Ivan Getting, whoserved as the president of Aerospace duringthe life of the MOL program, noted in aninterview, the mixture proposed by Aero-space “was much safer from the standpoint
Construction began on Vandenberg’s SLC-6 in March 1966. This was one of the most complex construction projects ever attempted by theAir Force at Vandenberg. With the cancellation of MOL, SLC-6 would have to wait several decades for its first successful launch.
In November 1966, MOL enjoyed amuch-needed success when a Gemini cap-sule, attached to a modified Titan II propel-lant tank (to simulate the laboratory), waslaunched from the Eastern Test Range by aTitan IIIC. One important purpose of thislaunch was to test the stability of a hatchdoor that had been cut into the heat shieldof the Gemini capsule, an addition thatwould enable the astronauts to transfer di-rectly from their capsule to the laboratory.The capsule was ejected and recovered nearAscension Island, and the heat-shield testwas declared a success. This test flightmarked the only occasion that the TitanIIIC/MOL configuration was actuallyflown.
By the end of 1966, MOL plannerswere seeing genuine signs of progress, butthese were tempered by several negativetrends—most notably, the continued under-funding of the project and the concurrentcost overruns. These budget problemswould only worsen as the program grew incomplexity and increasingly had to com-pete for funds with the Vietnam War.
A Growing ProjectThe principal MOL contractor and majorsubcontractors were selected in early 1967.Negotiations were somewhat protractedbecause the government insisted on fixed-
US Air Force

14 • Crosslink Summer 2004
of ignition and fire” than the all-oxygen en-vironment used by NASA inside Apollo 1.Meanwhile, in March, the increasingweight of the laboratory module forced theAir Force to propose upgrading the TitanIIIC. (The crew-rated version of Titan IIIC,under development specifically for theMOL program, was designated Titan IIIM.)Much support for MOL came from theAerospace Titan program office, which wasassigned to study the proposed Titan IIICimprovements.
Further financial woes arose later inthe year when details of the next federalbudget were released. The president onlyallocated $430 million for total MOLspending, slightly more than half of the$800 million that contractors said theyneeded to complete their work. This drainon MOL funding, caused by the escalatingcosts of the Vietnam War, forced the AirForce to push back scheduled MOLlaunches.
Aerospace had been making recom-mendations for technical and schedulechanges to cut costs since the beginning of1966—but by the fall of 1967, fundingproblems became so severe that the AirForce asked Aerospace to review the entire
program to identify its most important ob-jectives and note measures that could savemoney. This study was known formally asProject Upgrade, while a concurrent techni-cal audit conducted by Aerospace wasnamed Project Emily (the derivation of thisname is unknown). Project Upgrade eventu-ally identified 22 major MOL objectives,and in March 1968, Aerospace published anew performance and requirements docu-ment that became the standard guide forMOL contractors. The idea was to reducecosts by eliminating requirements thatcould not be traced to program objectives.
When specifics of the federal budgetfor fiscal year 1969 began to appear in June1968, further problems arose. The $515million proposed for MOL—at least $100million below estimates of the amountneeded—necessitated another series ofschedule changes. The first launch was stillset for late 1970, but the third was pushedback three months. It was now planned forMOL to be operational by 1971. By thistime, constant schedule changes and budg-etary problems were affecting workforcemorale. Joe Wambolt recalls that, “No mat-ter how hard we worked, we were always ayear away from launch. We just neverseemed to get ahead.” The 1969 budget alsoforced Aerospace to cut the number of tech-nical personnel working on MOL from 300to 275. According to Air Force and Aero-space projections, roughly $700 million an-nually would be needed for the next fewyears—but with the Vietnam War still rag-ing, there was little likelihood of receivingmore than $500 million for each of the nextthree fiscal years at least.
The Air Force asked Aerospace to con-duct another series of technical reviews todetermine possible changes for the programto accommodate the reduced budgets. InJanuary 1969, a new president, Richard M.Nixon, was inaugurated, but there was littlelikelihood that he would increase fundingfor a program like MOL after campaigningon a platform of greater restraint in federalspending.
Impending DisasterDespite cutbacks and constant budget limi-tations, MOL still had the largest support ofany research and development programwithin the DOD. Moreover, by 1969, theprogram had made many significant ad-vances, including substantial progress to-ward the completion of SLC-6 as well asthe development of the Titan IIIM launch
Artist’s conception of the MOL ascending intoorbit. When this image was made, in 1964,planners expected to use a Titan IIIC to lift thelaboratory.
vehicle and various MOL subcomponents.Fourteen pilots (eleven Air Force, twoNavy, one Marine) had already been se-lected as MOL astronauts and were in train-ing. It still appeared to many Air Force andAerospace observers that a viable military“man-in-space” program was on the vergeof implementation. Thus, with the approachof June and the announcement of the 1970fiscal budget looming, there was nervous-ness among MOL team members as to howmuch funding that the program would re-ceive, but apparently no sense of impendingdisaster.
On June 10, 1969, Ivan Getting was inWashington, DC, attending a meeting of theVietnam Panel of the President’s ScientificAdvisory Board, when he heard the star-tling news that Defense Secretary MelvinLaird had just told Congress that MOL hadbeen cancelled. In an effort to reduce costs,President Nixon had opted to cut furtherfunding for MOL in favor of NASA’s muchmore visible Skylab program, which wasalso in development as a follow-up toApollo. Even though roughly $1.4 billion indevelopment funds had already been spenton MOL, the projected cost increases, thecontinuing advances in automated spacesurveillance systems, and the lack of sup-porters outside the DOD made MOL aneasy target. “Regardless of the justice of thedecision,” Getting wrote in his autobiogra-phy, “the impact on Aerospace and its peo-ple was traumatic.” The Air Force was simi-larly stunned by Nixon’s decision, and theofficial Air Force announcement of MOL’scancellation was made at the site of thenearly completed SLC-6 at Vandenberg.
When the cancellation of MOL wasannounced, nearly 600 Aerospace employ-ees were working on the program. Besidethe 205 working in the MOL program of-fice, this number included employees work-ing in various support functions, such as the50 technical staff members in the Titan of-fice assigned to work on the Titan IIIM.One out of every six members of Aero-space’s technical workforce was affected bythe cancellation. The fiscal year would endon June 30, leaving only three more weeksof funding for the Aerospace program of-fice. MOL represented about 20 percent ofthe work performed at Aerospace; job cutswere inevitable.
Nonetheless, Getting refused to allowthe company to lose some of the country’smost productive technical minds. Workingclosely with Aerospace management and
US
Air
Forc
e

Crosslink Summer 2004 • 15
Further ReadingThe Aerospace Corporation Archives, MannedOrbiting Laboratory Collection, AC-073.
The Aerospace Corporation Archives, OrbiterCollection, AC-005.
The Aerospace Corporation Archives, Presi-dent’s Report to the Board of Trustees, Vol. II(all quarterly reports published 1964–1970),AC-003.
I. Getting, All in a Lifetime: Science in the De-fense of Democracy (Vantage Press, NewYork, 1989).
I. Getting, oral history interview, March 7,2001.
Donald Pealer, “Manned Orbiting Laboratory(Parts 1 and 2),” Quest: The History of Space-flight Quarterly, Vol. 4, No. 2,3.
Space and Missile Systems Center, HistoricalArchives, MOL files.
Joe Wambolt, oral history interview, May 27,2004.
the Air Force, he quickly initiated a processof screening and reassigning MOL staff toother Aerospace programs. The Air Force,well aware of the quality of the AerospaceMOL scientists and engineers, assisted thetransfer of some Aerospace personnel tosupport other program offices. Still, therewere only so many slots available, and acorporate-wide layoff took place over thenext several weeks. Even though these lay-offs were not as severe as initially feared,they did affect corporate morale. In the finalyear of the 1960s, the boundless optimismof that decade came to an abrupt halt formany at Aerospace who wondered if theirprograms might be axed next. It was, wroteGetting, “a bitter pill.”
The MOL LegacyThough undeniably important in the historyof The Aerospace Corporation, MOL alsoplayed a vital role in the history of theAmerican space effort. It remains, muchlike the Dyna-Soar, one of the great “what-ifs?” in the history of space exploration.Had it not been terminated, MOL would
have been the first U.S. orbital spacestation, and its crews would have been thefirst to reach space from the Western TestRange (a feat still unaccomplished).
Despite the contention in 1969 thattechnology had overtaken the need for hu-man observers in space, the same argumentoriginally used to support the presence ofMOL astronauts is used today to justify acrew onboard the International Space Sta-tion. Some MOL experiments were eventu-ally performed on Skylab missions, andsome of the reconnaissance systems werelater employed on the KH series of satel-lites. MOL’s use of Gemini technology, pro-posed at the time as a useful maneuver tohelp the program win approval, has its ad-mirers in the space community today be-cause of the widespread perception thatGemini hardware was able to perform itstasks using relatively cheap, yet reliable,technology. With renewed emphasis todayon the importance of space to U.S. militaryefforts, more and more observers are look-ing back to the concepts first proposed 40years ago by the advocates of MOL.
Fourteen pilots (eleven Air Force, two Navy, one Marine) were selected asMOL astronauts. A MOL fact sheet from early 1968 notes that, “in addi-tion to their formal training in advanced aeronautics, they work as engi-neering consultants, providing the pilot’s view in the design of equipment.
For example, in the past year tests have been successfully conducted bythe crew members in a specially equipped jet aircraft flying parabolic arcsto demonstrate the capability of astronauts to transfer back and forth be-tween the Gemini B and the laboratory in a weightless environment.”
US
Air
Forc
e
16 • Crosslink Summer 2004
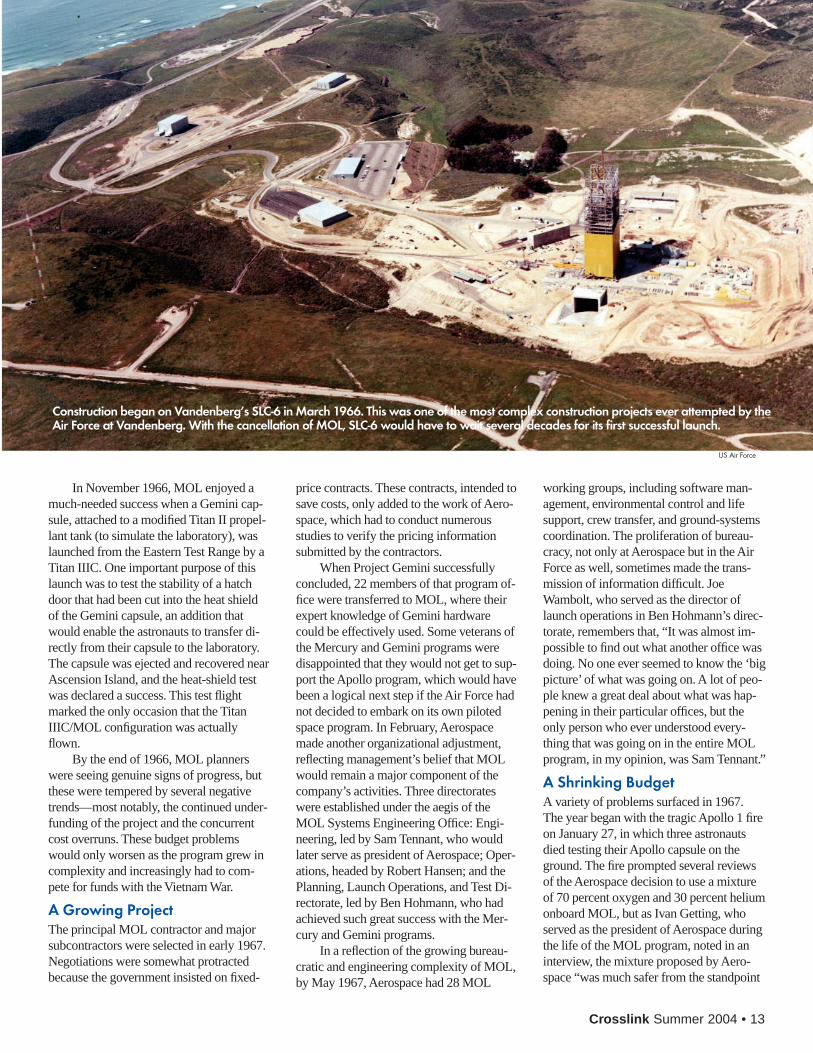
SDIO, the Strategic Defense Initia-tive Organization (precursor of theMissile Defense Agency), con-ducted numerous experiments in
the late 1980s to study phenomena relatedto the passage of intercontinental ballisticmissiles through the upper atmosphere. Un-derstanding such phenomena was consid-ered a critical step in building systems todetect and track such missiles.
In an effort to involve NATO allies inits research, SDIO invited the West Germangovernment to join in an experiment involv-ing deployment of the Shuttle Pallet Satel-lite (SPAS-II), developed and flown byWest Germany in a prior research mission.In its primary mode, deployed from thecargo bay, it would transport sensors for re-mote observations and be retrieved once thedata were collected.
The Germans proposed installing aninfrared scanner and spectrometer on thesatellite to measure the radiance profiles ofthe Earth limb, the bright background
The Infrared Background SignatureSurvey: A NASA Shuttle Experiment
NA
SA
Frederick Simmons, Lindsay Tilney, andThomas Hayhurst
The development of remote sensing systems requires an accurate understandingof the phenomena to be observed. Aerospace research helped characterizespace phenomena of interest to missile defense planners.
Crosslink Summer 2004 • 17
against which a missile defense systemwould have to discriminate midcourse tar-gets. Hence, the experiment was termedthe Infrared Background Signature Sur-vey, or simply IBSS.
A panel of scientists from several or-ganizations (including Aerospace) wasassembled to review the plan. Their im-mediate reaction was that the German in-strument was ill suited for the job. More-over, they pointed out that SDIO wasalready funding development of an instru-ment at the Air Force Geophysics Labora-tory for that very purpose (a cryogenic in-frared radiometer, which in fact flew onthe same shuttle mission as IBSS). Ac-cordingly, the group began looking forother experiments that could effectivelyuse the German instrument.
Aerospace recommended two exper-iments that were accepted by SDIO. Thefirst involved using the sensors aboardSPAS-II to observe the plumes from theshuttle’s orbital maneuvering system en-gines (OMS) and the primary reactioncontrol system thrusters (PRCS). Theseengines would approximate the thrustersthat powered the various postboost vehi-cles of concern to SDIO.
The second experiment involved thedeployment of small canisters that wouldrelease liquid rocket propellants to simu-late the rupture of a missile tank by aboost-phase interceptor. Characterizationof such propellant releases could providea basis for a missile defense system’s “killassessment.”
The plume observations wereplanned and coordinated by the Institutefor Defense Analyses, with subsequentanalyses performed at Aerospace andother organizations. The responsibilityfor the propellant releases was given toAerospace.
Preparations and DeploymentAerospace played a large role in the program as a whole by overseeing the integration of the IBSS payload into the orbiter
and managing its orbital opera-tions. The complex operations ofthis mission were planned and de-signed at the Aerospace Concep-tual Flight Planning Center usingthe NASA Flight Design Systemsoftware. Aerospace also helpeddevelop crew procedures andflight-planning requirements to en-sure that the astronauts carried outthe experiments properly.
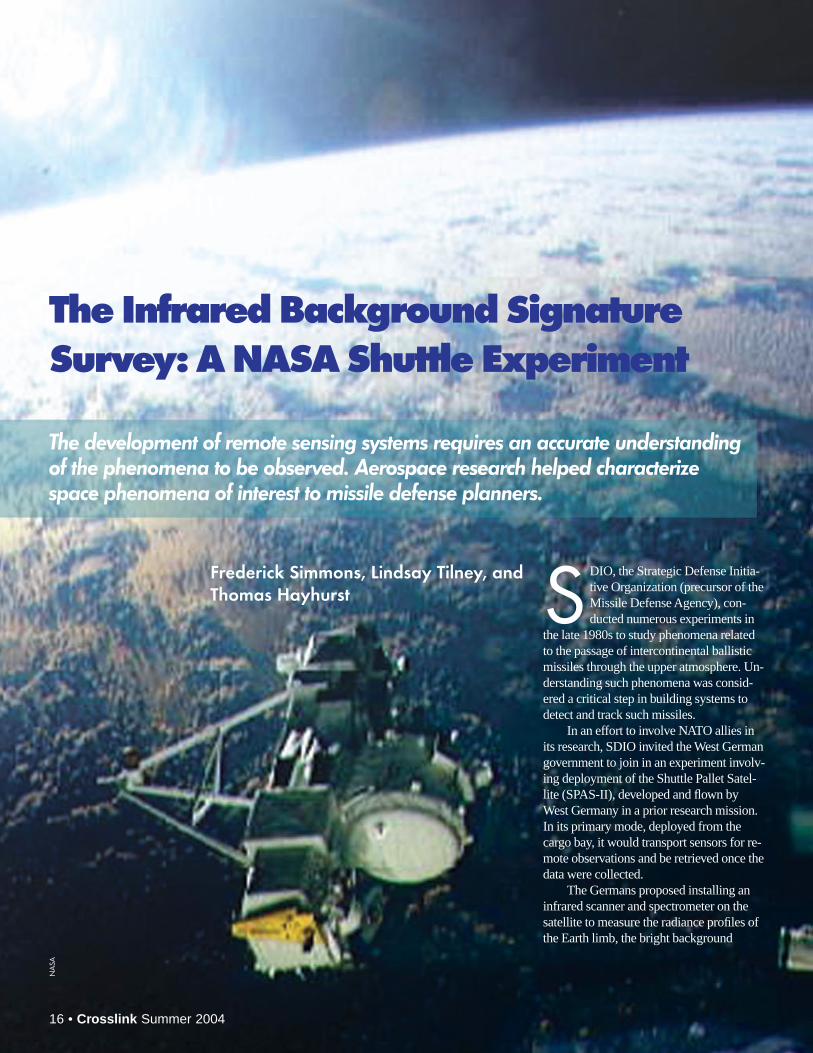
The IBSS experiments wereconducted from shuttle flight STS-39, launched April 28, 1991, into acircular orbit of 260-kilometeraltitude and 57-degree inclination.Aerospace engineers served astechnical advisors for the directorand manager for cargo operations.The various onboard activities re-quired two full shifts of astronauts (GuionBluford, Jr., now an Aerospace trustee, wasa mission specialist for the accompanyingpayload on this flight).
After the shuttle was launched, severaldeviations from the nominal timeline posedgreat challenges—most notably, dealingwith the effects of a change in launch date,a delayed SPAS-II deployment, increasedallocation of data collected while the satel-lite was attached to the remote manipulatorsystem, and a delay in the timing of thehigh-priority observations. Aerospace
The IBSS Shuttle Pallet Satellite being deployed from thebay of the orbiter Discovery by the remote grappler.
NA
SA
NA
SA
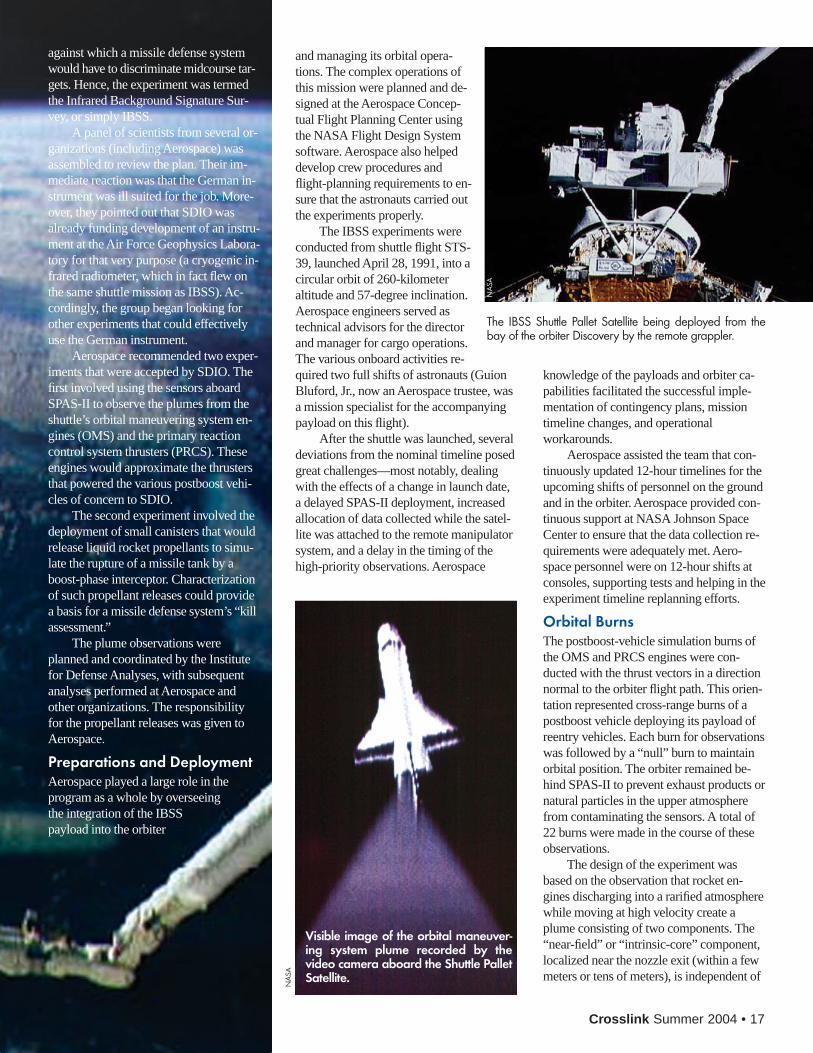
Visible image of the orbital maneuver-ing system plume recorded by thevideo camera aboard the Shuttle PalletSatellite.
knowledge of the payloads and orbiter ca-pabilities facilitated the successful imple-mentation of contingency plans, missiontimeline changes, and operationalworkarounds.
Aerospace assisted the team that con-tinuously updated 12-hour timelines for theupcoming shifts of personnel on the groundand in the orbiter. Aerospace provided con-tinuous support at NASA Johnson SpaceCenter to ensure that the data collection re-quirements were adequately met. Aero-space personnel were on 12-hour shifts atconsoles, supporting tests and helping in theexperiment timeline replanning efforts.
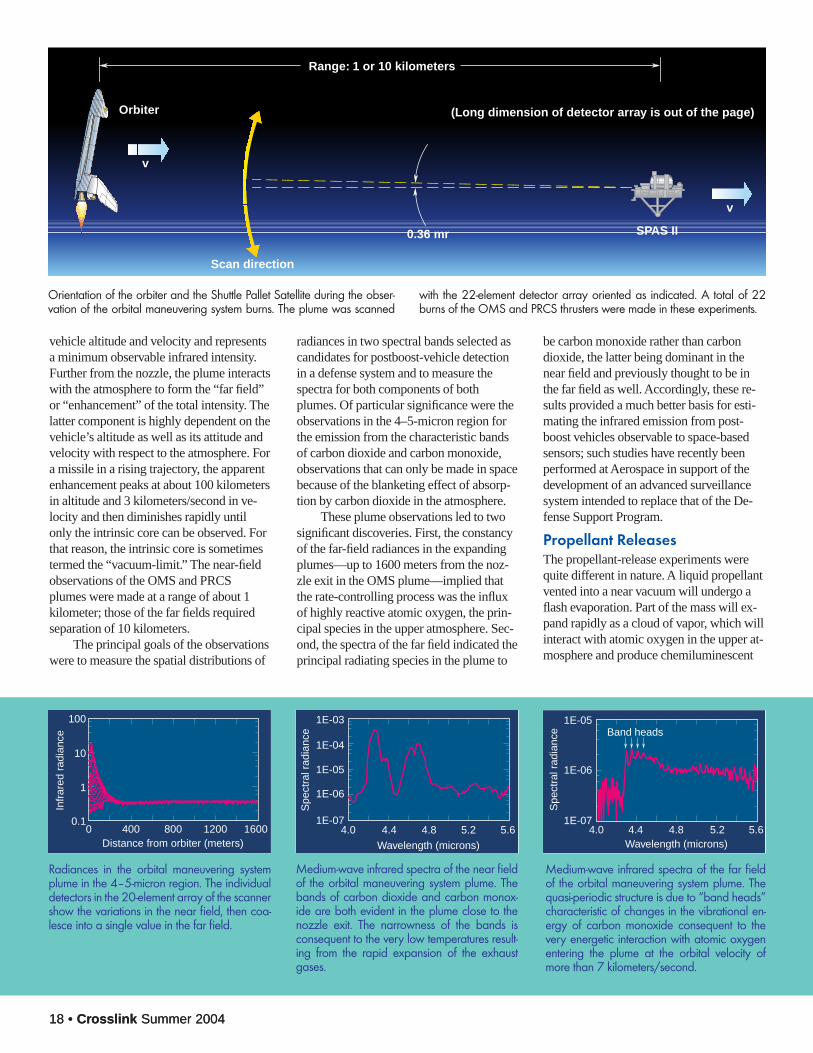
Orbital BurnsThe postboost-vehicle simulation burns ofthe OMS and PRCS engines were con-ducted with the thrust vectors in a directionnormal to the orbiter flight path. This orien-tation represented cross-range burns of apostboost vehicle deploying its payload ofreentry vehicles. Each burn for observationswas followed by a “null” burn to maintainorbital position. The orbiter remained be-hind SPAS-II to prevent exhaust products ornatural particles in the upper atmospherefrom contaminating the sensors. A total of22 burns were made in the course of theseobservations.
The design of the experiment wasbased on the observation that rocket en-gines discharging into a rarified atmospherewhile moving at high velocity create aplume consisting of two components. The“near-field” or “intrinsic-core” component,localized near the nozzle exit (within a fewmeters or tens of meters), is independent of
18 • Crosslink Summer 2004
be carbon monoxide rather than carbondioxide, the latter being dominant in thenear field and previously thought to be inthe far field as well. Accordingly, these re-sults provided a much better basis for esti-mating the infrared emission from post-boost vehicles observable to space-basedsensors; such studies have recently beenperformed at Aerospace in support of thedevelopment of an advanced surveillancesystem intended to replace that of the De-fense Support Program.
Propellant ReleasesThe propellant-release experiments werequite different in nature. A liquid propellantvented into a near vacuum will undergo aflash evaporation. Part of the mass will ex-pand rapidly as a cloud of vapor, which willinteract with atomic oxygen in the upper at-mosphere and produce chemiluminescent
18 • Crosslink Summer 2004
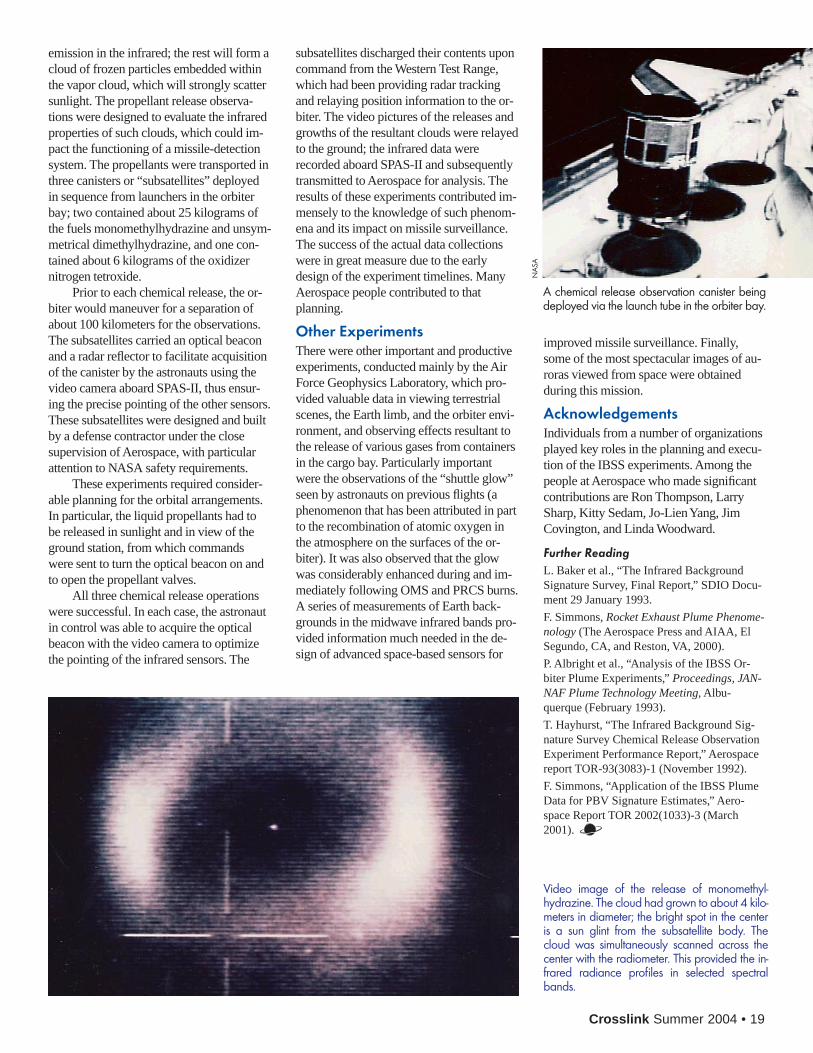
vehicle altitude and velocity and representsa minimum observable infrared intensity.Further from the nozzle, the plume interactswith the atmosphere to form the “far field”or “enhancement” of the total intensity. Thelatter component is highly dependent on thevehicle’s altitude as well as its attitude andvelocity with respect to the atmosphere. Fora missile in a rising trajectory, the apparentenhancement peaks at about 100 kilometersin altitude and 3 kilometers/second in ve-locity and then diminishes rapidly untilonly the intrinsic core can be observed. Forthat reason, the intrinsic core is sometimestermed the “vacuum-limit.” The near-fieldobservations of the OMS and PRCSplumes were made at a range of about 1kilometer; those of the far fields requiredseparation of 10 kilometers.
The principal goals of the observationswere to measure the spatial distributions of
radiances in two spectral bands selected ascandidates for postboost-vehicle detectionin a defense system and to measure thespectra for both components of bothplumes. Of particular significance were theobservations in the 4–5-micron region forthe emission from the characteristic bandsof carbon dioxide and carbon monoxide,observations that can only be made in spacebecause of the blanketing effect of absorp-tion by carbon dioxide in the atmosphere.
These plume observations led to twosignificant discoveries. First, the constancyof the far-field radiances in the expandingplumes—up to 1600 meters from the noz-zle exit in the OMS plume—implied thatthe rate-controlling process was the influxof highly reactive atomic oxygen, the prin-cipal species in the upper atmosphere. Sec-ond, the spectra of the far field indicated theprincipal radiating species in the plume to
Range: 1 or 10 kilometers
Orbiter
v
v
SPAS II
Scan direction
0.36 mr
(Long dimension of detector array is out of the page)
Orientation of the orbiter and the Shuttle Pallet Satellite during the obser-vation of the orbital maneuvering system burns. The plume was scanned
with the 22-element detector array oriented as indicated. A total of 22burns of the OMS and PRCS thrusters were made in these experiments.
Infr
ared
rad
ianc
e
Distance from orbiter (meters)
100
10
0.1
1
160012008004000
Spe
ctra
l rad
ianc
e
4.0 4.4 4.8 5.2 5.6
Wavelength (microns)
1E-03
1E-05
1E-07
1E-04
1E-06
Spe
ctra
l rad
ianc
e
4.0 4.4 4.8 5.2 5.6Wavelength (microns)
1E-05
1E-06
1E-07
Band heads
Radiances in the orbital maneuvering systemplume in the 4–5-micron region. The individualdetectors in the 20-element array of the scannershow the variations in the near field, then coa-lesce into a single value in the far field.
Medium-wave infrared spectra of the near fieldof the orbital maneuvering system plume. Thebands of carbon dioxide and carbon monox-ide are both evident in the plume close to thenozzle exit. The narrowness of the bands isconsequent to the very low temperatures result-ing from the rapid expansion of the exhaustgases.
Medium-wave infrared spectra of the far fieldof the orbital maneuvering system plume. Thequasi-periodic structure is due to “band heads”characteristic of changes in the vibrational en-ergy of carbon monoxide consequent to thevery energetic interaction with atomic oxygenentering the plume at the orbital velocity ofmore than 7 kilometers/second.
improved missile surveillance. Finally,some of the most spectacular images of au-roras viewed from space were obtainedduring this mission.
AcknowledgementsIndividuals from a number of organizationsplayed key roles in the planning and execu-tion of the IBSS experiments. Among thepeople at Aerospace who made significantcontributions are Ron Thompson, LarrySharp, Kitty Sedam, Jo-Lien Yang, JimCovington, and Linda Woodward.
Further ReadingL. Baker et al., “The Infrared BackgroundSignature Survey, Final Report,” SDIO Docu-ment 29 January 1993.
F. Simmons, Rocket Exhaust Plume Phenome-nology (The Aerospace Press and AIAA, ElSegundo, CA, and Reston, VA, 2000).
P. Albright et al., “Analysis of the IBSS Or-biter Plume Experiments,” Proceedings, JAN-NAF Plume Technology Meeting, Albu-querque (February 1993).
T. Hayhurst, “The Infrared Background Sig-nature Survey Chemical Release ObservationExperiment Performance Report,” Aerospacereport TOR-93(3083)-1 (November 1992).
F. Simmons, “Application of the IBSS PlumeData for PBV Signature Estimates,” Aero-space Report TOR 2002(1033)-3 (March2001).
Crosslink Summer 2004 • 19
subsatellites discharged their contents uponcommand from the Western Test Range,which had been providing radar trackingand relaying position information to the or-biter. The video pictures of the releases andgrowths of the resultant clouds were relayedto the ground; the infrared data wererecorded aboard SPAS-II and subsequentlytransmitted to Aerospace for analysis. Theresults of these experiments contributed im-mensely to the knowledge of such phenom-ena and its impact on missile surveillance.The success of the actual data collectionswere in great measure due to the earlydesign of the experiment timelines. ManyAerospace people contributed to thatplanning.
Other ExperimentsThere were other important and productiveexperiments, conducted mainly by the AirForce Geophysics Laboratory, which pro-vided valuable data in viewing terrestrialscenes, the Earth limb, and the orbiter envi-ronment, and observing effects resultant tothe release of various gases from containersin the cargo bay. Particularly importantwere the observations of the “shuttle glow”seen by astronauts on previous flights (aphenomenon that has been attributed in partto the recombination of atomic oxygen inthe atmosphere on the surfaces of the or-biter). It was also observed that the glowwas considerably enhanced during and im-mediately following OMS and PRCS burns.A series of measurements of Earth back-grounds in the midwave infrared bands pro-vided information much needed in the de-sign of advanced space-based sensors for
Video image of the release of monomethyl-hydrazine. The cloud had grown to about 4 kilo-meters in diameter; the bright spot in the centeris a sun glint from the subsatellite body. Thecloud was simultaneously scanned across thecenter with the radiometer. This provided the in-frared radiance profiles in selected spectralbands.
emission in the infrared; the rest will form acloud of frozen particles embedded withinthe vapor cloud, which will strongly scattersunlight. The propellant release observa-tions were designed to evaluate the infraredproperties of such clouds, which could im-pact the functioning of a missile-detectionsystem. The propellants were transported inthree canisters or “subsatellites” deployedin sequence from launchers in the orbiterbay; two contained about 25 kilograms ofthe fuels monomethylhydrazine and unsym-metrical dimethylhydrazine, and one con-tained about 6 kilograms of the oxidizernitrogen tetroxide.
Prior to each chemical release, the or-biter would maneuver for a separation ofabout 100 kilometers for the observations.The subsatellites carried an optical beaconand a radar reflector to facilitate acquisitionof the canister by the astronauts using thevideo camera aboard SPAS-II, thus ensur-ing the precise pointing of the other sensors.These subsatellites were designed and builtby a defense contractor under the closesupervision of Aerospace, with particularattention to NASA safety requirements.
These experiments required consider-able planning for the orbital arrangements.In particular, the liquid propellants had tobe released in sunlight and in view of theground station, from which commandswere sent to turn the optical beacon on andto open the propellant valves.
All three chemical release operationswere successful. In each case, the astronautin control was able to acquire the opticalbeacon with the video camera to optimizethe pointing of the infrared sensors. The
A chemical release observation canister beingdeployed via the launch tube in the orbiter bay.
NA
SA
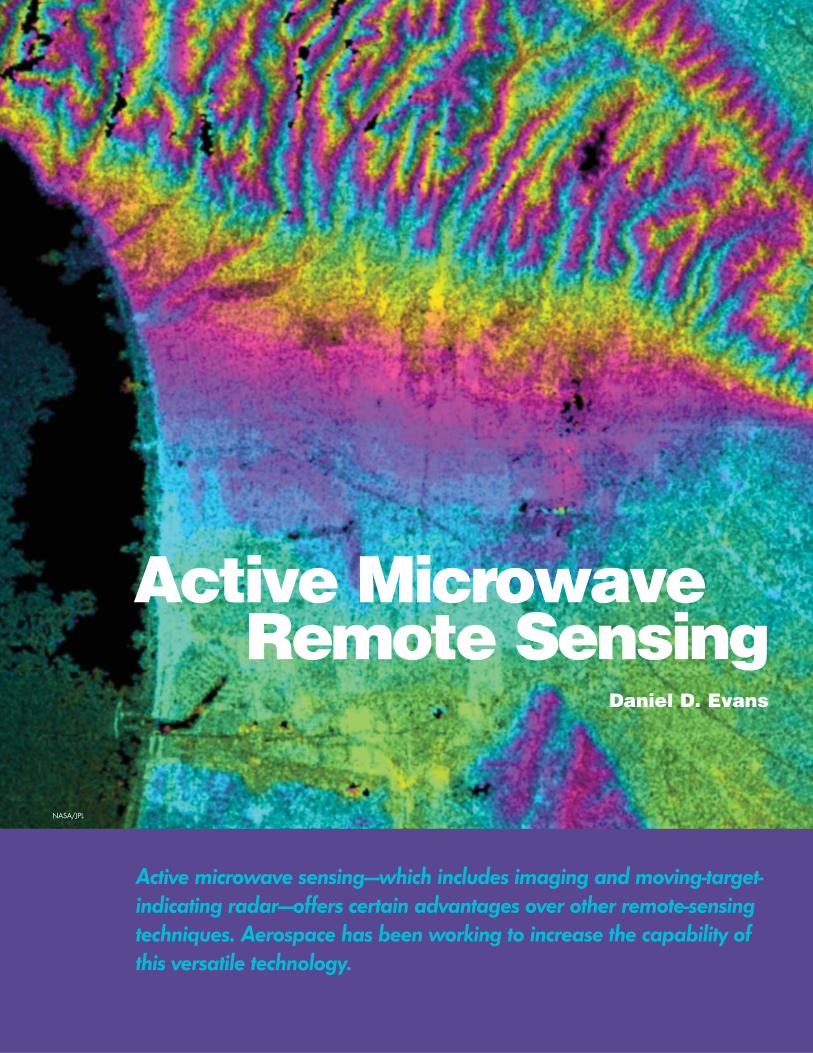
Daniel D. Evans
Remote SensingActive Microwave
Active microwave sensing—which includes imaging and moving-target-indicating radar—offers certain advantages over other remote-sensingtechniques. Aerospace has been working to increase the capability ofthis versatile technology.
NASA/JPL
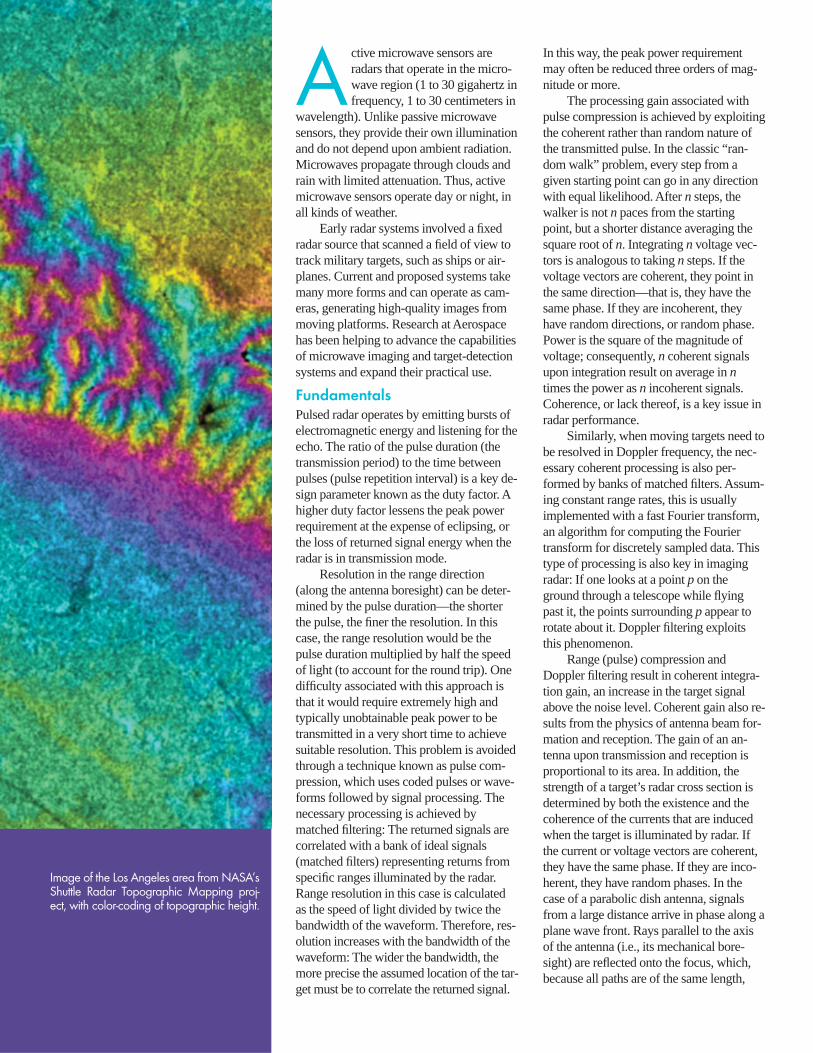
A ctive microwave sensors areradars that operate in the micro-wave region (1 to 30 gigahertz infrequency, 1 to 30 centimeters in
wavelength). Unlike passive microwavesensors, they provide their own illuminationand do not depend upon ambient radiation.Microwaves propagate through clouds andrain with limited attenuation. Thus, activemicrowave sensors operate day or night, inall kinds of weather.
Early radar systems involved a fixedradar source that scanned a field of view totrack military targets, such as ships or air-planes. Current and proposed systems takemany more forms and can operate as cam-eras, generating high-quality images frommoving platforms. Research at Aerospacehas been helping to advance the capabilitiesof microwave imaging and target-detectionsystems and expand their practical use.
FundamentalsPulsed radar operates by emitting bursts ofelectromagnetic energy and listening for theecho. The ratio of the pulse duration (thetransmission period) to the time betweenpulses (pulse repetition interval) is a key de-sign parameter known as the duty factor. Ahigher duty factor lessens the peak powerrequirement at the expense of eclipsing, orthe loss of returned signal energy when theradar is in transmission mode.
Resolution in the range direction(along the antenna boresight) can be deter-mined by the pulse duration—the shorterthe pulse, the finer the resolution. In thiscase, the range resolution would be thepulse duration multiplied by half the speedof light (to account for the round trip). Onedifficulty associated with this approach isthat it would require extremely high andtypically unobtainable peak power to betransmitted in a very short time to achievesuitable resolution. This problem is avoidedthrough a technique known as pulse com-pression, which uses coded pulses or wave-forms followed by signal processing. Thenecessary processing is achieved bymatched filtering: The returned signals arecorrelated with a bank of ideal signals(matched filters) representing returns fromspecific ranges illuminated by the radar.Range resolution in this case is calculatedas the speed of light divided by twice thebandwidth of the waveform. Therefore, res-olution increases with the bandwidth of thewaveform: The wider the bandwidth, themore precise the assumed location of the tar-get must be to correlate the returned signal.
In this way, the peak power requirementmay often be reduced three orders of mag-nitude or more.
The processing gain associated withpulse compression is achieved by exploitingthe coherent rather than random nature ofthe transmitted pulse. In the classic “ran-dom walk” problem, every step from agiven starting point can go in any directionwith equal likelihood. After n steps, thewalker is not n paces from the startingpoint, but a shorter distance averaging thesquare root of n. Integrating n voltage vec-tors is analogous to taking n steps. If thevoltage vectors are coherent, they point inthe same direction—that is, they have thesame phase. If they are incoherent, theyhave random directions, or random phase.Power is the square of the magnitude ofvoltage; consequently, n coherent signalsupon integration result on average in ntimes the power as n incoherent signals.Coherence, or lack thereof, is a key issue inradar performance.
Similarly, when moving targets need tobe resolved in Doppler frequency, the nec-essary coherent processing is also per-formed by banks of matched filters. Assum-ing constant range rates, this is usuallyimplemented with a fast Fourier transform,an algorithm for computing the Fouriertransform for discretely sampled data. Thistype of processing is also key in imagingradar: If one looks at a point p on theground through a telescope while flyingpast it, the points surrounding p appear torotate about it. Doppler filtering exploitsthis phenomenon.
Range (pulse) compression andDoppler filtering result in coherent integra-tion gain, an increase in the target signalabove the noise level. Coherent gain also re-sults from the physics of antenna beam for-mation and reception. The gain of an an-tenna upon transmission and reception isproportional to its area. In addition, thestrength of a target’s radar cross section isdetermined by both the existence and thecoherence of the currents that are inducedwhen the target is illuminated by radar. Ifthe current or voltage vectors are coherent,they have the same phase. If they are inco-herent, they have random phases. In thecase of a parabolic dish antenna, signalsfrom a large distance arrive in phase along aplane wave front. Rays parallel to the axisof the antenna (i.e., its mechanical bore-sight) are reflected onto the focus, which,because all paths are of the same length,
Image of the Los Angeles area from NASA’sShuttle Radar Topographic Mapping proj-ect, with color-coding of topographic height.
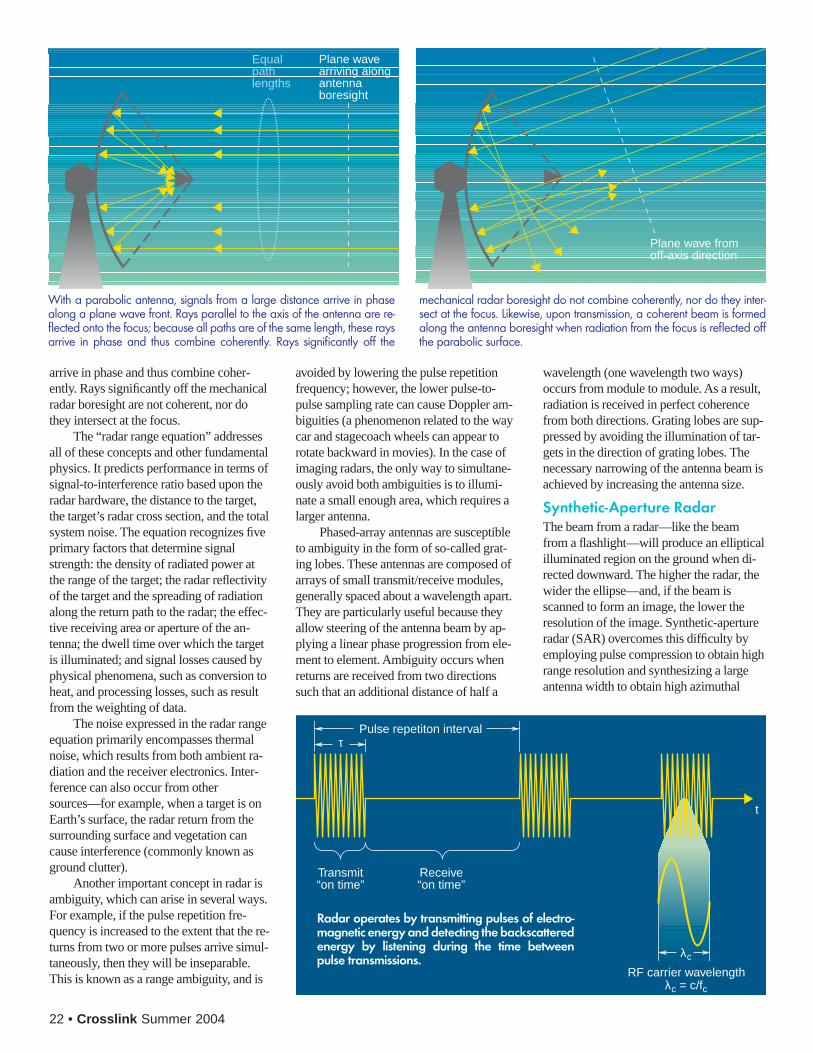
avoided by lowering the pulse repetitionfrequency; however, the lower pulse-to-pulse sampling rate can cause Doppler am-biguities (a phenomenon related to the waycar and stagecoach wheels can appear torotate backward in movies). In the case ofimaging radars, the only way to simultane-ously avoid both ambiguities is to illumi-nate a small enough area, which requires alarger antenna.
Phased-array antennas are susceptibleto ambiguity in the form of so-called grat-ing lobes. These antennas are composed ofarrays of small transmit/receive modules,generally spaced about a wavelength apart.They are particularly useful because theyallow steering of the antenna beam by ap-plying a linear phase progression from ele-ment to element. Ambiguity occurs whenreturns are received from two directionssuch that an additional distance of half a
wavelength (one wavelength two ways)occurs from module to module. As a result,radiation is received in perfect coherencefrom both directions. Grating lobes are sup-pressed by avoiding the illumination of tar-gets in the direction of grating lobes. Thenecessary narrowing of the antenna beam isachieved by increasing the antenna size.
Synthetic-Aperture RadarThe beam from a radar—like the beamfrom a flashlight—will produce an ellipticalilluminated region on the ground when di-rected downward. The higher the radar, thewider the ellipse—and, if the beam isscanned to form an image, the lower theresolution of the image. Synthetic-apertureradar (SAR) overcomes this difficulty byemploying pulse compression to obtain highrange resolution and synthesizing a largeantenna width to obtain high azimuthal
22 • Crosslink Summer 2004
arrive in phase and thus combine coher-ently. Rays significantly off the mechanicalradar boresight are not coherent, nor dothey intersect at the focus.
The “radar range equation” addressesall of these concepts and other fundamentalphysics. It predicts performance in terms ofsignal-to-interference ratio based upon theradar hardware, the distance to the target,the target’s radar cross section, and the totalsystem noise. The equation recognizes fiveprimary factors that determine signalstrength: the density of radiated power atthe range of the target; the radar reflectivityof the target and the spreading of radiationalong the return path to the radar; the effec-tive receiving area or aperture of the an-tenna; the dwell time over which the targetis illuminated; and signal losses caused byphysical phenomena, such as conversion toheat, and processing losses, such as resultfrom the weighting of data.
The noise expressed in the radar rangeequation primarily encompasses thermalnoise, which results from both ambient ra-diation and the receiver electronics. Inter-ference can also occur from othersources—for example, when a target is onEarth’s surface, the radar return from thesurrounding surface and vegetation cancause interference (commonly known asground clutter).
Another important concept in radar isambiguity, which can arise in several ways.For example, if the pulse repetition fre-quency is increased to the extent that the re-turns from two or more pulses arrive simul-taneously, then they will be inseparable.This is known as a range ambiguity, and is
τ
t
λc
RF carrier wavelengthλc = c/fc
Transmit“on time”
Receive“on time”
Pulse repetiton interval
Plane wavearriving alongantennaboresight
Equalpathlengths
Radar operates by transmitting pulses of electro-magnetic energy and detecting the backscatteredenergy by listening during the time betweenpulse transmissions.
With a parabolic antenna, signals from a large distance arrive in phasealong a plane wave front. Rays parallel to the axis of the antenna are re-flected onto the focus; because all paths are of the same length, these raysarrive in phase and thus combine coherently. Rays significantly off the
mechanical radar boresight do not combine coherently, nor do they inter-sect at the focus. Likewise, upon transmission, a coherent beam is formedalong the antenna boresight when radiation from the focus is reflected offthe parabolic surface.
Plane wave fromoff-axis direction
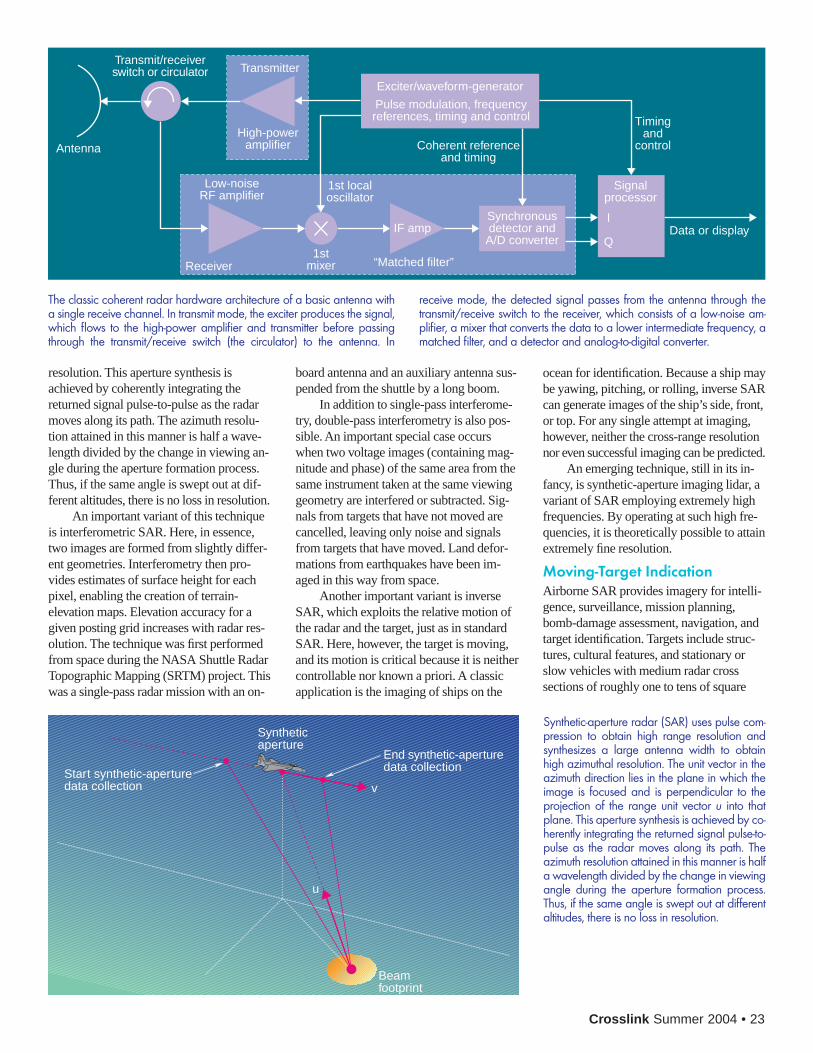
Crosslink Summer 2004 • 23
resolution. This aperture synthesis isachieved by coherently integrating thereturned signal pulse-to-pulse as the radarmoves along its path. The azimuth resolu-tion attained in this manner is half a wave-length divided by the change in viewing an-gle during the aperture formation process.Thus, if the same angle is swept out at dif-ferent altitudes, there is no loss in resolution.
An important variant of this techniqueis interferometric SAR. Here, in essence,two images are formed from slightly differ-ent geometries. Interferometry then pro-vides estimates of surface height for eachpixel, enabling the creation of terrain-elevation maps. Elevation accuracy for agiven posting grid increases with radar res-olution. The technique was first performedfrom space during the NASA Shuttle RadarTopographic Mapping (SRTM) project. Thiswas a single-pass radar mission with an on-
Antenna
Transmit/receiverswitch or circulator Transmitter
High-poweramplifier
Timingand
control
Data or display
1st localoscillator
Low-noiseRF amplifier
Receiver1st
mixer “Matched filter”
Coherent referenceand timing
Exciter/waveform-generator
Pulse modulation, frequencyreferences, timing and control
Signalprocessor
Q
IIF amp
Synchronousdetector andA/D converter
The classic coherent radar hardware architecture of a basic antenna witha single receive channel. In transmit mode, the exciter produces the signal,which flows to the high-power amplifier and transmitter before passingthrough the transmit/receive switch (the circulator) to the antenna. In
receive mode, the detected signal passes from the antenna through thetransmit/receive switch to the receiver, which consists of a low-noise am-plifier, a mixer that converts the data to a lower intermediate frequency, amatched filter, and a detector and analog-to-digital converter.
board antenna and an auxiliary antenna sus-pended from the shuttle by a long boom.
In addition to single-pass interferome-try, double-pass interferometry is also pos-sible. An important special case occurswhen two voltage images (containing mag-nitude and phase) of the same area from thesame instrument taken at the same viewinggeometry are interfered or subtracted. Sig-nals from targets that have not moved arecancelled, leaving only noise and signalsfrom targets that have moved. Land defor-mations from earthquakes have been im-aged in this way from space.
Another important variant is inverseSAR, which exploits the relative motion ofthe radar and the target, just as in standardSAR. Here, however, the target is moving,and its motion is critical because it is neithercontrollable nor known a priori. A classicapplication is the imaging of ships on the
End synthetic-aperturedata collection
Syntheticaperture
v
u
Start synthetic-aperturedata collection
Beamfootprint
Synthetic-aperture radar (SAR) uses pulse com-pression to obtain high range resolution andsynthesizes a large antenna width to obtainhigh azimuthal resolution. The unit vector in theazimuth direction lies in the plane in which theimage is focused and is perpendicular to theprojection of the range unit vector u into thatplane. This aperture synthesis is achieved by co-herently integrating the returned signal pulse-to-pulse as the radar moves along its path. Theazimuth resolution attained in this manner is halfa wavelength divided by the change in viewingangle during the aperture formation process.Thus, if the same angle is swept out at differentaltitudes, there is no loss in resolution.
ocean for identification. Because a ship maybe yawing, pitching, or rolling, inverse SARcan generate images of the ship’s side, front,or top. For any single attempt at imaging,however, neither the cross-range resolutionnor even successful imaging can be predicted.
An emerging technique, still in its in-fancy, is synthetic-aperture imaging lidar, avariant of SAR employing extremely highfrequencies. By operating at such high fre-quencies, it is theoretically possible to attainextremely fine resolution.
Moving-Target IndicationAirborne SAR provides imagery for intelli-gence, surveillance, mission planning,bomb-damage assessment, navigation, andtarget identification. Targets include struc-tures, cultural features, and stationary orslow vehicles with medium radar crosssections of roughly one to tens of square
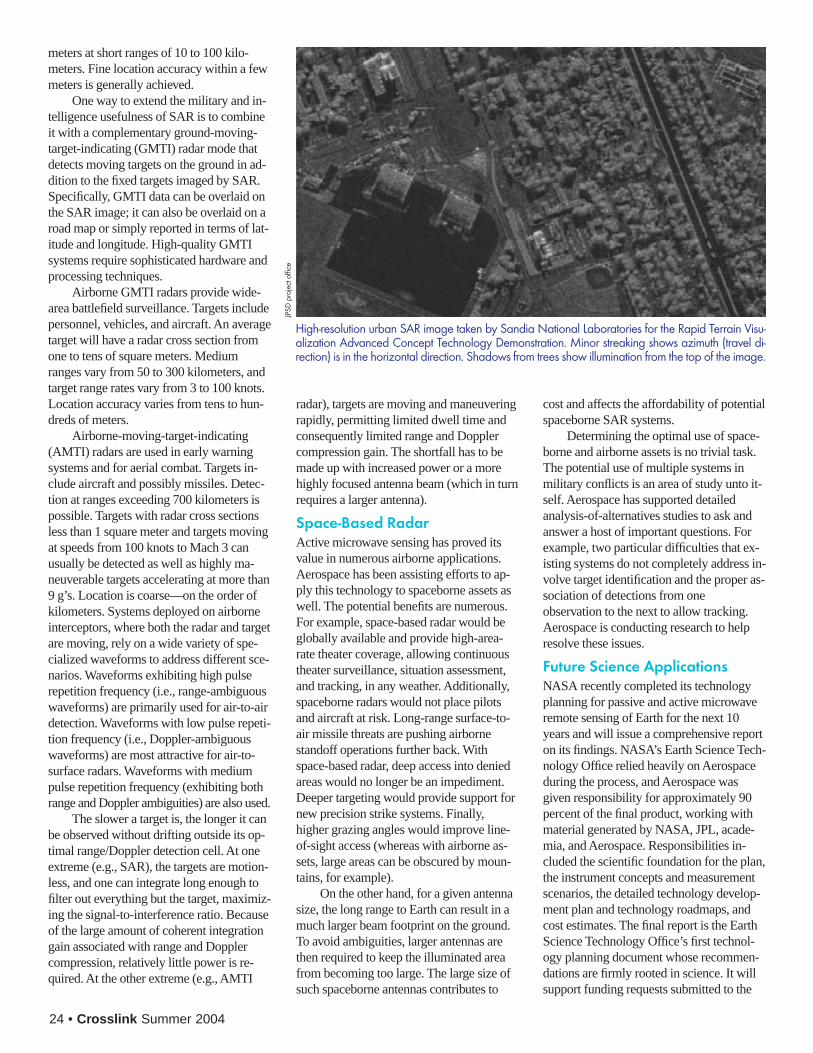
24 • Crosslink Summer 2004
High-resolution urban SAR image taken by Sandia National Laboratories for the Rapid Terrain Visu-alization Advanced Concept Technology Demonstration. Minor streaking shows azimuth (travel di-rection) is in the horizontal direction. Shadows from trees show illumination from the top of the image.
JPSD
pro
ject
offi
ce
meters at short ranges of 10 to 100 kilo-meters. Fine location accuracy within a fewmeters is generally achieved.
One way to extend the military and in-telligence usefulness of SAR is to combineit with a complementary ground-moving-target-indicating (GMTI) radar mode thatdetects moving targets on the ground in ad-dition to the fixed targets imaged by SAR.Specifically, GMTI data can be overlaid onthe SAR image; it can also be overlaid on aroad map or simply reported in terms of lat-itude and longitude. High-quality GMTIsystems require sophisticated hardware andprocessing techniques.
Airborne GMTI radars provide wide-area battlefield surveillance. Targets includepersonnel, vehicles, and aircraft. An averagetarget will have a radar cross section fromone to tens of square meters. Mediumranges vary from 50 to 300 kilometers, andtarget range rates vary from 3 to 100 knots.Location accuracy varies from tens to hun-dreds of meters.
Airborne-moving-target-indicating(AMTI) radars are used in early warningsystems and for aerial combat. Targets in-clude aircraft and possibly missiles. Detec-tion at ranges exceeding 700 kilometers ispossible. Targets with radar cross sectionsless than 1 square meter and targets movingat speeds from 100 knots to Mach 3 canusually be detected as well as highly ma-neuverable targets accelerating at more than9 g’s. Location is coarse—on the order ofkilometers. Systems deployed on airborneinterceptors, where both the radar and targetare moving, rely on a wide variety of spe-cialized waveforms to address different sce-narios. Waveforms exhibiting high pulserepetition frequency (i.e., range-ambiguouswaveforms) are primarily used for air-to-airdetection. Waveforms with low pulse repeti-tion frequency (i.e., Doppler-ambiguouswaveforms) are most attractive for air-to-surface radars. Waveforms with mediumpulse repetition frequency (exhibiting bothrange and Doppler ambiguities) are also used.
The slower a target is, the longer it canbe observed without drifting outside its op-timal range/Doppler detection cell. At oneextreme (e.g., SAR), the targets are motion-less, and one can integrate long enough tofilter out everything but the target, maximiz-ing the signal-to-interference ratio. Becauseof the large amount of coherent integrationgain associated with range and Dopplercompression, relatively little power is re-quired. At the other extreme (e.g., AMTI
radar), targets are moving and maneuveringrapidly, permitting limited dwell time andconsequently limited range and Dopplercompression gain. The shortfall has to bemade up with increased power or a morehighly focused antenna beam (which in turnrequires a larger antenna).
Space-Based RadarActive microwave sensing has proved itsvalue in numerous airborne applications.Aerospace has been assisting efforts to ap-ply this technology to spaceborne assets aswell. The potential benefits are numerous.For example, space-based radar would beglobally available and provide high-area-rate theater coverage, allowing continuoustheater surveillance, situation assessment,and tracking, in any weather. Additionally,spaceborne radars would not place pilotsand aircraft at risk. Long-range surface-to-air missile threats are pushing airbornestandoff operations further back. Withspace-based radar, deep access into deniedareas would no longer be an impediment.Deeper targeting would provide support fornew precision strike systems. Finally,higher grazing angles would improve line-of-sight access (whereas with airborne as-sets, large areas can be obscured by moun-tains, for example).
On the other hand, for a given antennasize, the long range to Earth can result in amuch larger beam footprint on the ground.To avoid ambiguities, larger antennas arethen required to keep the illuminated areafrom becoming too large. The large size ofsuch spaceborne antennas contributes to
cost and affects the affordability of potentialspaceborne SAR systems.
Determining the optimal use of space-borne and airborne assets is no trivial task.The potential use of multiple systems inmilitary conflicts is an area of study unto it-self. Aerospace has supported detailedanalysis-of-alternatives studies to ask andanswer a host of important questions. Forexample, two particular difficulties that ex-isting systems do not completely address in-volve target identification and the proper as-sociation of detections from oneobservation to the next to allow tracking.Aerospace is conducting research to helpresolve these issues.
Future Science ApplicationsNASA recently completed its technologyplanning for passive and active microwaveremote sensing of Earth for the next 10years and will issue a comprehensive reporton its findings. NASA’s Earth Science Tech-nology Office relied heavily on Aerospaceduring the process, and Aerospace wasgiven responsibility for approximately 90percent of the final product, working withmaterial generated by NASA, JPL, acade-mia, and Aerospace. Responsibilities in-cluded the scientific foundation for the plan,the instrument concepts and measurementscenarios, the detailed technology develop-ment plan and technology roadmaps, andcost estimates. The final report is the EarthScience Technology Office’s first technol-ogy planning document whose recommen-dations are firmly rooted in science. It willsupport funding requests submitted to the
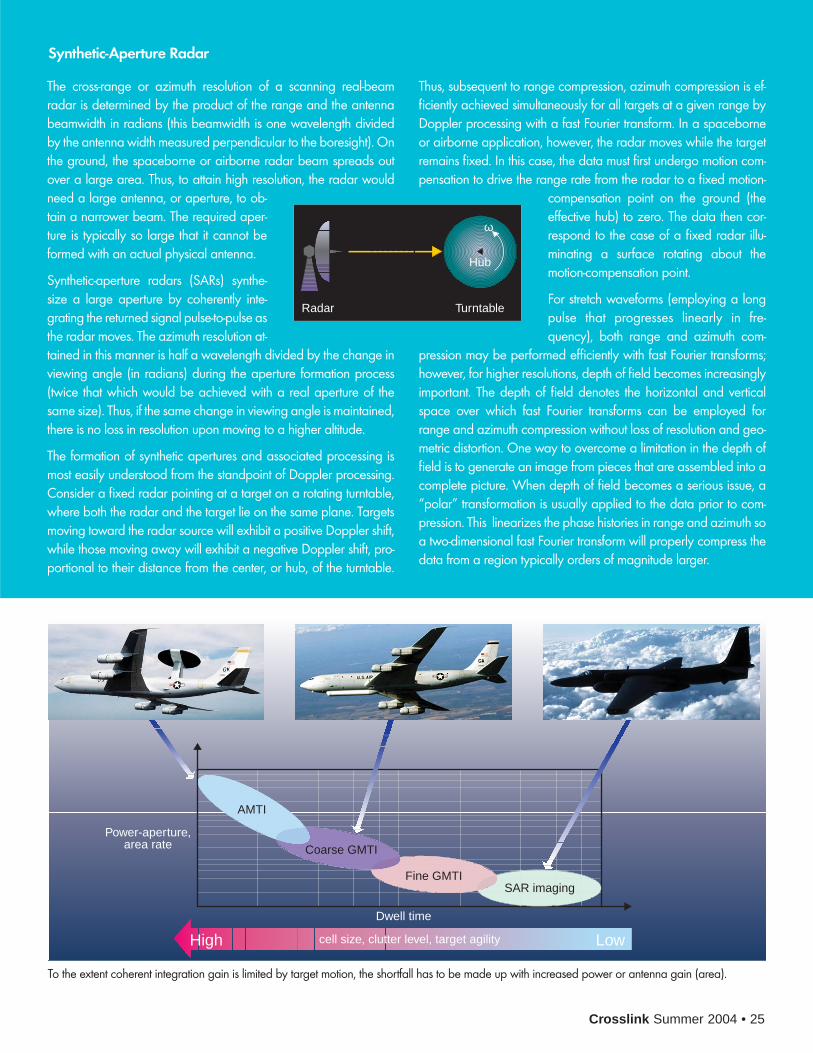
Crosslink Summer 2004 • 25
Power-aperture,area rate
Dwell time
High Lowcell size, clutter level, target agility
AMTI
Fine GMTISAR imaging
Coarse GMTI
To the extent coherent integration gain is limited by target motion, the shortfall has to be made up with increased power or antenna gain (area).
The cross-range or azimuth resolution of a scanning real-beamradar is determined by the product of the range and the antennabeamwidth in radians (this beamwidth is one wavelength dividedby the antenna width measured perpendicular to the boresight). Onthe ground, the spaceborne or airborne radar beam spreads outover a large area. Thus, to attain high resolution, the radar wouldneed a large antenna, or aperture, to ob-tain a narrower beam. The required aper-ture is typically so large that it cannot beformed with an actual physical antenna.
Synthetic-aperture radars (SARs) synthe-size a large aperture by coherently inte-grating the returned signal pulse-to-pulse asthe radar moves. The azimuth resolution at-tained in this manner is half a wavelength divided by the change inviewing angle (in radians) during the aperture formation process(twice that which would be achieved with a real aperture of thesame size). Thus, if the same change in viewing angle is maintained,there is no loss in resolution upon moving to a higher altitude.
The formation of synthetic apertures and associated processing ismost easily understood from the standpoint of Doppler processing.Consider a fixed radar pointing at a target on a rotating turntable,where both the radar and the target lie on the same plane. Targetsmoving toward the radar source will exhibit a positive Doppler shift,while those moving away will exhibit a negative Doppler shift, pro-portional to their distance from the center, or hub, of the turntable.
Thus, subsequent to range compression, azimuth compression is ef-ficiently achieved simultaneously for all targets at a given range byDoppler processing with a fast Fourier transform. In a spaceborneor airborne application, however, the radar moves while the targetremains fixed. In this case, the data must first undergo motion com-pensation to drive the range rate from the radar to a fixed motion-
compensation point on the ground (theeffective hub) to zero. The data then cor-respond to the case of a fixed radar illu-minating a surface rotating about themotion-compensation point.
For stretch waveforms (employing a longpulse that progresses linearly in fre-quency), both range and azimuth com-
pression may be performed efficiently with fast Fourier transforms;however, for higher resolutions, depth of field becomes increasinglyimportant. The depth of field denotes the horizontal and verticalspace over which fast Fourier transforms can be employed forrange and azimuth compression without loss of resolution and geo-metric distortion. One way to overcome a limitation in the depth offield is to generate an image from pieces that are assembled into acomplete picture. When depth of field becomes a serious issue, a“polar” transformation is usually applied to the data prior to com-pression. This linearizes the phase histories in range and azimuth soa two-dimensional fast Fourier transform will properly compress thedata from a region typically orders of magnitude larger.
Synthetic-Aperture Radar
Hub
ω
Radar Turntable
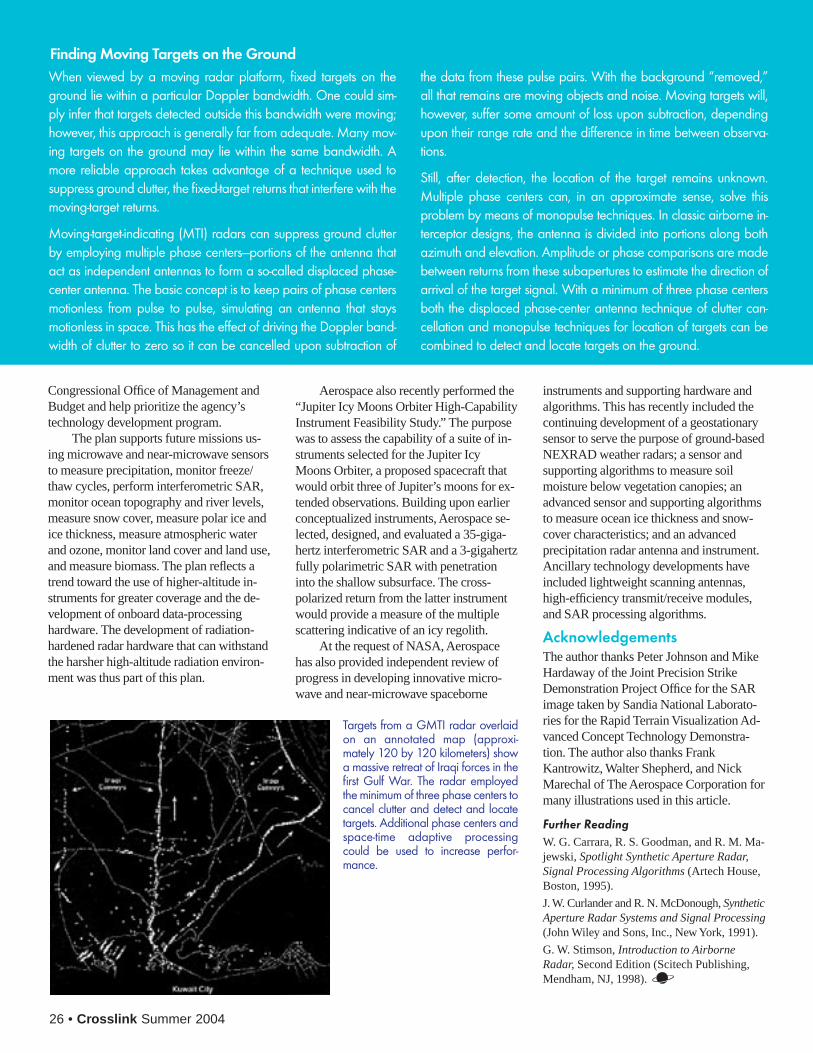
Congressional Office of Management andBudget and help prioritize the agency’stechnology development program.
The plan supports future missions us-ing microwave and near-microwave sensorsto measure precipitation, monitor freeze/thaw cycles, perform interferometric SAR,monitor ocean topography and river levels,measure snow cover, measure polar ice andice thickness, measure atmospheric waterand ozone, monitor land cover and land use,and measure biomass. The plan reflects atrend toward the use of higher-altitude in-struments for greater coverage and the de-velopment of onboard data-processinghardware. The development of radiation-hardened radar hardware that can withstandthe harsher high-altitude radiation environ-ment was thus part of this plan.
Aerospace also recently performed the“Jupiter Icy Moons Orbiter High-CapabilityInstrument Feasibility Study.” The purposewas to assess the capability of a suite of in-struments selected for the Jupiter IcyMoons Orbiter, a proposed spacecraft thatwould orbit three of Jupiter’s moons for ex-tended observations. Building upon earlierconceptualized instruments, Aerospace se-lected, designed, and evaluated a 35-giga-hertz interferometric SAR and a 3-gigahertzfully polarimetric SAR with penetrationinto the shallow subsurface. The cross-polarized return from the latter instrumentwould provide a measure of the multiplescattering indicative of an icy regolith.
At the request of NASA, Aerospacehas also provided independent review ofprogress in developing innovative micro-wave and near-microwave spaceborne
26 • Crosslink Summer 2004
Targets from a GMTI radar overlaidon an annotated map (approxi-mately 120 by 120 kilometers) showa massive retreat of Iraqi forces in thefirst Gulf War. The radar employedthe minimum of three phase centers tocancel clutter and detect and locatetargets. Additional phase centers andspace-time adaptive processingcould be used to increase perfor-mance.
When viewed by a moving radar platform, fixed targets on theground lie within a particular Doppler bandwidth. One could sim-ply infer that targets detected outside this bandwidth were moving;however, this approach is generally far from adequate. Many mov-ing targets on the ground may lie within the same bandwidth. Amore reliable approach takes advantage of a technique used tosuppress ground clutter, the fixed-target returns that interfere with themoving-target returns.
Moving-target-indicating (MTI) radars can suppress ground clutterby employing multiple phase centers—portions of the antenna thatact as independent antennas to form a so-called displaced phase-center antenna. The basic concept is to keep pairs of phase centersmotionless from pulse to pulse, simulating an antenna that staysmotionless in space. This has the effect of driving the Doppler band-width of clutter to zero so it can be cancelled upon subtraction of
the data from these pulse pairs. With the background “removed,”all that remains are moving objects and noise. Moving targets will,however, suffer some amount of loss upon subtraction, dependingupon their range rate and the difference in time between observa-tions.
Still, after detection, the location of the target remains unknown.Multiple phase centers can, in an approximate sense, solve thisproblem by means of monopulse techniques. In classic airborne in-terceptor designs, the antenna is divided into portions along bothazimuth and elevation. Amplitude or phase comparisons are madebetween returns from these subapertures to estimate the direction ofarrival of the target signal. With a minimum of three phase centersboth the displaced phase-center antenna technique of clutter can-cellation and monopulse techniques for location of targets can becombined to detect and locate targets on the ground.
Finding Moving Targets on the Ground
instruments and supporting hardware andalgorithms. This has recently included thecontinuing development of a geostationarysensor to serve the purpose of ground-basedNEXRAD weather radars; a sensor andsupporting algorithms to measure soilmoisture below vegetation canopies; anadvanced sensor and supporting algorithmsto measure ocean ice thickness and snow-cover characteristics; and an advancedprecipitation radar antenna and instrument.Ancillary technology developments haveincluded lightweight scanning antennas,high-efficiency transmit/receive modules,and SAR processing algorithms.
AcknowledgementsThe author thanks Peter Johnson and MikeHardaway of the Joint Precision StrikeDemonstration Project Office for the SARimage taken by Sandia National Laborato-ries for the Rapid Terrain Visualization Ad-vanced Concept Technology Demonstra-tion. The author also thanks FrankKantrowitz, Walter Shepherd, and NickMarechal of The Aerospace Corporation formany illustrations used in this article.
Further ReadingW. G. Carrara, R. S. Goodman, and R. M. Ma-jewski, Spotlight Synthetic Aperture Radar,Signal Processing Algorithms (Artech House,Boston, 1995).
J. W. Curlander and R. N. McDonough, SyntheticAperture Radar Systems and Signal Processing(John Wiley and Sons, Inc., New York, 1991).
G. W. Stimson, Introduction to AirborneRadar, Second Edition (Scitech Publishing,Mendham, NJ, 1998).

Crosslink Summer 2004 • 27
E lectro-optical remote-sensing sys-tems are built to do specific jobs—for example, to make meteorologi-cal measurements, to characterize
Earth’s climate, to track patterns of landuse, or to collect high-quality imagery. It isthe systems engineer’s task to determinewhat characteristics a proposed systemmust have to fulfill its mission. To do so, theengineer must “flow down” requirementsfrom the mission level to the sensor as awhole, from the sensor to its components,and from components to subcomponents.Aerospace has developed tools and expert-ise to facilitate this complex process.
Performance GoalsIn most cases, top-level system perfor-mance must be expressed in quantitativeterms in order to flow down requirements.
In the case of a meteorological sensor, per-formance might be specified in terms of thedesired accuracy of surface reflectance orsurface temperature measurements. For animaging sensor, performance might bespecified in terms of a quantitative metricsuch as the National Image InterpretabilityRating System (NIIRS), which grades im-ages based on their usefulness in perform-ing analytic tasks.
Once presented with a quantitative top-level requirement, the systems engineer de-termines which hardware would be suitablebased on standard performance metrics.Such metrics are many and varied.
A large class of metrics appropriate toradiometric and imaging systems are thoserelated to signal-to-noise ratio, which mustbe high enough to confidently distinguishthe lowest signal of interest from spurious
features caused by electronic noise or theinherent fluctuations of the signal. Thesignal-to-noise ratio itself may be the pre-ferred metric, or it may be replaced by a“noise-equivalent” quantity, such as noise-equivalent delta reflectance or noise-equivalent temperature difference. A noise-equivalent quantity represents the inputsignal level required to achieve a signal-to-noise ratio of exactly 1. It is convenientbecause it presents the noise in the units ofthe signal. All of these metrics set con-straints on the hardware. For example, tomaximize the signal, the detectors must belarge (to collect the most light possible) andthe optics must be highly reflective and fast(i.e., have a low ratio of focal length toaperture); to minimize noise, the detectorsmust be cooled, stray light must be held to aminimum, and so forth.
Engineering and Simulation of
Electro-Optical Remote-Sensing SystemsIn designing remote-sensing systems, performance metrics must be linked to design parameters to flow requirements into hardware specifications. Aerospace has developed tools that comprehensively model the complex interaction of these metrics and parameters.
Stephen Cota
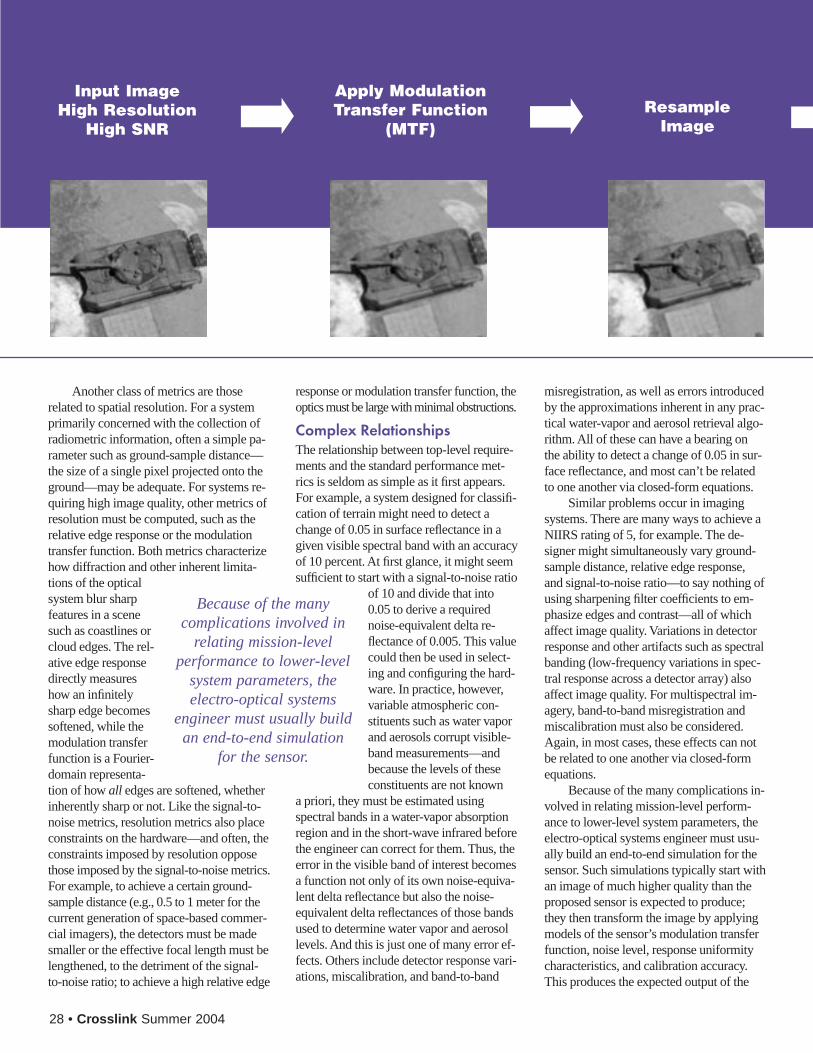
28 • Crosslink Summer 2004
Another class of metrics are thoserelated to spatial resolution. For a systemprimarily concerned with the collection ofradiometric information, often a simple pa-rameter such as ground-sample distance—the size of a single pixel projected onto theground—may be adequate. For systems re-quiring high image quality, other metrics ofresolution must be computed, such as therelative edge response or the modulationtransfer function. Both metrics characterizehow diffraction and other inherent limita-tions of the opticalsystem blur sharpfeatures in a scenesuch as coastlines orcloud edges. The rel-ative edge responsedirectly measureshow an infinitelysharp edge becomessoftened, while themodulation transferfunction is a Fourier-domain representa-tion of how all edges are softened, whetherinherently sharp or not. Like the signal-to-noise metrics, resolution metrics also placeconstraints on the hardware—and often, theconstraints imposed by resolution opposethose imposed by the signal-to-noise metrics.For example, to achieve a certain ground-sample distance (e.g., 0.5 to 1 meter for thecurrent generation of space-based commer-cial imagers), the detectors must be madesmaller or the effective focal length must belengthened, to the detriment of the signal-to-noise ratio; to achieve a high relative edge
response or modulation transfer function, theoptics must be large with minimal obstructions.
Complex RelationshipsThe relationship between top-level require-ments and the standard performance met-rics is seldom as simple as it first appears.For example, a system designed for classifi-cation of terrain might need to detect achange of 0.05 in surface reflectance in agiven visible spectral band with an accuracyof 10 percent. At first glance, it might seemsufficient to start with a signal-to-noise ratio
of 10 and divide that into0.05 to derive a requirednoise-equivalent delta re-flectance of 0.005. This valuecould then be used in select-ing and configuring the hard-ware. In practice, however,variable atmospheric con-stituents such as water vaporand aerosols corrupt visible-band measurements—andbecause the levels of theseconstituents are not known
a priori, they must be estimated usingspectral bands in a water-vapor absorptionregion and in the short-wave infrared beforethe engineer can correct for them. Thus, theerror in the visible band of interest becomesa function not only of its own noise-equiva-lent delta reflectance but also the noise-equivalent delta reflectances of those bandsused to determine water vapor and aerosollevels. And this is just one of many error ef-fects. Others include detector response vari-ations, miscalibration, and band-to-band
Input ImageHigh Resolution
High SNR
Apply ModulationTransfer Function
(MTF)Resample
Image
Because of the many complications involved in
relating mission-level performance to lower-level
system parameters, the electro-optical systems
engineer must usually build an end-to-end simulation
for the sensor.
misregistration, as well as errors introducedby the approximations inherent in any prac-tical water-vapor and aerosol retrieval algo-rithm. All of these can have a bearing onthe ability to detect a change of 0.05 in sur-face reflectance, and most can’t be relatedto one another via closed-form equations.
Similar problems occur in imagingsystems. There are many ways to achieve aNIIRS rating of 5, for example. The de-signer might simultaneously vary ground-sample distance, relative edge response,and signal-to-noise ratio—to say nothing ofusing sharpening filter coefficients to em-phasize edges and contrast—all of whichaffect image quality. Variations in detectorresponse and other artifacts such as spectralbanding (low-frequency variations in spec-tral response across a detector array) alsoaffect image quality. For multispectral im-agery, band-to-band misregistration andmiscalibration must also be considered.Again, in most cases, these effects can notbe related to one another via closed-formequations.
Because of the many complications in-volved in relating mission-level perform-ance to lower-level system parameters, theelectro-optical systems engineer must usu-ally build an end-to-end simulation for thesensor. Such simulations typically start withan image of much higher quality than theproposed sensor is expected to produce;they then transform the image by applyingmodels of the sensor’s modulation transferfunction, noise level, response uniformitycharacteristics, and calibration accuracy.This produces the expected output of the
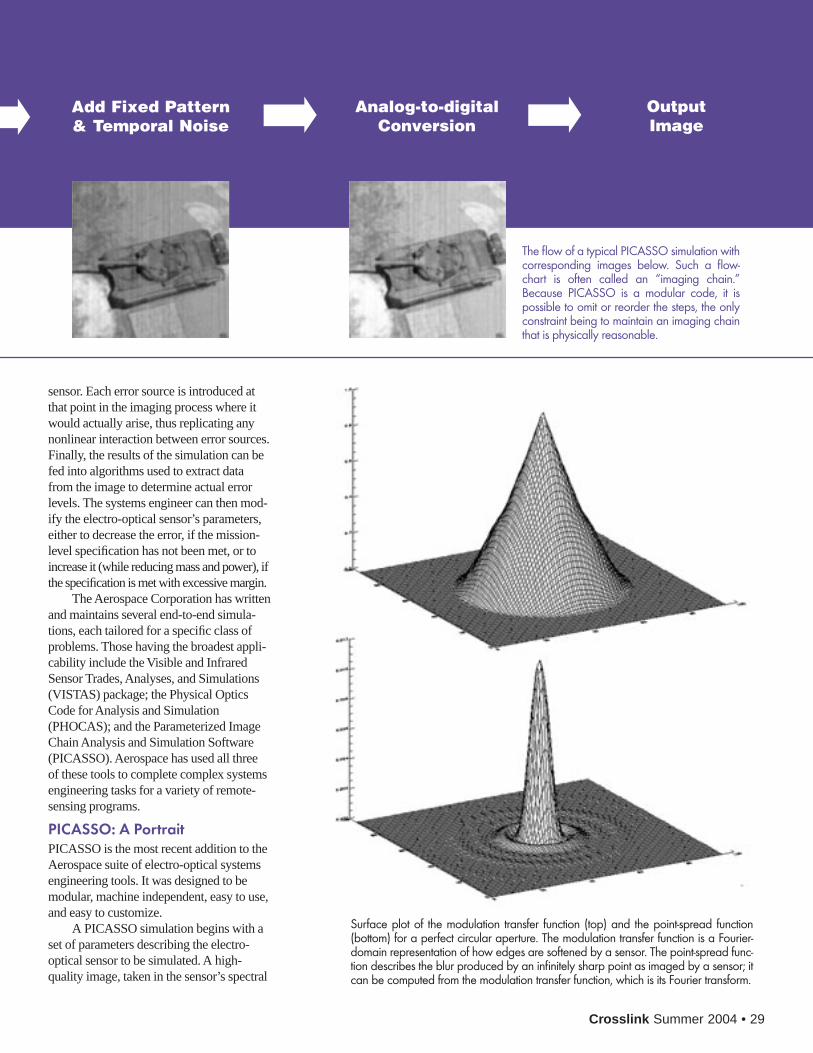
Crosslink Summer 2004 • 29
Add Fixed Pattern& Temporal Noise
Analog-to-digitalConversion
OutputImage
The flow of a typical PICASSO simulation withcorresponding images below. Such a flow-chart is often called an “imaging chain.” Because PICASSO is a modular code, it is possible to omit or reorder the steps, the onlyconstraint being to maintain an imaging chainthat is physically reasonable.
Surface plot of the modulation transfer function (top) and the point-spread function(bottom) for a perfect circular aperture. The modulation transfer function is a Fourier-domain representation of how edges are softened by a sensor. The point-spread func-tion describes the blur produced by an infinitely sharp point as imaged by a sensor; itcan be computed from the modulation transfer function, which is its Fourier transform.
sensor. Each error source is introduced atthat point in the imaging process where itwould actually arise, thus replicating anynonlinear interaction between error sources.Finally, the results of the simulation can befed into algorithms used to extract datafrom the image to determine actual errorlevels. The systems engineer can then mod-ify the electro-optical sensor’s parameters,either to decrease the error, if the mission-level specification has not been met, or toincrease it (while reducing mass and power), ifthe specification is met with excessive margin.
The Aerospace Corporation has writtenand maintains several end-to-end simula-tions, each tailored for a specific class ofproblems. Those having the broadest appli-cability include the Visible and InfraredSensor Trades, Analyses, and Simulations(VISTAS) package; the Physical OpticsCode for Analysis and Simulation(PHOCAS); and the Parameterized ImageChain Analysis and Simulation Software(PICASSO). Aerospace has used all threeof these tools to complete complex systemsengineering tasks for a variety of remote-sensing programs.
PICASSO: A PortraitPICASSO is the most recent addition to theAerospace suite of electro-optical systemsengineering tools. It was designed to bemodular, machine independent, easy to use,and easy to customize.
A PICASSO simulation begins with aset of parameters describing the electro-optical sensor to be simulated. A high-quality image, taken in the sensor’s spectral
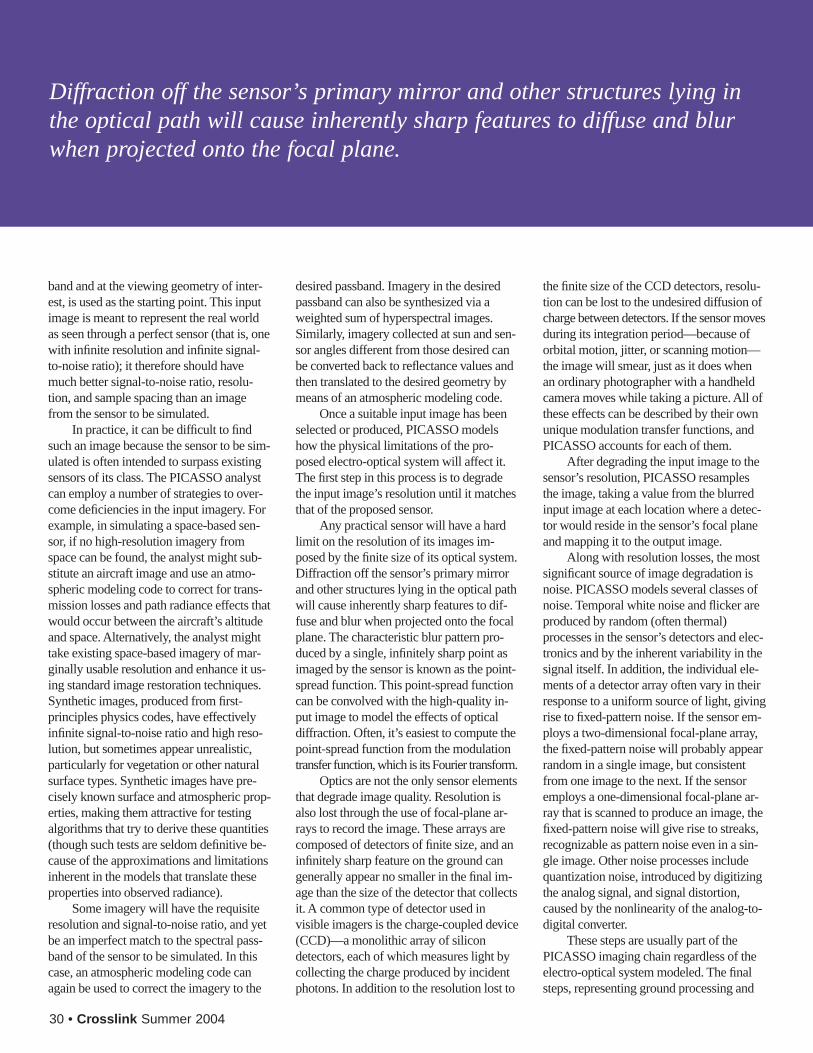
30 • Crosslink Summer 2004
band and at the viewing geometry of inter-est, is used as the starting point. This inputimage is meant to represent the real worldas seen through a perfect sensor (that is, onewith infinite resolution and infinite signal-to-noise ratio); it therefore should havemuch better signal-to-noise ratio, resolu-tion, and sample spacing than an imagefrom the sensor to be simulated.
In practice, it can be difficult to findsuch an image because the sensor to be sim-ulated is often intended to surpass existingsensors of its class. The PICASSO analystcan employ a number of strategies to over-come deficiencies in the input imagery. Forexample, in simulating a space-based sen-sor, if no high-resolution imagery fromspace can be found, the analyst might sub-stitute an aircraft image and use an atmo-spheric modeling code to correct for trans-mission losses and path radiance effects thatwould occur between the aircraft’s altitudeand space. Alternatively, the analyst mighttake existing space-based imagery of mar-ginally usable resolution and enhance it us-ing standard image restoration techniques.Synthetic images, produced from first-principles physics codes, have effectivelyinfinite signal-to-noise ratio and high reso-lution, but sometimes appear unrealistic,particularly for vegetation or other naturalsurface types. Synthetic images have pre-cisely known surface and atmospheric prop-erties, making them attractive for testingalgorithms that try to derive these quantities(though such tests are seldom definitive be-cause of the approximations and limitationsinherent in the models that translate theseproperties into observed radiance).
Some imagery will have the requisiteresolution and signal-to-noise ratio, and yetbe an imperfect match to the spectral pass-band of the sensor to be simulated. In thiscase, an atmospheric modeling code canagain be used to correct the imagery to the
desired passband. Imagery in the desiredpassband can also be synthesized via aweighted sum of hyperspectral images.Similarly, imagery collected at sun and sen-sor angles different from those desired canbe converted back to reflectance values andthen translated to the desired geometry bymeans of an atmospheric modeling code.
Once a suitable input image has beenselected or produced, PICASSO modelshow the physical limitations of the pro-posed electro-optical system will affect it.The first step in this process is to degradethe input image’s resolution until it matchesthat of the proposed sensor.
Any practical sensor will have a hardlimit on the resolution of its images im-posed by the finite size of its optical system.Diffraction off the sensor’s primary mirrorand other structures lying in the optical pathwill cause inherently sharp features to dif-fuse and blur when projected onto the focalplane. The characteristic blur pattern pro-duced by a single, infinitely sharp point asimaged by the sensor is known as the point-spread function. This point-spread functioncan be convolved with the high-quality in-put image to model the effects of opticaldiffraction. Often, it’s easiest to compute thepoint-spread function from the modulationtransfer function, which is its Fourier transform.
Optics are not the only sensor elementsthat degrade image quality. Resolution isalso lost through the use of focal-plane ar-rays to record the image. These arrays arecomposed of detectors of finite size, and aninfinitely sharp feature on the ground cangenerally appear no smaller in the final im-age than the size of the detector that collectsit. A common type of detector used invisible imagers is the charge-coupled device(CCD)—a monolithic array of silicondetectors, each of which measures light bycollecting the charge produced by incidentphotons. In addition to the resolution lost to
the finite size of the CCD detectors, resolu-tion can be lost to the undesired diffusion ofcharge between detectors. If the sensor movesduring its integration period—because oforbital motion, jitter, or scanning motion—the image will smear, just as it does whenan ordinary photographer with a handheldcamera moves while taking a picture. All ofthese effects can be described by their ownunique modulation transfer functions, andPICASSO accounts for each of them.
After degrading the input image to thesensor’s resolution, PICASSO resamplesthe image, taking a value from the blurredinput image at each location where a detec-tor would reside in the sensor’s focal planeand mapping it to the output image.
Along with resolution losses, the mostsignificant source of image degradation isnoise. PICASSO models several classes ofnoise. Temporal white noise and flicker areproduced by random (often thermal)processes in the sensor’s detectors and elec-tronics and by the inherent variability in thesignal itself. In addition, the individual ele-ments of a detector array often vary in theirresponse to a uniform source of light, givingrise to fixed-pattern noise. If the sensor em-ploys a two-dimensional focal-plane array,the fixed-pattern noise will probably appearrandom in a single image, but consistentfrom one image to the next. If the sensoremploys a one-dimensional focal-plane ar-ray that is scanned to produce an image, thefixed-pattern noise will give rise to streaks,recognizable as pattern noise even in a sin-gle image. Other noise processes includequantization noise, introduced by digitizingthe analog signal, and signal distortion,caused by the nonlinearity of the analog-to-digital converter.
These steps are usually part of thePICASSO imaging chain regardless of theelectro-optical system modeled. The finalsteps, representing ground processing and
Diffraction off the sensor’s primary mirror and other structures lying inthe optical path will cause inherently sharp features to diffuse and blurwhen projected onto the focal plane.
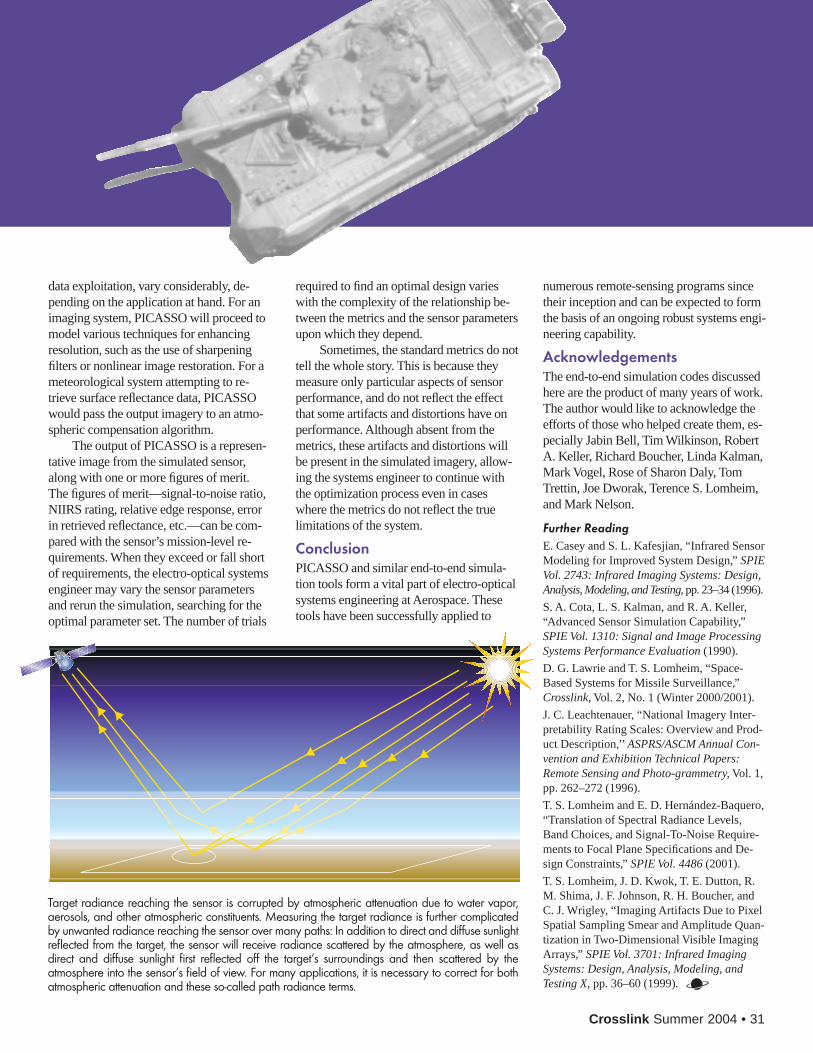
Crosslink Summer 2004 • 31
data exploitation, vary considerably, de-pending on the application at hand. For animaging system, PICASSO will proceed tomodel various techniques for enhancingresolution, such as the use of sharpeningfilters or nonlinear image restoration. For ameteorological system attempting to re-trieve surface reflectance data, PICASSOwould pass the output imagery to an atmo-spheric compensation algorithm.
The output of PICASSO is a represen-tative image from the simulated sensor,along with one or more figures of merit.The figures of merit—signal-to-noise ratio,NIIRS rating, relative edge response, errorin retrieved reflectance, etc.—can be com-pared with the sensor’s mission-level re-quirements. When they exceed or fall shortof requirements, the electro-optical systemsengineer may vary the sensor parametersand rerun the simulation, searching for theoptimal parameter set. The number of trials
required to find an optimal design varieswith the complexity of the relationship be-tween the metrics and the sensor parametersupon which they depend.
Sometimes, the standard metrics do nottell the whole story. This is because theymeasure only particular aspects of sensorperformance, and do not reflect the effectthat some artifacts and distortions have onperformance. Although absent from themetrics, these artifacts and distortions willbe present in the simulated imagery, allow-ing the systems engineer to continue withthe optimization process even in caseswhere the metrics do not reflect the truelimitations of the system.
ConclusionPICASSO and similar end-to-end simula-tion tools form a vital part of electro-opticalsystems engineering at Aerospace. Thesetools have been successfully applied to
numerous remote-sensing programs sincetheir inception and can be expected to formthe basis of an ongoing robust systems engi-neering capability.
AcknowledgementsThe end-to-end simulation codes discussedhere are the product of many years of work.The author would like to acknowledge theefforts of those who helped create them, es-pecially Jabin Bell, Tim Wilkinson, RobertA. Keller, Richard Boucher, Linda Kalman,Mark Vogel, Rose of Sharon Daly, TomTrettin, Joe Dworak, Terence S. Lomheim,and Mark Nelson.
Further ReadingE. Casey and S. L. Kafesjian, “Infrared SensorModeling for Improved System Design,” SPIEVol. 2743: Infrared Imaging Systems: Design,Analysis, Modeling, and Testing, pp. 23–34 (1996).
S. A. Cota, L. S. Kalman, and R. A. Keller,“Advanced Sensor Simulation Capability,”SPIE Vol. 1310: Signal and Image ProcessingSystems Performance Evaluation (1990).
D. G. Lawrie and T. S. Lomheim, “Space-Based Systems for Missile Surveillance,”Crosslink, Vol. 2, No. 1 (Winter 2000/2001).
J. C. Leachtenauer, “National Imagery Inter-pretability Rating Scales: Overview and Prod-uct Description,’’ ASPRS/ASCM Annual Con-vention and Exhibition Technical Papers:Remote Sensing and Photo-grammetry, Vol. 1,pp. 262–272 (1996).
T. S. Lomheim and E. D. Hernández-Baquero,“Translation of Spectral Radiance Levels,Band Choices, and Signal-To-Noise Require-ments to Focal Plane Specifications and De-sign Constraints,” SPIE Vol. 4486 (2001).
T. S. Lomheim, J. D. Kwok, T. E. Dutton, R.M. Shima, J. F. Johnson, R. H. Boucher, andC. J. Wrigley, “Imaging Artifacts Due to PixelSpatial Sampling Smear and Amplitude Quan-tization in Two-Dimensional Visible ImagingArrays,” SPIE Vol. 3701: Infrared ImagingSystems: Design, Analysis, Modeling, andTesting X, pp. 36–60 (1999).
Target radiance reaching the sensor is corrupted by atmospheric attenuation due to water vapor,aerosols, and other atmospheric constituents. Measuring the target radiance is further complicatedby unwanted radiance reaching the sensor over many paths: In addition to direct and diffuse sunlightreflected from the target, the sensor will receive radiance scattered by the atmosphere, as well asdirect and diffuse sunlight first reflected off the target’s surroundings and then scattered by theatmosphere into the sensor’s field of view. For many applications, it is necessary to correct for bothatmospheric attenuation and these so-called path radiance terms.
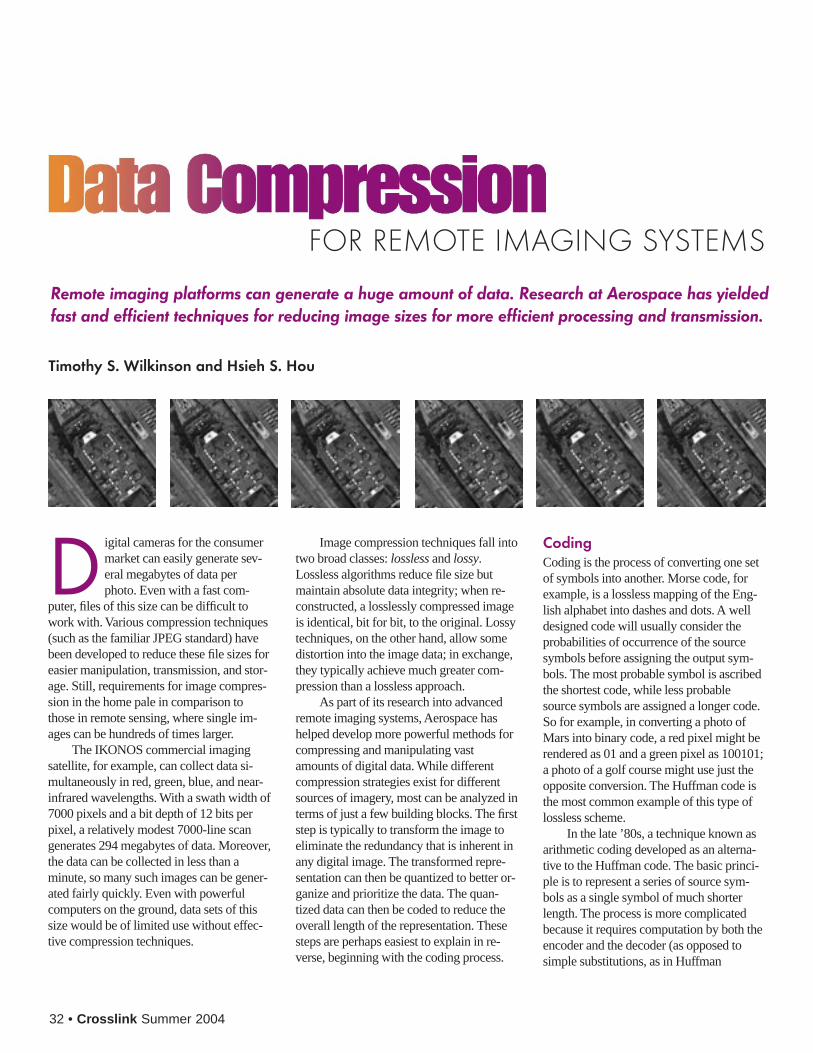
32 • Crosslink Summer 2004
D igital cameras for the consumermarket can easily generate sev-eral megabytes of data perphoto. Even with a fast com-
puter, files of this size can be difficult towork with. Various compression techniques(such as the familiar JPEG standard) havebeen developed to reduce these file sizes foreasier manipulation, transmission, and stor-age. Still, requirements for image compres-sion in the home pale in comparison tothose in remote sensing, where single im-ages can be hundreds of times larger.
The IKONOS commercial imagingsatellite, for example, can collect data si-multaneously in red, green, blue, and near-infrared wavelengths. With a swath width of7000 pixels and a bit depth of 12 bits perpixel, a relatively modest 7000-line scangenerates 294 megabytes of data. Moreover,the data can be collected in less than aminute, so many such images can be gener-ated fairly quickly. Even with powerfulcomputers on the ground, data sets of thissize would be of limited use without effec-tive compression techniques.
Image compression techniques fall intotwo broad classes: lossless and lossy.Lossless algorithms reduce file size butmaintain absolute data integrity; when re-constructed, a losslessly compressed imageis identical, bit for bit, to the original. Lossytechniques, on the other hand, allow somedistortion into the image data; in exchange,they typically achieve much greater com-pression than a lossless approach.
As part of its research into advancedremote imaging systems, Aerospace hashelped develop more powerful methods forcompressing and manipulating vastamounts of digital data. While differentcompression strategies exist for differentsources of imagery, most can be analyzed interms of just a few building blocks. The firststep is typically to transform the image toeliminate the redundancy that is inherent inany digital image. The transformed repre-sentation can then be quantized to better or-ganize and prioritize the data. The quan-tized data can then be coded to reduce theoverall length of the representation. Thesesteps are perhaps easiest to explain in re-verse, beginning with the coding process.
CodingCoding is the process of converting one setof symbols into another. Morse code, forexample, is a lossless mapping of the Eng-lish alphabet into dashes and dots. A welldesigned code will usually consider theprobabilities of occurrence of the sourcesymbols before assigning the output sym-bols. The most probable symbol is ascribedthe shortest code, while less probablesource symbols are assigned a longer code.So for example, in converting a photo ofMars into binary code, a red pixel might berendered as 01 and a green pixel as 100101;a photo of a golf course might use just theopposite conversion. The Huffman code isthe most common example of this type oflossless scheme.
In the late ’80s, a technique known asarithmetic coding developed as an alterna-tive to the Huffman code. The basic princi-ple is to represent a series of source sym-bols as a single symbol of much shorterlength. The process is more complicatedbecause it requires computation by both theencoder and the decoder (as opposed tosimple substitutions, as in Huffman
FOR REMOTE IMAGING SYSTEMS
Remote imaging platforms can generate a huge amount of data. Research at Aerospace has yieldedfast and efficient techniques for reducing image sizes for more efficient processing and transmission.
Timothy S. Wilkinson and Hsieh S. Hou
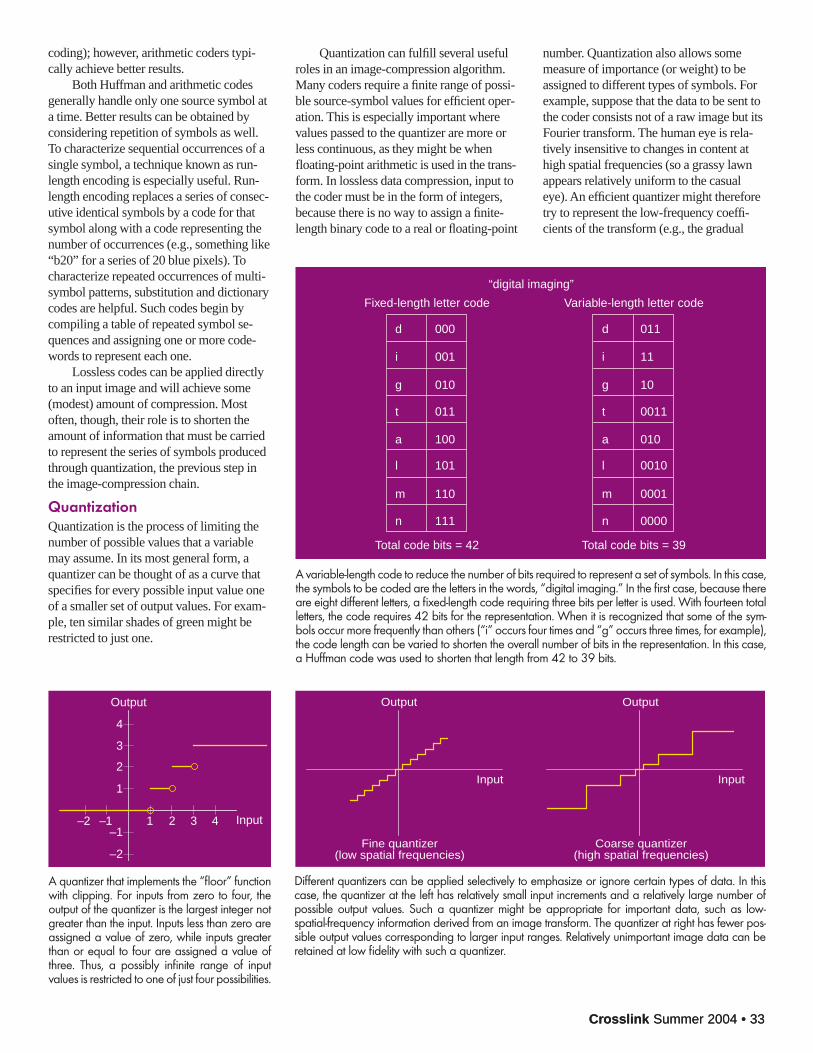
Crosslink Summer 2004 • 33
Quantization can fulfill several usefulroles in an image-compression algorithm.Many coders require a finite range of possi-ble source-symbol values for efficient oper-ation. This is especially important wherevalues passed to the quantizer are more orless continuous, as they might be whenfloating-point arithmetic is used in the trans-form. In lossless data compression, input tothe coder must be in the form of integers,because there is no way to assign a finite-length binary code to a real or floating-point
number. Quantization also allows somemeasure of importance (or weight) to beassigned to different types of symbols. Forexample, suppose that the data to be sent tothe coder consists not of a raw image but itsFourier transform. The human eye is rela-tively insensitive to changes in content athigh spatial frequencies (so a grassy lawnappears relatively uniform to the casualeye). An efficient quantizer might thereforetry to represent the low-frequency coeffi-cients of the transform (e.g., the gradual
Crosslink Summer 2004 • 33
coding); however, arithmetic coders typi-cally achieve better results.
Both Huffman and arithmetic codesgenerally handle only one source symbol ata time. Better results can be obtained byconsidering repetition of symbols as well.To characterize sequential occurrences of asingle symbol, a technique known as run-length encoding is especially useful. Run-length encoding replaces a series of consec-utive identical symbols by a code for thatsymbol along with a code representing thenumber of occurrences (e.g., something like“b20” for a series of 20 blue pixels). Tocharacterize repeated occurrences of multi-symbol patterns, substitution and dictionarycodes are helpful. Such codes begin bycompiling a table of repeated symbol se-quences and assigning one or more code-words to represent each one.
Lossless codes can be applied directlyto an input image and will achieve some(modest) amount of compression. Mostoften, though, their role is to shorten theamount of information that must be carriedto represent the series of symbols producedthrough quantization, the previous step inthe image-compression chain.
QuantizationQuantization is the process of limiting thenumber of possible values that a variablemay assume. In its most general form, aquantizer can be thought of as a curve thatspecifies for every possible input value oneof a smaller set of output values. For exam-ple, ten similar shades of green might berestricted to just one.
“digital imaging”
Fixed-length letter code Variable-length letter code
d 000
i 001
g 010
t 011
a 100
l 101
m 110
n 111
Total code bits = 42
d 011
i 11
g 10
t 0011
a 010
l 0010
m 0001
n 0000
Total code bits = 39
Output
Input
4
3
2
1
–1
–2
–1–2 1 2 3 4
OutputOutput
InputInput
Coarse quantizer(high spatial frequencies)
Fine quantizer(low spatial frequencies)
A variable-length code to reduce the number of bits required to represent a set of symbols. In this case,the symbols to be coded are the letters in the words, “digital imaging.” In the first case, because thereare eight different letters, a fixed-length code requiring three bits per letter is used. With fourteen totalletters, the code requires 42 bits for the representation. When it is recognized that some of the sym-bols occur more frequently than others (“i” occurs four times and “g” occurs three times, for example),the code length can be varied to shorten the overall number of bits in the representation. In this case,a Huffman code was used to shorten that length from 42 to 39 bits.
A quantizer that implements the “floor” functionwith clipping. For inputs from zero to four, theoutput of the quantizer is the largest integer notgreater than the input. Inputs less than zero areassigned a value of zero, while inputs greaterthan or equal to four are assigned a value ofthree. Thus, a possibly infinite range of inputvalues is restricted to one of just four possibilities.
Different quantizers can be applied selectively to emphasize or ignore certain types of data. In thiscase, the quantizer at the left has relatively small input increments and a relatively large number ofpossible output values. Such a quantizer might be appropriate for important data, such as low-spatial-frequency information derived from an image transform. The quantizer at right has fewer pos-sible output values corresponding to larger input ranges. Relatively unimportant image data can beretained at low fidelity with such a quantizer.
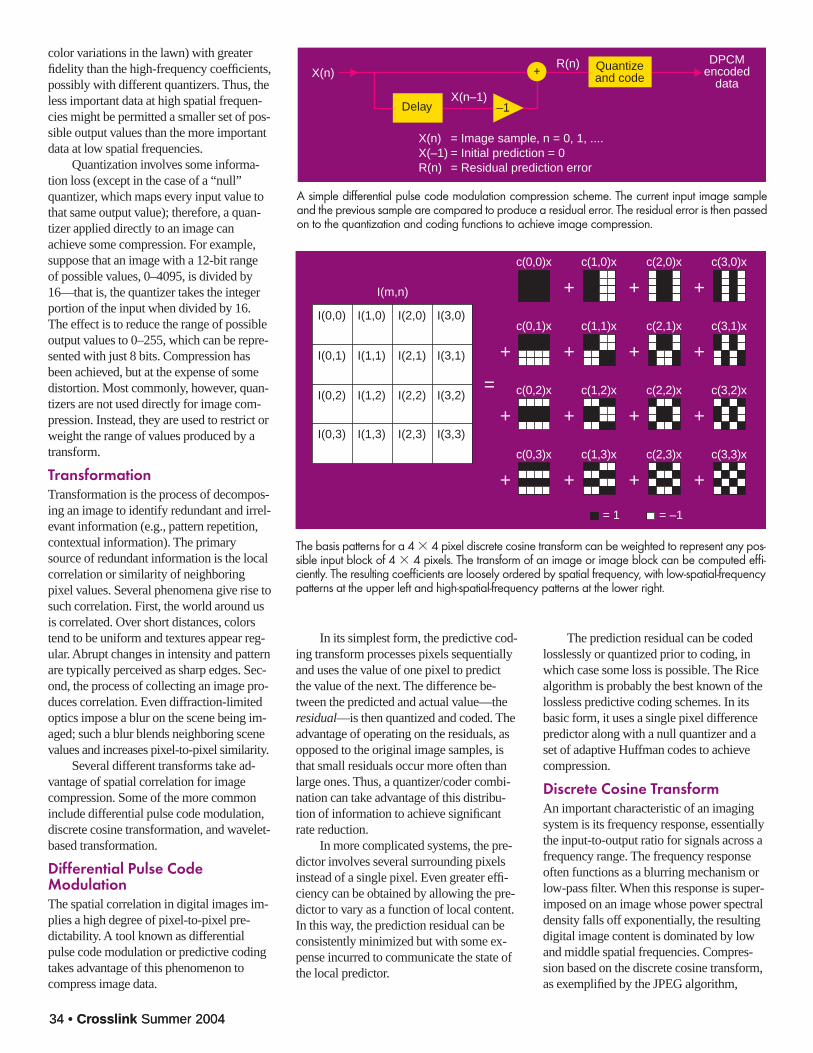
34 • Crosslink Summer 200434 • Crosslink Summer 2004
color variations in the lawn) with greaterfidelity than the high-frequency coefficients,possibly with different quantizers. Thus, theless important data at high spatial frequen-cies might be permitted a smaller set of pos-sible output values than the more importantdata at low spatial frequencies.
Quantization involves some informa-tion loss (except in the case of a “null”quantizer, which maps every input value tothat same output value); therefore, a quan-tizer applied directly to an image canachieve some compression. For example,suppose that an image with a 12-bit rangeof possible values, 0–4095, is divided by16—that is, the quantizer takes the integerportion of the input when divided by 16.The effect is to reduce the range of possibleoutput values to 0–255, which can be repre-sented with just 8 bits. Compression hasbeen achieved, but at the expense of somedistortion. Most commonly, however, quan-tizers are not used directly for image com-pression. Instead, they are used to restrict orweight the range of values produced by atransform.
TransformationTransformation is the process of decompos-ing an image to identify redundant and irrel-evant information (e.g., pattern repetition,contextual information). The primarysource of redundant information is the localcorrelation or similarity of neighboringpixel values. Several phenomena give rise tosuch correlation. First, the world around usis correlated. Over short distances, colorstend to be uniform and textures appear reg-ular. Abrupt changes in intensity and patternare typically perceived as sharp edges. Sec-ond, the process of collecting an image pro-duces correlation. Even diffraction-limitedoptics impose a blur on the scene being im-aged; such a blur blends neighboring scenevalues and increases pixel-to-pixel similarity.
Several different transforms take ad-vantage of spatial correlation for imagecompression. Some of the more commoninclude differential pulse code modulation,discrete cosine transformation, and wavelet-based transformation.
Differential Pulse CodeModulationThe spatial correlation in digital images im-plies a high degree of pixel-to-pixel pre-dictability. A tool known as differentialpulse code modulation or predictive codingtakes advantage of this phenomenon tocompress image data.
In its simplest form, the predictive cod-ing transform processes pixels sequentiallyand uses the value of one pixel to predictthe value of the next. The difference be-tween the predicted and actual value—theresidual—is then quantized and coded. Theadvantage of operating on the residuals, asopposed to the original image samples, isthat small residuals occur more often thanlarge ones. Thus, a quantizer/coder combi-nation can take advantage of this distribu-tion of information to achieve significantrate reduction.
In more complicated systems, the pre-dictor involves several surrounding pixelsinstead of a single pixel. Even greater effi-ciency can be obtained by allowing the pre-dictor to vary as a function of local content.In this way, the prediction residual can beconsistently minimized but with some ex-pense incurred to communicate the state ofthe local predictor.
The prediction residual can be codedlosslessly or quantized prior to coding, inwhich case some loss is possible. The Ricealgorithm is probably the best known of thelossless predictive coding schemes. In itsbasic form, it uses a single pixel differencepredictor along with a null quantizer and aset of adaptive Huffman codes to achievecompression.
Discrete Cosine TransformAn important characteristic of an imagingsystem is its frequency response, essentiallythe input-to-output ratio for signals across afrequency range. The frequency responseoften functions as a blurring mechanism orlow-pass filter. When this response is super-imposed on an image whose power spectraldensity falls off exponentially, the resultingdigital image content is dominated by lowand middle spatial frequencies. Compres-sion based on the discrete cosine transform,as exemplified by the JPEG algorithm,
X(n)
X(n–1)
R(n) DPCMencoded
data
X(n) = Image sample, n = 0, 1, ....X(–1) = Initial prediction = 0R(n) = Residual prediction error
Delay –1
Quantizeand code+
I(m,n)
c(0,3)x
+
c(1,3)x
+
c(2,3)x
+
c(3,3)x
+
c(0,2)x
+
c(1,2)x
+
c(2,2)x
+
c(3,2)x
+
c(0,1)x
+
c(1,1)x
+
c(2,1)x
+
c(3,1)x
+
c(0,0)x c(1,0)x
+
c(2,0)x
+
c(3,0)x
+
=
= 1 = –1
I(0,0) I(1,0) I(2,0) I(3,0)
I(0,1) I(1,1) I(2,1) I(3,1)
I(0,2) I(1,2) I(2,2) I(3,2)
I(0,3) I(1,3) I(2,3) I(3,3)
A simple differential pulse code modulation compression scheme. The current input image sampleand the previous sample are compared to produce a residual error. The residual error is then passedon to the quantization and coding functions to achieve image compression.
The basis patterns for a 4 � 4 pixel discrete cosine transform can be weighted to represent any pos-sible input block of 4 � 4 pixels. The transform of an image or image block can be computed effi-ciently. The resulting coefficients are loosely ordered by spatial frequency, with low-spatial-frequencypatterns at the upper left and high-spatial-frequency patterns at the lower right.
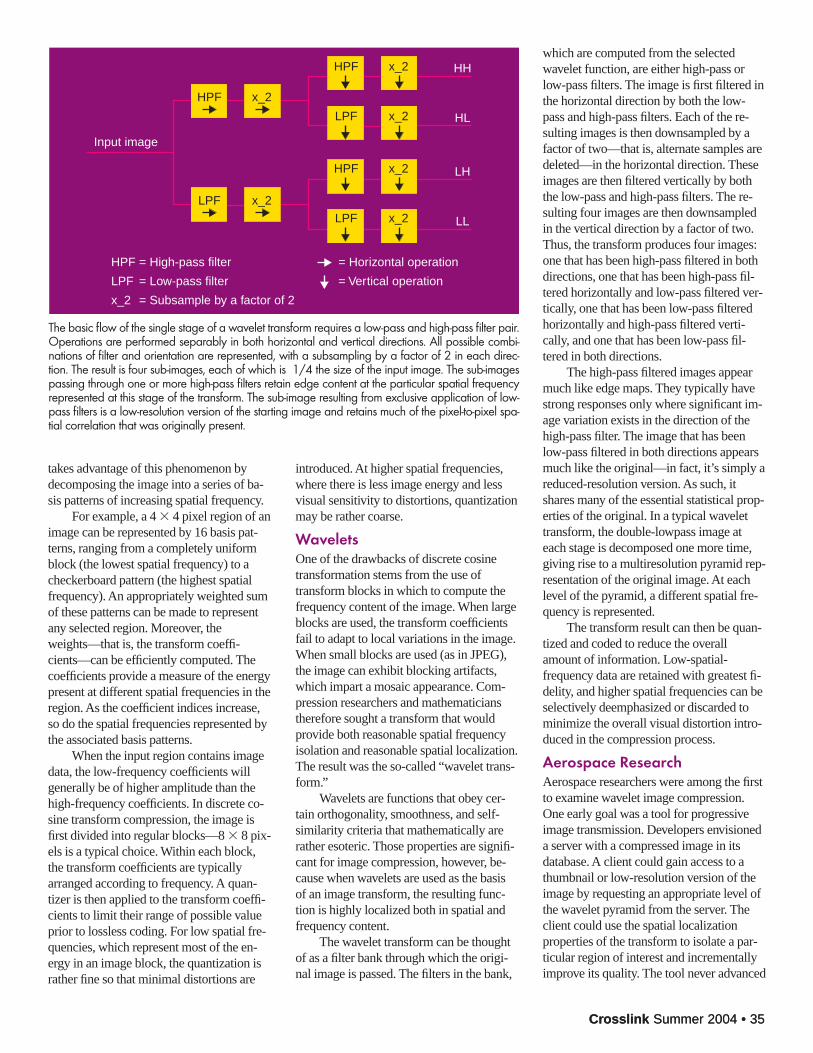
Crosslink Summer 2004 • 35
takes advantage of this phenomenon bydecomposing the image into a series of ba-sis patterns of increasing spatial frequency.
For example, a 4 � 4 pixel region of animage can be represented by 16 basis pat-terns, ranging from a completely uniformblock (the lowest spatial frequency) to acheckerboard pattern (the highest spatialfrequency). An appropriately weighted sumof these patterns can be made to representany selected region. Moreover, theweights—that is, the transform coeffi-cients—can be efficiently computed. Thecoefficients provide a measure of the energypresent at different spatial frequencies in theregion. As the coefficient indices increase,so do the spatial frequencies represented bythe associated basis patterns.
When the input region contains imagedata, the low-frequency coefficients willgenerally be of higher amplitude than thehigh-frequency coefficients. In discrete co-sine transform compression, the image isfirst divided into regular blocks—8 � 8 pix-els is a typical choice. Within each block,the transform coefficients are typicallyarranged according to frequency. A quan-tizer is then applied to the transform coeffi-cients to limit their range of possible valueprior to lossless coding. For low spatial fre-quencies, which represent most of the en-ergy in an image block, the quantization israther fine so that minimal distortions are
introduced. At higher spatial frequencies,where there is less image energy and lessvisual sensitivity to distortions, quantizationmay be rather coarse.
WaveletsOne of the drawbacks of discrete cosinetransformation stems from the use oftransform blocks in which to compute thefrequency content of the image. When largeblocks are used, the transform coefficientsfail to adapt to local variations in the image.When small blocks are used (as in JPEG),the image can exhibit blocking artifacts,which impart a mosaic appearance. Com-pression researchers and mathematicianstherefore sought a transform that wouldprovide both reasonable spatial frequencyisolation and reasonable spatial localization.The result was the so-called “wavelet trans-form.”
Wavelets are functions that obey cer-tain orthogonality, smoothness, and self-similarity criteria that mathematically arerather esoteric. Those properties are signifi-cant for image compression, however, be-cause when wavelets are used as the basisof an image transform, the resulting func-tion is highly localized both in spatial andfrequency content.
The wavelet transform can be thoughtof as a filter bank through which the origi-nal image is passed. The filters in the bank,
Crosslink Summer 2004 • 35
which are computed from the selectedwavelet function, are either high-pass orlow-pass filters. The image is first filtered inthe horizontal direction by both the low-pass and high-pass filters. Each of the re-sulting images is then downsampled by afactor of two—that is, alternate samples aredeleted—in the horizontal direction. Theseimages are then filtered vertically by boththe low-pass and high-pass filters. The re-sulting four images are then downsampledin the vertical direction by a factor of two.Thus, the transform produces four images:one that has been high-pass filtered in bothdirections, one that has been high-pass fil-tered horizontally and low-pass filtered ver-tically, one that has been low-pass filteredhorizontally and high-pass filtered verti-cally, and one that has been low-pass fil-tered in both directions.
The high-pass filtered images appearmuch like edge maps. They typically havestrong responses only where significant im-age variation exists in the direction of thehigh-pass filter. The image that has beenlow-pass filtered in both directions appearsmuch like the original—in fact, it’s simply areduced-resolution version. As such, itshares many of the essential statistical prop-erties of the original. In a typical wavelettransform, the double-lowpass image ateach stage is decomposed one more time,giving rise to a multiresolution pyramid rep-resentation of the original image. At eachlevel of the pyramid, a different spatial fre-quency is represented.
The transform result can then be quan-tized and coded to reduce the overallamount of information. Low-spatial-frequency data are retained with greatest fi-delity, and higher spatial frequencies can beselectively deemphasized or discarded tominimize the overall visual distortion intro-duced in the compression process.
Aerospace ResearchAerospace researchers were among the firstto examine wavelet image compression.One early goal was a tool for progressiveimage transmission. Developers envisioneda server with a compressed image in itsdatabase. A client could gain access to athumbnail or low-resolution version of theimage by requesting an appropriate level ofthe wavelet pyramid from the server. Theclient could use the spatial localizationproperties of the transform to isolate a par-ticular region of interest and incrementallyimprove its quality. The tool never advanced
Input image
HPF x_2
LPF x_2
HH
HL
LH
LL
HPF = High-pass filter
LPF = Low-pass filter
x_2 = Subsample by a factor of 2
= Horizontal operation
= Vertical operation
HPF x_2
LPF x_2
HPF x_2
LPF x_2
The basic flow of the single stage of a wavelet transform requires a low-pass and high-pass filter pair.Operations are performed separably in both horizontal and vertical directions. All possible combi-nations of filter and orientation are represented, with a subsampling by a factor of 2 in each direc-tion. The result is four sub-images, each of which is 1/4 the size of the input image. The sub-imagespassing through one or more high-pass filters retain edge content at the particular spatial frequencyrepresented at this stage of the transform. The sub-image resulting from exclusive application of low-pass filters is a low-resolution version of the starting image and retains much of the pixel-to-pixel spa-tial correlation that was originally present.
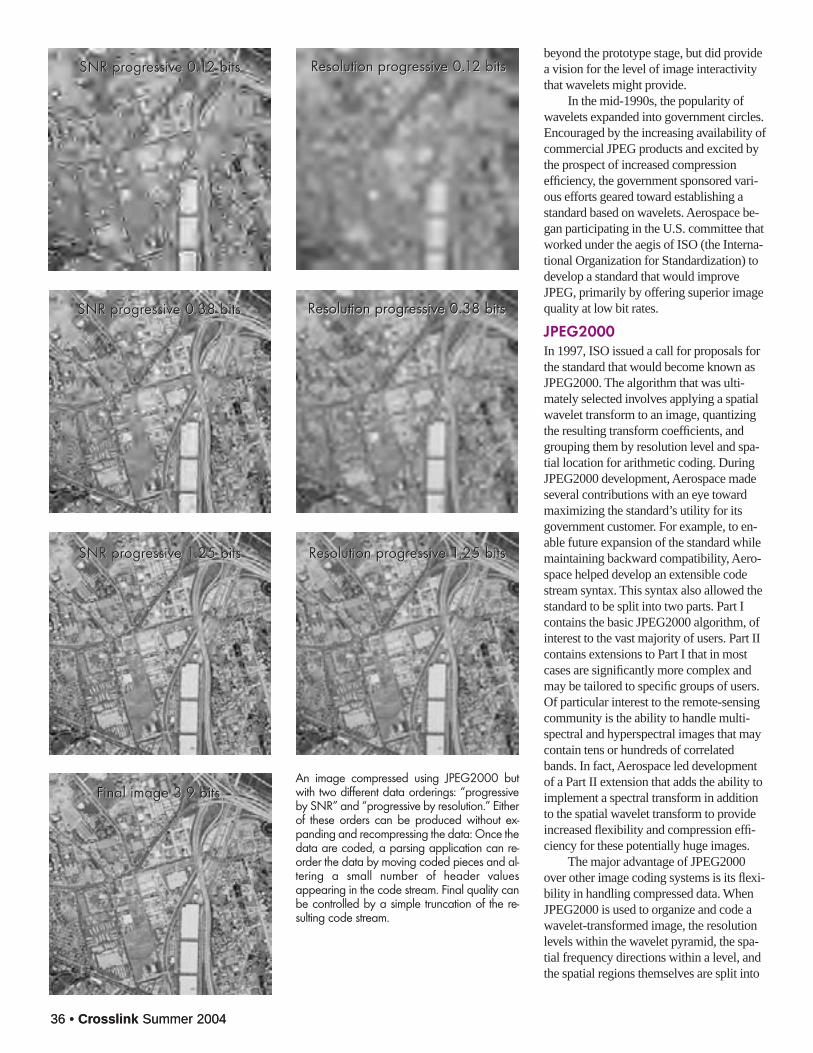
36 • Crosslink Summer 200436 • Crosslink Summer 2004
An image compressed using JPEG2000 butwith two different data orderings: “progressiveby SNR” and “progressive by resolution.” Eitherof these orders can be produced without ex-panding and recompressing the data: Once thedata are coded, a parsing application can re-order the data by moving coded pieces and al-tering a small number of header valuesappearing in the code stream. Final quality canbe controlled by a simple truncation of the re-sulting code stream.
SNR progressive 0.12 bits Resolution progressive 0.12 bits
Final image 3.9 bits
SNR progressive 0.38 bits Resolution progressive 0.38 bits
SNR progressive 1.25 bits Resolution progressive 1.25 bits
beyond the prototype stage, but did providea vision for the level of image interactivitythat wavelets might provide.
In the mid-1990s, the popularity ofwavelets expanded into government circles.Encouraged by the increasing availability ofcommercial JPEG products and excited bythe prospect of increased compressionefficiency, the government sponsored vari-ous efforts geared toward establishing astandard based on wavelets. Aerospace be-gan participating in the U.S. committee thatworked under the aegis of ISO (the Interna-tional Organization for Standardization) todevelop a standard that would improveJPEG, primarily by offering superior imagequality at low bit rates.
JPEG2000In 1997, ISO issued a call for proposals forthe standard that would become known asJPEG2000. The algorithm that was ulti-mately selected involves applying a spatialwavelet transform to an image, quantizingthe resulting transform coefficients, andgrouping them by resolution level and spa-tial location for arithmetic coding. DuringJPEG2000 development, Aerospace madeseveral contributions with an eye towardmaximizing the standard’s utility for itsgovernment customer. For example, to en-able future expansion of the standard whilemaintaining backward compatibility, Aero-space helped develop an extensible codestream syntax. This syntax also allowed thestandard to be split into two parts. Part Icontains the basic JPEG2000 algorithm, ofinterest to the vast majority of users. Part IIcontains extensions to Part I that in mostcases are significantly more complex andmay be tailored to specific groups of users.Of particular interest to the remote-sensingcommunity is the ability to handle multi-spectral and hyperspectral images that maycontain tens or hundreds of correlatedbands. In fact, Aerospace led developmentof a Part II extension that adds the ability toimplement a spectral transform in additionto the spatial wavelet transform to provideincreased flexibility and compression effi-ciency for these potentially huge images.
The major advantage of JPEG2000over other image coding systems is its flexi-bility in handling compressed data. WhenJPEG2000 is used to organize and code awavelet-transformed image, the resolutionlevels within the wavelet pyramid, the spa-tial frequency directions within a level, andthe spatial regions themselves are split into
SNR progressive 0.12 bits Resolution progressive 0.12 bits
Final image 3.9 bits
SNR progressive 0.38 bits Resolution progressive 0.38 bits
SNR progressive 1.25 bits Resolution progressive 1.25 bits
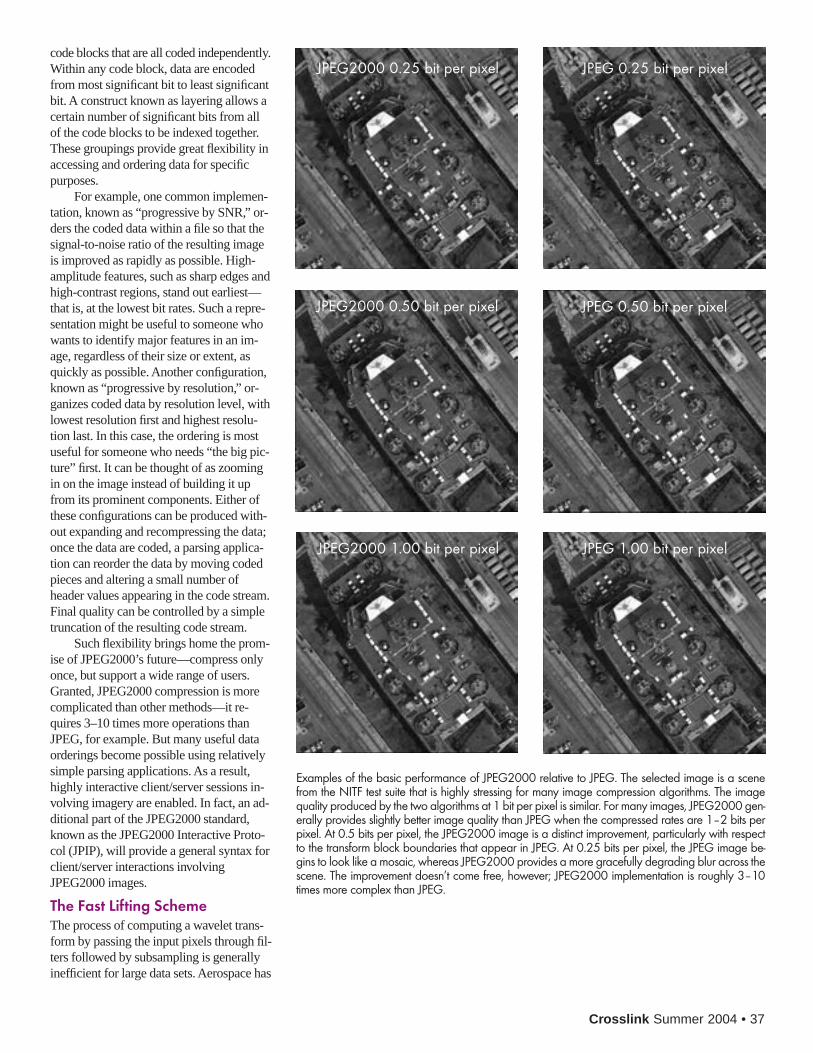
Crosslink Summer 2004 • 37
Examples of the basic performance of JPEG2000 relative to JPEG. The selected image is a scenefrom the NITF test suite that is highly stressing for many image compression algorithms. The imagequality produced by the two algorithms at 1 bit per pixel is similar. For many images, JPEG2000 gen-erally provides slightly better image quality than JPEG when the compressed rates are 1–2 bits perpixel. At 0.5 bits per pixel, the JPEG2000 image is a distinct improvement, particularly with respectto the transform block boundaries that appear in JPEG. At 0.25 bits per pixel, the JPEG image be-gins to look like a mosaic, whereas JPEG2000 provides a more gracefully degrading blur across thescene. The improvement doesn’t come free, however; JPEG2000 implementation is roughly 3–10times more complex than JPEG.
JPEG2000 0.25 bit per pixel JPEG 0.25 bit per pixel
JPEG2000 0.50 bit per pixel JPEG 0.50 bit per pixel
JPEG2000 1.00 bit per pixel JPEG 1.00 bit per pixel
code blocks that are all coded independently.Within any code block, data are encodedfrom most significant bit to least significantbit. A construct known as layering allows acertain number of significant bits from allof the code blocks to be indexed together.These groupings provide great flexibility inaccessing and ordering data for specificpurposes.
For example, one common implemen-tation, known as “progressive by SNR,” or-ders the coded data within a file so that thesignal-to-noise ratio of the resulting imageis improved as rapidly as possible. High-amplitude features, such as sharp edges andhigh-contrast regions, stand out earliest—that is, at the lowest bit rates. Such a repre-sentation might be useful to someone whowants to identify major features in an im-age, regardless of their size or extent, asquickly as possible. Another configuration,known as “progressive by resolution,” or-ganizes coded data by resolution level, withlowest resolution first and highest resolu-tion last. In this case, the ordering is mostuseful for someone who needs “the big pic-ture” first. It can be thought of as zoomingin on the image instead of building it upfrom its prominent components. Either ofthese configurations can be produced with-out expanding and recompressing the data;once the data are coded, a parsing applica-tion can reorder the data by moving codedpieces and altering a small number ofheader values appearing in the code stream.Final quality can be controlled by a simpletruncation of the resulting code stream.
Such flexibility brings home the prom-ise of JPEG2000’s future—compress onlyonce, but support a wide range of users.Granted, JPEG2000 compression is morecomplicated than other methods—it re-quires 3–10 times more operations thanJPEG, for example. But many useful dataorderings become possible using relativelysimple parsing applications. As a result,highly interactive client/server sessions in-volving imagery are enabled. In fact, an ad-ditional part of the JPEG2000 standard,known as the JPEG2000 Interactive Proto-col (JPIP), will provide a general syntax forclient/server interactions involvingJPEG2000 images.
The Fast Lifting SchemeThe process of computing a wavelet trans-form by passing the input pixels through fil-ters followed by subsampling is generallyinefficient for large data sets. Aerospace has
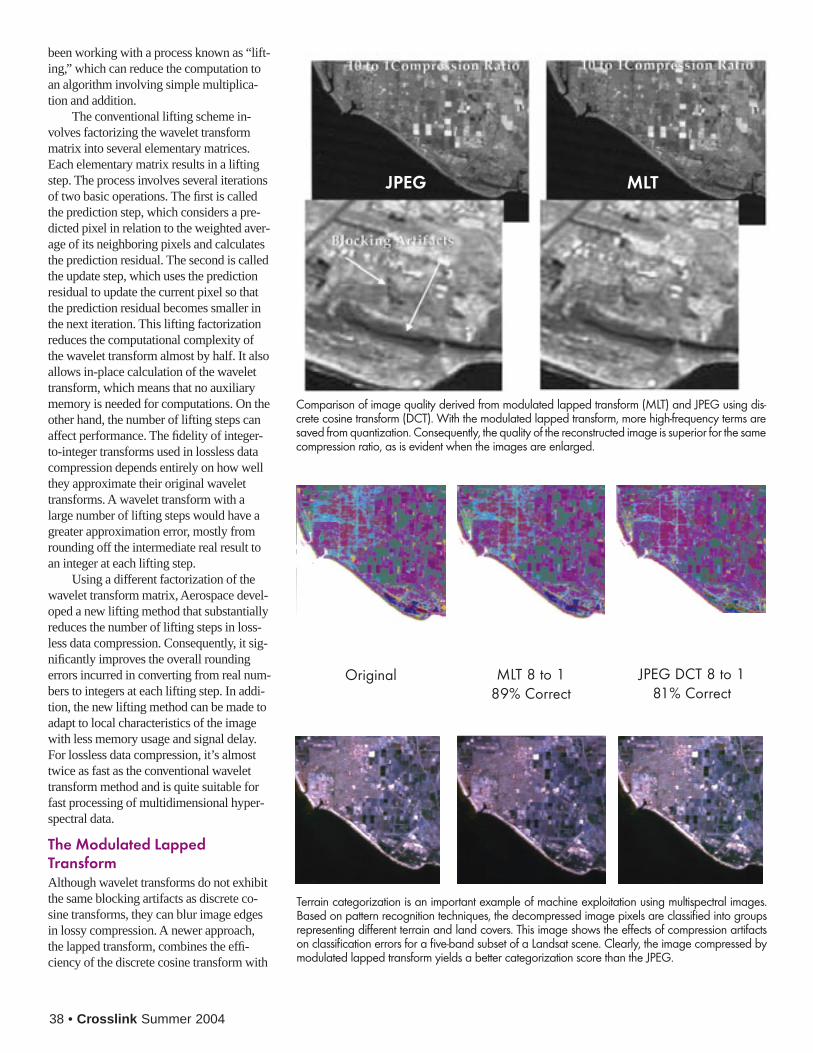
38 • Crosslink Summer 2004
been working with a process known as “lift-ing,” which can reduce the computation toan algorithm involving simple multiplica-tion and addition.
The conventional lifting scheme in-volves factorizing the wavelet transformmatrix into several elementary matrices.Each elementary matrix results in a liftingstep. The process involves several iterationsof two basic operations. The first is calledthe prediction step, which considers a pre-dicted pixel in relation to the weighted aver-age of its neighboring pixels and calculatesthe prediction residual. The second is calledthe update step, which uses the predictionresidual to update the current pixel so thatthe prediction residual becomes smaller inthe next iteration. This lifting factorizationreduces the computational complexity ofthe wavelet transform almost by half. It alsoallows in-place calculation of the wavelettransform, which means that no auxiliarymemory is needed for computations. On theother hand, the number of lifting steps canaffect performance. The fidelity of integer-to-integer transforms used in lossless datacompression depends entirely on how wellthey approximate their original wavelettransforms. A wavelet transform with alarge number of lifting steps would have agreater approximation error, mostly fromrounding off the intermediate real result toan integer at each lifting step.
Using a different factorization of thewavelet transform matrix, Aerospace devel-oped a new lifting method that substantiallyreduces the number of lifting steps in loss-less data compression. Consequently, it sig-nificantly improves the overall roundingerrors incurred in converting from real num-bers to integers at each lifting step. In addi-tion, the new lifting method can be made toadapt to local characteristics of the imagewith less memory usage and signal delay.For lossless data compression, it’s almosttwice as fast as the conventional wavelettransform method and is quite suitable forfast processing of multidimensional hyper-spectral data.
The Modulated LappedTransformAlthough wavelet transforms do not exhibitthe same blocking artifacts as discrete co-sine transforms, they can blur image edgesin lossy compression. A newer approach,the lapped transform, combines the effi-ciency of the discrete cosine transform with
Comparison of image quality derived from modulated lapped transform (MLT) and JPEG using dis-crete cosine transform (DCT). With the modulated lapped transform, more high-frequency terms aresaved from quantization. Consequently, the quality of the reconstructed image is superior for the samecompression ratio, as is evident when the images are enlarged.
Terrain categorization is an important example of machine exploitation using multispectral images.Based on pattern recognition techniques, the decompressed image pixels are classified into groupsrepresenting different terrain and land covers. This image shows the effects of compression artifactson classification errors for a five-band subset of a Landsat scene. Clearly, the image compressed bymodulated lapped transform yields a better categorization score than the JPEG.
JPEG MLT
Original MLT 8 to 189% Correct
JPEG DCT 8 to 181% Correct
Crosslink Summer 2004 • 39
the overlapping properties of wavelets. Inrecent studies, they have been shown to out-perform both techniques in preserving im-age quality. One particular type of lappedtransform, the modulated lapped transform,is being investigated at Aerospace.
The modulated lapped transform em-ploys both a discrete cosine transform and abell-shaped weighting (window) function,which resembles the low-pass filter func-tion in a wavelet transform. This windowfunction and the discrete cosine transformoperate on two adjacent blocks of pixelssuccessively. The window function modu-lates the input to the discrete cosine trans-form, allowing the blocks to overlap priorto actual transformation. Thus, the modu-lated lapped transform achieves the highspeed of the discrete cosine transform with-out the blocking artifacts. The weighting ofthe input data by the bell-shaped windowfunction causes the high-frequency terms toroll off much faster than they would using adiscrete cosine transform alone. Thus, more
of them are saved from quantization (asource of loss). Consequently, the quality ofthe reconstructed image is better than thatachieved through a discrete cosine transformfor the same compression ratio.
Another important point is that themodulated lapped transform has more thantwo channels at the onset of transformation,whereas the wavelet transform has only twoand needs to progressively split the low-passchannel as it goes to lower resolution levels.Thus, the modulated lapped transform oper-ates faster than a wavelet transform.
Most applications of modulated lappedtransform, including the Aerospace-patentedversion, are for lossy image compression;however, using a different formulation andthe fast lifting method,Aerospace researchershave derived lossless and near-losslessmodulated lapped transform algorithms. Inaddition, the lossless compressed data haveexcellent resistance to error propagation be-cause of the block structure. Given its errorresistance and fast processing properties, the
lossless and near-lossless modulated lappedtransform would be suitable for compress-ing multidimensional hyperspectral data inremote-sensing applications.
ConclusionAs both the spatial and spectral resolutionsof remote image sensors increase, theamount of data they collect continues togrow. On the other hand, the availablecommunication channels for faithfullytransmitting the data to ground are becom-ing scarce. There is therefore a real need todevelop new data-compression techniquesthat can support storage and transmission ofimages of varying resolution and quality. Inaddition, the compression operations mustbe fast and require little power for instanta-neous processing.
The trend is toward more interactivemanipulation of imagery. The wavelettransform that underlies the JPEG2000standard for still images and the transformthat underlies the MPEG4 standard forvideo compression share many commonproperties. With their successful integrationin the future, new data-compression tech-niques should be able to process huge data-sets with high fidelity and speed.
JPIP will be suitable for use on theInternet, and interactive and customizableWeb-based applications could begin ap-pearing soon. Such a development will holdspecial interest for the remote-sensing com-munity as a tool to minimize disseminationdelays.
An important military standard, theNational Imagery Transmission Format(NITF), provides a file structure to supportnot only image data but also associated sup-port data and other graphical information.The integration of JPEG into NITF pro-vided government users with increased im-age-compression capabilities and made itpossible to use commercially availableproducts. JPEG2000 is being incorporatedinto NITF version 2.1 and will significantlyenhance these capabilities.
Ultimately, each imagery source andprovider presents a unique set of require-ments and challenges. Through continuedinvolvement with the JPEG committee,Aerospace will provide valuable insightinto the effective integration of JPEG2000into government and military systems. Sim-ilarly, further investigation into the fast lift-ing scheme and the modulated lapped trans-form will ensure the usability of morecomprehensive remote-imaging systems.
Aerospace Contributions to Image Data Compression Techniques
Aerospace had developed several new and alternative high-quality image-datacompression techniques during the last 20 years, mostly for use with multispectraland hyperspectral imaging systems. A few highlights include:
Split-Radix Discrete Cosine Transform, U.S. Patent 5,408,425, 1995.
Modulated Lapped Transform Method, U.S. Patent 5,859,788, 1999.
Merge and Split of Fourier Transformed Data, U.S. Patent pending.
Merge and Split of Hartley Transformed Data, U.S. Patent pending.
Merge and Split of Discrete Cosine Transformed Data, U.S. Patent pending.
Merge and Split of Discrete Sine Transformed Data, U.S. Patent pending.
Merge and Split of Karhunen-Loeve Transformed Data, U.S. Patent pending.
Merge and Split of Generalized Transformed Data, U.S. Patent pending.
Multiple Description Transmission and Resolution Conversion of CompressedData, Aerospace Invention Disclosure, 2002.
Lossless Discrete Cosine Transform with Embedded Haar Wavelet Transform,Aerospace Invention Disclosure, 2002.
Lossless Modulated Lapped Transform with Embedded Haar Wavelet Transform, Aerospace Invention Disclosure, 2002.
Extended Haar Transform and Hybrid Orthogonal Transform, Aerospace Invention Disclosure, 2003.
New Lifting Scheme in Wavelet Transforms, Aerospace Invention Disclosure, 2004.
Fast Adaptive Lifting Scheme in Wavelet Transforms, Aerospace Invention Dis-closure, 2004.
1.
2.
3.
4.
5.
6.
7.
8.
9.
10.
11.
12.
13.
14.

40 • Crosslink Summer 2004
Detecting
from Space
The wildfires that ravaged southern California in 2003 not only scarredthe landscape but also dumped pollutants into the air. These fires providean example of how satellite data can reveal the impact of intense localsources of air pollution on air quality on a regional or even global scale.This true-color image was taken by the Moderate Resolution ImagingSpectroradiometer (MODIS) on NASA’s EOS Aqua satellite and clearlyshows the smoke plumes of ten raging fires. MODIS data can assist inmonitoring the transport of aerosolized pollutants.

Crosslink Summer 2004 • 41Crosslink Summer 2004 • 41
S atellite data have traditionally been underexploited by the air-quality community. The Environmental Protection Agency (EPA),together with state and regional air-quality agencies, relies insteadon an extensive ground-based network to monitor and predict ur-
ban air quality. Recent and planned technological advancements in remotesensing are demonstrating that space-based measurements can be a valu-able tool for forecasting air quality, providing information not availablefrom traditional monitoring stations. Satellite data can aid in the detection,tracking, and understanding of pollutant transport by providing observa-tions over large spatial domains and at varying altitudes. Satellites can bethe only data source in rural and remote areas where no ground-basedmeasurements are taken. Satellite data can be used qualitatively to providea regional view of pollutants and to help assess the impact of events such asbiomass burning or dust transport from remote sources. Space-based datacan also be used quantitatively to initialize and validate air-quality models.
The Aerospace Corporation has a long history of support to meteoro-logical satellite programs such as the Defense Meteorological SatelliteSystem (DMSP), the Polar-orbiting Operational Environment Satellites(POES), and the Geostationary Operational Environment Satellites(GOES). More recently, this support has extended to environmental satel-lite systems such as NASA’s Earth Observing System (EOS) and the futureNational Polar-orbiting Operational Environmental Satellite System(NPOESS), which will merge DMSP and POES weather satellites into anintegrated environmental observation system. These systems could play a
The use of satellite data for air-quality
applications has been hindered by a
historical lack of collaboration between
air-quality and satellite scientists.
Aerospace is well positioned to help bridge
the gap between these two
communities.
Leslie Belsma
SeaS
pace
Cor
pora
tion
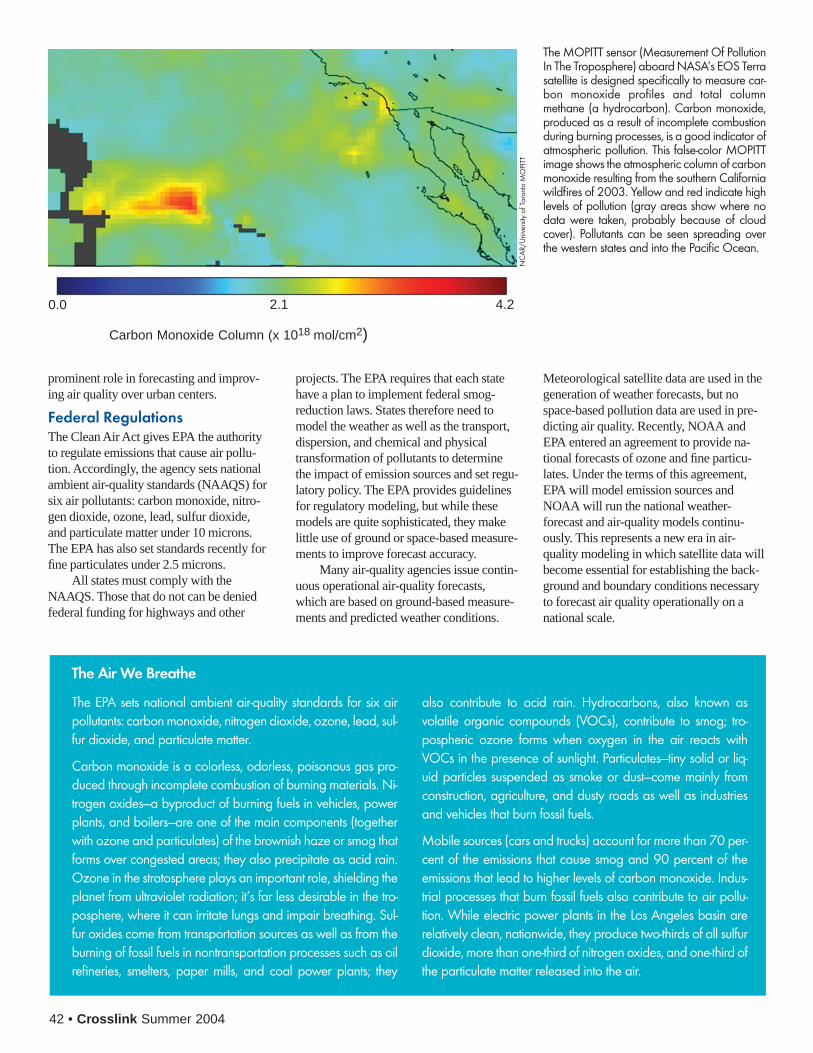
42 • Crosslink Summer 2004
The EPA sets national ambient air-quality standards for six airpollutants: carbon monoxide, nitrogen dioxide, ozone, lead, sul-fur dioxide, and particulate matter.
Carbon monoxide is a colorless, odorless, poisonous gas pro-duced through incomplete combustion of burning materials. Ni-trogen oxides—a byproduct of burning fuels in vehicles, powerplants, and boilers—are one of the main components (togetherwith ozone and particulates) of the brownish haze or smog thatforms over congested areas; they also precipitate as acid rain.Ozone in the stratosphere plays an important role, shielding theplanet from ultraviolet radiation; it’s far less desirable in the tro-posphere, where it can irritate lungs and impair breathing. Sul-fur oxides come from transportation sources as well as from theburning of fossil fuels in nontransportation processes such as oilrefineries, smelters, paper mills, and coal power plants; they
also contribute to acid rain. Hydrocarbons, also known asvolatile organic compounds (VOCs), contribute to smog; tro-pospheric ozone forms when oxygen in the air reacts withVOCs in the presence of sunlight. Particulates—tiny solid or liq-uid particles suspended as smoke or dust—come mainly fromconstruction, agriculture, and dusty roads as well as industriesand vehicles that burn fossil fuels.
Mobile sources (cars and trucks) account for more than 70 per-cent of the emissions that cause smog and 90 percent of theemissions that lead to higher levels of carbon monoxide. Indus-trial processes that burn fossil fuels also contribute to air pollu-tion. While electric power plants in the Los Angeles basin arerelatively clean, nationwide, they produce two-thirds of all sulfurdioxide, more than one-third of nitrogen oxides, and one-third ofthe particulate matter released into the air.
The Air We Breathe
prominent role in forecasting and improv-ing air quality over urban centers.
Federal RegulationsThe Clean Air Act gives EPA the authorityto regulate emissions that cause air pollu-tion. Accordingly, the agency sets nationalambient air-quality standards (NAAQS) forsix air pollutants: carbon monoxide, nitro-gen dioxide, ozone, lead, sulfur dioxide,and particulate matter under 10 microns.The EPA has also set standards recently forfine particulates under 2.5 microns.
All states must comply with theNAAQS. Those that do not can be deniedfederal funding for highways and other
projects. The EPA requires that each statehave a plan to implement federal smog-reduction laws. States therefore need tomodel the weather as well as the transport,dispersion, and chemical and physicaltransformation of pollutants to determinethe impact of emission sources and set regu-latory policy. The EPA provides guidelinesfor regulatory modeling, but while thesemodels are quite sophisticated, they makelittle use of ground or space-based measure-ments to improve forecast accuracy.
Many air-quality agencies issue contin-uous operational air-quality forecasts,which are based on ground-based measure-ments and predicted weather conditions.
Meteorological satellite data are used in thegeneration of weather forecasts, but nospace-based pollution data are used in pre-dicting air quality. Recently, NOAA andEPA entered an agreement to provide na-tional forecasts of ozone and fine particu-lates. Under the terms of this agreement,EPA will model emission sources andNOAA will run the national weather-forecast and air-quality models continu-ously. This represents a new era in air-quality modeling in which satellite data willbecome essential for establishing the back-ground and boundary conditions necessaryto forecast air quality operationally on anational scale.
0.0 2.1 4.2
Carbon Monoxide Column (x 1018 mol/cm2)
The MOPITT sensor (Measurement Of PollutionIn The Troposphere) aboard NASA’s EOS Terrasatellite is designed specifically to measure car-bon monoxide profiles and total columnmethane (a hydrocarbon). Carbon monoxide,produced as a result of incomplete combustionduring burning processes, is a good indicator ofatmospheric pollution. This false-color MOPITTimage shows the atmospheric column of carbonmonoxide resulting from the southern Californiawildfires of 2003. Yellow and red indicate highlevels of pollution (gray areas show where nodata were taken, probably because of cloudcover). Pollutants can be seen spreading overthe western states and into the Pacific Ocean.
NC
AR/
Uni
vers
ity o
f Tor
onto
MO
PITT
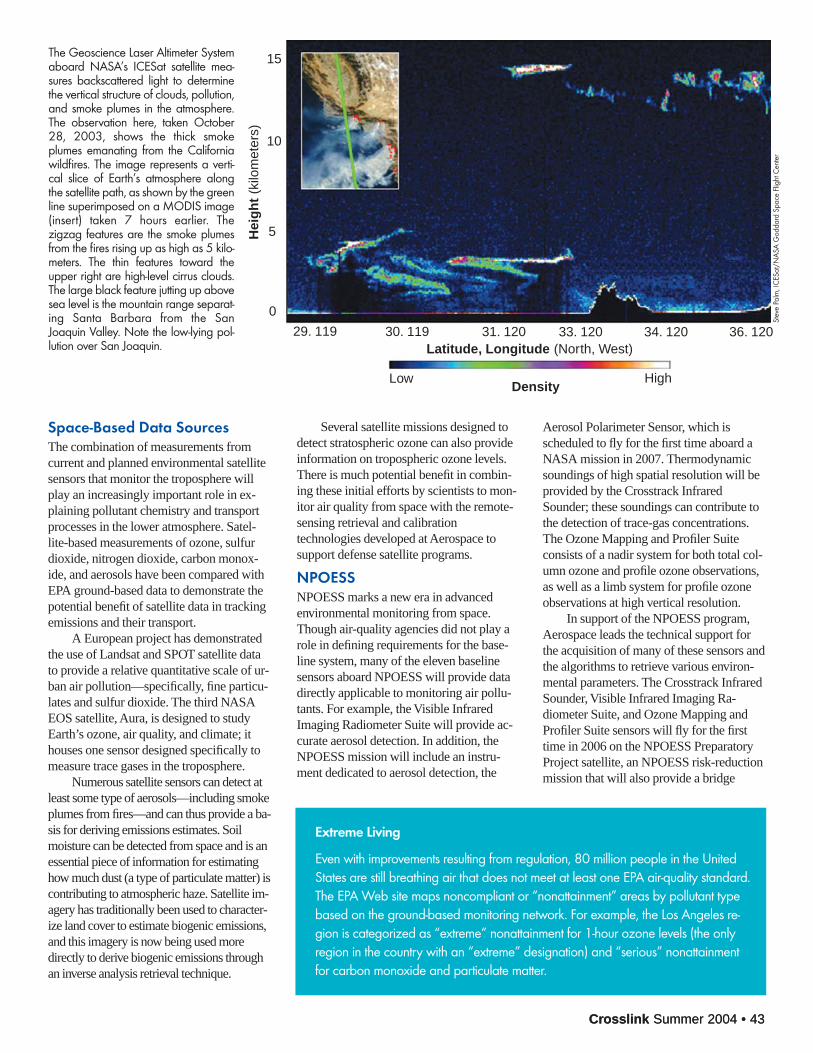
Crosslink Summer 2004 • 43
Space-Based Data SourcesThe combination of measurements fromcurrent and planned environmental satellitesensors that monitor the troposphere willplay an increasingly important role in ex-plaining pollutant chemistry and transportprocesses in the lower atmosphere. Satel-lite-based measurements of ozone, sulfurdioxide, nitrogen dioxide, carbon monox-ide, and aerosols have been compared withEPA ground-based data to demonstrate thepotential benefit of satellite data in trackingemissions and their transport.
A European project has demonstratedthe use of Landsat and SPOT satellite datato provide a relative quantitative scale of ur-ban air pollution—specifically, fine particu-lates and sulfur dioxide. The third NASAEOS satellite, Aura, is designed to studyEarth’s ozone, air quality, and climate; ithouses one sensor designed specifically tomeasure trace gases in the troposphere.
Numerous satellite sensors can detect atleast some type of aerosols—including smokeplumes from fires—and can thus provide a ba-sis for deriving emissions estimates. Soilmoisture can be detected from space and is anessential piece of information for estimatinghow much dust (a type of particulate matter) iscontributing to atmospheric haze. Satellite im-agery has traditionally been used to character-ize land cover to estimate biogenic emissions,and this imagery is now being used moredirectly to derive biogenic emissions throughan inverse analysis retrieval technique.
Several satellite missions designed todetect stratospheric ozone can also provideinformation on tropospheric ozone levels.There is much potential benefit in combin-ing these initial efforts by scientists to mon-itor air quality from space with the remote-sensing retrieval and calibrationtechnologies developed at Aerospace tosupport defense satellite programs.
NPOESSNPOESS marks a new era in advancedenvironmental monitoring from space.Though air-quality agencies did not play arole in defining requirements for the base-line system, many of the eleven baselinesensors aboard NPOESS will provide datadirectly applicable to monitoring air pollu-tants. For example, the Visible InfraredImaging Radiometer Suite will provide ac-curate aerosol detection. In addition, theNPOESS mission will include an instru-ment dedicated to aerosol detection, the
Aerosol Polarimeter Sensor, which isscheduled to fly for the first time aboard aNASA mission in 2007. Thermodynamicsoundings of high spatial resolution will beprovided by the Crosstrack InfraredSounder; these soundings can contribute tothe detection of trace-gas concentrations.The Ozone Mapping and Profiler Suiteconsists of a nadir system for both total col-umn ozone and profile ozone observations,as well as a limb system for profile ozoneobservations at high vertical resolution.
In support of the NPOESS program,Aerospace leads the technical support forthe acquisition of many of these sensors andthe algorithms to retrieve various environ-mental parameters. The Crosstrack InfraredSounder, Visible Infrared Imaging Ra-diometer Suite, and Ozone Mapping andProfiler Suite sensors will fly for the firsttime in 2006 on the NPOESS PreparatoryProject satellite, an NPOESS risk-reductionmission that will also provide a bridge
Crosslink Summer 2004 • 43
Low HighDensity
Latitude, Longitude (North, West)29. 119
15
10
5
0
30. 119 31. 120 33. 120 34. 120 36. 120
The Geoscience Laser Altimeter Systemaboard NASA’s ICESat satellite mea-sures backscattered light to determinethe vertical structure of clouds, pollution,and smoke plumes in the atmosphere.The observation here, taken October28, 2003, shows the thick smokeplumes emanating from the Californiawildfires. The image represents a verti-cal slice of Earth’s atmosphere alongthe satellite path, as shown by the greenline superimposed on a MODIS image(insert) taken 7 hours earlier. Thezigzag features are the smoke plumesfrom the fires rising up as high as 5 kilo-meters. The thin features toward theupper right are high-level cirrus clouds.The large black feature jutting up abovesea level is the mountain range separat-ing Santa Barbara from the SanJoaquin Valley. Note the low-lying pol-lution over San Joaquin.
Stev
e Pa
lm, I
CES
at/N
ASA
God
dard
Spa
ce F
light
Cen
ter
Hei
gh
t (k
ilom
eter
s)
Extreme Living
Even with improvements resulting from regulation, 80 million people in the UnitedStates are still breathing air that does not meet at least one EPA air-quality standard.The EPA Web site maps noncompliant or “nonattainment” areas by pollutant typebased on the ground-based monitoring network. For example, the Los Angeles re-gion is categorized as “extreme” nonattainment for 1-hour ozone levels (the onlyregion in the country with an “extreme” designation) and “serious” nonattainmentfor carbon monoxide and particulate matter.
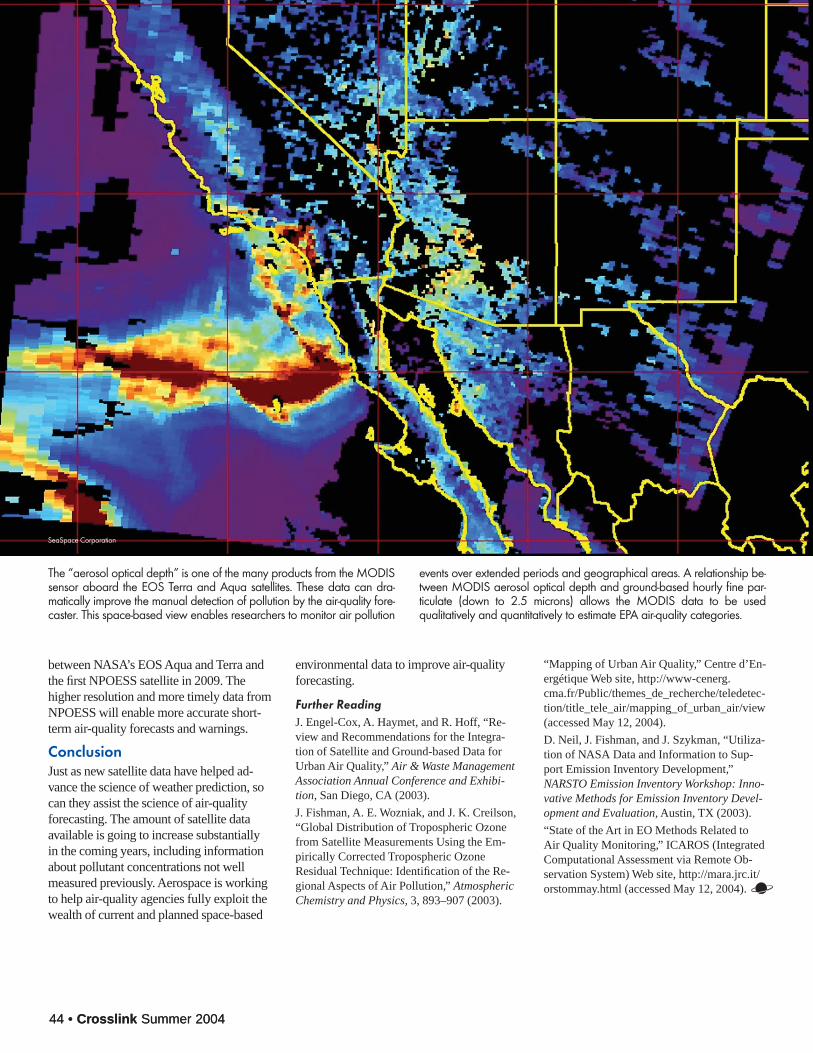
44 • Crosslink Summer 2004
“Mapping of Urban Air Quality,” Centre d’En-ergétique Web site, http://www-cenerg.cma.fr/Public/themes_de_recherche/teledetec-tion/title_tele_air/mapping_of_urban_air/view(accessed May 12, 2004).
D. Neil, J. Fishman, and J. Szykman, “Utiliza-tion of NASA Data and Information to Sup-port Emission Inventory Development,”NARSTO Emission Inventory Workshop: Inno-vative Methods for Emission Inventory Devel-opment and Evaluation, Austin, TX (2003).
“State of the Art in EO Methods Related toAir Quality Monitoring,” ICAROS (IntegratedComputational Assessment via Remote Ob-servation System) Web site, http://mara.jrc.it/orstommay.html (accessed May 12, 2004).
44 • Crosslink Summer 2004
between NASA’s EOS Aqua and Terra andthe first NPOESS satellite in 2009. Thehigher resolution and more timely data fromNPOESS will enable more accurate short-term air-quality forecasts and warnings.
ConclusionJust as new satellite data have helped ad-vance the science of weather prediction, socan they assist the science of air-qualityforecasting. The amount of satellite dataavailable is going to increase substantiallyin the coming years, including informationabout pollutant concentrations not wellmeasured previously. Aerospace is workingto help air-quality agencies fully exploit thewealth of current and planned space-based
environmental data to improve air-qualityforecasting.
Further ReadingJ. Engel-Cox, A. Haymet, and R. Hoff, “Re-view and Recommendations for the Integra-tion of Satellite and Ground-based Data forUrban Air Quality,” Air & Waste ManagementAssociation Annual Conference and Exhibi-tion, San Diego, CA (2003).
J. Fishman, A. E. Wozniak, and J. K. Creilson,“Global Distribution of Tropospheric Ozonefrom Satellite Measurements Using the Em-pirically Corrected Tropospheric OzoneResidual Technique: Identification of the Re-gional Aspects of Air Pollution,” AtmosphericChemistry and Physics, 3, 893–907 (2003).
The “aerosol optical depth” is one of the many products from the MODISsensor aboard the EOS Terra and Aqua satellites. These data can dra-matically improve the manual detection of pollution by the air-quality fore-caster. This space-based view enables researchers to monitor air pollution
events over extended periods and geographical areas. A relationship be-tween MODIS aerosol optical depth and ground-based hourly fine par-ticulate (down to 2.5 microns) allows the MODIS data to be usedqualitatively and quantitatively to estimate EPA air-quality categories.
SeaSpace Corporation
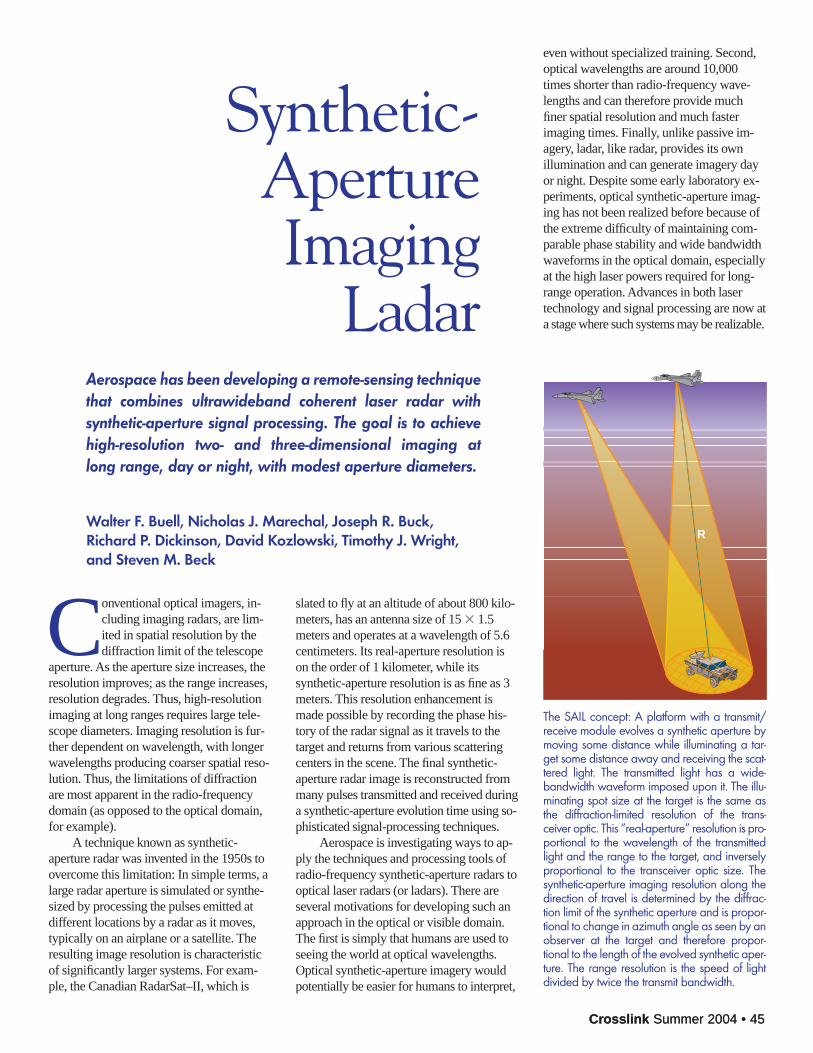
Crosslink Summer 2004 • 45Crosslink Summer 2004 • 45
Synthetic-ApertureImaging
LadarAerospace has been developing a remote-sensing technique that combines ultrawideband coherent laser radar with synthetic-aperture signal processing. The goal is to achieve high-resolution two- and three-dimensional imaging at long range, day or night, with modest aperture diameters.
Walter F. Buell, Nicholas J. Marechal, Joseph R. Buck, Richard P. Dickinson, David Kozlowski, Timothy J. Wright, and Steven M. Beck
Conventional optical imagers, in-cluding imaging radars, are lim-ited in spatial resolution by thediffraction limit of the telescope
aperture. As the aperture size increases, theresolution improves; as the range increases,resolution degrades. Thus, high-resolutionimaging at long ranges requires large tele-scope diameters. Imaging resolution is fur-ther dependent on wavelength, with longerwavelengths producing coarser spatial reso-lution. Thus, the limitations of diffractionare most apparent in the radio-frequencydomain (as opposed to the optical domain,for example).
A technique known as synthetic-aperture radar was invented in the 1950s toovercome this limitation: In simple terms, alarge radar aperture is simulated or synthe-sized by processing the pulses emitted atdifferent locations by a radar as it moves,typically on an airplane or a satellite. Theresulting image resolution is characteristicof significantly larger systems. For exam-ple, the Canadian RadarSat–II, which is
slated to fly at an altitude of about 800 kilo-meters, has an antenna size of 15 � 1.5meters and operates at a wavelength of 5.6centimeters. Its real-aperture resolution ison the order of 1 kilometer, while itssynthetic-aperture resolution is as fine as 3meters. This resolution enhancement ismade possible by recording the phase his-tory of the radar signal as it travels to thetarget and returns from various scatteringcenters in the scene. The final synthetic-aperture radar image is reconstructed frommany pulses transmitted and received duringa synthetic-aperture evolution time using so-phisticated signal-processing techniques.
Aerospace is investigating ways to ap-ply the techniques and processing tools ofradio-frequency synthetic-aperture radars tooptical laser radars (or ladars). There areseveral motivations for developing such anapproach in the optical or visible domain.The first is simply that humans are used toseeing the world at optical wavelengths.Optical synthetic-aperture imagery wouldpotentially be easier for humans to interpret,
even without specialized training. Second,optical wavelengths are around 10,000times shorter than radio-frequency wave-lengths and can therefore provide muchfiner spatial resolution and much fasterimaging times. Finally, unlike passive im-agery, ladar, like radar, provides its ownillumination and can generate imagery dayor night. Despite some early laboratory ex-periments, optical synthetic-aperture imag-ing has not been realized before because ofthe extreme difficulty of maintaining com-parable phase stability and wide bandwidthwaveforms in the optical domain, especiallyat the high laser powers required for long-range operation. Advances in both lasertechnology and signal processing are now ata stage where such systems may be realizable.
R
The SAIL concept: A platform with a transmit/receive module evolves a synthetic aperture bymoving some distance while illuminating a tar-get some distance away and receiving the scat-tered light. The transmitted light has a wide-bandwidth waveform imposed upon it. The illu-minating spot size at the target is the same asthe diffraction-limited resolution of the trans-ceiver optic. This “real-aperture” resolution is pro-portional to the wavelength of the transmittedlight and the range to the target, and inverselyproportional to the transceiver optic size. Thesynthetic-aperture imaging resolution along thedirection of travel is determined by the diffrac-tion limit of the synthetic aperture and is propor-tional to change in azimuth angle as seen by anobserver at the target and therefore propor-tional to the length of the evolved synthetic aper-ture. The range resolution is the speed of lightdivided by twice the transmit bandwidth.
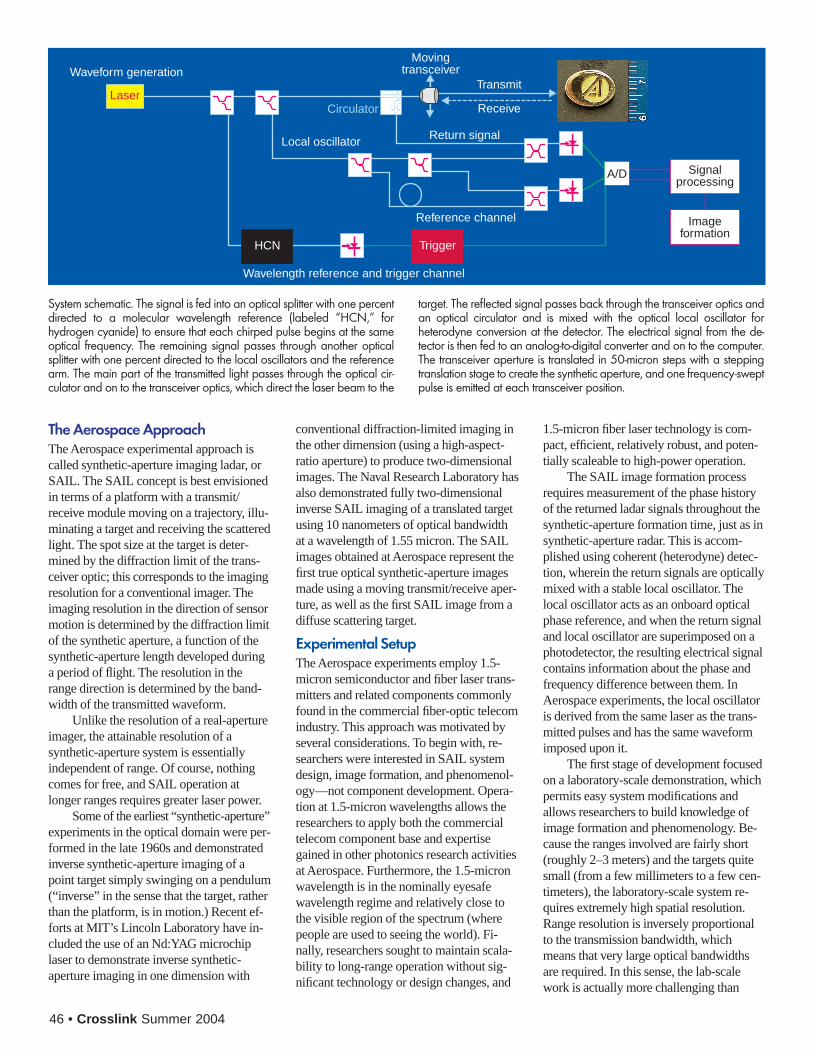
46 • Crosslink Summer 2004
The Aerospace ApproachThe Aerospace experimental approach iscalled synthetic-aperture imaging ladar, orSAIL. The SAIL concept is best envisionedin terms of a platform with a transmit/receive module moving on a trajectory, illu-minating a target and receiving the scatteredlight. The spot size at the target is deter-mined by the diffraction limit of the trans-ceiver optic; this corresponds to the imagingresolution for a conventional imager. Theimaging resolution in the direction of sensormotion is determined by the diffraction limitof the synthetic aperture, a function of thesynthetic-aperture length developed duringa period of flight. The resolution in therange direction is determined by the band-width of the transmitted waveform.
Unlike the resolution of a real-apertureimager, the attainable resolution of asynthetic-aperture system is essentiallyindependent of range. Of course, nothingcomes for free, and SAIL operation atlonger ranges requires greater laser power.
Some of the earliest “synthetic-aperture”experiments in the optical domain were per-formed in the late 1960s and demonstratedinverse synthetic-aperture imaging of apoint target simply swinging on a pendulum(“inverse” in the sense that the target, ratherthan the platform, is in motion.) Recent ef-forts at MIT’s Lincoln Laboratory have in-cluded the use of an Nd:YAG microchiplaser to demonstrate inverse synthetic-aperture imaging in one dimension with
conventional diffraction-limited imaging inthe other dimension (using a high-aspect-ratio aperture) to produce two-dimensionalimages. The Naval Research Laboratory hasalso demonstrated fully two-dimensionalinverse SAIL imaging of a translated targetusing 10 nanometers of optical bandwidthat a wavelength of 1.55 micron. The SAILimages obtained at Aerospace represent thefirst true optical synthetic-aperture imagesmade using a moving transmit/receive aper-ture, as well as the first SAIL image from adiffuse scattering target.
Experimental SetupThe Aerospace experiments employ 1.5-micron semiconductor and fiber laser trans-mitters and related components commonlyfound in the commercial fiber-optic telecomindustry. This approach was motivated byseveral considerations. To begin with, re-searchers were interested in SAIL systemdesign, image formation, and phenomenol-ogy—not component development. Opera-tion at 1.5-micron wavelengths allows theresearchers to apply both the commercialtelecom component base and expertisegained in other photonics research activitiesat Aerospace. Furthermore, the 1.5-micronwavelength is in the nominally eyesafewavelength regime and relatively close tothe visible region of the spectrum (wherepeople are used to seeing the world). Fi-nally, researchers sought to maintain scala-bility to long-range operation without sig-nificant technology or design changes, and
1.5-micron fiber laser technology is com-pact, efficient, relatively robust, and poten-tially scaleable to high-power operation.
The SAIL image formation processrequires measurement of the phase historyof the returned ladar signals throughout thesynthetic-aperture formation time, just as insynthetic-aperture radar. This is accom-plished using coherent (heterodyne) detec-tion, wherein the return signals are opticallymixed with a stable local oscillator. Thelocal oscillator acts as an onboard opticalphase reference, and when the return signaland local oscillator are superimposed on aphotodetector, the resulting electrical signalcontains information about the phase andfrequency difference between them. InAerospace experiments, the local oscillatoris derived from the same laser as the trans-mitted pulses and has the same waveformimposed upon it.
The first stage of development focusedon a laboratory-scale demonstration, whichpermits easy system modifications andallows researchers to build knowledge ofimage formation and phenomenology. Be-cause the ranges involved are fairly short(roughly 2–3 meters) and the targets quitesmall (from a few millimeters to a few cen-timeters), the laboratory-scale system re-quires extremely high spatial resolution.Range resolution is inversely proportionalto the transmission bandwidth, whichmeans that very large optical bandwidthsare required. In this sense, the lab-scalework is actually more challenging than
Waveform generationMoving
transceiver
Signalprocessing
Imageformation
Transmit
Receive
Return signal
Reference channel
Local oscillator
Wavelength reference and trigger channel
Laser
A/D
HCN Trigger
Circulator
System schematic. The signal is fed into an optical splitter with one percentdirected to a molecular wavelength reference (labeled “HCN,” forhydrogen cyanide) to ensure that each chirped pulse begins at the sameoptical frequency. The remaining signal passes through another opticalsplitter with one percent directed to the local oscillators and the referencearm. The main part of the transmitted light passes through the optical cir-culator and on to the transceiver optics, which direct the laser beam to the
target. The reflected signal passes back through the transceiver optics andan optical circulator and is mixed with the optical local oscillator forheterodyne conversion at the detector. The electrical signal from the de-tector is then fed to an analog-to-digital converter and on to the computer.The transceiver aperture is translated in 50-micron steps with a steppingtranslation stage to create the synthetic aperture, and one frequency-sweptpulse is emitted at each transceiver position.
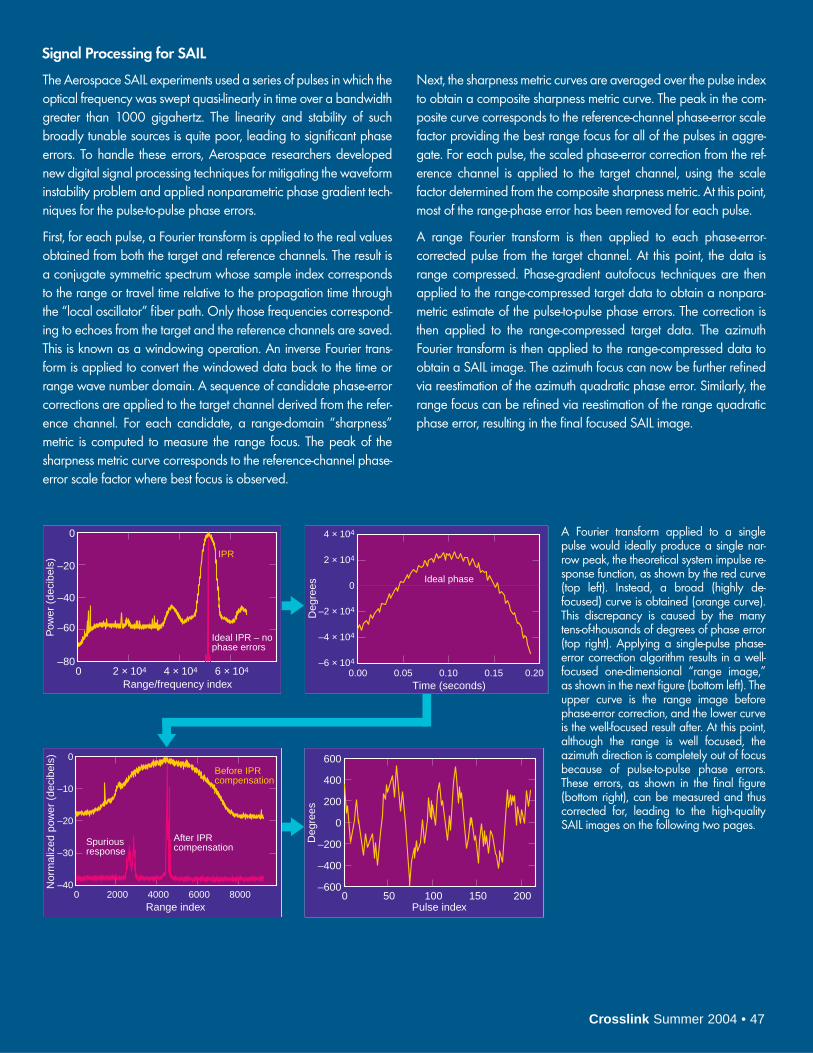
Crosslink Summer 2004 • 47
The Aerospace SAIL experiments used a series of pulses in which theoptical frequency was swept quasi-linearly in time over a bandwidthgreater than 1000 gigahertz. The linearity and stability of suchbroadly tunable sources is quite poor, leading to significant phaseerrors. To handle these errors, Aerospace researchers developednew digital signal processing techniques for mitigating the waveforminstability problem and applied nonparametric phase gradient tech-niques for the pulse-to-pulse phase errors.
First, for each pulse, a Fourier transform is applied to the real valuesobtained from both the target and reference channels. The result isa conjugate symmetric spectrum whose sample index correspondsto the range or travel time relative to the propagation time throughthe “local oscillator” fiber path. Only those frequencies correspond-ing to echoes from the target and the reference channels are saved.This is known as a windowing operation. An inverse Fourier trans-form is applied to convert the windowed data back to the time orrange wave number domain. A sequence of candidate phase-errorcorrections are applied to the target channel derived from the refer-ence channel. For each candidate, a range-domain “sharpness”metric is computed to measure the range focus. The peak of thesharpness metric curve corresponds to the reference-channel phase-error scale factor where best focus is observed.
Next, the sharpness metric curves are averaged over the pulse indexto obtain a composite sharpness metric curve. The peak in the com-posite curve corresponds to the reference-channel phase-error scalefactor providing the best range focus for all of the pulses in aggre-gate. For each pulse, the scaled phase-error correction from the ref-erence channel is applied to the target channel, using the scalefactor determined from the composite sharpness metric. At this point,most of the range-phase error has been removed for each pulse.
A range Fourier transform is then applied to each phase-error-corrected pulse from the target channel. At this point, the data isrange compressed. Phase-gradient autofocus techniques are thenapplied to the range-compressed target data to obtain a nonpara-metric estimate of the pulse-to-pulse phase errors. The correction isthen applied to the range-compressed target data. The azimuthFourier transform is then applied to the range-compressed data toobtain a SAIL image. The azimuth focus can now be further refinedvia reestimation of the azimuth quadratic phase error. Similarly, therange focus can be refined via reestimation of the range quadraticphase error, resulting in the final focused SAIL image.
Signal Processing for SAILP
ower
(de
cibe
ls)
Range/frequency index2 × 1040 4 × 10⁴ 6 × 10⁴
IPR
Ideal IPR – nophase errors
0
–20
–40
–60
–80
Nor
mal
ized
pow
er (
deci
bels
)
Range index
Before IPRcompensation
0
–10
–20
–30
–40
After IPRcompensation
Spuriousresponse
20000 4000 6000 8000
Deg
rees
Pulse index
0
–600
–400
–200
200
400
600
0 50 100 150 200
A Fourier transform applied to a singlepulse would ideally produce a single nar-row peak, the theoretical system impulse re-sponse function, as shown by the red curve(top left). Instead, a broad (highly de-focused) curve is obtained (orange curve).This discrepancy is caused by the manytens-of-thousands of degrees of phase error(top right). Applying a single-pulse phase-error correction algorithm results in a well-focused one-dimensional “range image,”as shown in the next figure (bottom left). Theupper curve is the range image beforephase-error correction, and the lower curveis the well-focused result after. At this point,although the range is well focused, theazimuth direction is completely out of focusbecause of pulse-to-pulse phase errors.These errors, as shown in the final figure(bottom right), can be measured and thuscorrected for, leading to the high-qualitySAIL images on the following two pages.
Deg
rees
Time (seconds)
4 × 10⁴
2 × 10⁴
–2 × 10⁴
–4 × 10⁴
–6 × 10⁴
0Ideal phase
0.00 0.05 0.10 0.15 0.20

48 • Crosslink Summer 2004
errors regardless of range mismatch in thereference channel. (Previous work at theNaval Research Laboratory had demon-strated a SAIL image, but the implementa-tion required exact matching of the refer-ence and target arms.) A discrepancy ofapproximately 1 meter between the lengthof the reference channel path and the lengthof the target channel path was introduced. Aspecialized digital compensation techniqueresulted in a well-focused image of the tri-angle target. This phase of the experimentdemonstrated that SAIL can employ a fiber-optic reference channel to produce focused2-D images even in cases where the rangeto target is either uncertain or variable (as ina system that points to various targets at dif-fering ranges).
In the course of their experiments, theresearchers noticed very faint artifacts in theimagery. Logarithmic representations of im-age intensity revealed “ghost” images aboveand below the main image. These ghostswere traced to residual amplitude-modula-tion ripple in laser intensity. (With thesource of the artifacts identified, researcherscan now develop an algorithm to correct forthem.) These results demonstrated a movebeyond simply “making pictures” to doingdetailed image-quality analysis.
target. To remove this constraint, Aerospacedeveloped new algorithms for intrapulsephase-error correction to handle arbitrarymismatch between the reference arm andthe target path length.
ObservationsThe first experiment generated an image ofa triangle cut from a piece of retroreflectivematerial. The target was tilted away fromthe observing platform at 45 degrees to cre-ate the range depth. The resulting SAIL im-age displays range in the vertical directionand cross-range or azimuth in the horizontaldimension. The Aerospace reference-channeldesign, coupled with phase-gradient auto-focus techniques, helped estimate andremove the intrapulse and pulse-to-pulsephase errors, which would render the imageunrecognizable. Despite the incidence of“laser speckle” (inherent in any coherentimaging technique), the image was stillhighly interpretable to the human eye, andthe focus was reasonably good. This initialresult indicated that synthetic-aperture ladarimaging is possible despite the instability ofthe laser waveform.
The next experiment sought to demon-strate the possibility of achieving focusedimagery in the presence of large waveform
These images demon-strate the possibility ofmanaging imagefocus regardless ofdiscrepancies be-tween the referencechannel and targetchannel ranges. Inthe top image, the reference and targetchannels are care-fully matched (seerange plot at left). Inthe lower image, thereference channelpath length does notmatch the target channel path length (net mismatch approximately 1 meter; range to target is approximately 2–3 meters). A digital compensation technique involving a special “sharpness” metricnonetheless produces a well focused image of the triangle target. Thisimage demonstrates that SAIL can employ a fiber-optic referencechannel to produce focused two-dimensional images even in caseswhere the range to target is either uncertain or variable.
SAIL image of a trianglecut from a piece of retrore-flective material. The targetis tilted away from the observer at 45 degrees tocreate the range depth,which is why the laser spotsize appears elliptical. TheSAIL image thus displaysrange in the verticaldimension and cross-rangeor azimuth in the horizontaldimension. Inset is a close-range photograph of the target triangle; the white lines on the target do nothave the retroreflective material and appear as dark lines in the SAIL image.The fuzzy image above the figure is a “beam-scan” image, where the rangehas been focused but the azimuth processing has not been performed. Thebeam-scan image represents the real-aperture diffraction-limited spot scannedacross the target shape; it gives an impression of the image quality and resolution that would be obtained in the absence of aperture synthesis. Phase-gradient autofocus techniques were used to estimate and remove the pulse-to-pulse phase errors, which, if not removed, would render the imageunrecognizable. The dark diagonal lines through the target image are lessthan a millimeter wide. As a result of “laser speckle,” this image has a signal-to-noise ratio of about 1. The eye ignores this speckle noise, and the image isstill highly interpretable. The focus is reasonably good, although the numberof SAIL range resolution elements per illuminating spot size is only about 60.This result indicates that synthetic-aperture ladar imaging is possible despite thenonlinearity and instability of the laser waveform.
longer-range applications. The transmitterfor the lab-scale system is a commercialtunable external-cavity semiconductor lasercapable of producing a nominally linearfrequency-swept waveform with a band-width of 30 nanometers (more than 1 tera-hertz). Compared with the RadarSat-IIwaveform mentioned earlier, the system canachieve range resolution on the order of10,000 times finer.
The linearity and stability of suchbroadly tunable sources is quite poor, lead-ing to significant phase error in the linearfrequency-modulated waveform as well asresidual amplitude modulation. This is acommon dilemma: tunable sources are nothighly stable, and stable sources are notgenerally tunable. To overcome this prob-lem, the Aerospace team used a referencechannel to directly monitor optical phaseerrors induced during waveform generation.These measured errors were corrected usinga phase-error compensation algorithm. Inthe first implementations, the optical lengthof the reference arm was constrained to pre-cisely match the target range. Such a con-straint would seriously limit the operationalutility of a SAIL system, because the refer-ence channel would have to be retunedevery time the system pointed to a new
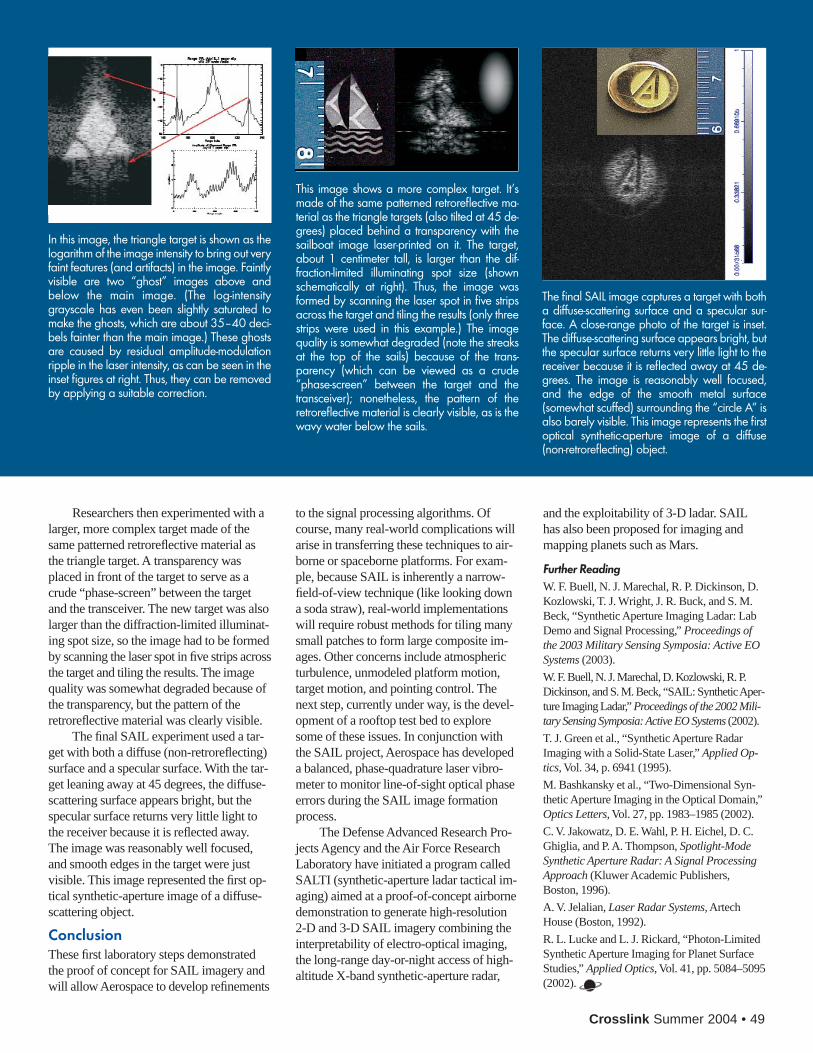
Crosslink Summer 2004 • 49
Researchers then experimented with alarger, more complex target made of thesame patterned retroreflective material asthe triangle target. A transparency wasplaced in front of the target to serve as acrude “phase-screen” between the targetand the transceiver. The new target was alsolarger than the diffraction-limited illuminat-ing spot size, so the image had to be formedby scanning the laser spot in five strips acrossthe target and tiling the results. The imagequality was somewhat degraded because ofthe transparency, but the pattern of theretroreflective material was clearly visible.
The final SAIL experiment used a tar-get with both a diffuse (non-retroreflecting)surface and a specular surface. With the tar-get leaning away at 45 degrees, the diffuse-scattering surface appears bright, but thespecular surface returns very little light tothe receiver because it is reflected away.The image was reasonably well focused,and smooth edges in the target were justvisible. This image represented the first op-tical synthetic-aperture image of a diffuse-scattering object.
ConclusionThese first laboratory steps demonstratedthe proof of concept for SAIL imagery andwill allow Aerospace to develop refinements
to the signal processing algorithms. Ofcourse, many real-world complications willarise in transferring these techniques to air-borne or spaceborne platforms. For exam-ple, because SAIL is inherently a narrow-field-of-view technique (like looking downa soda straw), real-world implementationswill require robust methods for tiling manysmall patches to form large composite im-ages. Other concerns include atmosphericturbulence, unmodeled platform motion,target motion, and pointing control. Thenext step, currently under way, is the devel-opment of a rooftop test bed to exploresome of these issues. In conjunction withthe SAIL project, Aerospace has developeda balanced, phase-quadrature laser vibro-meter to monitor line-of-sight optical phaseerrors during the SAIL image formationprocess.
The Defense Advanced Research Pro-jects Agency and the Air Force ResearchLaboratory have initiated a program calledSALTI (synthetic-aperture ladar tactical im-aging) aimed at a proof-of-concept airbornedemonstration to generate high-resolution2-D and 3-D SAIL imagery combining theinterpretability of electro-optical imaging,the long-range day-or-night access of high-altitude X-band synthetic-aperture radar,
and the exploitability of 3-D ladar. SAILhas also been proposed for imaging andmapping planets such as Mars.
Further ReadingW. F. Buell, N. J. Marechal, R. P. Dickinson, D.Kozlowski, T. J. Wright, J. R. Buck, and S. M.Beck, “Synthetic Aperture Imaging Ladar: LabDemo and Signal Processing,” Proceedings ofthe 2003 Military Sensing Symposia: Active EOSystems (2003).
W. F. Buell, N. J. Marechal, D. Kozlowski, R. P.Dickinson, and S. M. Beck, “SAIL: Synthetic Aper-ture Imaging Ladar,” Proceedings of the 2002 Mili-tary Sensing Symposia: Active EO Systems (2002).
T. J. Green et al., “Synthetic Aperture RadarImaging with a Solid-State Laser,” Applied Op-tics, Vol. 34, p. 6941 (1995).
M. Bashkansky et al., “Two-Dimensional Syn-thetic Aperture Imaging in the Optical Domain,”Optics Letters, Vol. 27, pp. 1983–1985 (2002).
C. V. Jakowatz, D. E. Wahl, P. H. Eichel, D. C.Ghiglia, and P. A. Thompson, Spotlight-ModeSynthetic Aperture Radar: A Signal ProcessingApproach (Kluwer Academic Publishers,Boston, 1996).
A. V. Jelalian, Laser Radar Systems, ArtechHouse (Boston, 1992).
R. L. Lucke and L. J. Rickard, “Photon-LimitedSynthetic Aperture Imaging for Planet SurfaceStudies,” Applied Optics, Vol. 41, pp. 5084–5095(2002).
The final SAIL image captures a target with botha diffuse-scattering surface and a specular sur-face. A close-range photo of the target is inset.The diffuse-scattering surface appears bright, butthe specular surface returns very little light to thereceiver because it is reflected away at 45 de-grees. The image is reasonably well focused,and the edge of the smooth metal surface(somewhat scuffed) surrounding the “circle A” isalso barely visible. This image represents the firstoptical synthetic-aperture image of a diffuse(non-retroreflecting) object.
In this image, the triangle target is shown as thelogarithm of the image intensity to bring out veryfaint features (and artifacts) in the image. Faintlyvisible are two “ghost” images above andbelow the main image. (The log-intensitygrayscale has even been slightly saturated tomake the ghosts, which are about 35–40 deci-bels fainter than the main image.) These ghostsare caused by residual amplitude-modulationripple in the laser intensity, as can be seen in theinset figures at right. Thus, they can be removedby applying a suitable correction.
This image shows a more complex target. It’smade of the same patterned retroreflective ma-terial as the triangle targets (also tilted at 45 de-grees) placed behind a transparency with thesailboat image laser-printed on it. The target,about 1 centimeter tall, is larger than the dif-fraction-limited illuminating spot size (shownschematically at right). Thus, the image wasformed by scanning the laser spot in five stripsacross the target and tiling the results (only threestrips were used in this example.) The imagequality is somewhat degraded (note the streaksat the top of the sails) because of the trans-parency (which can be viewed as a crude“phase-screen” between the target and thetransceiver); nonetheless, the pattern of theretroreflective material is clearly visible, as is thewavy water below the sails.

Aerospace helped craft government policy allowing satellite imaging companies to sell their products and services to foreign customers—without compromising national security.
I n February 2002, Colombian PresidentAndres Pastrana appeared on his na-tion’s television and declared an end topeace negotiations with the Revolu-
tionary Armed Forces of Colombia, an in-surgent group that the government had beenfighting for decades. In supporting his deci-sion, Pastrana held up satellite photographsof clandestine road networks developed inthe demilitarized zone in the south ofColombia—a violation, he argued, of thetwo-year-old peace process. The photos he
held up for his nation and the world to wit-ness were not declassified images from aColombian military satellite, nor were theyfrom any U.S. defense system. They werepurchased from a U.S. commercial satellitecompany.
Pastrana’s display of commercial satel-lite imagery received little notice in the me-dia, which was naturally more concernedwith his policy announcements. It was,however, one of the most dramatic manifes-tations of a policy signed by President
Clinton in 1994, Presidential DecisionDirective-23, U.S. Policy on Foreign Accessto U.S. Remote Sensing Capabilities. Aero-space had a role in implementing that policyand later helped shape the directive thatwould succeed it.
A Landmark DirectivePresidential Decision Directive-23 (orPDD-23, as it is commonly known) had itsroots in the Land Remote Sensing PolicyAct of 1992, which established the terms
Dennis Jones
50 • Crosslink Summer 2004
Commercial Remote Sensing and National Security
Spac
e Im
agin
g

Crosslink Summer 2004 • 51
Aerospace supported the drafting of a newremote-sensing policy for the Director ofCentral Intelligence and assisted in the cre-ation and implementation of the CIA’s Re-mote Sensing Committee, chaired by theNational Reconnaissance Office (NRO) andthe National Geospatial-IntelligenceAgency (formerly the National Imagingand Mapping Agency, or NIMA). Aero-space also assisted the NRO in fulfilling itsrole as the licensing coordinator for the in-telligence community and oversaw Depart-ment of Defense (DOD) implementationactions, shepherding numerous licensingand export control issues through the DODclearance process. In addition, Aerospaceanalyzed thousands of space technologyexport license requests and dozens of com-mercial operating license actions and pro-vided timely, in-depth analysis of foreignremote-sensing capabilities to ensure thebalance between commercial competitive-ness and national security protection wasmaintained.
A New DirectiveThe Clinton policy was a watershed for theremote-sensing community. It allowed U.S.companies to build, launch, and operatehigh-resolution satellites with frequent-revisit, high-data-rate collection and, insome cases, regional tasking, downlinking,and nearly instantaneous processing. Thepolicy heralded a new era in which almostany consumer with available resources—from governments toprivate citizens—couldpurchase high-resolu-tion images of almostany point on Earth.
Still, the commer-cial market for suchimagery—both domes-tic and international—did not materialize asrapidly or as broadly asanticipated. Pastrana’s display highlightedboth the promise and frustrations of the bur-geoning industry: The images and their de-rived products had immediate applications,but the widespread adoption by repeat orlarge-volume customers was slow to de-velop. Thus, the sustainability of the com-mercial satellite imaging industry still wasless than certain nearly a decade after its in-ception.
The Bush administration sought tochange that with the approval of a new Na-tional Security Presidential Directive on
U.S. commercial remote sensing in April2003. This policy provided a strong govern-ment rationale for procuring high-resolutionimagery from U.S. providers, established aframework for international access to high-resolution remote-sensing technology, en-couraged civil departments and agencies tointegrate high-resolution data into daily op-erations, and more clearly delineated U.S.Government roles and responsibilities re-garding the commercial industry. This wasthe president’s first major policy directiveunder the auspices of a comprehensive Na-tional Security Council review of space pol-icy matters. Aerospace played a key role insupporting the DOD, NRO, and intelligencecommunity in assisting the National Secu-rity Council in the drafting, coordination,and eventual approval of the new directive.
The Bush administration’s policy, likethat of the Clinton administration, soughtboth to advance and protect U.S. nationalsecurity and foreign policy interests“through maintaining the nation’s leader-ship in remote sensing space capabilities.”However, the Bush directive went furtherby suggesting that “sustaining and enhanc-ing the U.S. remote sensing industry”would also help achieve that goal. In otherwords, a strong U.S. commercial remote-sensing industry could be good for businessand good for national security.
The Bush administration’s policy alsooffered a more aggressive U.S. Government
approach to commercialremote sensing by defin-ing what role commercialimagery would play insatisfying government re-quirements. The mostfundamental shift was inmandating that the gov-ernment “rely to the max-imum practical extent onU.S. commercial remotesensing space capabilities
for filling imagery and geo-spatial needs formilitary, intelligence, foreign policy, home-land security, and civil users.”
With that role for commercial imagerydelineated, the policy established how thegovernment would realign its own imagerycollection efforts to meet national needs—for example, by focusing on more challeng-ing intelligence and defense requirementsand advanced technology solutions. PDD-23 never specified a defined mission forU.S. commercial imagery. Interestingly, the
for civil and commercial remote sensing inthe U.S. Government. The act designatedthe National Oceanic and Atmospheric Ad-ministration (NOAA) as the chief regula-tory agency for the commercial remote-sensing industry and outlined the generalterms and conditions required to obtain a li-cense to operate a remote-sensing satellitein the United States. These included, for ex-ample, the submission of on-orbit technicalcharacteristics of the proposed system forNOAA review. The act also stipulated that alicensee “operate the system in such a man-ner as to preserve the national security ofthe United States and to observe the interna-tional obligations of the United States.”These conditions required the governmentto investigate the ambiguous nexus betweentechnology development and national secu-rity and decide on the best course of action.Accordingly, Aerospace began conductingresearch and analysis to assist the investiga-tion and decision-making process.
PDD-23 was in many ways a responseto the end of the Cold War. At that time, ma-jor manufacturers of classified satellite sys-tems feared that the elimination of the So-viet Union as an adversary would lead toreduced government spending for nationaltechnical architectures. These companieslobbied the administration to permit com-mercialization of previously classified satel-lite imaging capabilities as a means to sus-tain the satellite industrial base and promoteU.S. products and services overseas.
The Clinton directive sought to balancethe need to protect sensitive technologyfrom proliferating while advancing the for-tunes of U.S. companies that desired to en-ter this new market. The policy tilted, albeitslightly, toward national security by includ-ing provisions for the suspension of com-mercial operations by the Secretary ofCommerce (in consultation with the Secre-taries of Defense and State) when U.S.troops were at risk or when the nation faceda clear and present danger. The Clinton pol-icy included general guidelines for licensingcommercial capabilities, supporting thegoal of maintaining the U.S. industry’s leadover international competitors. The policyrefrained from articulating a clear set of op-erating capabilities, leaving it to the intera-gency process to make licensing determina-tions on a case-by-case basis.
Aerospace would come to play a majorrole in facilitating this interagency process.When the government asked for assistancein interpreting and implementing PDD-23,
The policy heralded a newera in which almost any consumer with available
resources—from governmentsto private citizens—couldpurchase high-resolution
images of almost any pointon Earth.
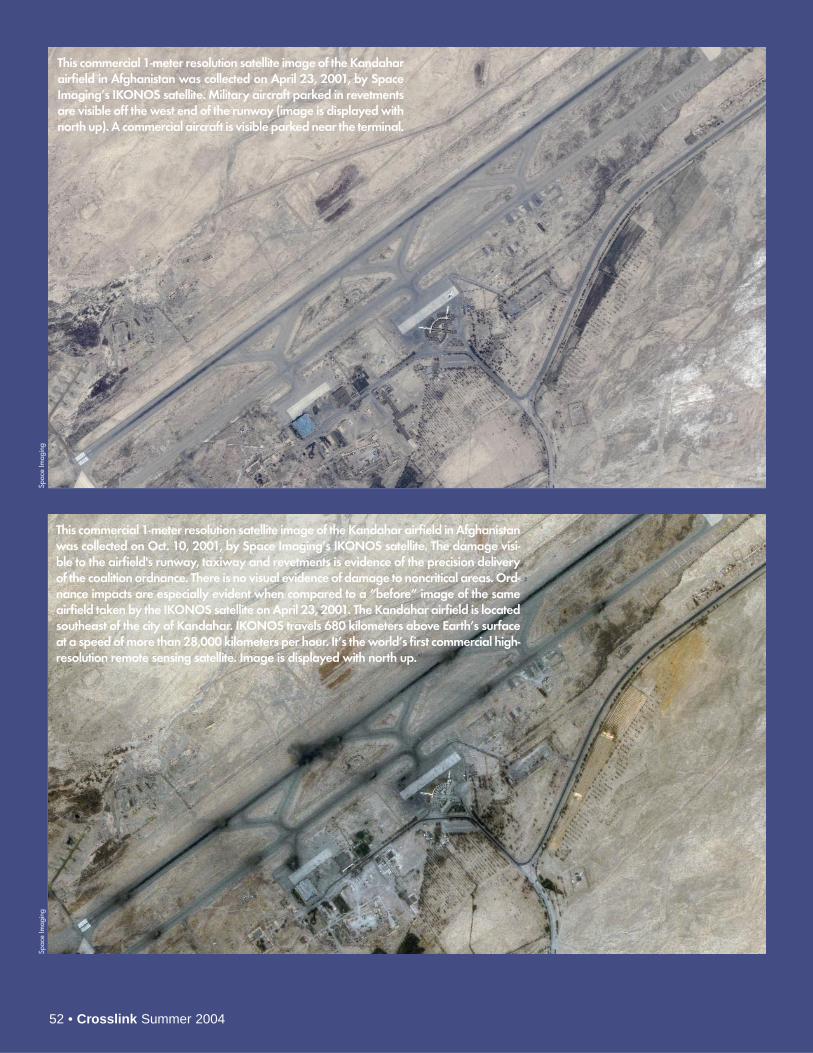
52 • Crosslink Summer 2004
This commercial 1-meter resolution satellite image of the Kandaharairfield in Afghanistan was collected on April 23, 2001, by SpaceImaging’s IKONOS satellite. Military aircraft parked in revetmentsare visible off the west end of the runway (image is displayed withnorth up). A commercial aircraft is visible parked near the terminal.
This commercial 1-meter resolution satellite image of the Kandahar airfield in Afghanistanwas collected on Oct. 10, 2001, by Space Imaging’s IKONOS satellite. The damage visi-ble to the airfield's runway, taxiway and revetments is evidence of the precision deliveryof the coalition ordnance. There is no visual evidence of damage to noncritical areas. Ord-nance impacts are especially evident when compared to a “before” image of the sameairfield taken by the IKONOS satellite on April 23, 2001. The Kandahar airfield is locatedsoutheast of the city of Kandahar. IKONOS travels 680 kilometers above Earth’s surfaceat a speed of more than 28,000 kilometers per hour. It’s the world’s first commercial high-resolution remote sensing satellite. Image is displayed with north up.
Spac
e Im
agin
gSp
ace
Imag
ing

Spac
e Im
agin
g
Crosslink Summer 2004 • 53Crosslink Summer 2004 • 53
Satellite image showing where Saddam Hussein was captured at Ad Dawr in Iraq. Thelocation of the inset is in the upper left hand corner of the larger image.
Satellite image of the area where the U.S. forces struck on the first night of the Iraq war (Dora Farm), believed to be Saddam Hussein’s bunker that night.
Spac
e Im
agin
g
Spac
e Im
agin
g
54 • Crosslink Summer 2004
Clinton directive contained no references to“geo-spatial” needs at all. The world ofcommercial remote sensing and the U.S.Government’s adoption of it as a criticalsource of information had clearly evolved.
Aerospace personnel supported the de-velopment of the Bush administration’s Na-tional Security Presidential Directive fromits inception through approval, includinginteragency debate and coordination. Evennow, Aerospace personnel are assisting inthe policy’s implemen-tation. The same Aero-space offices thathelped implementPDD-23 were tappedonce again for their un-derstanding of that di-rective as well as for their insight into for-eign governmental and commercialtechnology developments in the remote-sensing marketplace. The Aerospace policycadre assisted the government in ensuringthat the new policy was cognizant of allaspects of commercial remote-sensing pol-icy history and lessons learned. Aerospacepersonnel also ensured that policy makerspossessed a strong appreciation for the tech-nical aspects and national security and com-mercial implications of the new remote-sensing policy.
Aerospace is leading a major effort todevelop the Sensitive Technologies List,
which will provide the State Department, inits lead role for export control, with com-prehensive information about space tech-nologies and serve as a guide for decidingexport licenses for space systems, compo-nents, and technologies. Aerospace contin-ues to support the government in the negoti-ation and implementation of government-to-government agreements and other inter-national frameworks concerning the trans-fer of sensitive space technology. The Aero-
space team also supportsU.S. delegations in theirconsultations with for-eign allies on the adop-tion of effective nationalpolicies and regulatoryregimes to manage the
operation and possible proliferation ofspace technology.
Aerospace helped the NRO and Na-tional Geospatial-Intelligence Agency de-velop a strategy in 1999 that would inte-grate commercial imagery into current andfuture architectures. In 2001, Aerospaceagain assisted with further policy researchand technical analysis to support an updateof the strategy; both versions called for sig-nificant top-line funding increases for com-mercial imagery purchases, integration, andreadiness. These efforts culminated in theClearView and NextView programs. Underthe ClearView program, the National
Geospatial-Intelligence Agency agreed topurchase a minimum level of imagery dataover a five-year period; several contractshave been awarded for satellite imagerywith nominal ground sampling distances ofone meter or less. NextView moves beyondthe commodity-based approach of commer-cial imagery acquisition and seeks to ensureaccess, priority tasking rights, area cover-age, and broad licensing for sharing im-agery with all potential mission partners.Initial contracts will provide ground sam-pling distance down to half a meter.
ConclusionDevelopments in commercial remote sens-ing have required Aerospace to adapt its tra-ditional strengths to assist the U.S. Govern-ment in crafting and implementing soundpolicy for the benefit of the national secu-rity and commercial space communities.The National Geospatial-IntelligenceAgency, for example, has asked Aerospaceto help its Commercial Imagery Centermanage the NextView program and provideadvice and guidance in the creation of abranch office to manage commercial im-agery policy, plans, and strategy. Throughthese and other efforts, Aerospace will con-tinue to help U.S. defense intelligence agen-cies define, communicate, and fulfill theircritical geospatial imaging needs.
The Government Role
According to the Bush administration’s policy on commercial remote sensing, the U.S. Government will:
• Rely to the maximum practical extent on U.S. commercial remote sensing space capabilities for filling imagery and geospatial needs for military, intelligence, foreign policy, homeland security, and civil users;
• Focus U.S. Government remote sensing space systems on meeting needs that cannot be effectively, affordably, and reliably satisfied by commercial providers because of economic factors, civil mission needs, national security concerns,or foreign policy concerns;
• Develop a long-term, sustainable relationship between the U.S. Government and the U.S. commercial remote sensing space industry;
• Provide a timely and responsive regulatory environment for licensing the operations and exports of commercial remote sensing space systems; and
• Enable U.S. industry to compete successfully as a provider of remote sensing space capabilities for foreign governments and foreign commercial users, while ensuring appropriate measures are implemented to protect national security and foreign policy.
The policy established howthe government would realign
its own imagery collection efforts to meet national needs.

Crosslink Summer 2004 • 55
Bookmarks Recent Publications and Patents by the Technical Staff
Publications S. Alfano, “Determining Probability Upper
Bounds for NEO Close Approaches,”2004 Planetary Defense Conference:Protecting Earth from Asteroids (OrangeCounty, CA, Feb. 23–26, 2004), AIAAPaper 2004-1478.
P. E. Andersen, L. Thrane, H. T. Yura, A. Ty-cho, and T. M. Jorgensen, “Modeling theOptical Coherence Tomography Geome-try Using the Extended Huygens–FresnelPrinciple and Monte Carlo Simulations,”Saratov Fall Meeting 2002: OpticalTechnologies in Biophysics and MedicineIV (Oct. 14, 2003), SPIE, Vol. 5068, pp.170–181.
M. J. Barrera, “Conceptual Design of an As-teroid Interceptor for a Nuclear Deflec-tion Mission,” 2004 Planetary DefenseConference: Protecting Earth from Aster-oids (Orange County, CA, Feb. 23–26,2004), AIAA Paper 2004-1481.
J. D. Barrie, P. D. Fuqua, B. L. Jones, and N.Presser, “Demonstration of the StierwaltEffect Caused by Scatter from InducedCoating Defects in Multilayer DielectricFilters,” Thin Solid Films, Vol. 447–448,pp. 1–6 (Jan. 30, 2004).
J. Camparo, “Fluorescence Fluctuationsfrom a Multilevel Atom in a Non-stationary Phase-Diffusion Field: Deter-ministic Frequency Modulation,” Physi-cal Review A: Atomic, Molecular, andOptical Physics, Vol. 69, No. 1, pp.013802/1–11 (2004).
E. T. Campbell and L. E. Speckman, “Pre-liminary Design of Feasible Athos Inter-cept Trajectories,” 2004 Planetary De-fense Conference: Protecting Earth fromAsteroids (Orange County, CA, Feb.23–26, 2004), AIAA Paper 2004-1454.
V. Chobotov, “The Space Elevator Conceptas a Launching Platform for Earth andInterplanetary Missions,” 2004 PlanetaryDefense Conference: Protecting Earthfrom Asteroids (Orange County, CA, Feb.23–26, 2004), AIAA Paper 2004-1482.
J. G. Coffer, B. Sickmiller, and J. C. Cam-paro, “Cavity-Q Aging Observed Via anAtomic-Candle Signal,” IEEE Transac-tions on Ultrasonics, Ferroelectrics andFrequency Control, Vol. 51, No. 2, pp.139–145 (Feb. 2004).
D. DeAtkine, J. McLeroy, and J. Steele,“Department of Defense Experiments onthe International Space Station ExpressPallet,” 42nd AIAA Aerospace SciencesMeeting and Exhibit (Reno, NV, Jan.5–8, 2004), AIAA Paper 2004-0442.
M. El-Alaoui, R. L. Richard, M. Ashour-Ab-dalla, and M. W. Chen, “Low MachNumber Bow Shock Locations During aMagnetic Cloud Event: Observations andMagnetohydrodynamic Simulations,”Geophysical Research Letters, Vol. 31, p.L03813 (Feb. 4, 2004).
J. S. George, R. Koga, K. B. Crawford, P.Yu, S. H. Crain, and V. T. Tran, “SEESensitivity Trends in Non-hardened HighDensity SRAMs with Sub-micron Fea-ture Sizes,” IEEE Radiation Effects DataWorkshop Record (Monterey, CA, Jul.21–25, 2003), pp. 83–88.
D. L. Glackin, J. D. Cunningham, and C. S.Nelson, “Earth Remote Sensing withNPOESS: Instruments and Environmen-tal Data Products,” Proceedings of theSPIE—The International Society for Op-tical Engineering, Vol. 5234, No. 1, pp.123–131 (2004).
T. J. Grycewicz, T. S. Lomheim, P. W. Mar-shall, and P. LeVan, “The 2002 SEEWGFPA Roadmap,” Focal Plane Arrays forSpace Telescopes (San Diego, CA, Jan.12, 2004), SPIE, Vol. 5167, pp. 31–37.
S. G. Hanson and H. T. Yura, “ComplexABCD Matrices: an Analytical Tool forAnalyzing Light Propagation InvolvingStochastic Processes,” 19th Congress ofthe International Commission for Optics:Optics for the Quality of Life (Nov. 18,2003), SPIE, Vol. 4829, pp. 592–593.
C. B. Harris, P. Szymanski, S. Garrett-Roe,A. D. Miller, K. J. Gaffney, S. H. Liu,and I. Bezel, “Electron Solvation and Lo-calization at Interfaces,” Physical Chem-istry of Interfaces and Nanomaterials II(San Diego, CA, Dec. 8, 2003), SPIE,Vol. 5223, pp. 159–168.
A. R. Hopkins, R. A. Lipeles, and W. H.Kao, “Electrically Conducting Poly-aniline Microtube Blends,” Thin SolidFilms, Vol. 447–448, pp. 474–480 (Jan.30, 2004).
J. Huang, S. Virji, B. H. Weiller, and R. B.Kaner, “Nanostructured Polyaniline
Sensors,” Chemistry, A European Jour-nal, Vol. 10, pp. 1314–1319 (2004).
D. M. Kalitan, M. J. A. Rickard, J. M. Hall,and E. L. Petersen, “Ignition Measure-ments of Ethylene-Oxygen-Diluent Mix-tures with and without Silane Addition,”42nd AIAA Aerospace Sciences Meetingand Exhibit (Reno, NV, Jan. 5–8, 2004),AIAA Paper 2004-1323.
H. I. Kim, P. P. Frantz, S. V. Didziulis, L. C.Fernandez-Torres, and S. S. Perry, “Reac-tion of Trimethylphosphate with TiC andVC(100) Surfaces,” Surface Science, Vol.543, No. 1–3, pp. 103–117 (Oct. 1, 2003).
B. F. Knight and M. K. Hamilton, “A Pro-posed Multidimensional Analysis Func-tion,” Technologies, Systems, and Archi-tectures for Transnational Defense II(Orlando, FL, Aug. 12, 2003), SPIE, Vol.5072, pp. 80–89.
R. Koga, S. H. Crain, J. S. George, S. LaLu-mondiere, K. B. Crawford, C. S. Yu, andV. T. Tran, “Variability in Measured SEESensitivity Associated with Design andFabrication Iterations,” IEEE RadiationEffects Data Workshop Record (Mon-terey, CA, Jul. 21–25, 2003), pp. 77–82.
T. Langley, R. Koga, and T. Morris, “Single-Event Effects Test Results of 512 MBSDRAMs,” IEEE Radiation Effects DataWorkshop Record (Monterey, CA, Jul.21–25, 2003), pp. 98–101.
D. Lynch, “Comet, Asteroid, NEO Deflec-tion Experiment (CANDE)—AnEvolved Mission Concept,” 2004 Plane-tary Defense Conference: ProtectingEarth from Asteroids (Orange County,CA, Feb. 23–26, 2004), AIAA Paper2004-1479.
D. Lynch and G. Peterson, “Athos, Porthos,Aramis & Dartagnan—Four PlanningScenarios for Planetary Protection,” 2004Planetary Defense Conference: Protect-ing Earth from Asteroids (OrangeCounty, CA, Feb. 23–26, 2004), AIAAPaper 2004-1417.
V. N. Mahajan, “Zernike Polynomials andAberration Balancing,” Current Develop-ments in Lens Design and Optical Engi-neering IV (San Diego, CA, Nov. 3,2003), SPIE, Vol. 5173, pp. 1–17.
C. J. Marshall, S. C. Moss, R. E. Howard, K.A. LaBel, T. J. Grycewicz, J. L. Barth,

56 • Crosslink Summer 2004
Bookmarks Continued
and D. Brewer, “Carrier Plus: a SensorPayload for Living With a Star Space En-vironment Testbed (LWS/SET),” FocalPlane Arrays for Space Telescopes (SanDiego, CA, Jan. 12, 2004), SPIE, Vol.5167, pp. 216–222.
T. N. Mundhenk, N. Dhavale, S. Marmol, E.Calleja, V. Navalpakkam, K. Bellman, C.Landauer, M. A. Arbib, and L. Itti, “Uti-lization and Viability of Biologically In-spired Algorithms in a Dynamic Multi-agent Camera Surveillance System,”Intelligent Robots and Computer VisionXXI: Algorithms, Techniques, and ActiveVision (Providence, RI, Oct. 1, 2003),SPIE, Vol. 5267, pp. 281–292.
D. Pack, B. B. Yoo, E. Tagliaferri, “SatelliteSensor Detection of a Major MeteorEvent in the United States on 27 March2003: The Park Forest, Illinois Bolide,”2004 Planetary Defense Conference:Protecting Earth from Asteroids (OrangeCounty, CA, Feb. 23–26, 2004), AIAAPaper 2004-1407.
G. Peterson, “NEO Orbit Uncertainties andTheir Effect on Risk Assessment,” 2004Planetary Defense Conference: Protect-ing Earth from Asteroids (OrangeCounty, CA, Feb. 23–26, 2004), AIAAPaper 2004-1420.
G. Peterson, “Delta-V Requirements forDEFT Scenario Objects (DefinedThreat),” 2004 Planetary Defense Con-ference: Protecting Earth from Asteroids(Orange County, CA, Feb. 23–26, 2004),AIAA Paper 2004-1475.
L. B. Rainey, Space Modeling and Simula-tion: Roles and Applications Throughoutthe System Life Cycle (The AerospacePress and American Institute of Aeronau-tics and Astronautics, Inc., El Segundo,CA, 2004).
D. D. Sawall, R. M. Villahermosa, R. A.Lipeles, and A. R. Hopkins, “InterfacialPolymerization of Polyaniline Nano-fibers Grafted to Au Surfaces,” Chem-istry of Materials, Vol. 16, No. 9, pp.1606–1608 (2004).
T. Scalione, H. W. Swenson, F. De Luccia,C. Schueler, J. E. Clement, and L. Darn-ton, “Post-CDR NPOESS VIIRS SensorDesign and Performance,” Sensors, Sys-tems, and Next-Generation Satellites VII(Barcelona, Spain, Feb. 2, 2004), SPIEVol. 5234, pp. 144–155.
S. S. Shen, “Spectral Quality Equation Re-lating Collection Parameters to Object/Anomaly Detection Performance,” Algo-rithms and Technologies for Multi-spectral, Hyperspectral, and Ultra-spectral Imagery IX (Orlando, FL, Sept.24, 2003), SPIE, Vol. 5093, pp. 29–36.
P. L. Smith, M. J. Barrera, E. T. Campbell,K. A. Feldman, G. E. Peterson, and G. N.Smit, “Deflecting a Near-Term Threat—Mission Design for the All-Out NuclearOption,” 2004 Planetary Defense Con-ference: Protecting Earth from Asteroids(Orange County, CA, Feb. 23–26, 2004),AIAA Paper 2004-1447.
R. L. Thornton, R. L. Phillips, and L. C. An-drews, “Laser Communications UtilizingMolniya Satellite Orbits,” Free-SpaceLaser Communication and Active LaserIllumination III (San Diego, CA, Jan. 27,2004), SPIE, Vol. 5160, pp. 292–301.
S. Virji, J. Huang, R. B. Kaner, and B. H.Weiller, “Polyaniline Nanofiber Gas Sen-sors: Examination of Response Mecha-nisms,” Nano Letters, Vol. 4, No. 3, pp.491 (Mar. 1, 2004).
R. L. Walterscheid, G. Schubert, and D. G.Brinkman, “Acoustic Waves in the UpperMesosphere and Lower ThermosphereGenerated by Deep Tropical Convec-tion,” Journal of Geophysical ResearchA: Space Physics, Vol. 108, No. A11(Nov. 2003).
C. C. Wang and D. J. Sklar, “Metric Trans-formation for a Turbo-Coded DPSKWaveform,” Journal of Wireless Commu-nication and Mobile Computing, Vol. 3,No. 5, pp. 609–616 (Aug. 2003).
B. H. Weiller, P. D. Fuqua, and J. V. Osborn,“Fabrication, Characterization, and Ther-mal Failure Analysis of a Micro HotPlate Chemical Sensor Substrate,” Jour-nal of the Electrochemical Society, Vol.151, No. 3, pp. H59–H65 (Feb. 5, 2004).
J. E. Wessel, R. W. Farley, and S. M. Beck,“Lidar for Calibration/Validation ofMicrowave Sounding Instruments,” Li-dar Remote Sensing for EnvironmentalMonitoring IV (San Diego, CA, Dec. 29,2003), SPIE, Vol. 5154, pp. 161–169.
S. Yongkun and N. Presser, “TunableInGaAsP/InP DFB Lasers at 1.3 µmIntegrated with Pt Thin Film HeatersDeposited by Focused Ion Beam,”
Electronics Letters, Vol. 39, No. 25, pp.1823–1825 (Dec. 11, 2003).
C. C. Yui, G. M. Swift, C. Carmichael, R.Koga, and J. S. George, “SEU MitigationTesting of Xilinx Virtex II FPGAs,”IEEE Radiation Effects Data WorkshopRecord (Monterey, CA, Jul. 21–25,2003), pp. 92–97.
H. T. Yura and S. G. Hanson, “Variance ofIntensity for Gaussian Statistics and Par-tially Developed Speckle in ComplexABCD Optical Systems,” Communica-tions, Vol. 228, No. 4–6, pp. 263–270(Dec. 15, 2003).
PatentsS. Alfano, F. K. Chan, M. L. Greer, “Eigen-
value Quadric Surface Method for Deter-mining When Two Ellipsoids ShareCommon Volume for Use in Spatial Col-lision Detection and Avoidance,” U.S.Patent No. 6,694,283, Feb. 2004.
This computationally efficient analyticalmethod can determine whether twoquadric surfaces have common spatialpoints or share the same volume. Thetechnique can be used to asses the risk ofcollision by two orbiting bodies: the fu-ture state of each object is represented bya covariance-based ellipsoid, and theseellipsoids are then analyzed to seewhether they intersect. If so, then a colli-sion risk is indicated. The method in-volves adding an extra dimension to thesolution space, providing an extra dimen-sional product matrix. The eigenvaluesfrom this matrix are examined to identifyany that are associated with degeneratequadric surfaces. If any are found, theyare further examined to identify thosethat are associated with intersecting de-generate quadric surfaces. The methodprovides direct share-volume resultsbased on comparisons of the eigenvalues,which can be rapidly computed. Themethod can also be used to determinewhether two ellipses only appear to sharethe same projected area based on view-ing angle.
R. B. Dybdal and D. D. Pidhayny, “Methodof Tracking a Signal from a Moving Sig-nal Source,” U.S. Patent No. 6,731,240,May 2004.
Signals emanating from a moving sourcecan be tracked by exploiting estimated
Crosslink Summer 2004 • 57
variations in the motion of the source.Signal strength values are measured atopen-loop-commanded angular offsetsfrom the a priori estimated signal posi-tion and used to correct the antenna’salignment. In the case of an orbitingsatellite, the estimated satellite locationis computed from the satellite’s ephe-meris. The signal sampling at the angularoffsets varies with the anticipated dy-namics of the satellite’s motion as ob-served from the antenna’s location. Thecommanded angular offsets are alongand orthogonal to the direction of thesignal source motion—i.e., in-track andcross-track. Signal power measurementsare used not only to correct the antennadirection but also to support decisions onwhen to revalidate the step-trackalignment.
S. W. Janson, J. E. Pollard, C-C. Chao,“Method for Deploying an OrbitingSparse Array Antenna,” U.S. Patent No.6,725,012, April 2004.
A cluster of small, free-flying satellitescan be kept in rigid formation despitenatural perturbing forces. Orbital param-eters are chosen so that each satellite oc-cupies a node in a spatial pattern that re-volves around a real or fictitious centralsatellite in a frozen inclined eccentricEarth orbit. When the cluster’s plane ofrotation is inclined 60 degrees relative tothe central satellite’s orbit plane, thecluster appears to rotate like a wheel.Otherwise, the radial distances betweenthe center point and the satelliteslengthen and decrease twice per orbitaround Earth, and the cluster moves as anonrigid elliptical body. In all cases, theshape of the formation is maintained andall satellites return to their initial positiononce per revolution around Earth. Fuel-efficient microthrusting is all that’sneeded to maintain the formation forlong periods. The technique is useful forpositioning satellites as the elements in asparse-aperture array, which can have anoverall dimension from tens of meters tothousands of kilometers. The satellitesremain spatially fixed with respect toeach other within a fraction of the aver-age interelement spacing, eliminating thepossibility of intersatellite collisionswhile providing a slowly changingantenna sidelobe distribution.
R. Kumar, “Adaptive Smoothing System forFading Communication Channels,” U.S.Patent No. 6,693,979, Feb. 2004.
This adaptive smoother enhances the per-formance of radio-frequency receiversdespite the amplitude variations caused byionospheric scintillation or due to anyother amplitude fading mechanism. Thesystem can compensate for the loss due tofading of coherently modulated communi-cation and navigation signals, includingGPS. It employs an adaptive phase-lockloop based on a Kalman filter to providephase estimations, a high-order estimatorto compute rapidly varying dynamicamplitude, and an adaptive fixed-delaysmoother to provide improved code-delayand carrier-phase estimates. Simulationsshow a performance improvement of 6–8decibels when the adaptive smoother em-ploys all three components. The simula-tions show that the adaptive smoother, op-erating under realistic channel-fade rates,can compensate for any loss in trackingperformance caused by amplitude fading.
S. S. Osofsky, P. E. Hanson, “Adaptive Inter-ference Cancellation Method,” U.S.Patent No. 6,724,840, April 2004.
Developed for use as part of a widebandcommunications receiver, this adaptivesystem isolates and cancels unwanted sig-nals having predetermined frequency, am-plitude, and modulation criteria. The sys-tem works by continuously scanning afrequency bandwidth. Detected signals areparameterized, and these parameters arecompared with the definition of an unde-sired signal stored in a microcontroller.When an undesirable signal is detected ata particular frequency location, a refer-ence path gets tuned to that location. Thereference path serves to isolate the unde-sired signal, which is then phase-inverted,amplified, and vector-summed with the in-put signal stream, which is delayed for co-herent nulling. The unwanted signal issuppressed in the composite signal, leav-ing only the desired signal. The micro-controller also monitors and adjusts thereference path to adaptively minimize anyresidual interfering signal and respond tochanges in interference. The system oper-ates from 100–160 megahertz and can gen-erate wideband nulls over a 5-megahertzbandwidth with a 15-decibel attenuationdepth or narrowband nulls of 30 decibels.
R. P. Patera, G. E. Peterson, “Vehicular Tra-jectory Collision Avoidance Maneuver-ing Method,” U.S. Patent No. 6,691,034,Feb. 2004.
Applicable to aircraft, launch vehicles,satellites, and spacecraft, this analyticmethod assesses the risk of an objectcolliding with another craft or debris anddetermines the optimal avoidance ma-neuver. Screening out bodies that poseno risk, the method first determines whenthe vehicle will come close enough to aforeign object to raise the possibility of acollision. It then determines the probabil-ity of collision. If the probability exceedsa predetermined threshold, the methodthen determines an avoidance maneuver,charting the direction, magnitude, andtime of thrust to bring the probability be-low the threshold using the least propel-lant possible. The method uses variousprocesses, including conjunction deter-minations through trajectory propaga-tion, collision probability predictionthrough coordinate rotation and scalingbased on error-covariance matrices, andnumerical searching for optimal avoid-ance maneuvers.
J. Penn, “X33 Aeroshell and Bell NozzleRocket Engine Launch Vehicle,” U.S.Patent No. 6,685,141, Feb. 2004.
This work defines a class of launch vehi-cles characterized by one or more rocketstages, each attached to a separate stagethat supplies liquid propellant. The rocketstages use X33 aeroshell flight-control sur-faces and can be equipped with three, four,or five bell-nozzle engines. Each rocketstage can be a booster or an orbiter with apayload bay. The feeding stage can be anexternal tank (no engine) or a core stagewith two bell-nozzle engines and a payloadbay. One possible configuration would be alaunch vehicle having a single orbiter withfive engines attached to an external tank.Another version would be a three-engineorbiter with a four-engine booster, bothattached to an external tank; in this case,the four-engine booster augments both thethrust and the propellant-load capability ofthe system, thereby increasing payloadcapacity. In a third form, a four-engine or-biter with a four-engine booster is attachedto an external tank. Alternatively, two X33four-engine boosters can be attached to acore stage to provide ultraheavy lift.

Dennis Jones is Director, Center for Space Policy and Strategy, in Aero-space’s Rosslyn office. Prior to joining Aerospace, heserved as imagery analyst in the Central IntelligenceAgency and served on the White House Drug Policy Of-fice’s National Security staff. From 1994 to 2000, he sup-ported the NRO Office of Policy in the execution of its in-ternational and commercial responsibilities, includingcommercial remote-sensing policy development and im-plementation. He has also worked for a commercial
remote-sensing company as well as for U.S. defense and intelligence pro-grams. He holds a Master of Governmental Administration degree from theUniversity of Pennsylvania ([email protected]).
Lindsay Tilney, Senior Project Engineer, is responsible for developingtechnical courses for members of technical staff andtheir primary customers. She has more than 19 years ofexperience in the aerospace industry, including satellitesoftware design and analysis, flight planning for spaceshuttle payloads, ground system design, on-orbit testing,and satellite system software modeling and simulation.She holds a B.S. in mathematics and computer sciencefrom UCLA. She joined Aerospace in 1986 (lindsay. [email protected]).
Thomas Hayhurst is Director of the Sensing and Exploitation Depart-ment in the Electronic Systems Division, which sup-ports the development of electro-optical remote-sensingpayloads with end-to-end system performance modelingand engineering trade studies. He joined the AerospaceChemistry and Physics Laboratory in 1982 and beganby studying phenomena that produce infrared emissionsin space and their effects on space surveillance systems.In 1991, he joined the Sensing and Exploitation Depart-
ment and shifted focus toward electro-optical sensor design and systemperformance issues. He has a Ph.D. in physics from the University of Cali-fornia at Berkeley ([email protected]).
David L. Glackin is Senior Engineering Specialist in the Sensing and Ex-ploitation Department, where he specializes in remotesensing science and technology and in solar astronomy.He came to Aerospace from JPL in 1986 and has sup-ported a range of NASA, JPL, NOAA, DOD, and WhiteHouse programs. These include DMSP, NPOESS, andthe Interagency Working Group on Earth Observation.He holds an M.S. in astrogeophysics from the Univer-sity of Colorado. He is the author of Civil, Commercial,
and International Remote Sensing Systems and Geoprocessing, publishedby The Aerospace Press/AIAA ([email protected]).
Steve Cota, Senior Project Leader, Sensor Engineering and Exploitation De-partment, is responsible for assessing sensor performancefor civil and national security programs. He has led thePICASSO project since its inception and has been activein applying atmospheric modeling codes to sensor per-formance problems. He served as an advisor during thesource selection for the NPOESS Visible/Infrared Imager/Radiometer Suite and Aerosol Polarimetry Sensor. Hejoined Aerospace in 1987 and worked in the area of sensor
performance modeling and image exploitation until 1990. After a brief termat Martin Marietta Astronautics, he returned to Aerospace in 1992 to supportthe Systems Planning and Development Department. From 1994 until 1998,he supported the Air Force Program Executive Officer for Space. He has aPh.D. in astronomy from Ohio State University ([email protected]).
58 • Crosslink Summer 2004
Frederick S. Simmons retired from Aerospace in 1998, after 50 years inthe industry. He continues as a consultant for the Space-Based Infrared Systems programs. Since joining Aero-space in 1971, he served as principal investigator for aprogram of missile observations from a U-2 aircraft andproject engineer for Project Chaser and the Multispec-tral Measurement Program. As an advisor to DARPA,he coordinated studies under the Plume Physics andEarly Warning Programs of the Strategic Technology
Office and served as consultant for the Teal Ruby. As an advisor to SDIOand BMDO, he served on the Phenomenology Steering and AnalysisGroup and was principal investigator for several experiments involvinginfrared observations. He is the author of Rocket Exhaust Plume Phenome-nology, published by The Aerospace Press/AIAA. He received The Aero-space Corporation President’s Award in 1983 ([email protected]).
Contributors
Commercial Remote Sensing and National Security
Leslie O. Belsma of Space Support Division supports both the DMSP andNPOESS program offices. She also manages an InternalResearch and Development project to demonstrate the useof satellite data to improve high-resolution weather fore-casting in support of air-quality and homeland-security ap-plications. She promotes the use of satellite data for air-quality applications through presentations to the civilair-quality community. A retired Air Force weather officerwith an M.S. in aeronomy from the University of Michi-
gan, she joined Aerospace in 1999 ([email protected]).
Detecting Air Pollution from Space
Daniel D. Evans, Senior Engineering Specialist, Radar and Signal SystemsDepartment, has more than 30 years of experience in radarphenomenology, radar processing, radar mode design, andradar systems. He joined Aerospace in 1997 and received aCorporate Individual Achievement Award in 2002 for de-velopment of a detection algorithm in support of the cor-poration’s national security mission. Evans often serves asan independent reviewer for NASA technology develop-ment programs. He has a Ph.D. in mathematics from
UCLA and an M.B.A. from California State University, Los Angeles ([email protected]).
Active Microwave Remote Sensing
Engineering and Simulation of Electro-Optical Remote-Sensing Systems
Earth Remote Sensing: An Overview
The Infrared Background Signature Survey
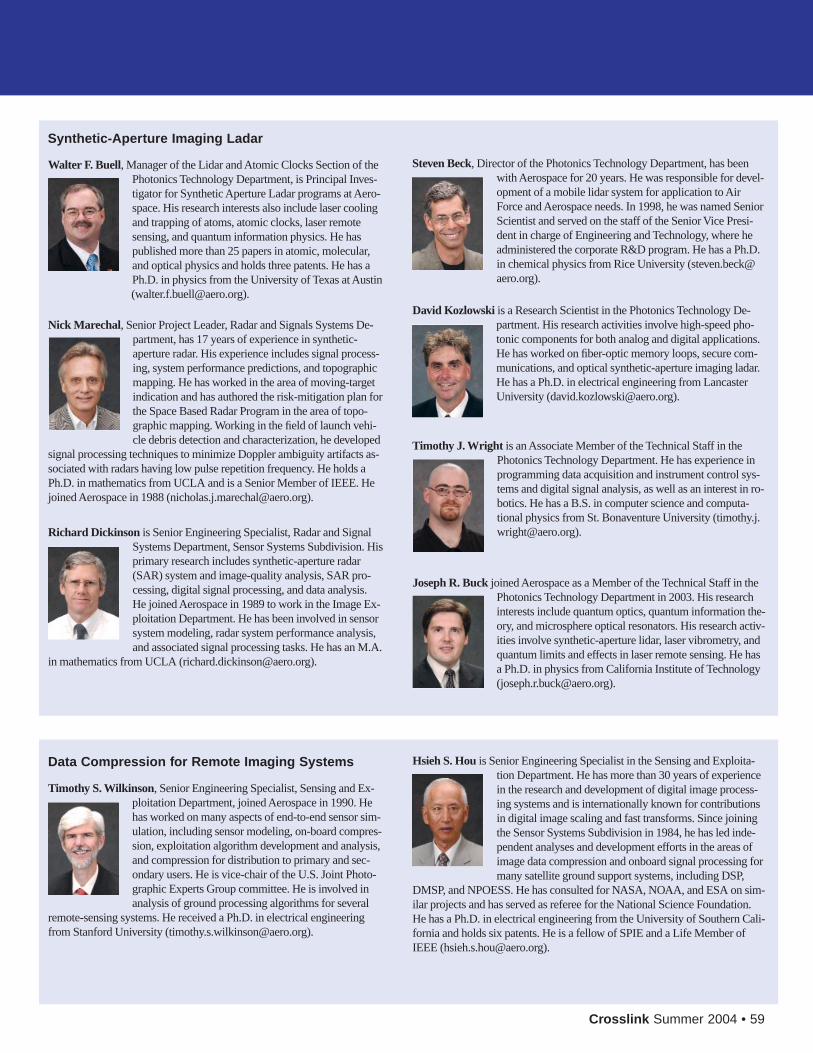
Walter F. Buell, Manager of the Lidar and Atomic Clocks Section of thePhotonics Technology Department, is Principal Inves-tigator for Synthetic Aperture Ladar programs at Aero-space. His research interests also include laser coolingand trapping of atoms, atomic clocks, laser remotesensing, and quantum information physics. He haspublished more than 25 papers in atomic, molecular,and optical physics and holds three patents. He has aPh.D. in physics from the University of Texas at Austin ([email protected]).
Nick Marechal, Senior Project Leader, Radar and Signals Systems De-partment, has 17 years of experience in synthetic-aperture radar. His experience includes signal process-ing, system performance predictions, and topographicmapping. He has worked in the area of moving-targetindication and has authored the risk-mitigation plan forthe Space Based Radar Program in the area of topo-graphic mapping. Working in the field of launch vehi-cle debris detection and characterization, he developed
signal processing techniques to minimize Doppler ambiguity artifacts as-sociated with radars having low pulse repetition frequency. He holds aPh.D. in mathematics from UCLA and is a Senior Member of IEEE. Hejoined Aerospace in 1988 ([email protected]).
Joseph R. Buck joined Aerospace as a Member of the Technical Staff in thePhotonics Technology Department in 2003. His researchinterests include quantum optics, quantum information the-ory, and microsphere optical resonators. His research activ-ities involve synthetic-aperture lidar, laser vibrometry, andquantum limits and effects in laser remote sensing. He hasa Ph.D. in physics from California Institute of Technology([email protected]).
Richard Dickinson is Senior Engineering Specialist, Radar and SignalSystems Department, Sensor Systems Subdivision. Hisprimary research includes synthetic-aperture radar(SAR) system and image-quality analysis, SAR pro-cessing, digital signal processing, and data analysis.He joined Aerospace in 1989 to work in the Image Ex-ploitation Department. He has been involved in sensorsystem modeling, radar system performance analysis,and associated signal processing tasks. He has an M.A.
in mathematics from UCLA ([email protected]).
David Kozlowski is a Research Scientist in the Photonics Technology De-partment. His research activities involve high-speed pho-tonic components for both analog and digital applications.He has worked on fiber-optic memory loops, secure com-munications, and optical synthetic-aperture imaging ladar.He has a Ph.D. in electrical engineering from LancasterUniversity ([email protected]).
Steven Beck, Director of the Photonics Technology Department, has beenwith Aerospace for 20 years. He was responsible for devel-opment of a mobile lidar system for application to AirForce and Aerospace needs. In 1998, he was named SeniorScientist and served on the staff of the Senior Vice Presi-dent in charge of Engineering and Technology, where headministered the corporate R&D program. He has a Ph.D.in chemical physics from Rice University ([email protected]).
Hsieh S. Hou is Senior Engineering Specialist in the Sensing and Exploita-tion Department. He has more than 30 years of experiencein the research and development of digital image process-ing systems and is internationally known for contributionsin digital image scaling and fast transforms. Since joiningthe Sensor Systems Subdivision in 1984, he has led inde-pendent analyses and development efforts in the areas ofimage data compression and onboard signal processing formany satellite ground support systems, including DSP,
DMSP, and NPOESS. He has consulted for NASA, NOAA, and ESA on sim-ilar projects and has served as referee for the National Science Foundation.He has a Ph.D. in electrical engineering from the University of Southern Cali-fornia and holds six patents. He is a fellow of SPIE and a Life Member ofIEEE ([email protected]).
Crosslink Summer 2004 • 59
Timothy S. Wilkinson, Senior Engineering Specialist, Sensing and Ex-ploitation Department, joined Aerospace in 1990. Hehas worked on many aspects of end-to-end sensor sim-ulation, including sensor modeling, on-board compres-sion, exploitation algorithm development and analysis,and compression for distribution to primary and sec-ondary users. He is vice-chair of the U.S. Joint Photo-graphic Experts Group committee. He is involved inanalysis of ground processing algorithms for several
remote-sensing systems. He received a Ph.D. in electrical engineeringfrom Stanford University ([email protected]).
Data Compression for Remote Imaging Systems
Timothy J. Wright is an Associate Member of the Technical Staff in thePhotonics Technology Department. He has experience inprogramming data acquisition and instrument control sys-tems and digital signal analysis, as well as an interest in ro-botics. He has a B.S. in computer science and computa-tional physics from St. Bonaventure University ([email protected]).
Synthetic-Aperture Imaging Ladar

The Back Page
Peering through his homemade telescope nearly 400 years ago, Galileo first laideyes on the four largest moons of Jupiter, now known as Io, Europa,Ganymede, and Callisto. His observations caused a notorious stir amonghis contemporaries, forcing a profound shift in the accepted model of
the cosmos.It’s only fitting, then, that Galileo’s namesake spacecraft should cause
an equal sensation by indicating that these moons might hold vast salt-water oceans beneath their icy surfaces. Indeed, data from the Galileocraft suggest that liquid water on Europa made contact with the sur-face in geologically recent times and may still lie relatively close tothe surface. If so, Europa could potentially harbor life.
Based on this possibility, NASA is developing ambitiousplans for a new mission—the Jupiter Icy Moons Orbiter, orJIMO—that would orbit Callisto, Ganymede, and Europa toinvestigate their makeup, history, and potential for sustaininglife. Sending a spacecraft halfway across the solar system ishard enough, but getting it into and out of three separate lu-nar orbits will be a tremendous feat, requiring a significantamount of energy. Thus, JIMO will be a new type ofspacecraft, driven by nuclear-generated ion propulsion.The technology will be challenging, but the rewards willbe significant: An onboard reactor could support an im-pressive suite of instruments far superior to anythingthat could be sent using traditional solar and batterypower. It could even be used to beam power to a probeor lunar lander.
Aerospace has been lending its technical expertiseto the JIMO project. For example, as part of the High-Capability Instrument Concept study, Aerospacehelped develop a baseline design for a suite of instru-ments that can take advantage of the large power supplyto achieve high sensitivity, spatial resolution, spectralresolution, duty cycle, and data rates. The candidate in-struments included a visible and infrared imagingspectrometer, a thermal mapper, a laser al-timeter, a multispectral laser surface-reflection spectrometer, an interfero-metric synthetic-aperture radar, apolarimetric synthetic-apertureradar, a subsurface radar sounder,and a radio plasma sounder. In ad-dition to generating basic specifi-cations for each instrument, Aero-space explored a number of designoptions to delineate critical trade-offs. Driving technologies for eachinstrument type were identified, as well
Jupiter’s Newest Satellite
JPL

as an estimate of theneeded developmenttime. The laser spectro-meter, for example, isan entirely new instru-ment, and the multispec-tral selective-reflectionlidar is based on capabili-ties that are available in theindustry but do not exist in a sin-gle design.
Aerospace also performed the cov-erage analysis for JIMO, including verification ofmaximum revisit times for various inclinations andaltitudes and access coverage for the entire moon of Eu-ropa. The Revisit program, a software tool developed byAerospace, was used for the visualization and computa-tion. Key results from the study included an analysis of thefields of view needed to achieve the desired mapping cov-erage. In some cases, the analysis prompted a change insensor configuration to accommodate sunlight constraints.This analysis also helped define duty cycles that would re-duce the amount of data being sent back to Earth withoutcompromising overall performance.
In a related effort, Aerospace engineers analyzed thetelecommunications needed for the return of data from theJIMO instruments—and derived a target specification ofroughly 233 megabytes per second. Key considerations in-cluded loss of communication due to blockage fromJupiter, the sun, and the Jovian moons and the enormousamount of sensor data (even with onboard processing) thatwill need to be sent. Aerospace provided three systemoptions: direct radio-frequency communication using a 3-or 5-meter dish at 35 gigahertz; laser communication usingmultiple lasers in the terahertz band; and radio-frequencycommunication via a relay satellite trailing JIMO.
One particular challenge facing JIMO is the harsh ra-diation environment. Jupiter has trapped proton and elec-tron belts, much like Earth; however, the Jovian trappedelectron environment is much more severe. Planning forthis environment will require some new approaches be-cause the most problematic particle around Jupiter is thehigh-energy electron—not the proton, which is the primaryconcern around Earth. Aerospace analyses indicate that theradiation challenges are not insurmountable: If commercialintegrated circuits continue to evolve at their present rate,they should allow significant improvements in radiationhardness and better protection for both analog and digitalflight electronics, including focal planes. Better inherent
radiation resistance, along withproper shielding design, should allowJIMO to survive. Still, JIMO willneed to overcome the data corruptionthat will occur as sensitive imagers
and spectrometers attempt to collectdata in the midst of this severe
radiation. As part of the conceptual mission
studies, Aerospace performed independentcost estimates for various configurations and de-
sign iterations. The main trades consisted of varyingpower-conversion types, nuclear-reactor types, and powerlevels. The cost analysis emphasized technology forecast-ing, risk, radiation hardening, schedule penalty, calibrationof the primary contractor’s historical programs, safetyspecifications, and responsiveness to other program-man-agement and engineering issues. After each design itera-tion, the Aerospace and contractor teams met to reconciletheir cost estimates. This proved especially valuable be-cause Aerospace was able to influence contractor costestimates and, in certain cases, the contractor’s costmethodology.
NASA hopes to launch JIMO early in the nextdecade—and it will probably take another six years toreach its destination. So, it will take some while before sci-entists crack the secrets of Jupiter’s frozen moons. In themeantime, Aerospace will continue to support the programas needed, joining NASA and other organizations in hon-oring and advancingGalileo’s greatlegacy.

The Aerospace CorporationP.O. Box 92957Los Angeles, CA 90009-2957
FIRST CLASSU.S. POSTAGE
PAIDPermit No. 125
El Segundo, Calif.
Return Service Address
Summer 2004 Vol. 5 No. 2Crosslink
Editor in ChiefDonna J. Born
EditorGabriel Spera
Guest EditorThomas Hayhurst
Contributing EditorSteven R. Strom
Staff EditorJon Bach
Art DirectorRichard Humphrey
IllustratorJohn A. Hoyem
PhotographerMike Morales
Editorial BoardMalina Hills, ChairDavid A. Bearden
Donna J. BornLinda F. Brill
John E. ClarkDavid J. EvansIsaac GhozeilLinda F. Halle
David R. HickmanMichael R. Hilton
John P. HurrellWilliam C. KrenzMark W. MaierMark E. Miller
John W. MurdockMabel R. Oshiro
Fredric M. Pollack
Corporate OfficersWilliam F. Ballhaus Jr.
President and CEO
Joe M. Straus
Executive Vice President
Wanda M. Austin
Stephen E. Burrin
Marlene M. Dennis
Jerry M. Drennan
Lawrence T. Greenberg
Ray F. Johnson
Gordon J. Louttit
John R. Parsons
Donald R. Walker
Dale E. Wallis
John R. Wormington
Copyright 2004 The Aerospace Corporation. All rights reserved. Permission to copy orreprint is not required, but appropriate credit must be given to The Aerospace Corporation.
Crosslink (ISSN 1527-5264) is published by The Aerospace Corporation, an independent,nonprofit corporation dedicated to providing objective technical analyses and assessmentsfor military, civil, and commercial space programs. Founded in 1960, the corporation oper-ates a federally funded research and development center specializing in space systems archi-tecture, engineering, planning, analysis, and research, predominantly for programs managedby the Air Force Space and Missile Systems Center and the National Reconnaissance Office.
For more information about Aerospace, visit www.aero.org or write to Corporate Com-munications, P.O. Box 92957, M1-447, Los Angeles, CA 90009-2957.
For questions about Crosslink, send email to [email protected] or write to The Aero-space Press, P.O. Box 92957, Los Angeles, CA 90009-2957. Visit the Crosslink Web site atwww.aero.org/publications/crosslink.
Board of TrusteesBradford W. Parkinson, Chair
Howell M. Estes III, Vice Chair
William F. Ballhaus Jr.
Richard E. Balzhiser
Guion S. Bluford Jr.
Donald L. Cromer
Daniel E. Hastings
Jimmie D. Hill
John A. McLuckey
Thomas S. Moorman Jr.
Dana M. Muir
Ruth L. Novak
Sally K. Ride
Robert R. Shannon
Donald W. Shepperd
Jeffrey H. Smith
K. Anne Street
John H.Tilelli Jr.
Robert S. Walker