earth and planetary science letters - unimi.itusers.unimi.it/paleomag/papers/lanci+2010.pdf · 232...
TRANSCRIPT

Earth and Planetary Science Letters 292 (2010) 231–237
Contents lists available at ScienceDirect
Earth and Planetary Science Letters
j ourna l homepage: www.e lsev ie r.com/ locate /eps l
Astronomical tuning of the Cenomanian Scaglia Bianca Formation at Furlo, Italy
Luca Lanci a,c,⁎, Giovanni Muttoni b,c, Elisabetta Erba b
a DIGEOTECA, University of Urbino, Campus Scientifico SOGESTA, 61100, Urbino (PU), Italyb Dipartimento di Scienze della Terra “A.Desio”, Università degli Studi di Milano, Via Mangiagalli 34, 20133 Milano, Italyc ALP — Alpine Laboratory of Paleomagnetism, via Madonna dei Boschi 76, 12016 Peveragno (CN), Italy
⁎ Corresponding author. Also at School of Earth anWestern Australia, 35 Stirling Highway, Crawley WA, 60
E-mail addresses: [email protected], luca.lan
0012-821X/$ – see front matter © 2010 Elsevier B.V. Adoi:10.1016/j.epsl.2010.01.041
a b s t r a c t
a r t i c l e i n f oArticle history:Received 30 August 2009Received in revised form 26 January 2010Accepted 26 January 2010Available online 16 February 2010
Editor: P. DeMenocal
Keywords:Cenomanianblack shalesBonarelli Levelrock magnetismcyclostratigraphy
The astronomical tuning of the upper Cenomanian rhythmic succession of marine limestones and blackshales that prelude to the Bonarelli Level (=Oceanic Anoxic Event 2) in the classic Furlo section of centralItaly was achieved using cyclostratigraphic analyses on environmentally controlled rock-magnetic propertiesand the CaCO3 content of the limestones. The astronomical tuning was based on the stable 405 kyr-longeccentricity cycle observed in the rock-magnetic record and correlated to the orbital solution of Laskar et al.(2004), and the phase relationship was established by the eccentricity-modulated precession signalobserved in the CaCO3 record. According to our tuning, pre-Bonarelli black shales formed during eccentricityminima and reduced seasonality when reduced deep-water circulation (sea bottom ventilation) in apaleogeographically constricted Alpine Tethys–Central Atlantic Ocean promoted organic matter preservationand possibly a reduced carbonate dissolution resulting in a higher sedimentation rate. In compliance, theonset of the OAE2 at Furlo corresponds to the eccentricity minimum nominally placed at 93.92 Ma, with thefull development of OAE2 persisting much longer than any black shale precursor across at least one longeccentricity maximum.
d Environment, University of09, [email protected] (L. Lanci).
ll rights reserved.
© 2010 Elsevier B.V. All rights reserved.
1. Introduction
In the Furlo Gorge of central Italy (Fig. 1a), the Bonarelli Level isexposed at the top of a 20 m-thick section of upper Cenomanianlimestones and black shales pertaining to the Scaglia BiancaFormation. It represents the local sedimentary expression of OceanicAnoxic Event (OAE) 2 (e.g., Arthur and Premoli Silva, 1982), and theassociated δ13Corg positive excursion (e.g., Tsikos et al., 2004; Kurodaet al., 2007; Mort et al., 2007) (Fig. 2). Black shale deposition acrossthe OAE2 appears global in nature as it was recognized in all mainoceanic basins (Arthur et al., 1990). Furthermore, the record from thenearby Abruzzi platform shows that the Bonarelli Level correspondsto a phase of fast sea-level rise (drawn platform) that was correlatedworldwide and related to climate changes (Galeotti et al., 2009).
Rhythmic episodes of organic matter accumulation resulting in thedeposition of thin black shale layers occur below the Bonarelli Level(Coccioni and Galeotti, 2003). Pre-Bonarelli black shales of Cenomanianage seem to be a regional feature of the Alpine Tethys Ocean and theadjacent Central Atlantic Ocean (Italian Apennines as well as Deep SeaDrilling Project and Ocean Drilling Program sites in the Iberia abyssalplain, Galicia margin, Newfoundland basin, Blake Nose, Demerara rise,and Cape Verde basin).
Twomainmodels have been proposed to explain the preservation oforganic matter within pre-Bonarelli black shales, namely the anti-monsoonal model, originally developed for the Aptian–Albian blackshales of the Marne a Fucoidi Fm., which lies immediately below theScaglia Bianca Fm. (Herbert and Fischer, 1986), and the monsoonalmodel, developed for Pliocene–Pleistocene Mediterranean sapropels(Rossignol-Strick, 1985;Hilgen, 1991a; Hilgen et al., 1995) and, recentlyapplied to Cenomanian black shales byMitchell et al. (2008). Accordingto the anti-monsoonal model, black shales were deposited duringperiods of low orbital forcing leading to reduced seasonal contrast anddeep-water formation, and resulting in decreased sea bottom ventila-tion, deep-intermediate water mass hypoxia and enhanced preserva-tion of organic matter (Herbert and Fischer, 1986).
According to the monsoonal model, Pliocene–Pleistocene sapropelswere deposited in the eastern Mediterranean Sea at times of intense(northern) summer monsoons (Rossignol-Strick, 1985) during eccen-tricitymaximawhen the seasonal contrast in theNorthernHemisphere—and hence monsoonality — was significantly increased, enhancing flooddischarge in theMediterraneanSea thatpreventeddeep-water formationand promoted anoxia and organic matter preservation (Rohling andHilgen, 1991; Hilgen, 1991b; Emeis andWeissert, 2009). Though appliedto different time intervals and paleogeographic settings, both modelsdeemorbital forcing as a triggeringmechanism for deposition of Corg-richsediments, but in opposite phase relationships.
Choosing among the possible orbital scenarios (and triggeringmechanisms) of Cenomanianblack shales formation (i.e., anti-monsoonalversus monsoonal) requires establishing the correct phase relationship

Fig. 1. Palaeo-location of the Furlo area and present day location of the studied sections. (a) Geologic sketch map of the central Apennines with location of the Furlo section; theshaded area represents the Mesozoic formation. (b) Paleogeographic map (www.odsn.de) of the Tethys–Central Atlantic region at ∼94 Ma (Cenomanian–Turonian boundary) withapproximate location of the Furlo section.
232 L. Lanci et al. / Earth and Planetary Science Letters 292 (2010) 231–237
between the forcing mechanism (eccentricity) and the periodic signalextracted from the geologic record and related to black shales. Here wepresent the results of a cyclostratigraphic study performed on a∼2.1 Myrcontinuous record of rock-magnetic properties and calcium carbonate(CaCO3) content of the Scaglia Bianca Fm. at Furlo. Spectral analysis is alsoused to determine the orbital conditions at the time of onset of theBonarelli Level.
2. Lithology and age
The Scaglia Bianca Fm. at Furlo (Fig. 1a)was deposited at a latitude of∼20°N in the tropical belt of the Tethys seaway (Fig. 1b). The Furlosection has already been studied by Mitchell et al. (2008) forcyclostratigraphy and by Mort et al. (2007) for organic carbon(δ13Corg) stratigraphy across the Bonarelli Level. From base to top, wedistinguish the followingmain stratigraphic intervals relative to thebaseof the Bonarelli Level placed at meter level 0 (Fig. 2).
(I) The interval from −20 to −18.50 m consists of white to lightgrey micritic limestones with pinkish chert lenses and nodules.
(II) The interval from −18.50 to −13.30 m consists of couplets oflight grey micritic limestones with pinkish to light grey chert
layers and lenses, and black shales. Black chert occurs from−16.57 m upwards.
(III) The interval from −13.30 to −3.20 m consists of couplets oflight grey micritic limestones with black chert layers, and blackshales.
(IV) The interval from −3.20 to 0 m consists of light grey micriticlimestones with black chert layers. A single, thin black shaleoccurs at −0.7 m.
(V) The Bonarelli Level is 1 m-thick (from 0 to +1 m) and consistsof couplets of black laminated organic-rich shales, radiolarian-rich layers, and occasional black chert layers.
(VI) The interval frommeter level +1 to+4 m consists of light greymicritic limestones with light grey to reddish chert layers.
Calcareous nannofossils are common andmoderately well preservedin limestones whereas their abundance and preservation is extremelyvariable in black shales where they can range from very abundant toscarce and from moderately to poorly preserved. The last occurrence ofAxopodorhadbus albianus (at −0.63 m) and the first occurrence ofQuadrum gartneri (at +0.74 m) are used to identify the NC 12** zone(Bralower et al., 1995) of latest Cenomanian age (Fig. 2). The FO of Q.gartneriapproximates theCenomanian–Turonianboundary, as calibrated
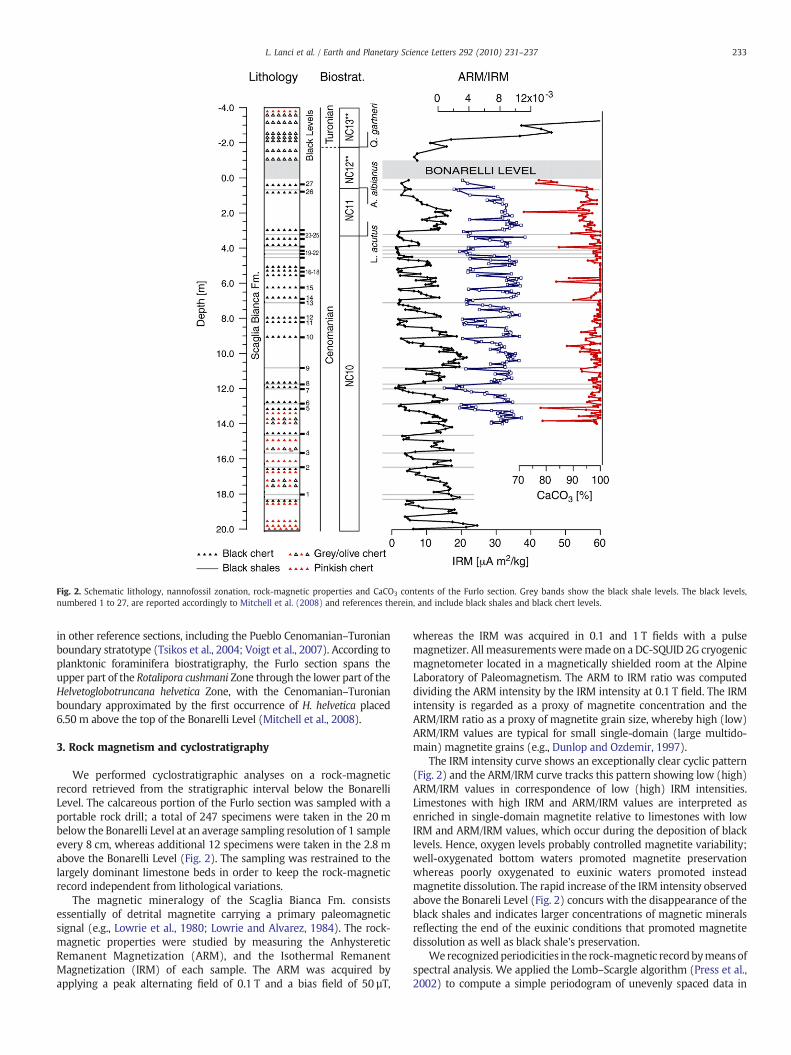
Fig. 2. Schematic lithology, nannofossil zonation, rock-magnetic properties and CaCO3 contents of the Furlo section. Grey bands show the black shale levels. The black levels,numbered 1 to 27, are reported accordingly to Mitchell et al. (2008) and references therein, and include black shales and black chert levels.
233L. Lanci et al. / Earth and Planetary Science Letters 292 (2010) 231–237
in other reference sections, including the Pueblo Cenomanian–Turonianboundary stratotype (Tsikos et al., 2004; Voigt et al., 2007). According toplanktonic foraminifera biostratigraphy, the Furlo section spans theupper part of the Rotalipora cushmani Zone through the lower part of theHelvetoglobotruncana helvetica Zone, with the Cenomanian–Turonianboundary approximated by the first occurrence of H. helvetica placed6.50 m above the top of the Bonarelli Level (Mitchell et al., 2008).
3. Rock magnetism and cyclostratigraphy
We performed cyclostratigraphic analyses on a rock-magneticrecord retrieved from the stratigraphic interval below the BonarelliLevel. The calcareous portion of the Furlo section was sampled with aportable rock drill; a total of 247 specimens were taken in the 20 mbelow the Bonarelli Level at an average sampling resolution of 1 sampleevery 8 cm, whereas additional 12 specimens were taken in the 2.8 mabove the Bonarelli Level (Fig. 2). The sampling was restrained to thelargely dominant limestone beds in order to keep the rock-magneticrecord independent from lithological variations.
The magnetic mineralogy of the Scaglia Bianca Fm. consistsessentially of detrital magnetite carrying a primary paleomagneticsignal (e.g., Lowrie et al., 1980; Lowrie and Alvarez, 1984). The rock-magnetic properties were studied by measuring the AnhystereticRemanent Magnetization (ARM), and the Isothermal RemanentMagnetization (IRM) of each sample. The ARM was acquired byapplying a peak alternating field of 0.1 T and a bias field of 50 µT,
whereas the IRM was acquired in 0.1 and 1 T fields with a pulsemagnetizer. All measurements weremade on a DC-SQUID 2G cryogenicmagnetometer located in a magnetically shielded room at the AlpineLaboratory of Paleomagnetism. The ARM to IRM ratio was computeddividing the ARM intensity by the IRM intensity at 0.1 T field. The IRMintensity is regarded as a proxy of magnetite concentration and theARM/IRM ratio as a proxy of magnetite grain size, whereby high (low)ARM/IRM values are typical for small single-domain (large multido-main) magnetite grains (e.g., Dunlop and Ozdemir, 1997).
The IRM intensity curve shows an exceptionally clear cyclic pattern(Fig. 2) and the ARM/IRM curve tracks this pattern showing low (high)ARM/IRM values in correspondence of low (high) IRM intensities.Limestones with high IRM and ARM/IRM values are interpreted asenriched in single-domain magnetite relative to limestones with lowIRM and ARM/IRM values, which occur during the deposition of blacklevels. Hence, oxygen levels probably controlled magnetite variability;well-oxygenated bottom waters promoted magnetite preservationwhereas poorly oxygenated to euxinic waters promoted insteadmagnetite dissolution. The rapid increase of the IRM intensity observedabove the Bonareli Level (Fig. 2) concurs with the disappearance of theblack shales and indicates larger concentrations of magnetic mineralsreflecting the end of the euxinic conditions that promoted magnetitedissolution as well as black shale's preservation.
We recognizedperiodicities in the rock-magnetic recordbymeansofspectral analysis. We applied the Lomb–Scargle algorithm (Press et al.,2002) to compute a simple periodogram of unevenly spaced data in

Fig. 4. a) Multi Taper Method power spectra of CaCO3, in the upper 14 m of Furlosection, and of IRM for direct comparison. The 95% confidence level (dashed line) refersto CaCO3 spectra. Periodicities corresponding to astronomical precession (arrows) arestatistically significant, while the peak corresponding to the short eccentricity has amarginal significance, however it has a similar frequency of the highly significant IRMpeak. b) CaCO3 signal filtered at the frequencies of 4 cycles/m and 5 cycles/m,corresponding to precession, and its “envelope” showing the amplitude modulation,calculated using the Hilbert transform. In the lower panel the calcium carbonate signalis compared with IRM filtered at 1 cycle/m frequency (i.e. short eccentricity). Themaxima of the filtered IRM correspond to larger amplitude modulation of theprecessional signal of CaCO3 which are expected during eccentricity maxima, henceIRM maxima correspond to periods of eccentricity maxima.
234 L. Lanci et al. / Earth and Planetary Science Letters 292 (2010) 231–237
depth scale; as shown later more sophisticated techniques such as theMulti Taper Method gave virtually identical results. The periodogram ofthe IRM curve shows three well-defined and large-amplitude peakscorresponding to frequencies of ∼0.25 cycle/m, ∼0.80 cycle/m and∼1.0 cycle/m (Fig. 3). The IRM periodogram has a striking resemblancewith the periodogram of Earth's eccentricity computed from the Laskaret al. (2004) solution for a similar time interval (93–96Ma) when it isrescaled to a sedimentation rate of 10 m/Myr, which is estimated on theaverage thickness of the Scaglia Bianca Fm. in the Umbria-Marche basinand the duration of the Cenomanian stage (Gradstein et al., 2004). Theratios between the highly significant IRM peak frequencies, as well astheir relative amplitude, match that of the orbital eccentricity (Fig. 3),therefore, we interpret the IRM spectral peaks as Earth's eccentricitycycles of periods ∼400 kyr (∼0.25 cycle/m), ∼125 kyr (∼0.8 cycle/m)and ∼100 kyr (∼1.0 cycle/m).
To establish the correct phase relationship between IRM andeccentricity, we measured the calcium carbonate (CaCO3) content ofthe 197 limestone samples using standard techniques (Fig. 2). TheCaCO3measurementswere interpolated to evenly spaced samples,withan interval equivalent to their average sampling interval of 7 cm, inorder to compute the frequency spectrumusing theMulti TaperMethodaccording to the algorithm described by Mann and Lees (1996), whichwas used also for subsequent filtering. The power spectrum (Fig. 4a) ischaracterized by two statistically significant frequency peaks at∼4 cycles/m and∼5 cycles/m,which correspond to precessional periodsof ∼25 and ∼20 kyr, assuming the average sediment accumulation rateof∼10 m/Myr established above. Evidences of short eccentricity are alsofound in the CaCO3 spectrum at ∼1 cycle/m, this frequency (albeit notsignificant at the 95% confidence level) corresponds to that computedfor the IRM record using the same Multi Taper Method (Fig. 4a). TheCaCO3 record filtered at the precession frequencies of ∼4 cycles/m and∼5 cycles/m shows an amplitude modulation whose envelope has beencalculated using the Hilbert transform (Fig. 4b). When compared to theIRM records filtered on the short eccentricity frequency of ∼1 cycle/m,the CaCO3 modulation follows the short eccentricity signal, suggestingthat it represents a true record of astronomical precession, with low(high) IRM values corresponding to large (small) CaCO3 modulation.
4. Age model
The stability of the solution of orbitalmotion calculation is limited bythe numerical accuracy of the computation and by the chaotic behaviorof the Solar system (Laskar, 1990). According to Laskar et al. (2004), the
Fig. 3. Normalized Lomb's periodograms (Press et al., 2002) of the IRM intensity plottedversus 1/depth in the lower horizontal axis, and of orbital eccentricity from the Laskar etal. (2004) solution for the period 93–96 Myr, plotted versus 1/age in theupper horizontalaxis. Horizontal axes are rescaled according to a sedimentation rate of 10 m/Myr.Confidence level for IRM (dashed line) was calculated, based on a red-noise hypothesis,according to the method proposed by Allen and Smith (1996).
only reliable component of the astronomical solution for theMesozoic isthe (g2−g5) term, corresponding to the 405 kyr eccentricity period,which is in any case subject to non negligible errors of about 0.1–0.2%.This implies that a time scale based on the counting of long eccentricitycycles assumed to have a fixed periodicity of 405 kyr may have an erroras large as 190 kyr in the Cenomanian (Laskar et al., 2004).
Based on these premises, we performed the astronomical tuning ofthe Furlo sequence by comparing the 405 kyr-long eccentricity cycle,from the Laskar et al. (2004) solution, with the IRM intensity filtered atthe highly significant 0.25 cycle/m frequency (i.e., 4 m period) peakusing theMulti TaperMethod (Mann and Lees, 1996). The correct phaserelationship between the IRM and the 405 kyr eccentricity cycle wasestablished using changes in the amplitude of the precessional signalderived from the CaCO3 record. The modulation of the CaCO3 filtered at∼4 and∼5 cycles/m, indicates periods of eccentricitymaxima,where themodulation is largest, and periods of eccentricity minima, where themodulation is nearly zero. Periods of eccentricity maxima are found tocorrespond to periods with larger IRM values (Fig. 4b). Conversely,periodswith lower IRMvalue correspond tominimal orbital eccentricity.
As a radiometric tie point for our tuning, we adopted the age of∼94.1 Ma for the base of the δ13Corg positive excursion in the PuebloCenomanian–Turonian boundary stratotype that Sageman et al. (2006)connected by cycle counting to radiometric dates from Obradovich

Fig. 6. Sedimentation rate of the Cenomanian Scaglia Bianca based on the astronomicaltuning of the short eccentricity cycles. Although the average sedimentation rateappears rather constant (a), there are significant long-term variations with a period of4 m (b), which corresponds to the long eccentricity cycle (405 kyr).
235L. Lanci et al. / Earth and Planetary Science Letters 292 (2010) 231–237
(1993). This radiometric date from Pueblo section was successfullycorrelated with the δ13Corg positive excursion observed in the Furlosection at the base of the Bonarelli Level (Tsikos et al., 2004; Mort et al.,2007). Based on the above, we correlate the IRMminimum found at thebase of the Bonarelli Level, which corresponds to the base of δ13Corgexcursion, with the long eccentricity minimum that is closest in age(93.95 Ma) to the age of ∼94.1 Ma (Fig. 5). The preceding 5 minima inthe 0.25 cycle/m(i.e., 4 mperiod)filtered IRM signal follow consistentlythe 405 kyr eccentricity cycles by simply assuming a nearly constantsedimentation rate of about 10 m/Myr, which is a reasonable assump-tion given the lithologically homogenous nature of the Scaglia BiancaFm. Since the IRM spectrum exhibits large power corresponding to theshort eccentricity frequency bands, it is also possible to compare the fulleccentricity solution of Laskar et al. (2004) with the IRM intensityfiltered at peaks of 1.0 cycle/m, 0.8 cycle/m and 0.25 cycle/m as well aswith the unfiltered IRM intensity (Fig. 5). Interestingly, also the shortperiod (1 to 1.25 m) IRM variations appear to be in phase with theorbital solution (Laskar et al., 2004), which might suggest that thecalculations for these components are correct. Based on the abovecorrelation, the 20 m-thick interval comprised between the section baseand the base of the Bonarelli Level spans ∼2.1 Myr (Fig. 5) with anaverage sedimentation rate of ∼10 m/Myr in agreement with previousastronomical calibration (Mitchell et al., 2008). Finer scale variations insedimentation rate throughout the section can be calculated by takinginto account the thickness of individual short eccentricity cycles (1 to1.25 m) in the IRM record. This exercise is independent from theprecision of the astronomical calculation for these components sincetheir period is not expected to change significantly. The resultingsedimentation rate (Fig. 6a) shows an average of 9.9 m/Myr and longperiod (∼4 m) changes synchronous with IRM fluctuation, henceeccentricity, with high sedimentation rates corresponding to loweccentricity periods.
5. Discussion
The magnetic properties of the upper Cenomanian Scaglia BiancaFm. at Furlo show a remarkably clear rhythmic pattern that is relatedto Earth's eccentricity. In particular, we were able to directly isolatethe term (g2−g5), with a period of 405 kyr, which has a stable
Fig. 5. Tuning of the IRM signal to the astronomical solution of Laskar et al. (2004). The IRMassuming a constant sedimentation rate of 10 m/Myr (see text for details). The IRM minimuage of 94.1 Myr for the base of Bonarelli Level. The IRM and the eccentricity filtered on the mawell and allow a finer tuning based using the short eccentricity cycles. The position of blackastronomical eccentricity is also shown. A duration of the Bonarelli Level of ∼500 kyr is ass
numerical solution for the Mesozoic era (Laskar et al., 2004). Thedirect phase relationship between the eccentricity signal and the IRMintensity is deduced from the amplitude modulation of the preces-sional signal recorded in the calcium carbonate record. We found thatthe amplitude of the precession-related signal is modulated by theshort (∼100 kyr) eccentricity and shows larger variability in corre-spondence of the IRM maxima that, by implication, correspond tomaximal orbital forcing modulation. On this basis, we tuned IRMmaxima with maxima of eccentricity and IRM minima witheccentricity minima. Accordingly, within the ∼2.1 Myr-long timeinterval preceding the onset of the Bonarelli Level black shales and/orblack cherts (as proxied by IRM minima) preferentially depositedduring ∼100 kyr eccentricity minima within 405 kyr minima (Fig. 5).
filtered at 4 m period was tuned to the corresponding 405 kyr-filtered eccentricity bym at the top of the section was linked to the 405 kyr minimum closest to the estimatedin spectral peaks of 1 m, 1.2 m, 4 m and 100 kyr, 125 kyr, 405 kyr respectively, compareshales (tall black), black chert (low grey), the Bonarelli Level and their correlation withumed according to Mort et al. (2007).

236 L. Lanci et al. / Earth and Planetary Science Letters 292 (2010) 231–237
Recently, Mitchell et al. (2008) attempted to correlate the rhythmiclithological properties of theCenomanian Scaglia Bianca Fm. at Furlowiththe astronomical solutionof Laskar et al. (2004), usinga facies rank-depthmethod. Their cyclostratigraphic results are broadly similar to thosepresented in this study in terms of cycle counting, albeit the stableMesozoic eccentricity term (405 kyr) was indirectly derived from theprecession envelope assumed to represent the complete eccentricitysignal. Their tuning was achieved starting from the same initial tie pointof ∼94.1 Ma for the base of the Bonarelli Level and searching for the bestpeak and amplitude matching between the precession-derived shorteccentricity signal,which they found in theScaglia Bianca Fm. depth-rankseries, and the full eccentricity solution from Laskar et al. (2004). Theresulting correlation implied a systematic coincidence between eccen-tricity maxima and black shale levels, which they explained by invokingthe monsoonal model developed for the Pliocene–Pleistocene Mediter-ranean sapropels. In their preferred interpretation, the onset of theBonarelli Level is placed at 94.21 Mawithin a long eccentricitymaximum,and the level itself persisted over a protracted period (340 kyr) ofunusually low insolation variability (eccentricity and obliquity) due to asimultaneous node in all orbital parameters of the astronomical solution.Based on this coincidence, Mitchell et al. (2008) hypothesized that thetiming of the Bonarelli Level as well as other OAEs are controlled by verylong-term (∼2.45 Myr) astronomical variations. However, since the onlyastronomical parameter that canbe reliably computed for theMesozoic isthe (g2−g5) term (Laskar et al., 2004) and the age of the other eccen-tricity terms is subject to a large uncertainty, the actual age of such nodescannot be determined. Although attractive, the correlation of theBonarelli Level (andpossibly otherOAEs)with thepeculiar orbital config-uration proposed by Mitchell et al. (2008) cannot be established atpresent because the chaotic evolution of the orbits prevents a precisedetermination of the Earth's motion, and astronomical calculation forperiods older than about 60 Ma does not have the desirable precision.
Given the possible errors (up to 190 kyr) associated with theastronomical calculations for the Cenomanian, and considering thatthese intrinsic errors sum up to errors associated with the correlationsand with the radiometric ages, the main practical difference betweenthe age model of Mitchell et al. (2008) and ours is the opposite phaserelationship of the 405 kyr eccentricity term. In fact, our successfuldetermination of the phase relationship between the geologic recordand the astronomical solution clarifies the orbital configuration that ledto the formation of black shales, as well as magnetite dissolution, andconfirmsprevious assertions thatmid-Cretaceous rhythmic black shalesformed during periods of eccentricityminima. In particular, ourfindingsaccredit the anti-monsoonalmodel of black shales formation previouslyproposed by Herbert and Fischer (1986) for the Aptian–AlbianMarne aFucoidi Formation.
The scrutiny of the sedimentation rate (Fig. 6b) shows significantlong-term variations with a period virtually identical to the longeccentricity but with opposite phase (i.e., higher sedimentation ratescorresponding to long eccentricity minima), which is corroborated bythe analysis of calcium carbonate content showing the same oppositephase relationship. These variations are difficult to explain as aconsequence of CaCO3 productivity because the oligotrophic conditionsoccurring during periods of eccentricity minima, as inferred fromnannofossil and foraminiferal records (Premoli Silva et al., 1989;Galeotti, 1998) and predicted by the anti-monsoonal model (Herbertand Fischer, 1986), would favor a decrease of nutrient recycling. Weinfer that themain factor controlling thevariability of the sedimentationrate in the Cenomanian Scaglia Bianca Formation is likely to be thepreservation of CaCO3. Kuhnt et al. (2009) reported Cenomanian sea-level fluctuations that were paced by the long eccentricity (405 kyr)with low-stands associatedwith eccentricityminima.We speculate thatan increase of ocean water alkalinity related to the suppression ofshallow water carbonate production during low-stands could haveenhanced CaCO3 preservation in these periods providing a plausiblemechanism to explain the observed variability of sedimentation rate.
6. Conclusions
Spectral analysis of rock-magnetic properties of the Scaglia BiancaFm. at Furlo and its phase relationships with the astronomical solutionfor the late Cenomanian, showevidence that black shales deposition andthe onset of the Bonarelli Level occurred during times of eccentricityminima as predicted by the anti-monsoonal model of Herbert andFischer (1986). In line with this model, the onset of the Bonarelli Leveldeposition and the associated δ13Corg perturbation fall in correspon-dence of an eccentricity minimum, as in the case of the preceding blackshales. With the orbitally controlled series of Corg-rich deposits,however, the Bonarelli Level obviously represents a much larger eventin terms of magnitude and duration as it persisted across at least onelong eccentricity maximum. Whether or not this and other CretaceousOAEs are paced by very long-term eccentricity variations, as proposedby Mitchell et al. (2008), cannot be established by direct comparisonwith the full astronomical solution because of its insufficient precision.However, it could in principle be tested by astronomically tuning thetime elapsed between several OAEs using the reliable (g2−g5) term.
We notice that the IRM short (∼100 kyr) eccentricity cycles appearto be in phase with the solution of Laskar et al. (2004) suggesting apositive test for the accuracy of this component. Fine-tuning of the IRMrecord revealed a cyclic variation of sedimentation rate that increasesduring period of eccentricity minima and black shales deposition. Theobserved periodicity of the sedimentation rate, of about 400 kyr, wasrelated to orbitally controlled sea-level fluctuations (Kuhnt et al., 2009)and explained as enhanced carbonate preservation during low-standperiods. According to this scenario, black shales formed probablybecause of reduced oceanic mixing, deep-water formation, and seabottom ventilation that promoted organic matter preservation. Condi-tions of reduced deep-water formation were preferentially achievedduring periods of low orbital eccentricitywhen the insolation variabilitydue to precession was reduced, seasonality and monsoonality dumped(e.g., Herbert and Fischer, 1986; Premoli Silva et al., 1989; Herbert andD'Hondt, 1990; Erba, 1992; Galeotti et al., 2003) and sea level was atlow-stand (Kuhnt et al., 2009). These conjunctures may have put theAlpineTethys–Central AtlanticOcean,whichwasa relatively constrictedbasin with narrow or morphologically complex connections with thePacific and South Atlantic Oceans, in a metastable state with respect todeep-water circulation that was susceptible to small external forcing,especially if the source of high latitude (cooler and better oxygenated)deep water was located in the Southern Ocean (Poulsen et al., 2001).
Acknowledgments
We are deeply in debt with Simone Galeotti for countless advicesand the many discussions that helped improve this manuscript. Thepaper benefited from the review of Ross Mitchell and other threeanonymous reviewers.
References
Allen,M., Smith, L.A., 1996.Monte Carlo SSA: detecting irregular oscillations in thepresenceof coloured noise. J. Climatol. 9, 3373–3404.
Arthur, M.A., Premoli Silva, I., 1982. Development of widespread organic carbon-richstrata in the Mediterranean Tethys. In: Schlanger, S.O., Cita, M.B. (Eds.), Nature andOrigin of Cretaceous Carbon-Rich Facies. Academic Press, London, pp. 7–54.
Arthur, M.A., Brumsack, H.-J., Jenkyns, H.C., Schlanger, S.O., 1990. Stratigraphy, geochem-istry, andpaleoceanography of organic carbon-richCretaceous sequences. In: K.A. Publ.(Editor), Cretaceous Resources, Events, and Rhythms, pp. 75–119.
Bralower, T.J., Zachos, C.J., Thomas, E., Parrow, M., Paull, C.K., Premoli Silva, I., Sliter, W.V.,Lohmann, K.C., 1995. Late Paleocene to Eocene paleoceanography of the equatorialPacific Ocean: stable isotopes recorded at Ocean Drilling Program Site 865, AllisonGuyot. Paleoceanography 10 (4), 841–865.
Coccioni, R., Galeotti, S., 2003. Themid-CenomanianEvent: prelude toOAE 2. Palaeogeogr.,Palaeoclimatol., Palaeoecol. 190 (14), 427–440.
Dunlop, D.J., Ozdemir, O., 1997. RockMagnetism: Fundamentals and Frontiers. CambridgeUniversity Press, Cambridge. 573 pp.
Emeis, K.-C., Weissert, H., 2009. Tethyan–Mediterranean organic carbon-rich sedimentsfrom Mesozoic black shales to sapropels. Sedimentology 56 (1), 247–266.

237L. Lanci et al. / Earth and Planetary Science Letters 292 (2010) 231–237
Erba, E., 1992. Calcareous nannofossil distribution in pelagic rhythmic sediments (Aptian–Albian Piobbico core, Central Italy). Riv. Ital. Paleontol. Stratigr. 97, 455–484.
Galeotti, S., 1998. Planktic and benthic foraminiferal distribution patterns as a response tochanges in surface fertility and ocean circulation: a case study from the Late Albian‘Amadeus Segment’ (Central Italy). J. Micropaleonlogy 17 (1), 87–96.
Galeotti, S., Sprovieri,M., Coccioni, R., Bellanca, A., Neri, R., 2003. Orbitallymodulated blackshale deposition in the upper Albian Amadeus Segment (central Italy): a multi-proxyreconstruction. Palaeogeogr., Palaeoclimatol., Palaeoecol. 190, 441–458.
Galeotti, S., Rusciadelli, G., Sprovieri, M., Lanci, L., Gaudio, A., Pekar, S., 2009. Sea-levelcontrol on facies architecture in the Cenomanian–Coniacian ApulianMargin (westernTethys): a record of glacioeustatic fluctuations during the Cretaceous greenhouse?Palaeogeogr., Palaeoclimatol., Palaeoecol. 276 (1–4), 196–205.
Gradstein, F.M., Ogg, J.G., Smith, A.G., Agterberg, F.P., Bleeker,W., Cooper, R.A., Davydov, V.,Gibbard, P., Hinnov, L., House, M.R., Lourens, L., Luterbacher, H.-P., McArthur, J.,Melchin, M.J., Robb, L.J., Shergold, J., Villeneuve, M., Wardlaw, B.R., Ali, J.R., Brinkhuis,H., Hilgen, F.J., Hooker, J., Howarth, R.J., Knoll, A.H., Laskar, J., Monechi, S., Powell, J.,Plumb, K.A., Raffi, I., Röhl, U., Sanfilippo, A., Schmitz, B., Shackleton, N.J., Shields, G.A.,Strauss,H., VanDam, J., Veizer, J., vanKolfschoten, T.,Wilson,D., 2004. AGeologic TimeScale 2004. Cambridge University Press.
Herbert, D.T., D'Hondt, L.S., 1990. Precessional climate cyclicity in Late Cretaceous–EarlyTertiary marine sediments: a high resolution chronometer of Cretaceous–Tertiaryboundary events. Earth Planet. Sci. Lett. 99 (3), 263–276.
Herbert, T.D., Fischer, A.G., 1986. Milankovitch climatic origin of mid-Cretaceous blackshale rhythms in central Italy. Nature 321, 739–743.
Hilgen, F.J., 1991a. Extension of the astronomically calibrated (polarity) time scale tothe Miocene/Pliocene boundary. Earth Planet. Sci. Lett. 107, 349–368.
Hilgen, F.J., 1991b. Astronomical calibration of Gauss toMatuyama sapropels in theMediter-ranean and implication for the geomagnetic polarity time scale. Earth Planet. Sci. Lett.104, 226–244.
Hilgen, F.J., Krijgsman, W., Langereis, C.G., Lourens, L.J., Santarelli, A., Zachariasse, W.J.,1995. Extending the astronomical (polarity) time scale into theMiocene. Earth Planet.Sci. Lett. 136, 495–510.
Kuhnt, W., Holbourn, A., Gale, A., Chellai, E.H., Kennedy, W.J., 2009. Basin (SWMorocco)Cenomanian sequence stratigraphy and sea-level fluctuations in the Tarfaya. Geol.Soc. Am. Bull. 121, 1695–1710.
Kuroda, J., Ohkouchi, N., Ishii, T., Tokuyama, H., Asahiko, T., 2007. Lamina-scale analysisof sedimentary components in Cretaceous black shales by chemical compositionalmapping: implications for paleoenvironmental changes during the Oceanic AnoxicEvents. Geochim. Cosmochim. Acta 69 (6), 1479–1494.
Laskar, J., 1990. The chaotic motion of the Solar System: a numerical estimate of the sizeof the chaotic zones. Icarus 88, 266–291.
Laskar, J., Robutel, P., Joutel, F., Gastineau,M., Correia, A.C.M., Levrard, B., 2004. A long-termnumerical solution for the insolation quantities of the Earth. Astron. Astrophys. 428,261–285.
Lowrie, W., Alvarez, W., 1984. Lower Cretaceous magntic stratigraphy in Umbrian pelagiclimestone sections. Earth Planet. Sci. Lett. 71, 315–328.
Lowrie, W., Alvarez, W., Premoli Silva, I., Monechi, S., 1980. Lower Cretaceous magnetic stra-tigraphy in Umbrian pelagic carbonate rocks. Geophys. J. R. Astronom. Soc. 60, 263–281.
Mann, M.E., Lees, J., 1996. Robust estimation of background noise and signal detectionin climatic time series. Clim. Change 33, 409–445.
Mitchell, R.N., Bice, D.M., Montanari, A., Cleaveland, L.C., Christianson, K.T., Coccioni, R.,Hinnov, A.L., 2008. Oceanic anoxic cycles? Orbital prelude to the Bonarelli Level(OAE 2). Earth Planet. Sci. Lett. 26, 1–16.
Mort, H., Jacquat, O., Adatte, T., Steinmann, P., Fölmi, K., Matera, V., Berner, Z., Stüben, D.,2007. TheCenomanian/Turonian anoxic event at theBonarelli Level in Italy and Spain:enhanced productivity and/or better preservation? Cretaceous Res. 28, 597–612.
Obradovich, J.D., 1993. A Cretaceous time scale. In: Caldwell, W.G.E., Kauffman, E.G.(Eds.), Evolution of the Western Interior Basin: Geological Association of CanadaSpecial Paper, pp. 379–396.
Poulsen, C.J., Barron, E.J., Arthur, M.A., Peterson, W.H., 2001. Response of the mid-Cretaceousglobal oceanic circulation to tectonic andCO2 forcing. Paleoceanography16(6), 576–592.
Premoli Silva, I., Erba, E., Tornaghi, M.E., 1989. Paleoenvironmental signals and changesin surface fertility in mid Cretaceous Corg-rich pelagic facies on the Fucoid Marls(central Italy). Geobios Mem. Spec. 11, 225–236.
Press, H.W., Teukolsky, A.S., Vetterling, T.W., Flannery, P.B., 2002. Numerical Recipes inC: The Art of Scientific Computing, 2nd Ed. Cambridge University Press, Cambridge.
Rohling, E.J., Hilgen, F.J., 1991. The eastern Mediterranean climate at times of sapropelformation: a review. Geol. Mijnbouw 70, 253–264.
Rossignol-Strick, M., 1985. Mediterranean quaternary sapropels, an immediate resonseof the African monsoon to variation of insolation. Palaeogeogr., Palaeoclimatol.,Palaeoecol. 49, 237–263.
Sageman, B.B., Meyers, R.S., Arthur, A.M., 2006. Orbital time scale and new C-isotoperecord for Cenomanian–Turonian boundary stratotype. Geology 34 (2), 125–128.doi:10.1130/G22074.1.
Tsikos, H., Jenkyns, H.C., Walsworth-Bell, B., Petrizzo, M.R., Forster, A., Kolonic, S., Erba, E.,Premoli Silva, I., Baas, M., Wagner, T., Sinninghe Damste, J.S., 2004. Carbon-isotopestratigraphy recorded by the Cenomanian–Turonian Oceanic Anoxic Event: correla-tion and implications based on three key localities. J. Geol. Soc. 161 (4), 711–719.doi:10.1144/0016-764903-077.
Voigt, S., Aurag, A., Leis, F., Kaplan, U., 2007. Late Cenomanian to Middle Turonian high-resolution carbon isotope stratigraphy: new data from theMünsterland CretaceousBasin, Germany. Earth Planet. Sci. Lett. 253 (1–2), 196–210.