earningsannouncement4q17 v ca - web3.cmvm.ptweb3.cmvm.pt/sdi/emitentes/docs/fr67441.pdf ·...
TRANSCRIPT
EARNINGS ANNOUNCEMENT 31 DECEMBER 2017
EARNINGS ANNOUCEMENT 31 DECEMBER 2017
Pag. 2
1. CEO’S MESSAGE AND MAIN HIGHLIGHTS
"In order to better convey the strategic objectives and the main trends of our portfolio, we have carried out, as of the current quarter, a reorganization of Sonae Capital's Earnings Announcement, splitting the Real Estate Assets and the Business Units. In the first block, we intend to continue to create value through the sale of Real Estate Assets. In the second one, which includes operations in six different segments, we intend to strengthen our competitive position in order to reach increasing levels of profitability.
During 2017 we continued to take important steps towards the materialization of the defined corporate strategy, based on: (i) improving the competitive position of each of our businesses; (ii) search for new value-generating businesses that fit within the Group’s competencies; (iii) sale of non-strategic Real Estate Assets; and (iv) maintenance of a balanced capital structure based on the type of business and assets held by the Group.
Thus, in terms of improving the competitive position of Sonae Capital's Business Units, I will by start highlighting the 7.4% growth in turnover to 157.9M€, as well as the 50.0% growth in EBITDA to 17.3M€ when compared to the previous year. Particularly remarkable was the performance of the Energy segment, where we almost doubled EBITDA, and of Hospitality, where the main business indicators improved in all hotels in operation. In the Fitness segment we successfully continued the growth of the Solinca chain and, already in 2018, we acquired the "Pump" chain, holding a well-deserved prominent position in the Fitness market in Portugal. In the Refrigeration and HVAC segment, the results remained below expectations. In Tróia, the operations that support the Resort continue to show improvements in profitability.
Regarding the search for new growth and value-generating platforms, we concluded during 2017 the acquisition of ADIRA, a Portuguese-based company, leveraging one of the country's main assets and resources - the Engineering know-how - strongly focused on the international market and a key player in the "Metal Forming" sector. This business is reported in our most recent segment: Industrial Engineering. The first few months have been devoted mainly to the integration of ADIRA into Sonae Capital's reality and to the replenishment and allocation of the required resources to implement the defined strategy, which results should begin to be visible in the second half of 2018.
The sale of Real Estate Assets this year evolved in line with the expected trend, both in the segment of residential units in Tróia, where we carried out 29 deeds, and in the other Real Estate Assets segment where the ongoing negotiations, already started in 2017, allow us to have good prospects for the following months.
2017 is marked by the strong investment both in the current businesses, with particular emphasis on the investment in the Energy segment and in the acquisition of new businesses – Adira. Nevertheless, we have a strong capital structure and adequate to the Group's businesses and assets held, with a Loan-to-Value ratio of 15.9% and Net Debt to EBITDA ratio of 2.57x, allowing us to face future growth with safety. Net debt increased 43.4M€ to 109.4M€ due to the strong investment (61.6M€) and the Dividend payment (25M€) partially offset by the operational cash flow generated (43.2M€).
The combination of the results and the cash flow generated in the period, with the perspectives for the continued sale of Real Estate assets allows the Board of Directors to propose, for the third consecutive year, a shareholder remuneration without harming the maintenance of an adequate capital structure and the ability to finance the identified growth options. The Board of Directors will propose to the Shareholders’ General Meeting a dividend distribution of 15M€.
2018 will naturally bring several challenges. Firm in pursuit of a clear strategy and with deep confidence in the quality of our people, I believe we are on the right track to achieve the ambitious results that we continue to propose to ourselves every day.”
Cláudia Azevedo, CEO
EARNINGS ANNOUNCEMENT 31 DECEMBER 2017
Pag. 3
MAIN HIGHLIGHTS
THE STRATEGY IMPLEMENTATION, BASED ON THE DEFINED GUIDANCE, HAS DEMONSTRATED THE INCREASED FIRMNESS AND SUSTAINABILITY OF THE GROUP'S BUSINESS RESULTS:
1. IMPROVED COMPETITIVE POSITION OF EACH BUSINESS • Strong growth in turnover and profitability:
o Energy: growth of +18.3% in Turnover and 81.8% in Ebitda, with a significant contribution from operations acquired during 2017;
o Hospitality: a year of strong growth regarding turnover (+16.2%) and EBITDA (+79.6%), with positive EBITDA at "Porto Palácio Hotel" and "The House" operations, the latter in its first full year of operation;
o Resort operations also showed an improvement of +9.1% in turnover and 45.1% in Ebitda;
• The Fitness segment also showed a significant growth of +28.5% in turnover, due to the growth of 30.8% in the membership base, opening two new clubs during the year (to which were added two openings in early 2018);
• Backlog value as of 31st December in the Ref. & HVAC segment, in the domestic market, of 23.2M€, equivalent to approximately 5.4 months of turnover;
2. SEARCH FOR NEW AND VALUE GENERATING GROWTH PLATFORMS • Acquisition and integration of ADIRA, an important milestone in the implementation of the
corporate strategy;
• Full integration of the operations acquired during the year in the Energy segment, namely: (i) 1MW of a Cogeneration operation fueled by landfill biogas, acquired at the end of the first quarter; and (ii) 15MW, acquired in 2Q17, in Renewable Energies, significantly increasing turnover (5.1M€) and profitability (4.0M€), giving greater stability to the group’s cash flow;
• Acquisition, in the Fitness business (conclusion already in 2018), of the "PUMP" clubs chain, reinforcing our presence, mainly in the Lisbon metropolitan area.
3. SALE OF REAL ESTATE ASSETS AS A PRIVILEGED WAY OF FINANCING GROWTH OPTIONS • Number of sales deeds of residential units in the Troia Resort, totaling 29 contracts (+4
compared to the same period last year), 2 of which in the fractional regime, corresponding to 11.7M€ for the year. At the beginning of the year and up to the date of this report, 5 deeds were already signed and a set of 7 Promissory Purchase and Sale Agreements and Reserves remain in stock, amounting to 4.7M€;
• Sales deeds of a diverse lot of Real Estate Assets (excluding residential units of Tróia) totaling 20.2M€ in the period, in addition to the PPSAs at the end of the year totaling 4.5M€;
4. FOCUS ON CASH-FLOW AND CONSERVATIVE CAPITAL STRUCTURE • Despite the strong Investment (61.6M€, including the acquisition of ADIRA) and the
Dividends distribution in 2017 (25M€), Net Debt only increased 43.4M€, due to the operational cash flow;
• Net Debt under control and adequate to the type of business and assets held by the Group: LTV of 15.9% and Net Debt / Ebitda of 2.57x.
EARNINGS ANNOUCEMENT 31 DECEMBER 2017
Pag. 4
2. OVERALL PERFORMANCE
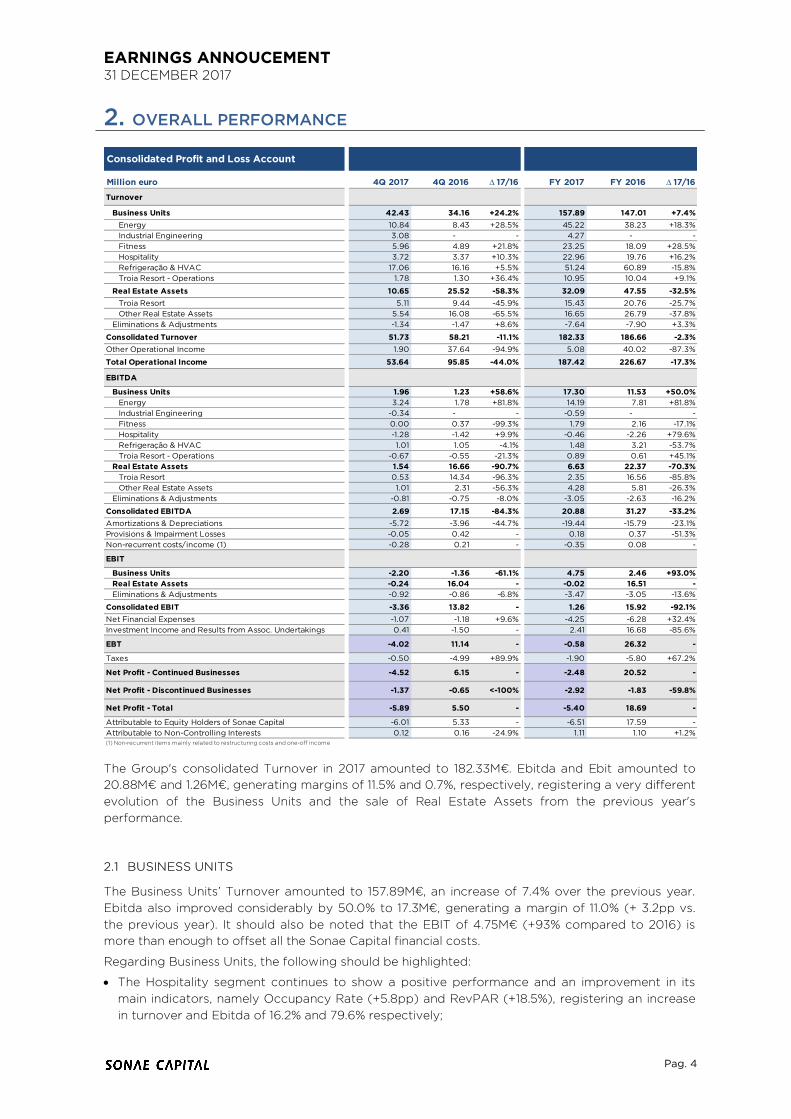
The Group's consolidated Turnover in 2017 amounted to 182.33M€. Ebitda and Ebit amounted to 20.88M€ and 1.26M€, generating margins of 11.5% and 0.7%, respectively, registering a very different evolution of the Business Units and the sale of Real Estate Assets from the previous year's performance.
2.1 BUSINESS UNITS
The Business Units’ Turnover amounted to 157.89M€, an increase of 7.4% over the previous year. Ebitda also improved considerably by 50.0% to 17.3M€, generating a margin of 11.0% (+ 3.2pp vs. the previous year). It should also be noted that the EBIT of 4.75M€ (+93% compared to 2016) is more than enough to offset all the Sonae Capital financial costs.
Regarding Business Units, the following should be highlighted:
• The Hospitality segment continues to show a positive performance and an improvement in its main indicators, namely Occupancy Rate (+5.8pp) and RevPAR (+18.5%), registering an increase in turnover and Ebitda of 16.2% and 79.6% respectively;
Consolidated Profit and Loss Account
Million euro 4Q 2017 4Q 2016 D 17/16 FY 2017 FY 2016 D 17/16
Turnover
Business Units 42.43 34.16 +24.2% 157.89 147.01 +7.4%Energy 10.84 8.43 +28.5% 45.22 38.23 +18.3%Industrial Engineering 3.08 - - 4.27 - -Fitness 5.96 4.89 +21.8% 23.25 18.09 +28.5%Hospitality 3.72 3.37 +10.3% 22.96 19.76 +16.2%Refrigeração & HVAC 17.06 16.16 +5.5% 51.24 60.89 -15.8%Troia Resort - Operations 1.78 1.30 +36.4% 10.95 10.04 +9.1%
Real Estate Assets 10.65 25.52 -58.3% 32.09 47.55 -32.5%Troia Resort 5.11 9.44 -45.9% 15.43 20.76 -25.7%Other Real Estate Assets 5.54 16.08 -65.5% 16.65 26.79 -37.8%
Eliminations & Adjustments -1.34 -1.47 +8.6% -7.64 -7.90 +3.3%
Consolidated Turnover 51.73 58.21 -11.1% 182.33 186.66 -2.3%Other Operational Income 1.90 37.64 -94.9% 5.08 40.02 -87.3%
Total Operational Income 53.64 95.85 -44.0% 187.42 226.67 -17.3%
EBITDA
Business Units 1.96 1.23 +58.6% 17.30 11.53 +50.0%Energy 3.24 1.78 +81.8% 14.19 7.81 +81.8%Industrial Engineering -0.34 - - -0.59 - -Fitness 0.00 0.37 -99.3% 1.79 2.16 -17.1%Hospitality -1.28 -1.42 +9.9% -0.46 -2.26 +79.6%Refrigeração & HVAC 1.01 1.05 -4.1% 1.48 3.21 -53.7%Troia Resort - Operations -0.67 -0.55 -21.3% 0.89 0.61 +45.1%
Real Estate Assets 1.54 16.66 -90.7% 6.63 22.37 -70.3%Troia Resort 0.53 14.34 -96.3% 2.35 16.56 -85.8%Other Real Estate Assets 1.01 2.31 -56.3% 4.28 5.81 -26.3%
Eliminations & Adjustments -0.81 -0.75 -8.0% -3.05 -2.63 -16.2%
Consolidated EBITDA 2.69 17.15 -84.3% 20.88 31.27 -33.2%Amortizations & Depreciations -5.72 -3.96 -44.7% -19.44 -15.79 -23.1%Provisions & Impairment Losses -0.05 0.42 - 0.18 0.37 -51.3%Non-recurrent costs/income (1) -0.28 0.21 - -0.35 0.08 -
EBIT
Business Units -2.20 -1.36 -61.1% 4.75 2.46 +93.0%Real Estate Assets -0.24 16.04 - -0.02 16.51 -Eliminations & Adjustments -0.92 -0.86 -6.8% -3.47 -3.05 -13.6%
Consolidated EBIT -3.36 13.82 - 1.26 15.92 -92.1%Net Financial Expenses -1.07 -1.18 +9.6% -4.25 -6.28 +32.4%Investment Income and Results from Assoc. Undertakings 0.41 -1.50 - 2.41 16.68 -85.6%
EBT -4.02 11.14 - -0.58 26.32 -
Taxes -0.50 -4.99 +89.9% -1.90 -5.80 +67.2%
Net Profit - Continued Businesses -4.52 6.15 - -2.48 20.52 -
Net Profit - Discontinued Businesses -1.37 -0.65 <-100% -2.92 -1.83 -59.8%
Net Profit - Total -5.89 5.50 - -5.40 18.69 -
Attributable to Equity Holders of Sonae Capital -6.01 5.33 - -6.51 17.59 -Attributable to Non-Controlling Interests 0.12 0.16 -24.9% 1.11 1.10 +1.2%(1) Non-recurrent items mainly related to restructuring costs and one-off income
EARNINGS ANNOUNCEMENT 31 DECEMBER 2017
Pag. 5
• Sustained growth of the Fitness segment turnover (+28.5%) due to the continued increase in the number of active members (+30.8%). The expansion plan that has been implemented (two clubs opened in the period and another two already in January 2018), once the recent opened clubs reach a regular level of members, has a negative impact on profitability, translated to a decrease of 17.1% in the Ebitda level compared to the same period of the previous year;
• The Energy segment continued to show increases both in turnover (+18.3%) and, mainly, in Ebitda (+81.8%), to 45.22M€ and 14.19M€, respectively. The evolution of energy and gas price indexes, as well as the contribution of the operations acquired in 2017, were the main contributors to the significant improvement in performance;
• The Ref. & HVAC segment registered an expected decrease of 15.8% in turnover (during 2016, with particular incidence in the 3Q, a major international project was delivered), noting, however, a clear recovery compared to the previous quarters with the turnover improvement in the 4Q17 of 5.5% to 17.1M€. Naturally at Ebitda level, there was also a deterioration when compared to the previous year;
• Troia Operations, as a result of the growing dynamics of the resort, continue to show increasing traffic, visible in the 9.1% growth in turnover (strongly leveraged in the Atlantic Ferries operation) and 45.1% in Ebitda;
• The Industrial Engineering segment, still in consolidation and adaptation to the reality of Sonae Capital's processes, contributed with 4.27M€ in turnover (contribution since August 2017) and negative 0.59M€ in Ebitda (including acquisition costs).
2.2 REAL ESTATE ASSETS
• Troia Resort consolidated the positive evolution already shown in previous quarters, with an increase in the number of deeds compared to the same period last year. During 2017, 29 sales deeds were closed (two of which “fractional”), more 4 deeds compared to the same period of the previous year, corresponding to 11.7M€. However, comparability with the previous year is affected by the sale of UNOPs 7/8/9 in 2016, with the turnover decreasing 25.7% and a similar impact on profitability (-86.2%). As of the date of this report, additional 5 deeds have already been signed and 7 PPSAs and reserves remain in stock, corresponding to 4.7M€ that are expected to be closed in the next quarters for a significant part of this contracts;
• Regarding other Real Estate Assets, a set of sales deeds were signed related to several assets, totalling 20.2M€. It should be noted that PPSAs are still in the pipeline on a diverse range of real estate assets, totalling 4.5M€.
Consolidated Net Profit (continued operations) was negative by 2.48M€, representing a decrease of 23M€ compared to the previous year, mainly due to: the (i) already registered performance at Ebitda level (-10.4M€ due to capital gains generated by Real Estate Assets sales in 2016); (ii) improvement in Financial Results (+2.0M€) due to the lower net debt average level and especially lower financing costs; and (iii) essentially the lower Investment Results due to the sale in 2016 of investments in road concessions.
EARNINGS ANNOUCEMENT 31 DECEMBER 2017
Pag. 6
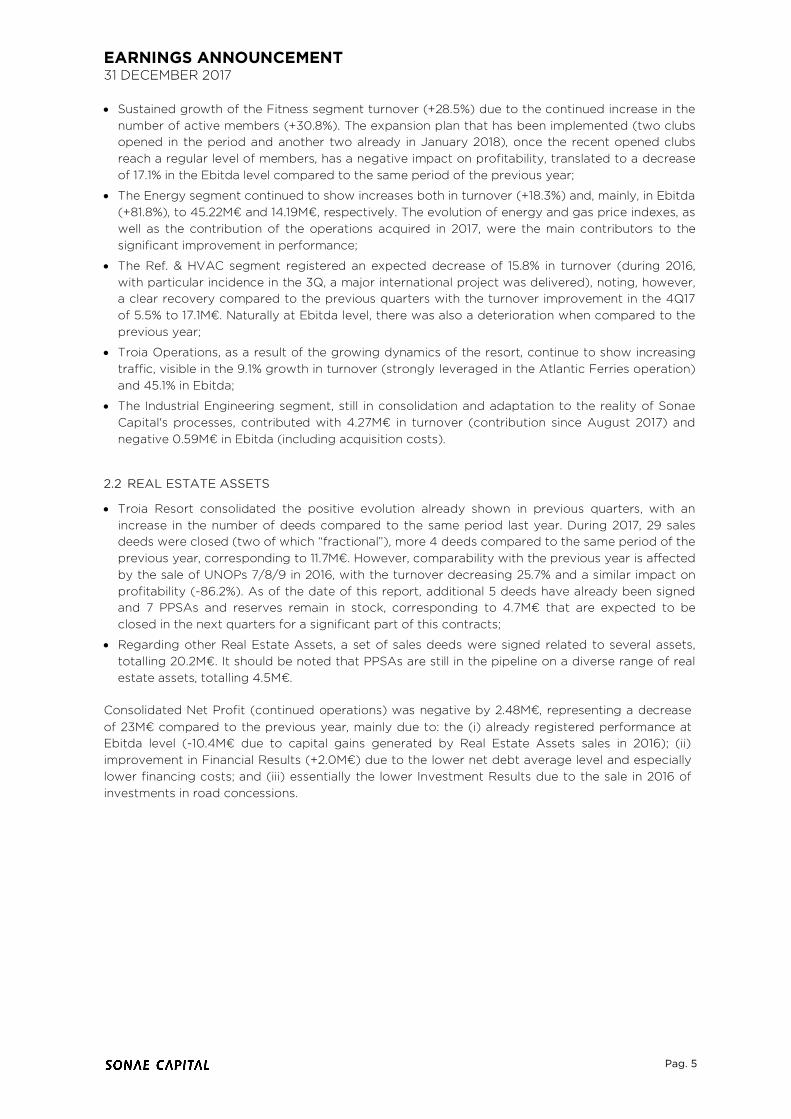
• Capex for the year amounted to 61.6M€ (including 16.1M€ related to ADIRA's acquisition), a significant increase of 48.9M€ compared to the previous year, mainly as a result of investments in the acquisition of new businesses, especially in the Energy segment.
• Free Cash Flow (levered) at the end of December, excluding dividends, registered negative 17.8M€ due to the above-mentioned investments (61.6M€ with impact of 53.9M€ in FCF), despite the improvement in the cash flow generated by operations which amounted to 40.4M€.
• As a result of those investments, Net Debt increased to 109.4M€ when compared to the previous year-end, maintaining however an appropriate capital structure regarding the Group's type of business and assets: Loan To Value (LTV) of 15,9% and Net Debt / Ebitda of non-Real Estate businesses of 2.57x.
• Net Invested Capital increased by 3.7% compared to the end of 2016, to 400.7M€ driven by the increase in Fixed Assets under Management.
• Due to this increase in net debt, the Debt to Equity ratio rose to 37.5%, +16.9pp compared to the end of 2016.
Million euro Dec 2017 Dec 2016 D 17/16
Net Capital Employed 400.7 386.4 +3.7%
Fixed Assets 322.6 284.1 +13.6%Non-Current Investments (net) 8.6 4.6 +88.3%Working Capital 71.8 98.4 -27.0%Capex (end of period) 61.6 12.7 >100%% Fixed Assets 19.1% 4.5% +14.6 pp
Net Debt/EBITDA 109.4 66.0 +65.6%
% Net Capital Employed 27.3% 17.1% +10.2 ppDebt to Equity 37.5% 20.6% +16.9 ppNet Debt excluding Energy 60.4 48.9 +23.3%
Capital Structure Ratios
Loan to Value (Real Estate) 15.9% 8.6%Net Debt/EBITDA (recurrent) 2.57x 2,38x
Capital Structure/Capex/Ratios
Million euro Dec 2017 Dec 2016 D 17/16
Total Assets 516.1 501.5 +2.9%
Tangible and Intangible Assets 275.3 246.3 +11.8%Goodwill 47.4 37.8 +25.2%Non-Current Investments 2.0 1.7 +16.6%Other Non-Current Assets 34.4 29.3 +17.2%Stocks 94.4 102.6 -8.0%Trade Debtors and Other Current Assets 53.0 48.5 +9.2%Cash and Cash Equivalents 7.3 32.2 -77.3%Assets held for sale 2.4 3.0 -20.2%
Total Equity 291.4 320.4 -9.0%
Total Equity attributable to Equity Holders of Sonae Capital 280.5 310.4 -9.7%Total Equity attributable to Non-Controlling Interests 10.9 9.9 +10.0%
Total Liabilities 224.8 181.2 +24.0%
Non-Current Liabilities 116.2 120.7 -3.7%Non-Current Borrowings 88.5 94.3 -6.1%Deferred Tax Liabilities 21.6 19.6 +10.2%Other Non-Current Liabilities 6.1 6.8 -10.8%
Current Liabilities 108.6 60.5 +79.6%Current Borrowings 28.2 4.0 >100%Trade Creditors and Other Current Liabilities 75.5 52.8 +43.1%Liabilities associated to assets held for sale 4.8 3.7 +28.9%
Total Equity and Liabilities 516.1 501.5 +2.9%
Consolidated Balance Sheet
EARNINGS ANNOUNCEMENT 31 DECEMBER 2017
Pag. 7
3. BUSINESS UNITS
3.1. ENERGY
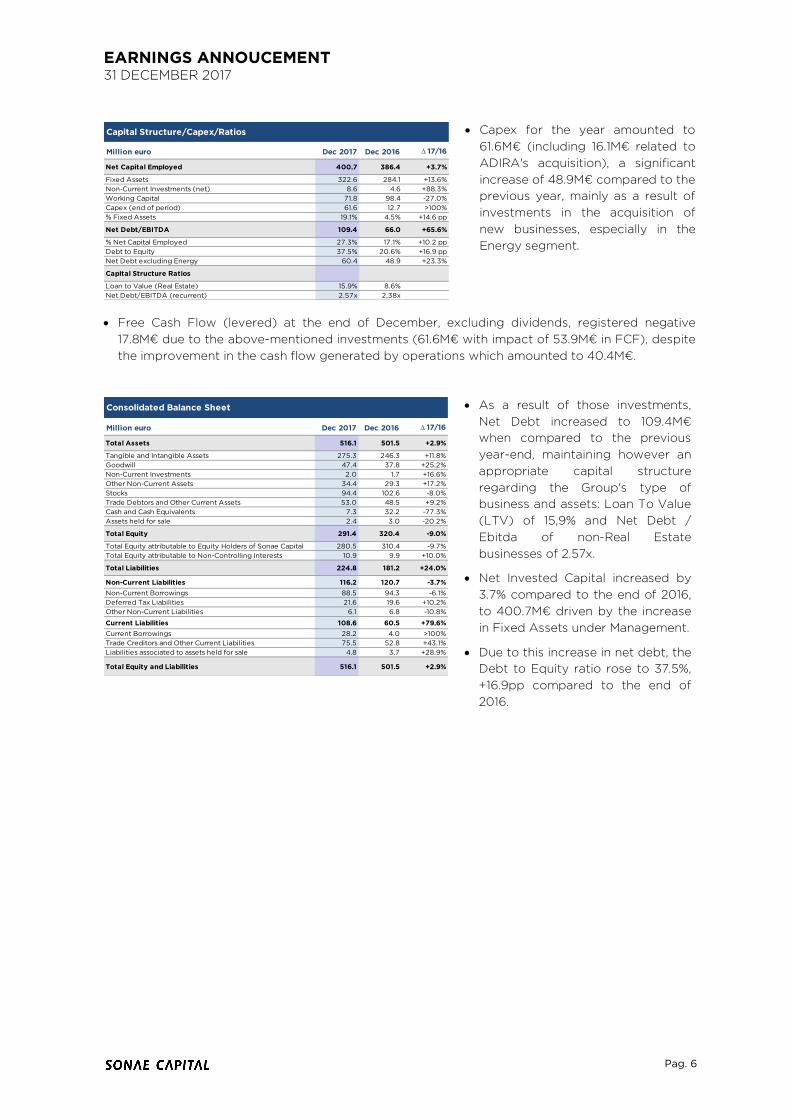
• Turnover of the Energy segment amounted to 45.22M€, an increase of 18.3% over the previous year, due to: (i) the increase in electricity sales prices; (ii) the higher production level; and (iii) the operations acquired in the period. These acquisitions, combined with the termination of an energy services contract (non-owned operation), currently translate into a 65MW owned or operated capacity. It should be noted that no further discontinuations are foreseen during the next 8 quarters (4Q19).
• As a result of the turnover positive performance, EBITDA amounted to 14.19M€, almost the double of the previous year figure, reaching a 31.4% margin, a significant increase of 11pp, reinforcing the continuous improvement in performance demonstrated above. It should be noted that the contribution of the operations acquired during the year amounted to 5.1M€ and 4.0M€, respectively at turnover and Ebitda levels.
• Capex amounted to 39.0M€, mainly as a result of the aforementioned acquisitions.
3.2. INDUSTRIAL ENGINEERING
Million euro 4Q 2017 4Q 2016 D 17/16 FY 2017 FY 2016 D 17/16
Total Operational Income 11.95 8.76 +36.5% 46.60 38.80 +20.1%
Turnover 10.84 8.43 +28.5% 45.22 38.23 +18.3%Other Operational Income 1.12 0.32 >100% 1.38 0.57 >100%
Total Operational Costs -8.71 -6.97 -24.9% -32.41 -30.99 -4.6%
Cost of Goods Sold -5.61 -4.85 -15.9% -23.17 -23.46 +1.2%External Supplies and Services -1.51 -1.14 -32.5% -5.09 -4.43 -15.0%Staff Costs -0.87 -0.53 -64.8% -2.64 -2.32 -13.6%Other Operational Expenses -0.72 -0.46 -55.9% -1.50 -0.78 -91.7%
EBITDA 3.24 1.78 +81.8% 14.19 7.81 +81.8%
EBITDA Margin (% Turnover) 29.9% 21.1% +8.8 pp 31.4% 20.4% +11.0 pp
EBIT 0.86 0.86 -0.2% 7.23 4.63 +56.2%
EBIT Margin (% Turnover) 7.9% 10.2% -2.3 pp 16.0% 12.1% +3.9 pp
Capex 1.79 6.90 -74.1% 38.99 7.21 >100%
EBITDA-Capex 1.45 -5.12 - -24.80 0.60 -
Total Capacity (MW) 65.5 62.8 +4.3% 65.5 62.8 +4.3%
Owned & Operated 62.3 52.6 +18.4% 62.3 52.6 +18.4%Operated (not consolidated) 3.2 10.2 3.2 10.2
Profit and Loss Account - Energy
Million euro 4Q 2017 4Q 2016 D 17/16 FY 2017 FY 2016 D 17/16
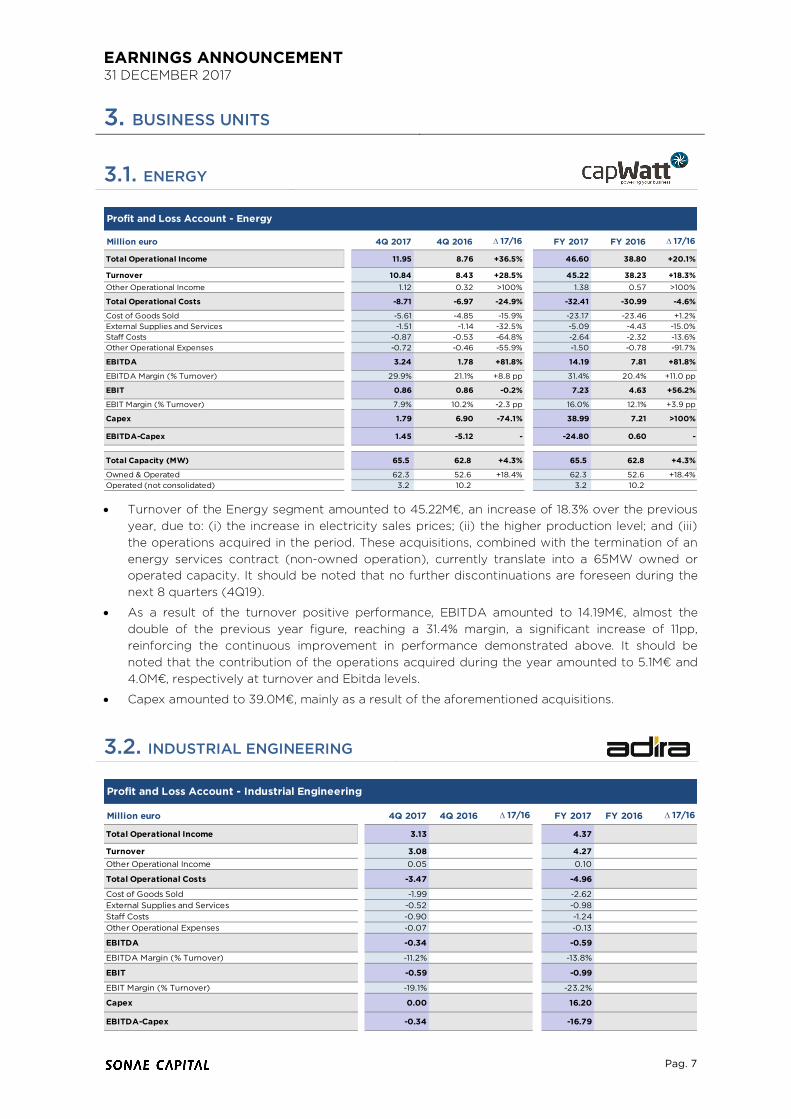
Total Operational Income 3.13 4.37
Turnover 3.08 4.27Other Operational Income 0.05 0.10
Total Operational Costs -3.47 -4.96
Cost of Goods Sold -1.99 -2.62External Supplies and Services -0.52 -0.98Staff Costs -0.90 -1.24Other Operational Expenses -0.07 -0.13
EBITDA -0.34 -0.59
EBITDA Margin (% Turnover) -11.2% -13.8%
EBIT -0.59 -0.99
EBIT Margin (% Turnover) -19.1% -23.2%
Capex 0.00 16.20
EBITDA-Capex -0.34 -16.79
Profit and Loss Account - Industrial Engineering
EARNINGS ANNOUCEMENT 31 DECEMBER 2017
Pag. 8
Following its strategic purpose, Sonae Capital has incorporated an Industrial Engineering segment aimed at creating a cluster of technological-based companies with a strong exporting drive and leveraged in the Portuguese engineering skills.
The first movement in this area was materialized during 2017 with the acquisition of ADIRA.
ADIRA, a Portuguese-based company with more than 60 years of history, is a key player in the "Metal Forming" industry, developing, designing, manufacturing and commercializing machine tools, that has the majority of its activity focused on external markets. At the same time, ADIRA is acknowledged as a technologically dynamic company with a widespread brand, being associated to recurrent investment in innovation and R&D, which has resulted in the attribution of several national and international awards.
The acquisition of ADIRA was completed in 3Q17 and only contributed to the Group's consolidated results as of August.
In this initial phase, the main focus of the Team has been the integration of the main Group’s corporate processes, following a clear vision on the transformation plan that is urgent to implement.
The contribution of this segment to the Group’s consolidated results was 4.3M€ at the top line level and -0.6M€ at Ebitda which includes, in addition to Adira's regular activity, costs related to the acquisition and integration process.
3.3. FITNESS
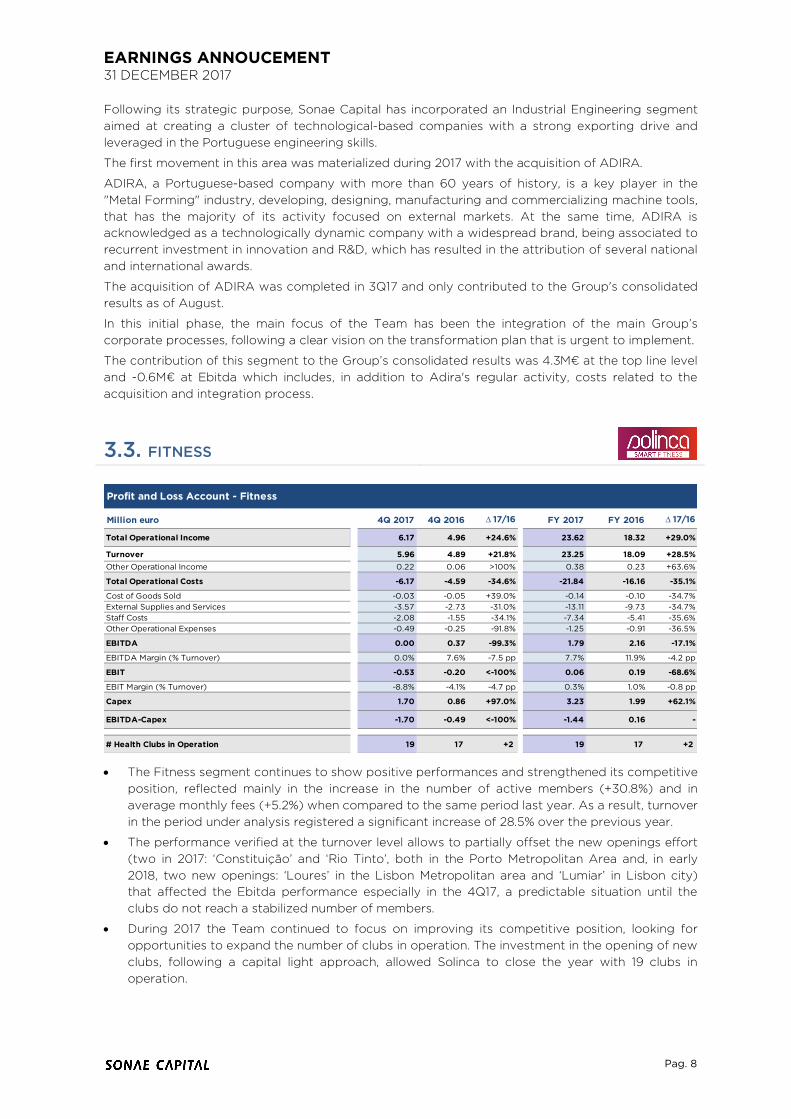
• The Fitness segment continues to show positive performances and strengthened its competitive position, reflected mainly in the increase in the number of active members (+30.8%) and in average monthly fees (+5.2%) when compared to the same period last year. As a result, turnover in the period under analysis registered a significant increase of 28.5% over the previous year.
• The performance verified at the turnover level allows to partially offset the new openings effort (two in 2017: ‘Constituição’ and ‘Rio Tinto’, both in the Porto Metropolitan Area and, in early 2018, two new openings: ‘Loures’ in the Lisbon Metropolitan area and ‘Lumiar’ in Lisbon city) that affected the Ebitda performance especially in the 4Q17, a predictable situation until the clubs do not reach a stabilized number of members.
• During 2017 the Team continued to focus on improving its competitive position, looking for opportunities to expand the number of clubs in operation. The investment in the opening of new clubs, following a capital light approach, allowed Solinca to close the year with 19 clubs in operation.
Million euro 4Q 2017 4Q 2016 D 17/16 FY 2017 FY 2016 D 17/16
Total Operational Income 6.17 4.96 +24.6% 23.62 18.32 +29.0%
Turnover 5.96 4.89 +21.8% 23.25 18.09 +28.5%Other Operational Income 0.22 0.06 >100% 0.38 0.23 +63.6%
Total Operational Costs -6.17 -4.59 -34.6% -21.84 -16.16 -35.1%
Cost of Goods Sold -0.03 -0.05 +39.0% -0.14 -0.10 -34.7%External Supplies and Services -3.57 -2.73 -31.0% -13.11 -9.73 -34.7%Staff Costs -2.08 -1.55 -34.1% -7.34 -5.41 -35.6%Other Operational Expenses -0.49 -0.25 -91.8% -1.25 -0.91 -36.5%
EBITDA 0.00 0.37 -99.3% 1.79 2.16 -17.1%
EBITDA Margin (% Turnover) 0.0% 7.6% -7.5 pp 7.7% 11.9% -4.2 pp
EBIT -0.53 -0.20 <-100% 0.06 0.19 -68.6%
EBIT Margin (% Turnover) -8.8% -4.1% -4.7 pp 0.3% 1.0% -0.8 pp
Capex 1.70 0.86 +97.0% 3.23 1.99 +62.1%
EBITDA-Capex -1.70 -0.49 <-100% -1.44 0.16 -
# Health Clubs in Operation 19 17 +2 19 17 +2
Profit and Loss Account - Fitness
EARNINGS ANNOUNCEMENT 31 DECEMBER 2017
Pag. 9
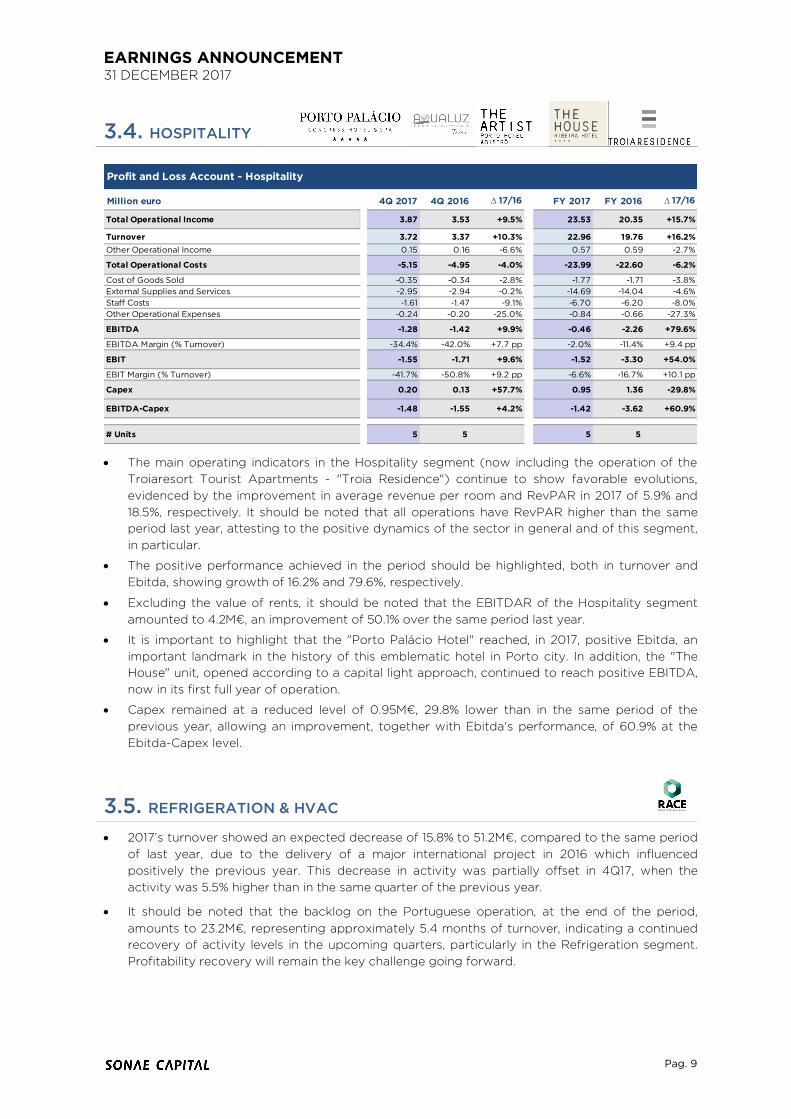
3.4. HOSPITALITY
• The main operating indicators in the Hospitality segment (now including the operation of the Troiaresort Tourist Apartments - "Troia Residence") continue to show favorable evolutions, evidenced by the improvement in average revenue per room and RevPAR in 2017 of 5.9% and 18.5%, respectively. It should be noted that all operations have RevPAR higher than the same period last year, attesting to the positive dynamics of the sector in general and of this segment, in particular.
• The positive performance achieved in the period should be highlighted, both in turnover and Ebitda, showing growth of 16.2% and 79.6%, respectively.
• Excluding the value of rents, it should be noted that the EBITDAR of the Hospitality segment amounted to 4.2M€, an improvement of 50.1% over the same period last year.
• It is important to highlight that the "Porto Palácio Hotel" reached, in 2017, positive Ebitda, an important landmark in the history of this emblematic hotel in Porto city. In addition, the "The House" unit, opened according to a capital light approach, continued to reach positive EBITDA, now in its first full year of operation.
• Capex remained at a reduced level of 0.95M€, 29.8% lower than in the same period of the previous year, allowing an improvement, together with Ebitda's performance, of 60.9% at the Ebitda-Capex level.
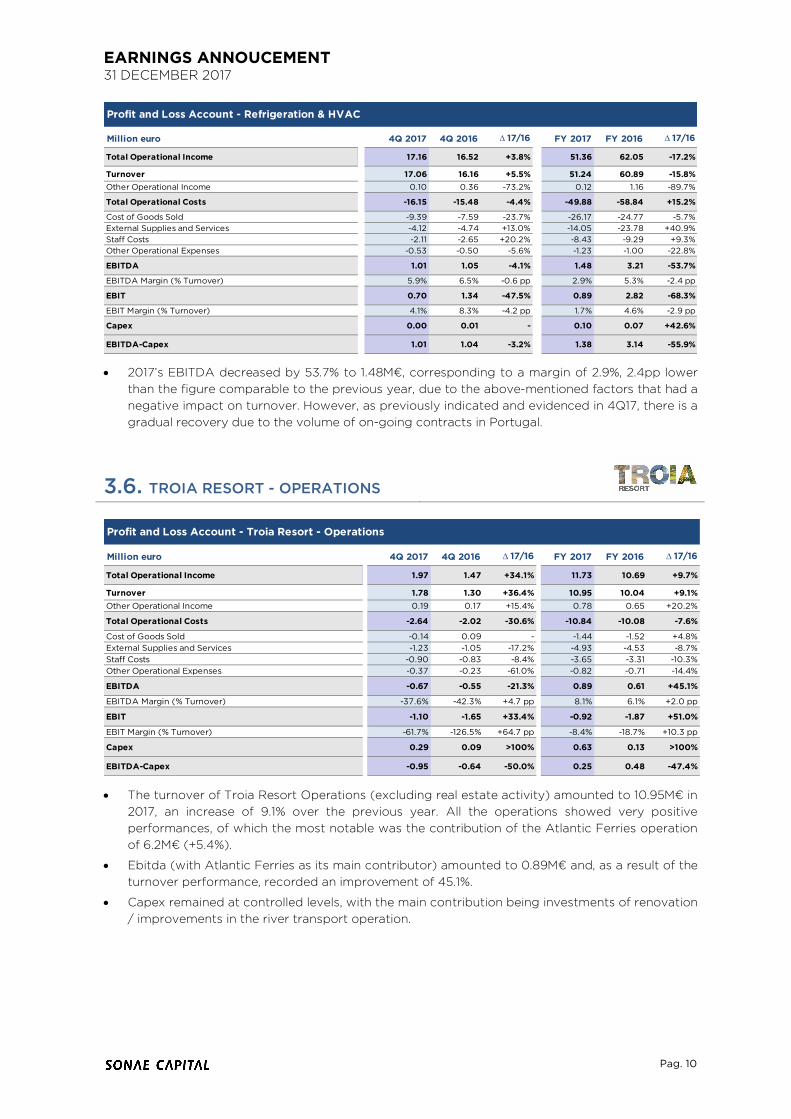
3.5. REFRIGERATION & HVAC • 2017’s turnover showed an expected decrease of 15.8% to 51.2M€, compared to the same period
of last year, due to the delivery of a major international project in 2016 which influenced positively the previous year. This decrease in activity was partially offset in 4Q17, when the activity was 5.5% higher than in the same quarter of the previous year.
• It should be noted that the backlog on the Portuguese operation, at the end of the period, amounts to 23.2M€, representing approximately 5.4 months of turnover, indicating a continued recovery of activity levels in the upcoming quarters, particularly in the Refrigeration segment. Profitability recovery will remain the key challenge going forward.
Million euro 4Q 2017 4Q 2016 D 17/16 FY 2017 FY 2016 D 17/16
Total Operational Income 3.87 3.53 +9.5% 23.53 20.35 +15.7%
Turnover 3.72 3.37 +10.3% 22.96 19.76 +16.2%Other Operational Income 0.15 0.16 -6.6% 0.57 0.59 -2.7%
Total Operational Costs -5.15 -4.95 -4.0% -23.99 -22.60 -6.2%
Cost of Goods Sold -0.35 -0.34 -2.8% -1.77 -1.71 -3.8%External Supplies and Services -2.95 -2.94 -0.2% -14.69 -14.04 -4.6%Staff Costs -1.61 -1.47 -9.1% -6.70 -6.20 -8.0%Other Operational Expenses -0.24 -0.20 -25.0% -0.84 -0.66 -27.3%
EBITDA -1.28 -1.42 +9.9% -0.46 -2.26 +79.6%
EBITDA Margin (% Turnover) -34.4% -42.0% +7.7 pp -2.0% -11.4% +9.4 pp
EBIT -1.55 -1.71 +9.6% -1.52 -3.30 +54.0%
EBIT Margin (% Turnover) -41.7% -50.8% +9.2 pp -6.6% -16.7% +10.1 pp
Capex 0.20 0.13 +57.7% 0.95 1.36 -29.8%
EBITDA-Capex -1.48 -1.55 +4.2% -1.42 -3.62 +60.9%
# Units 5 5 5 5
Profit and Loss Account - Hospitality
EARNINGS ANNOUCEMENT 31 DECEMBER 2017
Pag. 10
• 2017’s EBITDA decreased by 53.7% to 1.48M€, corresponding to a margin of 2.9%, 2.4pp lower than the figure comparable to the previous year, due to the above-mentioned factors that had a negative impact on turnover. However, as previously indicated and evidenced in 4Q17, there is a gradual recovery due to the volume of on-going contracts in Portugal.
3.6. TROIA RESORT - OPERATIONS
• The turnover of Troia Resort Operations (excluding real estate activity) amounted to 10.95M€ in 2017, an increase of 9.1% over the previous year. All the operations showed very positive performances, of which the most notable was the contribution of the Atlantic Ferries operation of 6.2M€ (+5.4%).
• Ebitda (with Atlantic Ferries as its main contributor) amounted to 0.89M€ and, as a result of the turnover performance, recorded an improvement of 45.1%.
• Capex remained at controlled levels, with the main contribution being investments of renovation / improvements in the river transport operation.
Million euro 4Q 2017 4Q 2016 D 17/16 FY 2017 FY 2016 D 17/16
Total Operational Income 17.16 16.52 +3.8% 51.36 62.05 -17.2%
Turnover 17.06 16.16 +5.5% 51.24 60.89 -15.8%Other Operational Income 0.10 0.36 -73.2% 0.12 1.16 -89.7%
Total Operational Costs -16.15 -15.48 -4.4% -49.88 -58.84 +15.2%
Cost of Goods Sold -9.39 -7.59 -23.7% -26.17 -24.77 -5.7%External Supplies and Services -4.12 -4.74 +13.0% -14.05 -23.78 +40.9%Staff Costs -2.11 -2.65 +20.2% -8.43 -9.29 +9.3%Other Operational Expenses -0.53 -0.50 -5.6% -1.23 -1.00 -22.8%
EBITDA 1.01 1.05 -4.1% 1.48 3.21 -53.7%
EBITDA Margin (% Turnover) 5.9% 6.5% -0.6 pp 2.9% 5.3% -2.4 pp
EBIT 0.70 1.34 -47.5% 0.89 2.82 -68.3%
EBIT Margin (% Turnover) 4.1% 8.3% -4.2 pp 1.7% 4.6% -2.9 pp
Capex 0.00 0.01 - 0.10 0.07 +42.6%
EBITDA-Capex 1.01 1.04 -3.2% 1.38 3.14 -55.9%
Profit and Loss Account - Refrigeration & HVAC
Million euro 4Q 2017 4Q 2016 D 17/16 FY 2017 FY 2016 D 17/16
Total Operational Income 1.97 1.47 +34.1% 11.73 10.69 +9.7%
Turnover 1.78 1.30 +36.4% 10.95 10.04 +9.1%Other Operational Income 0.19 0.17 +15.4% 0.78 0.65 +20.2%
Total Operational Costs -2.64 -2.02 -30.6% -10.84 -10.08 -7.6%
Cost of Goods Sold -0.14 0.09 - -1.44 -1.52 +4.8%External Supplies and Services -1.23 -1.05 -17.2% -4.93 -4.53 -8.7%Staff Costs -0.90 -0.83 -8.4% -3.65 -3.31 -10.3%Other Operational Expenses -0.37 -0.23 -61.0% -0.82 -0.71 -14.4%
EBITDA -0.67 -0.55 -21.3% 0.89 0.61 +45.1%
EBITDA Margin (% Turnover) -37.6% -42.3% +4.7 pp 8.1% 6.1% +2.0 pp
EBIT -1.10 -1.65 +33.4% -0.92 -1.87 +51.0%
EBIT Margin (% Turnover) -61.7% -126.5% +64.7 pp -8.4% -18.7% +10.3 pp
Capex 0.29 0.09 >100% 0.63 0.13 >100%
EBITDA-Capex -0.95 -0.64 -50.0% 0.25 0.48 -47.4%
Profit and Loss Account - Troia Resort - Operations
EARNINGS ANNOUNCEMENT 31 DECEMBER 2017
Pag. 11
4. REAL ESTATE ASSETS
4.1. TROIA RESORT The Tróia Real Estate Assets Unit recorded a turnover of 15.4M€, as a result of the following contributions:
• 29 deeds of touristic units signed (2 in fractional regime), corresponding to 11.7M€. Despite the growth of 4 deeds compared to the previous year, the total value decreased by 18.2% due to the sales mix. It should be noted that, of those 29 deeds, 19 (65.5%) were covered by the guaranteed income product, compared to 13 (52% of total deeds) registered in the previous year.
It should also be noted that since the beginning of 2018 and to the date of this report, 5 deeds have been closed and 7 Promissory for Purchase and Sale Agreements and Reserves are still in stock, for a total amount of 4.7M€.
• The rents related to the assets held in operation (Hotels, Tróia Shopping, Car parks, Touristic Units in operation) amounted to 3.7M€, in line with the previous year.
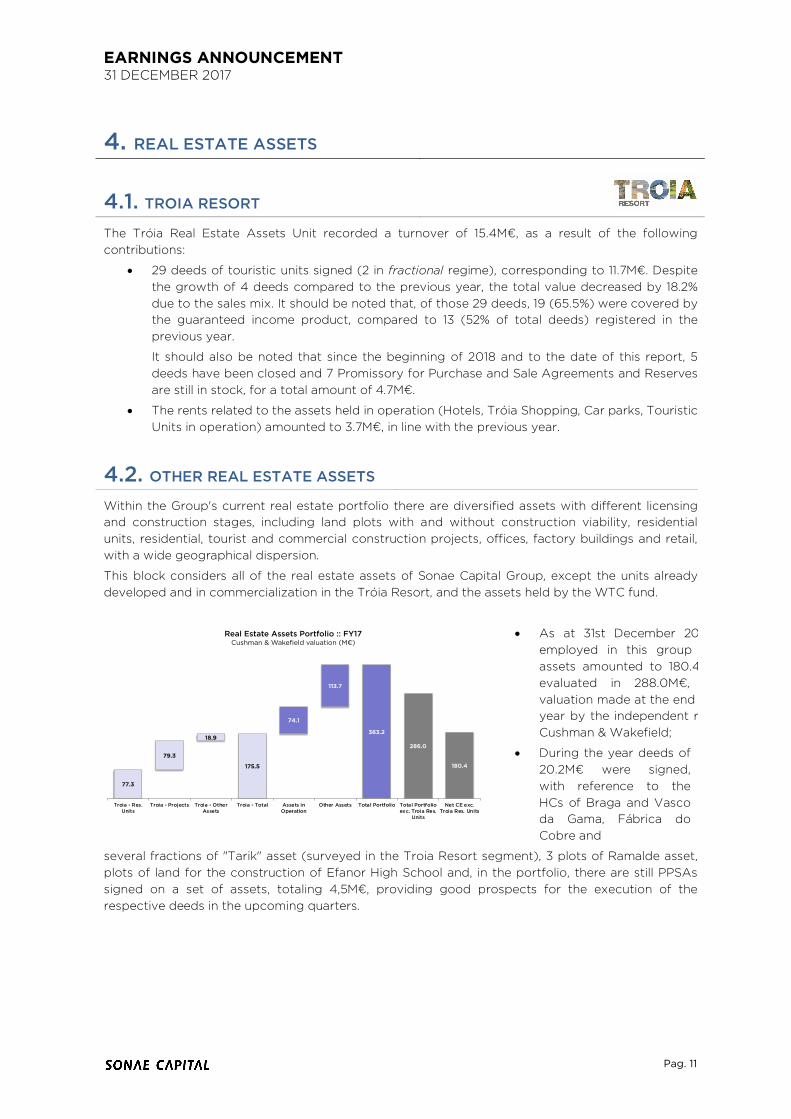
4.2. OTHER REAL ESTATE ASSETS Within the Group's current real estate portfolio there are diversified assets with different licensing and construction stages, including land plots with and without construction viability, residential units, residential, tourist and commercial construction projects, offices, factory buildings and retail, with a wide geographical dispersion.
This block considers all of the real estate assets of Sonae Capital Group, except the units already developed and in commercialization in the Tróia Resort, and the assets held by the WTC fund.
• As at 31st December 2017, the capital employed in this group of real estate assets amounted to 180.4M€, which are evaluated in 288.0M€, according to valuation made at the end of the previous year by the independent reference entity Cushman & Wakefield;
• During the year deeds of 20.2M€ were signed, with reference to the HCs of Braga and Vasco da Gama, Fábrica do Cobre and
several fractions of "Tarik" asset (surveyed in the Troia Resort segment), 3 plots of Ramalde asset, plots of land for the construction of Efanor High School and, in the portfolio, there are still PPSAs signed on a set of assets, totaling 4,5M€, providing good prospects for the execution of the respective deeds in the upcoming quarters.
77.3
79.3
18.9
175.5
74.1
113.7
363.2
286.0
180.4
Troia - Res.Units
Troia - Projects Troia - OtherAssets
Troia - Total Assets inOperation
Other Assets Total Portfolio Total Portfolioexc. Troia Res.
Units
Net CE exc.Troia Res. Units
Real Estate Assets Portfolio :: FY17Cushman & Wakefield valuation (M€)
EARNINGS ANNOUCEMENT 31 DECEMBER 2017
Pag. 12
5. CORPORATE INFORMATION
5.1. CORPORATE INFORMATION 4Q17 • As at 12th October 2017, Sonae Capital, SGPS, SA, announced that, through its subsidiary
CapWatt, SGPS, SA, acquired, from Sonae Arauco, SA, 90% of the share capital and the voting rights of the company "Sociedade de Iniciativa de Aproveitamentos Florestais - Energia, SA" (SIAF-Energia), for a global consideration of approximately 0.9 million Euros. This company owns and operates the biomass fired cogeneration plant installed in Sonae Arauco's industrial facility in Mangualde and owns a license to develop and operate a new biomass fired cogeneration plant with installed electric capacity of 10MW. The development of the new cogeneration plant and the correspondent investment, in global amount of 45 million Euros, will be executed by CapWatt.
• As at 17th November 2017 Sonae Capital, SGPS, SA, announced that it has entered into a sale and purchase agreement for the acquisition of 100% of the share capital and voting rights of the company About, SGPS, SA, which operates, through its subsidiaries, eight Fitness Clubs under the “Pump” brand.
5.2. SUBSEQUENT CORPORATE EVENTS • As at 12th January 2018 following the non-opposition decision of the Portuguese Competition
Authority (‘Autoridade da Concorrência’) and the fulfillment of certain conditions precedent, Sonae Capital, SGPS, SA announced that the above mentioned acquisition had become effective.
EARNINGS ANNOUNCEMENT 31 DECEMBER 2017
Pag. 13
6. METHODOLOGICAL NOTES The consolidated financial statements presented in this report are audited and have been prepared in accordance with the International Financial Reporting Standards ("IAS / IFRS"), issued by the International Accounting Standards Board ("IASB"), as adopted by the European Union.
With the aim of continuing to improve the quality and transparency of the information provided, not only at the Consolidated level, but also, at each Business Units level, and aligned with the best market practices, the international operations (Angola, Mozambique and Brazil) of the Refrigeration & HVAC segment are now considered assets held for sale and therefore their contribution to the consolidated results is recognized as discontinued operations. In order to maintain the information comparability, the 2016 figures are presented in appendix according to this new reality.
In addition, in order to better report the results of our business portfolio, aware of the significant differences between the fundamentals of each of our businesses, we now report clearly detailed information between Real Estate Assets and Business Units. In order to ensure comparability, we present the quarterly figures for 2016 and 2017 in the new layout, and we also present the 4Q17 in the former layout.
GLOSSARY
§ Capex = Investment in Tangible and Intangible Assets.
§ EBITDA = Operational Profit (EBIT) + Amortization and Depreciation + Provisions and
Impairment Losses + Impairment Losses of Real Estate Assets in Stocks (included in Costs
of Goods Sold) – Reversal of Impairment Losses and Provisions (including in Other
Operation Income).
§ EBITDA, excluding Guaranteed Income Provisions = EBITDA + Provisions related to the
estimated present value of potential costs for the full period of the Guaranteed Income from
real estate sales at Troia Resort.
§ EBITDAR = EBITDA + Building Rents.
§ Gearing: Debt to Equity = Net Debt / Equity.
§ HVAC = Heating, Ventilation and Air Conditioning. § Loan to Value (LTV) = Net Debt of real estate assets / Real estate assets Valuation.
§ Net Debt = Non-Current Loans + Current Loans – Cash and Cash Equivalents – Current
Investments.
§ Operational Cash Flow = EBITDA - Capex.
§ PPSA = Promissory Purchase and Sale Agreement.
§ RevPAR = Revenue Per Available Room.
EARNINGS ANNOUCEMENT 31 DECEMBER 2017
Pag. 14
APPENDIX
2018’s reporting layout:
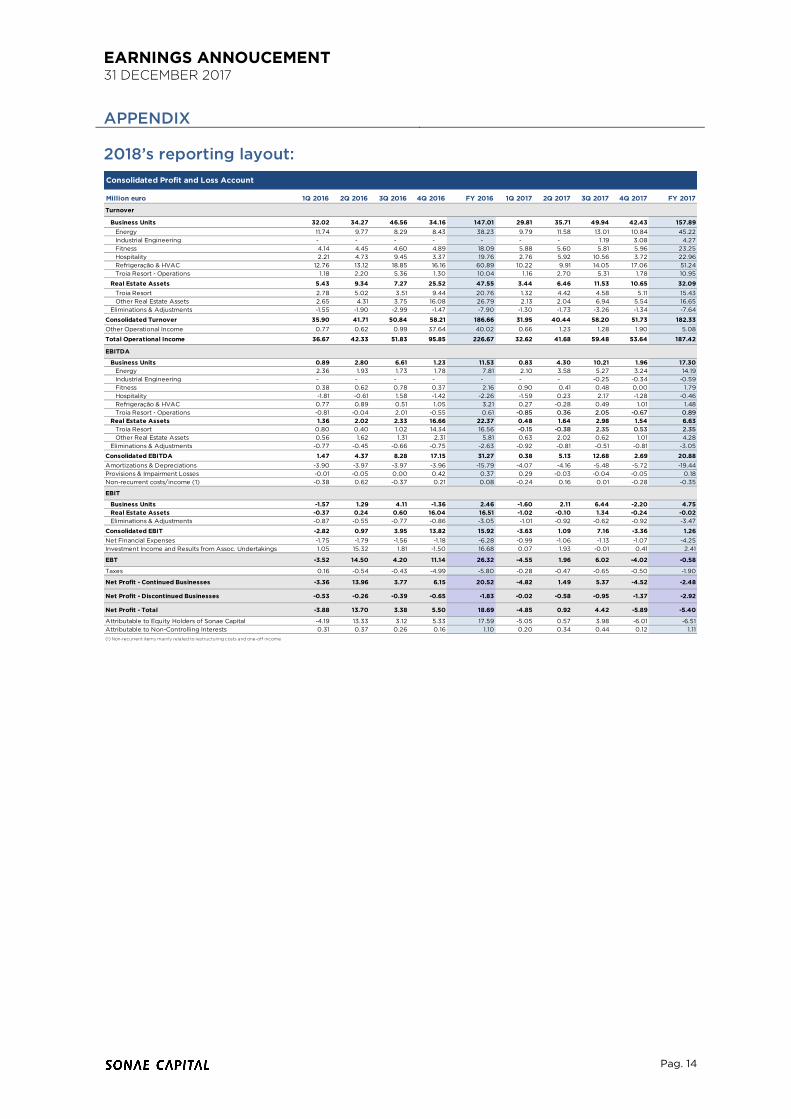
Consolidated Profit and Loss Account
Million euro 1Q 2016 2Q 2016 3Q 2016 4Q 2016 FY 2016 1Q 2017 2Q 2017 3Q 2017 4Q 2017 FY 2017
Turnover
Business Units 32.02 34.27 46.56 34.16 147.01 29.81 35.71 49.94 42.43 157.89Energy 11.74 9.77 8.29 8.43 38.23 9.79 11.58 13.01 10.84 45.22Industrial Engineering - - - - - - - 1.19 3.08 4.27Fitness 4.14 4.45 4.60 4.89 18.09 5.88 5.60 5.81 5.96 23.25Hospitality 2.21 4.73 9.45 3.37 19.76 2.76 5.92 10.56 3.72 22.96Refrigeração & HVAC 12.76 13.12 18.85 16.16 60.89 10.22 9.91 14.05 17.06 51.24Troia Resort - Operations 1.18 2.20 5.36 1.30 10.04 1.16 2.70 5.31 1.78 10.95
Real Estate Assets 5.43 9.34 7.27 25.52 47.55 3.44 6.46 11.53 10.65 32.09Troia Resort 2.78 5.02 3.51 9.44 20.76 1.32 4.42 4.58 5.11 15.43Other Real Estate Assets 2.65 4.31 3.75 16.08 26.79 2.13 2.04 6.94 5.54 16.65
Eliminations & Adjustments -1.55 -1.90 -2.99 -1.47 -7.90 -1.30 -1.73 -3.26 -1.34 -7.64
Consolidated Turnover 35.90 41.71 50.84 58.21 186.66 31.95 40.44 58.20 51.73 182.33Other Operational Income 0.77 0.62 0.99 37.64 40.02 0.66 1.23 1.28 1.90 5.08
Total Operational Income 36.67 42.33 51.83 95.85 226.67 32.62 41.68 59.48 53.64 187.42
EBITDA
Business Units 0.89 2.80 6.61 1.23 11.53 0.83 4.30 10.21 1.96 17.30Energy 2.36 1.93 1.73 1.78 7.81 2.10 3.58 5.27 3.24 14.19Industrial Engineering - - - - - - - -0.25 -0.34 -0.59Fitness 0.38 0.62 0.78 0.37 2.16 0.90 0.41 0.48 0.00 1.79Hospitality -1.81 -0.61 1.58 -1.42 -2.26 -1.59 0.23 2.17 -1.28 -0.46Refrigeração & HVAC 0.77 0.89 0.51 1.05 3.21 0.27 -0.28 0.49 1.01 1.48Troia Resort - Operations -0.81 -0.04 2.01 -0.55 0.61 -0.85 0.36 2.05 -0.67 0.89
Real Estate Assets 1.36 2.02 2.33 16.66 22.37 0.48 1.64 2.98 1.54 6.63Troia Resort 0.80 0.40 1.02 14.34 16.56 -0.15 -0.38 2.35 0.53 2.35Other Real Estate Assets 0.56 1.62 1.31 2.31 5.81 0.63 2.02 0.62 1.01 4.28
Eliminations & Adjustments -0.77 -0.45 -0.66 -0.75 -2.63 -0.92 -0.81 -0.51 -0.81 -3.05
Consolidated EBITDA 1.47 4.37 8.28 17.15 31.27 0.38 5.13 12.68 2.69 20.88Amortizations & Depreciations -3.90 -3.97 -3.97 -3.96 -15.79 -4.07 -4.16 -5.48 -5.72 -19.44Provisions & Impairment Losses -0.01 -0.05 0.00 0.42 0.37 0.29 -0.03 -0.04 -0.05 0.18Non-recurrent costs/income (1) -0.38 0.62 -0.37 0.21 0.08 -0.24 0.16 0.01 -0.28 -0.35
EBIT
Business Units -1.57 1.29 4.11 -1.36 2.46 -1.60 2.11 6.44 -2.20 4.75Real Estate Assets -0.37 0.24 0.60 16.04 16.51 -1.02 -0.10 1.34 -0.24 -0.02Eliminations & Adjustments -0.87 -0.55 -0.77 -0.86 -3.05 -1.01 -0.92 -0.62 -0.92 -3.47
Consolidated EBIT -2.82 0.97 3.95 13.82 15.92 -3.63 1.09 7.16 -3.36 1.26Net Financial Expenses -1.75 -1.79 -1.56 -1.18 -6.28 -0.99 -1.06 -1.13 -1.07 -4.25Investment Income and Results from Assoc. Undertakings 1.05 15.32 1.81 -1.50 16.68 0.07 1.93 -0.01 0.41 2.41
EBT -3.52 14.50 4.20 11.14 26.32 -4.55 1.96 6.02 -4.02 -0.58
Taxes 0.16 -0.54 -0.43 -4.99 -5.80 -0.28 -0.47 -0.65 -0.50 -1.90
Net Profit - Continued Businesses -3.36 13.96 3.77 6.15 20.52 -4.82 1.49 5.37 -4.52 -2.48
Net Profit - Discontinued Businesses -0.53 -0.26 -0.39 -0.65 -1.83 -0.02 -0.58 -0.95 -1.37 -2.92
Net Profit - Total -3.88 13.70 3.38 5.50 18.69 -4.85 0.92 4.42 -5.89 -5.40
Attributable to Equity Holders of Sonae Capital -4.19 13.33 3.12 5.33 17.59 -5.05 0.57 3.98 -6.01 -6.51Attributable to Non-Controlling Interests 0.31 0.37 0.26 0.16 1.10 0.20 0.34 0.44 0.12 1.11(1) Non-recurrent items mainly related to restructuring costs and one-off income

EARNINGS ANNOUNCEMENT 31 DECEMBER 2017
Pag. 15
Former reporting layout:
Consolidated Profit and Loss AccountMillion euro
1Q 2016 2Q 2016 3Q 2016 4Q 2016 FY 2016 1Q 2017 2Q 2017 3Q 2017 4Q 2017 FY 2017
Total Operational Income 36.67 42.33 51.83 95.85 226.67 32.62 41.68 59.48 53.64 187.42
Turnover 35.90 41.71 50.84 58.21 186.66 31.95 40.44 58.20 51.73 182.33Resorts 3.88 7.21 9.33 10.70 31.13 2.39 7.16 10.45 6.85 26.85Hospitality 2.10 4.34 7.35 3.21 17.00 2.67 5.41 8.18 3.51 19.77Fitness 4.14 4.45 4.60 4.89 18.09 5.88 5.60 5.81 5.96 23.25Energy 11.74 9.77 8.29 8.43 38.23 9.79 11.58 13.01 10.84 45.22Refrigeration & HVAC 12.76 13.12 18.85 16.16 60.89 10.22 9.91 14.05 17.06 51.24Industrial Engineering 0.00 0.00 0.00 0.00 0.00 0.00 0.00 1.19 3.08 4.27Real Estate Assets 2.65 4.31 3.75 16.08 26.79 2.13 2.04 6.94 5.54 16.65Others & Eliminations -1.37 -1.50 -1.34 -1.27 -5.47 -1.13 -1.26 -1.43 -1.09 -4.91
Other Operational Income 0.77 0.62 0.99 37.64 40.02 0.66 1.23 1.28 1.90 5.08
EBITDA, excluding Guaranteed Income Provisions (1) 1.55 4.48 8.36 17.24 31.63 0.44 5.24 12.72 2.77 21.17Resorts 0.01 0.46 3.28 13.83 17.57 -0.99 0.09 4.68 -0.11 3.67Hospitality -1.76 -0.59 1.40 -1.36 -2.30 -1.54 0.24 1.93 -1.23 -0.60Fitness 0.38 0.62 0.78 0.37 2.16 0.90 0.41 0.48 0.00 1.79Energy 2.36 1.93 1.73 1.78 7.81 2.10 3.58 5.27 3.24 14.19Refrigeration & HVAC 0.77 0.89 0.51 1.05 3.21 0.27 -0.28 0.49 1.01 1.48Industrial Engineering 0.00 0.00 0.00 0.00 0.00 0.00 0.00 -0.25 -0.34 -0.59Real Estate Assets 0.56 1.62 1.31 2.31 5.81 0.63 2.02 0.62 1.01 4.28Others & Eliminations -0.77 -0.45 -0.66 -0.75 -2.63 -0.92 -0.81 -0.51 -0.81 -3.05
Provisions for Guaranteed Income -0.07 -0.12 -0.08 -0.09 -0.36 -0.06 -0.11 -0.04 -0.07 -0.29EBITDA 1.47 4.37 8.28 17.15 31.27 0.38 5.13 12.68 2.69 20.88
Amortizations & Depreciations -3.90 -3.97 -3.97 -3.96 -15.79 -4.07 -4.16 -5.48 -5.72 -19.44Provisions & Impairment Losses -0.01 -0.05 0.00 0.42 0.37 0.29 -0.03 -0.04 -0.05 0.18Non-recurrent costs/income (2) -0.38 0.62 -0.37 0.21 0.08 -0.24 0.16 0.01 -0.28 -0.35EBIT -2.82 0.97 3.95 13.82 15.92 -3.63 1.09 7.16 -3.36 1.26
Net Financial Expenses -1.75 -1.79 -1.56 -1.18 -6.28 -0.99 -1.06 -1.13 -1.07 -4.25Investment Income and Results from Assoc. Undertakings 1.05 15.32 1.81 -1.50 16.68 0.07 1.93 -0.01 0.41 2.41
EBT -3.52 14.50 4.20 11.14 26.32 -4.55 1.96 6.02 -4.02 -0.58
Taxes 0.16 -0.54 -0.43 -4.99 -5.80 -0.28 -0.47 -0.65 -0.50 -1.90
Net Profit - Continued Businesses -3.36 13.96 3.77 6.15 20.52 -4.82 1.49 5.37 -4.52 -2.48
Net Profit - Discontinued Businesses -0.53 -0.26 -0.39 -0.65 -1.83 -0.02 -0.58 -0.95 -1.37 -2.92
Net Profit - Total -3.88 13.70 3.38 5.50 18.69 -4.85 0.92 4.42 -5.89 -5.40
Attributable to Equity Holders of Sonae Capital -4.19 13.33 3.12 5.33 17.59 -5.05 0.57 3.98 -6.01 -6.51Attributable to Non-Controlling Interests 0.31 0.37 0.26 0.16 1.10 0.20 0.34 0.44 0.12 1.11(1) EBITDA excluding the estimated present value of the potencial costs for the period of the Guaranteed Income from real estate sales in Troia Resort
(2) Non-recurrent items mainly related to restructuring costs and one-off income
EARNINGS ANNOUCEMENT 31 DECEMBER 2017
Pag. 16
CONTACTS Anabela Nogueira de Matos Representative for Capital Market Relations E-mail: [email protected] Tel.: +351 220129528 Fax: +351 220107900 Nuno Parreiro Investor Relations Officer E-mail: [email protected] Tel.: +351 220107903 Fax: +351 220107935 Sonae Capital, SGPS, SA Lugar do Espido, Via Norte Apartado 3053 4471 – 907 Maia Portugal www.sonaecapital.pt