earnings results - cnx midstream partners lp/media/files/c/cnx-midstream/... · 2018-05-03 ·...
TRANSCRIPT
Earnings ResultsFirst Quarter 2018
May 3, 2018

Cautionary Language
2
Risk Factors. This presentation, including the oral statements made in connection herewith, contains forward-looking statements within the meaning of the federal securities laws. Statements that
are predictive in nature, that depend upon or refer to future events or conditions or that include the words “will,” “believe,” “expect,” “anticipate,” “intend,” “estimate” and other expressions that are
predictions of or indicate future events and trends and that do not relate to historical matters identify forward-looking statements. You should not place undue reliance on forward-looking
statements. Forward-looking statements are not guarantees of future performance and involve certain risks, uncertainties and assumptions that are difficult to predict, and there can be no
assurance that actual outcomes and results will not differ materially from those expected by our management. Specific factors that could cause actual results to differ materially from those
conveyed in the forward-looking statements, including, among others, that our business plans may change as circumstances warrant, are described in detail under the “Risk Factors” and “Forward-
Looking Statements” sections of our Annual Report on Form 10-K for the year ended December 31, 2017 and Quarterly Reports on Form 10-Q.
These risks, contingencies and uncertainties relate to, among other matters, completion of transactions; reduction in the volumes of natural gas and condensate transported through our gathering
systems; dependence on our operating subsidiaries; operational risks, including those relating to geography; our capital needs and business strategies; the impact on laws and regulations on our
business and industry; ability to make cash distributions; and other factors, many of which are beyond our control. We undertake no obligation to publicly update or revise any forward-looking
statement, whether as a result of new information, future events, changed circumstances or otherwise, unless required by law. Should one or more of the risks or uncertainties described in this
presentation occur, or should underlying assumptions prove incorrect, CNX Midstream Partners LP’s (“CNXM”) actual results and plans could differ materially from those expressed in any forward-
looking statements.
Distributions. Distributions from CNXM to unitholders are not guaranteed and are subject to various factors, including prevailing economic conditions, and are subject to prior approval by the
Board of Directors of CNXM’s general partner;
Data. This presentation has been prepared by CNXM and includes market data and other statistical information from sources believed by CNXM to be reliable, including independent industry
publications, government publications or other published independent sources. Some data are also based on CNXM’s good faith estimates, which are derived from its review of internal sources as
well as the independent sources described above. Although CNXM believes these sources are reliable, it has not independently verified the information and cannot guarantee its accuracy and
completeness.
Reconciliation. As it relates to the disclosures within this presentation of projected Adjusted EBITDA for fiscal or quarterly periods in 2018-2022, CNXM is unable to provide a reconciliation of such
metrics to projected operating income, the most directly comparable financial measure calculated in accordance with GAAP, due to the unknown effect, timing, and potential significance of certain
income statement items for CNXM.
Trademarks. CNXM owns or has rights to various trademarks, service marks and trade names that it uses in connection with the operation of its business. This presentation also contains
trademarks, service marks and trade names of third parties, which are the property of their respective owners. CNXM’s use or display of third parties’ trademarks, service marks, trade names or
products in this presentation is not intended to, and does not imply, a relationship with CNXM or an endorsement or sponsorship by or of CNXM. Solely for convenience, the trademarks, service
marks and trade names referred to in this presentation may appear without the ®, TM or SM symbols, but such references are not intended to indicate, in any way, that CNXM will not assert, to the
fullest extent under applicable law, its rights or the right of the applicable licensor to these trademarks, service marks and trade names.
Not an Offer. This presentation does not constitute an offer to sell or a solicitation of offers to buy securities of CNX Midstream Partners LP.
Q1 2018 Results
3
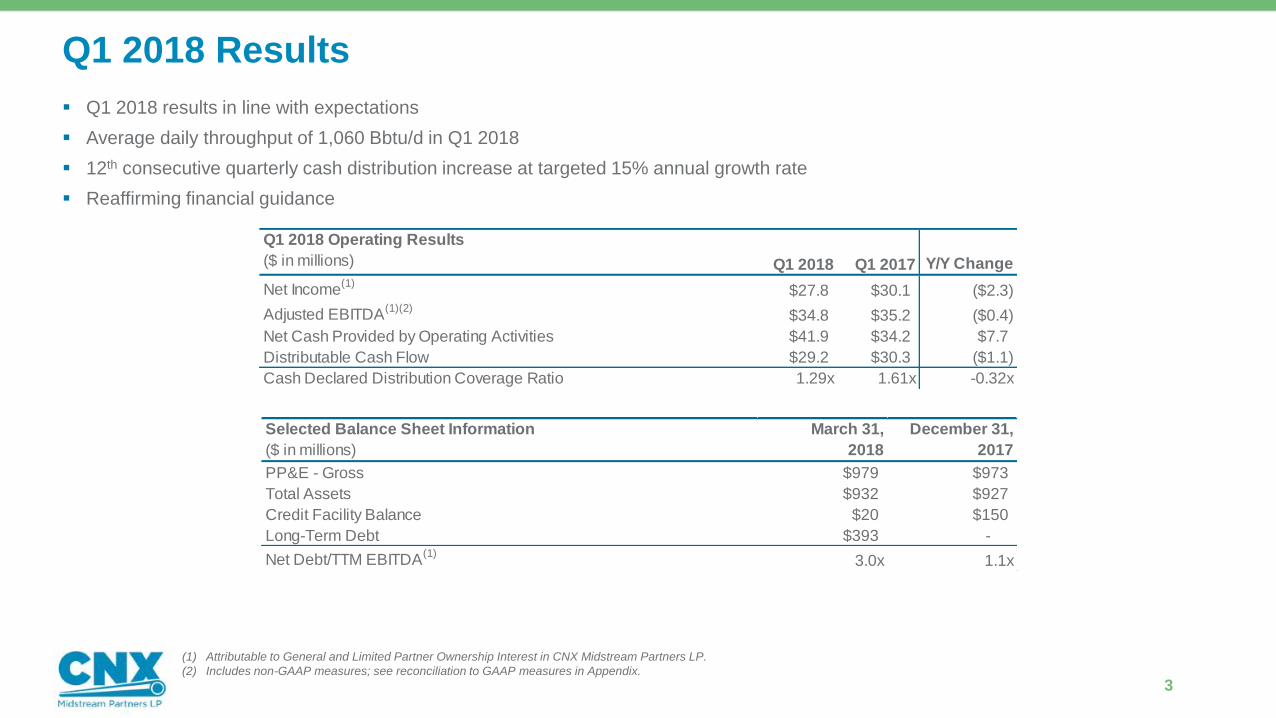
▪ Q1 2018 results in line with expectations
▪ Average daily throughput of 1,060 Bbtu/d in Q1 2018
▪ 12th consecutive quarterly cash distribution increase at targeted 15% annual growth rate
▪ Reaffirming financial guidance
Q1 2018 Operating Results
($ in millions) Q1 2018 Q1 2017 Y/Y Change
Net Income(1)
$27.8 $30.1 ($2.3)
Adjusted EBITDA(1)(2)
$34.8 $35.2 ($0.4)
Net Cash Provided by Operating Activities $41.9 $34.2 $7.7
Distributable Cash Flow $29.2 $30.3 ($1.1)
Cash Declared Distribution Coverage Ratio 1.29x 1.61x -0.32x
(1) Attributable to General and Limited Partner Ownership Interest in CNX Midstream Partners LP.
(2) Includes non-GAAP measures; see reconciliation to GAAP measures in Appendix.
Selected Balance Sheet Information
($ in millions)
March 31,
2018
December 31,
2017
PP&E - Gross $979 $973
Total Assets $932 $927
Credit Facility Balance $20 $150
Long-Term Debt $393 -
Net Debt/TTM EBITDA(1)
3.0x 1.1x
CNXM Agreement with CNX Resources and HG Energy II
4
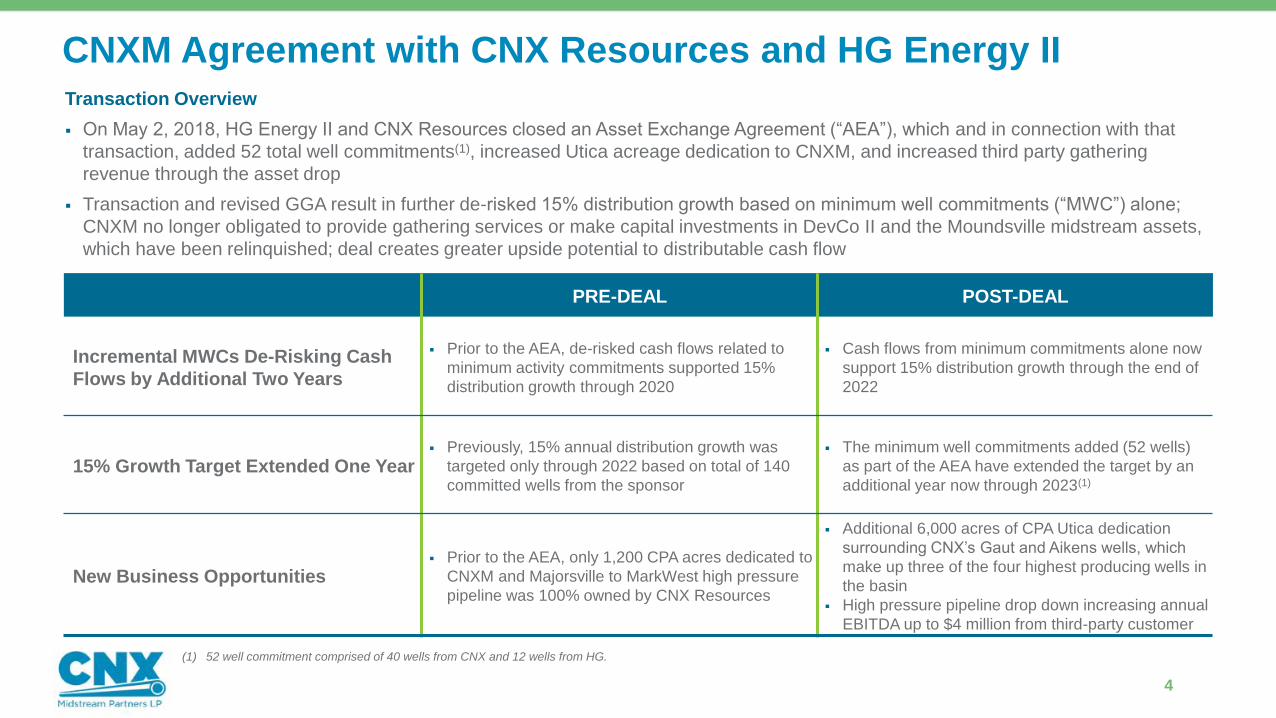
PRE-DEAL POST-DEAL
Incremental MWCs De-Risking Cash
Flows by Additional Two Years
▪ Prior to the AEA, de-risked cash flows related to
minimum activity commitments supported 15%
distribution growth through 2020
▪ Cash flows from minimum commitments alone now
support 15% distribution growth through the end of
2022
15% Growth Target Extended One Year▪ Previously, 15% annual distribution growth was
targeted only through 2022 based on total of 140
committed wells from the sponsor
▪ The minimum well commitments added (52 wells)
as part of the AEA have extended the target by an
additional year now through 2023(1)
New Business Opportunities▪ Prior to the AEA, only 1,200 CPA acres dedicated to
CNXM and Majorsville to MarkWest high pressure
pipeline was 100% owned by CNX Resources
▪ Additional 6,000 acres of CPA Utica dedication
surrounding CNX’s Gaut and Aikens wells, which
make up three of the four highest producing wells in
the basin
▪ High pressure pipeline drop down increasing annual
EBITDA up to $4 million from third-party customer
Transaction Overview
▪ On May 2, 2018, HG Energy II and CNX Resources closed an Asset Exchange Agreement (“AEA”), which and in connection with that
transaction, added 52 total well commitments(1), increased Utica acreage dedication to CNXM, and increased third party gathering
revenue through the asset drop
▪ Transaction and revised GGA result in further de-risked 15% distribution growth based on minimum well commitments (“MWC”) alone;
CNXM no longer obligated to provide gathering services or make capital investments in DevCo II and the Moundsville midstream assets,
which have been relinquished; deal creates greater upside potential to distributable cash flow
(1) 52 well commitment comprised of 40 wells from CNX and 12 wells from HG.
Details of HG Energy Asset Exchange Agreement
5
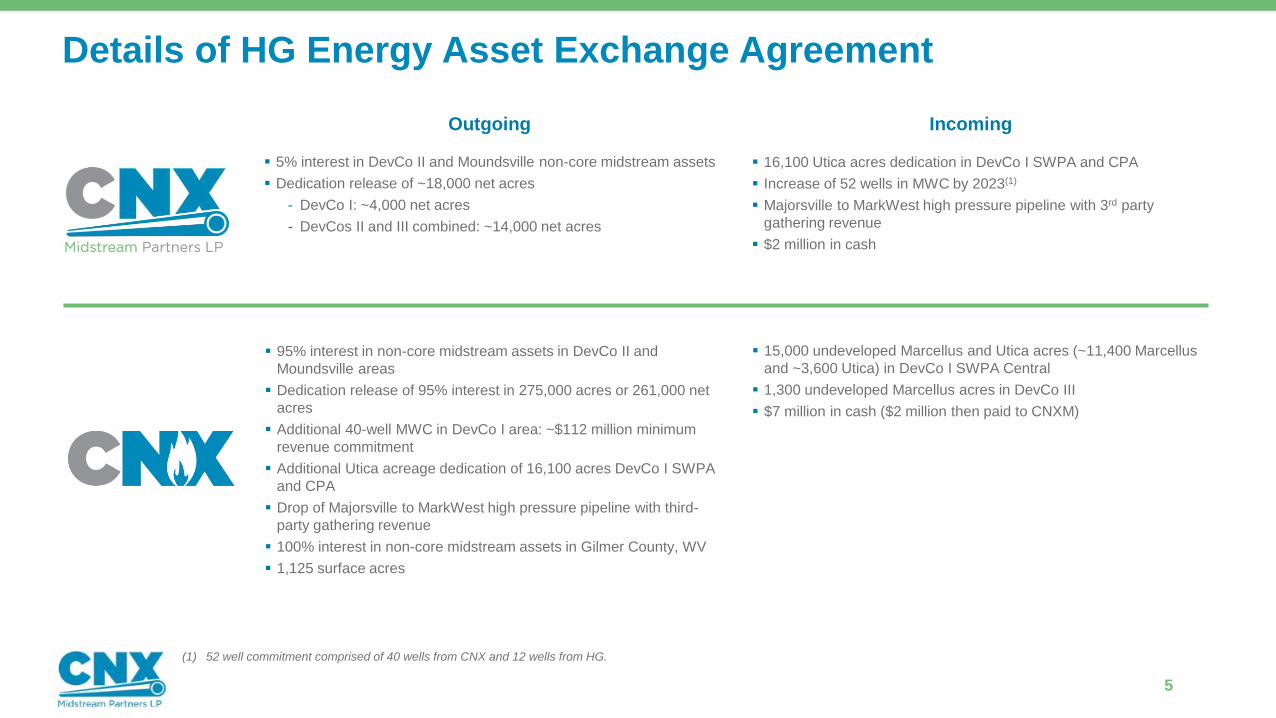
Outgoing Incoming
▪ 95% interest in non-core midstream assets in DevCo II and
Moundsville areas
▪ Dedication release of 95% interest in 275,000 acres or 261,000 net
acres
▪ Additional 40-well MWC in DevCo I area: ~$112 million minimum
revenue commitment
▪ Additional Utica acreage dedication of 16,100 acres DevCo I SWPA
and CPA
▪ Drop of Majorsville to MarkWest high pressure pipeline with third-
party gathering revenue
▪ 100% interest in non-core midstream assets in Gilmer County, WV
▪ 1,125 surface acres
▪ 15,000 undeveloped Marcellus and Utica acres (~11,400 Marcellus
and ~3,600 Utica) in DevCo I SWPA Central
▪ 1,300 undeveloped Marcellus acres in DevCo III
▪ $7 million in cash ($2 million then paid to CNXM)
▪ 5% interest in DevCo II and Moundsville non-core midstream assets
▪ Dedication release of ~18,000 net acres
- DevCo I: ~4,000 net acres
- DevCos II and III combined: ~14,000 net acres
▪ 16,100 Utica acres dedication in DevCo I SWPA and CPA
▪ Increase of 52 wells in MWC by 2023(1)
▪ Majorsville to MarkWest high pressure pipeline with 3rd party
gathering revenue
▪ $2 million in cash
(1) 52 well commitment comprised of 40 wells from CNX and 12 wells from HG.
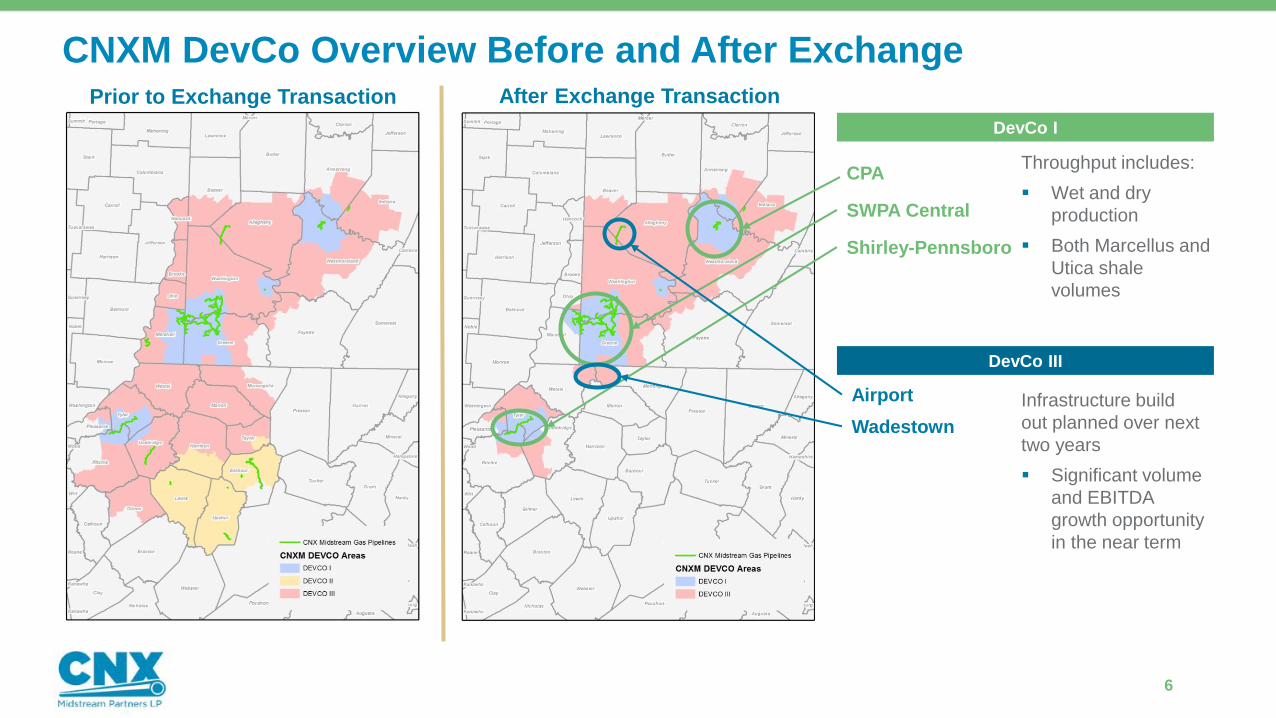
CNXM DevCo Overview Before and After Exchange
6
Prior to Exchange Transaction After Exchange Transaction
Wadestown
Shirley-Pennsboro
SWPA Central
CPA
DevCo I
DevCo III
Throughput includes:
▪ Wet and dry
production
▪ Both Marcellus and
Utica shale
volumes
Infrastructure build
out planned over next
two years
▪ Significant volume
and EBITDA
growth opportunity
in the near term
Airport

New MWCs and Revised GGA Drive De-Risked Growth
7
Agreement Time Period & Activity Commitment Total
Shirley-Penns MVC 2018 2019 2020 2021 2022 2023
Commitment (Bbtu/d) 130 130 153 175 200 175
Initial MWC 1/2018-12/2018 1/2019-4/2020 5/2020-4/2021 5/2021-4/2022
Commitment (wells) 30 40 40 30 140
MWC Post-Exchange
Agreement (add’l 52 wells)(1)
BY YE2021 2021-2023
Commitment (wells) 27 25 52
Total Well Commitments 192
Expected Cumulative Revenue(2)
Enhancing GGA for DevCo I
▪ New GGA creates more certainty on shipper terms
▪ Increases the likelihood of high-return gathering as volume growth utilizes
existing infrastructure
Min
. V
olu
me
Co
mm
itm
en
ts
Min
. W
ell
Co
mm
itm
en
ts
(1) 52 well commitment comprised of 40 wells from CNX and 12 wells from HG.
(2) Represents minimum revenue commitment under MWC and MVC terms.
$140$256
$358$449 $533 $611
$150
$306
$451
$590
$682$748
$290
$562
$809
$1,039
$1,214
$1,358
$0
$200
$400
$600
$800
$1,000
$1,200
$1,400
$1,600
2018E 2019E 2020E 2021E 2022E 2023E
$ in m
illio
ns
Cumulative Revenue from Minimum Revenue Commitments
Cumulative PDP Revenue
Allows focus on highest rate of return areas
▪ CNXM and CNX can now both focus capital and activity on wholly owned
and dedicated core-of-the-core acreage position and midstream systems
$0
$50
$100
$150
$200
$250
$300
$350
2017 2018E 2019E 2020E 2021E 2022E
$ in m
illio
ns
Upside Potential Above MVC & Commitments Activity Above MVC & Commitments - pre transaction
Activity Commitments - Pro Forma HG Transaction Activity Commitments - pre-transaction
Shirley-Penns MVC PDPs pre-S/P Drop
Total Distributions
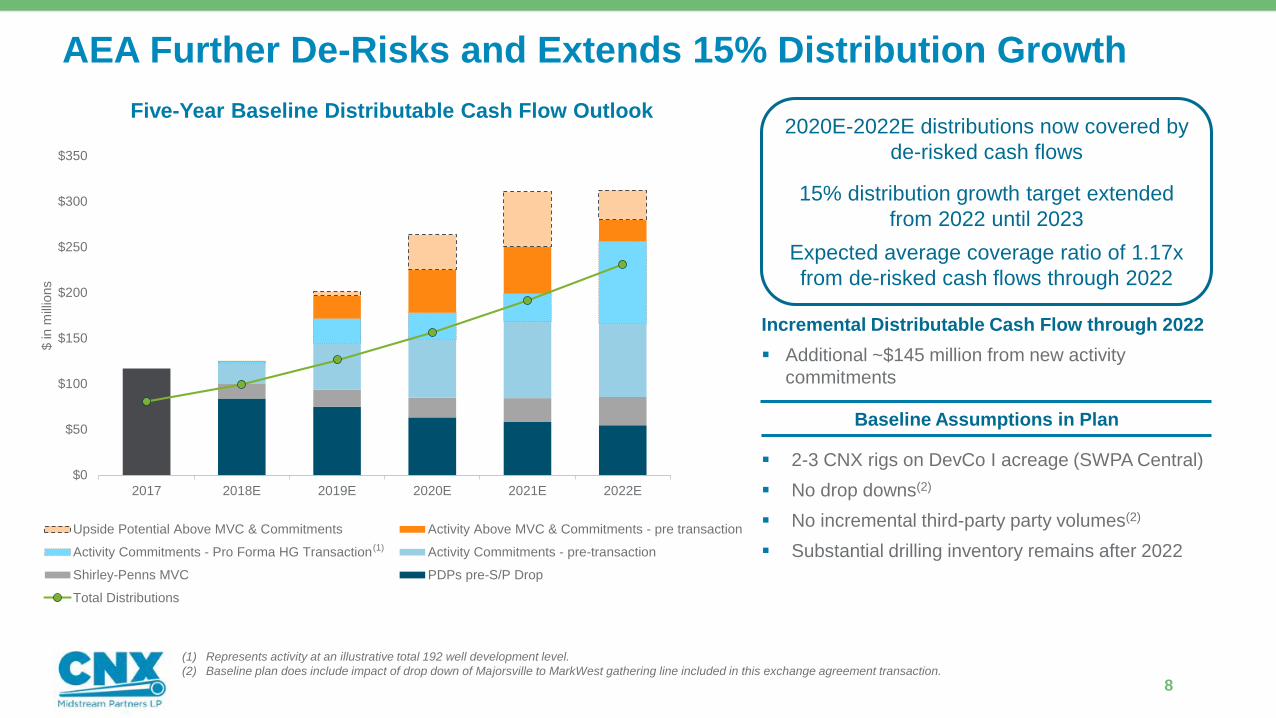
AEA Further De-Risks and Extends 15% Distribution Growth
8
(1) Represents activity at an illustrative total 192 well development level.
(2) Baseline plan does include impact of drop down of Majorsville to MarkWest gathering line included in this exchange agreement transaction.
Baseline Assumptions in Plan
▪ 2-3 CNX rigs on DevCo I acreage (SWPA Central)
▪ No drop downs(2)
▪ No incremental third-party party volumes(2)
▪ Substantial drilling inventory remains after 2022(1)
Five-Year Baseline Distributable Cash Flow Outlook
Incremental Distributable Cash Flow through 2022
▪ Additional ~$145 million from new activity
commitments
2020E-2022E distributions now covered by
de-risked cash flows
15% distribution growth target extended
from 2022 until 2023
Expected average coverage ratio of 1.17x
from de-risked cash flows through 2022

Transaction Expands Sponsor SWPA Central Marcellus Inventory
9
0
50
100
150
200
250
300
350
400
450
500
Entering 2018 2018 2019 2020 Year End 2020
Prior
Net SWPA
Central
Marcellus
Inventory
391Prior
Net SWPA
Central
Marcellus
Inventory
217
Additional
Locations from
HG Exchange
70
TILs 46
TILs 55
TILs 73
Additional
Locations from
HG Exchange
70
CNX SWPA Central Marcellus Inventory 2018E-2020E
SWPA Central Marcellus
locations remaining at
YE2020 based on current
development schedule287
Increase in remaining
SWPA Central Marcellus
locations due to Asset
Exchange Agreement 32%
461SWPA Central Marcellus
locations entering 2018(1)
(1) Some CNX SWPA Central Marcellus locations are located in DevCo III (i.e. Wadestown). All incremental inventory from transaction located in DevCo I.
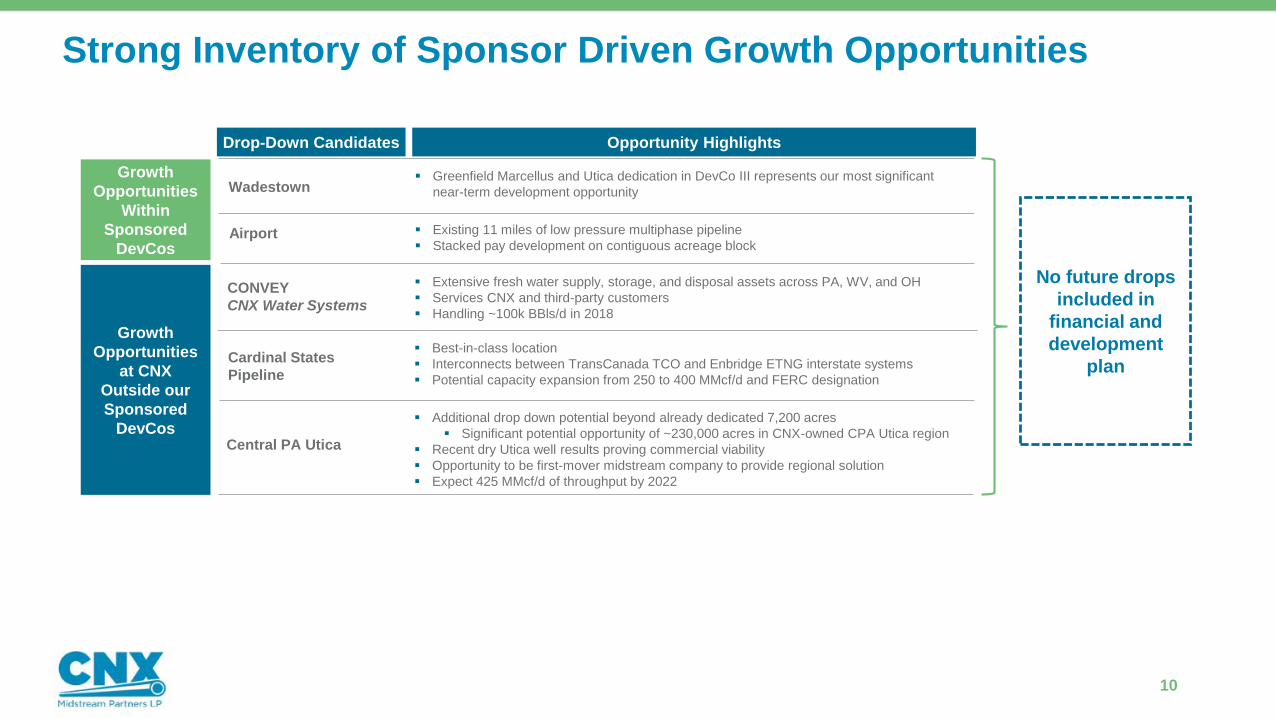
▪ Additional drop down potential beyond already dedicated 7,200 acres
▪ Significant potential opportunity of ~230,000 acres in CNX-owned CPA Utica region
▪ Recent dry Utica well results proving commercial viability
▪ Opportunity to be first-mover midstream company to provide regional solution
▪ Expect 425 MMcf/d of throughput by 2022
▪ Best-in-class location
▪ Interconnects between TransCanada TCO and Enbridge ETNG interstate systems
▪ Potential capacity expansion from 250 to 400 MMcf/d and FERC designation
▪ Extensive fresh water supply, storage, and disposal assets across PA, WV, and OH
▪ Services CNX and third-party customers
▪ Handling ~100k BBls/d in 2018
Strong Inventory of Sponsor Driven Growth Opportunities
10
Growth
Opportunities
Within
Sponsored
DevCos
Growth
Opportunities
at CNX
Outside our
Sponsored
DevCos
Drop-Down Candidates Opportunity Highlights
Wadestown
Airport
CONVEY
CNX Water Systems
Cardinal States
Pipeline
Central PA Utica
▪ Existing 11 miles of low pressure multiphase pipeline
▪ Stacked pay development on contiguous acreage block
▪ Greenfield Marcellus and Utica dedication in DevCo III represents our most significant
near-term development opportunity
No future drops
included in
financial and
development
plan
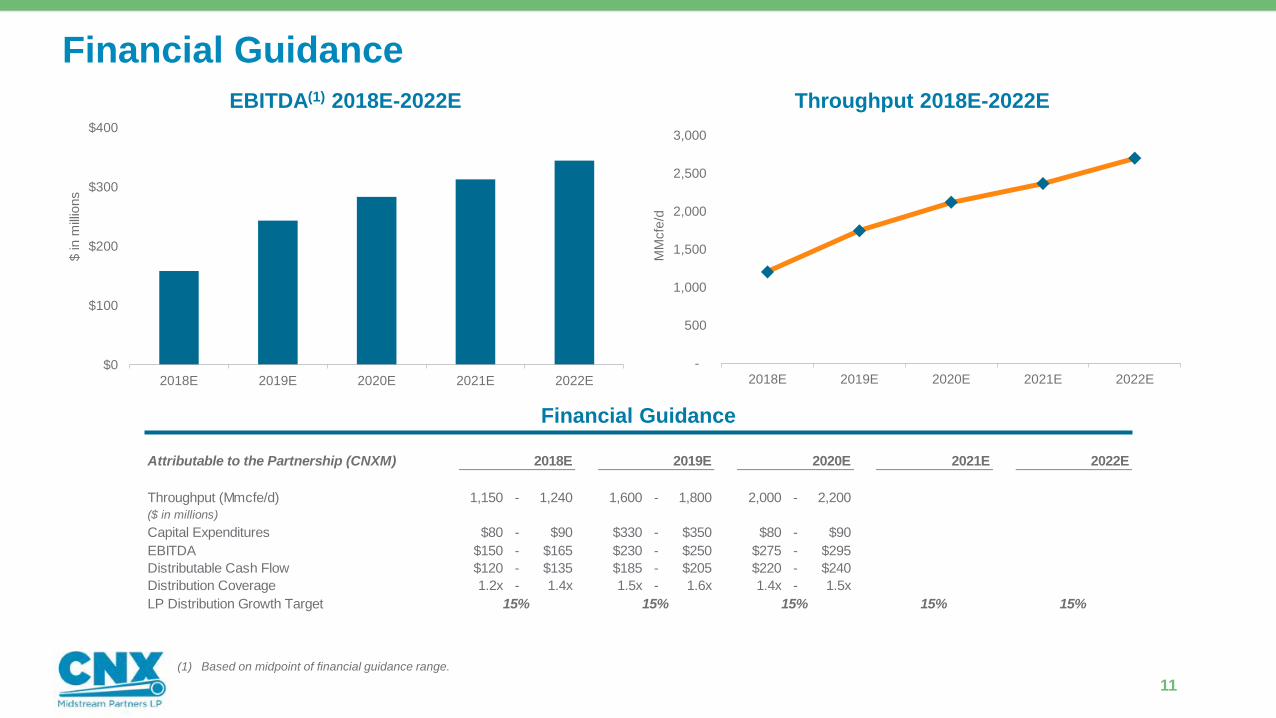
Attributable to the Partnership (CNXM) 2018E 2019E 2020E 2021E 2022E
Throughput (Mmcfe/d) 1,150 - 1,240 1,600 - 1,800 2,000 - 2,200
($ in millions)
Capital Expenditures $80 - $90 $330 - $350 $80 - $90
EBITDA $150 - $165 $230 - $250 $275 - $295
Distributable Cash Flow $120 - $135 $185 - $205 $220 - $240
Distribution Coverage 1.2x - 1.4x 1.5x - 1.6x 1.4x - 1.5x
LP Distribution Growth Target 15% 15%15% 15% 15%
Financial Guidance
11
EBITDA(1) 2018E-2022E
Financial Guidance
Throughput 2018E-2022E
$0
$100
$200
$300
$400
2018E 2019E 2020E 2021E 2022E
$ in m
illio
ns
-
500
1,000
1,500
2,000
2,500
3,000
2018E 2019E 2020E 2021E 2022E
MM
cfe
/d(1) Based on midpoint of financial guidance range.

Appendix
12

Non-GAAP ReconciliationEBITDA and Adjusted EBITDA
We define EBITDA as net income (loss) before net interest expense, depreciation and amortization, and Adjusted EBITDA as EBITDA adjusted for non-cash items which should not be included in
the calculation of distributable cash flow. EBITDA and Adjusted EBITDA are used as supplemental financial measures by management and by external users of our financial statements, such as
investors, industry analysts, lenders and ratings agencies, to assess:
▪ our operating performance as compared to those of other companies in the midstream energy industry, without regard to financing methods, historical cost basis or capital structure;
▪ the ability of our assets to generate sufficient cash flow to make distributions to our partners; our ability to incur and service debt and fund capital expenditures;
▪ and the viability of acquisitions and other capital expenditure projects and the returns on investment of various investment opportunities.
We believe that the presentation of EBITDA and Adjusted EBITDA provides information that is useful to investors in assessing our financial condition and results of operations. The GAAP
measures most directly comparable to EBITDA and Adjusted EBITDA are net income and net cash provided by operating activities. EBITDA and Adjusted EBITDA should not be considered
alternatives to net income, net cash provided by operating activities or any other measure of financial performance or liquidity presented in accordance with GAAP. EBITDA and Adjusted EBITDA
exclude some, but not all, items that affect net income or net cash, and these measures may vary from those of other companies. As a result, EBITDA and Adjusted EBITDA as presented below
may not be comparable to similarly titled measures of other companies.
Distributable Cash Flow
We define distributable cash flow as Adjusted EBITDA less net income attributable to noncontrolling interest, cash interest paid and maintenance capital expenditures, each net to the Partnership.
Distributable cash flow does not reflect changes in working capital balances.
Distributable cash flow is used as a supplemental financial measure by management and by external users of our financial statements, such as investors, industry analysts, lenders and ratings
agencies, to assess:
▪ the ability of our assets to generate cash sufficient to support our indebtedness and make future cash distributions to our unitholders; and
▪ the attractiveness of capital projects and acquisitions and the overall rates of return on alternative investment opportunities.
We believe that the presentation of distributable cash flow in this release provides information useful to investors in assessing our financial condition and results of operations. The GAAP
measures most directly comparable to distributable cash flow are net income and net cash provided by operating activities. Distributable cash flow should not be considered an alternative to net
income, net cash provided by operating activities or any other measure of financial performance or liquidity presented in accordance with GAAP. Distributable cash flow excludes some, but not all,
items that affect net income or net cash, and these measures may vary from those of other companies. As a result, our distributable cash flow may not be comparable to similarly titled measures
that other companies may use.
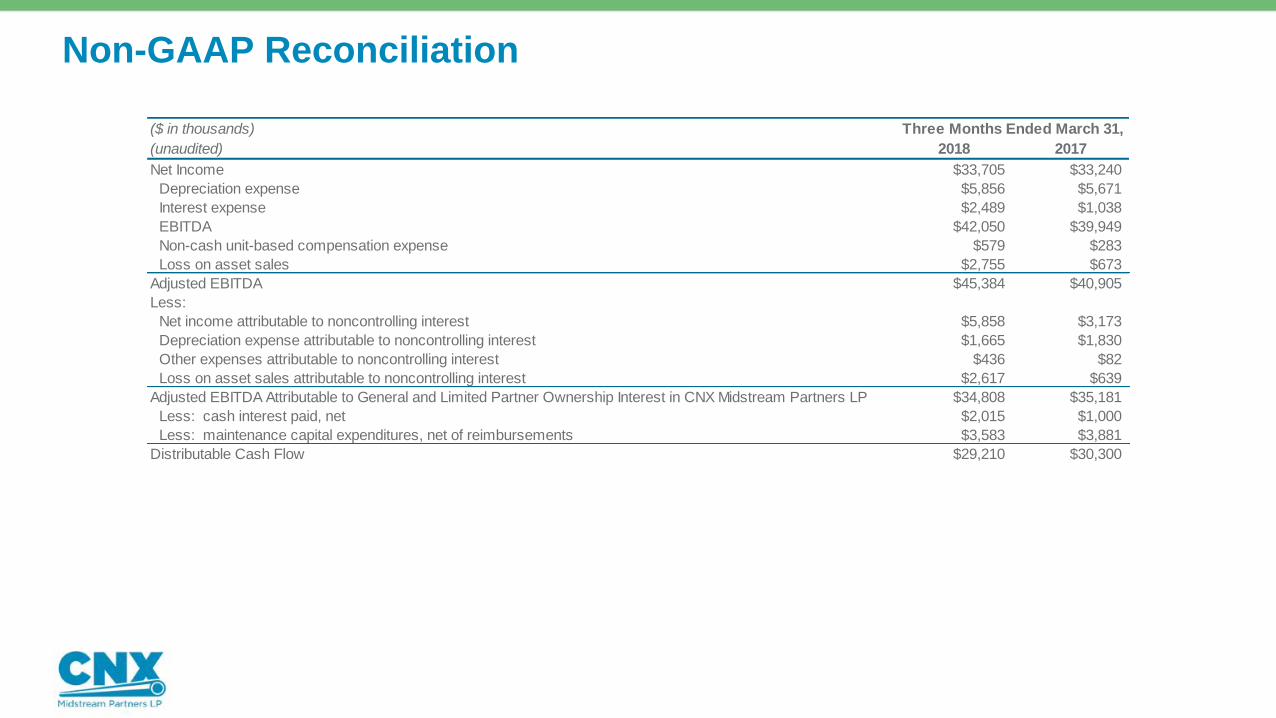
Non-GAAP Reconciliation
($ in thousands) Three Months Ended March 31,
(unaudited) 2018 2017
Net Income $33,705 $33,240
Depreciation expense $5,856 $5,671
Interest expense $2,489 $1,038
EBITDA $42,050 $39,949
Non-cash unit-based compensation expense $579 $283
Loss on asset sales $2,755 $673
Adjusted EBITDA $45,384 $40,905
Less:
Net income attributable to noncontrolling interest $5,858 $3,173
Depreciation expense attributable to noncontrolling interest $1,665 $1,830
Other expenses attributable to noncontrolling interest $436 $82
Loss on asset sales attributable to noncontrolling interest $2,617 $639
Adjusted EBITDA Attributable to General and Limited Partner Ownership Interest in CNX Midstream Partners LP $34,808 $35,181
Less: cash interest paid, net $2,015 $1,000
Less: maintenance capital expenditures, net of reimbursements $3,583 $3,881
Distributable Cash Flow $29,210 $30,300

Non-GAAP Reconciliation
($ in thousands) Twelve Months Ended
(unaudited) 3/31/2018 3/31/2017 12/31/2017
Net Income $134,527 $126,067 $134,062
Depreciation expense $22,877 $22,033 $22,692
Interest expense $6,011 $2,418 $4,560
EBITDA $163,415 $150,518 $161,314
Non-cash unit-based compensation expense $1,472 $922 $1,176
Loss on asset sales $5,996 $10,756 $3,914
Adjusted EBITDA $170,883 $162,196 $166,404
Less:
Net income attributable to noncontrolling interest $21,754 $24,304 $19,069
Depreciation expense attributable to noncontrolling interest $6,982 $9,141 $7,147
Other expenses attributable to noncontrolling interest $748 $514 $394
Loss on asset sales attributable to noncontrolling interest $5,696 $10,218 $3,718
Adjusted EBITDA Attributable to General and Limited Partner Ownership Interest in CNX Midstream Partners LP $135,703 $118,019 $136,076
Balance on Revolving Credit Facility $20,000 $162,000 $149,500
Long-Term Debt $392,647 - -
Cash $1,966 $6,018 $3,194
Net Debt $410,681 $155,982 $146,306
Net Debt / TTM Adjusted EBITDA 3.0x 1.3x 1.1x