earnings report - vivaaerobus · short-term loans and borrowing declined 63.9% between the second...
TRANSCRIPT

Earnings Report
2nd Quarter 2016 Grupo Viva Aerobus

Grupo Viva Aerobus announces results for the second quarter of 2016
Mexico City, Mexico, July 22, 2016- Grupo Viva Aerobus S.A. de C.V. (“Grupo Viva”), la holding of Aeroenlaces Nacionales, S.A. de C.V. ("VivaAerobus"), the carrier with the lowest costs in Latin America and rates comparable to bus transportation, announces today its second quarter earnings for 2016. The figures contained in this report are presented in accordance with the International Financial Reporting Standards (IFRS) and are expressed in millions of Mexican pesos unless otherwise stated.
2Q16 Earnings Highlights Total operating revenues in 2Q16 increased 42.1% to Ps. 1,317.5 million from the same quarter
in 2015.
Capacity measures in available seat kilometers (ASKs) totaled 1,772.2 million, representing an increase of 34.4% from 2Q15.
Revenue per available seat kilometer (RASK) in 2Q16 amounted to Ps. 74.3 cents, up 5.8% from 2Q15.
Cost per available seat kilometer (CASK) was Ps. 67.4 cents, 3.7% below the Ps. 70.0 cents in
2Q15.
EBITDAR in 2Q16 totaled Ps. 489.0 million, rising 121.4% from Ps. 220.9 million in 2Q15. EBITDAR margin in 2Q16 was 37.1%.
Net income in 2Q16 amounted to Ps. 286.5 million while we recorded a loss of Ps. 0.1 million
in 2Q15. The net income margin in the quarter was 21.7%.
At the close of the second quarter of 2016, the balance of cash and cash equivalents was Ps. 2,108.9 million, compared to Ps. 985.2 million recorded at the close of the second quarter of 2015, representing a 114.1% growth.

During the 2Q16, Grupo VivaAerobus added 2 new Airbus 320s to its fleet, closing the period with one of the most modern fleets in the world with 21 aircrafts, of which 19 Airbus 320s and 2 Boeing 737-300s, moving ahead to its goal of being an operator with a single type of aircrafts.
Juan Carlos Zuazua, CEO of Viva Aerobus, said: "Viva Aerobus´ team made this quarter the best second quarter in our history, which was enhanced by our transition fleet plan, which is already one of the youngest in the world, our continue focus on improving service to our passengers and by incorporating the latest technology in our systems.
“We increased the capacity and domestic passengers carried during the second quarter of the year, due to the successful implementation of the strategy of total renovation, which began with New Viva, as well as the work of all Viva Aerobus and our strict adherence to control costs. We will continue along this path to continue reporting operational and financial highlights”.
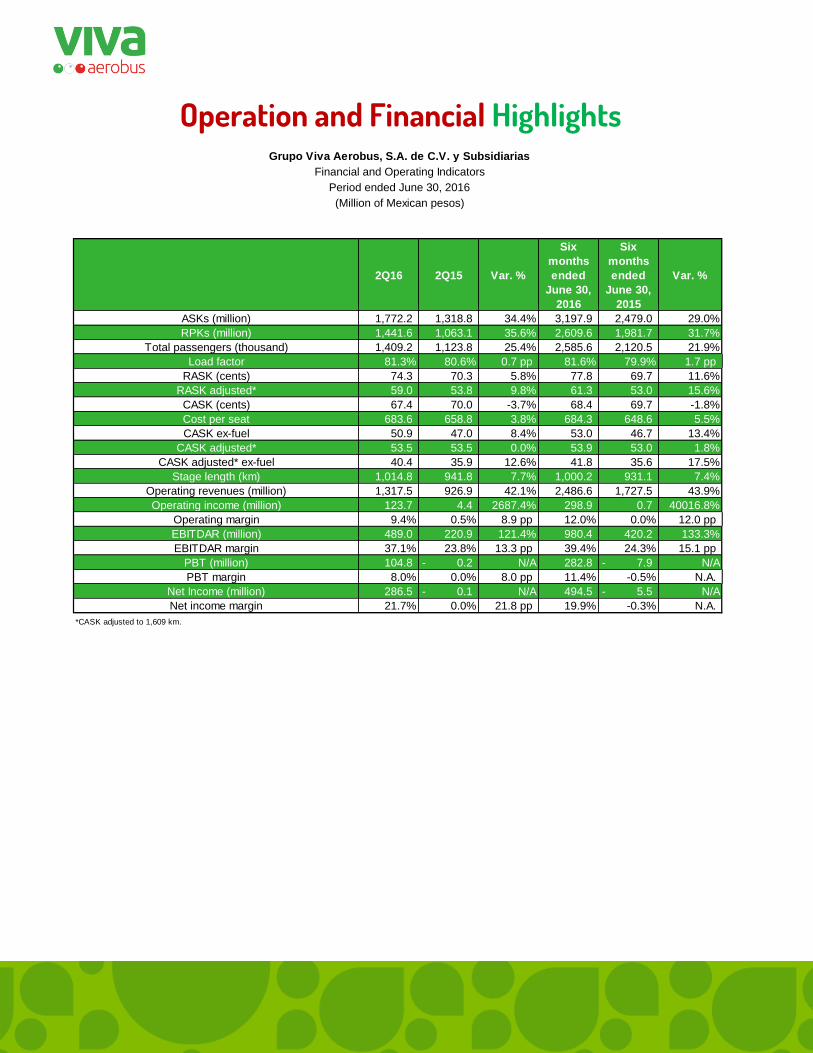
Operation and Financial Highlights
2Q16 2Q15 Var. %
Six
months
ended
June 30,
2016
Six
months
ended
June 30,
2015
Var. %
ASKs (million) 1,772.2 1,318.8 34.4% 3,197.9 2,479.0 29.0%
RPKs (million) 1,441.6 1,063.1 35.6% 2,609.6 1,981.7 31.7%
Total passengers (thousand) 1,409.2 1,123.8 25.4% 2,585.6 2,120.5 21.9%
Load factor 81.3% 80.6% 0.7 pp 81.6% 79.9% 1.7 pp
RASK (cents) 74.3 70.3 5.8% 77.8 69.7 11.6%
RASK adjusted* 59.0 53.8 9.8% 61.3 53.0 15.6%
CASK (cents) 67.4 70.0 -3.7% 68.4 69.7 -1.8%
Cost per seat 683.6 658.8 3.8% 684.3 648.6 5.5%
CASK ex-fuel 50.9 47.0 8.4% 53.0 46.7 13.4%
CASK adjusted* 53.5 53.5 0.0% 53.9 53.0 1.8%
CASK adjusted* ex-fuel 40.4 35.9 12.6% 41.8 35.6 17.5%
Stage length (km) 1,014.8 941.8 7.7% 1,000.2 931.1 7.4%
Operating revenues (million) 1,317.5 926.9 42.1% 2,486.6 1,727.5 43.9%
Operating income (million) 123.7 4.4 2687.4% 298.9 0.7 40016.8%
Operating margin 9.4% 0.5% 8.9 pp 12.0% 0.0% 12.0 pp
EBITDAR (million) 489.0 220.9 121.4% 980.4 420.2 133.3%
EBITDAR margin 37.1% 23.8% 13.3 pp 39.4% 24.3% 15.1 pp
PBT (million) 104.8 0.2- N/A 282.8 7.9- N/A
PBT margin 8.0% 0.0% 8.0 pp 11.4% -0.5% N.A.
Net Income (million) 286.5 0.1- N/A 494.5 5.5- N/A
Net income margin 21.7% 0.0% 21.8 pp 19.9% -0.3% N.A.
*CASK adjusted to 1,609 km.
Grupo Viva Aerobus, S.A. de C.V. y Subsidiarias
Financial and Operating Indicators
Period ended June 30, 2016
(Million of Mexican pesos)

Results summary Revenues
(Ps. Million) 2Q16 2Q15 Var. % Passengers $728.0 $593.5 22.7%
Service charge and others $589.5 $333.4 76.8% Total operating revenues $1,317.5 $926.9 42.1%
Operating revenues Total operating revenues in 2Q16 increased 42.1%, to Ps. 1,317.5 million, of which, 55.3% were passenger’s revenue at Ps. 728.0 million and the remaining 44.7% to service charge and others. This due to the increase in capacity and the rates.
Other revenues Other revenues amounted to Ps. 589.5 million in 2Q16, increasing 76.8% from the same last year period at Ps. 333.4 million.
Expenses
(Ps. Million) 2Q16 2Q15 Var. %
Total operating expenses $1,193.8 $922.5 29.4%
Total expenses Total operating expenses in 2Q16 totaled Ps. 1,193.8 million, increasing 29.4% from Ps. 992.5 million recorded in the same last year period. This due to the rental fee of the renovation of the fleet.

EBITDAR
(Ps. Million) 2Q16 2Q15 Var. %
EBITDAR $489.0 $220.0 121.4% EBITDAR margin % 37.1% 23.8% 13.3pp
At the close of 2Q16 EBITDAR amounted to Ps. 489.0 million, representing a substantial increase of 121.4% when compared to Ps. 220.9 million in 2Q15. EBITDAR margin in 2Q16 was 37.1%.
Net Income (Loss)
(Ps. Million) 2Q16 2Q15 Var. %
Net income (loss) $286.5 -$0.1 N.A. Net income margin 21.7% 0.0% N.A.
Net income at the close of 2Q16 amounted to Ps. 286.5 million, while we recorded a loss of Ps. 0.1 million in 2Q15. The net income margin for the quarter was 21.7%.
BALANCE SHEET
Assets
(Ps. Million) Jun 2016 Jun 2015 Var. %
Current Assets $2,590.5 $1,295.3 100.0% Non-current Assets $2,370.0 $2,767.9 -14.4%
Total Assets $4,960.5 $4,063.1 22.1%

Current Assets [Cash and cash equivalents, etc.] At the close of June 30, 2016, the cash and cash equivalent balance increased 114.1% to Ps. 2,108.9 million, compared to Ps. 985.2 million at the close of June 30, 2015.
Non-current Assets [Property, plant and equipment, deposits and other non-current assets] At the close of June 30, 2016, deposits in guarantee and pre-paid expenses decreased 33.2% to Ps. 1,398.2 million, compared to Ps. 2,091.9 million at the close of 2Q15.
Liabilities
(Ps. Million) Mar 2016 Mar 2015 Var. %
Short-term liabilities $2,238.5 $2,483.0 -9.8% Long-term liabilities $1,332.7 $1,190.5 11.9%
Total Liabilities $3,571.2 $3,673.5 -2.8%
Short-term liabilities [Loans and borrowings, accounts receivables, wages, taxes to be paid, etc.] Short-term loans and borrowing declined 63.9% between the second quarter of 2015 and the second quarter of 2016, dropping from Ps. 1,042.2 million to Ps. 376.0 million.
Long-term liabilities [Long-term loans and borrowings, other accounts receivables, provisions] The long-term liabilities rose 11.5% between June 30, 2015 and June 30, 2016, increasing from Ps. 1,028.6 million to Ps. 1,146.7 million.
Stockholders’ equity Total stockholders’ equity increased 256.6% to Ps. 1,389.3 million at the close of June 30, 2016 compared to Ps. 389.6 million at the close of June 30, 2015.

FLEET
Operating Fleet
Aircraft Jun 2016 Jun 2015 Var. %
Boeing 737-300 2 15 -86.7% Airbus 320 19 5 280.0%
At the close of June 30, 2016, Grupo VivaAerobus had a fleet of 21 aircraft, of which two are Boeing 737-300s and 19 are Airbus 320s. The current fleet reflects our transition plan which will lead VivaAerobus to be an operator with a single type of aircraft.

Relevant Corporate Events
RELEVANT EVENT #1
During the second quarter of 2016 Viva Aerobus received two new Airbus A320 aircraft with the FAA registry XA - VAU and XA - VAT, amounting to 19 Airbus 320 and 2 Boeing 737-300.
RELEVANT EVENT #2
During the second quarter of 2016, Viva Aerobus successfully implemented the passenger reservation system Navitaire, which allows a better management of reservations, and GoNow system which allows a simpler and orderly documentations.
As a technological platform, Navitaire provides Viva Aerobus the opportunity to tap into new markets, while improving its pricing strategy and generating additional revenue. Moreover, it allows to offer better connectivity with global agencies, as well as between airlines and between shared codes and self-Service passenger’s integration.
RELEVANT EVENT #3
During the second quarter of 2016, Viva Aerobus began operations in five new routes: Mexico City - Villahermosa, Mexico City - Tuxtla Gutierrez, Mexico City - Los Cabos, Mexico City – Chihuahua, and Guadalajara - Chihuahua.
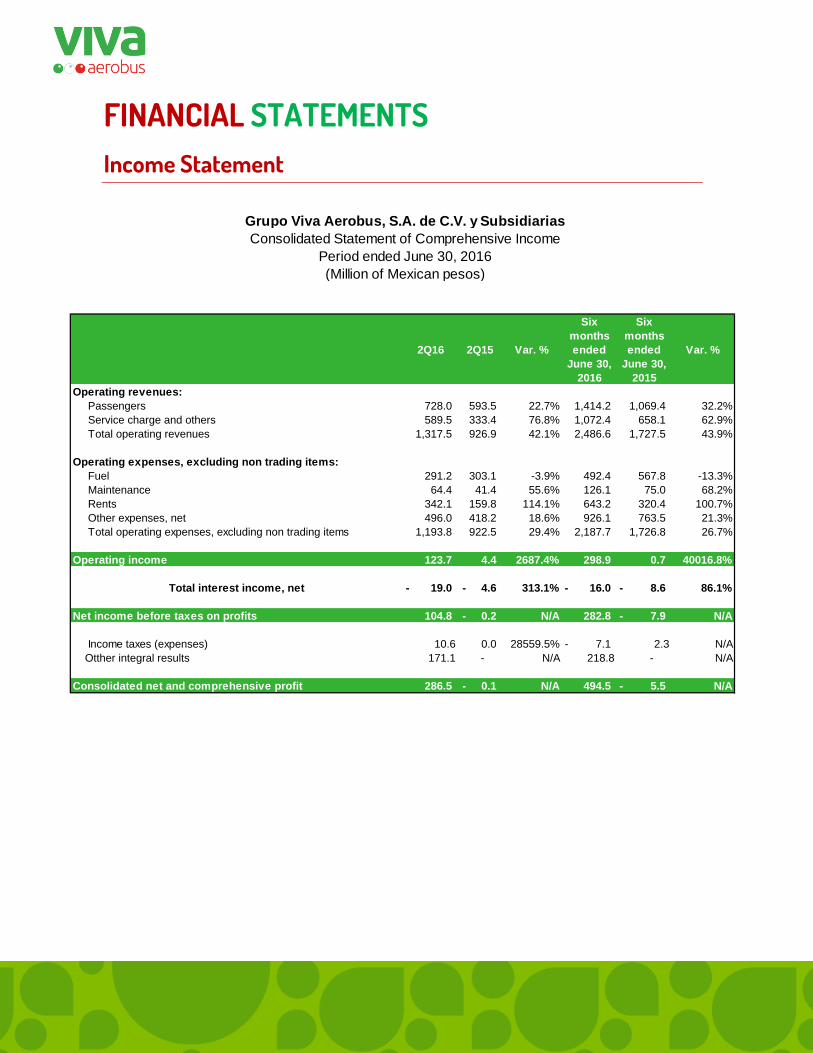
FINANCIAL STATEMENTS
Income Statement
2Q16 2Q15 Var. %
Six
months
ended
June 30,
2016
Six
months
ended
June 30,
2015
Var. %
Operating revenues:
Passengers 728.0 593.5 22.7% 1,414.2 1,069.4 32.2%
Service charge and others 589.5 333.4 76.8% 1,072.4 658.1 62.9%
Total operating revenues 1,317.5 926.9 42.1% 2,486.6 1,727.5 43.9%
Operating expenses, excluding non trading items:
Fuel 291.2 303.1 -3.9% 492.4 567.8 -13.3%
Maintenance 64.4 41.4 55.6% 126.1 75.0 68.2%
Rents 342.1 159.8 114.1% 643.2 320.4 100.7%
Other expenses, net 496.0 418.2 18.6% 926.1 763.5 21.3%
Total operating expenses, excluding non trading items 1,193.8 922.5 29.4% 2,187.7 1,726.8 26.7%
Operating income 123.7 4.4 2687.4% 298.9 0.7 40016.8%
Total interest income, net 19.0- 4.6- 313.1% 16.0- 8.6- 86.1%
Net income before taxes on profits 104.8 0.2- N/A 282.8 7.9- N/A
Income taxes (expenses) 10.6 0.0 28559.5% 7.1- 2.3 N/A
Otther integral results 171.1 - N/A 218.8 - N/A
Consolidated net and comprehensive profit 286.5 0.1- N/A 494.5 5.5- N/A
Grupo Viva Aerobus, S.A. de C.V. y Subsidiarias
Consolidated Statement of Comprehensive Income
Period ended June 30, 2016
(Million of Mexican pesos)

Balance Sheet
Six months
ended June 30,
2016
Six months
ended June 30,
2015
Var. %
Assets
Current assets 2,590.5 1,295.3 100.0%
Cash and cash equivalents 2,108.9 985.2 114.1%
Accounts receivable and others 126.9 128.6 -1.3%
Guarantee deposits and prepaid expenses 155.9 79.8 95.3%
Other current assets 198.9 101.7 95.5%
Non-current assets 2,370.0 2,767.9 -14.4%
Guarantee deposits and prepaid expenses 1,398.2 2,091.9 -33.2%
Other non-current assets 971.8 676.0 43.8%
Total Assets 4,960.5 4,063.1 22.1%
Liabilities and Stockholder's Equity
Current liabilities 2,238.5 2,483.0 -9.8%
Loans and borrowings 376.0 1,042.2 -63.9%
Air traffic liability 575.9 351.1 64.0%
Other short-term liabilities 1,286.6 1,089.7 18.1%
Long-term liabilities 1,332.7 1,190.5 11.9%
Loans and borrowings 1,146.7 1,028.6 11.5%
Other long-term liabilities 186.0 161.9 14.9%
Total liabilities 3,571.2 3,673.5 -2.8%
Stockholders' equity
Capital stock 552.2 552.2 0.0%
Other capital accounts 356.7 26.3 1256.5%
Retained profits (loss) 480.5 188.9- -354.3%
Total stockholders' equity 1,389.3 389.6 256.6%
Total liabilities and stockholders' equity 4,960.5 4,063.1 22.1%
Grupo Viva Aerobus, S.A. de C.V. y Subsidiarias
Consolidated Statement of Financial Position
Period ended June 30, 2016
(Million of Mexican pesos)

Cash Flow Statement
2Q16 2Q15 Var. %
Six
months
ended
June 30,
2016
Six
months
ended
June 30,
2015
Var. %
Net cash from operating activities 371.9 419.2 -11.3% 530.3 213.4 148.5%
Net cash used in investing activities 130.2 -221.8 N.A. 201.4 -835.8 N.A.
Net cash used in financing activities -224.7 92.8- 142.2% -432.6 1,090.9 N.A.
Effects of exchange rate fluctuations on cash and cash equivalents 8.3 1.5 453.8% 9.4 1.8 421.0%
Net increase in cash and cash equivalent 285.8 106.1 169.3% 308.4 470.3 -34.4%
Cash and cash equivalents at beginning of period 1,823.1 879.0 107.4% 1,800.5 514.9 249.7%
Cash and cash equivalents at end of period 2,108.9 985.2 114.1% 2,108.9 985.2 114.1%
Grupo Viva Aerobus, S.A. de C.V. y Subsidiarias
Consolidated Statement of Cash Flow
Period ended June 30, 2016
(Million of Mexican pesos)

Investor RELATIONS
Contacts
Juan Jorge Soto
Treasury Director and Investor
Relations
[email protected] + 52 (55) 5955 5512
Carla Núñez
Investor Relations
[email protected] [email protected]
+52 (55) 5955 5512
Lucia Domville
Grayling
[email protected] +1 (646) 284-9416
VivaAerobus
Insurgentes Norte 42, Mezzanine
Ciudad de México, C.P. 06400
México

Glossary ASKs: Available seat kilometers represents aircraft seating capacity multiplied by the number of kilometers the seats are flown. CASK: Cost per available seat kilometer represents operating expenses divided by available seat kilometers (ASKs). CASK ex-fuel: Represents operating expenses other than fuel divided by available seat kilometers (ASKs).
EBITDAR: Income before taxes, depreciation and amortization. It is calculated as revenues minus expenses, excluding taxes, interests, depreciation, amortization, restructuring and rental costs.
Load Factor: Represents the percentage of aircraft seating capacity that is actually used and is calculated by dividing revenue passenger kilometers by available seat kilometers (ASKs).
PDP Facility: Pre-delivery payments, corresponds to an agreement to finance the purchase of aircraft.
RASK: Operating revenue per available seat kilometer represents operating revenue divided by available seat kilometers.
RPKs: Revenue passenger kilometers represent the number of kilometers flown by revenue passengers.
Aircraft utilization: Represents the average number of block hours operated every day for each aircraft of the fleet.

Forward Looking Statements This press release can include forward-looking statements. Said statements are not based on historic information but rather on the vision of the current administration. The reader must understand that said statements or estimates imply risks and uncertainties that can change as a result of various factors that are not under the company’s control.
Viva Aerobus.com @Viva Aerobus Viva Aerobus