earnings release 2nd quarter — 2007 weyerhaeuser company august 3, 2007 dtp/3065 2007 q2.ppt...
TRANSCRIPT
Earnings Release2nd Quarter — 2007
Weyerhaeuser CompanyAugust 3, 2007
DTP/3065 2007 Q2.ppt • 0703/07 • 1

DTP/3065 2007 Q2.ppt • 0703/07 • 2
Forward-looking StatementThis presentation contains statements concerning the company’s future results and performance that are forward-looking statements within the meaning of the Private Securities Litigation Reform Act of 1995. Some of these forward-looking statements can be identified by the use of forward-looking terminology such as “expects,” “may,” “will,” “believes,” “should,” “approximately,” anticipates,” “estimates,” and “plans,” and the negative or other variations of those terms or comparable terminology or by discussions of strategy, plans or intentions. In particular, some of these forward-looking statements deal with expectations for third quarter 2007 regarding the company’s markets, earnings and performance of the company’s business segments, demand, pricing, shipments and sales realizations for the company’s products, fee harvests in the West and South, non-strategic land sales, manufacturing costs, SG&A costs, product mix, OCC, fiber and energy costs, scheduled annual maintenance outages, energy usage, home closings, non-homebuilding activities, and capital expenditures and CBPR cost-savings for the year and related matters. The accuracy of such statements is subject to a number of risks, uncertainties and assumptions that may cause actual results to differ materially from those projected, including, but not limited to: The effect of general economic conditions, including the level of interest rates and housing starts; Market demand for the company’s products, which may be tied to the relative strength of various U.S. business segments; Energy prices; Raw material prices; Chemical prices; Performance of the company’s manufacturing operations including unexpected maintenance requirements; The successful execution of internal performance plans; The level of competition from domestic and foreign producers; The effect of forestry, land use, environmental and other governmental regulations, and changes in accounting regulations; The effect of weather; The risk of loss from fires, floods, windstorms, hurricanes, pest infestation and other natural disasters; Transportation costs; Legal proceedings; The effect of timing of retirements and changes in the market price of company stock on charges for stock-based compensation; and Performance of pension fund investments and related derivatives.
The company is also a large exporter and is affected by changes in economic activity in Europe and Asia, particularly Japan, and by changes in currency exchange rates, particularly the relative value of the U.S. dollar to the Euro and the Canadian dollar, and restrictions on international trade or tariffs imposed on imports. These and other factors could cause or contribute to actual results differing materially from such forward-looking statements and, accordingly, no assurances can be given that any of the events anticipated by the forward-looking statements will occur, or if any of them occurs, what effect they will have on the company’s results of operations or financial condition. The company expressly declines any obligation to publicly revise any forward-looking statements that have been made to reflect the occurrence of events after the date of this presentation.
DTP/3065 2007 Q2.ppt • 0703/07 • 3
Statements Relating to Non-GAAP Financial Measures
During the course of this presentation, certain non-U.S. GAAP financial information will be presented. A reconciliation of those numbers to U.S. GAAP financial measures is included in this presentation which is available on the company’s website at www.weyerhaeuser.com
DTP/3065 2007 Q2.ppt • 0703/07 • 4
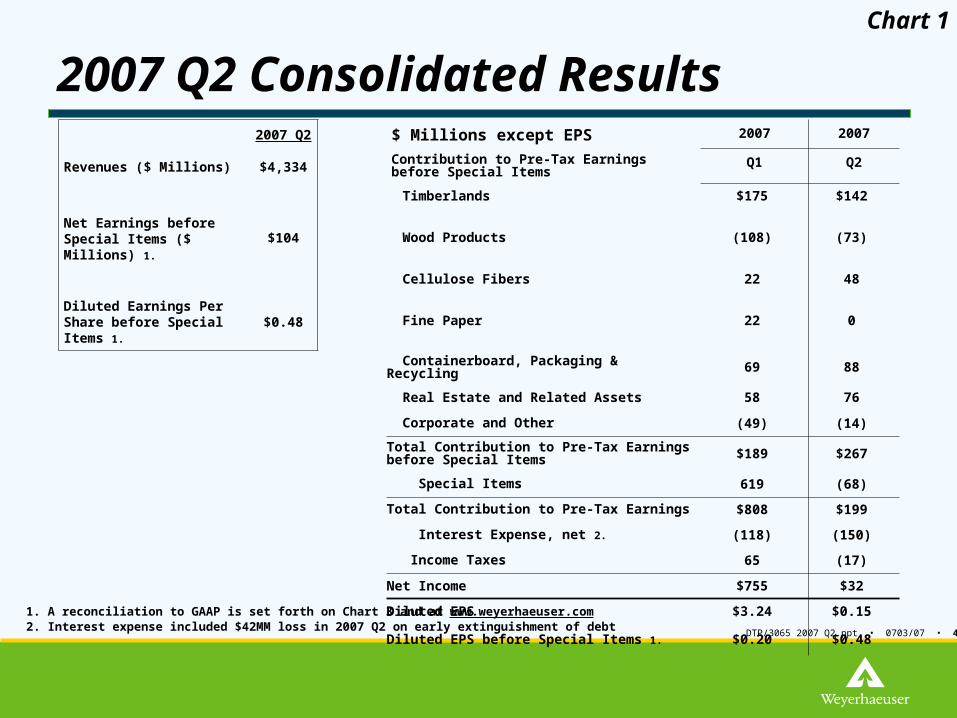
2007 Q2 Consolidated Results2007 Q2 $ Millions except EPS 2007 2007
Revenues ($ Millions) $4,334 Contribution to Pre-Tax Earnings before Special Items Q1 Q2
Timberlands $175 $142
Net Earnings before Special Items ($ Millions) 1.
$104 Wood Products (108) (73)
Cellulose Fibers 22 48
Diluted Earnings Per Share before Special Items 1.
$0.48 Fine Paper 22 0
Containerboard, Packaging & Recycling 69 88
Real Estate and Related Assets 58 76
Corporate and Other (49) (14)
Total Contribution to Pre-Tax Earnings before Special Items $189 $267
Special Items 619 (68)
Total Contribution to Pre-Tax Earnings $808 $199
Interest Expense, net 2. (118) (150)
Income Taxes 65 (17)
Net Income $755 $32
Diluted EPS $3.24 $0.15
Diluted EPS before Special Items 1. $0.20 $0.48
Chart 1
1. A reconciliation to GAAP is set forth on Chart 3 and at www.weyerhaeuser.com2. Interest expense included $42MM loss in 2007 Q2 on early extinguishment of debt
DTP/3065 2007 Q2.ppt • 0703/07 • 5
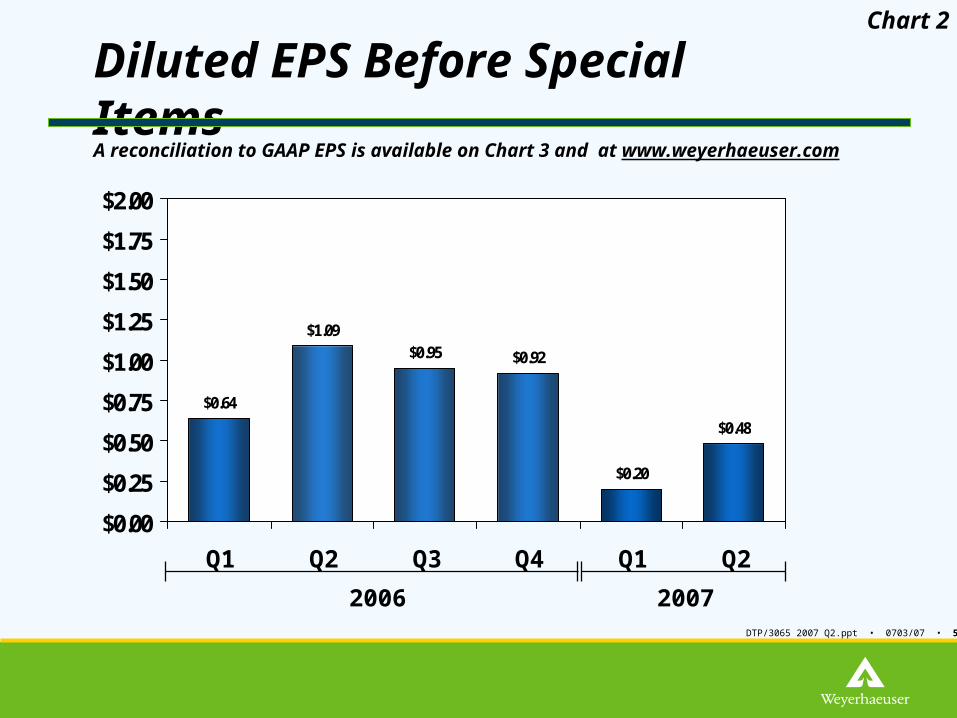
$0.64
$1.09$0.95 $0.92
$0.20
$0.48
$0.00
$0.25
$0.50
$0.75
$1.00
$1.25
$1.50
$1.75
$2.00
Q1 Q2 Q3 Q4 Q1 Q2
Diluted EPS Before Special ItemsA reconciliation to GAAP EPS is available on Chart 3 and at www.weyerhaeuser.com
2006 2007
Chart 2
DTP/3065 2007 Q2.ppt • 0703/07 • 6
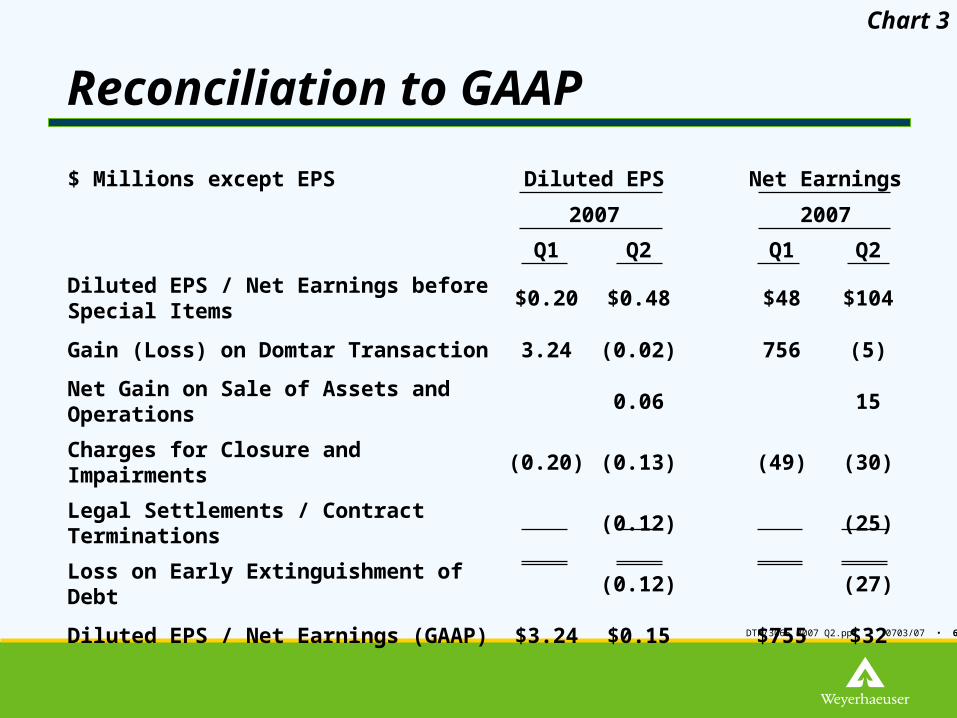
Reconciliation to GAAP
Chart 3
$ Millions except EPS Diluted EPS Net Earnings
2007 2007
Q1 Q2 Q1 Q2
Diluted EPS / Net Earnings before Special Items $0.20 $0.48 $48 $104
Gain (Loss) on Domtar Transaction 3.24 (0.02) 756 (5)
Net Gain on Sale of Assets and Operations 0.06 15
Charges for Closure and Impairments (0.20) (0.13) (49) (30)
Legal Settlements / Contract Terminations (0.12) (25)
Loss on Early Extinguishment of Debt (0.12) (27)
Diluted EPS / Net Earnings (GAAP) $3.24 $0.15 $755 $32
DTP/3065 2007 Q2.ppt • 0703/07 • 7
$0.00
$0.10
$0.20
$0.30
$0.40
$0.50
$0.60
2007 Q1 Timberlands WoodProducts
CelluloseFibers
Container-board
Packaging &Recycling
Real Estate &Related
Corp. & Other 2007 Q2
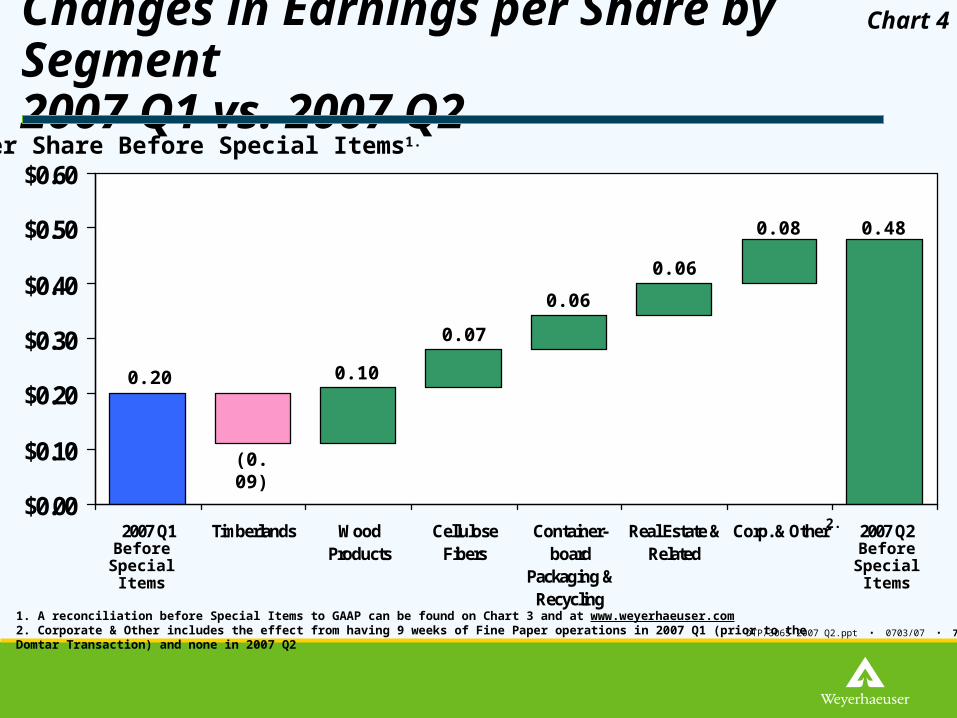
Changes in Earnings per Share by Segment 2007 Q1 vs. 2007 Q2 $ per Share Before Special Items1.
1. A reconciliation before Special Items to GAAP can be found on Chart 3 and at www.weyerhaeuser.com2. Corporate & Other includes the effect from having 9 weeks of Fine Paper operations in 2007 Q1 (prior to the Domtar Transaction) and none in 2007 Q2
0.20
0.07
0.06
0.08 0.48
Before SpecialItems
Chart 4
0.06
(0.09)
Before SpecialItems
0.10
2.
DTP/3065 2007 Q2.ppt • 0703/07 • 8
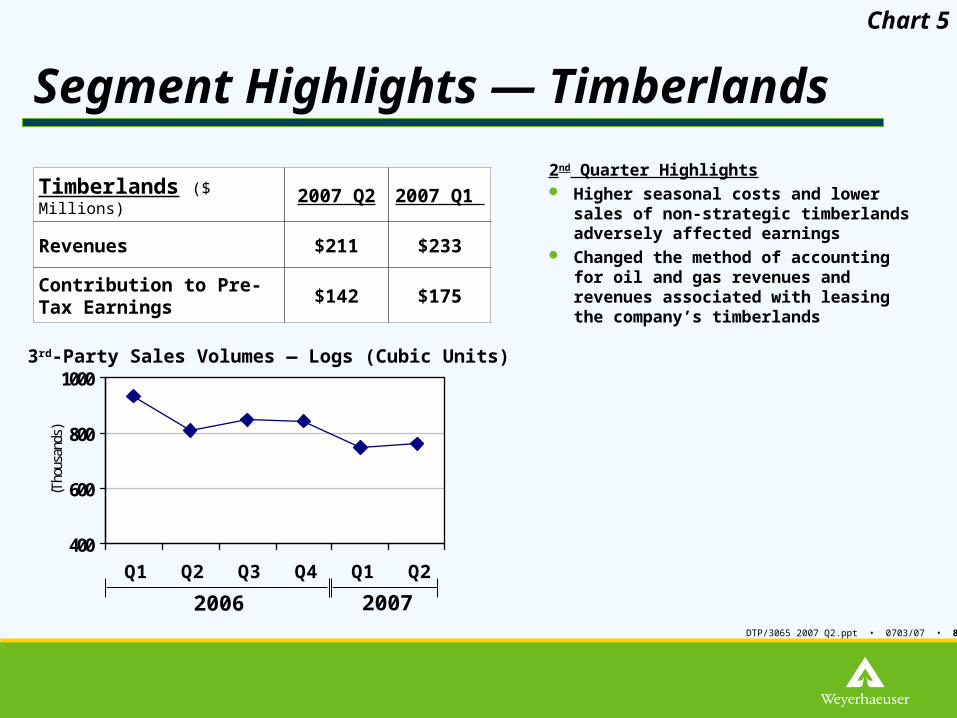
Segment Highlights — Timberlands
2nd Quarter Highlights Higher seasonal costs and lower sales of
non-strategic timberlands adversely affected earnings
Changed the method of accounting for oil and gas revenues and revenues associated with leasing the company’s timberlands
Timberlands ($ Millions) 2007 Q2 2007 Q1
Revenues $211 $233
Contribution to Pre-Tax Earnings
$142 $175
400
600
800
1000
Q1 Q2 Q3 Q4 Q1 Q2
(Tho
usan
ds)
3rd-Party Sales Volumes — Logs (Cubic Units)
2006 2007
Chart 5
DTP/3065 2007 Q2.ppt • 0703/07 • 9
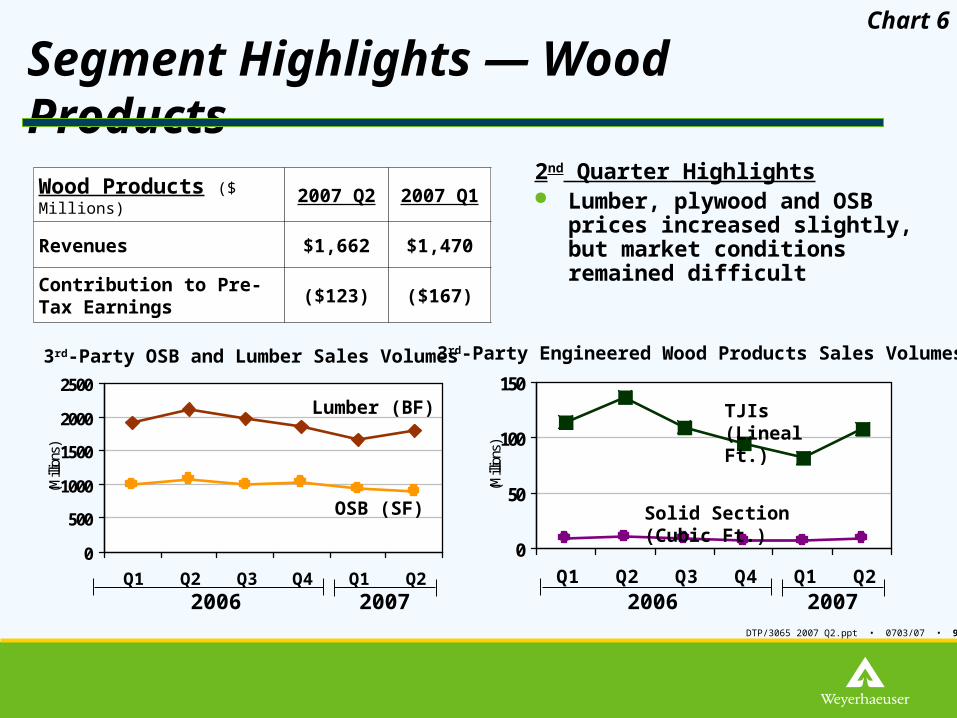
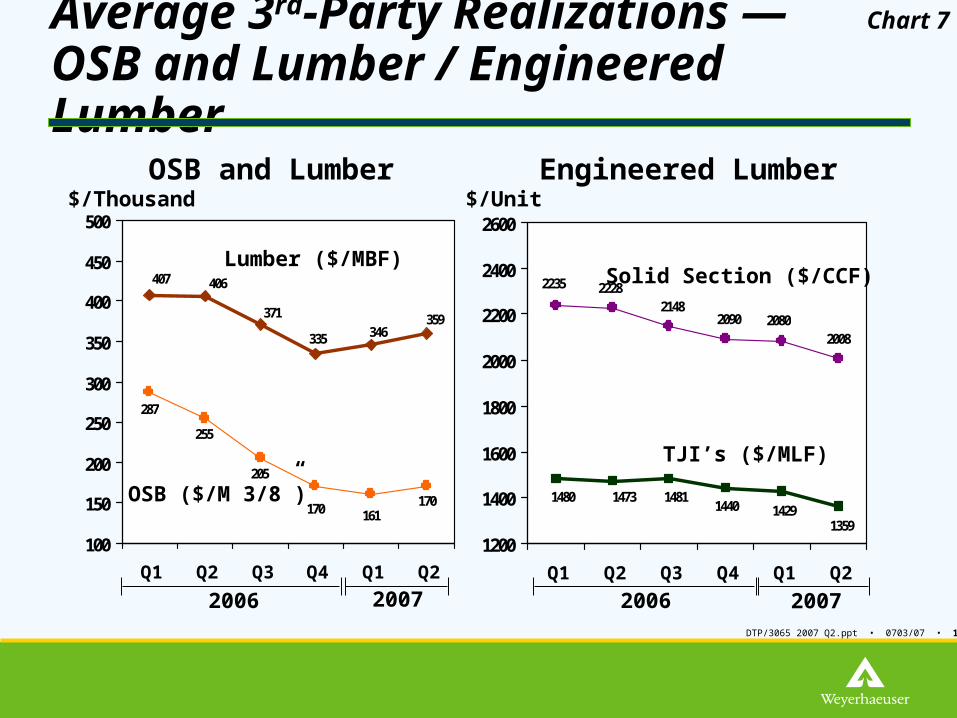
Segment Highlights — Wood Products
2nd Quarter Highlights Lumber, plywood and OSB prices
increased slightly, but market conditions remained difficult
2006
0
50
100
150
Q1 Q2 Q3 Q4 Q1 Q2
(Milli
ons)
TJIs (Lineal Ft.)
Solid Section (Cubic Ft.)
3rd-Party Engineered Wood Products Sales Volumes
0
500
1000
1500
2000
2500
Q1 Q2 Q3 Q4 Q1 Q2
(Milli
ons)
Lumber (BF)
OSB (SF)
2006
3rd-Party OSB and Lumber Sales Volumes
2007 2007
Chart 6
Wood Products ($ Millions) 2007 Q2 2007 Q1
Revenues $1,662 $1,470
Contribution to Pre-Tax Earnings
($123) ($167)
DTP/3065 2007 Q2.ppt • 0703/07 • 10
161170
170
205
255
287
359346335
371
406407
100
150
200
250
300
350
400
450
500
Q1 Q2 Q3 Q4 Q1 Q2
Average 3rd-Party Realizations —OSB and Lumber / Engineered Lumber
$/ThousandOSB and Lumber Engineered Lumber
$/Unit
OSB ($/M 3/8”)
Lumber ($/MBF)
20062007 2007
Chart 7
2006
200820802090
214822282235
135914291440
148114731480
1200
1400
1600
1800
2000
2200
2400
2600
Q1 Q2 Q3 Q4 Q1 Q2
Solid Section ($/CCF)
TJI’s ($/MLF)
DTP/3065 2007 Q2.ppt • 0703/07 • 11
2007
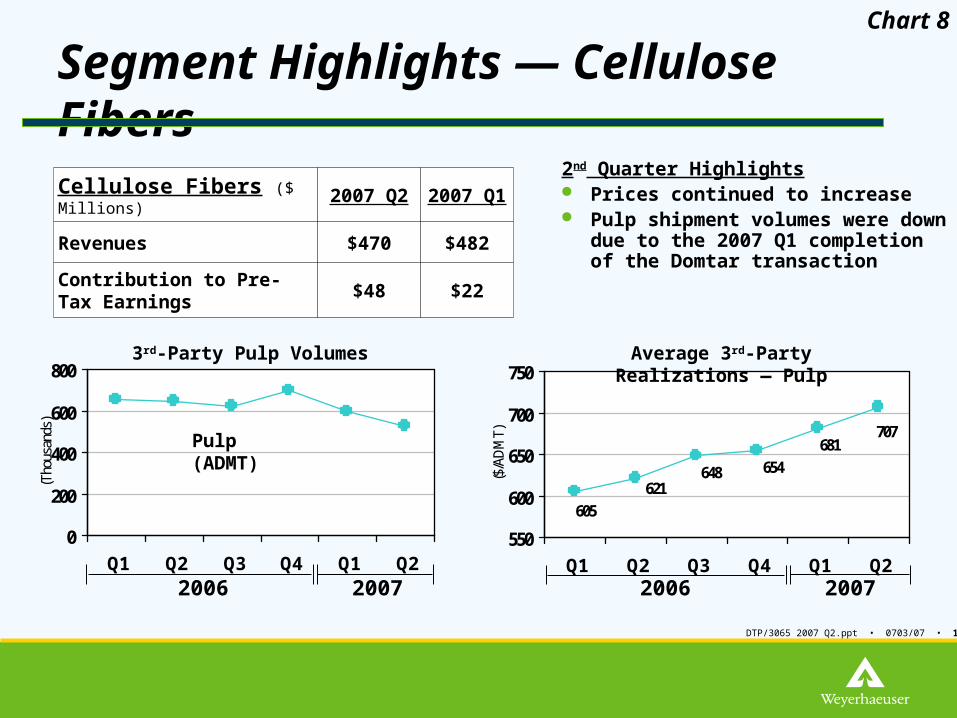
707681
654648621
605
550
600
650
700
750
Q1 Q2 Q3 Q4 Q1 Q2
($/A
DM
T)
Segment Highlights — Cellulose Fibers
2nd Quarter Highlights Prices continued to increase Pulp shipment volumes were down due to
the 2007 Q1 completion of the Domtar transaction
Chart 8
0
200
400
600
800
Q1 Q2 Q3 Q4 Q1 Q2
(Tho
usan
ds)
Pulp (ADMT)
2006
3rd-Party Pulp Volumes
20062007
Cellulose Fibers ($ Millions) 2007 Q2 2007 Q1
Revenues $470 $482
Contribution to Pre-Tax Earnings $48 $22
Average 3rd-Party Realizations — Pulp
DTP/3065 2007 Q2.ppt • 0703/07 • 12
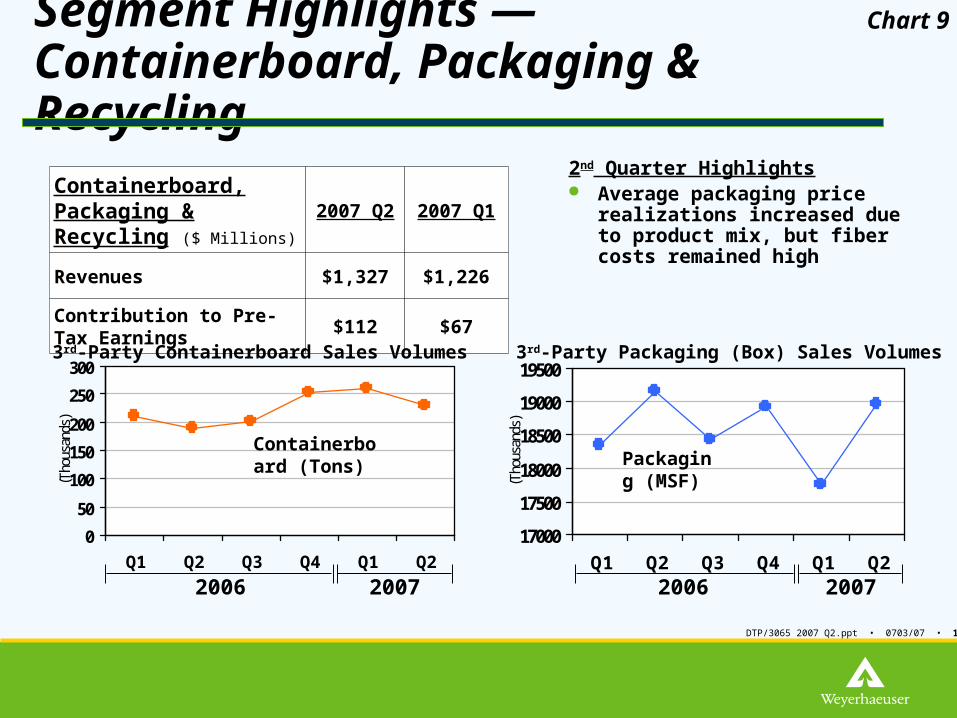
Segment Highlights — Containerboard, Packaging & Recycling
2nd Quarter Highlights Average packaging price realizations
increased due to product mix, but fiber costs remained high
Chart 9
Containerboard, Packaging & Recycling ($ Millions)
2007 Q2 2007 Q1
Revenues $1,327 $1,226
Contribution to Pre-Tax Earnings $112 $67
0
50
100
150
200
250
300
Q1 Q2 Q3 Q4 Q1 Q2
(Tho
usan
ds)
Containerboard (Tons)
2006
3rd-Party Containerboard Sales Volumes
2007
17000
17500
18000
18500
19000
19500
Q1 Q2 Q3 Q4 Q1 Q2
(Tho
usan
ds)
Packaging (MSF)
2006
3rd-Party Packaging (Box) Sales Volumes
2007
DTP/3065 2007 Q2.ppt • 0703/07 • 13
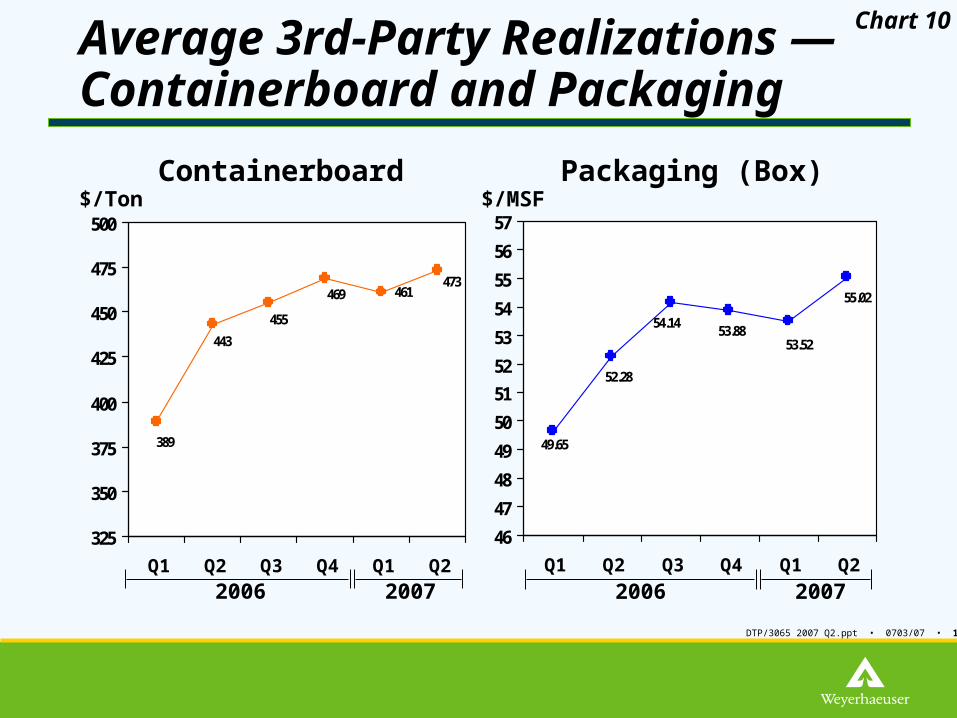
49.65
52.28
54.1453.88
53.52
55.02
46
47
48
49
50
51
52
53
54
55
56
57
Q1 Q2 Q3 Q4 Q1 Q2
461473
389
443
455
469
325
350
375
400
425
450
475
500
Q1 Q2 Q3 Q4 Q1 Q2
Average 3rd-Party Realizations —Containerboard and Packaging
$/TonContainerboard Packaging (Box)
$/MSF
Chart 10
2006 2007 2006 2007
DTP/3065 2007 Q2.ppt • 0703/07 • 14
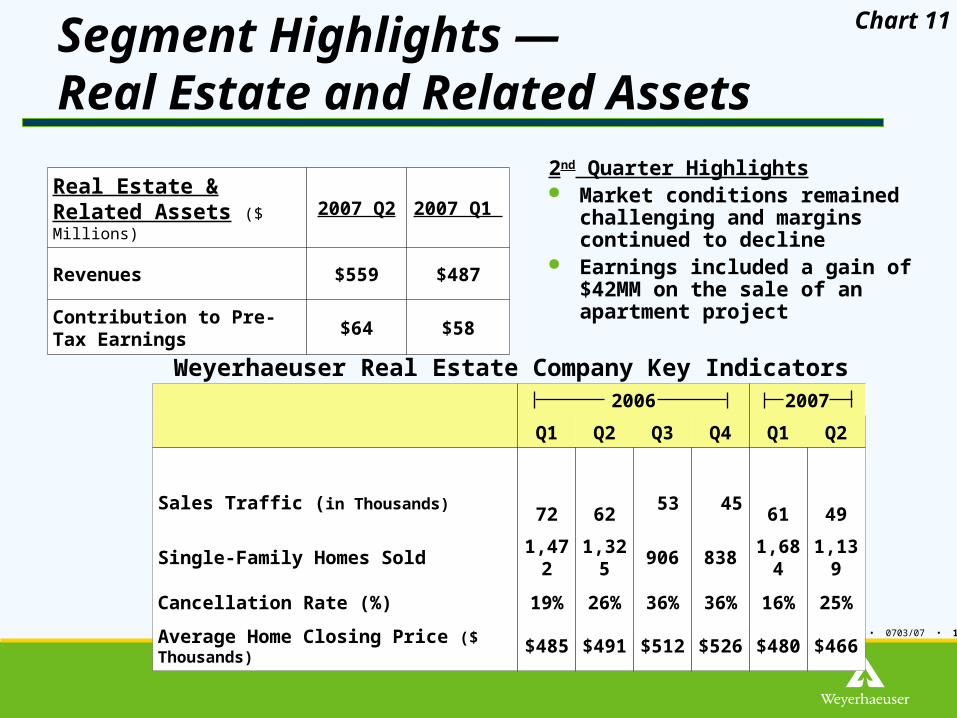
Segment Highlights —Real Estate and Related Assets
Real Estate & Related Assets ($ Millions)
2007 Q2 2007 Q1
Revenues $559 $487
Contribution to Pre-Tax Earnings $64 $58
2nd Quarter Highlights Market conditions remained
challenging and margins continued to decline
Earnings included a gain of $42MM on the sale of an apartment project
Chart 11
2006 2007
Q1 Q2 Q3 Q4 Q1 Q2
Sales Traffic (in Thousands) 72 62 53 45 61 49
Single-Family Homes Sold 1,472 1,325 906 838 1,684 1,139
Cancellation Rate (%) 19% 26% 36% 36% 16% 25%
Average Home Closing Price ($ Thousands) $485 $491 $512 $526 $480 $466
Weyerhaeuser Real Estate Company Key Indicators
DTP/3065 2007 Q2.ppt • 0703/07 • 15
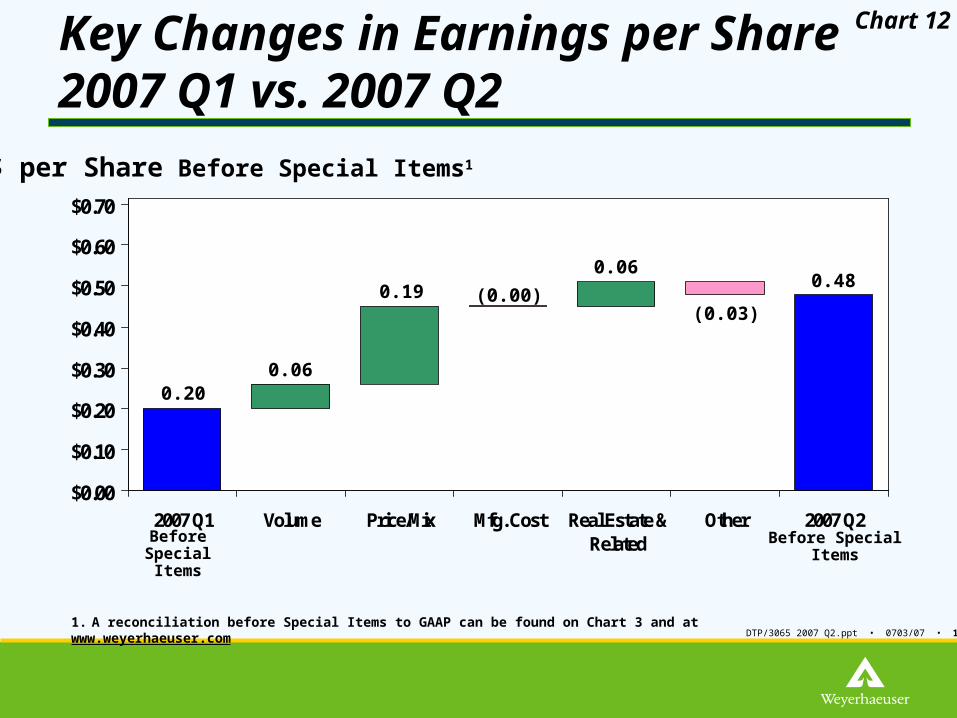
$0.00
$0.10
$0.20
$0.30
$0.40
$0.50
$0.60
$0.70
2007 Q1 Volume Price/Mix Mfg. Cost Real Estate &Related
Other 2007 Q2
Key Changes in Earnings per Share2007 Q1 vs. 2007 Q2
$ per Share Before Special Items1
Before SpecialItems
0.20
0.48
Before SpecialItems
Chart 12
0.06
0.19 (0.00)
0.06
(0.03)
1. A reconciliation before Special Items to GAAP can be found on Chart 3 and at www.weyerhaeuser.com
DTP/3065 2007 Q2.ppt • 0703/07 • 16
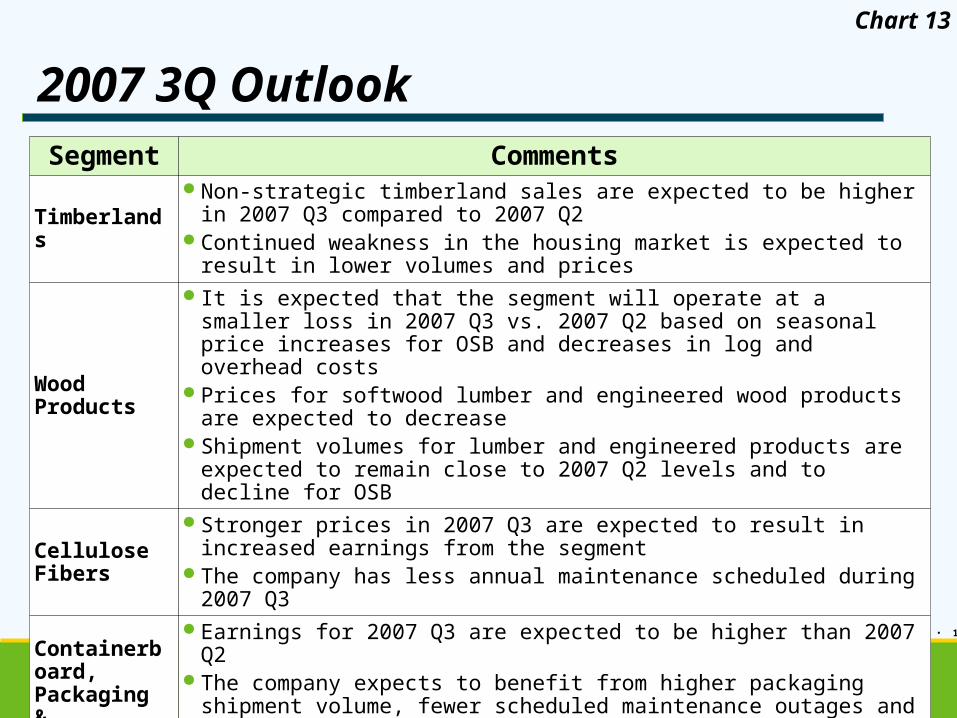
2007 3Q OutlookSegment Comments
Timberlands Non-strategic timberland sales are expected to be higher in 2007 Q3 compared to 2007 Q2 Continued weakness in the housing market is expected to result in lower volumes and prices
Wood Products
It is expected that the segment will operate at a smaller loss in 2007 Q3 vs. 2007 Q2 based on seasonal price increases for OSB and decreases in log and overhead costs
Prices for softwood lumber and engineered wood products are expected to decrease Shipment volumes for lumber and engineered products are expected to remain close to 2007
Q2 levels and to decline for OSB
Cellulose Fibers Stronger prices in 2007 Q3 are expected to result in increased earnings from the segment The company has less annual maintenance scheduled during 2007 Q3
Containerboard, Packaging & Recycling
Earnings for 2007 Q3 are expected to be higher than 2007 Q2 The company expects to benefit from higher packaging shipment volume, fewer scheduled
maintenance outages and lower seasonal energy costs in 2007 Q3 OCC fiber costs are expected to be higher in 2007 Q3
Real Estate and Related Assets
Earnings from this segment in 2007 Q3 are expected to be lower than 2007 Q2 as margins continue to decline due to difficult market conditions
Significant gains from non-homebuilding activities are not anticipated in 2007 Q3
Chart 13

DTP/3065 2007 Q2.ppt • 0703/07 • 17
Appendix
DTP/3065 2007 Q2.ppt • 0703/07 • 18
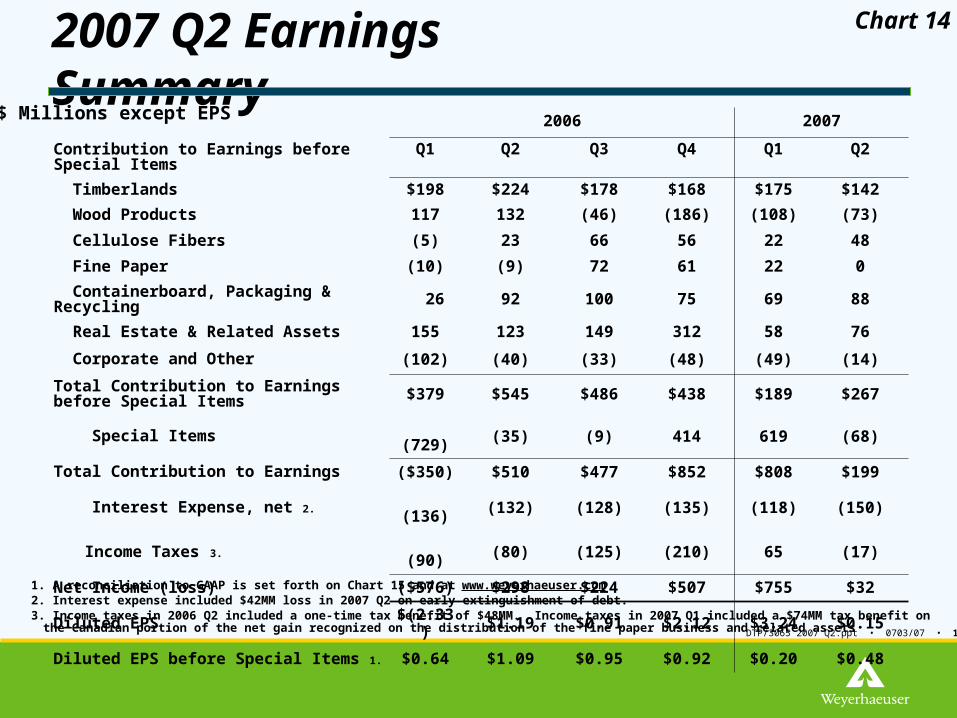
2007 Q2 Earnings Summary2006 2007
Contribution to Earnings before Special Items Q1 Q2 Q3 Q4 Q1 Q2
Timberlands $198 $224 $178 $168 $175 $142
Wood Products 117 132 (46) (186) (108) (73)
Cellulose Fibers (5) 23 66 56 22 48
Fine Paper (10) (9) 72 61 22 0
Containerboard, Packaging & Recycling 26 92 100 75 69 88
Real Estate & Related Assets 155 123 149 312 58 76
Corporate and Other (102) (40) (33) (48) (49) (14)
Total Contribution to Earnings before Special Items $379 $545 $486 $438 $189 $267
Special Items (729) (35) (9) 414 619 (68)
Total Contribution to Earnings ($350) $510 $477 $852 $808 $199
Interest Expense, net 2. (136) (132) (128) (135) (118) (150)
Income Taxes 3. (90) (80) (125) (210) 65 (17)
Net Income (loss) ($576) $298 $224 $507 $755 $32
Diluted EPS $(2.33) $1.19 $0.91 $2.12 $3.24 $0.15
Diluted EPS before Special Items 1. $0.64 $1.09 $0.95 $0.92 $0.20 $0.48
$ Millions except EPS
Chart 14
1. A reconciliation to GAAP is set forth on Chart 15 and at www.weyerhaeuser.com2. Interest expense included $42MM loss in 2007 Q2 on early extinguishment of debt.3. Income taxes in 2006 Q2 included a one-time tax benefit of $48MM. Income taxes in 2007 Q1 included a $74MM tax benefit on the Canadian portion of the net gain recognized on the
distribution of the fine paper business and related assets
DTP/3065 2007 Q2.ppt • 0703/07 • 19
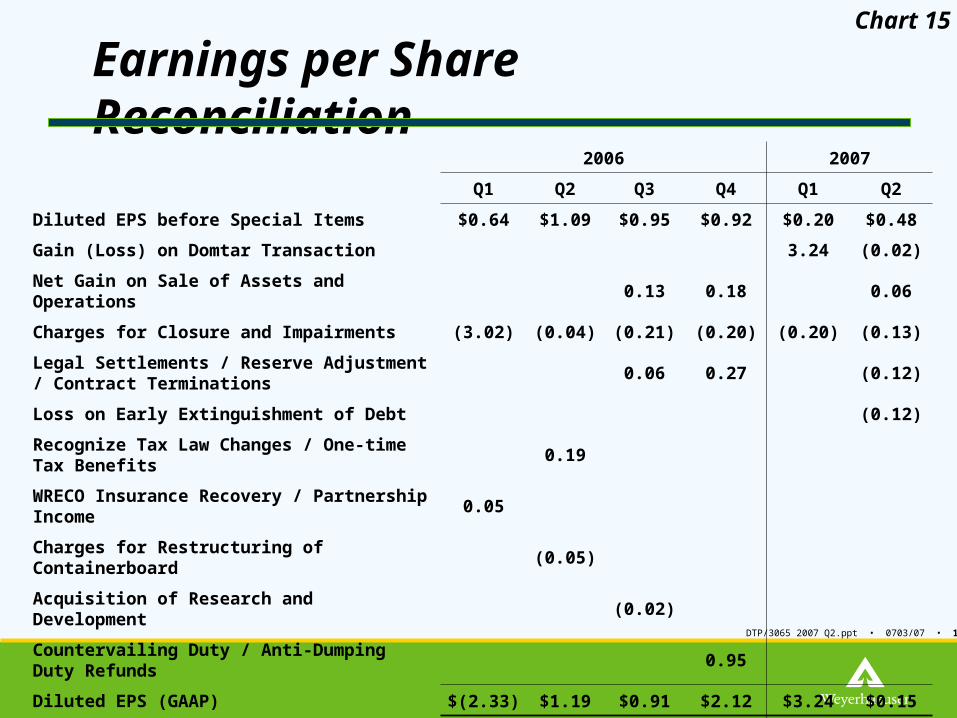
Earnings per Share Reconciliation
Chart 15
2006 2007
Q1 Q2 Q3 Q4 Q1 Q2
Diluted EPS before Special Items $0.64 $1.09 $0.95 $0.92 $0.20 $0.48
Gain (Loss) on Domtar Transaction 3.24 (0.02)
Net Gain on Sale of Assets and Operations 0.13 0.18 0.06
Charges for Closure and Impairments (3.02) (0.04) (0.21) (0.20) (0.20) (0.13)
Legal Settlements / Reserve Adjustment / Contract Terminations
0.06 0.27 (0.12)
Loss on Early Extinguishment of Debt (0.12)
Recognize Tax Law Changes / One-time Tax Benefits 0.19
WRECO Insurance Recovery / Partnership Income 0.05
Charges for Restructuring of Containerboard (0.05)
Acquisition of Research and Development (0.02)
Countervailing Duty / Anti-Dumping Duty Refunds 0.95
Diluted EPS (GAAP) $(2.33) $1.19 $0.91 $2.12 $3.24 $0.15
DTP/3065 2007 Q2.ppt • 0703/07 • 20
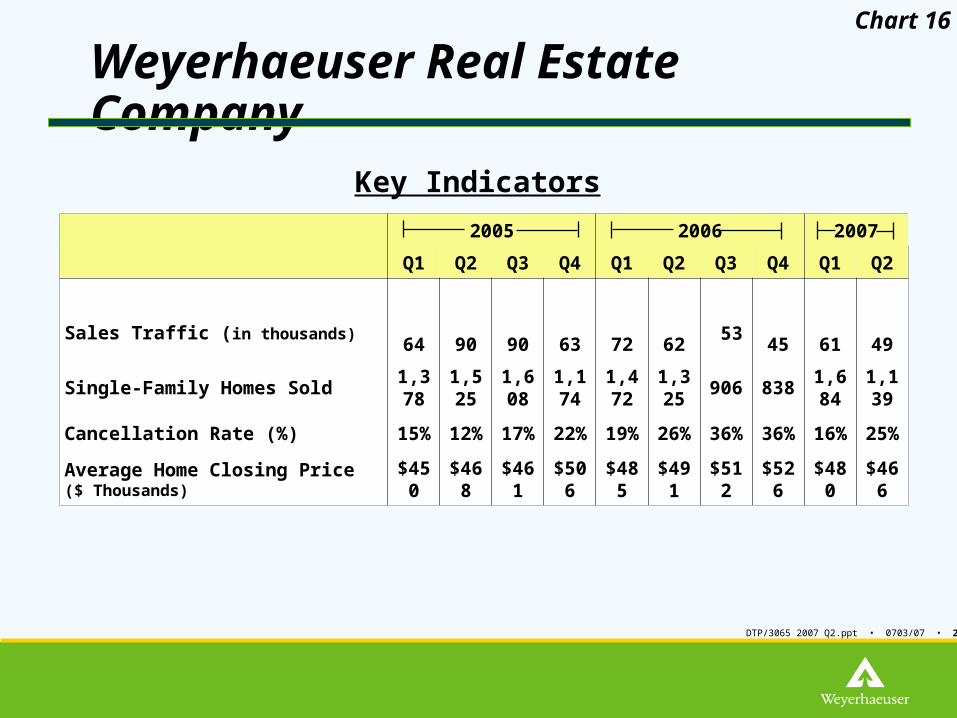
Weyerhaeuser Real Estate Company
2005 2006 2007
Q1 Q2 Q3 Q4 Q1 Q2 Q3 Q4 Q1 Q2
Sales Traffic (in thousands) 64 90 90 63 72 62 53 45 61 49
Single-Family Homes Sold 1,378 1,525 1,608 1,174 1,472 1,325 906 838 1,684 1,139
Cancellation Rate (%) 15% 12% 17% 22% 19% 26% 36% 36% 16% 25%
Average Home Closing Price ($ Thousands) $450 $468 $461 $506 $485 $491 $512 $526 $480 $466
Key Indicators
Chart 16