earnings quality and information transfers(sophia liu).pdf
TRANSCRIPT

8/18/2019 Earnings Quality and Information Transfers(Sophia Liu).pdf
http://slidepdf.com/reader/full/earnings-quality-and-information-transferssophia-liupdf 1/41
Earnings Quality and Information Transfers
Sophia (Hsin-Tsai) Liu
Krannert Graduate School of Management
Purdue University
West Lafayette, IN, 47907
January 2009
I thank my Ph.D. committee members Mark Bagnoli (co-chair), Susan Watts (co-chair), RobertEskew, and Byung Ro for their guidance. The comments received from Carol Anilowski, Casey Rowe, Yinghua Li, and Li Yao, and participants at Purdue University accounting workshop also benefited the paper. All errors are mine.

8/18/2019 Earnings Quality and Information Transfers(Sophia Liu).pdf
http://slidepdf.com/reader/full/earnings-quality-and-information-transferssophia-liupdf 2/41
1
Earnings Quality and Information Transfers
Abstract
This study examines whether the earnings quality of a firm that first announces
quarterly earnings in its industry impacts the magnitude of intra-industry information
transfers. Prior research shows that higher quality earnings better reflect the operating
fundamentals of a firm. I argue that because earnings of high quality contain better
information about a firm’s performance, they are more helpful to investors as they value
non-announcing firms (firms which make earnings announcements later than the first
announcer) in the same industry, resulting in greater information transfer . The results are
consistent with my hypothesis when earnings quality is captured by market-basedmeasures (ERC and value-relevance), but not when it is captured by accrual-based
measures (abnormal accruals and accrual quality). One possible explanation for this finding
is that investors incorporate market-based and accrual-based earnings quality into earnings
expectations differentially.

8/18/2019 Earnings Quality and Information Transfers(Sophia Liu).pdf
http://slidepdf.com/reader/full/earnings-quality-and-information-transferssophia-liupdf 3/41
2
1. Introduction
The purpose of this study is to investigate the association between earnings quality of
announcing firms and the magnitude of information transfers surrounding quarterly earnings
announcements. Existing evidence indicates that information transfer takes place from
announcing to non-announcing firms in the same industry, triggering changes in the non-
announcing firms’ stock prices upon the earnings announcement . As a result, I identify the
earnings announcements of industry peer firms as a source of information for a firm and use
measures of the earnings quality of the announcing firm to evaluate the merit of this information
source. As just noted, prior research has documented the existence of information transfers;
another literature has documented how the earnings quality of a firm affects stock revaluation
within that firm. I extend the work in these two fields by investigating whether earnings quality of
an announcing firm also affects the stock revaluation (which is used to measure the magnitude of
information transfers) of non-announcing firms within the same industry.
To explore the association between the magnitude of information transfers and some, but
by no means all, dimensional measures of earnings quality, I employ four measures of earnings
quality. Similar to the work of Francis et al. (2004), I refer to a firm's earnings response
coefficient (ERC) and a value-relevance measure as “market- based” earnings quality, and
abnormal accruals, estimated from the modified Jones model (Dechow et al. 1995), and accrual
quality, estimated from the Dechow and Dichev (2002) model, as “accrual- based” earnings
quality. Market-based measures take stock returns and prices into consideration and are derived
from the association between returns and accounting earnings while accrual-based measures are
based on accruals and earnings only and are derived from the accruals generating and allocating
processes.
My findings illustrate that after the amount of earnings information has been controlled,
the magnitude of information transfers is larger when an announcing firm has higher earnings
quality as captured by the market-based measures. However, the association between the
announcers’ earnings quality and the magnitude of information transfers is not significant when
the accrual-based measures are used. One possible explanation for this is that investors
incorporate market-based earnings quality and accrual-based earnings quality into earnings
expectations differentially. Specifically, for a firm that historically has higher unsigned abnormal
accruals or poor mapping from its accruals to operating cash flows, its historical accrual pattern
has already been taken into consideration, when the market or the analysts form their expectation
of the reported earnings. In other words, observing a dollar earnings surprise from a firms with

8/18/2019 Earnings Quality and Information Transfers(Sophia Liu).pdf
http://slidepdf.com/reader/full/earnings-quality-and-information-transferssophia-liupdf 4/41
3
high unsigned abnormal accruals (or low accrual quality) is equivalent to observing a dollar
earnings surprise from a firm with low unsigned abnormal accruals (or high accrual quality).
Therefore, it is not surprising that there is no significant association between announcers’
earnings quality and the magnitude of information transfers when the accrual-based measures are
used. Such an explanation hinges on the fact that the accrual-based earnings quality measures are
constructed over a long period of time, which allows the market to learn the accrual pattern of a
firm and adjust its expectation accordingly. In contrast, market-based measures are derived based
on the relationship between stock returns and accounting earnings. In essence, stock returns
reflect the market’s adjustment of its perception of all the value-relevant information of one firm
in a particular period, and clearly this adjustment is done based upon a prior expectation that has
already taken a firm’s accrual pattern into consideration. When the investors historically respon d
more to a firm’s reported earnings or the earnings numbers are historically more closely
associated with stock returns, it is reasonable to expect a greater information content of this firm’s
concurrent earnings announcement, and in turn, a greater information transfer to other non-
announcing firms in the same industry. This argument is supported by some of my empirical
tests, in which the announcing firm’s two-day cumulated abnormal returns are regressed on its
unexpected earnings and an interaction term between the unexpected earnings and its earnings
quality measure for the four earnings quality measures respectively. The results show that the
historical abnormal accruals and accrual quality do not incrementally affect the market reaction to
the unexpected earnings, but the historical market-based measures do. Given the fact that
historical accrual-based earnings quality does not induce different market reaction to earnings
surprises, it is not surprising that accrual-based earnings quality does not play a role in
information transfers either. However, I am not able to rule out alternative explanations.
I believe that my study contributes to the existing literature in the following ways. First,
very little research has examined the determinants of the magnitude of information transfers,
except for industry homogeneity and industry concentration (Frost, 1995; Ninon, 1999) and firm
size (Han and Wild, 2000; Asthana and Mishra, 2001). In her commentary on information
transfers research, Schipper (1990) calls for more attention to explain how such transfers operate,
and my study follows this suggestion by identifying earnings quality as an important determinant.
Second, the literature on a firm’s information environment usually focuses on the information
from a firm’s own financial reporting, insiders, analysts, institutional investors, and news
(Frankel and Li, 2004; Piotroski and Roulstone, 2004). The importance of intra-industry
information transfers is evident from studies of momentum (Moskowitz and Grinblatt, 1999) and
post-earnings announcement drift (Kovacs, 2007). Information transfers may be thought of as

8/18/2019 Earnings Quality and Information Transfers(Sophia Liu).pdf
http://slidepdf.com/reader/full/earnings-quality-and-information-transferssophia-liupdf 5/41
4
another information source and help to enrich a firm’s information environment. This study is
designed to analyze the merit of this information source. Third, Shipper (1990) raises a question
of whether the evidence regarding the existence of information transfers has implications for the
quality of our accounting system. Although there is no strong indication that our current
accounting system encourages information transfers or that information transfers are truly
considered when the accounting system is being formed, information transfers do take place.
When earnings quality of a firm is considered, the association between earnings quality and
information transfers may suggest potential externality benefits that high earnings quality of a
firm helps improve the information environment of other firms in the same industry. This study
suggests a side effect of high earnings quality to accounting policymakers and thus, extends
information transfers research by finding the linkage between policy-based motivations and the
existence of information transfers. In addition, the usefulness and the quality of earnings and
financial statements have drawn much attention in recent accounting research, especially around
the wave of accounting scandals of the early 2000s. Much effort has been put into investigating
benefits of high earnings quality and developing appropriate measures of earnings quality. This
study provides additional insight into various dimensional measures of earnings quality. I show
that the market-based and accrual-based earnings quality measures are different in terms of
capturing the effect of earnings quality on information transfers.
The remainder of the paper is organized as follows. Section 2 provides a literature review
and develops the hypothesis; Section 3 describes the measures of earnings quality and the
research design; Section 4 presents the sample selection and the results; and Section 5 concludes
the paper.
2. Prior research and hypothesis development
Since the pioneering work Ball and Brown (1968), it is commonly accepted that a firm’s
stock price change reflects investors’ expectation update towards this firm based upon new
information that arrived in the market.1 It is noted, however, firm-specific information is not the
only source investors would rely upon to form their expectations. Conceivably, an information
event announced by one firm could contemporaneously affect the market expectation of the value
of one or a group of non-announcing firms. This phenomenon is termed “information transfer”, as
1 Other measures, such as analyst forecast revisions (Lim et al., 2001; Caton et al., 2003) and abnormal
trading volumes (Wasley, 2001) are also used.

8/18/2019 Earnings Quality and Information Transfers(Sophia Liu).pdf
http://slidepdf.com/reader/full/earnings-quality-and-information-transferssophia-liupdf 6/41
5
defined in Schipper (1990). 2 Since firms in the same industry share common factors of the
resource and the product markets that underlie firm value, an event announcement could be useful
for evaluating non-announcing firms within the same industry as well.3 Indeed, extant literature
has confirmed that various events are able to deliver value relevant information not only about the
announcing firms themselves, but also about the non-announcing firms within the same industry.
These events include quarterly earnings announcements (Foster, 1981; Clinch and Sinclair, 1987;
Freeman and Tse, 1992; Han and Wild, 2000; Asthana and Mishra, 2001; Ramnath, 2002),
management forecasts announcements (Baginski, 1987; Han et al., 1989; Pyo and Lustgarten,
1990), earnings pre-announcements (Wasley, 2001), and earnings restatements (Xu et al., 2006;
Gleason et al., 2008). The existence of information transfers is also broadly documented in the
finance literature. For example, Lang and Stulz (1992) and Ferris et al. (1997) show that
bankruptcy announcements affect stock prices of industry peers adversely, especially for peer
firms that subsequently filed for bankruptcy within three years. Szewczyck (1992) suggests that
investors infer unfavorable information regarding the prospects of the industry from
announcements of common stock, convertible debt, and straight debt public offerings. Slovin et al.
(1991) find positive valuation effects for industry peers upon initial announcements of going-
private bids. Caton et al. (2003) indicate that the market infers unfavorable information regarding
the industry from dividend-omission announcements, and they document both negative abnormal
returns and negative abnormal analyst forecast revisions of industry peers upon announcements.
Fee and Thomas (2004) and Shahrur (2005) find positive pricing effects on firms in the same
industry as the merging firms upon the initial announcement of a horizontal takeover.
Figure 1 illustrates that the earnings surprise results in not only the price reaction of the
announcing firm around the earnings announcement date but also the price reaction of non-
announcing firms in the same industry, since the market perceives that elements of quarterly
earnings of announcing firms are both firm-specific and industry-wide. While no prior study has
examined the effect of earnings quality of announcing firms on the magnitude of information
transfers, the association is expected to exist. Prior research has showed that a firm’s earnings
quality is used by the market to extract information from its earnings announcements (Francis et
al., 2005) and earnings patterns (Francis et al., 2003; Bartov et al., 2002). This evidence is
consistent with the notion that earnings of higher quality better reflect operating fundamentals of
2 In the finance literature, the phenomenon of information transfers is sometimes alternatively termed“contagion effects” and “spillover effects”, which indicate contagion resulting from interdependencies between one or a group of firms and a group of related firms.3 The information transfer effects are usually documented between the announcing and non-announcingfirms in the same industry. Some recent studies also focus on information transfers along the supply chain,such as Hertzel et al. (2006), Menzly and Ozbas (2006), and Pandit et al. (2007).

8/18/2019 Earnings Quality and Information Transfers(Sophia Liu).pdf
http://slidepdf.com/reader/full/earnings-quality-and-information-transferssophia-liupdf 7/41
6
a firm and thus reinforce the pricing effect of that firm. Given the context of information
transfers, I expect that earnings of higher quality also contain information of higher quality about
a firm’s performance on the industry level as well as on the firm-specific level. Therefore,
earnings of higher quality could better help investors to evaluate non-announcing firms as well. In
addition, although earnings have been documented as a better predictor than current cash flows
for a firm’s future cash flows (e.g. Barth et al., 2001), the accrual components of earnings are
involved in both management judgment and estimates, which may weaken the relation between
current earnings and future cash flows. Investors may not be able to fully understand the
information contained in earnings, which can then result in firms with high (discretionary)
accruals being overpriced (Sloan, 1996; Xie, 2001). Earnings quality may significantly affect the
ability of market participants to use information contained in earnings (accruals). A theoretical
study (Lambert et al., 2007) also explains how the degree of precision of information affects a
firm’s pricing effect. Thus, I use earnings quality measures to capture the degree of precision of
earnings information available to the market regarding revaluing a non-announcing firm in the
same industry and test the following hypothesis (in the alternative form):
H: Ceteris paribus, earnings quality of announcing firms positively affects the magnitude
of information transfers, surrounding the quarterly earnings announcement.
As suggested in Schipper and Vincent (2003), it is difficult to provide a uniform
definition of earnings quality due to different users and different uses of earnings numbers; as a
result, it becomes difficult to use a one-dimensional measure to empirically evaluate earnings
quality. 4
Since my objective is to study the effect of earnings quality on the magnitude of
information transfers, which is measured in the abnormal stock returns of non-announcing firms,
the relevant measures are chosen based on the perspectives of participants, such as investors and
analysts, in the equity market. Francis et al. (2004) examine the association between the cost of
equity and seven earnings attributes and find that value-relevance and accrual quality are more
strongly associated with the cost of equity. 5 Their study motivates me to choose earnings
response coefficient (ERC), value-relevance, abnormal accruals, and accrual quality measures,
which better capture the metrics important to participants in the equity market in terms of
4 Other definitions (measures) of earnings quality not discussed below could also be found in the literature.For example, Revsine et al. (1999) consider earnings to be of high quality when they are sustainable.Mikhail et al. (2003) consider that earnings are of high quality when earnings are closely associated withfuture cash flows. Kirschenheiter and Melumad (2005) define high quality earnings as earnings that aremore informative and closer to the long-run firm value. Richardson et al. (2005) consider earnings to be ofhigh quality when they persist into the next period. In addition, White et al. (2003) consider that earningsare of high quality when they are conservative.5 The seven attributes are accrual quality, earnings persistence, predictability, smoothness, value relevance,timeliness, and conservatism.

8/18/2019 Earnings Quality and Information Transfers(Sophia Liu).pdf
http://slidepdf.com/reader/full/earnings-quality-and-information-transferssophia-liupdf 8/41
7
extracting information from earnings numbers as empirical proxies for earnings quality in my
study. Although these measures are commonly used in the literature, they are all criticized to
some extents.
Similar to Francis et al. (2004), I classify a firm's ERC and value-relevance as “market-
based” earnings quality measures and abnormal accruals, estimated from the modified Jones
model (Dechow et al. 1995) and accrual quality, derived from the Dechow and Dichev (2002)
model as “accrual- based” earnings quality measures. Market-based measures take stock returns
into consideration and the implicit assumption of them is that earnings with higher quality may
more closely reflect the economic income, which is represented by the stock returns. In contrast,
accrual-based measures are based on accounting information only and derived from the relations
among earnings, accruals, and cash flows. The underlying assumption of this type of measures is
that earnings with higher quality more accurately reflect the accruals generating process and the
accruals allocating process of cash flows to reporting periods.
3. Research design
3.1 Regression model
The announcing firm is defined as a firm whose quarterly earnings announcement is the
first announcement in its industry group to control for the timing and clustering effects, as
suggested in Freeman and Tse (1992) and Asthana and Mishra (2001) for the following reasons.
First, since the amount of information used to value non-announcing firms decreases in the
announcement sequence, restricting the sample to the first announcement each industry-quarter
increases the power of the test. Second, Asthana and Mishra (2001) show that the first
announcement in each industry-quarter is less likely to be clustered with the following
announcements. Non-announcing firms are defined as firms with the same 3-digit SIC code as the
announcing firms and with their earnings releases at least one trading day later than the
announcing firms’ earnings releases. 6 , 7 To reduce the concern of contemporaneous
announcements, the industry-quarter observations (including both announcing and non-
6 Ramnath (2002) use an analyst-based definition to identify peer firms since his study focuses on theresponses of analysts of the non-announcing firms to the quarterly earnings announcement of the earlierannouncer in the same industry. Identifying peer firms based on the analysts following may increase the power of the test.7 Foster (1981) also uses the homogeneous line of business classification, in which firms with at least 50 percent of their revenues from an industry line of business are included in the sample and the dominantfirm classification, in which only firms whose revenue ranks in the top half in the industry are included.The non-directional results based on SIC classification are similar as those based on the homogeneous lineof business classification and the dominant firm classification.

8/18/2019 Earnings Quality and Information Transfers(Sophia Liu).pdf
http://slidepdf.com/reader/full/earnings-quality-and-information-transferssophia-liupdf 9/41
8
announcing firms) are excluded if two firms in the same industry first make earnings
announcement on the same day. The magnitude of information transfers is measured in the non-
announcing firms’ abnormal returns upon the earnings announcements of quarter q of year t. The
measures of earnings quality are calculated based on the data rolling over the 12 most recent
quarters that have non-missing data (basically, a three-year window) until one quarter prior to the
quarter of the earnings announcement. This design ensures that information needed to evaluate
the earnings quality of the announcing firm, which is contained in the financial statements of
quarter q-1 of year t and of prior quarters, is publicly available.
I employ the following pooled cross-sectional regression model, with a measure of
earnings quality as an explanatory variable, controlling for the amount of earnings information
and other determinants that have been shown to affect the magnitude of information transfers.
CARs j,t,q =β 0 + β 1 UE i,t,q + β 2 EQi,t,q-1 + β 3 UE i t,q * EQi,t ,q-1+ Control Variables + ε (1)
An equal-weighted portfolio of non-announcing firms is formed for each earnings
announcement. CARs j,t,q is the average cumulative abnormal returns estimated from the market
model for a portfolio of non-announcing firms over the two-day window (-1,0) on the earnings
announcement date of an announcing firm in quarter q of year t and is used to measure
information transfers (i.e. information transfer effects are presumed to exist when the average
abnormal returns of the non-announcing firm portfolios are significantly different from zero).
Unexpected earnings (UEi,t,q), are defined as the difference between the actual earnings and the
median of analysts’ most recent earnings forecasts, made no earlier than 90 days prior to the
earnings announcement, scaled by the stock price at the beginning of quarter q of year t and are
used to capture the amount of earnings information.8 Earnings quality measures (EQi,t,q-1) are
calculated over the 12 most recent quarters that have non-missing data until quarter q-1 of year t
and the details are discussed later. The subscript i indicates announcing firms and the subscript j
8 The announcing firm’s abnormal returns are also used as a proxy for the unexpected component of the
firm’s earnings release in prior studies, such as Foster (1981) and Clinch and Sinclair (1987). However, this
use is subject to a problem of overstating the significance of information transfers due to the cross-sectionalcovariation in stock returns (Dietrich, 1989 and Frost, 1995). To avoid this critique, a more direct measurefor the amount of earnings information, unexpected earnings, is being used in the latter studies. As Frost(1995) points out, due to the measurement errors embedded in the use of the unexpected earnings, thisapproach may underestimate information transfers, in contrast to the use of a firm’s abnormal returns that
may overestimate information transfers. Besides, the announcing firm’s abnormal stock returns also reflect
other information released on the announcement date, since firms usually announce other news or make aforecast together with their quarterly earnings announcements. This study especially focuses on theinformation contained in earnings; therefore, an earnings measure may be more appropriate than a returnsmeasure.

8/18/2019 Earnings Quality and Information Transfers(Sophia Liu).pdf
http://slidepdf.com/reader/full/earnings-quality-and-information-transferssophia-liupdf 10/41
9
indicates non-announcing firms. The coefficient (β3) on the interaction term measures the
incremental impact of earnings quality on the magnitude of information transfers.
Unexpected earnings of announcing firms and abnormal returns of non-announcing firms
need not have the same sign. The direction of the stock price response of non-announcing firms
depends on the nature of the announced earnings affecting the industry and competition. The
information contained in earnings may reflect the general perspectives of the industry (contagion
effects) or may signal a change in the competitive position of announcing versus non-announcing
firms (competitive effects). To avoid the concern that the contagion effect and the competitive
effect offset each other (Kim et al., 2008), the non-directional unexpected earnings of announcing
firms and the non-directional abnormal returns of non-announcing firms are used in the
multivariate test. 9
In equation (1), several determinants of the magnitude of information transfers are
controlled. First, I control for the firm size of announcing firms. Prior research, such as Atiase
(1985) and Freeman (1987), argues that information production and dissemination by private
parties is increasing in firm size since private parties are drawn to larger firms by higher expected
trading profits. Therefore, the information conveyed to the market by public announcements (e.g.,
earnings announcements) is inversely related to the firm size. Han and Wild (2000) find the
empirical evidence to support this argument. Contrary to Han and Wild (2000), Schoderbek
(1995) finds that industry-wide information is usually transferred from the dominant firms to the
fringe firms. Using a different research design from that in Han and Wild (2000), Asthana and
Mishra (2001) find that infor mation transfers are positively associated with the announcing firm’s
size. 10 While the impact of firm size is not clear, it does affect the magnitude of information
transfers. Therefore, I control for the announcing firm’s size, which is measured in the natural log
of the market value of common shares outstanding at the end of quarter q of year t. Second, I also
control for the average firm size of the portfolio of non-announcing firms each industry-quarter.
While Asthana and Mishra (2001) do not reject the hypothesis that the magnitude of information
transfers is not affected by the non-announcing firm’s size, Han and Wild (2000) show that the
size of non-announcing firms is inversely related to the magnitude of information transfers. Third,
9 Prior research shows that the contagion effects usually dominate the competitive effects (i.e. the abnormalreturns of non-announcing firms and the unexpected earnings of the announcing firms are positivelyassociated).10 Another measure, the number of analysts following, is usually used to proxy for the amount ofinformation production and dissemination of a firm as well in prior research; therefore, I control for thisvariable and the coefficient on it is not statistically significant. This result is consistent with that of Han andWild (2000). Since the number of analysts following and firm size is highly correlated, to avoid themulticollinearity problem, I only control for the firm size in the main tests.

8/18/2019 Earnings Quality and Information Transfers(Sophia Liu).pdf
http://slidepdf.com/reader/full/earnings-quality-and-information-transferssophia-liupdf 11/41
10
the industry concentration is controlled through the Herfindahl index based on the notion that
information transfers should be observed in highly concentrated industries since industries of this
type generally consist of a small number of large and interdependent firms (Frost, 1995). Fourth,
to avoid the problem that the empirical tests only capture the co-movement of the returns of firms
within the same industry, the correlation between the daily returns of announcing and of non-
announcing firms in the prior year is controlled. 11 Fifth, following prior research, such as
Matsumoto (2002), an indicator variable is used for the fourth fiscal quarter to capture the quality
difference between earnings numbers of the fourth quarter and of the other three quarters, since
firms are under greater auditor scrutiny and tend to report special items in the fourth quarter.
3.2 Earn ings quality measures
As the first market-based measure, the ERC measure is estimated from the following
equation:
UR i,t,q = δ0 + δ1 UE i,t,q + ε (2)
where UR i,t,q is the cumulative abnormal returns surrounding the earnings announcement for firm
i at quarter q of year t, measured over a two-day window (-1,0), where abnormal returns are based
on the CRSP value-weighted market model. UE i,t,q is the unexpected quarterly earnings for firm
i at quarter q’s announcement date, scaled by the price as the end of that quarter for which
earnings are announced, where expected earnings are based on the median of analyst forecasts
outstanding within 90 days prior to the earnings announcement. I use the 12 most recent quarters
that have non-missing data for returns and unexpected earnings to estimate δ1 and use the
absolute value of δ1 as firm i’s measure of earnings quality in quarter q-1 of year t, noted as EQ
(ERC_ABS)i,t,q-1. A higher value indicates a greater level of high earnings quality.
The second market-based measure is value-relevance, measured as the adjusted R 2 from a
regression of the returns on the level and the change of earnings, following Collins et al. (1997)
and Francis and Schipper (1999), and slightly adjusted for the quarterly data. This construct is
believed to capture both relevance and reliability of earnings numbers. Specifically, the following
regression is used:
Return i,t,q = δ0 + δ1 EARN i,t,q + δ2 ∆EARN i,t,q + ε (3)
where:
11 This problem has been examined in prior research, such as Foster (1981) and Han and Wild (1990).

8/18/2019 Earnings Quality and Information Transfers(Sophia Liu).pdf
http://slidepdf.com/reader/full/earnings-quality-and-information-transferssophia-liupdf 12/41
8/18/2019 Earnings Quality and Information Transfers(Sophia Liu).pdf
http://slidepdf.com/reader/full/earnings-quality-and-information-transferssophia-liupdf 13/41
12
t. (Compustat #36)
∆DEBT i,t,q = firm i’s change in debt in current liabilities between quarter q of year t and
quarter q-1 of year t. (Compustat #45)
When Compustat #45 is unavailable, it is set to zero.
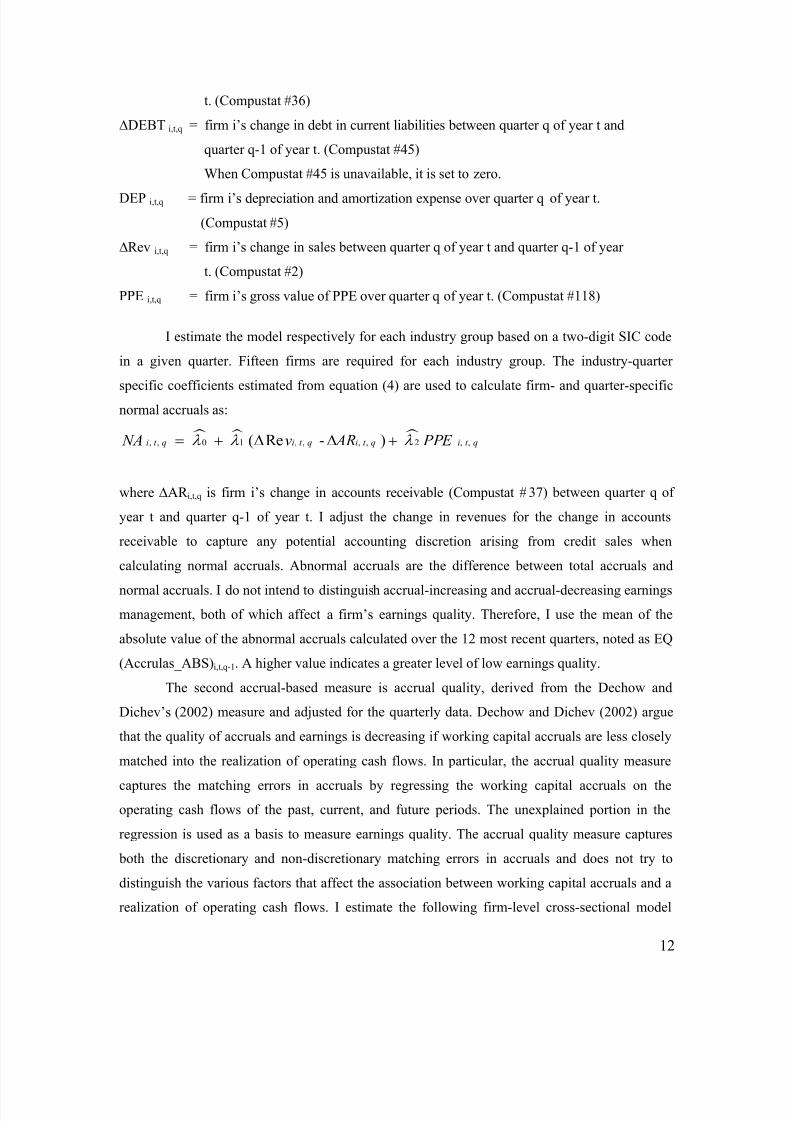
DEP i,t,q = firm i’s depreciation and amortization expense over quarter q of year t.
(Compustat #5)
∆Rev i,t,q = firm i’s change in sales between quarter q of year t and quarter q-1 of year
t. (Compustat #2)
PPE i,t,q = firm i’s gross value of PPE over quarter q of year t. (Compustat #118)
I estimate the model respectively for each industry group based on a two-digit SIC code
in a given quarter. Fifteen firms are required for each industry group. The industry-quarter
specific coefficients estimated from equation (4) are used to calculate firm- and quarter-specificnormal accruals as:
, , 0 1 , , , , 2 , , ( Re - )i t q i t q i t q i t q NA v AR PPE
where ∆AR i,t,q is firm i’s change in accounts receivable (Compustat #37) between quarter q of
year t and quarter q-1 of year t. I adjust the change in revenues for the change in accounts
receivable to capture any potential accounting discretion arising from credit sales when
calculating normal accruals. Abnormal accruals are the difference between total accruals and
normal accruals. I do not intend to distinguish accrual-increasing and accrual-decreasing earnings
management, both of which affect a firm’s earnings quality. Therefore, I use the mean of the
absolute value of the abnormal accruals calculated over the 12 most recent quarters, noted as EQ
(Accrulas_ABS)i,t,q-1. A higher value indicates a greater level of low earnings quality.
The second accrual-based measure is accrual quality, derived from the Dechow and
Dichev’s (2002) measure and adjusted for the quarterly data. Dechow and Dichev (2002) argue
that the quality of accruals and earnings is decreasing if working capital accruals are less closely
matched into the realization of operating cash flows. In particular, the accrual quality measure
captures the matching errors in accruals by regressing the working capital accruals on the
operating cash flows of the past, current, and future periods. The unexplained portion in the
regression is used as a basis to measure earnings quality. The accrual quality measure captures
both the discretionary and non-discretionary matching errors in accruals and does not try to
distinguish the various factors that affect the association between working capital accruals and a
realization of operating cash flows. I estimate the following firm-level cross-sectional model

8/18/2019 Earnings Quality and Information Transfers(Sophia Liu).pdf
http://slidepdf.com/reader/full/earnings-quality-and-information-transferssophia-liupdf 14/41
13
(where all of the variables are scaled by the firm’s total assets at the end of quarter q -1 of year t,
Compustat #44):
TCA i,t,q = λ0 + λ1 CFO i,t,q-4 + λ2 CFO i,t,q-3 + λ3 CFO i,t,q-2 + λ4 CFO i,t,q-1 + λ5 CFO i ,t q
+ λ6 CFO i,t,q+1 + λ7 CFO i,t,q+2 + λ8 CFO i,t,q+3 + λ9 CFO i,t,q+4 + ε (5)
where:
TA i,t,q = firm i’s total accruals over quarter q of year t, which equals ∆CA i,t,q
-∆CL i,t,q -∆Cash i,t,q +∆DEBTi,t,q – DEP i,t,q
∆CA i,t,q = firm i’s change in current assets between quarter q of year t and quarter q-1
of year t. (Compustat #40)
∆CL i,t,q = firm i’s change in current liabilities between quarter q of year t and quarter
q-1 of year t. (Compustat #49)
∆Cash i,t,q = firm i’s change in cash between quarter q of year t and quarter q-1 of year
t. (Compustat #36)
∆DEBT i,t,q = firm i’s change in debt in current liabilities between quarter q of year t and
quarter q-1 of year t. (Compustat #45)
When Compustat#45 is unavailable, it is set to zero.
DEP i,t,q = firm i’s depreciation and amortization expense over quarter q of year t.
(Compustat #5)
TCA i,t,q = firm i’s total current accruals over quarter q of year t, which equals
∆CA i,t,q -∆CL i,t,q -∆Cash i,t,q + ∆DEBT i,t,q
CFO i,t,q = firm i’s operating cash flows over quarter q of year t, which equals
NIBE i,t,q -TAi,t,q
NIBE i,t,q = firm i’s income before extraordinary items over quarter q of year t.
(Compustat #8)
I estimate the model respectively for each industry group based on a two-digit SIC code
in a given quarter. Fifteen firms are required for each industry group. The industry-quarter
specific coefficients estimated from equation (5) are used to calculate firm- and quarter-specific
Dechow and Dichev (2002) estimated TCA i,t,q , which is:
i,t,q 0 1 i,t,q-4 2 i,t,q-3 3 i,t,q-2 4 i,t,q-1 5 i ,t q
6 i,t,q+1 7 i,t,q+2 8 i,t,q+3 9 i,t,q+4
TCA = + CFO + CFO + CFO + CFO + CFO
+ CFO + CFO + CFO + CFO

8/18/2019 Earnings Quality and Information Transfers(Sophia Liu).pdf
http://slidepdf.com/reader/full/earnings-quality-and-information-transferssophia-liupdf 15/41
14
The residual is the difference between actual TCA and the estimated TCA. Consistent
with the prior measure, I use the standard deviation of the residuals calculated over the 12 most
recent quarters that have non-missing data, noted as EQ (AQ)i,t,q-1. A higher value indicates a
greater level of low earnings quality.
4. Sample selection and empirical results
4.1 Sample selection
The sample period for this study spans 48 quarters from the years 1995 to 2006. Firms
with non-calendar fiscal quarters are moved. The companies with mergers, acquisitions, or
discontinued operations, as indicated by Compustat, are excluded, since these transactions can
affect the accuracy of the coefficient estimates in the accrual models.14
The sample selection criteria are as follows, and the detailed selection procedure is in
Table 1:
1.
The financial firms (SIC 6000-6999) and utilities (SIC 4900-4999) are moved.
2.
The stock of a firm has a market price at the end of quarter q of year t greater than $5.
This procedure is to mitigate the potential trading illiquidity concern that might add noise
to the pricing analysis.
3.
A firm has total assets at the end of quarter q of year t that equal or exceed $1 million
dollars.
4.
The firms’ quarterly earnings announcement dates are available on Compustat. 15
5.
The firms have earnings announcements within 80 days of the end of each quarter to
remove erroneous announcement dates.
6.
Both the analyst forecasts of EPS and actual EPS are available on I/B/E/S.
7.
Stock return data is available on CRSP to facilitate the estimation of the market model
and the abnormal returns around earnings announcements.
8.
The necessary Compustat data is available for calculating the measures of earnings
quality and control variables.
Two samples are constructed. The first sample contains five firms with the largest market
share of each industry and requires that these five firms account for at least 50% of the total
14 As suggested in Collins and Hribar (2002) and McNichols (2002), these transactions cause the accrualsand sales to be based on a different entity.15 A test is conducted in which the earnings announcement date is either from Compustat or IBES of whichis earlier and the results do not change.

8/18/2019 Earnings Quality and Information Transfers(Sophia Liu).pdf
http://slidepdf.com/reader/full/earnings-quality-and-information-transferssophia-liupdf 16/41
15
market share in each industry. This selection is building on an oligopolistic setting and is
employed in prior research, such as Tookes (2008) and Kovacs (2007). The reported results are
based on this sample since this setting is theoretically and empirically documented to be better
capturing intra-industry information transfers. This sample is composed of 137 industries, totaling
3,179 industry-quarters. The firm size in terms of the market capitalization varies in a large range
between 73.84 million dollars and 111,215.57 million dollars. The average level of industry
concentration, measured as the Herfindahl index, varies between 0.07 and 0.82. The second
sample is composed of the first announcement in each industry group and any firms whose 3-digit
SIC code is the same as the announcing firms and whose earnings releases are at least one trading
day later than the announcing firms’ earnings releases. 16 The second sample contains both small
and large firms and the results of this sample are similar as those of the first sample for EQ
(ERC_ABS), EQ (Accruals_ABS), and EQ (AQ) but weaker for EQ (VR).
4.2 I ntra-industry i nformation transfers
To avoid the influence of outliers, the analyses are conducted at the portfolio level. In
particular, I form deciles in each quarter based on the unexpected earnings (UE) and the abnormal
returns of announcing firms and assign a rank to each decile. In each decile, I calculate abnormal
returns of announcing firms and of non-announcing firms. Consistent with prior studies, Panel A
of Table 2 documents that the deciles with larger UE (which are based on analyst forecast errors)
display higher average abnormal returns of non-announcing firms than the deciles with smaller
UE, although not monotonically and not significantly for some deciles. The abnormal returns of
non-announcing firms range from -0.09% to 0.25%, and the abnormal returns of announcing
firms range from -2.03% to 2.82%. The regression estimation in Panel C of Table 2 confirms the
positive association between the announcer’s directional unexpected earnings and non-
announcing firms’ directional abnormal returns (p=0.004).
Some prior studies also use abnormal returns of announcing firms on the earnings
announcement date as a proxy to capture the amount of earnings information. I form deciles in
each quarter based on this measure in Panel B of Table 2 and consistent with prior studies, there
is a significantly positive association between the abnormal returns of announcing firms and of
non-announcing firms. The abnormal returns of non-announcing firms range from -0.48% to
1.03%, and the abnormal returns of announcing firms range from -6.17% to 7.22%. The
16 This sample is not required to have the minimum number of firms in each industry group. If there arevery few peer firms in the industry group, there might be the impact of any idiosyncratic price movementsthat confounds the test.

8/18/2019 Earnings Quality and Information Transfers(Sophia Liu).pdf
http://slidepdf.com/reader/full/earnings-quality-and-information-transferssophia-liupdf 17/41
16
regression estimate in Panel C of Table 2 confirms the positive association between announcing
and non-announcing firms’ abnormal returns. The results from both the unexpected earnings rank
and the abnormal returns rank indicate that information transfers are predominantly contagious.
Although both the unexpected earnings and abnormal returns of announcing firms are shown to
be positively associated with the abnormal returns of non-announcing firms, the association
between abnormal returns of announcing firms and of non-announcing firms is much stronger
than that between unexpected earnings of announcing firms and abnormal returns of non-
announcing firms. (The adjusted R 2 is 7.09% vs. 0.23% in Panel C of Table 2; the Pearson
correlation is 0.27 vs. 0.04 in Table 3.) This reflects that the non-announcing firms’ market
reaction is not confined to the announcer’s earnings per se, but the market also reacts to other
information conveyed with earnings simultaneously. In this study, I especially focus on
information contained in earnings. In addition, the use of the market reaction of announcing firms
to measure the amount of earnings information may cause overstatement of information transfers
due to the cross-security return co-movement, which is independent of the information signal of
announcing firms (Foster, 1981 and Frost, 1995). Therefore, the unexpected earnings, instead of
the abnormal returns, of announcing firms are used in the multivariate tests.
4.3 Earn ings quality measures
The following tables report the empirical results of four earnings quality measures
respectively. Each measure requires the data rolling over the 12 most recent quarters. The sample
sizes for the ERC, value-relevance, abnormal accruals, and accrual quality measures are 2,093,
2,193, 1,167, and 1,508 industry-quarters, respectively. Table 4 presents the descriptive statistics
for each subsample. It shows that announcing firms are significantly larger in terms of the market
capitalization, on average, than are non-announcing firms (p=0.00). The abnormal returns of
announcing firms at the announcement date are significantly larger than the abnormal returns of
non-announcing firms. The Herfindahl index for each industry ranges between 0.071 and 0.928,
and the mean is around 0.288. EQ (ERC_ABS) is set to capture the earnings quality of
announcing firms, of which the range is between 0.00 and 687.955; EQ (VR) ranges between
0.0001 and 0.909; EQ (Accruals_ABS) ranges between 0.005 and 0.320; and EQ (AQ) ranges
between 0.002 and 0.218.
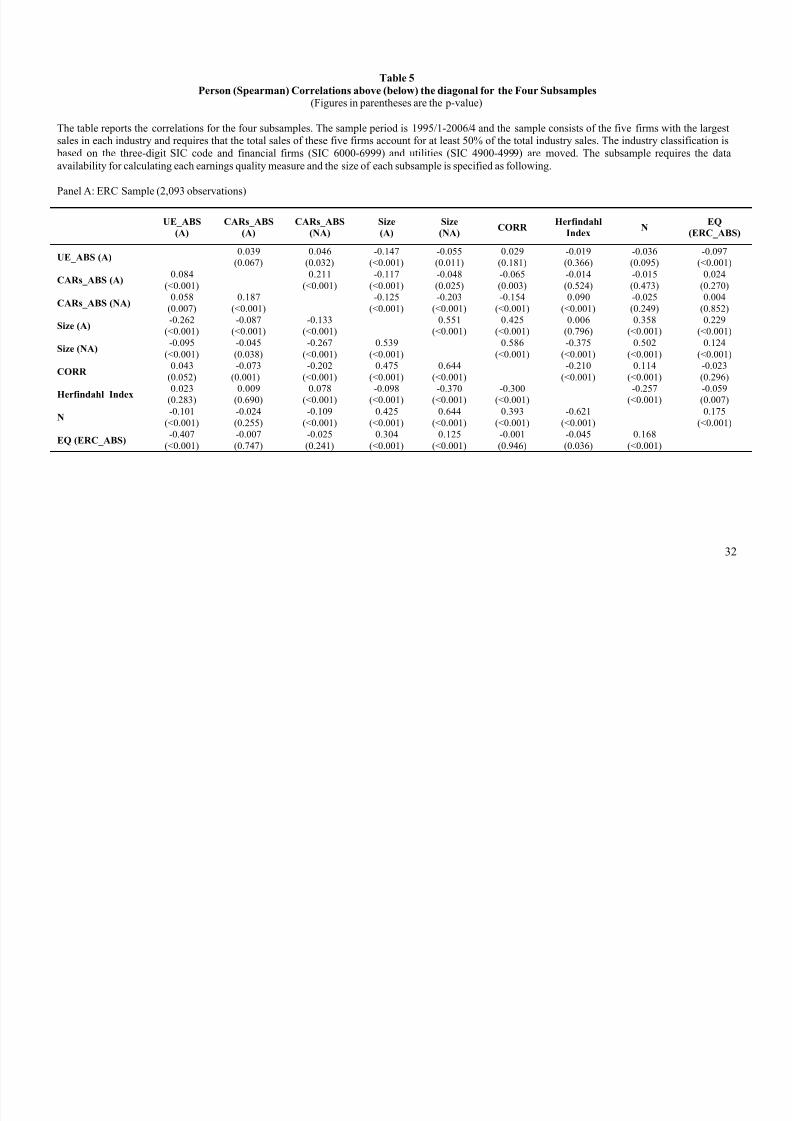
Table 5 contains the Pearson and Spearman correlations among the variables examined in
Table 4. This table illustrates that the abnormal returns of non-announcing firms are significantly
positively correlated with both the unexpected earnings and abnormal returns of announcing
firms. (Both the Pearson and Spearman correlations are significant at the 5% level for each

8/18/2019 Earnings Quality and Information Transfers(Sophia Liu).pdf
http://slidepdf.com/reader/full/earnings-quality-and-information-transferssophia-liupdf 18/41

8/18/2019 Earnings Quality and Information Transfers(Sophia Liu).pdf
http://slidepdf.com/reader/full/earnings-quality-and-information-transferssophia-liupdf 19/41
18
performed with respect to industry characteristics. Specifically, I partition the sample into
industries of high and low growth (based on the book to market ratio), industries of high and low
profitability (based on the returns on assets), and industries of high and low concentration (based
on the Herfindahl index) and the results are not sensitive to these partitions.
5. Discussion and Conclusion
It is puzzling why the incremental impact of earnings quality on the magnitude of
information transfers is only found for market-based measures but not for accrual-based
measures. I conjecture that one possible explanation is that a f irm’s historical pattern of
estimating accruals, either the mapping from accruals to operating cash flows or the abnormal
accruals, has already been incorporated into market expectations, and thus an earnings surprise of
a high accrual quality firm may be essentially the same relative to an earnings surprise of a low
accrual quality firm, and thus no differential information transfer is observed empirically. Such an
explanation hinges on the fact that the accrual-based earnings quality measures are constructed
over a long period of time, which allows the market to learn the accrual pattern of a firm and
adjust its expectation. On the other hand, market-based measures are derived based on the
relationship between stock returns and accounting earnings. In essence, stock returns reflect the
market’s adjustment of its perception of all the value-relevant information of one firm in a
particular period, and clearly this adjustment is done based upon a prior expectation that has
already taken a firm’s accrual patter n into consideration. Therefore, when the investors
historically respond more to a firm’s reported earnings or a firm’s earnings numbers are
historically more closely associated with its stock returns, it is reasonable to expect a greater
information content of this firm’s concurrent earnings announcement, and in turn, a greater
information transfer to other non-announcing firms in the same industry. To test the validity of
my conjecture, I conduct the following event study, in which the announcing firm’s 2-day CARs
is regressed on its unexpected earnings and an interaction term between the unexpected earnings
and this firm’s earnings quality measure. The test is done separately for all four earnings quality
measures. If my conjecture is true, I expect to observe an incremental market reaction to the
earnings surprise of a firm with high market-based earnings quality, and there should be no
statistical significance between the market reaction for earnings surprise of a firm with high
accrual-based earnings quality and that for earnings surprise of a firm with low accrual-based
earnings quality. Table 7 confirms my conjecture. In particular, it shows that historical abnormal
accruals or accrual quality does not incrementally affect the market’s update of its earnings

8/18/2019 Earnings Quality and Information Transfers(Sophia Liu).pdf
http://slidepdf.com/reader/full/earnings-quality-and-information-transferssophia-liupdf 20/41
19
expectation, but the historical market-based measures do. Therefore, given the fact that the
historical accrual-based earnings quality does not induce different market reaction to earnings
surprises, it is not surprising that the accrual-based earnings quality does not play a role in
information transfers either. Of course, alternative explanations are not ruled out. For example, a
quarterly instead of an annual earnings announcement setting is used in this study, since the
quarterly earnings announcements are more timely and informative than are annual earnings
announcements and therefore help to increase the power of the test in the information transfers
study. 17 However, a trade-off necessarily arises in which the quarterly accruals estimations are
subject to a greater number of estimating errors than would be the annual accruals estimations
due to the integral principle for interim financial statements in which firms may assign estimated
expenses to parts of a year. As a result, this trade-off may make the inference less accurate and
must be taken into account when evaluating the study’s conclusions.
Overall, this study investigates whether those announcing firms with higher earnings
quality result in a larger magnitude of information transfers than do those firms with lower
earnings quality surrounding quarterly earnings announcements. I identify four earnings quality
measures, ERC, value-relevance, abnormal accruals, and accrual quality, and classify ERC and
value-relevance measures as market-based and abnormal accruals and accrual quality as accrual-
based. Prior research suggests that earnings of higher quality better reflect the operating
fundamentals of a firm and thus reinforce the pricing effects of that firm. Within this context, I
expect earnings of higher quality may contain information of higher quality regarding a firm’s
valuation on the industry level as well as on the firm-specific level and therefore reinforce the
pricing effects on non-announcing firms within the same industry.
The empirical result suggests that the positive incremental impact of earnings quality on
the magnitude of information transfers takes place when the market-based, but not the accrual-
based, earnings quality measures are used. The finding that the association between announcers’
earnings quality and the magnitude of information transfers varies systematically across the
measures of earnings quality is possibly explained by the fact that the market incorporates the
market-based perspective earnings quality and accrual-based perspective earnings quality
differently. Specifically, the historical abnormal accruals and accrual quality has been
incorporated into earnings expectation ex ante and investors have already undone earnings
17 I also use the annual earnings announcement setting and an overall finding of no information transfersexplains the reason that most information transfer studies use quarterly earnings announcement setting.Pownall and Waymire (1989) is an exception.

8/18/2019 Earnings Quality and Information Transfers(Sophia Liu).pdf
http://slidepdf.com/reader/full/earnings-quality-and-information-transferssophia-liupdf 21/41
20
management or considered the coarse accrual-CFO mapping, therefore the accrual-based
measures do not affect the pricing effects of both announcing and non-announcing firms.
In summary, I demonstrate that an exploration of the effect of earnings quality on
information transfers contributes to our understanding of how information transfers take place
and of different measures of earnings quality.

8/18/2019 Earnings Quality and Information Transfers(Sophia Liu).pdf
http://slidepdf.com/reader/full/earnings-quality-and-information-transferssophia-liupdf 22/41
21
References
Asthana, S. and B. Mishra. 2001. The differential information hypothesis, firm size, and earningsinformation transfer, an empirical investigation. Journal of Business Research, vol. 53: 37-47.
Atiase, RK. 1985. Market implications of predisclosure information: size and exchange effects. Journal of
Accounting Research, vol. 25: 168-76.
Baginski, S. 1987. Intraindustry information transfers associated with management forecasts of earnings. Journal of Accounting Research, vol. 25(2): 196-216.
Ball, R. and P. Brown. 1968. An empirical evaluation of accounting income numbers. Journal of
Accounting Research, vol. 6(2): 159-178.
Barth, E., Cram, D.P., and K.K. Nelson. 2001. Accruals and the prediction of future cash flows. The
Accounting Review, vol. 76: 27-58.
Bartov, E., Givoly, D., and C. Hayn. 2002. The rewards to meeting or beating earnings expectations. Journal of Accounting and Economics, vol. 33: 173-204.
Bhattacharya, N., Desai, H., and K. Venkataraman. 2007. Earnings quality and information asymmetry:evidence from trading costs. Working Paper. Southern Methodist University.
Bhojraj, S., Lee, C., and D. Oler. 2003. What’s my line? A comparison of industry classification schemes
for capital market research. Journal of Accounting Research, vol. 41(5): 745-774.
Caton, G.L., Goh, J., and K. Ninon. 2003. Dividend omissions and intraindustry information transfers. Journal of Financial Research, vol. 26(1): 51-64.
Clinch, G. and N. A. Sinclair. 1987. Intra-industry information releases: a recursive systems approach. Journal of Accounting and Economics, vol. 9: 89-106.
Collins, D. and S. Kothari. 1989. An analysis of inter-temporal and cross-sectional determinants of earnings
response coefficients. Journal of Accounting and Economics, vol. 11:143-181.
Collins, D. and P. Hribar. 2002. Errors in estimating accruals: implications for empirical research. Journal
of Accounting Research, vol. 40: 105-134.
Collins, D., Maydew, E., and I. Weiss. 1997. Changes in the value-relevance of earnings and book valuesover the past forty years. Journal of Accounting and Economics, vol. 24: 39-67.
Dechow, P. and I. Dichev. 2002. The quality of accruals and earnings: the role of accrual estimation errors.The Accounting Review, vol. 77(supplement): 35-59.
Dechow, P., Sloan, R., and A. Sweeney. 1995. Detecting earnings management. The Accounting Review,vol. 70(2): 193-225.
Dietrich, J.R. 1989. Discussion of voluntary disclosure choice and earnings information transfer. Journalof Accounting Research, vol. 27 (supplement): 106-110.
Edelen, R.M. and G.B. Kadlec. 2005. Issuer surplus and the partial adjustment of IPO prices to publicinformation. Journal of Financial Economics, vol. 77: 347-373.
Fee, C.E., and S. Thomas. 2004. Sources of gains in horizontal takeovers: Evidence from customer,supplier, and rival firms. Journal of Financial Economics, vol. 74(3): 423-460.

8/18/2019 Earnings Quality and Information Transfers(Sophia Liu).pdf
http://slidepdf.com/reader/full/earnings-quality-and-information-transferssophia-liupdf 23/41
22
Ferris, S.P., Jayaraman, N., and A.K. Makhija. 1997. The response of competitors to announcements of bankruptcy: an empirical examination of contagion and competitive effects. Journal of Corporate Finance,vol. 3(4): 367-395.
Foster, G. 1981. Intra-industry information transfers associated with earnings releases. Journal of
Accounting and Economics, vol. 3: 201-232.
Francis, J. and K. Schipper. 1999. Have financial statements lost their relevance? Journal of Accounting
Research, vol. 37: 319-352.
Francis, J., LaFond, R., Olsson P., and K. Schipper. 2003. Earnings quality and the pricing effects ofearnings patterns. Working Paper, Duke University, University of Wisconsin, Financial AccountingStandards Board.
Francis, J., LaFond, R., Olsson P., and K. Schipper. 2004. Costs of equity and earnings attributes. The
Accounting Review, vol. 79(4): 967-1010.
Francis, J., LaFond, R., Olsson P., and K. Schipper. 2005. The market pricing of accruals quality. Journal
of Accounting and Economics, vol. 39: 295-327.
Frankel, R. and X. Li. 2004. Characteristics of a firm’s information environment and the informationasymmetry between insiders and outsiders. Journal of Accounting and Economics, vol. 37: 229-259.
Freeman, R.N. 1987. The association between accounting earnings and security returns for large and smallfirms. Journal of Accounting and Economics, vol. 9: 195-228.
Freeman, R. N. and S. Tse.1992. An earnings prediction approach to examining intercompany informationtransfer. Journal of Accounting and Economics, vol. 15: 509-523.
Frost, C. 1995. Intraindustry information transfer: an analysis of research methods and additional evidence. Review of Quantitative Finance and Accounting , vol. 5: 111-126.
Gleason, C., Jenkins, N.T., and W.B. Johnson. 2008. The contagion effects of accounting restatements. The
Accounting Review, vol. 83 (1): 83-110.
Han, J. C. Y. and J.J. Wild. 1990. Unexpected earnings and intraindustry information transfers: furtherevidence. Journal of Accounting Research, vol. 28(1): 211-219.
Han, J. C. Y. and J. J. Wild, 2000. Predisclosure information, firm capitalization, and earnings informationtransfers. Journal of Business Research, vol. 49: 273-288.
Han, J. C. Y., Wild, J. J., and K. Ramesh. 1989. Managers’ earnings forecasts and intra-industryinformation transfers. Journal of Accounting and Economics, vol. 11: 3-33.
Hetzel, M., Li, Z., Officer, M., and K. Rodgers. 2008. Inter-firm linkages and the wealth effects of financialdistress along the supply chain. Journal of Financial Economics, vol. 87 (2): 374-387.
Kim, Y., Lacina, M., and M. Park. 2008. Positive and negative information transfers from managementforecasts. Journal of Accounting Research, vol. 46 (4): 885-908.
Kirschenheiter, M and N. Melumad. 2005. Earnings’ quality and smoothing. Working Paper. PurdueUniversity and Columbia University.
Kothari, S.P.,Leone, A. and C. Wasley. 2005. Performance matched discretionary accrual measures. Journal of Accounting and Economics, vol. 39: 163-197.

8/18/2019 Earnings Quality and Information Transfers(Sophia Liu).pdf
http://slidepdf.com/reader/full/earnings-quality-and-information-transferssophia-liupdf 24/41
23
Kovacs, T. 2007. Is the post-earnings announcement drift rational or behavioral? evidence from intra-industry information transfers. Working Paper. Northeastern University.
Lambert, R., Leuz, C., and R. Verrecchia. 2007. Accounting information, disclosure, and the cost of capital. Journal of Accounting Research, vol. 45(2): 385-420.
Lang, L.H.P. and R.M. Stulz. 1992. Contagion and competitive intra-industry effects of bankruptcyannouncements: An empirical analysis. Journal of Financial Economics, vol. 32(1): 45-60.
Lim, S., Ro, B., and Y. Pyo. 2001. Analysts’ earnings forecast revision around industry member firms’
earnings announcement. Advances in Accounting , vol. 18: 149-168.
Matsumoto, Dawn A. 2002 Management’s incentives to avoid negative earnings surprises. The Accounting
Review 77(3): 483-514.
McNichols, M. 2000. Research design issues in earnings management studies. Journal of Accounting and
Public Policy, vol. 19(4-5): 313-345.
McNichols, M. 2002. Discussion of the quality of accruals and earnings: the role of accrual estimationerrors. The Accounting Review, vol. 77(supplement): 61-69.
Menzly, L. and O. Ozbas. 2006. Cross-industry momentum. Working Paper. University of SouthernCalifornia.
Mikhail, M, Walther, B., and R. Willis. 2003. Reactions to dividend changes conditional on earningsquality. Journal of Accounting, Auditing, and Finance, vol. 18 (1): 121-151.
Moskowitz, T. and M. Grinblatt. 1999. Do industries explain momentum? Journal of Finance, vol. 54 (4):1249-1290.
Ninon, K.S. 1999. The industry-wide implications of dividend omission and initiation announcements andthe determinants of information transfer. Financial Review, vol. 34(1): 137-158.
Pandit, S., Wasley, C., and T. Zach. 2007. Information externalities in capital market: the economicdeterminants of suppliers’ stock price reaction to their major customers’ information events . WorkingPaper. Ohio State University, University of Rochester, and Washington University.
Piotroski, J. and D. Roulstone. 2004. The influence of analysts, institutional investors, and insiders on theincorporation of market, industry, and firm-specific information into stock price. The Accounting Review,vol. 79(4): 1119-1151.
Pownall, G. and G. Waymire. 1989. Voluntary disclosure choice and earnings information transfer. Journal
of Accounting Research, vol. 27: 85-105.
Pyo, Y. and S. Lustgarten. 1990. Differential intra-industry information transfer associated withmanagement earnings forecasts. Journal of Accounting and Economics, vol. 13: 365-379.
Ramnath, S. 2002. Investor and analyst reactions to earnings announcement of related firms: an empiricalanalysis. Journal of Accounting Research, vol. 40(5): 1351-1376.
Revsine, L, Collins, D. and B. Johnson. 1999. Financial reporting and analysis. Prentice Hall, pp.988.
Richardson, S., Sloan, R., Soliman. M. and I. Tuna. 2005. Accrual reliability, earnings persistence andstock prices. Journal of Accounting Economics, vol. 39: 437-485.
Schipper, K.1990. Commentary on information transfers. Accounting Horizons, vol. 4(4): 97-107.

8/18/2019 Earnings Quality and Information Transfers(Sophia Liu).pdf
http://slidepdf.com/reader/full/earnings-quality-and-information-transferssophia-liupdf 25/41
24
Schipper, K. and L. Vincent. 2003. Earnings quality. Accounting Horizons, vol. 17(supplement): 97-110.
Schoderbek MP. 1995. Theory of the dominant firm: a capital market test. Review of Quantitative Finance
and Accounting , vol. 5: 253-270.
Servaes, H. and A. Tamayo. 2005. The response of industry rivals to control threats. Working Paper.London Business School.
Shahrur, H. 2005. Industry structure and horizontal takeovers: Analysis of wealth effects on rivals,suppliers, and corporate customers. Journal of Financial Economics, vol. 76(1): 61-98.
Sloan, R. 1996. Do stock prices fully reflect information in accruals and cash flows about future earnings?The Accounting Review, vol. 71: 289-315.
Slovin, M., Sushka, M., and Y. Bendeck. 1991. The intra-industry effects of going-private transactions. Journal of Finance, vol. 46(4): 1537-1550.
Tookes, H. 2008. Information, trading and product market interactions: cross-sectional implications ofinformed trading. Journal of Finance, vol. 63(1): 379-413
Szewczyck, S. 1992. The intra-industry transfer of information inferred from announcement of corporatesecurity offerings. Journal of Finance, vol. 47(5): 1935-1945.
Wasley, C. 2001. Information externalities associated with earnings pre-announcements. Working Paper.University of Rochester.
White, G., Sondhi, A. and A. Frued. 2003. The analysis and use of financial statements. John Wiley andSons, pp.767.
Xie, H. 2001. The mispricing of abnormal accruals. The Accounting Review, vol. 22: 249-281.
Xu, T., Najand, M., and D. Ziegenfuss. 2006. Intra-industry effects of earnings restatement due to
accounting irregularities. Journal of Business Finance and Accounting , vol. 33(5-6): 696-714.

8/18/2019 Earnings Quality and Information Transfers(Sophia Liu).pdf
http://slidepdf.com/reader/full/earnings-quality-and-information-transferssophia-liupdf 26/41
25
Figure1. Dissemination and earnings quality of quarterly earnings information
Ball and Brown (1968)
Effects of Earnings Quality(Francis et al., 2003; 2004;2005; Bartov et al. 2002)
Foster (1981), Clinch andSinclair (1987), Han and Wild(1990), and Freeman and Tse(1992)
Earnings Surprise of
Quarterly Earnings
Effects of Earnings Quality(this study)
Price Reactions of the
Announcing Firms
Price Reactions of the Non-Announcing Firms
(Information Transfers)

8/18/2019 Earnings Quality and Information Transfers(Sophia Liu).pdf
http://slidepdf.com/reader/full/earnings-quality-and-information-transferssophia-liupdf 27/41
26
Table 1
Sample Selection Procedures
This table summarizes the procedures of obtaining the sample of announcing and non-announcing firms. The data is drawn from COMPUSTAT quarterly file and spans 1995-2006.
The final sample for each earnings quality measure is formed from this sample based on thedata available for calculating the earnings quality measure.
Selection Procedures
The number of firm-quarter observations in
the sample
Announcing/ Non-announcing
All firm-quarter observations whose fiscal period ends on December 31from the quarterly COMPUSTAT file over 1995-2006. Financial firms(SIC 6000-6999) and utilities (SIC 4900-4999) are moved.
256,555
Firm-quarter observations not meeting the following requirements areexcluded:
U.S. firms (ADR firm observations are excluded.)243,097
The stock of a firm has a market price at the end of quarterq of year t which equals or exceeds $5. A firm has totalassets at the end of quarter q of year t that equal or exceedone million dollars.
164,309
Earnings announcement dates are available on COMPUSTAT. 158,775
Firms have earnings announcements within 80 days after theend of each quarter. 157,428
The sales data is available on COMPUSTAT to calculate theHerfindahl index. Stock price and shares outstanding data isavailable on COMPUSTAT to calculate firm size.
152,969
A sample of firms that is likely to have strong and /or well defined product market relations-large firms in highly concentrated industries.Five firms are with the largest market shares from each three-digit SICindustry, and required that these five firms account for at least 50% of thetotal industry sales.
5,683 22,732
Non-announcing firms released earnings one trading day later thanannouncing firms’ announcements. (i.e. An industry-quarter observation
is excluded if two firms in the same industry first make earningsannouncement on the same day)
3,886 15,544
Analyst forecast consensus of EPS prior to the quarterly earningsannouncement and actual EPS are available on I/B/E/S. 3,186 12,744
Stock prices are available on CRSP to facilitate the two-day CARs.3,179 12,583

8/18/2019 Earnings Quality and Information Transfers(Sophia Liu).pdf
http://slidepdf.com/reader/full/earnings-quality-and-information-transferssophia-liupdf 28/41
27
Table 2
Intra-industry Information Transfers
This table reports the abnormal returns of announcing and of non-announcing firms aroundthe announcing firms’ earnings announcement dates. Unexpected information deciles areformed each quarter by sorting on the announcing firms’ analyst earnings forecast errors
(Panel A) and on the announcing firms’ abnormal returns (Panel B). T-statistics are in parentheses.
Deciles
based on the
amount of
earnings
information
Average abnormal
returns for
announcing firms
Average
abnormal
returns for
announcing
firms (t-
statistics)
Average
abnormal
returns for non-
announcing
firms
Average
abnormal
returns for
non-
announcing
firms (t-
statistics)
Panel A: Deciles based on the unexpected earnings of announcing firms
(Unexpected earnings are measures in analyst forecast errors)1 -0.0203 (-9.37) -0.0009 (-0.57)2 -0.0149 (-8.16) -0.0022 (-1.85)3 -0.0049 (-2.87) -0.0006 (-0.44)
4 -0.0059 (-2.86) 0.0008 (0.59)5 0.0034 (1.86) 0.0001 (0.08)6 0.0062 (3.20) 0.0005 (0.45)7 0.0156 (8.18) 0.0003 (0.20)
8 0.0095 (4.73) 0.0003 (0.21)9 0.0195 (8.79) 0.0024 (1.75)10 0.0282 (11.83) 0.0025 (1.84)
10-1 0.0485 p-value:0.00 0.0034 p-value:0.07
Panel B: Deciles based on the abnormal returns of announcing firms
1 -0.0617 (-24.36) -0.0048 (-3.46)2 -0.0247 (-14.16) -0.0028 (-2.18)3 -0.0148 (-8.46) -0.0034 (-2.56)4 -0.0025 (-1.40) -0.0022 (-1.84)
5 0.0027 (1.50) -0.0003 (-0.25)6 0.0081 (4.87) -0.0006 (-0.46)7 0.0088 (5.06) 0.0013 (1.02)8 0.0178 (9.04) 0.0007 (0.56)9 0.0309 (15.75) 0.0050 (3.63)10 0.0722 (30.97) 0.0103 (7.57)
10-1 0.1339 p-value:0.00 0.0151 p-value:0.00

8/18/2019 Earnings Quality and Information Transfers(Sophia Liu).pdf
http://slidepdf.com/reader/full/earnings-quality-and-information-transferssophia-liupdf 29/41
28
Panel C: Regression estimations
Dep. Variable = CARs (NA) Model 1 Model 2
Intercept 0.025***
(<0.001)
0.005***
(<0.001)
UE(A) 0.130***(0.004)
CARs(A) 0.586***(<0.001)
Adj. R-square (%) 0.23 7.09
All the variables are defined in Appendix 1. ”A” implies announcing firms and “NA” implies non-announcing firms. ***, **, and * signify significance at 1%, 5%, and 10% levels.

8/18/2019 Earnings Quality and Information Transfers(Sophia Liu).pdf
http://slidepdf.com/reader/full/earnings-quality-and-information-transferssophia-liupdf 30/41
29
Table 3
Correlations between Unexpected Earnings and Abnormal Returns
This table reports the Pearson correlations between the unexpected earnings and the abnormalreturns of announcing and non-announcing firms.
Rank on unexpected
earnings (A)
Rank on abnormal
returns (A)
Abnormal returns (NA) 0.04** 0.27***
Abnormal returns (A) 0.19***
Variable definitions: The rank on unexpected earnings (A) is the decile rank sorted by thedifference between the announcing firms’ actual earnings per share and the latest median analystforecast for the same quarter, scaled by the stock price in the beginning of the quarter. The rank on
abnormal returns (A) is the decile rank sorted by the abnormal returns of the announcing firms.Abnormal returns (NA) are the cumulative abnormal returns in quarter q of year t for non-announcingfirms over the two-day window on the announcing firm’s earnings announcement date. “A” implies
announcing firms and “NA” implies non-announcing firms. ***, **, and * signify significance at 1%,5%, and 10% levels.

8/18/2019 Earnings Quality and Information Transfers(Sophia Liu).pdf
http://slidepdf.com/reader/full/earnings-quality-and-information-transferssophia-liupdf 31/41
Table 4
Descriptive Statistics for the Four Subsamples
The table reports the descriptive statistics for the four subsamples. The sample period is 1995/1-2006/4 and the sample consists of the five firms with thelargest sales in each industry and requires that the total sales of these five firms account for at least 50% of the total industry sales. The industryclassification is based on the three-digit SIC code and financial firms (SIC 6000-6999) and utilities (SIC 4900-4999) are moved. The subsample requiresthe data availability for calculating each earnings quality measure and the size of each subsample is specified as following.
Panel A: ERC Sample (2,093 observations)
Variable Mean Standard Deviation Min Median Max
Size (A) 8.053 1.682 3.373 7.961 13.256
Size (NA) 7.345 1.472 3.805 7.222 11.997
UE_ABS (A) 0.002 0.008 0 0.0006 0.284
CARs_ABS (A) 0.034 0.038 0.00001 0.022 0.534
CARs_ABS (NA) 0.025 0.017 0.002 0.021 0.152
CORR 0.258 0.179 -0.080 0.223 0.859
Herfindahl Index 0.292 0.151 0.071 0.257 0.928
N 19.440 33.612 5 10 487
EQ (ERC_ABS) 34.821 59.709 0 12.908 687.955
Panel B: Value Relevance Sample (2,193 observations)
Variable Mean Standard Deviation Min Median Max
Size (A) 8.031 1.717 3.373 7.943 13.256
Size (NA) 7.333 1.471 3.653 7.210 11.997UE_ABS (A) 0.002 0.008 0 0.001 0.284
CARs_ABS (A) 0.034 0.040 0.0001 0.022 0.678CARs_ABS (NA) 0.025 0.017 0.002 0.020 0.152
CORR 0.259 0.181 -0.080 0.225 0.860
Herfindahl index 0.292 0.151 0.071 0.258 0.928
N 19.138 32.871 5 10 487
EQ (VR) 0.234 0.183 0.0001 0.197 0.909

8/18/2019 Earnings Quality and Information Transfers(Sophia Liu).pdf
http://slidepdf.com/reader/full/earnings-quality-and-information-transferssophia-liupdf 32/41
31
Panel C: Abnormal Accruals Sample (1,167 observations)
Variable Mean Standard Deviation Min Median Max
Size (A) 8.113 1.668 3.373 8.082 12.522
Size (NA) 7.486 1.495 3.653 7.395 11.702
UE_ABS (A) 0.002 0.005 0 0.001 0.098CARs_ABS (A) 0.033 0.035 0.0001 0.021 0.298
CARs_ABS (NA) 0.025 0.019 0.002 0.020 0.152
CORR 0.262 0.174 -0.0587 0.231 0.810
Herfindahl Index 0.265 0.124 0.071 0.238 0.914
N 20.247 31.609 5 12 487EQ (Accruals_ABS) 0.042 0.038 0.005 0.029 0.320
Panel D: Accrual Quality Sample (1,508 observations)
Variable Mean Standard Deviation Min Median Max
Size (A) 7.989 1.599 3.373 7.972 12.522
Size (NA) 7.393 1.448 3.653 7.250 11.997
UE_ABS (A) 0.002 0.005 0 0.0005 0.098
CARs_ABS (A) 0.034 0.036 0.0001 0.022 0.391
CARs_ABS (NA) 0.025 0.019 0.002 0.020 0.157
CORR 0.260 0.172 -0.062 0.230 0.814
Herfindahl Index 0.276 0.137 0.068 0.245 0.928
N 18.573 24.965 5 10 235
EQ (AQ ) 0.017 0.015 0.002 0.014 0.218
All the variables are defined in Appendix 1.
8/18/2019 Earnings Quality and Information Transfers(Sophia Liu).pdf
http://slidepdf.com/reader/full/earnings-quality-and-information-transferssophia-liupdf 33/41
32
Table 5
Person (Spearman) Correlations above (below) the diagonal for the Four Subsamples(Figures in parentheses are the p-value)
The table reports the correlations for the four subsamples. The sample period is 1995/1-2006/4 and the sample consists of the five firms with the largestsales in each industry and requires that the total sales of these five firms account for at least 50% of the total industry sales. The industry classification is
based on the three-digit SIC code and financial firms (SIC 6000-6999) and utilities (SIC 4900-4999) are moved. The subsample requires the dataavailability for calculating each earnings quality measure and the size of each subsample is specified as following.
Panel A: ERC Sample (2,093 observations)
UE_ABS
(A)
CARs_ABS
(A)
CARs_ABS
(NA)
Size
(A)
Size
(NA)CORR
Herfindahl
IndexN
EQ
(ERC_ABS)
UE_ABS (A)0.039
(0.067)0.046
(0.032)-0.147
(<0.001)-0.055(0.011)
0.029(0.181)
-0.019(0.366)
-0.036(0.095)
-0.097(<0.001)
CARs_ABS (A)0.084
(<0.001)0.211
(<0.001)-0.117
(<0.001)-0.048(0.025)
-0.065(0.003)
-0.014(0.524)
-0.015(0.473)
0.024(0.270)
CARs_ABS (NA)0.058
(0.007)0.187
(<0.001)-0.125
(<0.001)-0.203
(<0.001)-0.154
(<0.001)0.090
(<0.001)-0.025(0.249)
0.004(0.852)
Size (A)-0.262
(<0.001)-0.087
(<0.001)-0.133
(<0.001)0.551
(<0.001)0.425
(<0.001)0.006
(0.796)0.358
(<0.001)0.229
(<0.001)
Size (NA)-0.095
(<0.001)-0.045(0.038)
-0.267(<0.001)
0.539(<0.001)
0.586(<0.001)
-0.375(<0.001)
0.502(<0.001)
0.124(<0.001)
CORR0.043
(0.052)-0.073
(0.001)-0.202
(<0.001)0.475
(<0.001)0.644
(<0.001)-0.210
(<0.001)0.114
(<0.001)-0.023(0.296)
Herfindahl Index 0.023(0.283) 0.009(0.690) 0.078(<0.001) -0.098(<0.001) -0.370(<0.001) -0.300(<0.001) -0.257(<0.001) -0.059(0.007)
N-0.101
(<0.001)-0.024(0.255)
-0.109(<0.001)
0.425(<0.001)
0.644(<0.001)
0.393(<0.001)
-0.621(<0.001)
0.175(<0.001)
EQ (ERC_ABS)-0.407
(<0.001)-0.007(0.747)
-0.025(0.241)
0.304(<0.001)
0.125(<0.001)
-0.001(0.946)
-0.045(0.036)
0.168(<0.001)

8/18/2019 Earnings Quality and Information Transfers(Sophia Liu).pdf
http://slidepdf.com/reader/full/earnings-quality-and-information-transferssophia-liupdf 34/41
33
Panel B: Value Relevance Sample (2,193 observations)
UE_ABS
(A)
CARs_ABS
(A)
CARs_ABS
(NA)
Size
(A)
Size
(NA)CORR
Herfindahl
IndexN EQ (VR)
UE_ABS (A)0.049
(0.019)0.052
(0.012)-0.147
(<0.001)-0.056(0.008)
0.021(0.323)
-0.018(0.403)
-0.033(0.096)
-0.005(0.827)
CARs_ABS (A)0.082
(<0.001)0.236
(<0.001)-0.100
(<0.001)-0.041(0.049)
-0.064(0.003)
-0.016(0.441)
-0.009(0.667)
0.058(0.006)
CARs_ABS(NA)0.061
(0.004)
0.179
(<0.001)
-0.123
(<0.001)
-0.210
(<0.001)
-0.152
(<0.001)
0.092
(<0.001)
-0.022
(0.301)
0.038
(0.069)
Size (A)-0.278
(<0.001)-0.073(0.001)
-0.137(<0.001)
0.554(<0.001)
0.437(<0.001)
0.005(0.811)
0.352(<0.001)
-0.043(0.041)
Size (NA)-0.106
(<0.001)-0.032(0.132)
-0.270(<0.001)
0.540(<0.001)
0.587(<0.001)
-0.379(<0.001)
0.499(<0.001)
-0.039(0.065)
CORR0.021
(0.315)-0.0003(0.989)
-0.192(<0.001)
0.488(<0.001)
0.643(<0.001)
-0.319(<0.001)
0.154(<0.001)
-0.069(0.001)
Herfindahl Index0.024
(0.252)-0.025(0.226)
0.073(0.001)
-0.087(<0.001)
-0.367(<0.001)
-0.302(<0.001)
-0.259(<0.001)
0.006(0.765)
N-0.103
(<0.001)0.020
(0.337)-0.103
(<0.001)0.425
(<0.001)0.634
(<0.001)0.405
(<0.001)-0.626
(<0.001)-0.038(0.069)
EQ (VR) -0.045(0.035)
0.027(0.204)
0.050(0.017)
-0.061(0.004)
-0.033(0.110)
-0.076(<0.001)
-0.005(0.821)
0.004(0.856h)

8/18/2019 Earnings Quality and Information Transfers(Sophia Liu).pdf
http://slidepdf.com/reader/full/earnings-quality-and-information-transferssophia-liupdf 35/41
34
Panel C: Abnormal Accruals Sample (1,167 observations)
UE_ABS
(A)
CARs_ABS
(A)
CARs_ABS
(NA)
Size
(A)
Size
(NA)CORR
Herfindahl
IndexN
EQ
(Accruals_
UE_ABS (A)0.085
(0.003)0.115
(<0.001)-0.215
(<0.001)-0.070(0.015)
0.057(0.050)
-0.022(0.449)
-0.045(0.115)
-0.05(0.053
CARs_ABS (A)0.086
(0.003)0.296
(<0.001)-0.079(0.006)
-0.041(0.157)
-0.063(0.032)
0.009(0.752)
-0.012(0.678)
0.059(0.039
CARs_ABS(NA)0.126
(<0.001)
0.222
(<0.001)
-0.170
(<0.001)
-0.210
(<0.001)
-0.163
(<0.001)
0.097
(<0.001)
-0.017
(0.566)
-0.08
(0.003Size (A)
-0.302(<0.001)
-0.046(0.109)
-0.189(<0.001)
0.580(<0.001)
0.508(<0.001)
-0.177(<0.001)
0.369(<0.001)
-0.05(0.049
Size (NA)-0.101
(<0.001)-0.036(0.210)
-0.275(<0.001)
0.570(<0.001)
0.600(<0.001)
-0.404(<0.001)
0.425(<0.001)
0.011(0.703
CORR0.014
(0.637)-0.059(0.045)
-0.202(<0.001)
0.520(<0.001)
0.646(<0.001)
-0.167(<0.001)
0.126(<0.001)
-0.04(0.124
Herfindahl Index0.018
(0.524)0.037
(0.198)0.062
(0.032)-0.190
(<0.001)-0.392
(<0.001)-0.163
(<0.001)-0.233
(<0.001)-0.00(0.861
N-0.089(0.002)
-0.020(0.478)
-0.074(0.010)
0.514(<0.001)
0.637(<0.001)
0.299(<0.001)
-0.589(<0.001)
0.024(0.396
EQ (Accruals_ABS)0.029
(0.317)0.056
(0.049)0.007
(0.809)-0.145
(<0.001)-0.102
(<0.001)-0.028(0.327)
0.067(0.019)
-0.108(<0.001)

8/18/2019 Earnings Quality and Information Transfers(Sophia Liu).pdf
http://slidepdf.com/reader/full/earnings-quality-and-information-transferssophia-liupdf 36/41
35
Panel D: Accrual Quality Sample (1,508 observations)
UE_ABS
(A)
CARs_ABS
(A)
CARs_ABS
(NA)
Size
(A)
Size
(NA)CORR
Herfindahl
IndexN EQ (AQ)
UE_ABS (A)0.092
(<0.001)0.112
(<0.001)-0.213
(<0.001)-0.081(0.001)
0.041(0.113)
-0.005(0.825)
-0.062(0.017)
-0.023(0.357)
CARs_ABS (A)0.100
(<0.001)0.249
(<0.001)-0.063(0.013)
-0.030(0.227)
-0.082(0.002)
0.026(0.306)
-0.015(0.566)
0.125(<0.001)
CARs_ABS(NA)
0.072
(0.004)
0.189
(<0.001)
-0.119
(<0.001)
-0.180
(<0.001)
-0.156
(<0.001)
0.084
(<0.001)
-0.065
(0.013)
0.010
(0.693)
Size (A)-0.304
(<0.001)-0.034(0.180)
-0.121(<0.001)
0.559(<0.001)
0.487(<0.001)
-0.121(<0.001)
0.482(<0.001)
-0.061(0.016)
Size (NA)-0.148
(<0.001)-0.018(0.475)
-0.229(<0.001)
0.525(<0.001)
0.584(<0.001)
-0.372(<0.001)
0.576(<0.001)
0.005(0.858)
CORR-0.003(0.910)
-0.080(0.002)
-0.200(<0.001)
0.498(<0.001)
0.618(<0.001)
-0.273(<0.001)
0.246(<0.001)
-0.079(0.002)
Herfindahl Index0.053
(0.037)0.043
(0.091)0.040
(0.115)-0.149
(<0.001)-0.352
(<0.001)-0.246
(<0.001)-0.330
(<0.001)-0.064(0.012)
N-0.152
(<0.001)-0.035(0.182)
-0.076(0.004)
0.483(<0.001)
0.631(<0.001)
0.389(<0.001)
-0.591(<0.001)
0.018(0.496)
EQ (AQ)0.002
(0.925)0.060
(0.017)0.047
(0.060)-0.087
(<0.001)-0.023(0.370)
-0.089(0.001)
-0.035(0.163)
-0.017(0.503)
All the variables are defined in Appendix 1.

8/18/2019 Earnings Quality and Information Transfers(Sophia Liu).pdf
http://slidepdf.com/reader/full/earnings-quality-and-information-transferssophia-liupdf 37/41
36
Table 6
Regression Estimations for the Four Subsamples(Figures in parentheses are the p-value)
The table reports the results of OLS regressions of non-announcing firms’ two-day abnormal returns on the earnings quality measure, controlling for theamount of earnings information and other determinants that have been shown to affect the magnitude of information transfers. The sample period is1995/1-2006/4 and the sample consists of the five firms with the largest sales in each industry and requires that the total sales of these five firms accountfor at least 50% of the total industry sales. The industry classification is based on the three-digit SIC code and financial firms (SIC 6000-6999) and utilities(SIC 4900-4999) are moved. The subsample requires the data availability for calculating each earnings quality measure and the size of each subsample is
specified as following. ***, **, and * signify significance at 1%, 5%, and 10% levels.
CARs_ABS(NA) j,t,q =β 0 + β 1 UE_ABS(A)i,t,q + β 2 EQ(A)i,t,q-1 + β 3 UE_ABS(A)i t,q * EQ(A)i,t ,q-1+ Control Variables + ε
Panel A
Subsample ERC Value Relevance Abnormal Accruals Accrual Quality
The number of observations 2,093 2,193 1,167 1,508
Dep. Variable: CARs_ABS (NA) Model 1 Model 2 Model 1 Model 2 Model 1 Model 2 Model 1 Model 2
Intercept0.029***(<0.001)
0.025***(<0.001)
0.028***(<0.001)
0.025***(<0.001)
0.030***(<0.001)
0.025***(<0.001)
0.029***(<0.001)
0.025***(<0.001)
UE_ABS (A)
0.113**
(0.018)
0.126***
(0.007)
0.437***
(<0.001)
0.385***
(<0.001)
CARs_ABS (A)0.090***(<0.001)
0.100***(<0.001)
0.156***(<0.001)
0.120***(<0.001)
CORR-0.015***(<0.001)
-0.014***(<0.001)
-0.015***(<0.001)
-0.013***(<0.001)
-0.019***(<0.001)
-0.016***(<0.001)
-0.017***(<0.001)
-0.015***(<0.001)
Adj. R-square (%) 2.25 6.09 2.54 7.18 4.05 10.83 3.43 7.70

8/18/2019 Earnings Quality and Information Transfers(Sophia Liu).pdf
http://slidepdf.com/reader/full/earnings-quality-and-information-transferssophia-liupdf 38/41
37
Panel B
Subsample ERCValue
Relevance
Abnormal
Accrual
Accrual
Quality
The number of observations 2,093 2,193 1,167 1,508
Dep. Variable: CARs_ABS (NA)
Intercept0.040***
(<0.001)
0.041***
(<0.001)
0.044***
(<0.001)
0.036***
(<0.001)UE_ABS (A)
0.069(0.156)
0.115(0.318)
0.329**(0.021)
0.251*(0.100)
CORR-0.004*(0.094)
-0.004(0.105)
-0.007*(0.074)
-0.010**(0.006)
Size (A)-0.0001(0.676)
0.0001(0.835)
-0.001(0.335)
0.0002(0.565)
Size (NA)-0.002***(<0.001)
-0.002***(<0.001)
-0.002***(<0.001)
-0.002***(<0.001)
Qtr4-0.001(0.281)
-0.001(0.113)
0.0001(0.950)
-0.0004(0.973)
Herfindahl Index0.002
(0.497)0.001
(0.711)0.003
(0.541)0.002
(0.591)
EQ0.00001(0.755)
0.001(0.534)
-0.043***(0.008)
-0.003(0.919)
UE_ABS (A)*EQ
0.017**
(0.007)
0.902**
(0.038)
0.486
(0.927)
7.961
(0.412)
Adj. R-square (%) 4.70 4.89 6.05 4.12
All the variables are defined in Appendix 1.
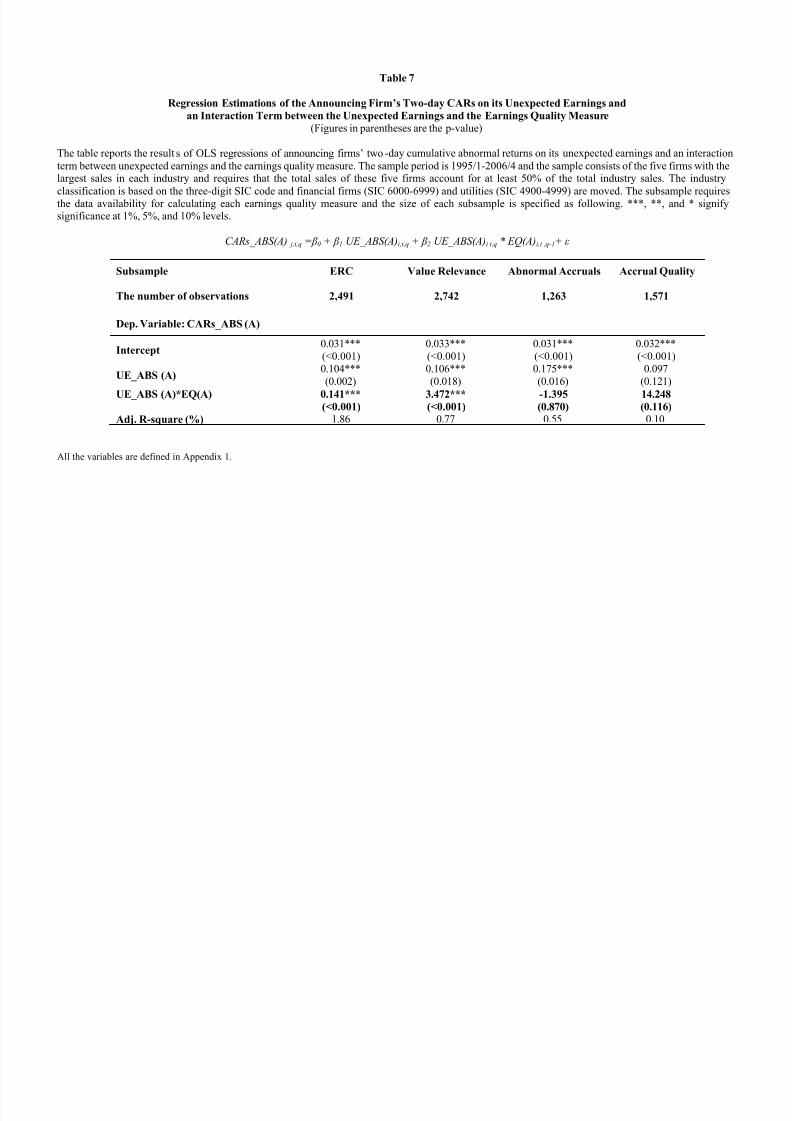
8/18/2019 Earnings Quality and Information Transfers(Sophia Liu).pdf
http://slidepdf.com/reader/full/earnings-quality-and-information-transferssophia-liupdf 39/41
Table 7
Regression Estimations of the Announcing Firm’s Two-day CARs on its Unexpected Earnings and
an Interaction Term between the Unexpected Earnings and the Earnings Quality Measure(Figures in parentheses are the p-value)
The table reports the results of OLS regressions of announcing firms’ two-day cumulative abnormal returns on its unexpected earnings and an interactionterm between unexpected earnings and the earnings quality measure. The sample period is 1995/1-2006/4 and the sample consists of the five firms with thelargest sales in each industry and requires that the total sales of these five firms account for at least 50% of the total industry sales. The industry
classification is based on the three-digit SIC code and financial firms (SIC 6000-6999) and utilities (SIC 4900-4999) are moved. The subsample requiresthe data availability for calculating each earnings quality measure and the size of each subsample is specified as following. ***, **, and * signifysignificance at 1%, 5%, and 10% levels.
CARs_ABS(A) j,t,q =β 0 + β 1 UE_ABS(A)i,t,q + β 2 UE_ABS(A)i t,q * EQ(A)i,t ,q-1+ ε
Subsample ERC Value Relevance Abnormal Accruals Accrual Quality
The number of observations 2,491 2,742 1,263 1,571
Dep. Variable: CARs_ABS (A)
Intercept0.031***(<0.001)
0.033***(<0.001)
0.031***(<0.001)
0.032***(<0.001)
UE_ABS (A)0.104***(0.002)
0.106***(0.018)
0.175***(0.016)
0.097(0.121)
UE_ABS (A)*EQ(A) 0.141***(<0.001)
3.472***(<0.001)
-1.395(0.870)
14.248(0.116)
Adj. R-square (%) 1.86 0.77 0.55 0.10
All the variables are defined in Appendix 1.

8/18/2019 Earnings Quality and Information Transfers(Sophia Liu).pdf
http://slidepdf.com/reader/full/earnings-quality-and-information-transferssophia-liupdf 40/41
Appendix 1
Variable Definition
Variable Definition
Size (A) The natural log of the capitalized value (quarterly COMPUSTAT #14 *quarterly COMPUSTAT # 61) of the announcing firms in the end of quarter qof year t.
Size (NA) The natural log of the capitalized value (quarterly COMPUSTAT #14 *quarterly COMPUSTAT # 61) of the equally-weighted portfolio of the non-announcing firms in the end of quarter q of year t.
UE (A) The unexpected component of the announcing firms’ earnings in quarter q ofyear t, defined as the difference between the actual earnings and the median ofanalysts’ most recent earnings forecasts made no earlier than 90 days prior tothe earnings announcement, scaled by the stock price at the beginning ofquarter q of year t.
UE_ABS (A) The absolute value of the unexpected component of the announcing firms’earnings in quarter q of year t, defined as the difference between the actual
earnings and the median of analysts’ most recent earnings forecasts made no
earlier than 90 days prior to the earnings announcement, scaled by the stock price at the beginning of quarter q of year t.
CARs (A) The cumulative value-weighted abnormal returns in quarter q of year t for anannouncing firm over the two-day window (-1,0) on the earningsannouncement date.
CARs_ABS (A) The absolute value of the cumulative value-weighted abnormal returns inquarter q of year t for an announcing firm over the two-day window (-1,0) onthe earnings announcement date.
CARs (NA) The average cumulative value-weighted abnormal returns in quarter q of year tfor an equally-weighted portfolio of non-announcing firms over the two-daywindow (-1,0) on the earnings announcement date of an announcing firm
which has the same three-digit SIC code.CARs_ABS (NA) The absolute value of the average cumulative value-weighted abnormal returns
in quarter q of year t for an equally-weighted portfolio of non-announcingfirms over the two-day window (-1,0) on the earnings announcement date of anannouncing firm which has the same three-digit SIC code.
CORR The average correlation among the daily returns of an announcing firm and ofnon-announcing firms in the prior year for each three-digit SIC code industry.
Qtr4 An indicator variable for the fourth fiscal quarter.
Herfindahl Index The sum of the squares of market shares of each firm in the same three-digitSIC code industry for each industry-quarter.
N The number of firms (one announcing firm plus non-announcing firms) in the
same three-digit SIC code industry for each industry-quarter announcement.
EQ (ERC_ABS) The absolute value of the coefficient from a regression of the cumulativeabnormal returns surrounding the earnings announcement for firm i, measuredover a two-day window(-1,0), where the abnormal returns are based on thevalue-weighted market model, on the unexpected quarterly earnings for firm iat the earnings announcement date, scaled by the price as the end of the quarterfor which earnings are announced, using the 12 most recent quarters that havenon-missing data for returns and analyst forecast errors. A higher valueindicates a greater level of high earnings quality.

8/18/2019 Earnings Quality and Information Transfers(Sophia Liu).pdf
http://slidepdf.com/reader/full/earnings-quality-and-information-transferssophia-liupdf 41/41
EQ (VR) The adjusted R 2 from a regression of the three-month holding returns ending inthe end of the quarter on the level of earnings and the change of earnings forfirm i, using the 12 most recent quarters that have non-missing data for returnsand earnings. A higher value indicates a greater level of high earnings quality.
EQ (Accruals_ABS) The average absolute value of the abnormal accruals estimated from themodified Jones model, using the 12 most recent quarters that have non-missingdata for estimating. A higher value indicates a greater level of low earnings
quality.
EQ (AQ) The standard deviation of the residuals estimated from the modified Dechowand Dichev (2002) model, using the 12 most recent quarters that have non-missing data for estimating. A higher value indicates a greater level of lowearnings quality.
”A” implies announcing firms and “NA” implies non-announcing firms.