earnings presentation - valoremadvisors.com exchange... · •industrial – ntpc,npc , reliance,...
TRANSCRIPT

EARNINGS PRESENTATION Q3/9M - FY16
1

EXECUTIVE SUMMARY • Ion Exchange (India) Ltd (Ion Exchange), formed in 1964, is a pioneer in water, waste water treatment & environment
solutions and caters to various industries, homes & communities
• Headquartered in Mumbai, the company has six manufacturing & assembly facilities across India, and one each in Bangladesh and UAE. It also has presence across other key geographies
• Installation: 1 lakh globally; 500+ in core sectors
OVERVIEW
•Engineering (52%) – Provides comprehensive and integrated services and solutions in water & waste water treatment including Sea Water desalination, Recycle and Zero liquid discharge plants to diverse industries
•Chemicals (37%) - Provides a comprehensive range of resins, speciality chemicals and customized chemical treatment programmes for water , non-water and specialty applications
•Consumer Products (11%) – Caters to individuals, hotels, spas, educational institutions, hospitals, laboratories, railway and defence establishments providing safe drinking water and a clean environment
BUSINESS & REVENUE (%) MIX
• Industrial – NTPC,NPC , Reliance, IOCL, JSW, CPCL, L&T, Essar group , IRCTC , BHEL, Tata Group,
• Institutional – Leela, Military Engineering Services, Taj Hotels, Holiday Inn, Hyatt Regency, Oberoi Hotels, Apollo Hospitals, Escorts Heart Institute, DLF, Puravankar
• International – Cargill, Technip France, Unilever group, Jurong, Thyssenkrupp ( Uhde), Jacobs, Kawasaki, Mitsubishi, PDO Oman, Emirates Steel, IKPP Indonesia
MARQUEE CLIENTS
•Total Income – INR 8,048 Mn
•EBITDA – INR 509 Mn
•PAT – INR 97 Mn
CONSOLIDATED FINANCIALS (FY15)
2
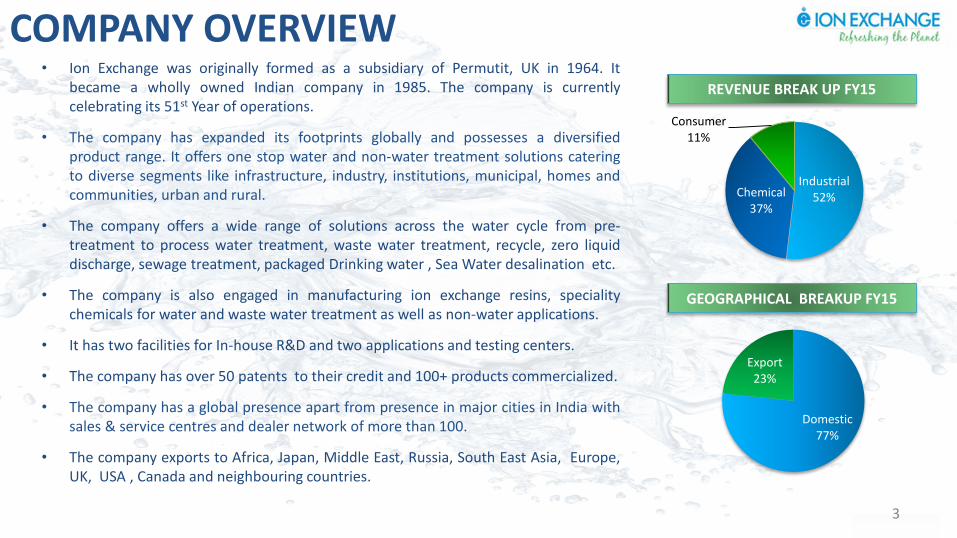
• Ion Exchange was originally formed as a subsidiary of Permutit, UK in 1964. It became a wholly owned Indian company in 1985. The company is currently celebrating its 51st Year of operations.
• The company has expanded its footprints globally and possesses a diversified product range. It offers one stop water and non-water treatment solutions catering to diverse segments like infrastructure, industry, institutions, municipal, homes and communities, urban and rural.
• The company offers a wide range of solutions across the water cycle from pre-treatment to process water treatment, waste water treatment, recycle, zero liquid discharge, sewage treatment, packaged Drinking water , Sea Water desalination etc.
• The company is also engaged in manufacturing ion exchange resins, speciality chemicals for water and waste water treatment as well as non-water applications.
• It has two facilities for In-house R&D and two applications and testing centers.
• The company has over 50 patents to their credit and 100+ products commercialized.
• The company has a global presence apart from presence in major cities in India with sales & service centres and dealer network of more than 100.
• The company exports to Africa, Japan, Middle East, Russia, South East Asia, Europe, UK, USA , Canada and neighbouring countries.
Industrial 52% Chemical
37%
Consumer 11%
Domestic 77%
Export 23%
COMPANY OVERVIEW REVENUE BREAK UP FY15
3
GEOGRAPHICAL BREAKUP FY15

4
Q3-FY16 performance:
• Total Income : INR 2,051 Mn; Growth of 2% YoY
• EBITDA : INR 160 Mn; Growth of 18.5% YoY
• EBITDA Margin : 7.8%; Growth of 110 Bps YoY
• Net Profit : INR 74 Mn; Growth of 32.1% YoY
• PAT Margin : 3.6%; Growth of 80 Bps YoY
• Diluted EPS : 4.95 INR; Growth of 31.6% YoY
9M-FY16 performance:
• Total Income : INR 5,708 Mn; Growth of 13.2% YoY
• EBITDA : INR 419 Mn; Growth of 21.4% YoY
• EBITDA Margin : 7.3%; Growth of 50 Bps YoY
• Net Profit : INR 179 Mn; Growth of 47.9% YoY
• PAT Margin : 3.1%; Growth of 70 Bps YoY
• Diluted EPS : 12.02 INR; Growth of 46.8% YoY
Q3/9M - FY16 FINANCIAL HIGHLIGHTS
5
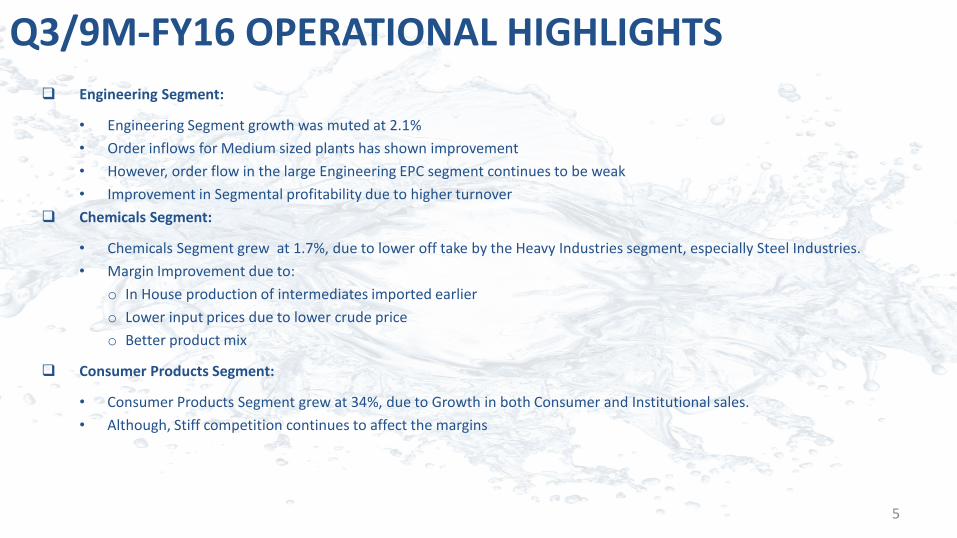
Q3/9M-FY16 OPERATIONAL HIGHLIGHTS
Engineering Segment:
• Engineering Segment growth was muted at 2.1%
• Order inflows for Medium sized plants has shown improvement
• However, order flow in the large Engineering EPC segment continues to be weak
• Improvement in Segmental profitability due to higher turnover
Chemicals Segment:
• Chemicals Segment grew at 1.7%, due to lower off take by the Heavy Industries segment, especially Steel Industries.
• Margin Improvement due to:
o In House production of intermediates imported earlier
o Lower input prices due to lower crude price
o Better product mix
Consumer Products Segment:
• Consumer Products Segment grew at 34%, due to Growth in both Consumer and Institutional sales.
• Although, Stiff competition continues to affect the margins

Q3 FY16 - INCOME STATEMENT
6
INCOME STATEMENT (INR MN) Q3-FY16 Q2-FY16 Q-o-Q Q3-FY15 YoY
Total Income* 2,051 1,998 2.7% 2,011 2.0%
Total Expenses 1,891 1,854 2.0% 1,876 0.8%
EBITDA 160 144 11.1% 135 18.5%
EBITDA Margin 7.8% 7.2% 60 bps 6.7% 110 bps
Depreciation 26 25 4.0% 29 (10.3)%
Finance Cost 27 26 3.8% 28 (3.6)%
PBT 107 93 15.1% 78 37.2%
Tax 33 32 3.1% 22 50.0%
Profit After Tax 74 61 21.3% 56 32.1%
PAT Margin 3.6% 3.1% 50 bps 2.8% 80 bps
EPS (Diluted) 4.95 4.10 20.7% 3.76 31.6%
*Total income includes other income

9M FY16 - INCOME STATEMENT
7
INCOME STATEMENT (INR MN) 9M-FY16 9M-FY15 YoY
Total Income* 5,708 5,042 13.2%
Total Expenses 5,289 4,697 12.6%
EBITDA 419 345 21.4%
EBITDA Margin 7.3% 6.8% 50 bps
Depreciation 74 87 (14.9)%
Finance Cost 77 83 (7.2)%
PBT 268 175 53.1%
Tax 89 54 64.8%
Profit After Tax 179 121 47.9%
PAT Margin 3.1% 2.4% 70 bps
EPS (Diluted) 12.02 8.19 46.8%
*Total income includes other income

HISTORICAL STANDALONE INCOME STATEMENT
*Total income includes other income 8
INCOME STATEMENT (INR MN) FY13 FY14 FY15 9M-FY16
Total Income* 7,732 7,201 7,400 5,708
Total Expenses 7,208 6,705 6,813 5,289
EBITDA 524 496 587 419
EBITDA Margin 6.8% 6.9% 7.9% 7.3%
Depreciation 79 84 98 74
Finance Cost 120 98 109 77
PBT 325 314 380 268
Tax 110 109 119 89
Profit After Tax 215 205 261 179
PAT Margin 2.8% 2.8% 3.5% 3.1%
EPS (Diluted) 14.56 14.08 17.61 12.02
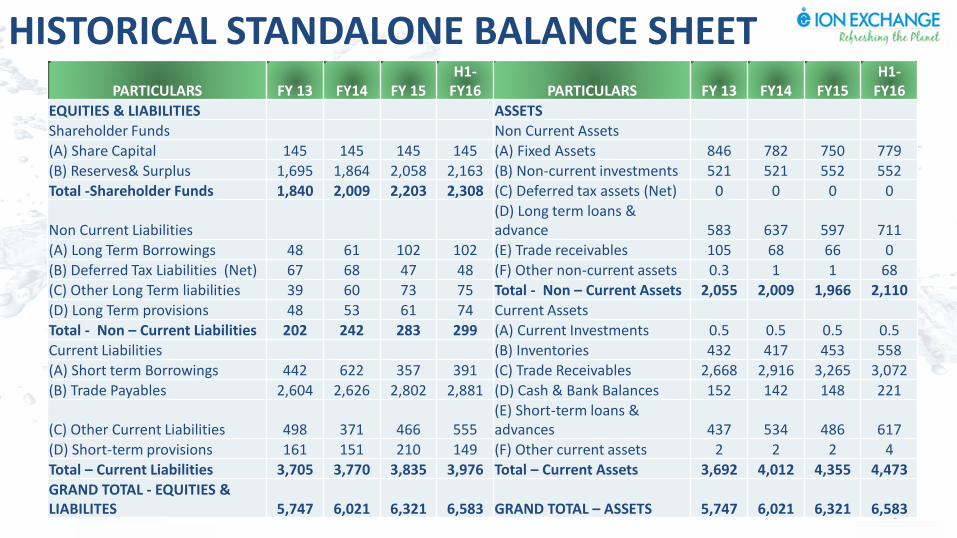
HISTORICAL STANDALONE BALANCE SHEET
9
PARTICULARS FY 13 FY14 FY 15 H1-
FY16 PARTICULARS FY 13 FY14 FY15 H1-
FY16
EQUITIES & LIABILITIES ASSETS
Shareholder Funds Non Current Assets
(A) Share Capital 145 145 145 145 (A) Fixed Assets 846 782 750 779
(B) Reserves& Surplus 1,695 1,864 2,058 2,163 (B) Non-current investments 521 521 552 552
Total -Shareholder Funds 1,840 2,009 2,203 2,308 (C) Deferred tax assets (Net) 0 0 0 0
Non Current Liabilities (D) Long term loans & advance 583 637 597 711
(A) Long Term Borrowings 48 61 102 102 (E) Trade receivables 105 68 66 0
(B) Deferred Tax Liabilities (Net) 67 68 47 48 (F) Other non-current assets 0.3 1 1 68
(C) Other Long Term liabilities 39 60 73 75 Total - Non – Current Assets 2,055 2,009 1,966 2,110
(D) Long Term provisions 48 53 61 74 Current Assets
Total - Non – Current Liabilities 202 242 283 299 (A) Current Investments 0.5 0.5 0.5 0.5
Current Liabilities (B) Inventories 432 417 453 558
(A) Short term Borrowings 442 622 357 391 (C) Trade Receivables 2,668 2,916 3,265 3,072
(B) Trade Payables 2,604 2,626 2,802 2,881 (D) Cash & Bank Balances 152 142 148 221
(C) Other Current Liabilities 498 371 466 555 (E) Short-term loans & advances 437 534 486 617
(D) Short-term provisions 161 151 210 149 (F) Other current assets 2 2 2 4
Total – Current Liabilities 3,705 3,770 3,835 3,976 Total – Current Assets 3,692 4,012 4,355 4,473
GRAND TOTAL - EQUITIES & LIABILITES 5,747 6,021 6,321 6,583 GRAND TOTAL – ASSETS 5,747 6,021 6,321 6,583

INCOME STATEMENT (INR MN) FY13 FY14 FY15
Total Income* 8,620 7,978 8,048
Total Expenses 8,081 7,589 7,539
EBITDA 539 389 509
EBITDA Margin 6.3% 4.9% 6.3%
Depreciation 123 106 121
Finance Cost 156 136 150
PBT 260 147 238
Tax 114 100 124
Profit After Tax 141 46 98
PAT Margin 1.6% 0.6% 1.2%
EPS (Diluted) 9.80 3.22 6.78
HISTORICAL CONSOLIDATED INCOME STATEMENT
*Total income includes other income 10
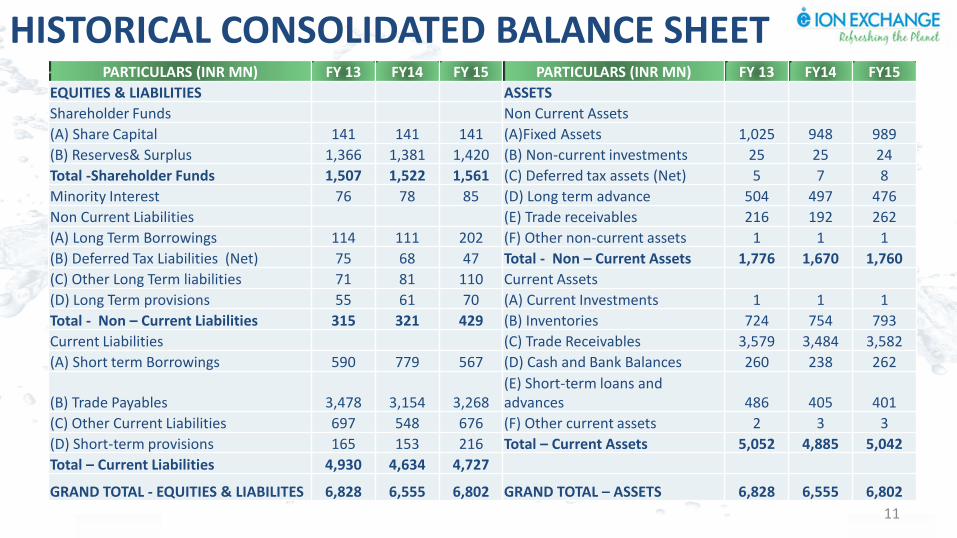
PARTICULARS (INR MN) FY 13 FY14 FY 15 PARTICULARS (INR MN) FY 13 FY14 FY15
EQUITIES & LIABILITIES ASSETS
Shareholder Funds Non Current Assets
(A) Share Capital 141 141 141 (A)Fixed Assets 1,025 948 989
(B) Reserves& Surplus 1,366 1,381 1,420 (B) Non-current investments 25 25 24
Total -Shareholder Funds 1,507 1,522 1,561 (C) Deferred tax assets (Net) 5 7 8
Minority Interest 76 78 85 (D) Long term advance 504 497 476
Non Current Liabilities (E) Trade receivables 216 192 262
(A) Long Term Borrowings 114 111 202 (F) Other non-current assets 1 1 1
(B) Deferred Tax Liabilities (Net) 75 68 47 Total - Non – Current Assets 1,776 1,670 1,760
(C) Other Long Term liabilities 71 81 110 Current Assets
(D) Long Term provisions 55 61 70 (A) Current Investments 1 1 1
Total - Non – Current Liabilities 315 321 429 (B) Inventories 724 754 793
Current Liabilities (C) Trade Receivables 3,579 3,484 3,582
(A) Short term Borrowings 590 779 567 (D) Cash and Bank Balances 260 238 262
(B) Trade Payables 3,478 3,154 3,268 (E) Short-term loans and advances 486 405 401
(C) Other Current Liabilities 697 548 676 (F) Other current assets 2 3 3
(D) Short-term provisions 165 153 216 Total – Current Assets 5,052 4,885 5,042
Total – Current Liabilities 4,930 4,634 4,727
GRAND TOTAL - EQUITIES & LIABILITES 6,828 6,555 6,802 GRAND TOTAL – ASSETS 6,828 6,555 6,802
HISTORICAL CONSOLIDATED BALANCE SHEET
11

MARKET DATA (BLOOMBERG – ION IN, REUTERS – IONX.BO)
PRICE DATA (AS ON 31st DECEMBER, 2015)
Face value (INR) 10
Market Price (INR) 359
52 Week H/L (INR) 370/192
Market Cap (INR Mn) 5,240
Equity Shares Outstanding (Mn) 14.53
Free Float Market Cap (Mn) 2911
1 Year Avg. trading volume (‘000) 10.5
44.44%
1.18%
54.38%
Promoters
DII
Others
SHAREHOLDING PATTERN (AS ON 30TH SEPTEMBER, 2015)
1 YEAR SHARE PRICE MOVEMENT (UPTO 31ST DECEMBER, 2015)
12
-30%
-20%
-10%
0%
10%
20%
30%
40%
50%
Ion Exchange Sensex

Disclaimer Ion Exchange Limited No representation or warranty, express or implied, is made as to, and no reliance should be placed on, the fairness, accuracy, completeness or correctness of the information or opinions contained in this presentation. Such information and opinions are in all events not current after the date of this presentation. Certain statements made in this presentation may not be based on historical information or facts and may be "forward looking statements" based on the currently held beliefs and assumptions of the management of Ion Exchange Limited (“Company” or “IONEX” ), which are expressed in good faith and in their opinion reasonable, including those relating to the Company’s general business plans and strategy, its future financial condition and growth prospects and future developments in its industry and its competitive and regulatory environment. Forward-looking statements involve known and unknown risks, uncertainties and other factors, which may cause the actual results, financial condition, performance or achievements of the Company or industry results to differ materially from the results, financial condition, performance or achievements expressed or implied by such forward-looking statements, including future changes or developments in the Company’s business, its competitive environment and political, economic, legal and social conditions. Further, past performance is not necessarily indicative of future results. Given these risks, uncertainties and other factors, viewers of this presentation are cautioned not to place undue reliance on these forward-looking statements. The Company disclaims any obligation to update these forward-looking statements to reflect future events or developments. This presentation is for general information purposes only, without regard to any specific objectives, financial situations or informational needs of any particular person. This presentation does not constitute an offer or invitation to purchase or subscribe for any securities in any jurisdiction, including the United States. No part of it should form the basis of or be relied upon in connection with any investment decision or any contract or commitment to purchase or subscribe for any securities. None of our securities may be offered or sold in the United States, without registration under the U.S. Securities Act of 1933, as amended, or pursuant to an exemption from registration there from. This presentation is confidential and may not be copied or disseminated, in whole or in part, and in any manner. Valorem Advisors Disclaimer: Valorem Advisors is an Independent Investor Relations Management Service company. This Presentation has been prepared by Valorem Advisors based on information and data which the Company considers reliable, but Valorem Advisors and the Company makes no representation or warranty, express or implied, whatsoever, and no reliance shall be placed on, the truth, accuracy, completeness, fairness and reasonableness of the contents of this Presentation. This Presentation may not be all inclusive and may not contain all of the information that you may consider material. Any liability in respect of the contents of, or any omission from, this Presentation is expressly excluded. Valorem Advisors also hereby certifies that the directors or employees of Valorem Advisors do not own any stock in personal or company capacity of the Company under review.
For further details please contact our Investor Relations Representatives: VALOREM ADVISORS Mr. Anuj Sonpal Tel: +91-22-3006-7521/22/23/24
Email: [email protected] 13

THANK YOU
14