earnings presentation 2019-2020 q1 · • the civil works for its new state of art distillery 200...
TRANSCRIPT

EARNINGS PRESENTATION 2019-2020 Q1

Financial Overview
Disclaimer
Key Financial Highlights
Executive Summary
Company at A Glance
Key Operational Highlights (Segment Wise)
3
4
5
7
9
15
Index2

Company Overview
• BCL is a part of the Mittal Group founded in 1976, by Late Shri D. D. Mittal.
• Under the stewardship of Mr. Rajinder Mittal, the company has now grown into an INR 10,000 Mn business empire.
• The company is a diversified conglomerate in manufacturing and development with business interests spread across avariety of industry verticals namely Edible Oil and Vanaspati, Distillery and Real Estate.
• The market Cap of the company as on 30th June, 2019 was INR 1,593.4 Mn.
Executive Summary3
Financials – 2018-19
Total RevenueINR 9,037 Mn
EBITDAINR 812 Mn
PATINR 413 Mn
Gross BlockINR 2,321 Mn
EDIBLE OIL & VANASPATIEngaged in the business of
manufacturing of Vanaspathi, Refined oil, and oil & solvent extraction
from seeds and rice.
DISTILLERYEngaged in the business of
manufacturing of Extra Neutral Alcohol (ENA) and bottling of liquor in
PML and IMFL in Punjab.
REAL ESTATEUndertaken two large real estate
projects in Bhatinda, Punjab

Company at A Glance
• Founded in 1976, BCL Industries Limited (BCL) is a part of the MittalGroup, founded by Shri D. D. Mittal. Now under the stewardship ofMr. Rajinder Mittal, the company has now grown into anINR 10,000 Mn business empire.
• BCL is one of the largest vertically integrated agro-based edible oilplayer in India with a gross annual turnover of more thanINR 9,000 Mn.
• The company has transformed from a small oil mill to one of the mostmodern and fully integrated rice and edible oil complexes in India witha processing capacity of 1,020 MT per day.
• The company forayed into the business of distillation of alcohol in theyear 2006 in partnership with Pioneer Industries Ltd withmanufacturing plant in Pathankot, Punjab.
• The company has a balance sheet size of nearly INR 5,600 Mn with ascalable business model which provides revenue visibility of nearlyINR 10,000 Mn post the expansion.
Total Revenue* Growth (INR Mn)
Segmental Revenue Break up – 2018-19
5,329
6,760
8,5769,037
2,177
2015-16 2016-17 2017-18 2018-19 Q1 2019-20*Consolidated
4
Edible Oil & Vanaspati Distillery
Real Estate
Business Mix
54% 43%
3%

KEY FINANCIAL HIGHLIGHTS
5

Key Financial Highlights6
2019-20 Q1 Standalone Financial Performance:
• Total Revenue: INR 2,177 Mn YoY Growth of 6.3%
• EBITDA: INR 160 Mn YoY Decline by 0.6%
• EBITDA Margin: 7.35% YoY Decline by 51 Bps
• Net Profit: INR 66 Mn YoY Growth 13.8%
• PAT Margin: 3.03% YoY Growth 20 Bps
• Diluted EPS: INR 3.43 per share
2019-20 Q1 Consolidated Financial Performance:
• Total Revenue: INR 2,177 Mn YoY Growth of 6.3%
• EBITDA: INR 159 Mn YoY Decline by 1.2%
• EBITDA Margin: 7.30% YoY Decline by 56 Bps
• Net Profit: INR 65 Mn YoY Growth 14.0%
• PAT Margin: 2.99% YoY Growth 21 Bps
• Diluted EPS: INR 3.39 per share

KEY OPERATIONAL HIGHLIGHTS (SEGMENT WISE)
7

Key Operational Highlights8
Distillery:• With the National Policy on Biofuels-2018 in place, BCL distillery segment had bagged the tender to supply to the tune of
about 3.2 Cr liters for the period 1st December 2018 until 30th November 2019. More than half of the quantity has beendelivered.
• The company has added suitable machinery for the processing of maize. This has been installed by keeping in mind thestate government’s push towards Maize over Paddy.
• Due to the shortage of damaged grains in the market the prices of raw materials had gone up. Having foreseen this thecompany benefitted because of a surplus stock of raw materials.
• The company’s performance was further boosted by the increase of prices in ENA. The prices of ENA have gone up by23% since Q1 2018-19.
• The civil works for its new state of art Distillery 200 KLPD plant at Kharagpur, WB under its subsidiary Svaksha DistilleryLimited is in full swing and is hoping to commence production by Q4 2019-20. The turnkey contract of the project hasbeen awarded to Praj Industries Ltd.
Edible Oil:
• This segment has been negatively affected by the economic slowdown but due to better management of affairs therevenue deficit was controlled at 12.6%.
• Due to the increased MSP, more mustard seed was available in the market. This resulted in some capacity utilization ofthe company’s oil mill which was idle during this period.
• The company is erecting an interesterification plant to further modernize our Vanaspati unit to control the trans-fat. Thisshould be functioning by the end of August, 2019.
Real Estate:
• Despite the elections and the slowdown in the economy our real estate revenues continue to increase. The Real Estatesegment demonstrated a 7.74% hike when compared to Q1 2018-19
• Company’s real estate projects continue to show steady sales and have had good feedback from the market. We expectthe sales to increase in the coming quarter due to the festive season.

FINANCIAL OVERVIEW
9
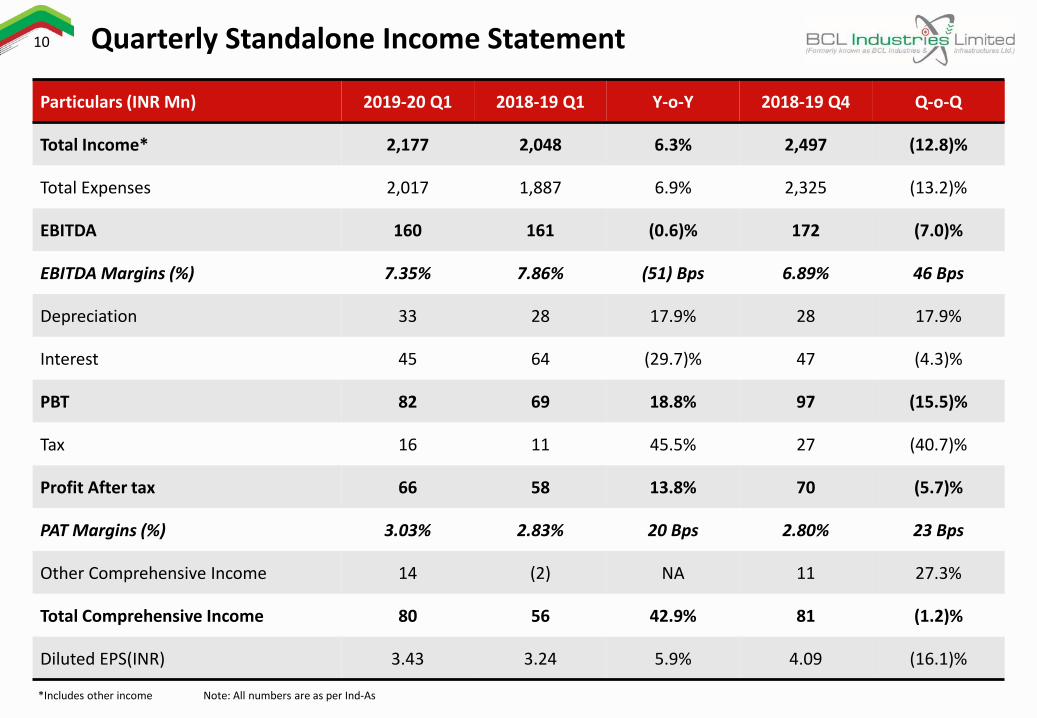
Particulars (INR Mn) 2019-20 Q1 2018-19 Q1 Y-o-Y 2018-19 Q4 Q-o-Q
Total Income* 2,177 2,048 6.3% 2,497 (12.8)%
Total Expenses 2,017 1,887 6.9% 2,325 (13.2)%
EBITDA 160 161 (0.6)% 172 (7.0)%
EBITDA Margins (%) 7.35% 7.86% (51) Bps 6.89% 46 Bps
Depreciation 33 28 17.9% 28 17.9%
Interest 45 64 (29.7)% 47 (4.3)%
PBT 82 69 18.8% 97 (15.5)%
Tax 16 11 45.5% 27 (40.7)%
Profit After tax 66 58 13.8% 70 (5.7)%
PAT Margins (%) 3.03% 2.83% 20 Bps 2.80% 23 Bps
Other Comprehensive Income 14 (2) NA 11 27.3%
Total Comprehensive Income 80 56 42.9% 81 (1.2)%
Diluted EPS(INR) 3.43 3.24 5.9% 4.09 (16.1)%
Quarterly Standalone Income Statement
*Includes other income Note: All numbers are as per Ind-As
10

Particulars (INR Mn) 2019-20 Q1 2018-19 Q1 Y-o-Y 2018-19 Q4 Q-o-Q
Total Income* 2,177 2,048 6.3% 2,497 (12.8)%
Total Expenses 2,018 1,887 6.9% 2,324 (13.2)%
EBITDA 159 161 (1.2)% 173 (8.1)%
EBITDA Margins (%) 7.30% 7.86% (56) Bps 6.93% 37 Bps
Depreciation 33 28 17.9% 28 17.9%
Interest 45 65 (30.8)% 48 (6.3)%
PBT 81 68 19.1% 97 (16.5)%
Tax 16 11 45.5% 27 (40.7)%
Profit After tax 65 57 14.0% 70 (7.1)%
PAT Margins (%) 2.99% 2.78% 21 Bps 2.80% 19 Bps
Other Comprehensive Income 14 (2) NA 10 40.0%
Total Comprehensive Income 79 55 43.6% 80 (1.3)%
Diluted EPS(INR) 3.39 3.40 (0.3)% 4.07 (16.7)%
Quarterly Consolidated Income Statement
*Includes other income Note: All numbers are as per Ind-As
11
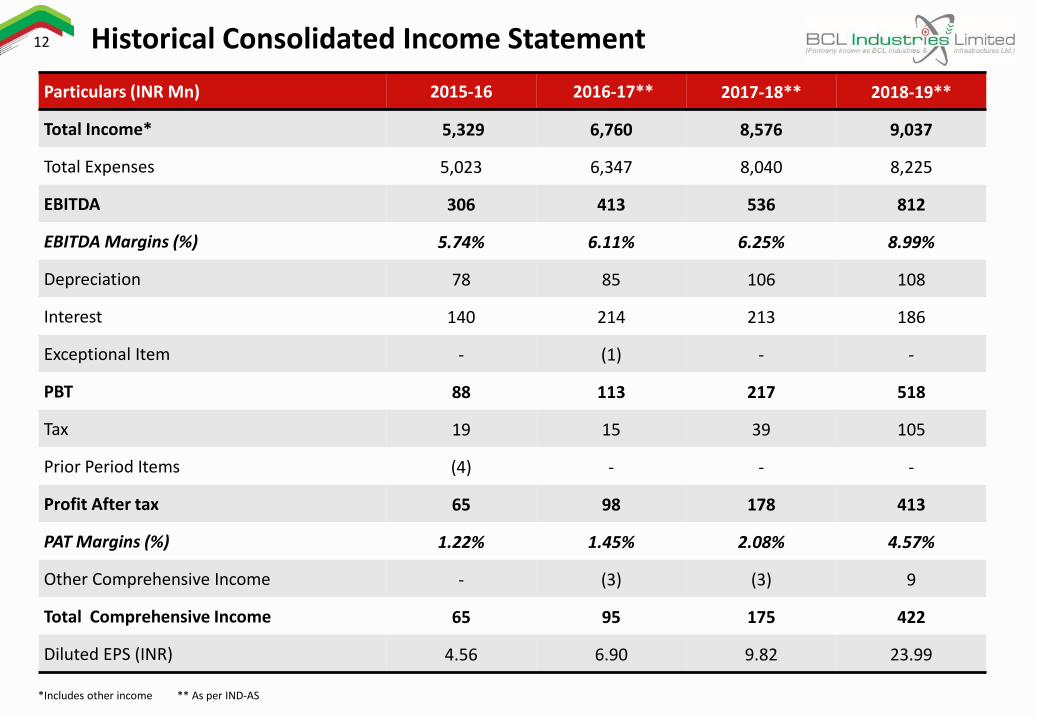
Particulars (INR Mn) 2015-16 2016-17** 2017-18** 2018-19**
Total Income* 5,329 6,760 8,576 9,037
Total Expenses 5,023 6,347 8,040 8,225
EBITDA 306 413 536 812
EBITDA Margins (%) 5.74% 6.11% 6.25% 8.99%
Depreciation 78 85 106 108
Interest 140 214 213 186
Exceptional Item - (1) - -
PBT 88 113 217 518
Tax 19 15 39 105
Prior Period Items (4) - - -
Profit After tax 65 98 178 413
PAT Margins (%) 1.22% 1.45% 2.08% 4.57%
Other Comprehensive Income - (3) (3) 9
Total Comprehensive Income 65 95 175 422
Diluted EPS (INR) 4.56 6.90 9.82 23.99
Historical Consolidated Income Statement
*Includes other income ** As per IND-AS
12

Consolidated Balance Sheet (Ind-AS)13
Particulars (INR Mn) 2017-18 2018-19
ASSETS
Non-Current Assets
Property, Plant & Equipment 1,355 1,377
Capital Work in progress 50 105
Goodwill on Consolidation 2 2
Investment Property 7 5
Financial Assets
Investments 22 32
Long-term Loans and Advances 9 -
Other non-current assets 15 148
Sub Total Non Current Assets 1,460 1,669
Current Assets
Inventories 2,624 2,662
Financial Assets
(i)Investments 307 312
(ii)Trade Receivables 421 616
(iii)Cash and Cash Equivalents 53 136
(iv)Others - 16
Other Current Assets 95 139
Assets classified as held for sale - 53
Sub Total Current Assets 3,500 3,934
TOTAL ASSETS 4,960 5,603
Particulars (INR Mn) 2017-18 2018-19
EQUITY AND LIABILITIES
Equity
Share Capital 157 174
Other Equity 1,161 1,655
Total Equity 1,318 1,829
Non Current Liabilities
(i)Borrowings 990 865
(ii)Other Financial Liabilities 31 24
Provisions 13 14
Deferred Tax Liabilities (net)78 92
Sub Total Non Current Liabilities 1,112 995
Current Liabilities
(i)Borrowings 1,286 1,055
(ii)Trade Payables 1,011 1,521
(iii)Other Financial Liabilities 183 45
Other current Liabilities 11 80
Provisions 39 78
Sub Total Current Liabilities 2,530 2,779
Sub Total Liabilities 3,642 3,774
TOTAL EQUITY AND LIABILITIES 4,960 5,603

Capital Market Data
Price Data (30th June, 2019)
Face Value (INR) 10.0
Market Price (INR) 91.4
52 Week H/L (INR) 136.0/78.4
Market Cap (INR Mn) 1,593.4
Equity Shares Outstanding (Mn) 19.2
1 Year Avg. trading volume ('000) 20.1
14
Promoter63.81%
Public33.61%
AIF2.58%
Current Shareholding Pattern
-20%
-15%
-10%
-5%
0%
5%
10%
15%
20%
25%
30%
Jul-18 Aug-18 Sep-18 Oct-18 Nov-18 Dec-18 Jan-19 Feb-19 Mar-19 Apr-19 May-19 Jun-19
BCL Industries Sensex

No representation or warranty, express or implied, is made as to, and no reliance should be placed on, the fairness, accuracy, completeness or correctness of the information or opinions contained in this
presentation. Such information and opinions are in all events not current after the date of this presentation. Certain statements made in this presentation may not be based on historical information or facts
and may be "forward looking statements" based on the currently held beliefs and assumptions of the management of BCL Industries Limited, which are expressed in good faith and in their opinion
reasonable, including those relating to the Company’s general business plans and strategy, its future financial condition and growth prospects and future developments in its industry and its competitive and
regulatory environment.
Forward-looking statements involve known and unknown risks, uncertainties and other factors, which may cause the actual results, financial condition, performance or achievements of the Company or
industry results to differ materially from the results, financial condition, performance or achievements expressed or implied by such forward-looking statements, including future changes or developments in
the Company’s business, its competitive environment and political, economic, legal and social conditions. Further, past performance is not necessarily indicative of future results. Given these risks,
uncertainties and other factors, viewers of this presentation are cautioned not to place undue reliance on these forward-looking statements. The Company disclaims any obligation to update these forward-
looking statements to reflect future events or developments.
This presentation is for general information purposes only, without regard to any specific objectives, financial situations or informational needs of any particular person. This presentation does not constitute
an offer or invitation to purchase or subscribe for any securities in any jurisdiction, including the United States. No part of it should form the basis of or be relied upon in connection with any investment
decision or any contract or commitment to purchase or subscribe for any securities. None of our securities may be offered or sold in the United States, without registration under the U.S. Securities Act of
1933, as amended, or pursuant to an exemption from registration there from.
This presentation is confidential and may not be copied or disseminated, in whole or in part, and in any manner.
Valorem Advisors Disclaimer:
Valorem Advisors is an Independent Investor Relations Management Service company. This Presentation has been prepared by Valorem Advisors based on information and data which the Company
considers reliable, but Valorem Advisors and the Company makes no representation or warranty, express or implied, whatsoever, and no reliance shall be placed on, the truth, accuracy, completeness,
fairness and reasonableness of the contents of this Presentation. This Presentation may not be all inclusive and may not contain all of the information that you may consider material. Any liability in respect
of the contents of, or any omission from, this Presentation is expressly excluded. Valorem Advisors also hereby certifies that the directors or employees of Valorem Advisors do not own any stock in personal
or company capacity of the Company under review.
Valorem Advisors
Mr. Anuj Sonpal, CEOTel: +91-22-49039500
Email: [email protected]
For further information please contact our Investor Relations Representatives:
Disclaimer15

16
THANK YOU