earnings plays stocks typically, but not always, will move the first trading day following...
TRANSCRIPT
SMB CAPITAL OPTIONS TRAINING PROGRAM

EARNINGS
PLAYS
SESSION FIFTEEN

Stocks typically, but not always, will move the first trading day following earnings, more than the average move for that stock over one trading session.
Recognizing this, the options market will drive up the Implied Volatilities of that stock’s options in the days leading up to the earnings event.
The IV’s in turn will almost always drop, sometimes precipitously, almost immediately after earnings have been announced and the market has digested the company’s results.
Normally the front month volatilities will drop more than the back month volatilities. The overall drop in volatilities of all options for all months as well as the the relative drops between months all have ramifications depending on the trade that is selected for that stock before that particular earnings event.
Basic Principles Behind Earnings Plays

If the trader believes that the IV drop will be so strong that the price movement will be overcome by the IV drop (i.e. the delta effect will be less than the vega effect) then you can SELL a straddle (iron butterfly or calendar) or sell a strangle (iron condor, double diagonal or double calendar).
If the trader believes that the price movement will be so strong that the price-suppressing effects of the IV drop will be overcome by the price movement effect, then the trader will BUY the straddle or the strangle.
Note—we never allow our risk to be unlimited so we will always buy wings for our short straddles or short strangles.
Earnings Plays

AAPL Price Chart one day before earnings announcement, January 2011

Heightened IVs of AAPL approaching January earnings release

Analyzing possible iron butterfly play

AAPL iron butterfly January 2011 earnings play

One hour into next trading, major IV drop

IV drop, even with big price move, causes large profit after 1 hour of
trading

End of Day, up 38% even with 1.8% move in underlying

Analyzing a possible calendar play (A/K/A straddle swap)

Netting out the cost of front month less back month (calendar)

AAPL Price Chart one day before earnings announcement, October, 2010
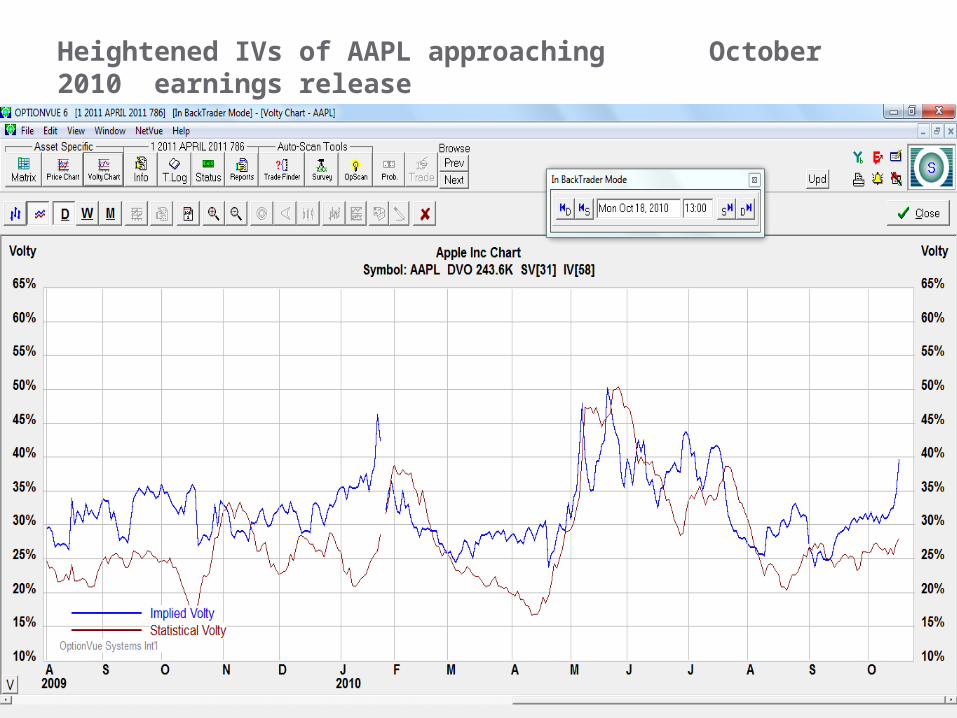
Heightened IVs of AAPL approaching October 2010 earnings release

ATM straddle sold in front month/bought in back month—note elevated front month vols

Analyze graph, day before earnings, ATM calendar

Morning after earning release, 13% gain despite large move=monster vol drop in front month vs. mild drop in back month.

Successful trade because of “vol crush” after earnings.
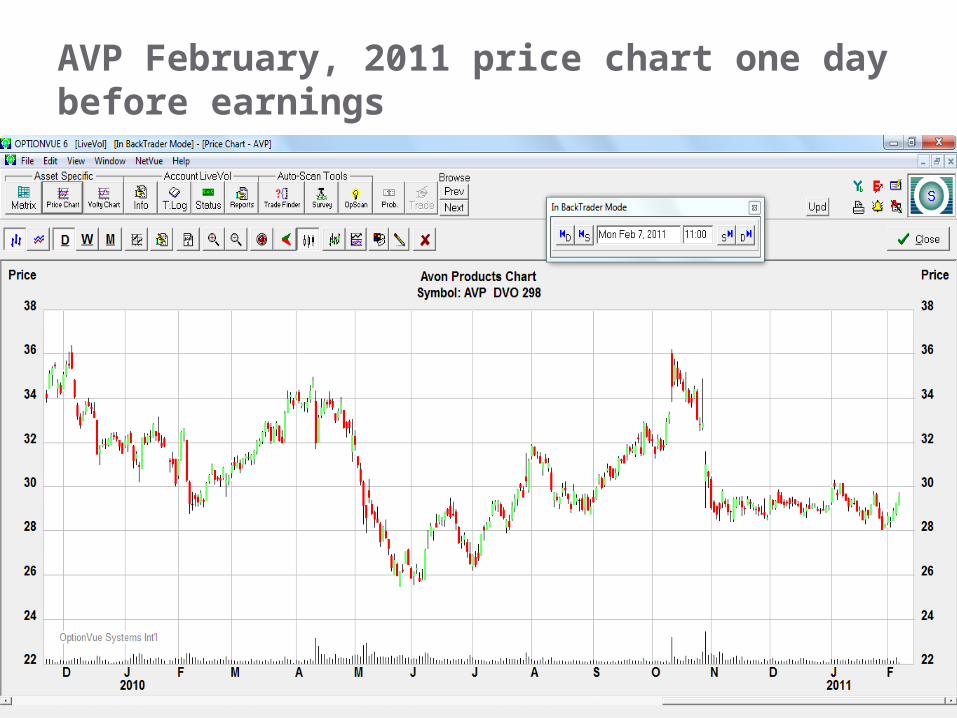
AVP February, 2011 price chart one day before earnings
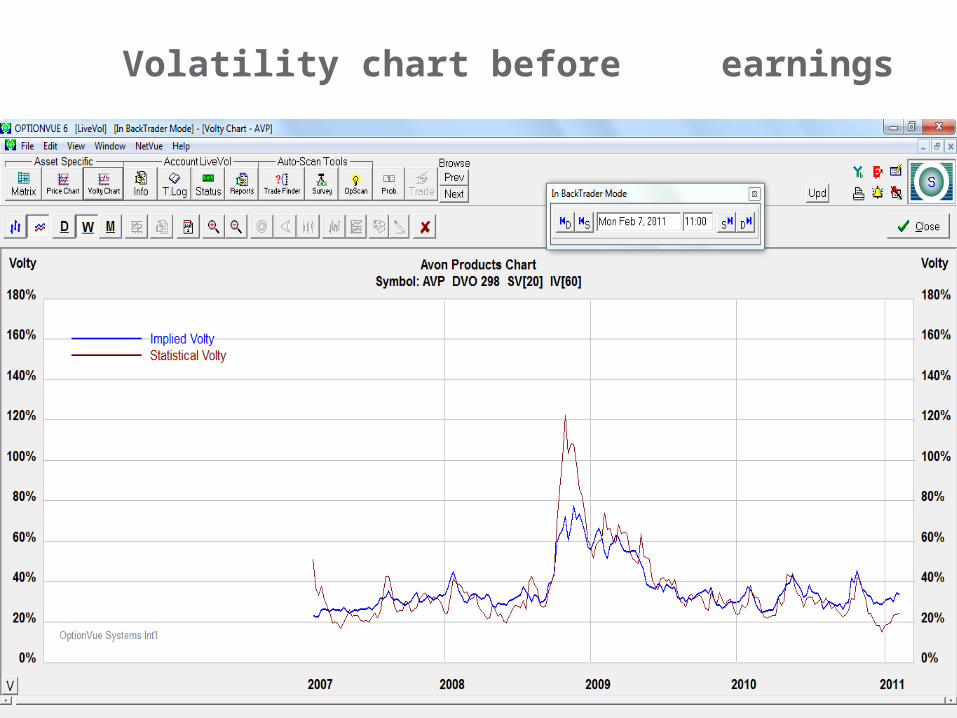
Volatility chart before earnings

Selling front month strangle, buying back month strangle=the double
calendar
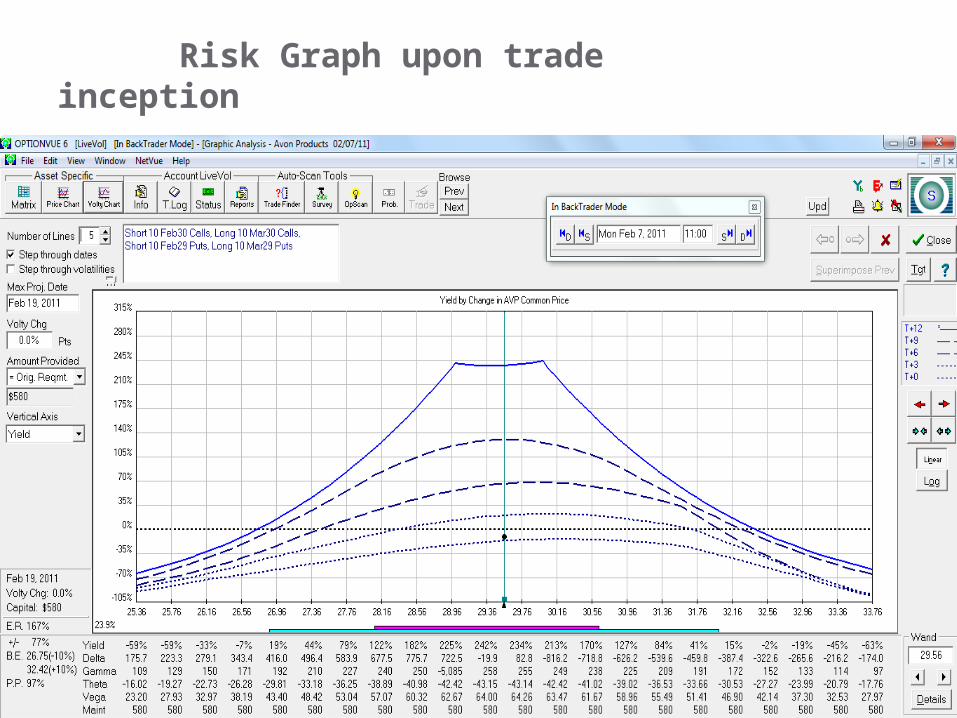
Risk Graph upon trade inception

Trade down initially next day

Ultimately 15% gain on vol crush
Some traders like to play long straddles when they believe the market is underestimating the likely price move as a result of the earnings release. This can be very rewarding, but also very difficult as the vol crush must be overcome by a monster price movement to compensate. If a long straddle is in fact chosen, the trader should carefully study previous quarters to see whether in fact the delta change was significant enough to overcome the vol crush.
Long Straddles

Using the Optionvue backtrader module, select four stocks from the past five years and observe the way their front month and back ATM options behave right before and right after earnings are announced. Then construct either a butterfly, condor, calendar or double calendar trade that suits the pattern of the behavior of the options relative to that equity. Review at least four quarters of data before making a selection. Once the selection is made, place the trade selected and document the type of trade made and the results for each
Homework